Submitted:
02 February 2025
Posted:
04 February 2025
You are already at the latest version
Abstract
This study presents an artificial intelligence (AI) prediction platform driven by deep learning technologies, designed specifically to address the challenges associated with predicting warpage behavior in fan-out wafer-level packaging (FOWLP). Traditional electronic engineers often face difficulties in implementing AI-driven models due to the specialized programming and algorithmic expertise required. To overcome this, the platform incorporates a graphical user interface (GUI) that simplifies the design, training, and operation of deep learning models. It enables users to configure and run AI predictions without needing extensive coding knowledge, thereby enhancing accessibility for non-expert users. The platform efficiently processes large datasets, automating feature extraction, data cleansing, and model training, ensuring accurate and reliable predictions. The effectiveness of the AI platform is demonstrated through case studies involving FOWLP architectures, highlighting its ability to provide quick and precise warpage predictions. Additionally, the platform is available in both uniform resource locator (URL)-based and standalone versions, offering flexibility in usage. This innovation significantly improves design efficiency, enabling engineers to optimize electronic packaging designs, reduce errors, and enhance overall system performance. The study concludes by showcasing the structure and functionality of the GUI platform, positioning it as a valuable tool for fostering further advancements in electronic packaging.
Keywords:
AI prediction platform
; fan-out wafer-level packaging (FOWLP)
; warpage prediction
; graphical user interface (GUI)
; deep learning
; Finite Element Analysis (FEA)
1. Introduction
In recent years, the remarkable pace of semiconductor fabrication technology advancements has been largely driven by the relentless demand for electronic devices that are not only smaller and faster but also more reliable and efficient. The continuous push for innovation in this sector has brought about numerous breakthroughs; however, it has simultaneously introduced significant technical challenges that have become increasingly difficult to overcome. One of the primary challenges arises from the physical limitations associated with the ongoing miniaturization of transistors, which now threaten to slow the progression of Moore's Law [1], a principle that has guided the semiconductor industry for decades. As the dimensions of transistors approach atomic scales, fundamental constraints related to quantum effects, heat dissipation, and power efficiency begin to dominate, making it increasingly difficult to sustain the exponential improvements in transistor density and performance that Moore's Law predicts. In light of these challenges, the semiconductor industry has shifted its focus toward alternative strategies that go beyond the traditional approach of simply scaling down transistor sizes. This shift has led to the development of what is often referred to as the "More than Moore" paradigm, which emphasizes heterogeneous integration through advanced packaging technologies [2,3,4,5,6,7,8]. Unlike the conventional scaling methods that focus solely on transistor miniaturization, the "More than Moore" approach seeks to enhance system performance by integrating multiple functions into a single package. These functions can include processing, memory, sensing, and communication, all of which are combined into a compact and highly efficient package. This approach has gained significant traction in recent years as a means of overcoming the limitations imposed by transistor scaling, offering a path forward for the continued advancement of electronic devices.
Among the various innovative packaging technologies that have been developed in support of the "More than Moore" paradigm, Fan-out wafer-level packaging (FOWLP) has emerged as one of the most promising solutions. FOWLP stands out due to its ability to deliver several key advantages that are highly sought after in the industry, including a higher I/O (input/output) density, a reduced form factor, and improved electrical performance. These advantages make FOWLP an ideal candidate for heterogeneous system integration, where multiple components with different functions and characteristics must be brought together into a single, cohesive package. By reducing the overall footprint of the package while simultaneously improving its performance, FOWLP enables manufacturers to meet the growing demand for smaller and more powerful electronic devices. Moreover, the integration of various components into a single package using FOWLP helps reduce the overall complexity of the system, leading to cost savings and greater efficiency in the manufacturing process. Despite its widespread recognition and growing adoption in the semiconductor industry, FOWLP is not without its challenges. As with any emerging technology, FOWLP faces several technical hurdles that must be addressed before it can fully realize its potential. Key challenges include optimizing yields, enhancing reliability, managing thermal dissipation, and, perhaps most critically, controlling warpage during the manufacturing process. Warpage, in particular, presents a significant obstacle, as it can manifest at various stages of the FOWLP manufacturing process and have far-reaching consequences for the overall performance and reliability of the final product. The deformation that results from warpage can lead to a range of issues, including misalignment of components, inaccuracies in material handling, and errors in registration during assembly. These issues, in turn, can result in reduced manufacturing yields, increased production costs, and diminished overall efficiency [6,9].
Given the significant impact that warpage can have on both the manufacturing process and the final product, it is critical to develop a deep understanding of the factors that contribute to warpage in FOWLP. This understanding must begin at the design phase, where the materials, geometries, and assembly processes used in FOWLP can be carefully analyzed and optimized to minimize warpage. Achieving this level of understanding, however, requires a comprehensive approach that combines both theoretical modeling and experimental validation. Unfortunately, despite the critical importance of this issue, existing research in the field has provided relatively limited insights into the underlying mechanisms that drive warpage in FOWLP [10]. The lack of extensive theoretical and experimental characterization presents a significant barrier to the development of effective warpage control strategies, and this gap in knowledge must be addressed in order to enable further advancements in FOWLP technology.
Theoretical approaches, such as finite element analysis (FEA), have emerged as powerful tools for investigating the complex interactions that lead to warpage in FOWLP. FEA offers a cost-effective and efficient means of exploring the underlying physical mechanisms that contribute to warpage, allowing researchers and engineers to simulate various design scenarios and assess their impact on warpage before actual fabrication begins. By utilizing FEA, it is possible to model the behavior of materials under thermal and mechanical loads, examine how different packaging geometries affect deformation, and predict the conditions under which warpage is likely to occur. This predictive capability is invaluable for optimizing FOWLP designs, as it enables designers to anticipate potential issues and implement corrective measures during the early stages of the development process. Although FEA and other theoretical modeling techniques offer substantial advantages in terms of cost and efficiency, they are not without limitations. The accuracy of these models is heavily dependent on the quality of the input data, including the material properties and boundary conditions used in the simulations. Moreover, FEA models often rely on certain simplifying assumptions, which can limit their ability to fully capture the complexity of real-world manufacturing environments. As a result, while FEA provides valuable insights into the potential causes of warpage, experimental validation remains an essential component of the overall process. Experimental methods, such as in-situ monitoring of warpage during the manufacturing process, can provide the empirical data needed to refine and validate theoretical models. This iterative process of theoretical modeling and experimental validation is crucial for achieving a comprehensive understanding of warpage and developing effective control strategies.
As global digitalization continues to advance at a rapid pace, electronic products have become intricately woven into the fabric of everyday life, fundamentally altering how individuals across the world work, communicate, and conduct their daily activities. These products offer an unprecedented level of convenience, reshaping industries and enhancing the quality of life on a massive scale. From indispensable devices like smartphones, tablets, and wearable technology to more complex systems such as smart home appliances, autonomous vehicles, and sophisticated aerospace applications, the proliferation of electronic products is ubiquitous. Their impact extends far beyond individual consumer usage, influencing economic structures, social interactions, and the broader trajectory of technological progress. The innovations that have emerged from these advancements not only serve to enhance daily living but have also played a pivotal role in driving forward societal and industrial transformation.
Nevertheless, the technological marvels that these electronic products represent are underpinned by exceptionally complex manufacturing processes, with the packaging design stage presenting some of the most significant and intricate challenges. Packaging design is a critical component of the overall manufacturing process, as it directly affects the performance, reliability, and durability of the final product. Designers working in this domain must navigate a multitude of factors that contribute to the successful integration of various electronic components within a limited space. Among these factors are the careful selection of materials, which must meet stringent thermal, mechanical, and electrical criteria, and the determination of optimal process parameters, which are crucial for ensuring the reliability of the final product under operational stress. Workflow design is equally important, as it involves the coordination of multiple manufacturing steps to ensure that the final assembly meets performance specifications while remaining cost-effective. These considerations demand not only a deep understanding of the technical aspects of packaging design but also an ability to anticipate and respond to the evolving requirements of both the market and the technology itself.
As technological advancements continue to accelerate and market demands become increasingly diverse, the challenges faced by packaging designers are only becoming more complex. The traditional methods of packaging design, which once sufficed in addressing the relatively straightforward demands of earlier electronic products, are now proving inadequate for the intricate systems being developed today. The rise of heterogeneous integration, advanced semiconductor packaging technologies, and the push for miniaturization are all placing new and significant demands on the packaging design process. In this rapidly evolving landscape, designers are tasked with balancing the competing needs for reduced size, improved performance, and enhanced reliability, all while ensuring that the manufacturing process remains scalable and cost-efficient.
To address the complexities and challenges faced in modern packaging design, particularly in the realm of microelectronics, researchers have increasingly turned to artificial intelligence (AI) in combination with advanced simulation methodologies [11,12,13,14,15,16]. AI has rapidly evolved into an essential tool for solving highly intricate problems across a broad range of disciplines, encompassing fields as diverse as medical diagnostics, autonomous transportation systems, space exploration missions, defense technologies, and various engineering domains. Its application in these areas has demonstrated the unparalleled ability of AI to manage and analyze vast datasets, identify patterns, and generate predictive models that offer unprecedented accuracy and efficiency. In the context of microelectronic packaging, AI-driven simulation models have become indispensable for evaluating critical aspects such as thermal-mechanical performance, which includes understanding the thermal behavior of packaging systems [12,13] and predicting system reliability [14,15,16]. These areas are particularly challenging due to the complex interactions between materials, geometries, and environmental conditions, all of which must be accounted for to ensure the performance and longevity of the electronic device.
To achieve these objectives, a wide array of machine learning techniques has been employed, each offering unique advantages in terms of predictive capabilities and computational efficiency. Techniques such as support vector regression (SVR) [11], random forest (RF) [16], gradient boosting regression (GBR) [17], K-nearest neighbors (KNN) [18], and kernel ridge regression (KRR) [19] have all been successfully applied to model various performance parameters in microelectronic packaging. These machine learning algorithms have the capacity to process large amounts of structured data, uncover complex relationships within the data, and generate predictions that can guide the design process. For instance, GBR has proven highly effective in handling non-linear relationships within datasets, while SVR offers robust performance by mapping data into high-dimensional feature spaces. KNN, with its straightforward approach to regression and classification tasks, remains a valuable tool in instances where the decision boundaries between data points are difficult to define, while KRR and RF provide powerful methods for handling noisy data and complex interactions between variables.
In addition to these machine learning models, several deep learning architectures have also been employed in the study of microelectronic packaging, further enhancing the ability to predict and optimize system performance. Recurrent neural networks (RNNs) [20], gated recurrent units (GRUs) [21], multilayer perceptrons (MLPs) [22], and long short-term memory networks (LSTMs) [23,24] have all demonstrated their effectiveness in capturing intricate, temporal dependencies within datasets and predicting long-term performance trends. These deep learning models are particularly adept at managing sequential and time-series data, making them ideal for tasks that require continuous monitoring of system behavior under varying conditions. In practice, AI techniques have been applied in a variety of scenarios to improve the thermal and mechanical performance of packaging structures. For example, Law et al. [12] developed an artificial neural network (ANN) model capable of predicting the thermal behavior of quad flat no-lead (QFN) packages, demonstrating the potential of AI in capturing complex thermal dynamics. Similarly, Subbarayan et al. [14] employed a similar approach to build a reliability prediction model for ball grid array (BGA) packages, further highlighting the versatility of AI in addressing different packaging designs. In more recent studies, Hsiao and Chiang [16] utilized the random forest algorithm to forecast the reliability lifespan of WLP through FEA simulations, validating their model against empirical data. The ability of the random forest algorithm to process large datasets with high accuracy while avoiding overfitting proved invaluable for this application. Additionally, Panigrahy et al. [25] explored the optimization of WLP reliability using AI-assisted design-on-simulation technologies, comparing multiple algorithms, including ANN, RNN, SVR, KRR, KNN, and RF. Their study not only demonstrated the predictive accuracy of these methods but also shed light on their computational efficiency, which is an increasingly important consideration as simulations grow in complexity. Kuo et al. [26] further expanded upon this by applying SVR techniques with both single and multiple kernel functions to predict the reliability of WLPs, demonstrating the flexibility of SVR in adapting to different dataset structures. Cheng et al. [27] also contributed to this body of work by developing an ANN-based model capable of predicting the warpage behavior of flip-chip chip-scale packages (FCCSP), achieving high computational efficiency and accuracy. These simulation models account for various material behaviors, including viscoelasticity, and incorporate temperature-dependent thermal-mechanical properties to closely match real-world conditions. Each of these studies underscores the growing importance of AI in microelectronic packaging, where the ability to predict performance and reliability is crucial for advancing next-generation technologies.
Building upon these important developments, this study aims to address a critical gap in the existing literature regarding warpage prediction for FOWLP by developing a novel predictive model. This model integrates FEA with advanced AI techniques to provide rapid, accurate assessments of process-induced warpage behavior, an issue that has long challenged the microelectronics manufacturing sector. A major innovation in this research is the introduction of a user-friendly graphical user interface (GUI) that complements the predictive model. This feature, which has been largely absent in prior studies, is particularly significant as it enhances both the accessibility and usability of the model for engineers and practitioners. Previous research, while focused on the technical accuracy and development of predictive models, has not placed sufficient emphasis on creating user-centric interfaces that facilitate widespread adoption in industry settings. The inclusion of a GUI in this study not only addresses that shortcoming but also elevates the functionality of the model by allowing users to input design parameters intuitively and observe real-time visualizations of warpage predictions. This real-time interaction transforms the design workflow, making it more efficient and accessible. The introduction of the GUI serves to democratize the use of advanced predictive models, bridging the gap between highly technical machine learning methodologies and practical engineering applications. This approach empowers a broader range of users, including those who may have limited expertise in AI or simulation technologies, to engage with complex predictive tools. Moreover, by simplifying the process of obtaining accurate predictions, the GUI plays a crucial role in integrating sophisticated models into the design and manufacturing process, making it easier for engineers to explore multiple design scenarios and optimize their solutions. Thus, this work provides an innovative contribution to the field, fostering greater accessibility and practical application of advanced modeling techniques in the context of FOWLP.
In this study, various machine learning approaches, including SVR [11], RF [16], GBR [17], KNN [18], and KRR [19], are examined in conjunction with deep learning methods such as RNN [20], GRU [21], MLP [22], and LSTM networks [23,24]. These methodologies are rigorously compared through a comprehensive evaluation, where the algorithm that demonstrates the closest alignment with FEA data is selected as the core algorithm for integration into the warpage prediction platform. This process of selecting the optimal algorithm ensures that the prediction model reflects the most accurate and reliable results possible, which are critical for further application in real-world scenarios. In addition to the machine learning and deep learning techniques, an FEA-driven process modeling approach is implemented, taking into account the viscoelastic properties of the epoxy molding compound (EMC) and the thermal-mechanical characteristics of the materials used in FOWLP, which vary with temperature. This combination allows for a more detailed understanding of how these material properties affect the warpage behavior during the manufacturing process. By incorporating these critical aspects into the modeling framework, the study provides a more holistic view of the factors influencing warpage. The effectiveness of this integrated modeling methodology is validated by comparing simulated warpage results with experimental data, ensuring that the model is not only theoretically robust but also practically relevant and accurate.
Further enhancing the study, a detailed parametric analysis is conducted to identify the key factors that exert the greatest influence on warpage behavior. These influential factors are carefully incorporated into the construction of the predictive model, ensuring that the model captures all relevant aspects of the process that may contribute to warpage. The inclusion of such detailed parametric variables allows for greater flexibility in the model, as it can be applied across a range of scenarios to predict warpage under different material and process conditions. Moreover, the feasibility and robustness of the developed warpage prediction model, now integrated with a GUI, are thoroughly evaluated using a separate validation dataset. This validation serves to test the performance of the model in predicting warpage under various conditions, ensuring that the predictions remain accurate across diverse testing scenarios. The introduction of the GUI is of particular importance, as it allows engineers to interact with the model in a user-friendly manner, facilitating real-time feedback and aiding significantly in the design process. By enabling users to adjust input parameters dynamically and receive instant predictions, the GUI adds a new layer of practicality to the warpage prediction model, making it more accessible and usable for industry professionals who may not be experts in machine learning or simulation techniques. This study goes beyond improving the accuracy of warpage prediction models for FOWLP by introducing a novel, intuitive GUI that dramatically enhances the usability of the model for real-world applications. The integration of this user-friendly interface streamlines the design process, enabling engineers to make more informed decisions quickly, thereby accelerating the overall workflow. By providing real-time predictive capabilities, the GUI-driven model not only improves the efficiency of the design process but also has the potential to significantly improve the performance and reliability of FOWLP systems. This new approach represents a significant advancement in the field, contributing to both the theoretical and practical aspects of microelectronic packaging design.
2. Structure and Fabrication Process of FOWLP
The structure of the FOWLP under investigation is elaborately illustrated in Figure 1, featuring a series of intricate and essential components that are pivotal to its functionality and reliability. These components include a glass carrier, redistribution layers (RDLs), silicon dies, copper pillar bumps (CPBs), and an EMC. Each element plays a significant role in the overall performance of the FOWLP, contributing to its mechanical strength, thermal stability, and electrical conductivity. The fabrication process of FOWLP begins with the deposition of a polyimide (PI) layer onto the glass carrier, which is a critical step that lays the foundation for the subsequent stages of the packaging process. Polyimide is chosen for its excellent thermal stability, chemical resistance, and mechanical properties, which are essential for maintaining the structural integrity of the package during high-temperature processes. Once the PI layer is deposited, the next crucial step is curing, wherein the carrier is subjected to a controlled heating process, reaching a temperature of approximately 210°C. This elevated temperature ensures that the polyimide layer adheres properly to the glass carrier, creating a stable and durable foundation for the subsequent layers that will be added to the package. The curing process also enhances the thermal stability of the PI layer, ensuring that it can withstand the thermal cycling that the FOWLP will experience during its operation. Following the successful curing of the polyimide layer, the fabrication process progresses to more complex stages that involve the creation of the RDLs. The RDLs are essential components of the FOWLP as they facilitate electrical interconnections between the silicon die and the external environment. The RDLs are typically composed of thin metal lines, such as copper, that are patterned onto the substrate. These metal lines provide a low-resistance path for electrical signals, ensuring efficient signal transmission between the die and the external circuitry. In addition to the RDLs, dielectric layers are also deposited during this stage to provide electrical insulation between the metal lines and other components of the package. The dielectric materials used in FOWLP are carefully selected for their ability to withstand high voltages and temperatures, ensuring the reliability and longevity of the package.
An important stage in the fabrication of FOWLP involves the formation of under bump metallization (UBM), which is a crucial interface between the silicon die and the copper pillar bumps. UBM plays a key role in ensuring a reliable electrical connection and mechanical adhesion between the die and the bumps. The UBM layer is typically composed of metals such as nickel and gold, which provide excellent electrical conductivity and corrosion resistance. The precise deposition of the UBM layer is critical for ensuring the long-term performance of the package, as any defects in this layer can lead to issues such as electrical shorts or mechanical failure. The die bonding process marks a significant step in the assembly of the FOWLP. During this process, the silicon die is carefully aligned and mounted onto the RDL substrate using CPBs as the interconnects. The precise alignment of the die with the bond pads on the substrate is essential for ensuring accurate electrical connections between the die and the substrate. Any misalignment during this stage could result in poor signal transmission or mechanical failure, both of which would compromise the performance of the package. The die bonding process is carried out in a highly controlled environment to minimize the risk of contamination or misalignment.
To ensure the mechanical stability and electrical conductivity of the die-substrate interface, the assembly is heated to a temperature of approximately 260°C. At this elevated temperature, the solder material in the copper pillar bumps melts, forming a strong bond between the silicon die and the substrate. This soldering process not only establishes electrical connectivity but also provides mechanical support to the die, ensuring that it remains securely attached to the substrate even under the stress of thermal cycling or mechanical shock. The high temperature required for this process is carefully controlled to prevent damage to the delicate components of the FOWLP while ensuring the integrity of the solder joints. Once the die bonding process is complete and the die is securely attached to the substrate, the next step involves the application of a liquid-type EMC. The EMC serves several critical functions in the FOWLP. First, it provides mechanical protection to the silicon die, shielding it from physical damage caused by external forces such as vibration, impact, or thermal expansion. Second, the EMC enhances the thermal stability of the package by distributing heat away from the die and preventing localized hotspots. This thermal management is crucial for maintaining the performance and longevity of the electronic components housed within the package. Third, the EMC provides electrical insulation, ensuring that the various conductive elements within the FOWLP remain electrically isolated from one another. This insulation is essential for preventing electrical shorts and ensuring the reliable operation of the package. After the liquid EMC is applied, it undergoes a curing process to solidify and adhere to the underlying components. The curing process is carried out at a temperature of approximately 150°C, which is sufficient to harden the EMC without causing thermal damage to the other components of the FOWLP. The cured EMC provides additional mechanical support to the package, ensuring that the silicon die and other components remain securely in place even under the stress of thermal cycling or mechanical vibrations. Furthermore, the cured EMC enhances the overall reliability of the package by protecting it from environmental factors such as moisture, dust, and chemical contaminants.
In addition to its protective functions, the EMC also contributes to the overall structural integrity of the FOWLP. By encapsulating the silicon die and other components, the EMC helps to distribute mechanical stresses evenly throughout the package, reducing the likelihood of localized failures. This even distribution of stress is particularly important in high-performance electronic applications, where the FOWLP may be subjected to extreme conditions such as high temperatures, rapid thermal cycling, or mechanical shock. The EMC ensures that the package can withstand these conditions without compromising its electrical or mechanical performance. The fabrication of the FOWLP is a highly intricate and precise process, requiring careful attention to detail at every stage. Each component, from the PI layer to the EMC, plays a critical role in ensuring the overall performance, reliability, and longevity of the package. By carefully controlling the deposition, bonding, and curing processes, the FOWLP can be engineered to meet the stringent demands of modern electronic devices, providing a reliable and efficient solution for advanced packaging applications.
3. Theoretical Frameworks of Machine Learning and Deep Learning
In this study, a combination of both machine learning and deep learning techniques is utilized to perform a comprehensive analysis and prediction of complex datasets, addressing the challenges inherent in capturing nuanced patterns within diverse data types. The machine learning approaches employed in this investigation include SVR [11], RF [16], GBR [17], KNN [18], and KRR [19]. Each of these methods brings distinct capabilities and strengths to the table, particularly in their ability to process structured data, which is a common characteristic of many real-world datasets. These algorithms excel in creating models that are capable of uncovering intricate relationships within data, and they vary in their approach to learning from the input variables. For instance, GBR is highly effective in handling non-linear relationships by sequentially building a series of models that correct the errors of previous iterations, whereas SVR focuses on constructing hyperplanes in a high-dimensional space to best separate the data points, offering robust performance even in complex scenarios. KNN, on the other hand, is valuable for its simplicity in classification and regression tasks, utilizing distance metrics to make predictions based on the nearest neighbors in the feature space, while KRR merges the strengths of ridge regression with kernel methods to handle non-linearity. In addition, RF is recognized for its ensemble learning approach, which combines multiple decision trees to improve prediction accuracy, reduce overfitting, and handle a diverse range of input data types. This method is particularly advantageous when working with large datasets that contain noisy or unbalanced data, as the averaging of multiple trees mitigates the risk of overfitting, providing stable and reliable predictions.
Furthermore, deep learning techniques are also incorporated into the analysis, including RNN [20], GRU [21], MLP [22], and LSTM [23,24]. These models are inherently more complex than traditional machine learning algorithms, as they are designed to automatically learn and extract features from unstructured data, such as time-series or sequential data. Their architecture allows them to recognize patterns across time steps, making them particularly well-suited for tasks that require temporal dynamics, such as predicting trends in financial markets, understanding user behavior over time, or forecasting demand in supply chain management. The recurrent nature of RNNs allows them to maintain a memory of previous inputs, enabling the model to make more informed predictions based on past information. However, due to issues such as vanishing gradients, GRU and LSTM were developed as advanced variants to overcome these limitations by introducing gating mechanisms that better control the flow of information through the network. These gated units are crucial for enabling the model to focus on relevant time steps, filtering out irrelevant information and thereby improving prediction accuracy.
In particular, LSTMs are highly effective in managing long-range dependencies within sequential data, offering a distinct advantage over traditional RNNs in applications that require the retention of information across extended sequences. This makes LSTMs particularly suitable for complex tasks such as speech recognition, language translation, and time-series forecasting, where the relationships between data points may span long intervals. GRUs offer a more streamlined architecture than LSTMs, reducing computational complexity while still retaining the ability to capture temporal dependencies. This makes GRUs an attractive option for scenarios where computational efficiency is critical, yet the task still demands the ability to model sequential dependencies with high accuracy.
MLP, though not explicitly designed for sequential data, provide a versatile framework for handling both regression and classification tasks. As a feedforward neural network, the MLP operates by passing information through multiple layers of interconnected nodes, allowing the network to learn hierarchical representations of the data. This approach is particularly powerful when working with high-dimensional datasets, as it enables the model to discover complex relationships between input features and target variables. While MLPs are often used for structured data, they can also be applied to unstructured data, particularly when combined with other models or used as part of a larger ensemble. The deep learning models, with their capacity to process vast amounts of data and their ability to automatically learn complex feature representations, significantly enhance the accuracy and robustness of the predictions generated in this study. By capturing intricate patterns that might be overlooked by traditional machine learning algorithms, these models contribute to a more nuanced understanding of the data, ultimately leading to more reliable and informed decision-making processes. The combination of both machine learning and deep learning methodologies thus provides a comprehensive toolkit for tackling the challenges presented by complex datasets, ensuring that the models developed in this study are both flexible and capable of delivering high-performance predictions across a variety of applications. A more comprehensive analysis and explanation of the previously discussed machine learning and deep learning models will now be presented, providing deeper insights into their respective functionalities and applications.
3.1. Support Vector Regression (SVR)
The SVR model [11] works by constructing a linear function in a high-dimensional feature space to capture the relationship between input features and the target variable. For a set of training data {(x1,y1),(x2,y2),…,(xn,yn)}, where xi ∈ Rd are the input feature vectors and yi ∈ R are the corresponding target values, the goal is to find a function f(x) that deviates from the actual target values by no more than ε and is as flat as possible. In its simplest form, the regression function can be expressed as,
where w is the weight vector and b is the bias term. However, not all data points can be perfectly fitted within this margin, so SVR introduces slack variables and to account for instances where the prediction error exceeds ε. The optimization problem can then be formulated as,
subject to the constraints:
In this formulation, the term represents the model complexity, or the flatness of the regression function, while the slack variables and account for the errors outside the ε margin. The parameter C controls the trade-off between minimizing the prediction error and maintaining a smooth regression function. A large C value prioritizes minimizing errors, allowing more points to violate the ε margin, whereas a smaller C enforces a smoother model at the cost of higher errors.
3.2. Random Forest (RF)
RF [16] is an ensemble learning technique that combines multiple decision trees to improve predictive accuracy and reduce overfitting. The algorithm works by generating multiple decision trees during training, with each tree trained on a random subset of the data and a random subset of the input features. The final prediction is made by aggregating the predictions from all the trees, typically through majority voting for classification or averaging for regression. In the case of regression, RF constructs M decision trees, each trained on a different bootstrap sample from the original dataset. The prediction for a given input x is the average of the individual predictions from each tree, expressed as,
where Tm(x) is the prediction of the m-th decision tree for input x, and M is the total number of trees in the forest. Each tree Tm is built by recursively splitting the data to minimize the variance in the output variable, typically using criteria like MSE. The goal of each split is to find the feature and threshold that maximally reduce the variance within each resulting subset, defined as,
where S is the original subset of data before the split, S1 and S2 are the resulting subsets after the split, and Var(S) is the variance of the target values in subset S. The algorithm selects the split that maximizes this variance reduction. In addition to bootstrapping, RF introduces randomness by selecting a random subset of features at each split within a tree. This is controlled by a parameter mtry, which specifies the number of features to consider at each node. For regression, this is typically set to , where p is the total number of features. This random selection ensures that each tree is diverse and not overly dependent on any specific features. Once all trees are trained, the RF model makes its final prediction for a given input x by averaging the predictions of all trees, as shown earlier. This averaging helps reduce the variance of the model and increases its robustness, as the individual errors of the trees tend to cancel each other out.
3.3. Gradient Boosting Regression (GBR)
GBR [17] is a sophisticated machine learning technique designed to iteratively improve predictive accuracy by combining multiple weak models, typically decision trees, into a strong ensemble model. At its core, GBR seeks to minimize a loss function, such as mean squared error (MSE), which is represented by,
yi represents the actual target value, and denotes the predicted value. The algorithm initiates with a preliminary prediction, typically defined as the mean of the target value. Subsequently, it computes the residuals, which are the deviations between the predicted value and the corresponding actual value yi, as expressed by the following equation,
In each iteration, GBR fits a weak learner to the residuals, where the weak learners typically consist of shallow decision trees. While these individual weak learners may exhibit a propensity for underfitting when considered in isolation, their sequential combination results in a significantly more robust predictive model. The principal innovation of GBR lies in the application of gradient descent to iteratively minimize the specified loss function. At each iteration, the model computes the gradient of the loss function with respect to the current predictions, expressed as,
is the gradient of the loss function evaluated at the current prediction . A new weak learner is then fitted to approximate this gradient, and the model is updated by incorporating the predictions of the weak learner, scaled by a learning rate α, which modulates the contribution of each learner to the overall model. The updated prediction at iteration m+1 is given by,
where hm(x) denotes the weak learner trained on the residuals. This process is iteratively repeated over a pre-defined number of iterations, progressively refining the accuracy of the model by minimizing the residual errors. After M iterations, the final model is represented as the cumulative sum of the initial prediction and the contributions of all weak learners, formulated as,
3.4. K-nearest Neighbors (KNN)
KNN [18] is a simple yet effective machine learning algorithm used for both classification and regression tasks. In the context of regression, KNN operates by identifying the kkk-nearest data points in the training set to a given query point and then predicting the target value based on the average of these neighbors. The core idea behind KNN is that similar instances are likely to have similar outcomes, making it a non-parametric method that does not assume any prior distribution of the data. In KNN, the first step is to define a distance metric to measure the similarity between data points. The most commonly used metric is the Euclidean distance, which for two data points xi and xj in a d-dimensional space is given by,
This formula computes the square root of the sum of squared differences between the corresponding features of the two points. Once the distance is calculated for all points in the training set relative to the query point, the algorithm selects the k-nearest neighbors, where k is a predefined integer. For KNN regression, the prediction is made by averaging the target values of these k-nearest neighbors. If the target values of the k-nearest neighbors are denoted by y1,y2,…,yk, the predicted value for the query point is computed as,
This simple averaging method ensures that the prediction reflects the local neighborhood of the query point. Alternatively, a weighted version of KNN can be used, where closer neighbors contribute more to the prediction than those further away. In such cases, the weights are inversely proportional to the distance between the query point and its neighbors. The weighted prediction is computed as,
whereis the weight assigned to the i-th neighbor based on its distance to the query point. This approach improves accuracy in situations where nearer neighbors are more likely to have similar target values.
3.5. Kernel Ridge Regression (KRR)
KRR [19] is an extension of ridge regression that incorporates the power of kernel methods, enabling it to handle non-linear relationships between features and target variables. Like standard ridge regression, KRR aims to minimize a penalized sum of squared errors, balancing the trade-off between fitting the data well and preventing overfitting by controlling the magnitude of the coefficients. The ridge regression problem is formulated as,
where yi represents the target values, xi the feature vectors, w the coefficients, and λ is the regularization parameter that discourages large coefficients and controls overfitting. While this works well for linear problems, it is insufficient for non-linear data, where a simple linear model cannot capture complex patterns. This is where Kernel Ridge Regression comes into play by mapping the data into a higher-dimensional feature space using a kernel function, allowing the model to fit non-linear relationships. In KRR, instead of solving the regression problem in the original feature space, we utilize a kernel function K(xi,xj), which computes the similarity between data points xi and xj without explicitly performing the high-dimensional mapping. One popular kernel used in KRR is the radial basis function kernel, which is defined as,
This kernel function measures the similarity between two data points based on their Euclidean distance, and the parameter σ controls the width of the Gaussian function, dictating how much influence each data point has in the higher-dimensional space. The use of kernels transforms the original regression problem into one that can be solved in the kernel space, leading to the following solution in the dual form. The solution for the regression problem in KRR can be written as,
where represents the vector of dual coefficients, K is the kernel matrix with entries K(xi,xj), λ is the regularization parameter, I is the identity matrix, and y is the vector of target values. Once is computed, predictions for a new data point x are made by evaluating the weighted sum of the kernel functions between the new data point and the training data points,
This formulation shows that the prediction for x depends on how similar it is to the training points, weighted by the coefficients , which were learned during the training process. The regularization parameter λ helps control the complexity of the model by preventing the kernel matrix from overfitting the training data. A larger λ results in a smoother, more generalized model, while a smaller λ allows the model to fit the data more closely.
3.6. Recurrent Neural Networks (RNN)
RNN [20] is a type of neural network architecture specifically designed for handling sequential data by allowing connections between units to form directed cycles, which introduces the concept of memory in the network. Unlike traditional feed forward neural networks, RNNs maintain a hidden state that is passed from one time step to the next, enabling them to capture temporal dependencies in data. At each time step t, the RNN takes an input xt, updates its hidden state ht, and generates an output yt, where the hidden state is influenced by both the current input and the hidden state from the previous time step. The fundamental equations governing an RNN are,
ht is the hidden state at time step t, Wh, Wx, and Wy are the weight matrices corresponding to the hidden state, input, and output, respectively, and bh and by are the bias terms. The non-linear activation function tanh is often used to introduce non-linearity into the network. The hidden state ht captures the information from both the current input xt and the past hidden state ht-1, thereby allowing the RNN to retain memory over time. The output yt is typically a linear transformation of the hidden state, followed by a non-linear activation function depending on the task.
For sequences, the RNN processes inputs sequentially, updating the hidden state at each time step, which allows it to learn patterns across time steps. The hidden state at time ttt not only depends on the input at that particular step but also on the entire history of previous inputs, thus allowing RNNs to capture long-term dependencies. This recurrence is what gives RNN their power for tasks like time-series prediction, natural language processing, and speech recognition.
3.7. Gated Recurrent Unit (GRU)
A GRU [21] is designed to handle sequential data by maintaining a hidden state that captures dependencies over time. It uses two main gates: the reset gate and the update gate, both of which control how information flows through the network and updates the hidden state. The update gate zt controls the degree to which the previous hidden state ht−1 influences the current hidden state ht. It is computed as,
where Wz and Uz are weight matrices, xt is the input at time step t, and σ represents the sigmoid function. The reset gate rt determines how much of the previous hidden state should be ignored when computing the candidate hidden state. It is calculated as,
Using the reset gate, the candidate hidden state is formed, which incorporates the influence of the input and selectively includes information from the past,
Finally, the new hidden state ht is updated by blending the previous hidden state ht−1 and the candidate hidden state , weighted by the update gate,
This mechanism allows the GRU to maintain relevant information over time while effectively discarding unnecessary details, ensuring that the model can capture both short- and long-term dependencies in the data.
3.8. Multilayer Perceptron (MLP)
A MLP [22] is a type of artificial neural network composed of at least three layers: an input layer, one or more hidden layers, and an output layer. Each layer consists of multiple nodes or neurons, where each neuron applies a weighted sum of its inputs followed by a nonlinear activation function. The mathematical model for a single neuron can be represented as,
where wi represents the weights, xi are the input features, and b is the bias term. The output of the neuron is passed through an activation function σ(z), commonly a sigmoid, rectified linear unit, or hyperbolic tangent function,
For the entire MLP, the forward propagation of inputs through multiple layers follows this process, and the network learns by adjusting the weights and biases through backpropagation. The goal is to minimize the loss function , where y is the true label and is the predicted label, using gradient descent,
where η is the learning rate. Through iterative training, the MLP optimizes its parameters to perform tasks like classification or regression.
3.9. Long Short-Term Memory (LSTM)
LSTM [23,24] is an architecture specifically designed to address the vanishing gradient problem, which poses significant challenges when models attempt to learn long-term dependencies. LSTMs use memory cells that maintain their state over time and are regulated by three gates: input, forget, and output gates. The memory cell ct is updated as follows,
where ct−1 is the previous cell state, is the candidate cell state, it is the input gate, and ft is the forget gate. The input gate it, forget gate ft, and output gate ot are defined as:
xt represents the input at time step t, ht−1 is the hidden state from the previous time step, and σ is the sigmoid function. The candidate cell state is computed as,
Finally, the hidden state ht is updated based on the output gate and the new cell state,
4. Finite Element Analysis (FEA) Model for FOWLP
A comprehensive FEA model has been developed, incorporating the ANSYS element birth and death technique alongside nonlinear FEA, to provide an accurate assessment of the warpage behavior observed in FOWLP during its fabrication process. As illustrated in Figure 2, the model represents a fully three-dimensional simulation of the FOWLP structure. In order to eliminate the possibility of rigid body motion, the displacement of the nodes located at the center of the bottom surface of the glass carrier is constrained. The detailed composition of the FEA model, depicted in Figure 3, includes critical components such as RDLs, EMC, CPBs, silicon dies, and the glass carrier. The mesh is constructed using hexahedral solid elements (ANSYS SOLID185), resulting in approximately 457,272 elements and 498,726 nodes in total for the entire FOWLP structure, ensuring a high level of precision in the warpage simulation. Table 1 shows the material properties of the WLP model. It is crucial to highlight that all materials, with the exception of the solder balls, exhibit linear behavior and are not influenced by temperature variations. The material properties of the SAC 305 solder balls, on the other hand, demonstrate nonlinear behavior and are highly dependent on temperature, as shown in Figure 4 [27]. While the EMC is modeled as a linearly viscoelastic material, all other materials are treated as linearly elastic, isotropic, and temperature-dependent, thereby ensuring an accurate representation of their mechanical response in the simulation.
EMC materials are critical in determining the thermal-mechanical performance of electronic packaging systems [28]. These materials typically exhibit viscoelastic characteristics that are influenced by temperature, time, and strain rate, leading to complex behaviors such as creep, stress relaxation, and hysteresis. The viscoelastic relaxation behavior of EMC materials is commonly modeled using a generalized Maxwell framework, which consists of multiple Maxwell elements and an independent spring arranged in parallel. This approach effectively captures the relaxation dynamics and is frequently represented through a Prony series expansion in frequency domain, which provides an accurate fit to experimental relaxation data.
E(ω) denotes the relaxation modulus of the entire model, gi the weight factor of the ith Maxwell element, the long-term fully relaxed weight factor, ω the frequency, τi the relaxation time, and N the total number of Maxwell elements.
The time and temperature dependence of the mechanical properties of a viscoelastic material can be correlated using the time–temperature superposition principle (TTSP). More specifically, the TTSP suggests that a relaxation curve of a viscoelastic material at a specific temperature can be employed as a reference for further characterizing the relaxation curves at other temperatures by conducting a horizontal translation of the reference relaxation curve in the logarithmic time domain. The temperature translation factor λT is normally approximated using an empirical relationship, the so-called Williams–Landel–Ferry (WLF) equation,
κ1 and κ2 are identified as curve-fitting coefficients, with Tr representing the reference temperature. The master curve of the relaxation modulus at this reference temperature can be derived by shifting the experimentally obtained frequency-dependent storage moduli measured at various temperatures along the time axis, utilizing the temperature-dependent translation factors λT. Through relaxation modulus data obtained at different isothermal conditions under 1% applied strain [29], a reference master curve has been constructed at the glass transition temperature of EMC, as depicted in Figure 5. The coefficients gi and τi for the 20-term Prony series model, which are used to fit this master curve, are presented in Table 2. Moreover, using the shift factor as a temperature function, as illustrated in Figure 6, the fitted WLF model coefficients, κ1=6.311×10⁷ and κ2=1.001×10⁹, have been determined for the translation factors, providing a temperature-dependent characterization.
5. Results and Discussion
5.1. Characterization of Process-Induced Warpage of FOWLP
In this study, an experimental approach using the Shadow Moiré measurement technique was meticulously employed to validate and confirm the accuracy of the FEA simulations for FOWLP. This technique, known for its high precision in measuring warpage and deformation, plays a pivotal role in ensuring that the simulation results align closely with real-world experimental outcomes. By leveraging the capabilities of the Shadow Moiré method, the study aimed to provide a robust and reliable validation framework, ensuring the predictive models are not only theoretical but also applicable to practical scenarios in semiconductor packaging.
Figure 7, presented in this study, offers a clear schematic representation of the RDLs within the FOWLP structure, a key component that plays a significant role in the overall performance and reliability of these advanced packaging systems. The RDLs serve as essential pathways for electrical connectivity, linking the microchips with external systems. Understanding the behavior of these layers under thermal and mechanical stress is crucial to the design and development of high-performance FOWLP structures, which are increasingly becoming the standard in modern electronics due to their high density and efficient use of space. The fabrication process for these complex structures begins with the deposition of the PI 0 dielectric layer onto the carrier substrate at a controlled temperature of 210°C, a critical step that ensures the proper insulation and protection of the underlying components. The precise temperature control is essential because any deviations could lead to defects in the dielectric layer, impacting the overall performance of the package. The PI 0 layer serves as the foundational layer, providing the necessary insulation and mechanical support for the subsequent RDLs and dielectric layers that will be added in the later stages of the process.
In the second stage of the fabrication process, the first redistribution layer (RDL 1) is fabricated. This layer forms the initial network of interconnections, establishing the primary pathways for electrical signals within the FOWLP structure. The process of fabricating the RDL involves precise lithography and metallization techniques, which must be executed with high accuracy to ensure the correct alignment and functionality of the interconnections. Once RDL 1 is successfully formed, the process moves to the third stage, where the dielectric layer PI 1 is deposited. This layer serves to insulate the RDL 1 from subsequent redistribution layers, preventing any electrical short circuits and ensuring the structural integrity of the entire package. The steps in stages two and three, specifically the fabrication of the RDLs and dielectric layers, are subsequently repeated twice to complete the formation of the additional layers, namely RDL 2, PI 2, RDL 3, and PI 3. Each repetition of this process is conducted with extreme precision, as the accuracy and performance of the final FOWLP structure depend heavily on the correct fabrication of each layer. The RDLs must be perfectly aligned, and the dielectric layers must provide effective insulation without introducing any mechanical stress or defects that could affect the warpage behavior of the package. By repeating these steps, the multilayered structure of the FOWLP is built, with each layer contributing to the overall electrical and mechanical performance of the system.
Moreover, the repeated fabrication process, involving multiple RDL and dielectric layers, introduces additional complexity in terms of thermal management and mechanical stability. Each layer, especially the redistribution layers, contributes to the overall thermal expansion characteristics of the package, which in turn influences the warpage behavior during thermal cycling. The Shadow Moiré technique was particularly useful in capturing these subtle deformations, providing detailed insights into how each layer affects the overall warpage of the structure. By correlating the experimental data with the FEA simulations, the study was able to refine the predictive models, ensuring that they accurately represent the real-world behavior of FOWLP structures under varying conditions. The combination of advanced fabrication techniques, precise measurement methods like Shadow Moiré, and sophisticated FEA simulations provides a comprehensive approach to understanding and mitigating warpage in FOWLP. This detailed understanding is critical for the development of reliable and efficient semiconductor packaging solutions that meet the demands of modern electronics, where performance, miniaturization, and reliability are paramount.
Due to the inherent scale mismatch between the intricate and smaller features of the RDL pattern and the significantly larger 12-inch wafer, it becomes clear that utilizing a conventional direct modeling approach for FEA simulations is not practical. The vast difference in scale leads to computational challenges, as accurately representing every detail of the RDL pattern within the full-scale wafer model would result in an excessively large computational burden and unmanageable simulation times. Therefore, The FEA utilizing a detailed fine mesh model can be directly applied to determine the effective orthotropic elastic properties of Cu circuit layers. This approach is particularly effective in capturing the critical parameters that influence these effective properties with high accuracy. However, it involves a highly intricate, time-intensive, and complex process for modeling and simulating the material behavior [30]. This methodology is succinctly referred to as the FEA-based effective approach [31]. The fundamental concept of this approach is to ensure that the elastic responses of the homogeneous equivalent continuum are in alignment with those of the original heterogeneous medium. Figure 8 depicts the model used in this study for the evaluation of equivalent material properties.
The effective CTEs of the Cu circuit layers could be simply calculated based on the strength of the materials,
where δi is the thermal deformation, αi (i = x, y, z) stands for the effective CTE in the i-th direction, ∆T denotes the temperature increment, and Li represents the side length of the Cu circuit layers in the i-th direction.
In accordance with the generalized Hooke’s law, the stress-strain relationship of an orthotropic material is expressed as,
where ε(εx, εy, εz) and σ(σx, σy, σz) are the normal strain and stress, respectively, γ(γxy, γyz, γzx) and τ(τxy, τyz, τzx) represent the shear strain and stress, respectively, and υ(υxy, υyz, υzx) denotes the Poisson’s ratio. In total, there are nine independent effective elastic constants to be determined for an orthotropic elastic material, which are Ex, Ey, Ez, υxy, υyz, υzx, Gxy, Gyz, and Gxz. These constants can be simply derived based on Equations (38)–(43) through FEAs with a set of different loading and boundary conditions. The rest of the effective elastic constants υxy, υyz, υzx can be readily derived from the fact that the compliance matrix is symmetric.
Table 3 presents the material properties of the RDLs. The effective material properties are calculated based on the equations mentioned above. The Cu volume fraction is approximately 24.9% in RDL1, 35.7% in RDL2, 40.2% in RDL3, and 23.5% in RDL4. This effective material approach not only simplifies the FEA simulation but also provides a more accurate representation of the mechanical behavior of the RDLs at the wafer scale. Without this approach, the simulation would either be too computationally expensive to be feasible or too simplified to yield meaningful results. By integrating the FEA-based effective approach, the study ensures that the essential mechanical properties of the RDLs are accurately captured, enabling precise predictions of warpage and other thermomechanical effects in the FOWLP structure. The combination of in-plane and out-of-plane CTE calculations allows for a comprehensive understanding of the thermal behavior of the RDLs, contributing to the overall accuracy of the simulation. Ultimately, this approach underscores the importance of balancing computational efficiency with the need for accuracy in FEA simulations, particularly when dealing with complex multi-material systems like FOWLP. Through the use of effective material properties, the study is able to overcome the challenges posed by the scale mismatch between the RDL pattern and the 12-inch wafer, ensuring that the simulation results remain reliable and relevant to real-world applications in semiconductor packaging.
The warpage analysis results, obtained through both experimental measurements and FEA simulations, are presented in Figure 9 for a detailed comparison. These results are critical for understanding the complex thermomechanical behavior that occurs during the RDL fabrication process, a key stage in the production of FOWLP structures. Specifically, Figure 9 (a) displays the experimentally measured warpage after the entire RDL fabrication process has been completed, showcasing the actual physical deformation of the structure. On the other hand, Figure 9 (b) illustrates the corresponding warpage as predicted by the FEA simulations, providing a theoretical representation of the same deformation based on the assumptions of the model and the material properties used in the simulation. Warpage refers to the differential deformation experienced by the structure along the z-axis, which is the vertical direction perpendicular to the wafer plane. Warpage is quantified as the difference between the maximum and minimum displacement values across the surface of the wafer, effectively measuring how much the structure bends or deforms due to thermal or mechanical stress. This deformation can be caused by several factors, including the differing CTE between the various materials used in the packaging, as well as the internal stresses that develop during the RDL fabrication process.
The comparison between the experimental measurements and the simulated results reveals a high degree of correlation, which is crucial in validating the accuracy and reliability of the FEA model employed in this study. Such validation is essential for ensuring that the simulation can be trusted to predict real-world outcomes, which is particularly important when designing and optimizing semiconductor packaging technologies. According to the results, the experimentally measured warpage reached a value of 506.6 μm, while the simulated warpage value was 495.7 μm. This minimal deviation of only 10.9 μm between the experimental and simulated values demonstrates a remarkably close agreement, underscoring the precision of the FEA model used in this analysis. This small discrepancy between the measured and simulated warpage can be attributed to several factors, including slight variations in material properties, process conditions, or the inherent limitations of experimental measurement techniques. Nonetheless, the close alignment between these two values highlights the robustness and reliability of the FEA approach, confirming that the model is capable of accurately capturing the key physical phenomena that occur during the RDL fabrication process. The ability of the FEA model to predict warpage with such a high degree of accuracy is particularly noteworthy given the inclusion of the viscoelastic properties of the EMC in the simulation. Viscoelastic materials, such as the EMC, exhibit both elastic and time-dependent viscous behavior, making their mechanical response more complex than purely elastic materials. By accounting for these viscoelastic properties in the simulation, the model is able to more accurately reflect the real-world behavior of the FOWLP structure under thermal cycling conditions.
The close congruence between the experimental and simulated results serves as strong evidence of the accuracy and robustness of the proposed process modeling methodology for predicting warpage. This high level of agreement between the two sets of data not only validates the effectiveness of the FEA framework in capturing the complex thermomechanical behavior of the system but also emphasizes the capability of the model to provide reliable predictions of warpage under practical manufacturing conditions. In other words, the FEA-based approach proves to be a highly effective tool for understanding and predicting the deformation behavior of FOWLP structures during the critical RDL fabrication process, which is essential for optimizing these structures to minimize undesirable warpage. Moreover, the successful validation of the FEA model in this study paves the way for its future application in optimizing packaging designs to minimize thermally induced warpage in advanced electronic systems. By providing a reliable and accurate tool for predicting warpage, this methodology enables engineers and designers to test various design configurations and material choices in a virtual environment before implementing them in actual manufacturing processes. This ability to simulate and predict warpage behavior in advance allows for more efficient and cost-effective design optimization, reducing the risk of failures and defects in the final product. Furthermore, the accuracy of the FEA model, as thoroughly validated through the comparison with experimental data, lays a strong foundation for the development of an AI-based predictive platform for warpage analysis. The data derived from the FEA simulations, having been confirmed to be accurate and reliable, will serve as a highly credible and robust dataset for training and validating the AI model. The integration of FEA-derived data into the AI platform will significantly enhance the precision and reliability of the AI predictions, ensuring that the platform can provide accurate and trustworthy results in real-world applications.
The use of AI in warpage prediction offers several advantages, including the ability to quickly analyze large datasets and identify complex patterns that may not be immediately apparent through traditional methods. By leveraging machine learning algorithms, the AI platform can learn from the FEA data and improve its predictive capabilities over time, becoming more accurate and efficient with each iteration. This integration of FEA and AI will facilitate more effective optimization and control of warpage in future packaging technologies, allowing for faster and more reliable design iterations. In practical terms, this AI-based predictive platform could be used to simulate the effects of various design parameters, such as material properties, layer thicknesses, and process conditions, on the warpage behavior of FOWLP structures. By providing accurate predictions of how these factors will influence warpage, the platform will enable engineers to make informed decisions during the design phase, ultimately leading to more robust and reliable packaging solutions. This will be particularly valuable in the development of next-generation electronic systems, where the demand for smaller, faster, and more efficient devices requires increasingly complex packaging designs with tight tolerances for warpage and other mechanical deformations. In conclusion, the results of this study firmly establish the credibility and effectiveness of the FEA-based approach in predicting warpage phenomena during the RDL fabrication process. The close agreement between the experimental measurements and the FEA simulations underscores the accuracy and robustness of the model, while the inclusion of viscoelastic properties further enhances its predictive capabilities. The successful validation of the FEA model not only demonstrates its usefulness in current packaging design optimization efforts but also lays the groundwork for the development of an AI-based predictive platform, which will enable even more efficient and accurate warpage analysis in the future. Through this integration of FEA and AI, the study contributes to the ongoing advancement of semiconductor packaging technologies, helping to meet the ever-growing demands of the electronics industry for high-performance, reliable, and miniaturized devices.
5.2. Establishment of Training/Test and Validation Datasets
In this study, five critical parameters were meticulously identified as the most influential factors contributing to thermal stress-induced warpage in FOWLP structures. These parameters include the Die/Package area ratio, the die thickness, the EMC thickness, and two key material properties of the EMC: Young’s modulus and the CTE. Figure 10 provides detailed specifications regarding the die thickness and EMC thickness. Each of these parameters was selected for its substantial impact on the thermomechanical performance of FOWLP structures, particularly under thermal cycling, a prevalent operational stressor in advanced packaging technologies that significantly influences warpage behavior.
To further understand how changes in these five parameters affect warpage, they were systematically incorporated into the development of an AI model designed to predict warpage behavior induced by thermal stress. The AI model, built using FEA-generated data, enables engineers to optimize FOWLP structures by minimizing warpage. The training dataset, consisting of 1200 data points, was created through FEA simulations, each representing a unique combination of the five parameters and corresponding warpage behavior, as detailed in Table 4. This comprehensive dataset offers a solid foundation for the AI model to accurately predict warpage across various design configurations. Additionally, this study systematically investigates the effects of the Die/Package area ratio, die thickness, EMC thickness, as well as the Young’s modulus and CTE of the EMC on warpage behavior. The Die/Package ratio was varied across 12 distinct percentage values ranging from 10% to 60% to capture a broad spectrum of design possibilities. Similarly, realistic variations in die and EMC thicknesses were examined, as these parameters critically influence the structural integrity and thermal stress response of the package. The mechanical properties of the EMC were evaluated across a range of Young’s modulus values (5, 10, 15, 20, and 25 GPa) and CTE values (5, 7, 10, and 15 ppm), reflecting different material behaviors under thermal stress. By exploring these variations, the study provides insights into the stiffness and thermal expansion behavior of the EMC, which are critical in minimizing warpage. Through the comprehensive simulation process, the generated dataset offers a robust foundation for in-depth analysis and accurate predictions across a wide variety of design configurations. Ultimately, the findings from this study contribute to a deeper understanding of the factors that influence warpage in FOWLP structures and provide valuable guidance for future packaging design, enhancing the reliability and performance of these technologies.
5.3. A Comparison of Prediction Results from Different Learning Models
The SVR model is initialized with a radial basis function (RBF) kernel, commonly used to handle non-linear relationships in data. The parameter C is set to 100, which controls the regularization of the model, with a higher value leading to a smaller margin and less tolerance for misclassification, making it more sensitive to training data. The gamma parameter, set to 0.1, defines the influence range of a training point, where a lower gamma extends the influence farther, and a higher gamma restricts it to nearby points. The epsilon parameter, set to 0.1, specifies the margin of tolerance within which no penalty is applied to errors in the training data. The model is trained on standardized input data, allowing it to make continuous predictions based on normalized features. In the RF model, the n_estimators parameter, set to 100, determines the number of decision trees used in the ensemble. With 100 trees, the model gains robustness and stability by averaging the outputs of multiple trees, reducing overfitting. The random_state parameter is set to 42, ensuring reproducibility by fixing the randomness in the internal processes of the algorithm. These parameters help balance randomness and repeatability while maximizing the predictive power of the model.
The GBR model uses 100 estimators, performing 100 boosting iterations to refine predictions and reduce errors. The learning rate is set to 0.1, controlling the contribution of each tree to the final prediction. The maximum depth of the trees is limited to 3, preventing overfitting, and the random_state parameter is set to 0 for reproducibility. Together, these parameters guide the model in handling bias, variance, and overall accuracy. For the KNN model, n_neighbors=3 specifies that the three closest neighbors will be used for regression. Both the input data and the target variable are normalized during training, and predictions are denormalized back to their original scale after the model completes the prediction process. The KRR model employs an RBF kernel, which captures non-linear relationships by measuring data point similarities based on their distance in feature space. The alpha parameter, set to 1.0, controls the regularization strength, balancing the trade-off between fitting the training data and generalizing to unseen data. A higher alpha increases regularization to reduce overfitting, while a lower alpha allows the model to capture more intricate patterns, potentially at the cost of overfitting. This combination of the RBF kernel and regularization through alpha enables KRR to handle non-linear regression tasks effectively while managing the risk of overfitting.
The input layer of the RNN model accepts a shape of (5, 1), indicating that each sample has five time steps, with each step containing a single feature. In the RNN and LSTM layers, 128 units are used, meaning they maintain 128 hidden units. Both layers use the ReLU activation function, which introduces non-linearity into the model to help it learn complex patterns. The final output layer, named 'output1,' is a single-unit Dense layer, reflecting that the model predicts a single target variable, such as the warpage value. In the RNN model, the SimpleRNNCell, with its 128 units, maintains the hidden state, while in the LSTM model, the LSTM layer processes sequences of data across multiple time steps. Both models are compiled using the Adam optimizer with a learning rate of 0.001, which is suited for gradient-based optimization. The loss function used is MSE, appropriate for regression tasks as it measures the squared differences between predicted and actual values.
Similarly, in the GRU model, the main parameter is the number of units, set to 128, which defines the dimensionality of the output space. The GRU is wrapped in a Bidirectional layer, which processes the input sequence both forward and backward, allowing the model to capture information from past and future time steps. The MLP model is designed with an input layer that accepts five features. It has three Dense layers, each containing 128 neurons, and all using the ReLU activation function. The final output layer is a single neuron for prediction. This model is also compiled using the Adam optimizer with a learning rate of 0.001, and MSE is used as the loss function. In all these models, normalization is applied to the input data, scaling it based on the mean and standard deviation, ensuring that all features contribute equally. Similarly, the output variable is normalized before training, and the predicted values are denormalized after prediction for better interpretability. All models are trained with 10000 epochs and a batch size of 240, with verbosity turned off during training to minimize console output.
In this study, a total of 10 sets of FOWLP dimensions and material parameters were meticulously selected to enable a thorough and comprehensive comparison between the performance of various machine learning models and deep learning models. The objective of this analysis was to evaluate the predictive accuracy and reliability of these models in estimating warpage, a critical factor in FOWLP applications, by comparing their predictions to those obtained from FEM simulations, which serve as a benchmark for assessing the validity of the predictions. The selection of 10 distinct sets of parameters ensures that a broad range of conditions and scenarios is represented, thereby allowing for a robust evaluation of the models' generalizability and performance across different configurations.
Table 5 provides an in-depth comparison between the FEM results and the corresponding predictions generated by five distinct machine learning models. These models were chosen for their widespread use and applicability in regression tasks, making them ideal candidates for evaluating their effectiveness in this particular domain. The models compared include SVR, RRF, GBR, KNN, and KRR. Each model was trained and tested on the selected dataset, and the results were evaluated based on the average deviation and standard deviation from the FEM results, which serve as the reference values for warpage predictions. The analysis reveals the following deviations for each machine learning model when compared to the FEM results: SVR exhibits an average deviation of 18.5% with a standard deviation of 15.4%, RF demonstrates a deviation of 6.2% with a standard deviation of 6.2%, GBR records a deviation of 21.6% with a standard deviation of 26.5%, KNN shows a deviation of 14.9% with a standard deviation of 19.8%, and KRR presents a deviation of 17.3% with a standard deviation of 16.4%. These values offer critical insights into the relative performance of each model, highlighting the strengths and limitations of different machine learning approaches when applied to warpage prediction tasks in FOWLP. The lower the deviation, the more closely the predictions of the model align with the FEM results, indicating higher accuracy and reliability. It is evident from the results that the RF model exhibits the smallest deviation from the FEM results, with an average deviation of 6.2%, and this deviation is notably lower in comparison to the other machine learning models included in the analysis. The relatively low standard deviation associated with the RF model also indicates a higher level of consistency across different test cases, further underscoring its reliability. This suggests that, among the models evaluated, the RF model demonstrates superior predictive capability and a higher level of accuracy in estimating warpage for FOWLP. The ensemble nature of the Random Forest algorithm, which aggregates the outputs of multiple decision trees, likely contributes to its robustness and ability to generalize across various parameter sets. The performance of this model highlights its suitability for regression tasks in this area, offering both accuracy and stability, making it a strong candidate for predictive applications in the field of FOWLP.
In contrast, Table 6 presents a similarly comprehensive comparison between the predictive results generated by various deep learning models and the corresponding FEM results. Unlike traditional machine learning models, deep learning models are particularly well-suited for handling complex, high-dimensional datasets and capturing non-linear relationships within the data. The deep learning models compared in this study include the RNN, GRU, MLPs, and LSTM. These models are known for their ability to model sequential data and learn complex patterns over time, which makes them ideal for this task, where warpage predictions depend on multiple interacting factors. A detailed analysis of the data reveals the average deviation and standard deviation for each deep learning model when compared to the FEM results. Specifically, the RNN model demonstrates a remarkably low deviation of 0.21% with a standard deviation of 0.23%, indicating a high level of accuracy and consistency in its predictions. The GRU model exhibits a deviation of 0.55% with a standard deviation of 0.56%, while the MLP model records a deviation of 0.60% with a standard deviation of 0.68%. The LSTM model, another popular variant of recurrent neural networks, shows a deviation of 0.34% with a standard deviation of 0.35%. The comparison clearly indicates that the predictions generated by all deep learning models significantly outperform those of the machine learning models, including the most accurate machine learning model, RF, in terms of both accuracy and precision. This stark contrast between the results highlights the superior capability of deep learning models to capture complex patterns, interactions, and relationships within the data, offering a level of predictive performance that traditional machine learning models cannot match.
The ability of deep learning models to process and learn from high-dimensional data without extensive feature engineering, combined with their capacity to model non-linear relationships, makes them particularly effective for tasks involving complex, multi-factorial phenomena such as warpage prediction in FOWLP. The substantial improvement in accuracy provided by the deep learning models is evident in the significant reduction in both the average deviation and the standard deviation across all models when compared to the FEM results. This improvement underscores the potential of deep learning models for more reliable and precise predictions in engineering applications, where accuracy is paramount for ensuring optimal performance and design integrity. The ability of deep learning models to consistently produce high-quality predictions across different parameter sets further reinforces their suitability for tasks involving complex systems and processes. Furthermore, within the set of deep learning models evaluated, the RNN model stands out as the top performer, demonstrating the smallest average deviation and standard deviation. This finding suggests that the RNN model not only produces predictions that are closest to the FEM results but also maintains a high level of consistency across different test cases, further solidifying its position as the most reliable model in this study. The ability of the RNN model to capture the sequential dependencies and interactions between different parameters likely contributes to its superior performance, making it an ideal candidate for warpage prediction in FOWLP applications. Consequently, based on these findings, this study concludes that the RNN deep learning model will be adopted as the core algorithm for the AI-based prediction platform. Its demonstrated ability to provide the most precise and consistent predictions, in comparison to both machine learning and other deep learning models, reinforces its suitability for integration into this predictive framework. The adoption of the RNN model is expected to enhance the reliability and effectiveness of the platform in future applications, offering more accurate and reliable warpage predictions, which are crucial for optimizing FOWLP designs and ensuring the success of advanced packaging technologies.
5.4. An AI Prediction Platform with a Graphical User Interface (GUI)
This study introduces a sophisticated AI prediction platform that operates via a uniform resource locator (URL) and features a comprehensive GUI, designed to streamline the user interaction process with complex AI models. The development of this platform addresses the growing need for accessible yet powerful AI-driven predictive tools, enabling users to engage with advanced machine learning algorithms in an intuitive and efficient manner. The entire framework of the platform, from its architectural design to its predictive functionality, was meticulously constructed using the Python programming language. The extensive library support, flexibility, and robust machine learning frameworks provided by Python make it the ideal choice for developing such a platform, allowing for the integration of complex models and ensuring high computational efficiency. The activation of this AI prediction platform through a URL necessitates the establishment of a reliable host server port, which acts as the gateway for communication between the user interface and the backend AI models. The server port plays a critical role in ensuring seamless data flow, allowing users to submit inputs and retrieve predictions without requiring direct access to the local machine hosting the models. However, to facilitate external network access to this host server port, it becomes imperative to configure a virtual server. The virtual server functions as an intermediary, connecting external users to the host server by providing a secure and stable channel for data transmission. Without this configuration, the platform would remain inaccessible to external networks, limiting its utility to local use only.
The process of configuring a virtual server introduces several key technical challenges that must be addressed to ensure the effectiveness of the platform. One of the primary concerns in this context is network security. Since the platform is accessible via the internet, robust security measures must be implemented to prevent unauthorized access, protect sensitive data, and safeguard the AI models from potential cyber threats. These security measures typically include the implementation of encrypted communication protocols such as HTTPS, advanced firewall configurations, and multi-layered user authentication systems. By integrating these security mechanisms, the platform is protected from malicious attacks, ensuring that only authorized users have access to its predictive capabilities. Beyond security considerations, the performance optimization of the virtual server is another crucial aspect of the design of the platform. The AI models incorporated into the system are computationally intensive, particularly when they process large datasets or perform sophisticated algorithmic operations. As such, the virtual server must be provisioned with adequate computational resources, including sufficient CPU power, memory allocation, and storage capacity, to ensure that the platform can handle high-volume requests and deliver rapid predictions. In addition, attention must be given to network latency and bandwidth management, as these factors directly affect the responsiveness of the platform. A high degree of optimization ensures that the platform provides real-time feedback and remains responsive even when accessed from remote locations or under heavy user loads.
Once the virtual server has been fully configured and integrated with the host server port, the AI prediction platform becomes operational, accessible through a simple URL. This web-based access eliminates the need for complex local installations or intricate technical setups, significantly reducing the barrier to entry for users who may not have extensive technical knowledge. The URL serves as the interface through which users can interact with the platform, launching the GUI that facilitates access to the underlying AI models. The GUI itself is designed to prioritize user experience, offering a streamlined and intuitive interface that allows for easy navigation through the various features and functions of the system. The GUI provides users with the capability to input data, adjust model parameters, and visualize results in a coherent and organized manner. This interface is not merely a superficial layer but plays an integral role in enhancing the ability of users to interact with the AI models effectively. The dynamic nature of the GUI allows users to modify input variables, immediately observe how these changes impact model predictions, and fine-tune parameters to better understand the underlying relationships captured by the AI models. Such interactivity promotes a deeper understanding of the AI decision-making process, facilitating more informed decision-making based on the model outputs. The visualization components embedded within the GUI are carefully designed to translate complex prediction data into easily interpretable formats, using charts, graphs, and other graphical tools to represent the model outputs.
From a technical standpoint, the process of developing this AI prediction platform involved multiple stages, each requiring significant attention to detail. Establishing the host server port was the initial step, providing the foundational infrastructure necessary for the communication between the user interface and the AI models. However, to make this infrastructure accessible externally, the creation of a virtual server was essential. This required configuring the virtual server to ensure that it could securely and efficiently handle the data requests being transmitted via the URL. In addition to setting up the server architecture, the development of the GUI was a critical component in ensuring the overall usability of the platform. The GUI was designed to abstract the complexity of the AI models, presenting the user with a clear, interactive environment that simplifies the predictive process while maintaining the computational rigor of the system. The entire system architecture reflects a balance between accessibility and complexity. The platform leverages the power of Python machine learning libraries to deliver sophisticated predictive capabilities, while the GUI ensures that these capabilities are presented in an accessible manner, allowing users of varying technical expertise to engage with the AI models effectively. This fusion of advanced machine learning technology with user-centric design underscores the utility of the platform as both a powerful predictive tool and an accessible application for practical use.
Figure 11 offers a detailed depiction of the workflow involved in establishing the GUI-based AI prediction platform that operates via a URL. It outlines the sequential steps required to set up the host server port, configure the virtual server, and ensure secure and efficient communication between the user interface and the backend AI models. The figure also highlights the interaction between the virtual server and external users, illustrating how the system facilitates real-time predictions and dynamic feedback through the GUI. This visual representation serves as an essential guide for understanding the technical infrastructure that supports the operation of the platform, providing additional insights into the underlying processes that enable its seamless functionality. By enabling web-based access to complex AI models, this platform represents a significant advancement in the field of predictive analytics, offering users the ability to harness the power of machine learning algorithms in a practical and efficient manner. The design of the platform, which integrates advanced security measures, computational optimization, and an intuitive GUI, ensures that it is both robust and user-friendly. This balance between technical complexity and ease of use makes the platform an ideal tool for a wide range of applications, from academic research to industrial use, providing a flexible solution for AI-driven predictive analysis.
The integration of a virtual server with the host server port allows for a scalable and secure platform that can accommodate multiple users and varying computational demands. This scalability ensures that the platform can grow in response to increased usage, maintaining its performance and reliability as it scales. Additionally, the focus on security protocols guarantees that the platform remains protected against unauthorized access and potential vulnerabilities, ensuring that it can be trusted for use in sensitive applications where data security is paramount. The development of this platform marks a step forward in making sophisticated AI technologies more accessible to users across different domains, democratizing access to predictive analytics tools.
Figure 12 provides a detailed illustration of the AI prediction platform, equipped with a GUI that operates through a URL-based system. This platform allows users to interact with complex AI-driven predictions in a streamlined and efficient manner. By entering specific dimensional parameters, users can initiate the predictive process by clicking the "predict" button, immediately receiving warpage values for the packaging structures under consideration. This instant feedback mechanism is designed to facilitate rapid and accurate decision-making, providing engineers and designers with a reliable tool to guide their structural designs. The platform thus serves as a valuable resource for optimizing design parameters and improving the overall performance of the packaging structures. By automating the predictive process, the platform reduces the manual workload typically associated with traditional modeling and simulation techniques, allowing users to obtain results in a fraction of the time.
The ability of the system to operate via a URL adds significant value by enabling remote access to the platform from any internet-connected device. This design feature ensures that users can benefit from the AI capabilities of the platform regardless of their physical location, thereby enhancing accessibility and user convenience. The platform is not only capable of delivering fast predictions but also ensures a high degree of accuracy, given its reliance on advanced AI algorithms that have been rigorously trained to model warpage behavior under various conditions. This capability offers a robust framework for practical applications in real-world scenarios, making it a critical tool for professionals who require precise predictions in their design workflows.
However, recognizing the limitations that may arise from network connectivity issues, the platform also includes a standalone version of the GUI-based AI prediction tool. For users whose computational environments lack reliable internet access, the offline version provides an equally powerful solution. The standalone version maintains the same core functionality and predictive accuracy as the URL-based system but is tailored for local use, ensuring uninterrupted operation without the need for external server connections. This adaptability is particularly important for users operating in restricted environments, such as laboratories or industrial settings where network access may be limited or unavailable. In the subsequent sections, an in-depth examination of the standalone version of the GUI-based AI prediction platform will be presented. This version retains all of the advanced features of the online platform, including its user-friendly interface and the precise predictive capabilities powered by machine learning algorithms. However, the standalone application has been optimized to run on local machines, providing users with a high-performance tool that does not rely on cloud infrastructure. By ensuring that the platform is fully functional in both online and offline modes, the system demonstrates its versatility and wide applicability across various fields, from academic research to industrial engineering. The flexibility offered by the platform makes it a critical asset for improving design efficiency and enhancing the predictive accuracy of packaging structure analyses, regardless of the working environment of the user.
The process of establishing the standalone version of the GUI-based AI prediction platform is notably simpler when compared to the method used for the URL-based platform. This streamlined approach involves embedding the GUI interface directly into the program code and subsequently converting it into an executable file (.exe). Once the executable file is generated, users can easily run the GUI-based AI prediction platform by merely clicking on the file, bypassing the need for external server configurations or network access. This localized approach ensures that the platform can function seamlessly on individual machines without requiring an internet connection, thus providing users with enhanced accessibility and convenience in environments where network connectivity might be unreliable or unavailable. When the platform is launched, users are greeted by a welcome message, which can be customized based on specific needs or user preferences, as depicted in Figure 13. This welcome message serves as an introductory screen, designed to enhance the user experience by offering initial guidance and clarifying any operational instructions. The main interface of the platform, as illustrated in Figure 14, maintains a clean and intuitive layout, allowing users to engage with the prediction model in a straightforward manner. The interface design follows the same operational logic as the URL-based version of the platform, ensuring consistency in the user experience across both versions.
Once the platform is fully opened, users are prompted to input dimensional parameters into the designated fields. These parameters, which are critical to determining the warpage behavior of the packaging structures, can be easily entered by the user. After the relevant values have been provided, the user simply clicks the “predict” button to initiate the AI-driven prediction process. The platform quickly processes the input data and delivers accurate warpage values, offering a comprehensive prediction of the structural behavior. This immediate feedback is crucial for design engineers, as it provides them with a quick and reliable tool for assessing potential design outcomes. The warpage prediction helps inform key design decisions, ensuring that packaging structures are optimized for both performance and durability. Furthermore, the operational simplicity of the standalone version of the platform enhances its utility in a wide range of applications. With no need for complex server setups or network configurations, users can deploy the platform in diverse working environments, from individual workstations in research labs to industrial settings where network access may be restricted. The standalone nature of the executable file also ensures that the platform is portable, enabling users to move it between different machines or share it with colleagues without the need for additional installations or configurations. The consistency between the standalone and URL-based versions of the platform ensures that users transitioning between the two will encounter a familiar interface and workflow. Both versions allow users to input dimensional parameters, initiate predictions with the click of a button, and receive real-time feedback on the warpage behavior of the packaging structures. This uniformity in operation promotes ease of use, as users are not required to learn new systems or interfaces when switching between the standalone and web-based platforms. The prediction results generated by both versions are equally accurate, thanks to the underlying AI models that power the platform, ensuring that the reliability and precision of the predictions remain unchanged regardless of the deployment method.
In essence, the standalone version of the GUI-based AI prediction platform offers a versatile and practical solution for users who require advanced predictive capabilities in environments where network connectivity may be limited or nonexistent. Its straightforward installation and operational process, combined with its powerful AI-driven prediction capabilities, make it an essential tool for design engineers and researchers alike. By providing quick and reliable warpage predictions, the platform supports informed decision-making and contributes to the overall efficiency and effectiveness of the design process. Through the localized execution of the platform, users gain access to a robust predictive tool without the need for complex setups, making it an invaluable resource for professionals working in a variety of fields. The ability of the platform to deliver consistent results across both standalone and URL-based versions ensures that it remains a highly flexible solution, capable of adapting to the specific needs and constraints of different working environments. In this way, the standalone GUI-based AI prediction platform significantly enhances the accessibility and utility of advanced AI technologies in the design and analysis of packaging structures.
6. Conclusions
In this study, the development of a GUI-driven AI prediction platform for FOWLP warpage behavior prediction has been comprehensively explored. This platform integrates FEA with advanced AI techniques to provide highly accurate, real-time predictions of thermal stress-induced warpage in FOWLP structures. By incorporating both URL-based and standalone versions, the system offers flexibility and accessibility to engineers, allowing them to interact with complex predictive models without requiring extensive programming knowledge. One of the major innovations of this platform is the seamless user interface, which allows users to input critical design parameters such as the die-to-package area ratio, die thickness, and the properties of the EMC into the AI model. This feature effectively simplifies the traditionally complex process of packaging design and simulation, making advanced modeling techniques more accessible to a broader range of users, particularly those without specialized expertise in these areas.
A key strength of the system lies in its ability to generate real-time, high-precision warpage predictions. This capability allows designers to rapidly evaluate different design variations, significantly reducing the need for time-consuming experimental methods. It also offers an efficient alternative to traditional FEA-based approaches, which can be computationally intensive and slow. The AI prediction tool integrates a wide range of machine learning models such as GBR, SVR, KNN, KRR, and RF. In addition to these machine learning approaches, it employs deep learning models including RNN, GRU, MLP, and LSTM networks. These models have been rigorously trained using FEA-generated data to ensure they achieve high levels of predictive accuracy and reliability in practical applications.
The comparison of the predictive performance of these models reveals that deep learning techniques, particularly the RNN, significantly outperform traditional machine learning models in terms of both accuracy and consistency. As demonstrated in Table 6, the RNN model exhibits the smallest deviation from the FEA results, with an average deviation of only 0.21% ± 0.23%. This marked improvement in accuracy makes the RNN model the most effective option for predicting warpage behavior in FOWLP structures. Given these results, the RNN model has been selected as the core algorithm for the AI prediction platform, ensuring that users benefit from the highest level of precision in real-time warpage predictions.
The integration of the high-performing RNN model into the GUI-driven platform provides engineers with a powerful, user-friendly tool for optimizing electronic packaging designs more effectively. This AI-based approach minimizes the risks associated with thermal warpage, which can lead to performance degradation or failure in next-generation electronic devices. By enabling real-time feedback and a streamlined simulation process, the platform enhances design workflows, allowing engineers to test multiple configurations and make data-driven decisions quickly. This represents a significant advancement in the field of electronic packaging, supporting the development of smaller, more reliable, and efficient packaging solutions for cutting-edge technologies.
Author Contributions
Conceptualization, Ching-Feng Yu; methodology, Ching-Feng Yu; software, Ching-Feng Yu; validation, Ching-Feng Yu and Jr-Wei Peng; formal analysis, Ching-Feng Yu; investigation, Ching-Feng Yu; resources, Chih-Cheng Hsiao, Chin-Hung Wang and Wei-Chung Lo; data curation, Ching-Feng Yu; writing—original draft preparation, Ching-Feng Yu; writing—review and editing, Ching-Feng Yu; visualization, Ching-Feng Yu; supervision, Ching-Feng Yu; project administration, Chih-Cheng Hsiao, Chin-Hung Wang and Wei-Chung Lo; funding acquisition, Chih-Cheng Hsiao, Chin-Hung Wang and Wei-Chung Lo. All authors have read and agreed to the published version of the manuscript.
Funding
This research received no external funding.
Data Availability Statement
Data sharing is not applicable
Conflicts of Interest
The authors declare no conflict of interest.
References
- Waldrop, M.M. The chips are down for Moore’s law. Nature 2016, 530, 144–147. [Google Scholar] [CrossRef]
- Lau, J.H. Recent advances and trends in advanced packaging. IEEE Trans. Compon. Packag. Manuf. Technol. 2022, 12, 228–252. [Google Scholar] [CrossRef]
- Huang, Y.W.; Chiang, K.N. Study of shear locking effect on 3D solder joint reliability analysis. J. Mech. 2022, 38, 176–184. [Google Scholar] [CrossRef]
- Zhao, J.; Chen, Z.; Qin, F.; Yu, D. Thermo-mechanical reliability study of through glass vias in 3D interconnection. Micromachines 2022, 13, 1799. [Google Scholar] [CrossRef] [PubMed]
- Liu, W.W.; Weng, B.; Li, J.; Yeh, C.K. FCCSP IMC growth under reliability stress following automotive standards. J. Microelectron. Electron. Packag. 2019, 16, 21–27. [Google Scholar]
- Yu, C.F.; Huang, Y.W.; Ouyang, T.Y.; Cheng, S.F.; Chang, H.H.; Hsiao, C.C. Suppression strategy for process-induced warpage of novel fan-out wafer level packaging. Microelectron. Reliab. 2022, 136, 114683. [Google Scholar] [CrossRef]
- Chen, C.; Su, M.; Ma, R.; Zhou, Y.; Li, J.; Cao, L. Investigation of warpage for multi-die fan-out wafer-level packaging process. Materials 2022, 15, 1683. [Google Scholar] [CrossRef]
- Van Dijk, M.; Huber, S.; Stegmaier, A.; Walter, H.; Wittler, O.; Schneider-Ramelow, M. Experimental and simulative study of warpage behavior for fan-out wafer-level packaging. Microelectron. Reliab. 2022, 135, 114585. [Google Scholar] [CrossRef]
- Cheng, H.C.; Wu, Z.-D.; Liu, Y.C. Viscoelastic warpage modeling of fan-out wafer-level packaging during wafer-level mold cure process. IEEE Trans. Compon. Packag. Manuf. Technol. 2020, 10, 1240–1250. [Google Scholar] [CrossRef]
- Lin, P.Y.; Lee, S. Warpage modeling of ultra-thin packages based on chemical shrinkage and cure-dependent viscoelasticity of molded underfill. IEEE Trans. Device Mater. Reliab. 2020, 20, 67–73. [Google Scholar] [CrossRef]
- Kavitha S; Varuna S; Ramya R. A comparative analysis on linear regression and support vector regression. 2016 Online International Conference on Green Engineering and Technologies (IC-GET), Coimbatore, 2016, pp. 1-5.
- Law, R.C.; Cheang, R.; Tan, Y.W.; Azid, I.-A. Thermal performance prediction of QFN packages using artificial neural network (ANN). In Proceedings of the Thirty-First IEEE/CPMT International Electronics Manufacturing Technology Symposium, Petaling Jaya, Malaysia, 8–10 November 2006; pp. 50–54. [Google Scholar]
- Acharya, P.V.; Lokanathan, M.; Ouroua, A.; Hebner, R.; Strank, S.; Bahadur, V. Machine learning-based predictions of benefits of high thermal conductivity encapsulation materials for power electronics packaging. J. Electron. Packag. ASME Trans. 2021, 143, 041109. [Google Scholar] [CrossRef]
- Subbarayan, G.; Li, Y.; Mahajan, R.L. Reliability simulations for solder joints using stochastic finite element and artificial neural network models. J. Electron. Packag. 1996, 118, 148–156. [Google Scholar] [CrossRef]
- Yuan, C.; Fan, X.; Zhang, G. Solder joint reliability risk estimation by AI-assisted simulation framework with genetic algorithm to optimize the initial parameters for AI models. Materials 2021, 14, 4835. [Google Scholar] [CrossRef] [PubMed]
- Hsiao, H.Y.; Chiang, K.N. AI-assisted reliability life prediction model for wafer-level packaging using the random forest method. J. Mech. 2021, 37, 28–36. [Google Scholar] [CrossRef]
- Praveena, M.; Jaiganesh, V. A literature review on supervised machine learning algorithms and boosting process. Int. J. Comput. Appl. 2017, 169, 32–35. [Google Scholar] [CrossRef]
- Ghawi, R.; Pfeffer, J. Efficient hyperparameter tuning with grid search for text categorization using KNN approach with BM25 similarity. Open Comput. Sci. 2019, 9, 160–180. [Google Scholar] [CrossRef]
- Panigrahy, S.K.; Chiang, K.N. Study on an artificial intelligence-based kernel ridge regression algorithm for wafer-level package reliability prediction. In Proceedings of the IEEE 71st Electronic Components and Technology Conference (ECTC), San Diego, CA, USA, 1 June–4 July 2021; pp. 1435–1441. [Google Scholar]
- Yin, C.; Zhu, Y.; Fei, J.; He, X. A deep learning approach for intrusion detection using recurrent neural networks. IEEE Access 2017, 5, 21954–21961. [Google Scholar] [CrossRef]
- Chen, J.; Jing, H.; Yuan, C.; Liu, Q. Gated recurrent unit-based recurrent neural network for remaining useful life prediction of nonlinear deterioration process. Reliab. Eng. Syst. Saf. 2019, 185, 372–382. [Google Scholar] [CrossRef]
- Tang, J.; Deng, C.; Huang, G.-B. Extreme learning machine for multilayer perceptron. IEEE Trans. Neural Netw. Learn. Syst. 2016, 27, 809–821. [Google Scholar] [CrossRef]
- Tsiouris, K.M.; Pezoulas, V.C.; Zervakis, M.; Konitsiotis, S.; Koutsouris, D.D.; Fotiadis, D.I. A long short-term memory deep learning network for the prediction of epileptic seizures using EEG signals. Comput. Biol. Med. 2018, 99, 24–37. [Google Scholar] [CrossRef]
- Ghosh, S.; Ekbal, A.; Bhattacharyya, P. Natural language processing and sentiment analysis: Perspectives from computational intelligence. Comput. Intell. Appl. Text Sentiment Data Anal. 2023, 17–47. [Google Scholar]
- Panigrahy, S.K.; Tseng, Y.C.; Lai, B.R.; Chiang, K.N. An overview of AI-assisted design-on-simulation technology for reliability life prediction of advanced packaging. Materials 2021, 14, 5342. [Google Scholar] [CrossRef]
- Kuo, H.C.; Chang, C.Y.; Yuan, C.A.; Chiang, K.N. Wafer-level packaging solder joint reliability lifecycle prediction using SVR-based machine learning algorithm. J. Mech. 2023, 39, 183–190. [Google Scholar] [CrossRef]
- Cheng, H.C.; Ma, C.L.; Liu, Y.L. Development of ANN-based warpage prediction model for FCCSP via subdomain sampling and Taguchi hyperparameter optimization. Micromachines 2023, 14, 1325. [Google Scholar] [CrossRef] [PubMed]
- Cheng, H.C.; Tai, L.C.; Liu, Y.C. Theoretical and experimental investigation of warpage evolution of flip chip package during fabrication. Materials 2021, 14, 4816. [Google Scholar] [CrossRef]
- Cheng, H.C.; Wu, Z.D.; Liu, Y.C. Viscoelastic warpage modeling of fan-out wafer-level packaging during wafer-level mold cure process. IEEE Trans. Compon. Packag. Manuf. Technol. 2020, 10, 1240–1250. [Google Scholar] [CrossRef]
- Czyzewski, J.; Rybak, A.; Gaska, K.; Sekula, R.; Kapusta, C. Modelling of effective thermal conductivity of composites filled with core-shell fillers. Materials 2020, 13, 5480. [Google Scholar] [CrossRef]
- Cheng, H.C.; Li, R.S.; Lin, S.C. ; Chen,W.H.; Chiang, K.N. Macroscopic mechanical constitutive characterization of through-silicon- via-based 3-D integration. IEEE Trans. Compon. Packag. Manuf. Technol. 2016, 6, 432–446. [Google Scholar] [CrossRef]
Figure 1.
The FOWLP assembly.

Figure 2.
3D FEA model of the FOWLP.
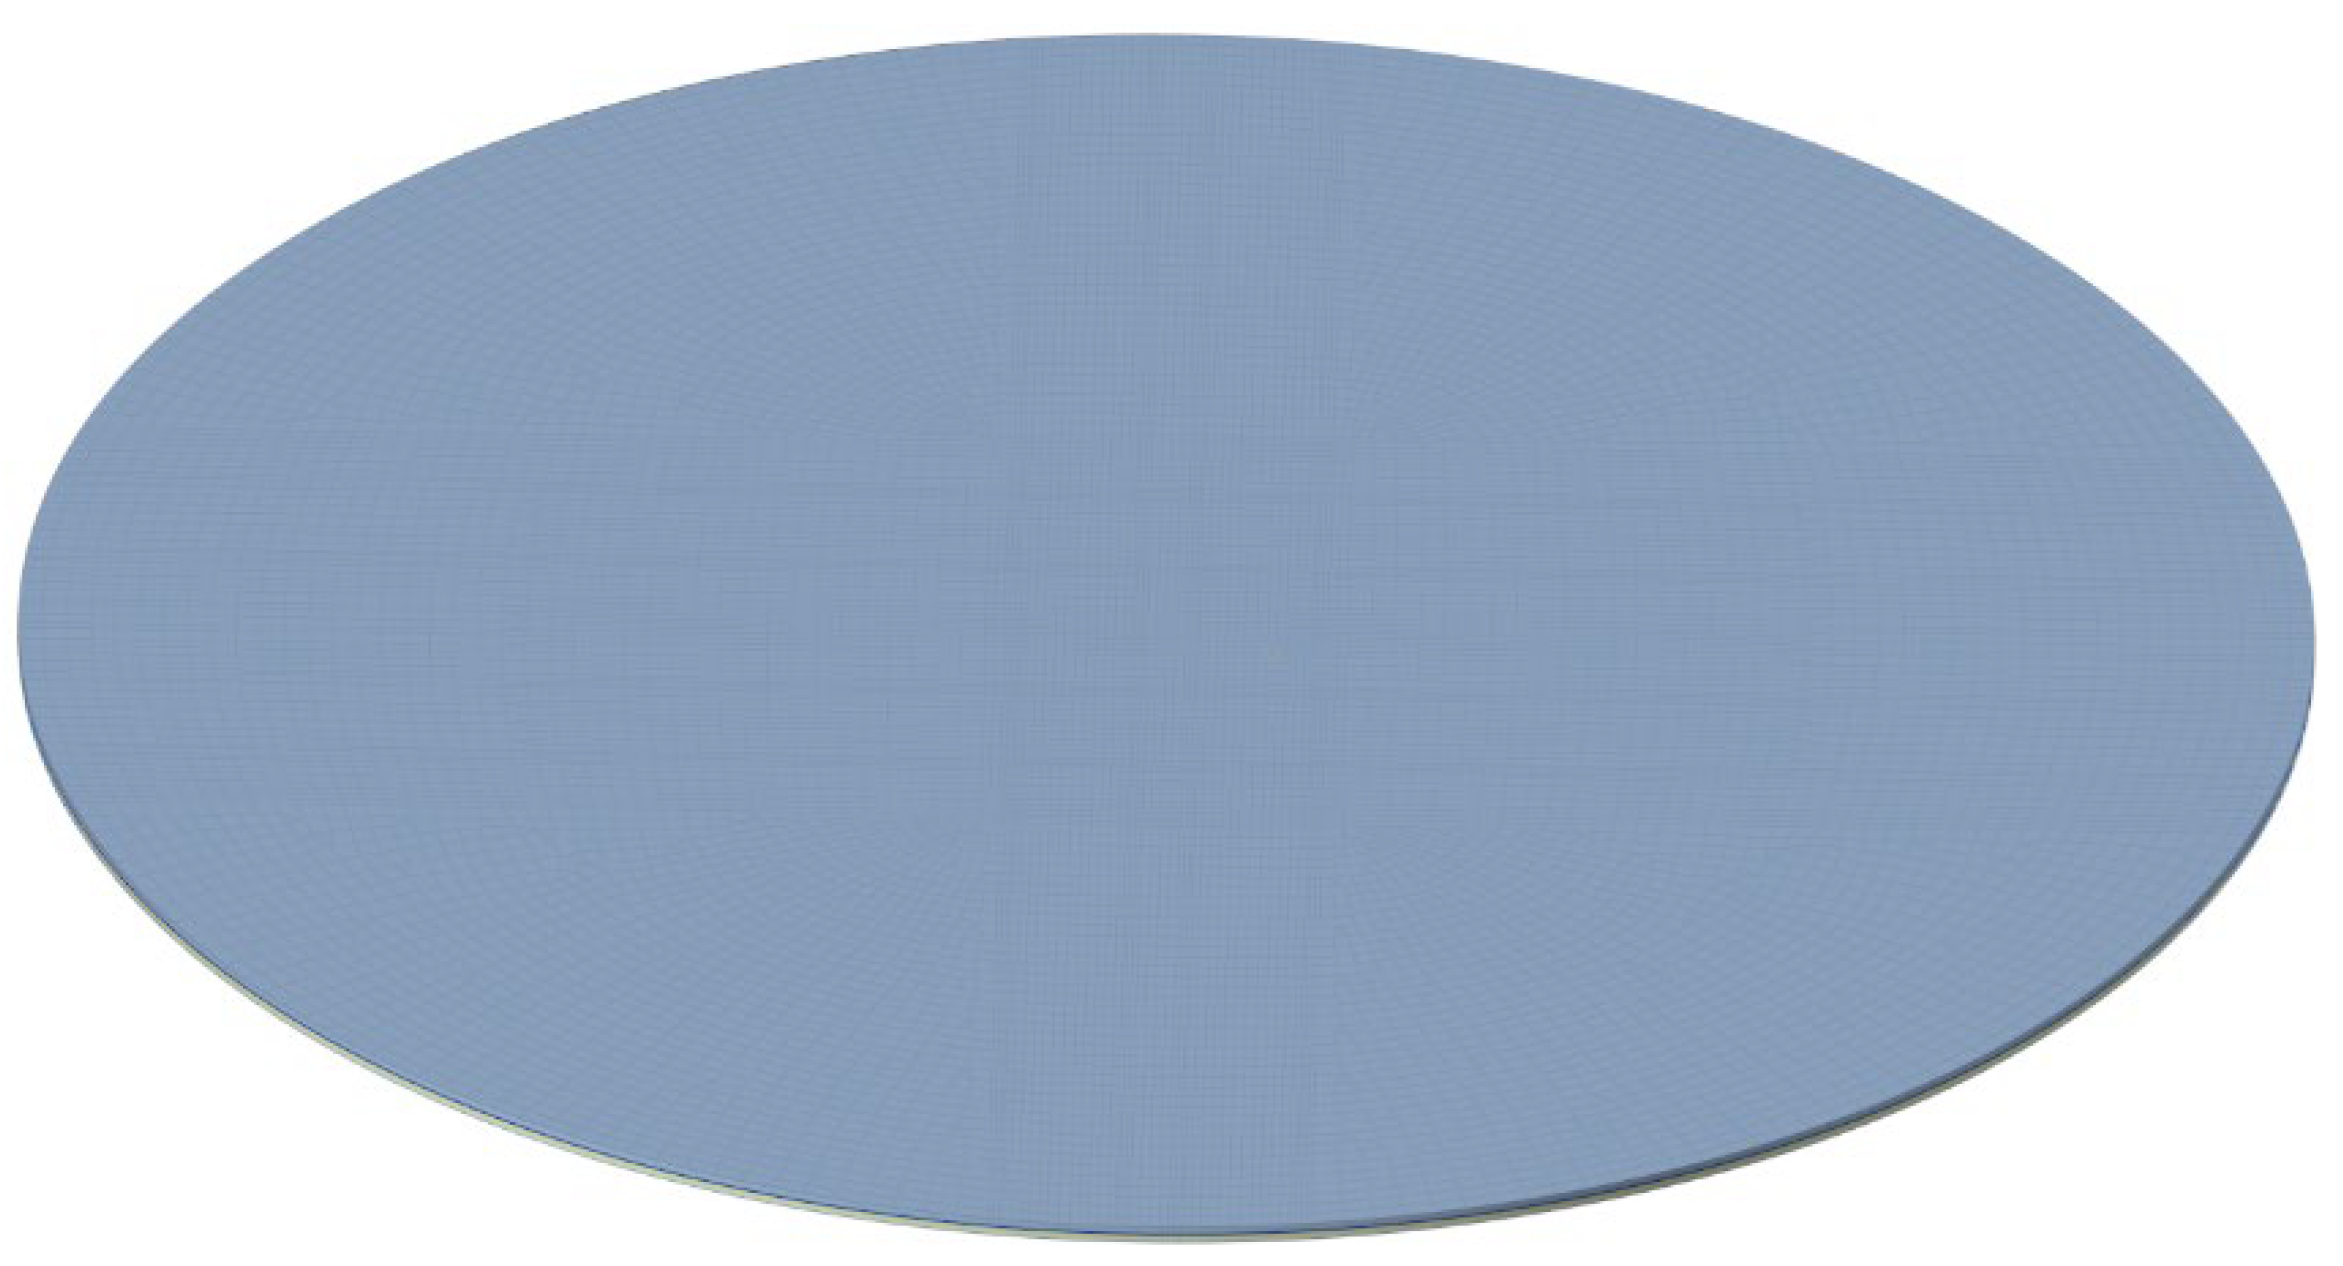
Figure 3.
The detail FEA model of the FOWLP.
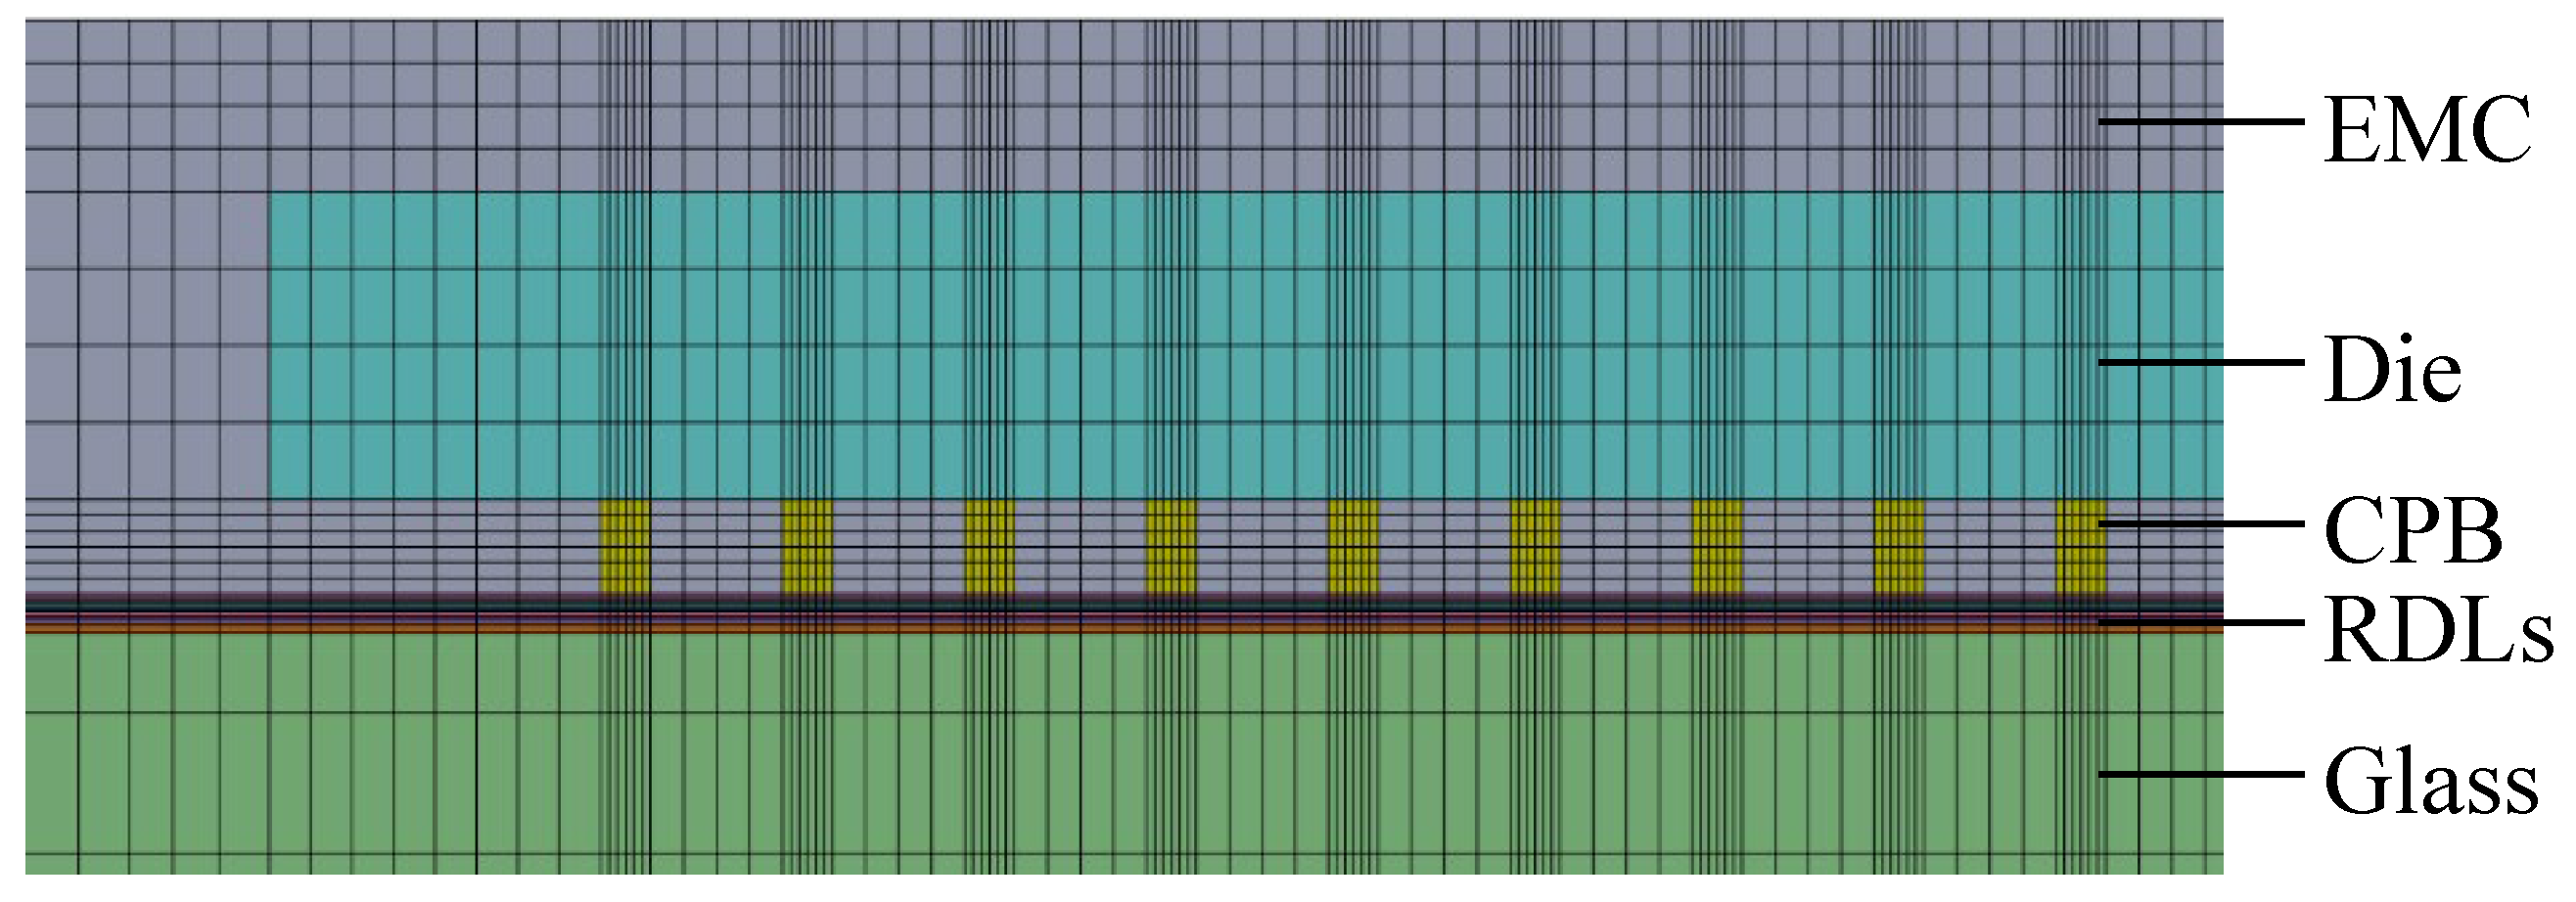
Figure 4.
Thermal-mechanical properties of SAC 305.
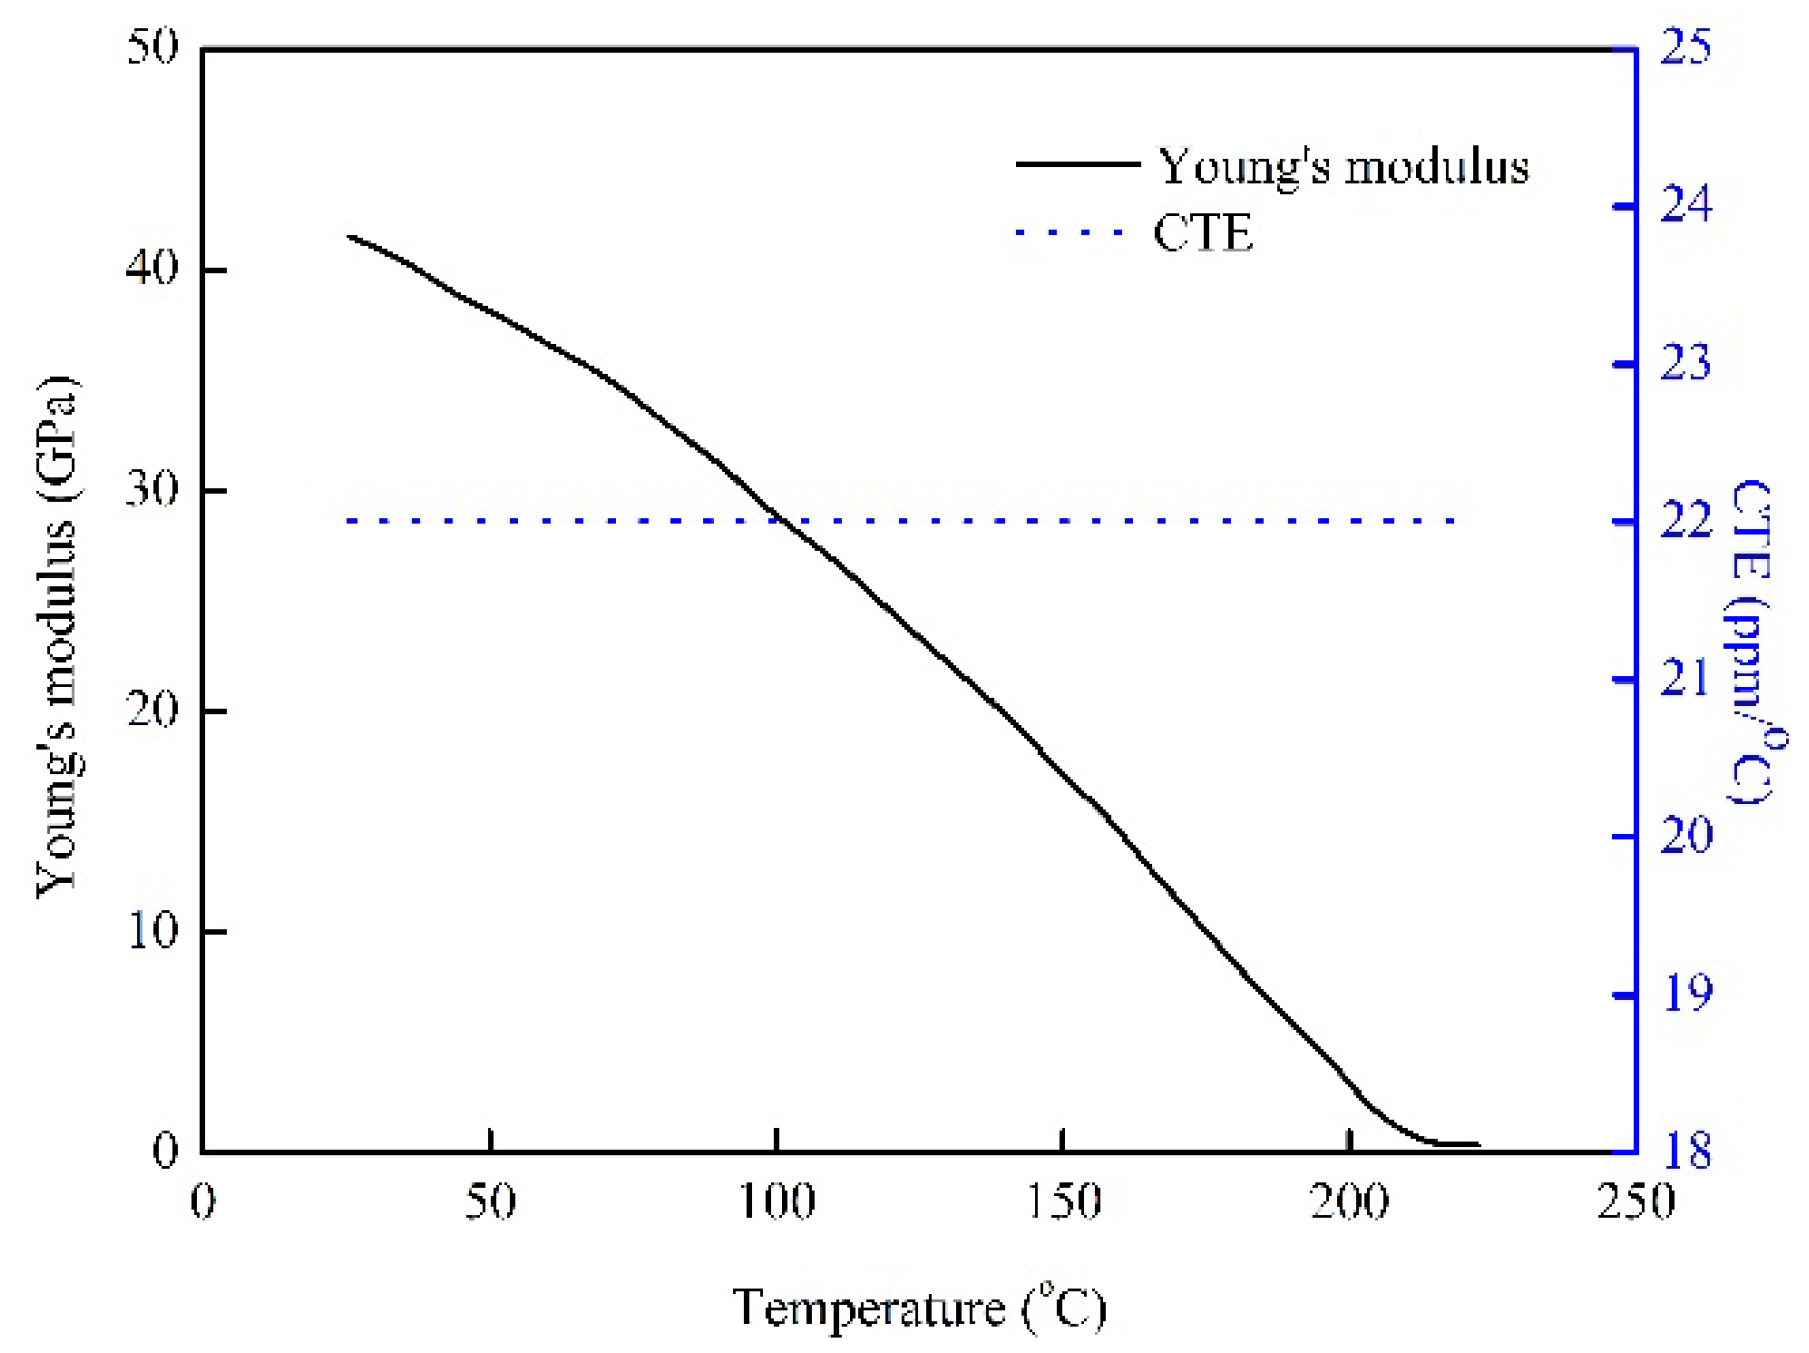
Figure 5.
Established reference master curve of relaxation modulus and its Prony series curve.
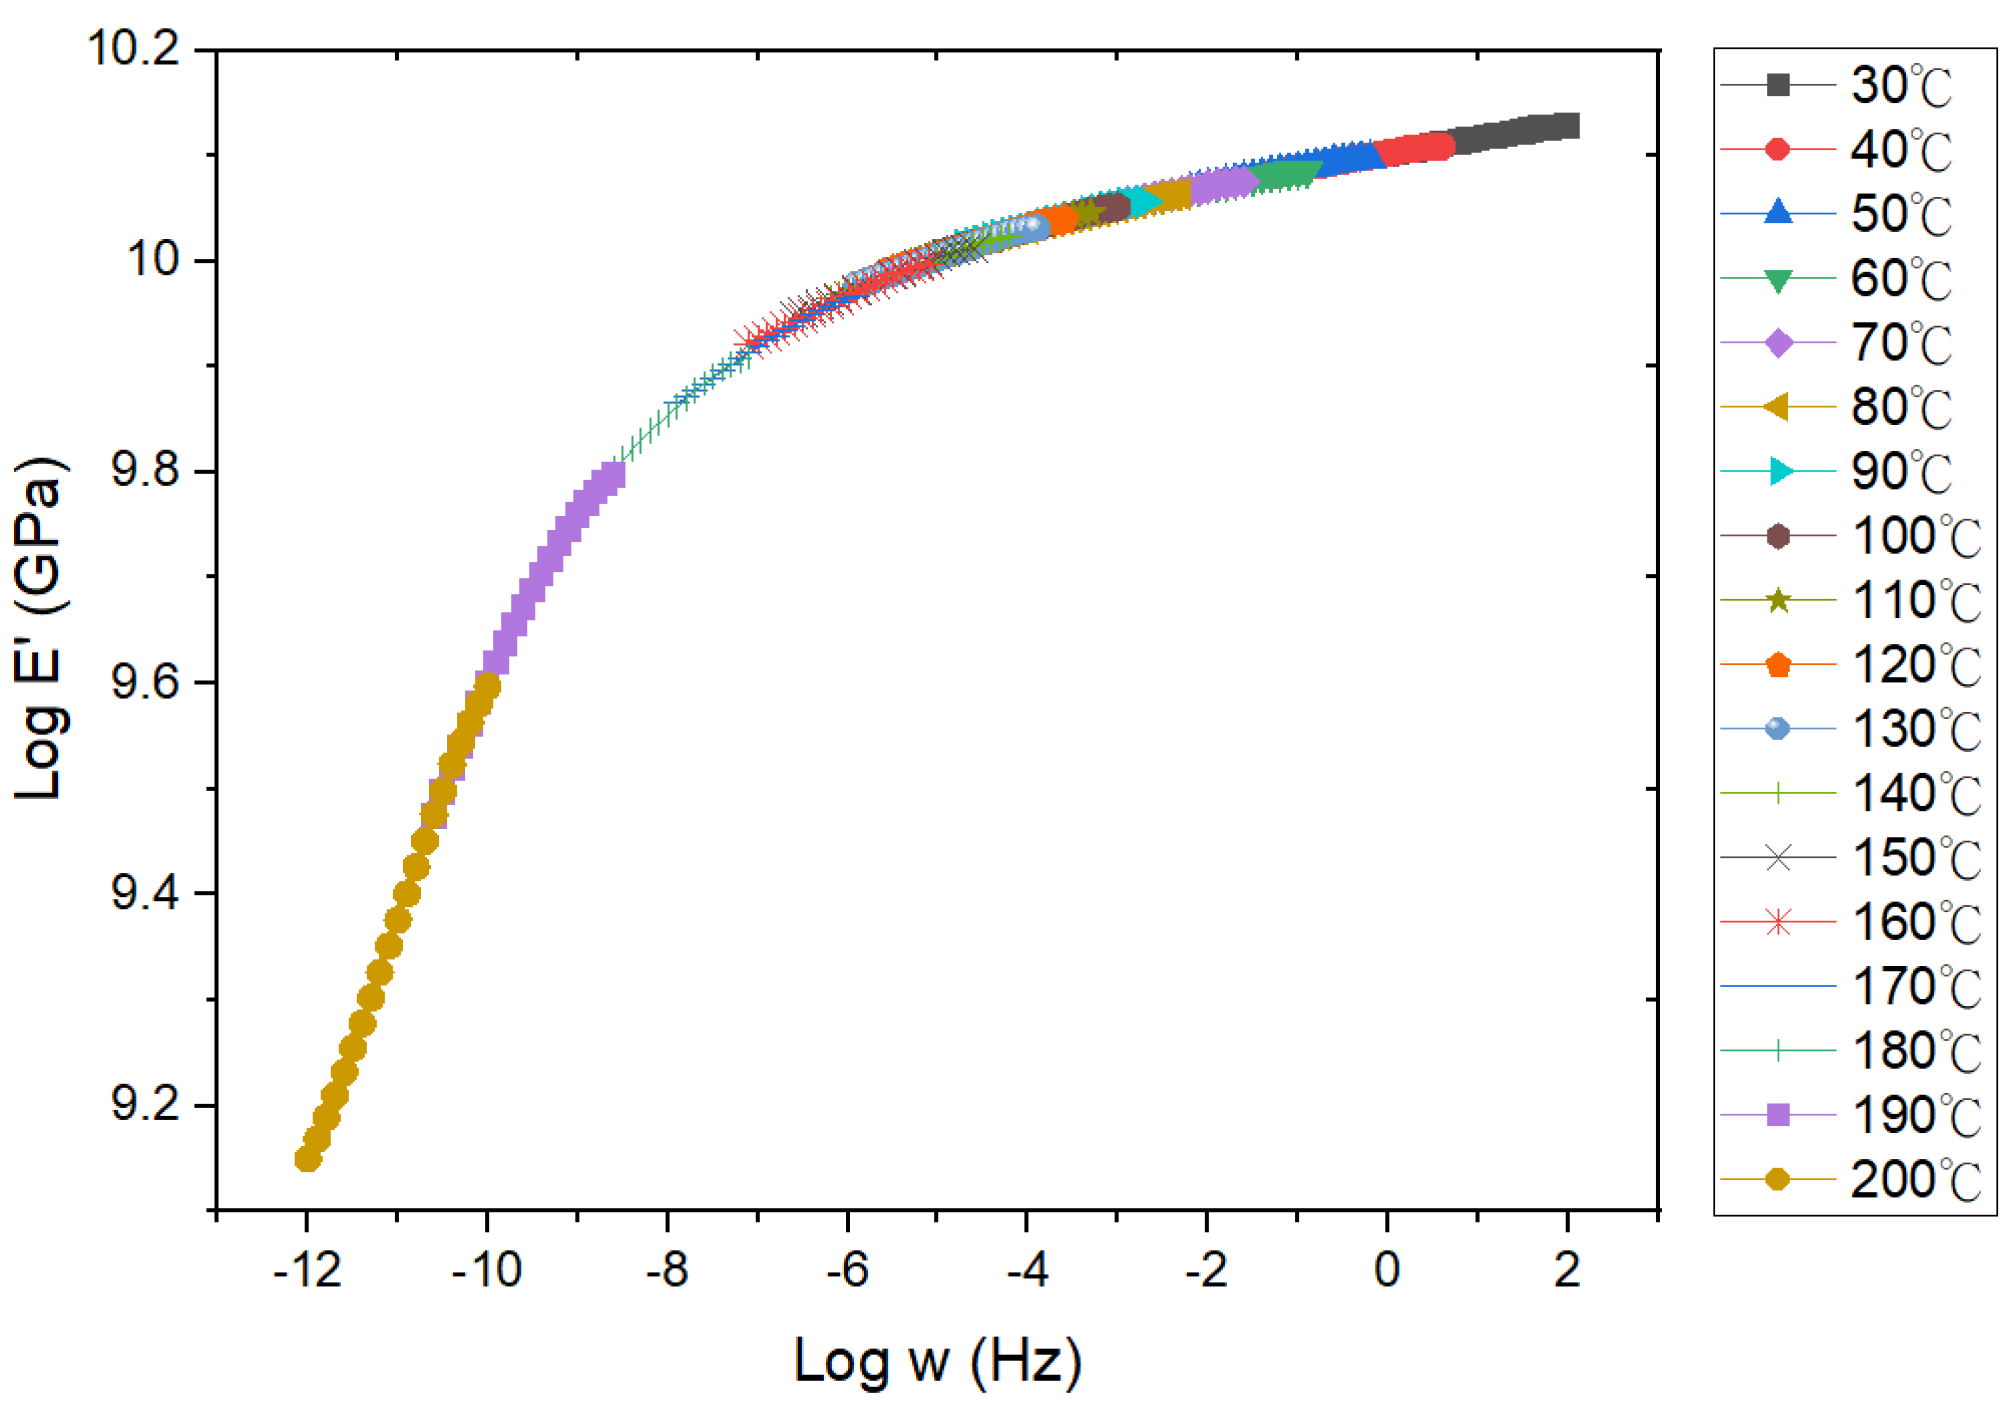
Figure 6.
Shift factor (aT) and fitted result with the WLF equation.
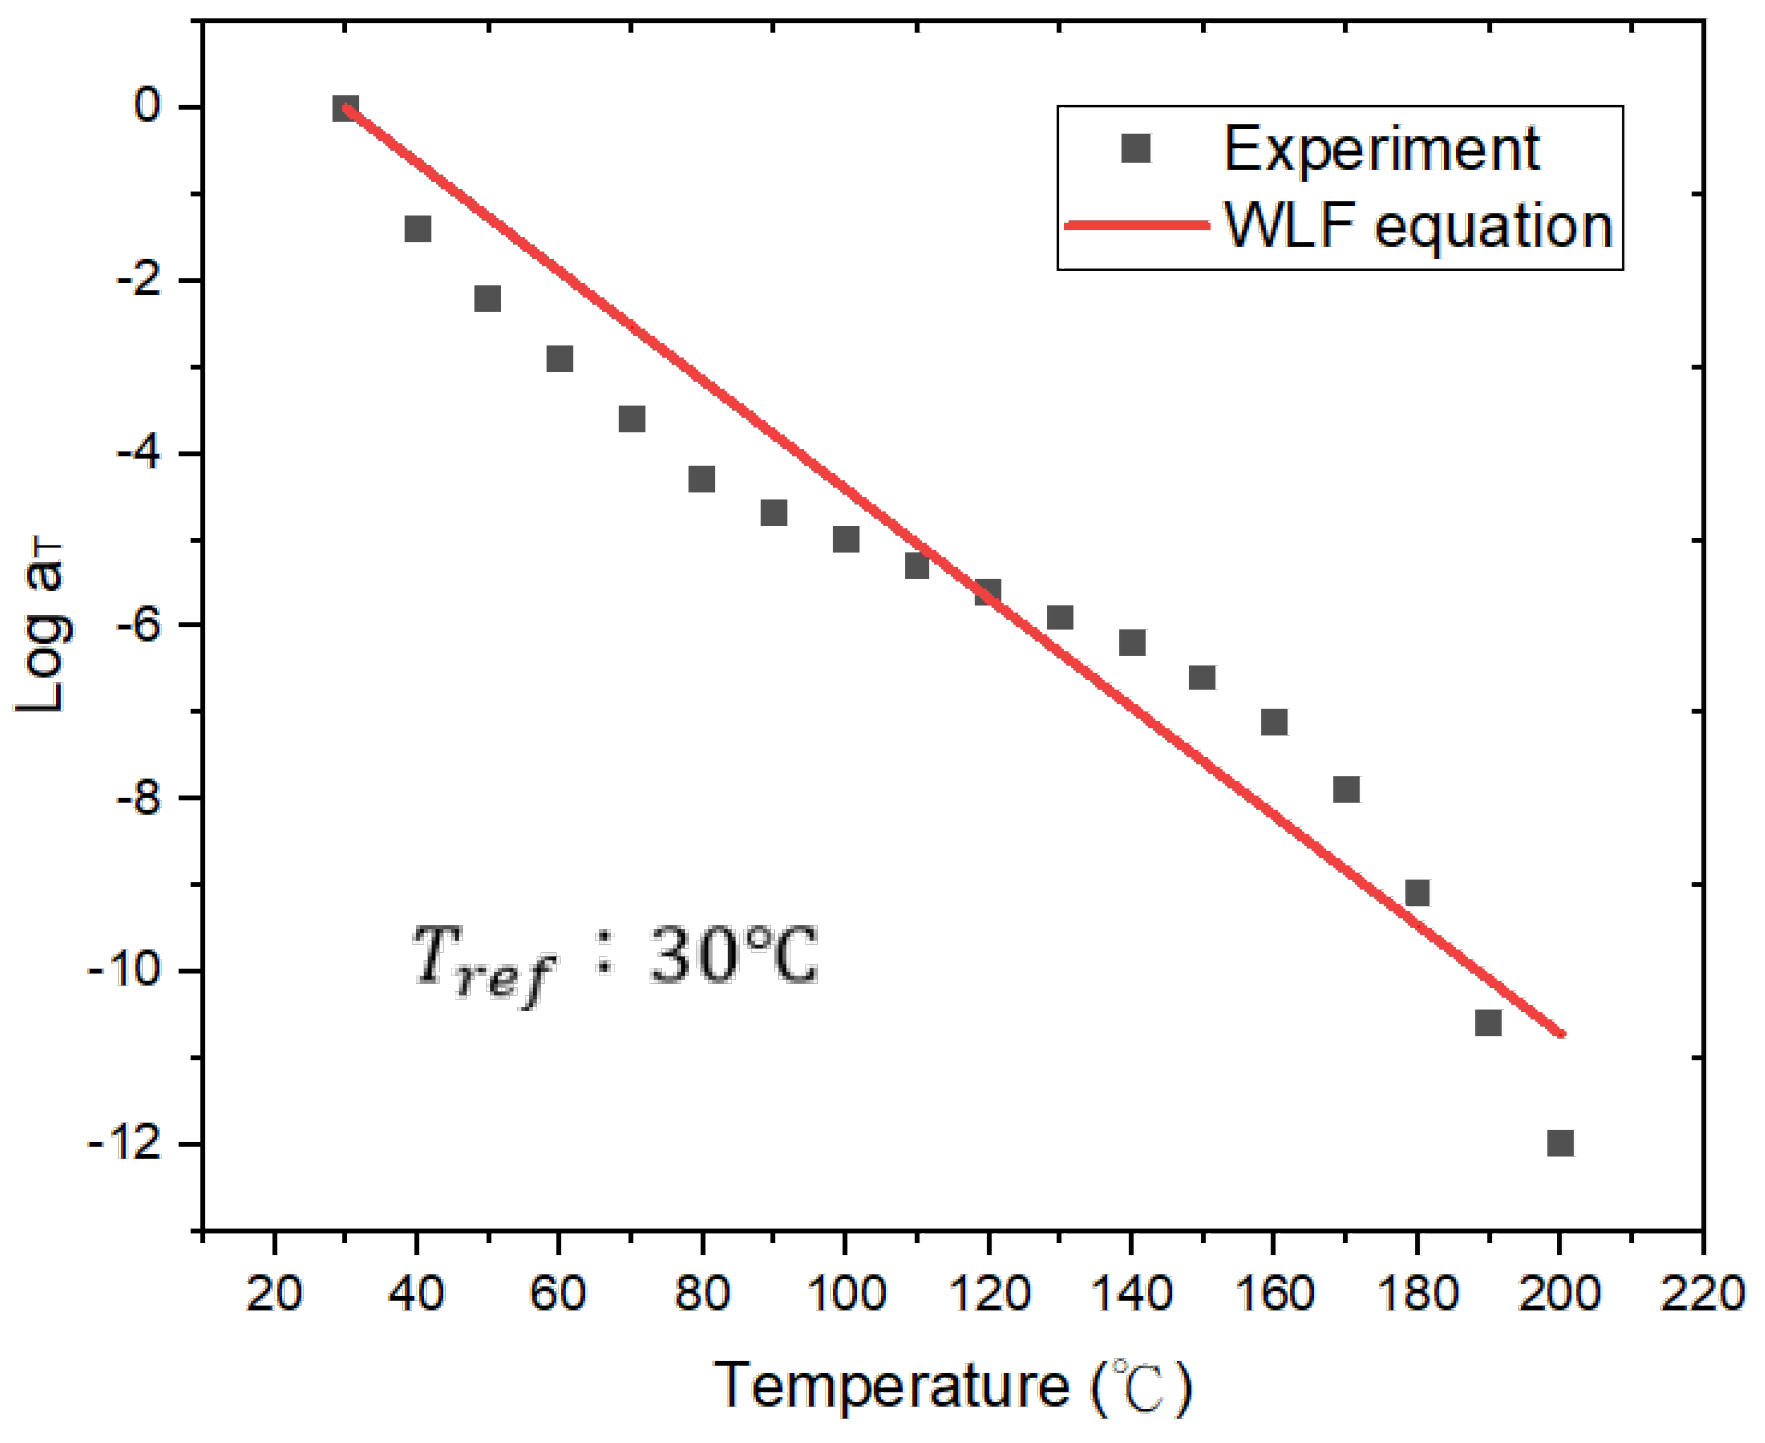
Figure 7.
Schematic of the equivalent RDL layer.
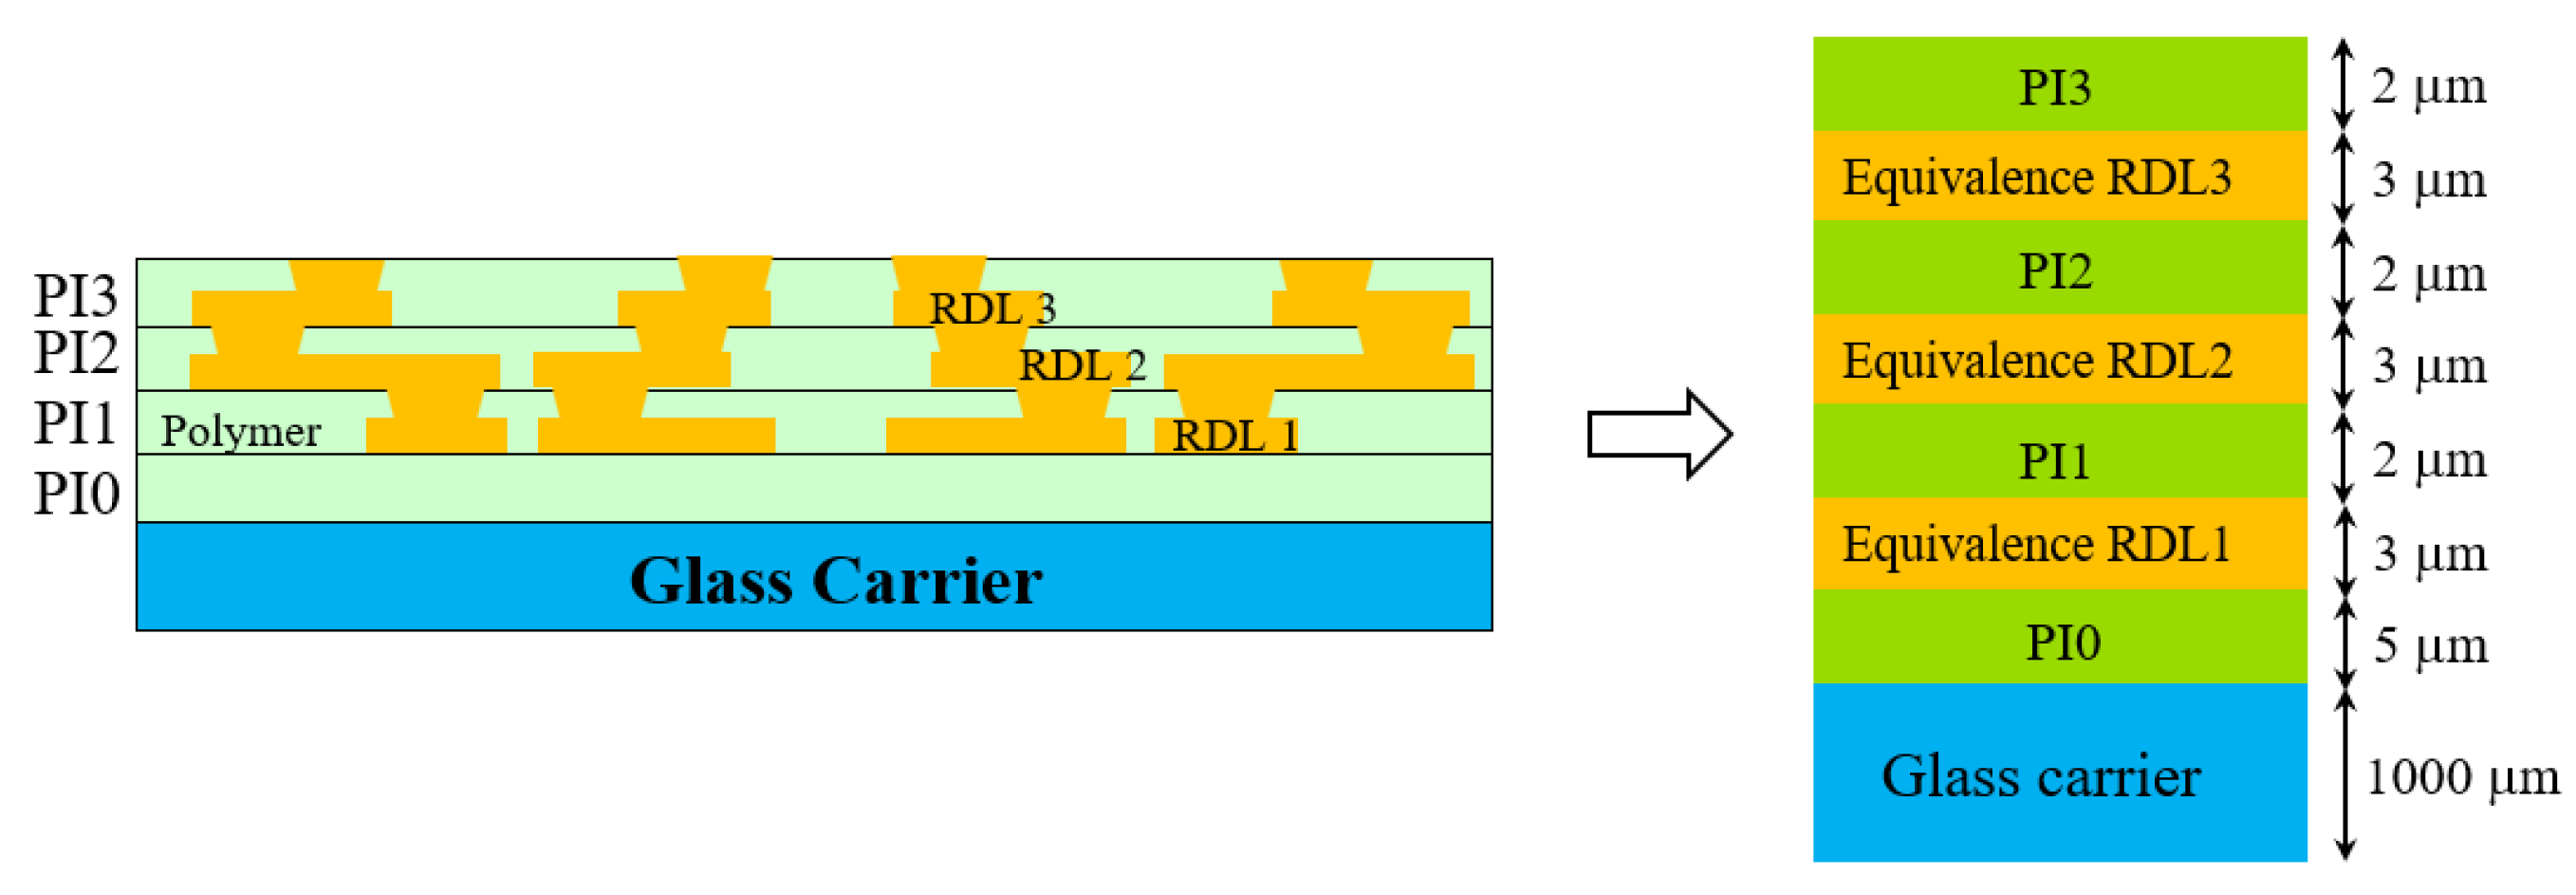
Figure 8.
The model for the estimation of equivalent material properties.
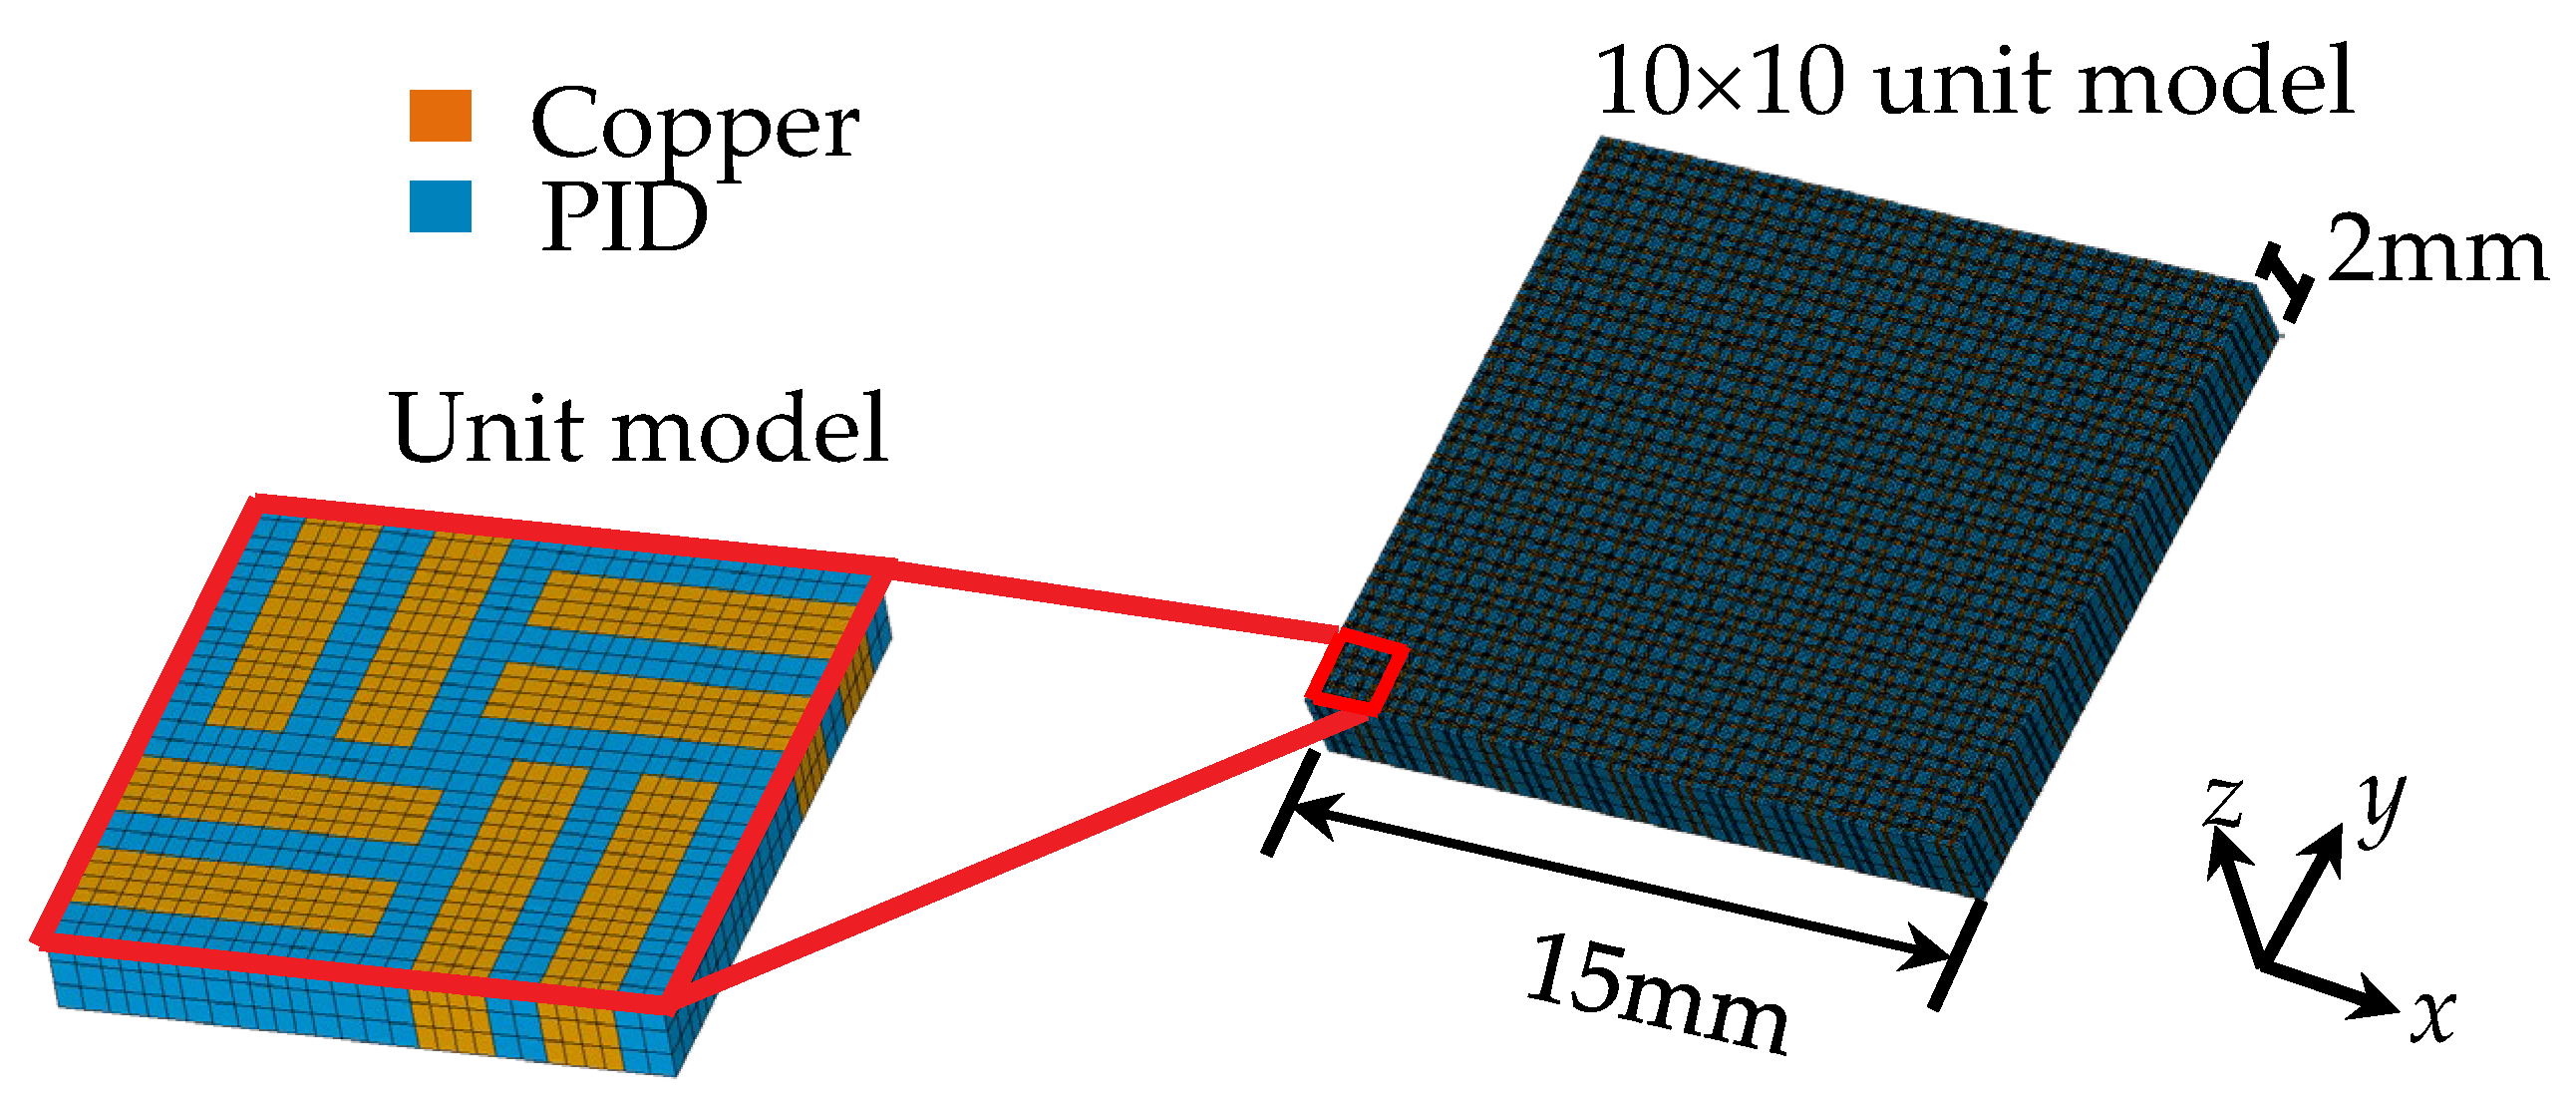
Figure 9.
The (a) measured and (b) simulated warpage contour plots.
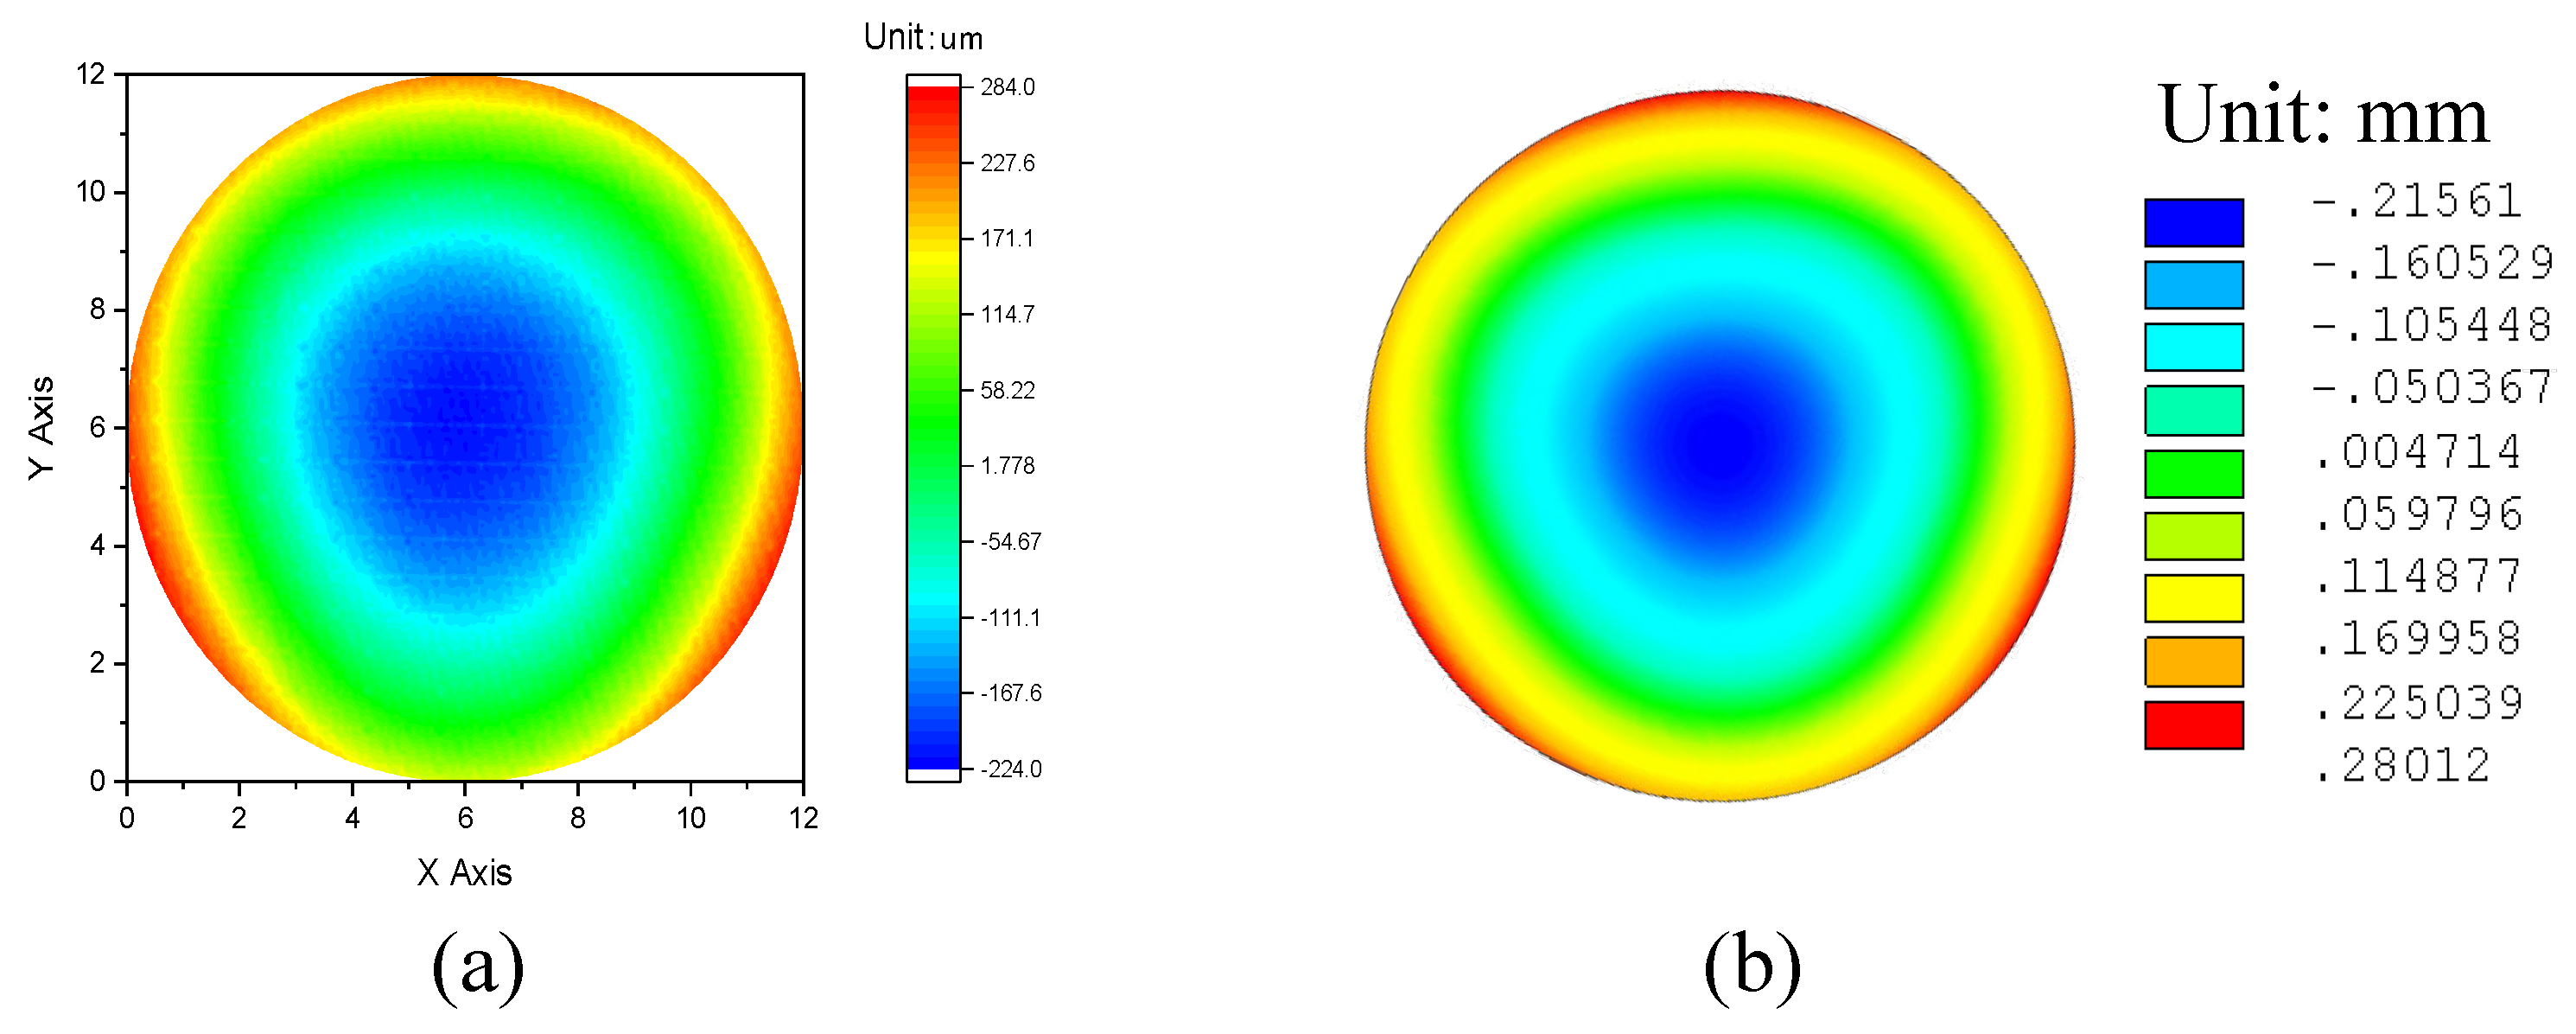
Figure 10.
Specifications of the die thickness and EMC thickness.
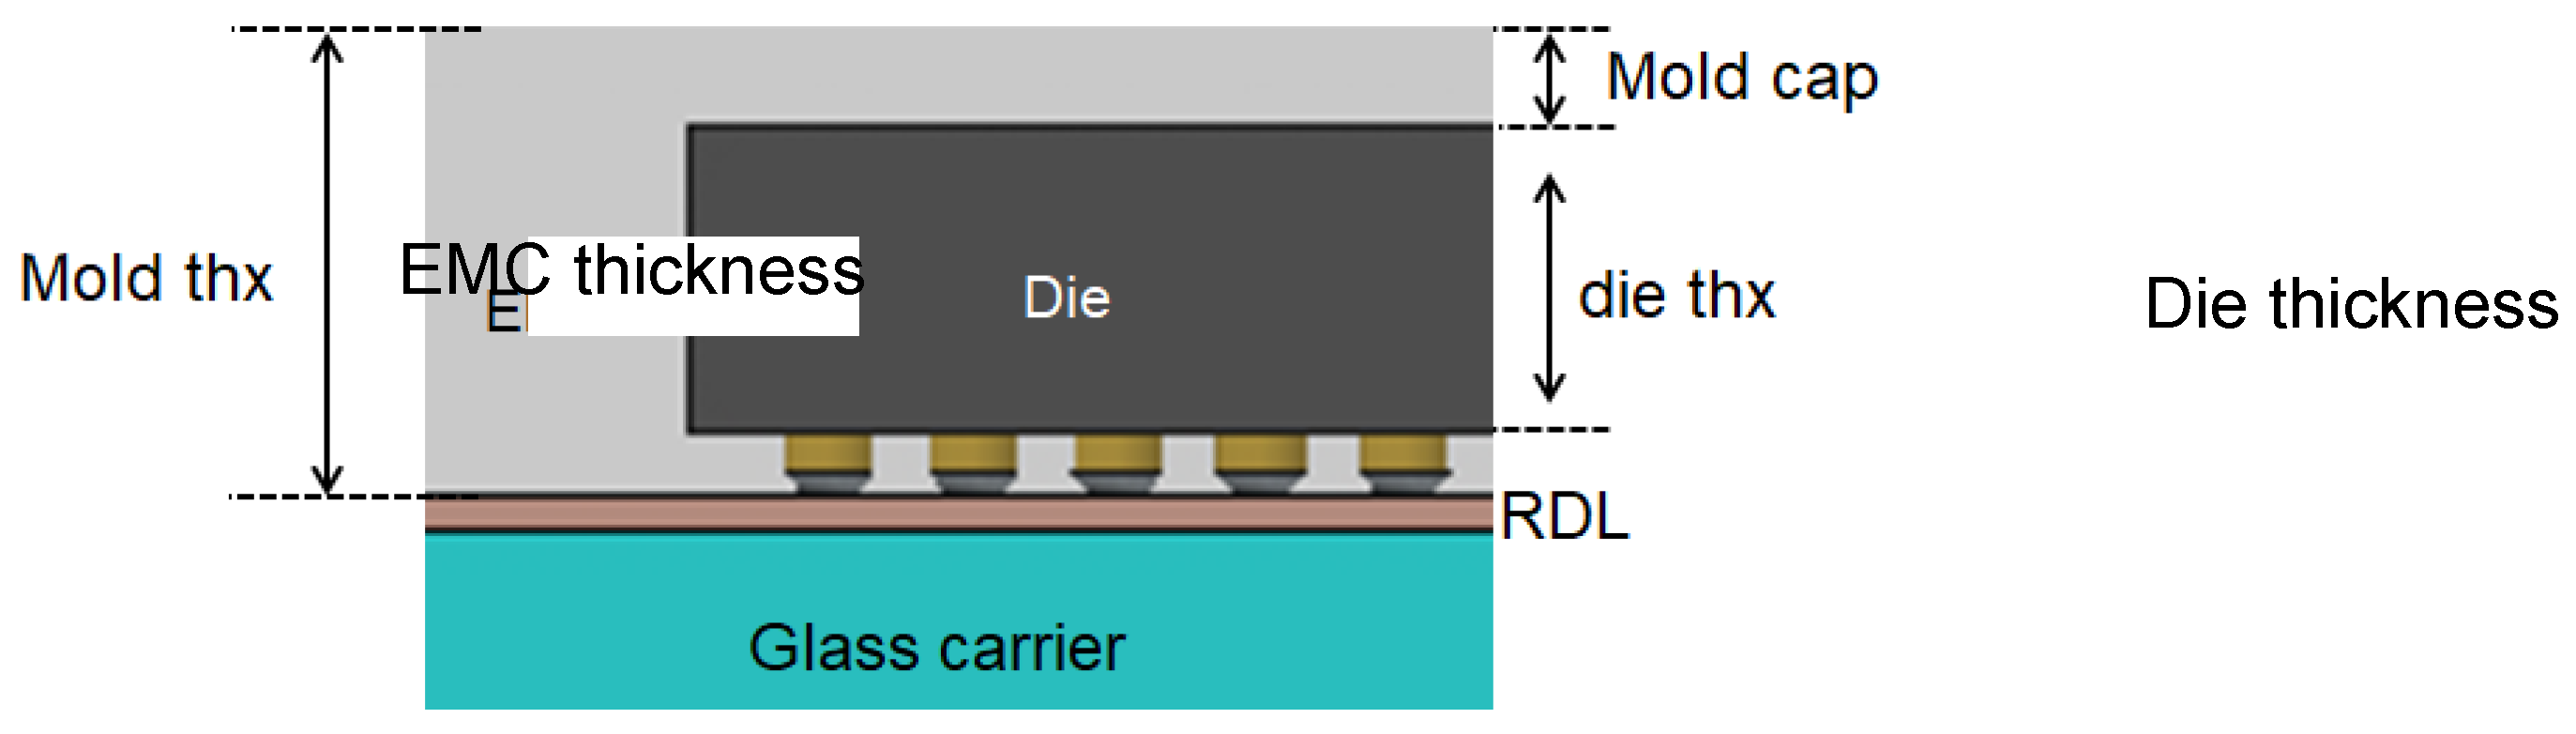
Figure 11.
The process of constructing a GUI-based AI prediction platform that operates through a URL involves several technical stages.
Figure 11.
The process of constructing a GUI-based AI prediction platform that operates through a URL involves several technical stages.
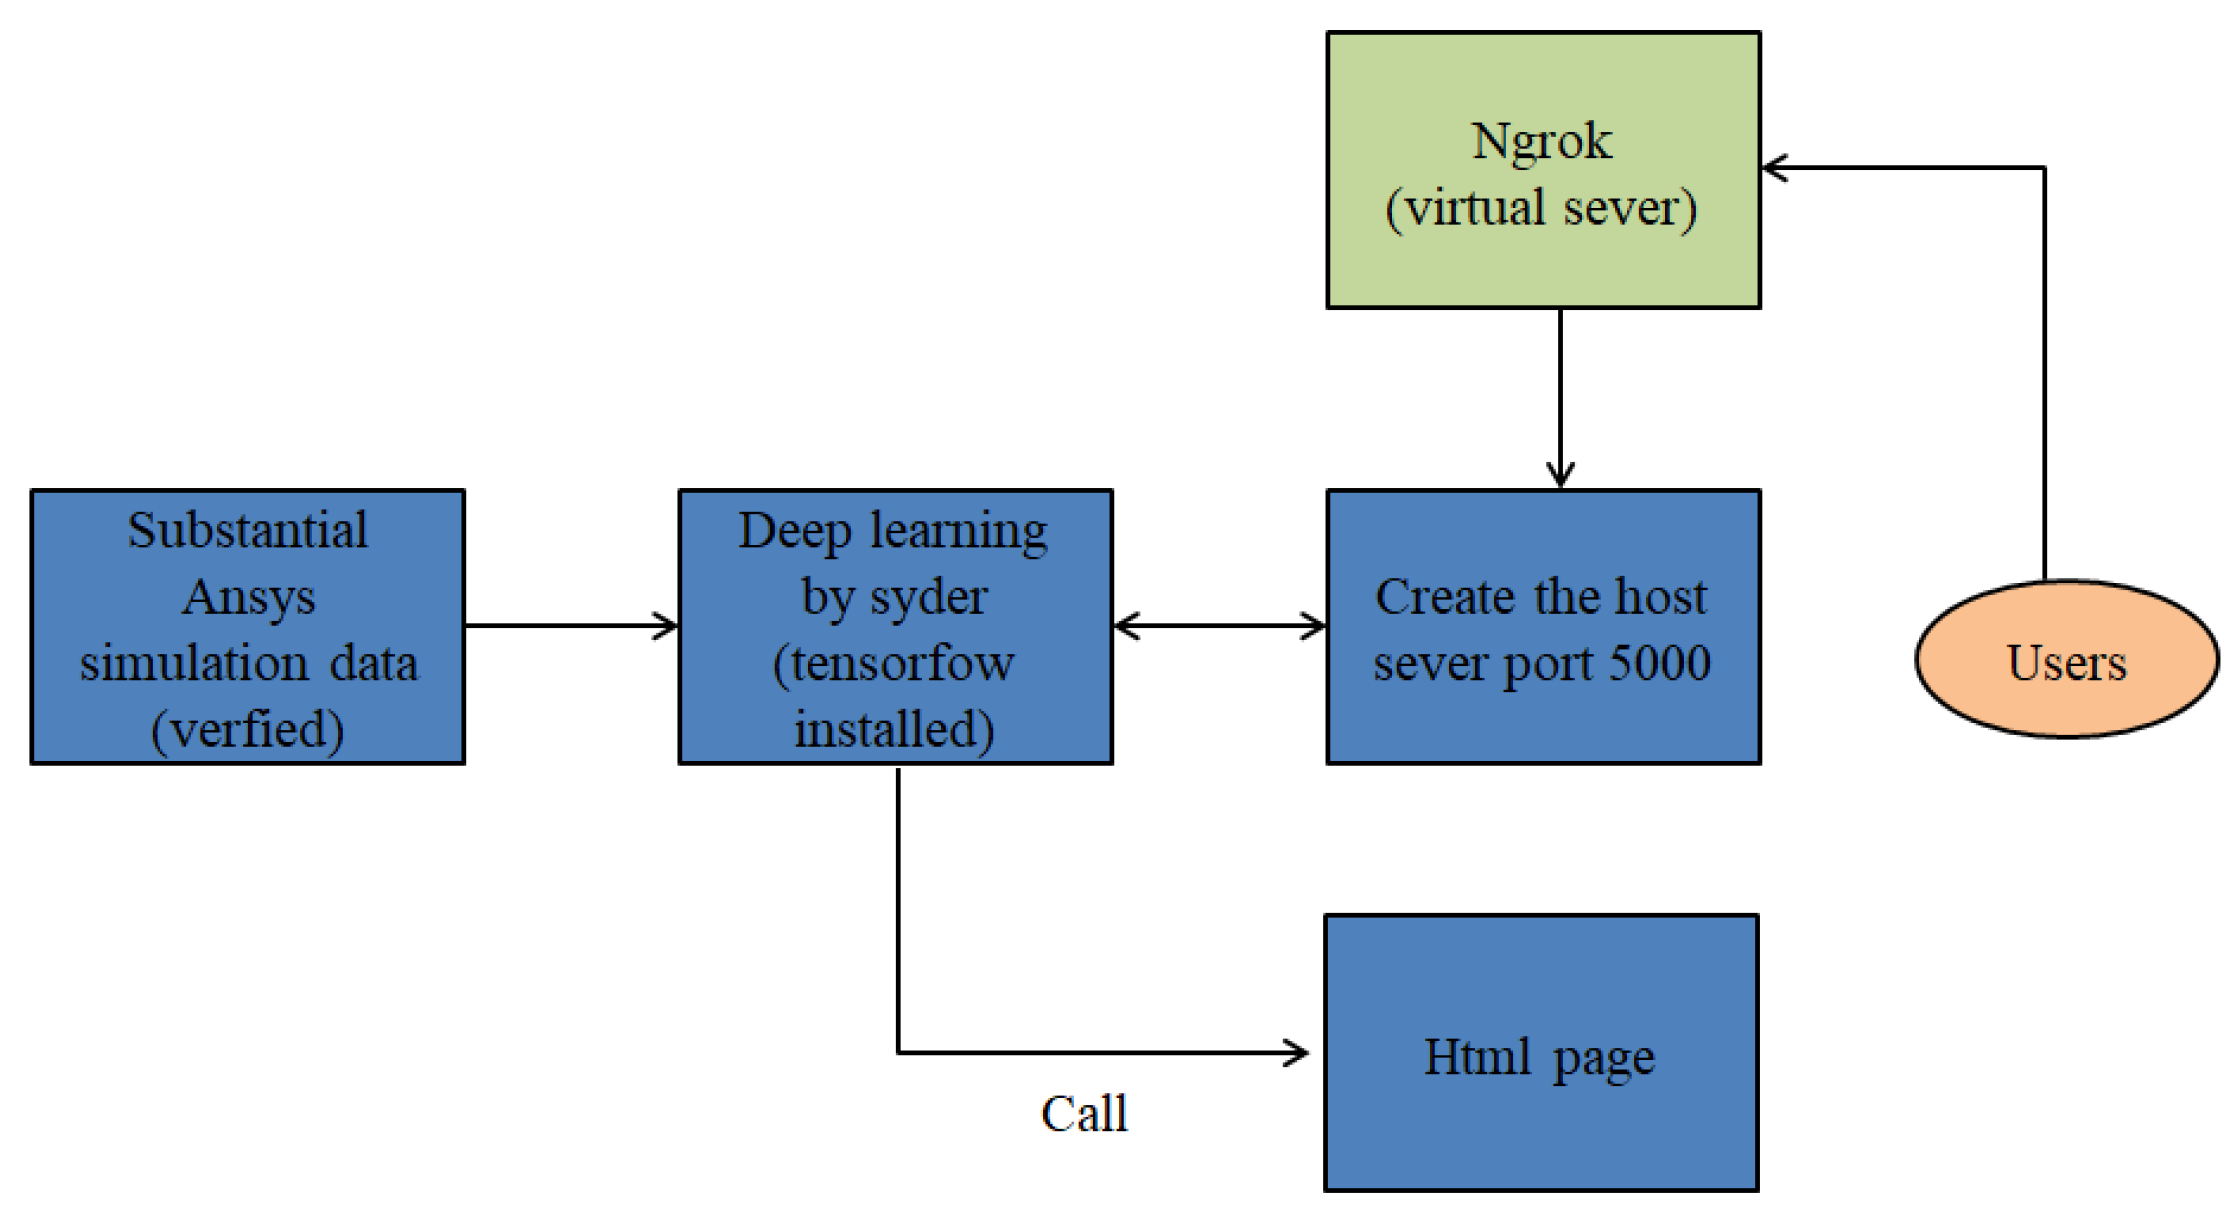
Figure 12.
The interface of the GUI-based AI prediction platform.
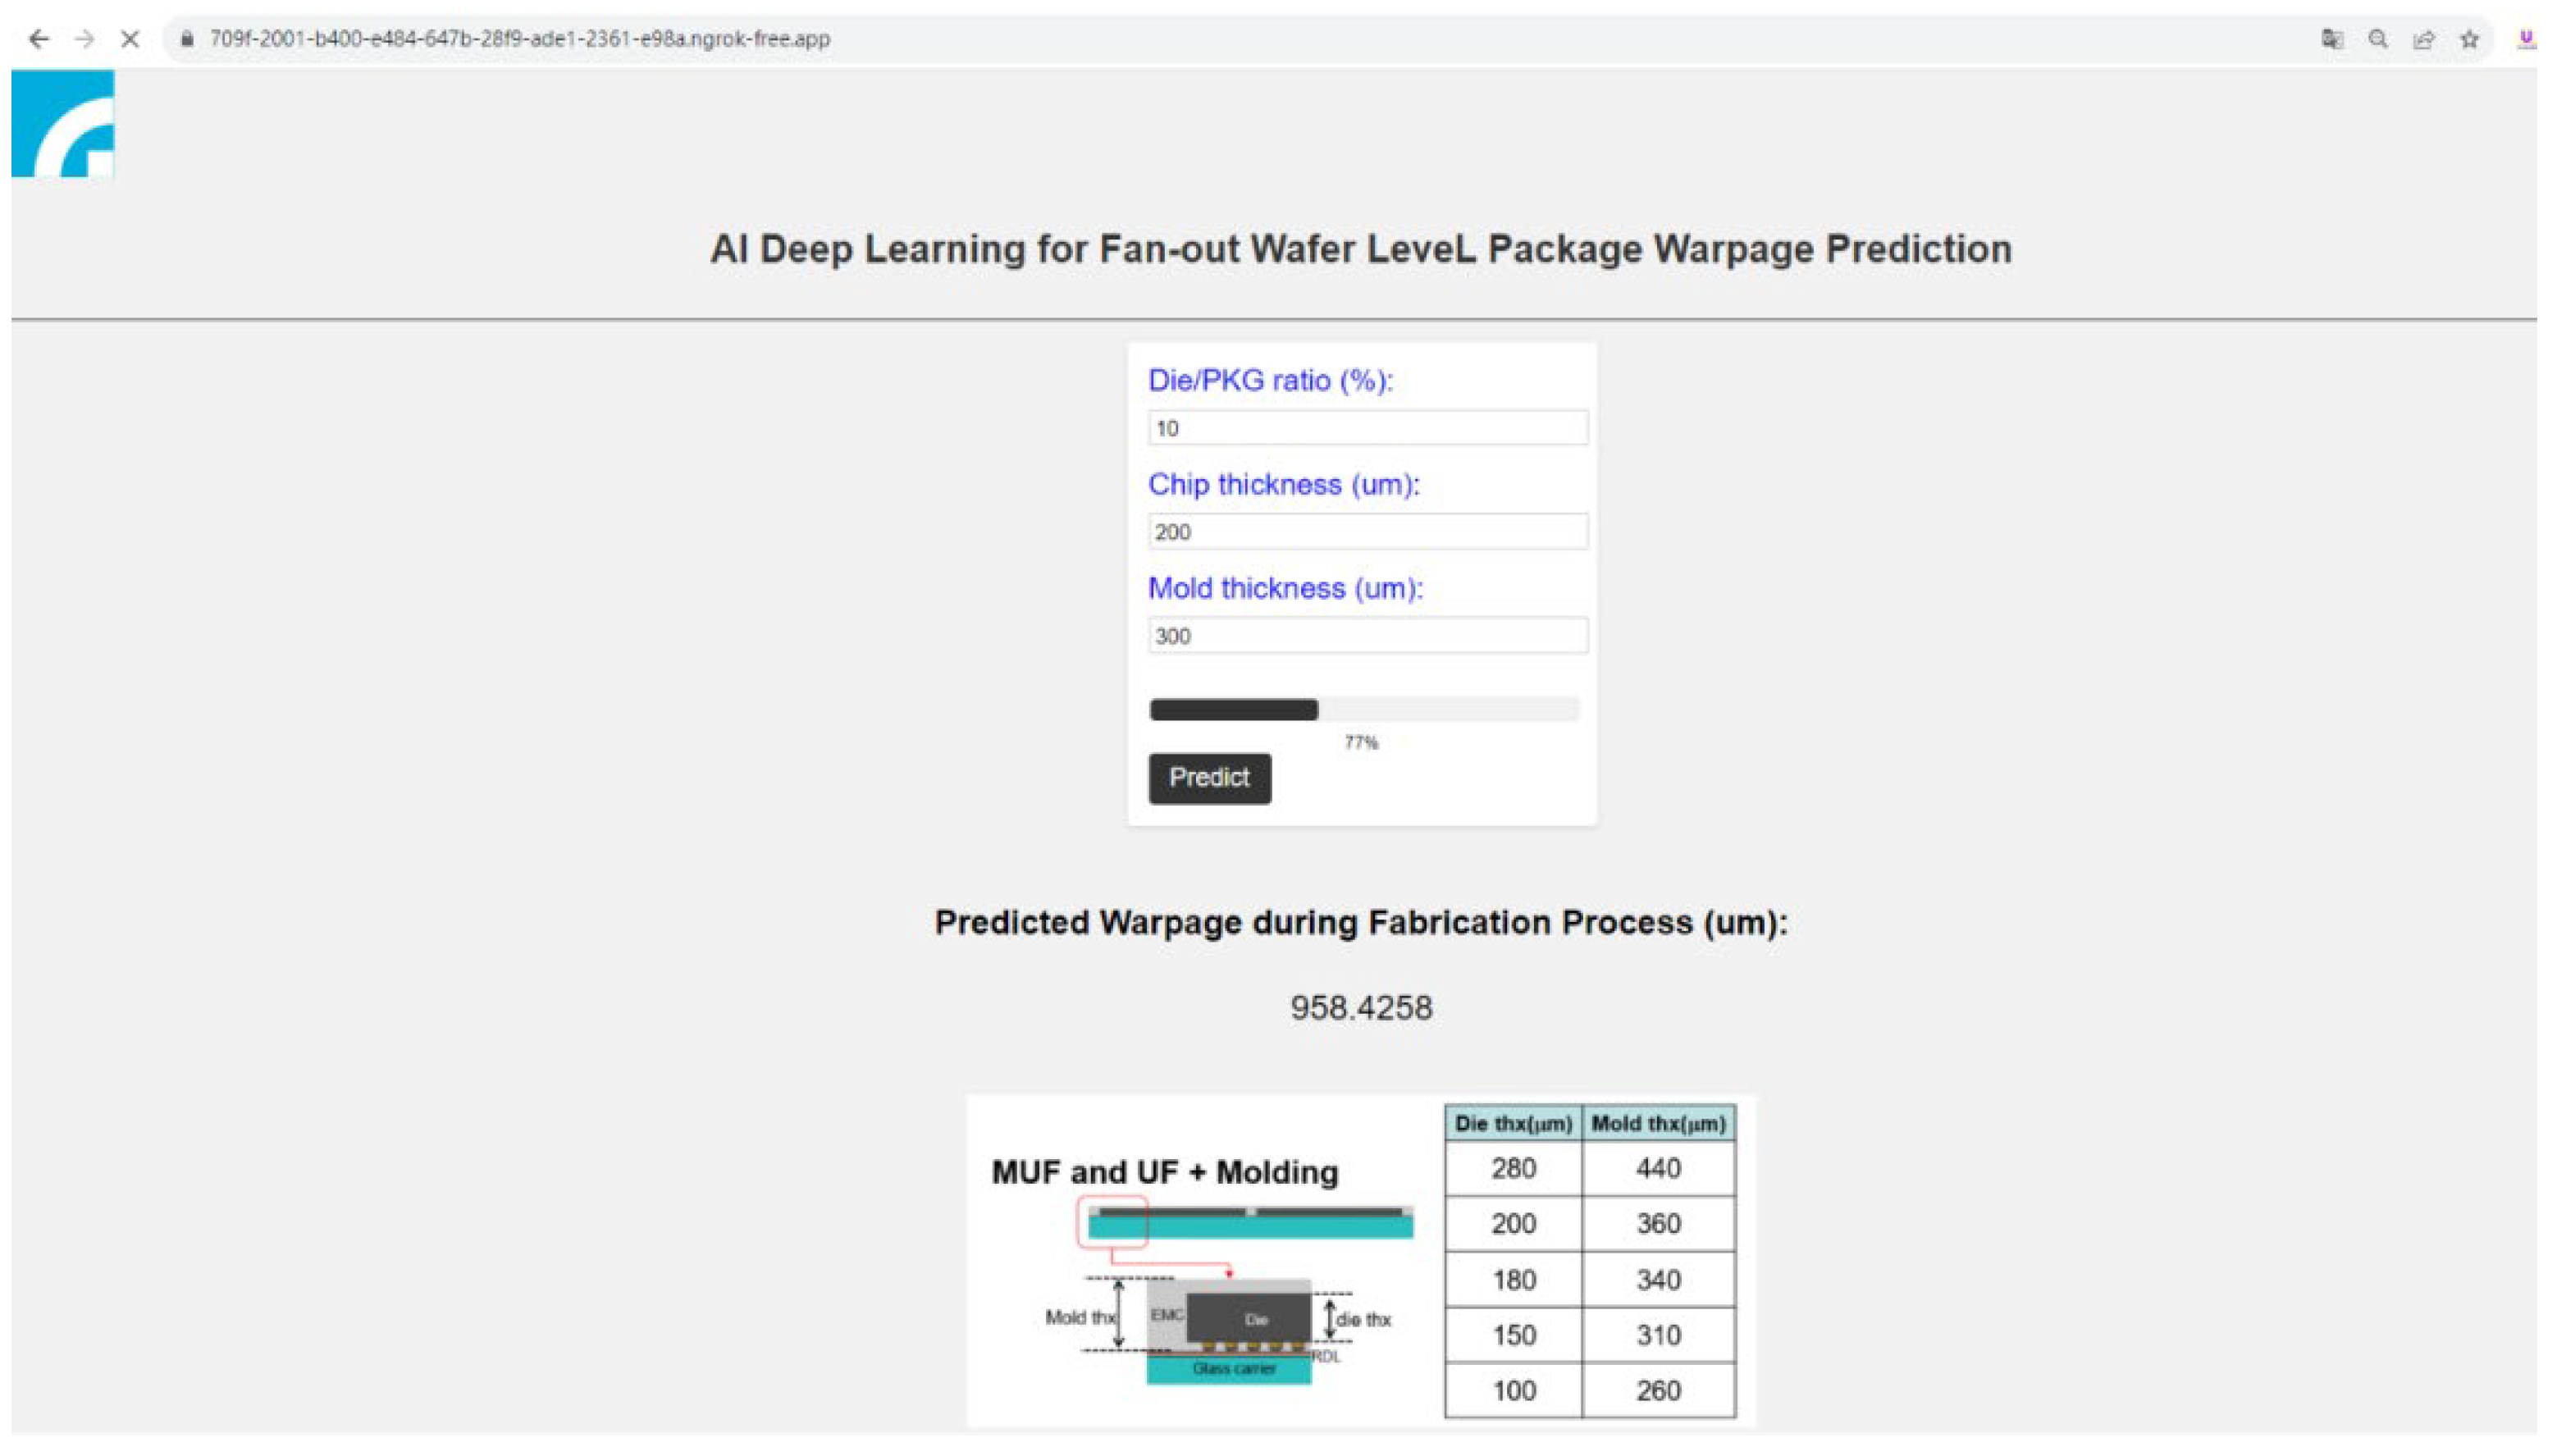
Figure 13.
Welcome message when the standalone prediction platform is launched.
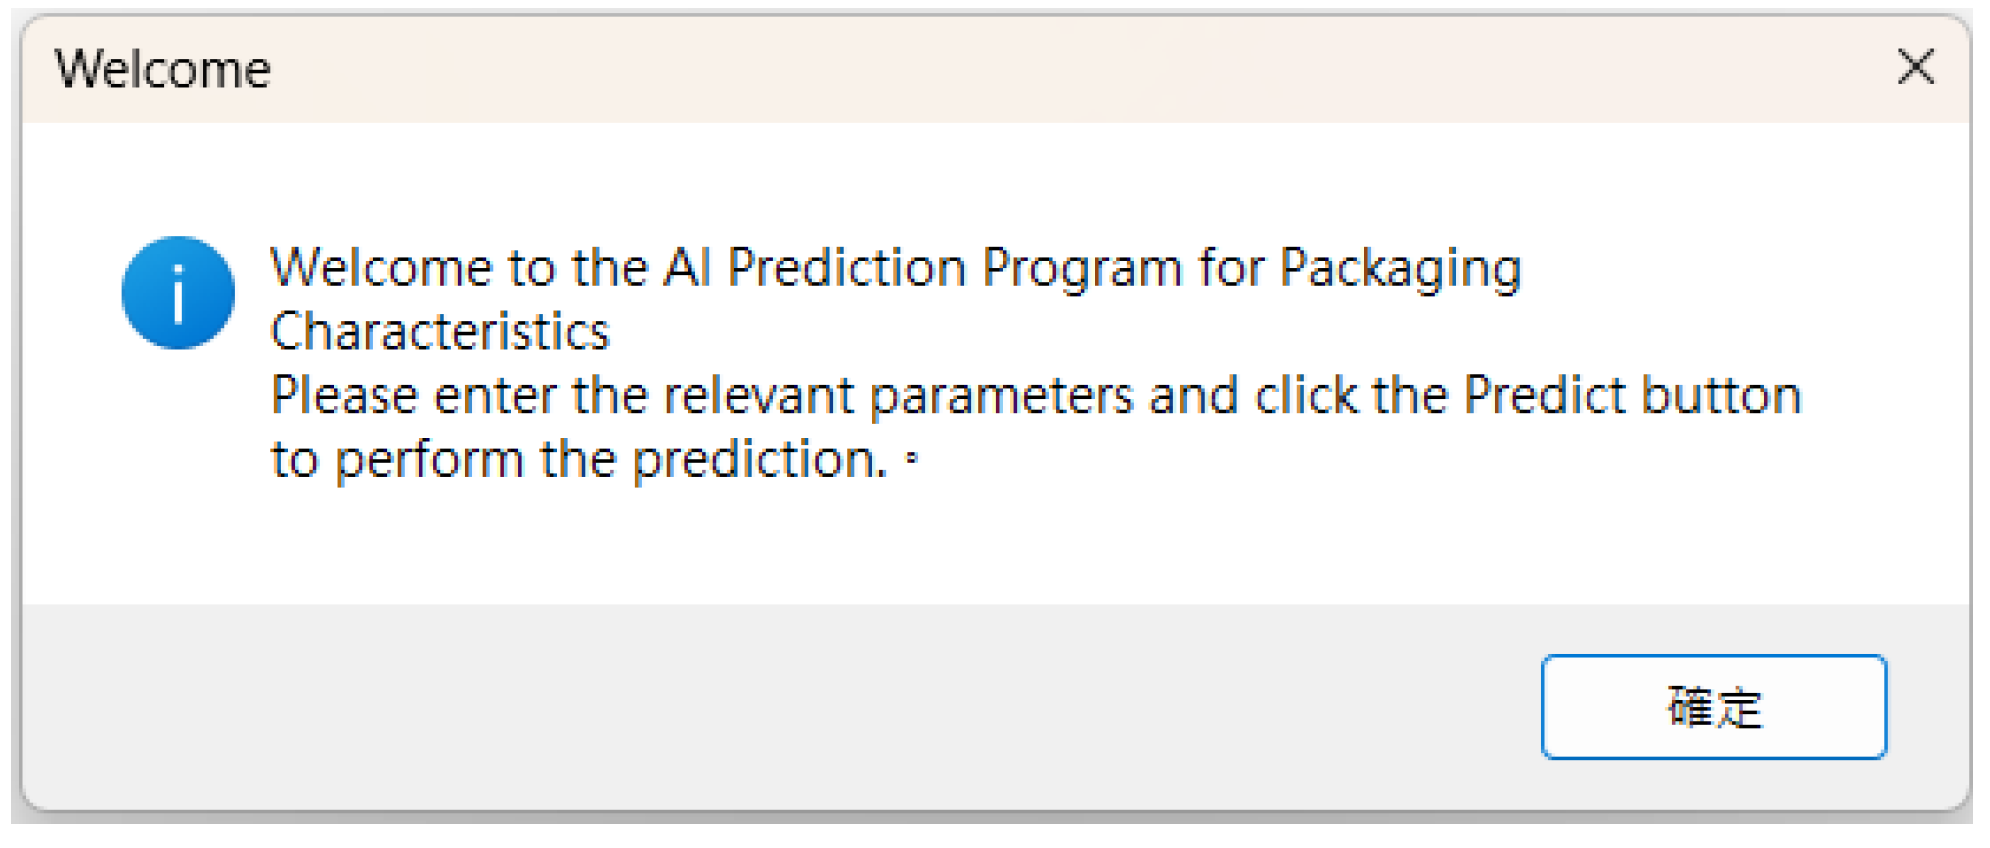
Figure 14.
The standalone version of the AI prediction platform with a GUI.
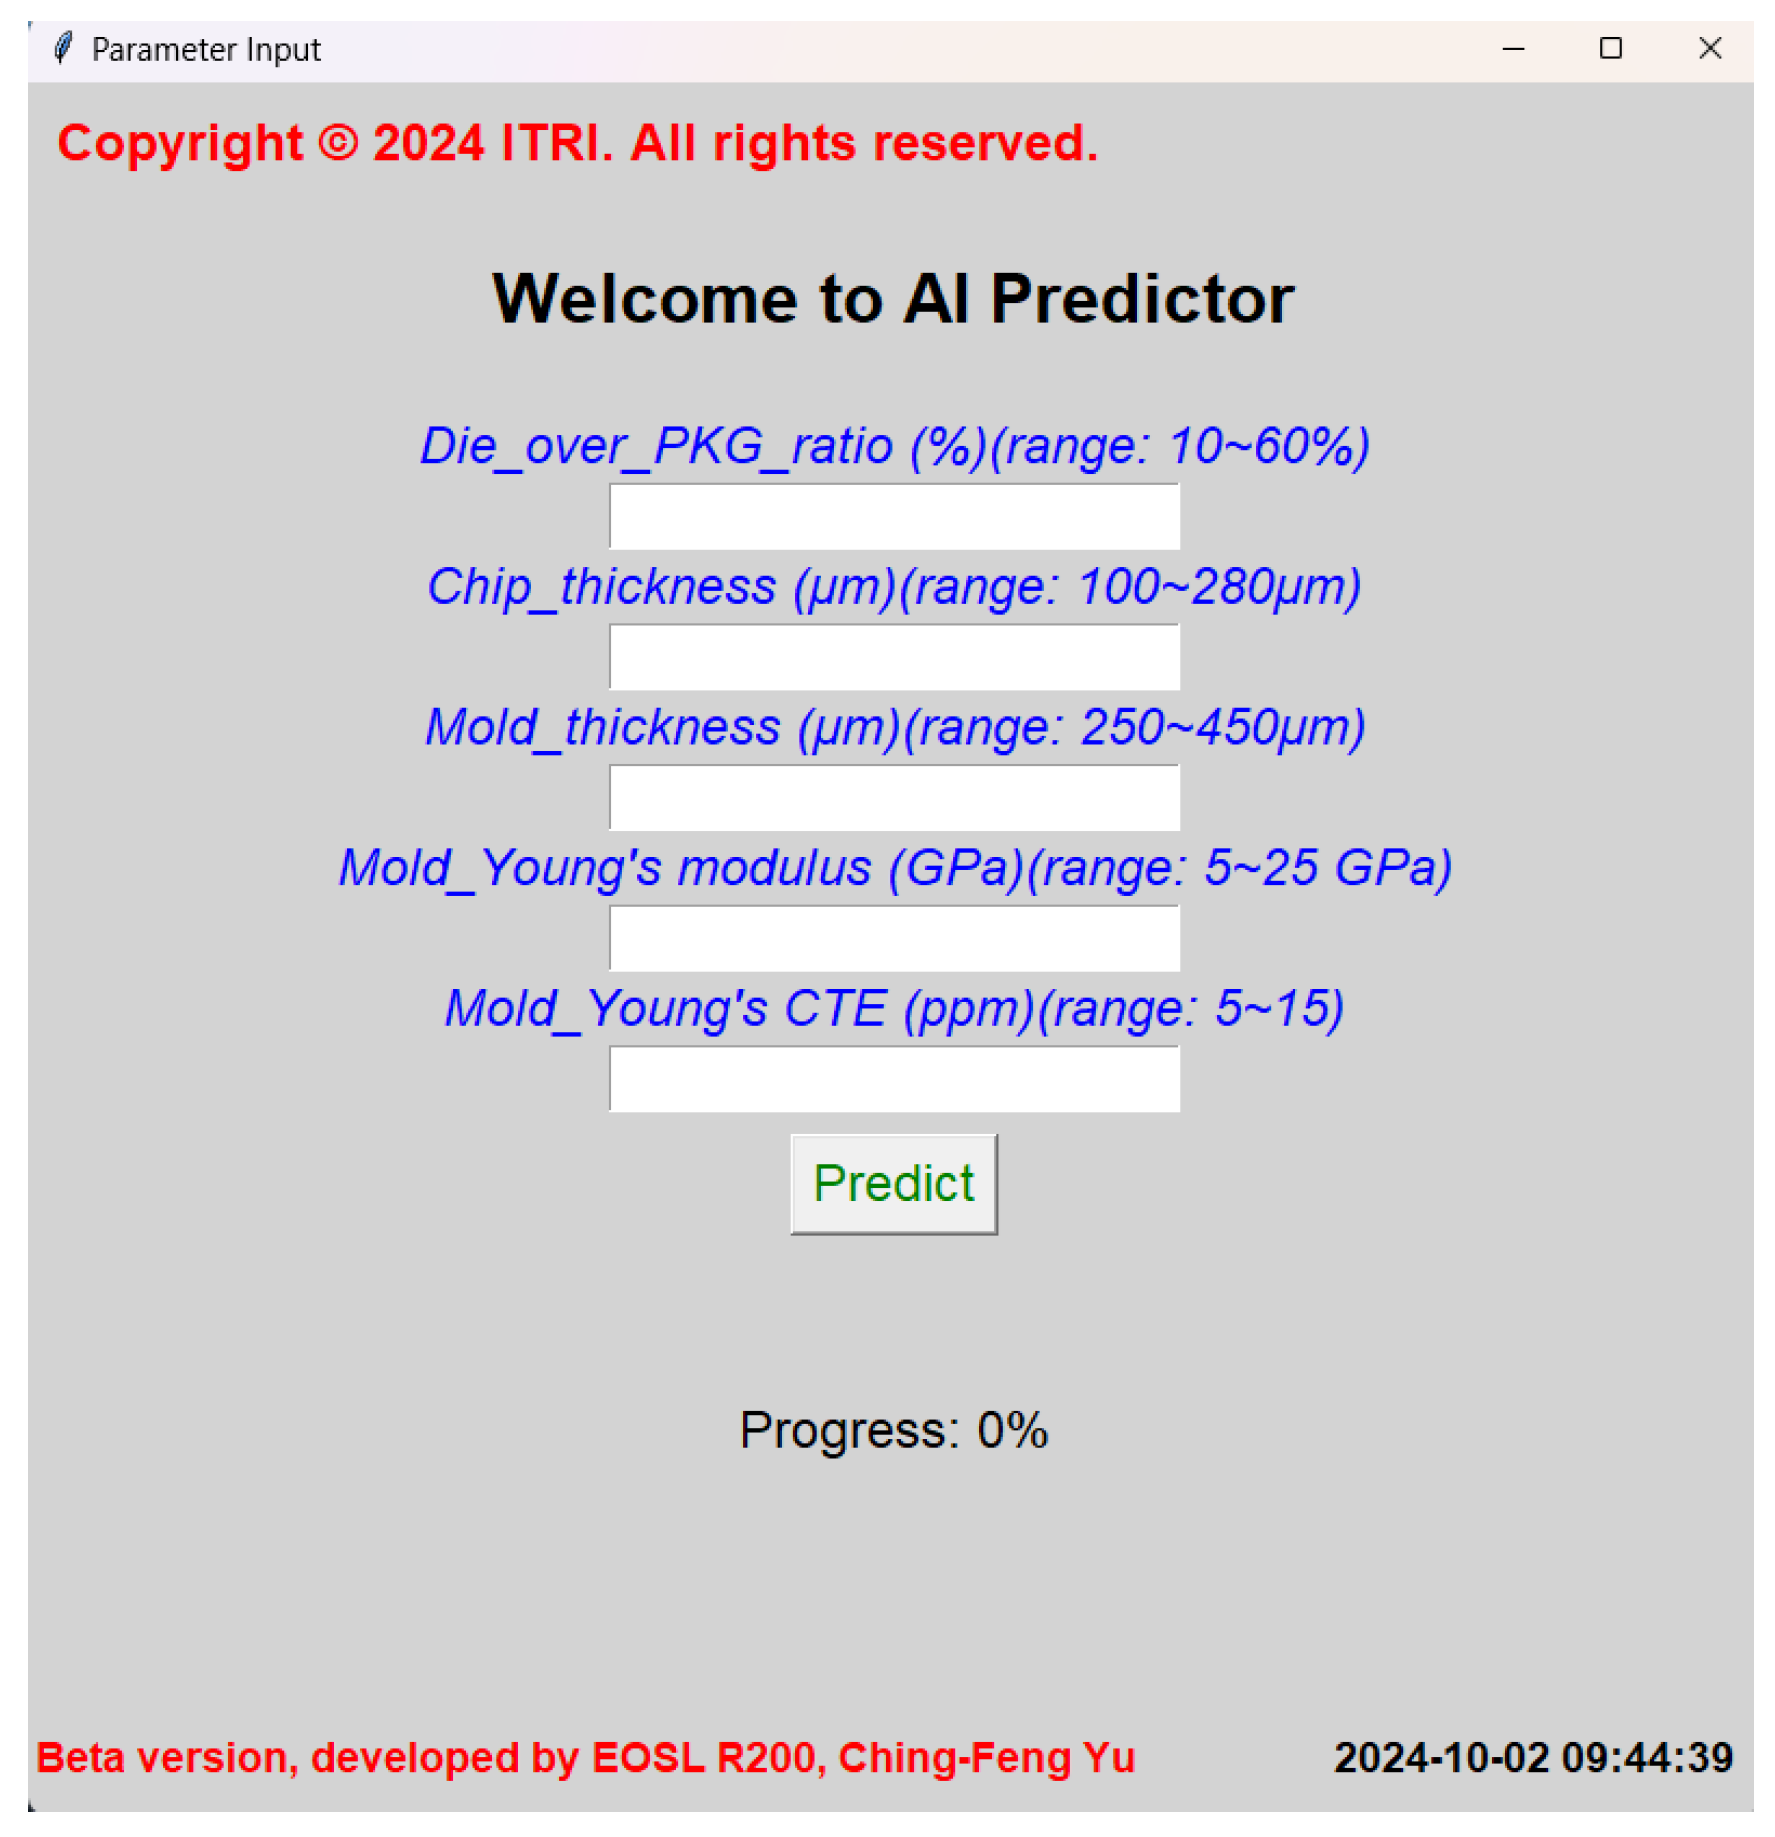

Table 1.
Material properties of each component.
| Material | Young’s modulus (GPa) | Poisson’s ratio | Coefficient of thermal expansion (CTE) |
|---|---|---|---|
| Si | 131 | 0.26 | 2.8 |
| PI | 3.3 | 0.3 | 52.5 |
| Cu | 120 | 0.4 | 17.5 |
| Glass carrier | 70.9 | 0.29 | 5 |
Table 2.
Fitted Prony series coefficients.
| i | τi | gi | i | τi | gi |
|---|---|---|---|---|---|
| 1 | 1.0×10¹⁹ | 2.33×10⁻¹⁴ | 11 | 1.0×10⁹ | 0.1209 |
| 2 | 1.0×10¹⁸ | 2.33×10⁻¹⁴ | 12 | 1.0×10⁸ | 0.09685 |
| 3 | 1.0×10¹⁷ | 2.33×10⁻¹⁴ | 13 | 1.0×10⁷ | 0.07191 |
| 4 | 1.0×10¹⁶ | 2.33×10⁻¹⁴ | 14 | 1.0×10⁶ | 0.06336 |
| 5 | 1.0×10¹⁵ | 2.33×10⁻¹⁴ | 15 | 1.0×10⁵ | 0.05796 |
| 6 | 1.0×10¹⁴ | 2.40×10⁻¹⁴ | 16 | 1.0×10⁴ | 0.0473 |
| 7 | 1.0×10¹³ | 1.86×10⁻¹² | 17 | 1.0×10³ | 0.03086 |
| 8 | 1.0×10¹² | 0.01558 | 18 | 1.0×10² | 0.04494 |
| 9 | 1.0×10¹¹ | 0.109 | 19 | 1.0×101 | 0.01368 |
| 10 | 1.0×10¹⁰ | 0.1342 | 20 | 1.0×100 | 0.07303 |
Table 3.
Material properties of the RDLs.
| Young’s Modulus (GPa) |
Poisson’s Ratio | Shear Modulus (GPa) |
CTE (ppm/oC) |
||||||||||
|---|---|---|---|---|---|---|---|---|---|---|---|---|---|
| Mat. | Cu content | ||||||||||||
| RDL4 | 23.5% | 3.93×10⁻¹⁰ | 3.93×10⁻¹⁰ | 25.85 | 0.12 | 1.79×10⁻¹² | 1.79×10⁻¹² | 4×10-11 | 9.64 | 9.64 | 5.87 | 5.87 | 0.17 |
| RDL3 | 40.2% | 14.0 | 14.0 | 46.9 | 0.32 | 0.096 | 0.096 | 5.72 | 17.54 | 17.54 | 36.11 | 36.11 | 18.81 |
| RDL2 | 35.7% | 12.8 | 12.8 | 42.2 | 0.32 | 0.097 | 0.097 | 5.31 | 15.77 | 15.77 | 37.93 | 37.93 | 19.16 |
| RDL1 | 24.9% | 10.5 | 10.5 | 30.8 | 0.316 | 0.108 | 0.108 | 4.39 | 11.52 | 11.52 | 41.81 | 41.81 | 20.48 |
Table 4.
Training data 1200 of FEA for five input features.
| Feature Name | Level |
|---|---|
| Die/Package (%) | 10, 15, 20, 25, 30, 35, 40, 45, 48, 50, 55, 60 |
| Die thickness (μm) | 101.6, 152.4, 180.3, 203.2, 279.4 |
| EMC thickness (μm) | 256.6, 307.4, 335.3, 358.2, 434.4 |
| EMC Young’s modulus (GPa) | 5, 10, 15, 20, 25 |
| EMC CTE (ppm) | 5, 7, 10, 15 |
Table 5.
Comparison between FEM Results and predicted values from machine learning approaches.
| Design | Die/PKG (%) |
Die thickness (μm) |
Mold thickness (μm) |
Mold E (GPa) |
Mold CTE (CTE) |
Warpage FEM (μm) |
SVR | RF | GBR | KNN | KRR |
| 1 | 10 | 203.2 | 358.2 | 25 | 5 | 570.6 | 493.1 | 557.6 | 526.1 | 937.9 | 707.0 |
| 2 | 15 | 180.3 | 335.3 | 15 | 5 | 266.6 | 214.2 | 251.8 | 272.6 | 276.9 | 332.23 |
| 3 | 20 | 152.4 | 307.4 | 20 | 15 | 4702.1 | 4762.0 | 4720.5 | 4863.1 | 4713.6 | 4958.4 |
| 4 | 25 | 101.6 | 256.6 | 10 | 7 | 560.6 | 516.1 | 476.8 | 403.4 | 563.7 | 472.8 |
| 5 | 30 | 101.6 | 256.6 | 25 | 15 | 4550.6 | 4473.3 | 4491.5 | 4678.4 | 4556.0 | 4331.5 |
| 6 | 35 | 152.4 | 307.4 | 5 | 15 | 698.9 | 573.0 | 711.6 | 685.8 | 607.5 | 669.3 |
| 7 | 48 | 152.4 | 307.4 | 10 | 15 | 906.9 | 805.8 | 894.6 | 924.9 | 1210.6 | 743.7 |
| 8 | 50 | 180.3 | 335.3 | 10 | 10 | 101.5 | 209.7 | 115.1 | 363.5 | 148.0 | 226.7 |
| 9 | 55 | 101.6 | 256.6 | 10 | 7 | 215.8 | 180.7 | 246.7 | 451.0 | 213.8 | 278.1 |
| 10 | 60 | 203.2 | 358.2 | 15 | 10 | 271.8 | 218.1 | 280.3 | 334.2 | 172.7 | 281.0 |
Table 6.
Comparison between FEM Results and predicted values from deep learning approaches.
| Design | Die/PKG (%) |
Die thickness (μm) |
Mold thickness (μm) |
Mold E (GPa) |
Mold CTE (CTE) |
Warpage FEM (μm) |
RNN | GRU | MLPs | LSTM |
| 1 | 10 | 203.2 | 358.2 | 25 | 5 | 570.6 | 571.3 | 568.0 | 572.4 | 568.3 |
| 2 | 15 | 180.3 | 335.3 | 15 | 5 | 266.6 | 266.7 | 263.1 | 266.4 | 269.7 |
| 3 | 20 | 152.4 | 307.4 | 20 | 15 | 4702.1 | 4703.0 | 4700.3 | 4711.1 | 4698.4 |
| 4 | 25 | 101.6 | 256.6 | 10 | 7 | 560.6 | 558.5 | 556.7 | 557.8 | 557.0 |
| 5 | 30 | 101.6 | 256.6 | 25 | 15 | 4550.6 | 4551.5 | 4546.7 | 4558.8 | 4546.1 |
| 6 | 35 | 152.4 | 307.4 | 5 | 15 | 698.9 | 699.3 | 698.9 | 696.4 | 697.5 |
| 7 | 48 | 152.4 | 307.4 | 10 | 15 | 906.9 | 906.3 | 905.8 | 906.5 | 906.1 |
| 8 | 50 | 180.3 | 335.3 | 10 | 10 | 101.5 | 100.8 | 100.6 | 99.6 | 101.5 |
| 9 | 55 | 101.6 | 256.6 | 10 | 7 | 215.8 | 216.3 | 219.2 | 212.1 | 215.3 |
| 10 | 60 | 203.2 | 358.2 | 15 | 10 | 271.8 | 273.0 | 271.0 | 270.0 | 273.2 |
Disclaimer/Publisher’s Note: The statements, opinions and data contained in all publications are solely those of the individual author(s) and contributor(s) and not of MDPI and/or the editor(s). MDPI and/or the editor(s) disclaim responsibility for any injury to people or property resulting from any ideas, methods, instructions or products referred to in the content. |
© 2025 by the authors. Licensee MDPI, Basel, Switzerland. This article is an open access article distributed under the terms and conditions of the Creative Commons Attribution (CC BY) license (http://creativecommons.org/licenses/by/4.0/).
Copyright: This open access article is published under a Creative Commons CC BY 4.0 license, which permit the free download, distribution, and reuse, provided that the author and preprint are cited in any reuse.


