
Submitted:
31 January 2025
Posted:
03 February 2025
You are already at the latest version
Abstract
The quantification of methane concentrations in air is essential for the quantification of methane emissions, which in turn is necessary to determine absolute emission and the efficacy of emission mitigation strategies. These are essential if countries are to meet climate goals. Large scale deployment of methane analyzers across the millions of emission sites is prohibitively expensive and lower-cost instrumentation has been recently developed as an alternative. Currently, it is unclear how cheaper instrumentation will affect measurement resolution or accuracy. To test this, the Wireless Autonomous Transportable Methane Emission Reporting System (WATCH4ERS) has been developed and comprises four sensing technologies: Metal Oxide (MOx,); Non-dispersion Infrared (NDIR); Integrated Infrared (INIR); and Tunable Diode Laser Absorption Spectrometer (TDLAS). This study describes the integration of these sensors to a single unit and test instrument response through calibration and downwind tests. Both calibration and response experiments indicate the INIR has little practical use for measuring methane concentrations less than 500 ppm. The MOx sensor is shown to have a logarithmic response to methane concentration change between background and 600 ppm but it is strongly suggested that passively sampling MOx sensor cannot respond fast enough to report concentrations that change on a sub-minute time frame. The NDIR sensor reported linear change to methane concentration between background and 600 ppm, although there was a noticeable lag in reporting changing concentration especially at higher values, and individual peaks could be observed throughout the experiment even when the plumes were released 5 s apart. The TDLAS sensor re-ported all changes in concentration but remains prohibitively expensive. Our findings suggest that each sensor technology could be optimized by either operational design or deployment location to quantify methane emissions and the WATCH4ERS units will be deployed in real-world environments to investigate the utility of each in the future.
Keywords:
Methane
; Concentration
; Quantification
1. Introduction
With fast-approaching deadlines to meet climate pledges signed by most countries globally, the desire to quantify and limit methane emissions has increased over the past five years [1,2]. While top-down quantification methods, such as satellite or tall tower approaches [3,4], can be used to give regional or relatively large-scale emission estimates, near-field observations are necessary to quantify emissions at the component scale, this gives operators in the energy, waste, and agriculture sectors targets for actionable mitigation [5,6,7].
The main shortcoming of near-field methane quantification is the cost of instrumentation used to measure methane concentrations. Since the late 1980s, cavity-based optical analyzers have been considered the gold standard in methane concentration quantification [8,9]. However, these instruments are expensive (>$30k each), and as there are hundreds of thousands of methane sources, large-scale deployment of methane measurements (using these instruments) remains prohibitively expensive.
To address this shortcoming, lower-cost sensors are being repurposed [10,11] or developed [12] although it is currently unclear if these sensors can replace gold-standard analyzers. As part of the US Department of Energy’s project to decarbonize natural gas resources, multiple low-cost sensing technologies are being evaluated as part of the US Department of Energy funded redevelopment of Colorado State University’s Methane Emission Technology Evaluation Center. Four lower-cost sensor types, metal oxide (MOx) sensors ($15 per sensor), a non-dispersive infrared (NDIR) sensor ($500 per sensor), an integrated infrared (INIR) sensor ($300 per sensor), and a tunable diode laser absorption spectrometer (TDLAS) ($15,000 per sensor), are co-located within an IP-69 rated box, powered using solar panels and data transmitted via the mobile network. Henceforth, this package will be referred to as the Wireless Autonomous Transportable Methane Emission Reporting System (WATCH4ERS).
MOx sensors typically use a tin-dioxide (SnO2) sensing layer that reacts with detected gases. The detection mechanism relies on the change in electrical conductivity through the oxide layer in presence of methane which is a reducing gas. An absorbance of oxygen molecules occurs on the surface of SnO2 forming O2- ions leading to electron capture creating a depletion layer at the surface of the SnO2, increasing its resistance [13,14]. Methane interacts with the adsorbed oxygen ions thus releasing the trapped electrons back into the SnO2 conduction band thereby decreasing its resistance. The reduction in resistance is proportional to the methane concentration. Over the last five years, metal oxide sensors have increasingly been used to detect and quantify emissions from oil and gas production infrastructure [6,13,15]. Low-cost MOx sensors are of great interest as the quantification of emissions from each emitting sites (landfill, oil and gas production, waste water, etc.) would require at least four sensors [16]. Lower-cost sensors would make the financial burden on measurement more manageable, however, it is unclear how responsive these sensors are.
NDIR multi-gas sensing platforms have been developed to measure methane concentrations, as well as carbon dioxide, nitrous oxide, and water, to sub-ppm mixing ratios [12]. The NDIR uses a multi-spectral and multi-optical path design coupled with three individual wavelength-selective detectors to observe the absorption of species-specific radiation and infer concentrations within an air sample [12,17]. As of 2025, NDIR sensors are relatively new to the methane emission quantification field and it is currently unclear how useful these will be compared to more established instrumentation (MOx and TDLAS).
Similarly, INIR sensors use absorption of infrared radiation to infer the abundance of methane in a sample of air between 100 ppm and 100% [18,19,20]. Infrared light passes through the gas sample chamber, and methane absorbs specific infrared wavelengths. The reduction in infrared intensity at these wavelengths, measured by the detector, is proportional to the methane concentration. This approach ensures high accuracy and selectivity for methane detection, with minimal interference from other gases. As INIR sensors have no heated elements, they are much safer to use around methane sources than MOx sensors and can therefore be installed much nearer to the source of emission. The INIR was included as part of the WATCH4ERS instrumentation as is has been reported that fast-responding sensors are able to distinguish high-concentration and small-volume “bubbles” within the plume [21] and it is currently unclear if sensors with higher detection limits, such as the SGX INIR, are fast enough to detect these.
TDLAS use a laser tuned to the absorption wavelength of methane [22]. The methane concentration in air is calculated from the change in the laser’s intensity as it passes through the sample. TDLAS instruments have a low minimum detection limit (as low as 1ppb), a high signal to-noise ratio and can measure in near-real time. The main shortcoming is that the cavity can be affected by dust and precision/accuracy can be affected by thermal expansion/contraction of the cavity. TDLAS are established instruments and have been used in many studies to report methane emissions, however, they are relatively expensive, and it is currently unclear how much better they are than other established (MOx) and emerging technologies (NDIR and INIR).
This paper describes the development of the WATCH4ERS which uses four sensing technologies (MOx, NDIR, INIR and TDLAS) to measure the methane concentrations in air at different upper/lower thresholds, with different levels of precision, and respond at different rates to changes in methane concentrations. The WATCH4ERS development aims to 1. Better understand the cost-benefit balance of methane sensors, and 2. Identify how decreasing instrumentation costs could increase deployment coverage. Here, we also provide a comprehensive guide on how to build methane measurement instruments, including all code, from low-cost off-the-shelf sensors.
2. Materials and Methods
The WATCH4ERS comprises five individual methane sensors (two MOx sensors, NDIR sensor, INIR sensor and a TDLAS) that stream data to a single laptop PC via a powered USB hub. Data are read into the PC using Python code and data are stored locally. Hardware, software, materials and build details are presented for each of the sensors below.
2.1. Data aquisition
The code required to run the WATCH4ERS can be found at https://github.com/stuartnriddick/AMMMU.git. Three Arduino UNO’s are used to interface the MOx sensors, the ’46 Hawk (TDLAS sensor) and the environment monitoring sensor (DHT22) to the data logging PC through a standard USB port. For the TGS2600 and TGS2611 metal oxide sensors, an Arduino UNO along with an Adafruit ADS1115 ADC interfaces the sensors and the code “Riddick MOX Arduino Code.ino” controls the sampling of these sensors and the transfer of the data to the PC. The ’46 Hawk sensor does not have any digital output and the data from this instrument is extracted by a technique known as “data sniffing” where code run by the monitoring Arduino interrogates the ’46 Hawk LCD and extracts the values displayed on the LCD. Sniffing the data transmitted to the LCD screen of the ’46 Hawk requires “Hawk Arduino Code.ino” downloaded to the Arduino UNO connected to it. The other two sensors, the INIR and the NDIR both have serial RS232 interfaces and these outputs are converted using RS232 to USB converter modules plugged directly into the USB Hub. The Python code that collects data from all the sensors and writes them to a file is “Ammu Python Code.py”.
2.2. Sensors
2.2.1. Metal oxide (MOx)
Typical metal oxide (MOx) sensor models used in these studies are the Taguchi Gas Sensors (TGS) 2600 and 2611 models produced by Figaro Engineering Inc. (Osaka, Japan). The TGS2600 uses a heated tin-dioxide (SnO2) sensing layer that reacts with the detected gases. The detection mechanism relies on the change in electrical conductivity through the SnO2 in the presence of methane which is a reducing gas [10,11,13]. The TGS2611 has the same operation basis as the TGS2600 but has been optimized for methane detection by the integration of a heating element to maintain optimal temperature for methane detection [13,14]. Additionally, the TGS2611 features a filter material that selectively permits methane to reach the sensing element while blocking other gases [13,14].
The metal oxide sensor has a resistance (R0) in clean air, i.e. air with ambient methane, which becomes lower in the presence of methane (Rs). The ratio of these resistances (R0/Rs) gives a measure of the methane mixing ratio in air. However, the resistance of the metal oxide sensor is also affected by the air temperature and relative humidity; therefore, the ratio of resistance must be corrected for these factors [10]. A DHT11 sensor was used to measure temperature and relative humidity (as described in Section 5.5). Both Figaro TGS sensors, 2600 and 2611, were powered by 5 V LM7805 voltage regulators (Figure 1). The voltage output from the TGS sensors was converted using an ADS1115, 16 bit analog-to-digital converter controlled by an Arduino UNO. The output was communicated to the PC laptop via the USB C port integrated into the Arduino UNO. An external 12 Volt DC source powered the data collection package.
2.2.2. Non-dispersive infrared (NDIR)
The K96 sensor from Sensair (Delsbo, Sweden) is a compact non-dispersive infrared multi-gas sensing platform that measures methane, carbon dioxide, nitrous oxide, and water, to sub-ppm levels [12]. The K96 uses a multi-spectral and multi-optical path design coupled with three individual wavelength-selective detectors to observe the absorption of species-specific radiation and infer concentrations within an air sample [12,17]. The sensor outputs data on three channels: the LPL channel measuring CO2, N2O, and CH4 (all in ppm); the SPL channel measuring CO2 in ppm; and the MPL channel measuring H2O in % volume. The K96, RS232 formatted data were sent to a laptop via Rx/TX pins on an FTDI FT232RL IC using a Python script. Data are updated every second and stored on the laptop hard drive. The K96 sensors were co-located to within 5 cm of the TGS2600 and TGS2611 sensors and passively exposed to the air.
2.2.3. Integrated infrared (INIR)
The SGX INIR-ME100 sensor (SGX, Katowice, Poland) uses the absorption of infra-red radiation to infer the abundance of methane in a sample of air between 100 ppm and 100% [18,20]. Infrared light passes through the gas sample chamber and methane absorbs specific IR wavelengths. The reduction in infrared intensity at these wavelengths, measured by the detector, is proportional to the methane concentration. The SGX INIR-ME100 directly outputs methane mixing ratio data and data are sent/read to a laptop via Rx/TX pins on an FTDI FT232RL IC using a Python script. Data are updated every second and stored on the laptop hard drive. The INIR sensor was co-located to within 5 cm of the other sensors and passively exposed to the air.
2.2.4. Tunable diode laser absorption spectrometer (TDLAS)
Methane mixing ratios were also measured by a Southern Cross Inc. (Norcross, GA, USA) ’46 Hawk tunable diode laser absorption spectrometer. The ’46 Hawk draws air into the cavity of the handheld unit at a rate of 1.2 lpm and methane mixing ratios are reported every second [23]. The response time of the ’46 Hawk is 2 seconds and can measure methane concentrations between 1 ppm and 100% gas with a sensitivity of 1 ppm. Gas measurements made by the ’46 Hawk are only displayed on an LCD screen and an Arduino-based interface was designed to capture and decode the displayed measurements. This information was then transferred through an RS232 interface to the data-logging PC. The sampling inlet of the ’46 Hawk was collocated (within 5 cm) with the TGS, INIR, and K96 sensors.
The interface between the Hawk LCD and the Arduino was accomplished using a technique known as “data sniffing” [24]. Data sniffing is a method of decoding the digits displayed on a liquid crystal display (LCD) allowing these values to be logged on some form of storage media. An Arduino UNO was used to monitor the three ‘46 Hawk LCD control lines (Enable, RS, R/W) and read data transmitted to the four LCD data lines. Data lines were read sequentially until the 16 data segments that characterized the LCD output had been read. These data were then converted to ASCII format and output by the Arduino as a serial string. These string data were then transferred to the PC via RS232 and a USB converter. The connections enabling the “sniffing” between the Hawk LCD and the Arduino port were made using 8-way ribbon cable, the implementation of which required delicate soldering as the separation between the ribbon cable wires was 1.27 mm with each conductor 0.3 mm in diameter.
2.2.5. Temperature and relative humidity
Temperature and relative humidity used to apply correction to the TGS data were measured using a DHT11 sensor and communicated to the laptop via an Arduino UNO.
2.3. Operating procedures
To start data collection, all USB connectors from the individual sensors should be attached to the USB hub and the hub attached to the laptop PC (Figure 3). The Python code “AMMMU_Python_Code.py” should be installed into a separate folder on the C Drive. Before the Python code is run, the assignment of each instruments’ com port should be updated in the code on lines 24 (TGS sensors port), line 25 (DHT11 sensor), line 26 (INIR sensor), line 36 (K96 sensor) and line 82 (’46 Hawk). The ’46 Hawk should be powered up first and alarm set to 10,000 ppm and volume set to “Off”. The other sensors can then be powered up. The Python module can then be set to run. Data are written to a new daily text file without headers in the folder that contains “AMMMU_Python_Code.py” with the naming format “MULTI_Sensor YYMMDD.txt”. Experimental data written on the same day will be concatenated to the same text file.
2.4. Data files
Data are recorded by the Arduino UNO as a text file in a space delimited format with 17 columns (Table 1). The main columns of interest for calculating methane concentrations are the time (Column 1; HH:MM:SS), TGS2600 output (Column 2; counts), TGS2611 output (Column 3; counts), K96 LPL channel (Column 5; sum of CO2, N2O, and CH4 concentrations in ppm), K96 SPL channel (Column 6; CO2 concentration in ppm), Hawk output (Column 13, CH4 concentration in ppm), INIR output (Column 14; CH4 concentration in ppm), DHT 11 relative humidity (Column 16, %), and DHT 11 temperature (Column 17, °C).
2.5. Sensor calibration
The MOx, NDIR and INIR sensors within the WATCH4ERS unit were calibrated by comparing sensor output to the TDLAS output, following the calibration of the TDLAS using the procedure outlined in the Southern Cross manual [23]. The WATCH4ERS unit was placed in a chamber at 20°C and 60% humidity. Following a 2-hour period of acclimatization, 0.5% methane gas was injected into the chamber at a rate of 1 g CH4 h-1 until the TDLAS registered a methane concentration greater than 400 ppm. This was repeated three times over a period of 2 hours (Figure 2). The MOx, NDIR and INIR sensors were then calibrated by comparing their output to the TDLAS output and calibration algorithms generated.
2.6. Sensor testing
One main concern with continuous monitoring sensors is the time taken for the sensors to respond to methane plumes. The time that the sensor is exposed to methane enhanced air is a function of both the emission source and the characteristics of the wind. Some emissions last relatively short periods of time, e.g. blow down events can occur over a single minute, while the direction of the wind field can vary in sub-minute time frames [6,21]. To investigate how the sensors in the WATCH4ERS units respond to high frequency changes in emission, short duration emissions will be run in a controlled environment and the lower-cost sensor response will be compared against the TDLAS sensor’s response.
Here, an experiment was conducted where 0.5% methane was released at 5 liters per minute 0.5 m upwind of a WATCH4ERS unit. Air flow between the release point and the WATCH4ERS unit was controlled at 3.5 m s-1 using a fan blowing at a constant rate. Five experiments were conducted to investigate the response of the MOx, NDIR, INIR and TDLAS sensors (Table 2). In each experiment, three gas plumes were released from a cylinder for a fixed duration with a controlled time between the plume release. The aims of the experiment are to determine: 1. How many of the plumes could be seen in the instruments’ methane concentration data; 2. The typical time taken to respond to a downwind plume; and 3. The typical methane concentrations observed downwind.
3. Results
3.2. Sensor calibration
Following the calibration procedure described in Section 2.5, the sensor output data were plotted against the TDLAS methane concentration data to generate an understanding of the sensor’s response. The MOx data were converted from an output voltage and then corrected for the effects of temperature and relative humidity following published methods [10,11,13]. These corrected data show a logarithmic response to methane concentrations between background and 500 ppm with the sensor response saturating at concentrations greater than 300 ppm (Figure 3). The scatter of points to the left of the logarithmic curve indicates a lag in the sensors response to change in methane concentration.
The NDIR methane output data shows a linear response to change in methane concentration between background and ~350 ppm. Scatter to the left of the regression line suggests a lag in NDIR response especially for the highest methane concentrations observed by the TDLAS. The coefficient of determination of the regression (R2) between the TDLAS and NDIR data over the two hours of calibration was 0.81. The output of the INIR remained zero over the entire 2-hour measurement period.
3.3. Sensor testing
Following the calibration experiments, the sensors’ response was tested against short duration plumes of methane. The TDLAS responded to the methane plumes within 5 seconds of the plumes being initiated 0.5 m away, note that the WATCH4ERS unit updates concentrations every 5 seconds (Figure 5). This suggests the TDLAS response is faster than the refresh rate of the WATCH4ERS unit. Reported methane concentrations were between 5 and 7 ppm for all experiments, which is in line with modelled values for a 1 g CH4 h-1 released 0.5 m away and travelling at 3.5 m s-1. Reported peaks also last the same amount of time as the emissions.
The NDIR sensor also responded to all methane peaks (Table 4). The response was between 12 and 18 seconds after the gas was released and methane peaks were lower than the TDLAS. Reported peaks from the NDIR lasted longer than the emission durations, however, peak height at 1 g CH4 h-1 was sufficiently large to identify individual plumes. Individual plume peaks could not be distinguished in the MOx output even though total methane observed over the experiment increased.
4. Discussion
The design, construction, and testing of the Wireless Autonomous Transportable Methane Emission Reporting System (WATCH4ERS), as described in this study, has resulted in the development of a sensing platform that can be used to measure methane across the scales of cost, precision, accuracy, and response rate. The WATCH4ERS uses four sensing technologies (MOx, NDIR, INIR and TDLAS) to measure the methane concentrations in air at different upper/lower thresholds, with different levels of precision, and respond at different rates to changes in methane concentrations. These relatively small and low-powered units can now be deployed near methane emission sites to investigate how instrument response affects emission quantification.
Both calibration and response experiments indicate the INIR has little practical use for measuring methane concentrations less than 500 ppm. The INIR sensor was included as part of the WATCH4ERS instrumentation as is has been reported that fast-responding sensors are able to distinguish high-concentration and small-volume “bubbles” within the plume [21] and it is currently unclear if sensors with higher detection limits, such as the SGX INIR, are fast enough to detect these. It is clear from our results that the INIR does not respond fast enough to be used as a downwind sensor.
The MOx sensor used here has been shown to have a logarithmic response to methane concentration change between background and 600 ppm, although previous literature suggests that response behavior is specific to individual sensors and linear and exponential responses have been reported [10,11,14]. Of note here is that the change in concentration during the calibration experiment was gradual (Figure 2) and the response of the MOx sensor passively sampling air, as presented here, can change over time fast enough to generate representative values for concentration measurement (Figure 3). The MOx response was found to be not fast enough when exposed to rapidly changing methane concentrations (Figure 5). It is strongly suggested here that a MOx mounted to passively sample air cannot respond fast enough to report emissions that either change on a sub-minute time frame or in variable winds. However, novel calibration methods [25], increased time averaging, or pumping air to the MOx sensors could overcome the issues and these sensors will continue to be tested as part of the WATCH4ERS unit.
The NDIR sensor reported linear change to methane concentration between background and 600 ppm, although there was a noticeable lag in reporting changing concentration especially at higher values (> 300 ppm). During the plume test, the NDIR responded to all plumes released and individual peaks could be observed throughout the experiment even when the plumes were released 5 s apart. Our data suggest the NDIR takes between 12 and 18 seconds to respond to end plume and the broad-lower peak reported indicates a slower overall response than the TDLAS sensor. The NDIR used here is also sensitive to other gases (N2O and CO2) and was tested in a controlled environment, so data output in a non-controlled environment may vary. However, given this passive instrument costs, 3 % of the TDLAS, it is a potentially useful sensors within the WATCH4ERS unit.
The TDLAS unit has been shown to respond to changes instantly in methane concentration and likely to be most useful dataset generated by the WATCH4ERS unit for dispersion modelling. Despite this, the cost of the instrument makes it prohibitively expensive to deploy units at every facility emitting methane globally and unrealistic option for widespread distribution. As such, the WATCH4ERS units will continue testing sensors to determine if operational modifications (e.g. pumps on the MOX sensors) can be installed or deployment locations optimized (e.g. INIR located nearer the sources) to better understand how lower-cost instrumentation can be used to detect, localize and quantify methane emissions.
5. Conclusions
This study presents a holistic description of sensor development, system incorporation, and programming code needed to integrate four methane sensing platforms (metal oxide sensors, a non-dispersive infrared sensor, an integrated infrared sensor, and a tunable diode laser absorption spectrometer) into a single measurement unit. Future work includes optimizing the WATCH4ERS for size so that they can be installed on mobile platforms and can be used to investigate spatial-temporal variability in methane concentrations.
Author Contributions
For research articles with several authors, a short paragraph specifying their individual contributions must be provided. The following statements should be used “Conceptualization, S.N.R. and J.C.R.; methodology, S.N.R., J.C.R., E.K., M.M. and F.C.; software, S.N.R., J.C.R. and E.K.; validation, S.N.R., J.C.R., M.M., F.C and E.K.; formal analysis, S.N.R. and E.K.; investigation, S.N.R. and E.K.; writing—original draft preparation, S.N.R. and E.K.; writing—review and editing, S.N.R., J.C.R., M.M., F.C, E.L., B.R., K.L., D.Z. and E.K.; supervision, S.N.R., K.L. and D.Z.; project administration, K.L. and D.Z.; funding acquisition, K.L. and D.Z. All authors have read and agreed to the published version of the manuscript.
Funding
This project has been funded by the U.S. Department of Energy's Office of Fossil Energy and Carbon Management (FECM) project # DE-FE0032276 “Capabilities Enhancement for Methane Emissions Technology Evaluation Center (METEC) to Decarbonize Natural Gas Resources”.
Institutional Review Board Statement
Not applicable.
Informed Consent Statement
Not applicable.
Data Availability Statement
Data can be accessed by contacting the corresponding author at stuart.
riddick@colostate.edu.
Conflicts of Interest
The authors declare no conflicts of interest.
References
- Nisbet, E.G.; Fisher, R.E.; Lowry, D.; France, J.L.; Allen, G.; Bakkaloglu, S.; Broderick, T.J.; Cain, M.; Coleman, M.; Fernandez, J.; et al. Methane Mitigation: Methods to Reduce Emissions, on the Path to the Paris Agreement. Rev. Geophys. 2020, 58, e2019RG000675. [Google Scholar] [CrossRef]
- IPCC Climate Change 2022: Impacts, Adaptation and Vulnerability. Contribution of Working Group II to the Sixth Assessment Report of the Intergovernmental Panel on Climate Change [H.-O. Pörtner, D.C. Roberts, M. Tignor, E.S. Poloczanska, K. Mintenbeck, A. Alegría, M. Craig, S. Langsdorf, S. Löschke, V. Möller, A. Okem, B. Rama (Eds.)].; Cambridge University Press.: Cambridge University Press, Cambridge, UK and New York, NY, USA, 2022; ISBN 978-1-00-932584-4. [Google Scholar]
- Varon, D.J.; Jacob, D.J.; Hmiel, B.; Gautam, R.; Lyon, D.R.; Omara, M.; Sulprizio, M.; Shen, L.; Pendergrass, D.; Nesser, H.; et al. Continuous Weekly Monitoring of Methane Emissions from the Permian Basin by Inversion of TROPOMI Satellite Observations. Atmos. Chem. Phys. 2023, 23, 7503–7520. [Google Scholar] [CrossRef]
- Barkley, Z.; Davis, K.; Miles, N.; Richardson, S.; Deng, A.; Hmiel, B.; Lyon, D.; Lauvaux, T. Quantification of Oil and Gas Methane Emissions in the Delaware and Marcellus Basins Using a Network of Continuous Tower-Based Measurements. Atmos. Chem. Phys. 2023, 23, 6127–6144. [Google Scholar] [CrossRef]
- Nisbet, E.; Weiss, R. Top-Down Versus Bottom-Up. Science 2010, 328, 1241–1243. [Google Scholar] [CrossRef] [PubMed]
- Riddick, S.N.; Ancona, R.; Cheptonui, F.; Bell, C.S.; Duggan, A.; Bennett, K.E.; Zimmerle, D.J. A Cautionary Report of Calculating Methane Emissions Using Low-Cost Fence-Line Sensors. Elementa: Science of the Anthropocene 2022, 10, 00021. [Google Scholar] [CrossRef]
- Riddick, S.N.; Cheptonui, F.; Yuan, K.; Mbua, M.; Day, R.; Vaughn, T.L.; Duggan, A.; Bennett, K.E.; Zimmerle, D.J. Estimating Regional Methane Emission Factors from Energy and Agricultural Sector Sources Using a Portable Measurement System: Case Study of the Denver–Julesburg Basin. Sensors 2022, 22, 7410. [Google Scholar] [CrossRef] [PubMed]
- Hodgkinson, J.; Tatam, R.P. Optical Gas Sensing: A Review. Meas. Sci. Technol. 2013, 24, 012004. [Google Scholar] [CrossRef]
- Maity, A.; Maithani, S.; Pradhan, M. Cavity Ring-down Spectroscopy: Recent Technological Advances and Applications. In Molecular and Laser Spectroscopy; Elsevier, 2020; pp. 83–120 ISBN 978-0-12-818870-5.
- Eugster, W.; Kling, G.W. Performance of a Low-Cost Methane Sensor for Ambient Concentration Measurements in Preliminary Studies. Atmospheric Measurement Techniques 2012, 5, 1925–1934. [Google Scholar] [CrossRef]
- Riddick, S.N.; Mauzerall, D.L.; Celia, M.; Allen, G.; Pitt, J.; Kang, M.; Riddick, J.C. The Calibration and Deployment of a Low-Cost Methane Sensor. Atmospheric Environment 2020, 230, 117440. [Google Scholar] [CrossRef]
- Wastine, B.; Hummelgård, C.; Bryzgalov, M.; Rödjegård, H.; Martin, H.; Schröder, S. Compact Non-Dispersive Infrared Multi-Gas Sensing Platform for Large Scale Deployment with Sub-Ppm Resolution. Atmosphere 2022, 13, 1789. [Google Scholar] [CrossRef]
- Shah, A.; Laurent, O.; Lienhardt, L.; Broquet, G.; Rivera Martinez, R.; Allegrini, E.; Ciais, P. Characterising the Methane Gas and Environmental Response of the Figaro Taguchi Gas Sensor (TGS) 2611-E00. Atmos. Meas. Tech. 2023, 16, 3391–3419. [Google Scholar] [CrossRef]
- Shah, A.; Laurent, O.; Broquet, G.; Philippon, C.; Kumar, P.; Allegrini, E.; Ciais, P. Determining Methane Mole Fraction at a Landfill Site Using the Figaro Taguchi Gas Sensor 2611-C00 and Wind Direction Measurements. Environ. Sci.: Atmos. 2024, 4, 362–386. [Google Scholar] [CrossRef]
- Cho, Y.; Smits, K.M.; Riddick, S.N.; Zimmerle, D.J. Calibration and Field Deployment of Low-Cost Sensor Network to Monitor Underground Pipeline Leakage. Sensors and Actuators B: Chemical 2022, 355, 131276. [Google Scholar] [CrossRef]
- Day, R.E.; Emerson, E.; Bell, C.; Zimmerle, D. Point Sensor Networks Struggle to Detect and Quantify Short Controlled Releases at Oil and Gas Sites. Sensors 2024, 24, 2419. [Google Scholar] [CrossRef] [PubMed]
- White, J.U. Long Optical Paths of Large Aperture. J. Opt. Soc. Am. 1942, 32, 285. [Google Scholar] [CrossRef]
- Jayarathne, J.R.R.N.; Chamindu Deepagoda, T.K.K.; Clough, T.J.; Nasvi, M.C.M.; Thomas, S.; Elberling, B.; Smits, K. Gas-Diffusivity Based Characterization of Aggregated Agricultural Soils. Soil Sci. Soc. Am. j. 2020, 84, 387–398. [Google Scholar] [CrossRef]
- Vaughn, T.L.; Ross, C.; Zimmerle, D.J.; Bennett, K.E.; Harrison, M.; Wilson, A.; Johnson, C. Open-Source High Flow Sampler for Natural Gas Leak Quantification Available online:. Available online: https://energy.colostate.edu/wp-content/uploads/sites/28/2022/08/FACF_High_Flow_Final_Report_ada.pdf (accessed on 26 October 2022).
- Jayarathne, J.R.R.N.; Zimmerle, D.; Kolodziej, R.S.; Riddick, S.; Smits, K.M. Flow and Transport of Methane from Leaking Underground Pipelines: Effects of Soil Surface Conditions and Implications for Natural Gas Leak Classification. Environ. Sci. Technol. Lett. 0003. [Google Scholar] [CrossRef]
- Riddick, S.N.; Mbua, M.; Brouwer, R.; Emerson, E.W.; Anand, A.; Kiplimo, E.; Ojomu, S.; Lo, J.-H.; Zimmerle, D.J. Comparison of Sub-Ppm Instrument Response Suggests Higher Detection Limits Could Be Used to Quantify Methane Emissions from Oil and Gas Infrastructure. Sensors 2024, 24, 3407. [Google Scholar] [CrossRef] [PubMed]
- Schiff, H.I.; Mackay, G.I.; Bechara, J. The Use of Tunable Diode Laser Absorption Spectroscopy for Atmospheric Measurements. Res. Chem. Intermed. 1994, 20, 525–556. [Google Scholar] [CrossRef]
- Southern Cross ’46 Hawk Natural Gas Detector Available online:. Available online: https://irp-cdn.multiscreensite.com/c5a1d295/files/uploaded/Hawk-Brochure.pdf (accessed on 3 July 2024).
- Arduino LCD 1602 (and Similar) Databus Sniffer Available online:. Available online: https://forum.arduino.cc/t/lcd-1602-and-similar-databus-sniffer/675769 (accessed on 19 September 2024).
- Kiplimo, E.; Riddick, S.N.; Mbua, M.; Upreti, A.; Anand, A.; Zimmerle, D.J. Addressing Low-Cost Methane Sensor Calibration Shortcomings with Machine Learning. Atmosphere 2024, 15, 1313. [Google Scholar] [CrossRef]
Figure 1.
Wiring for the Figaro TGS2600 and 2611 metal oxide sensors.
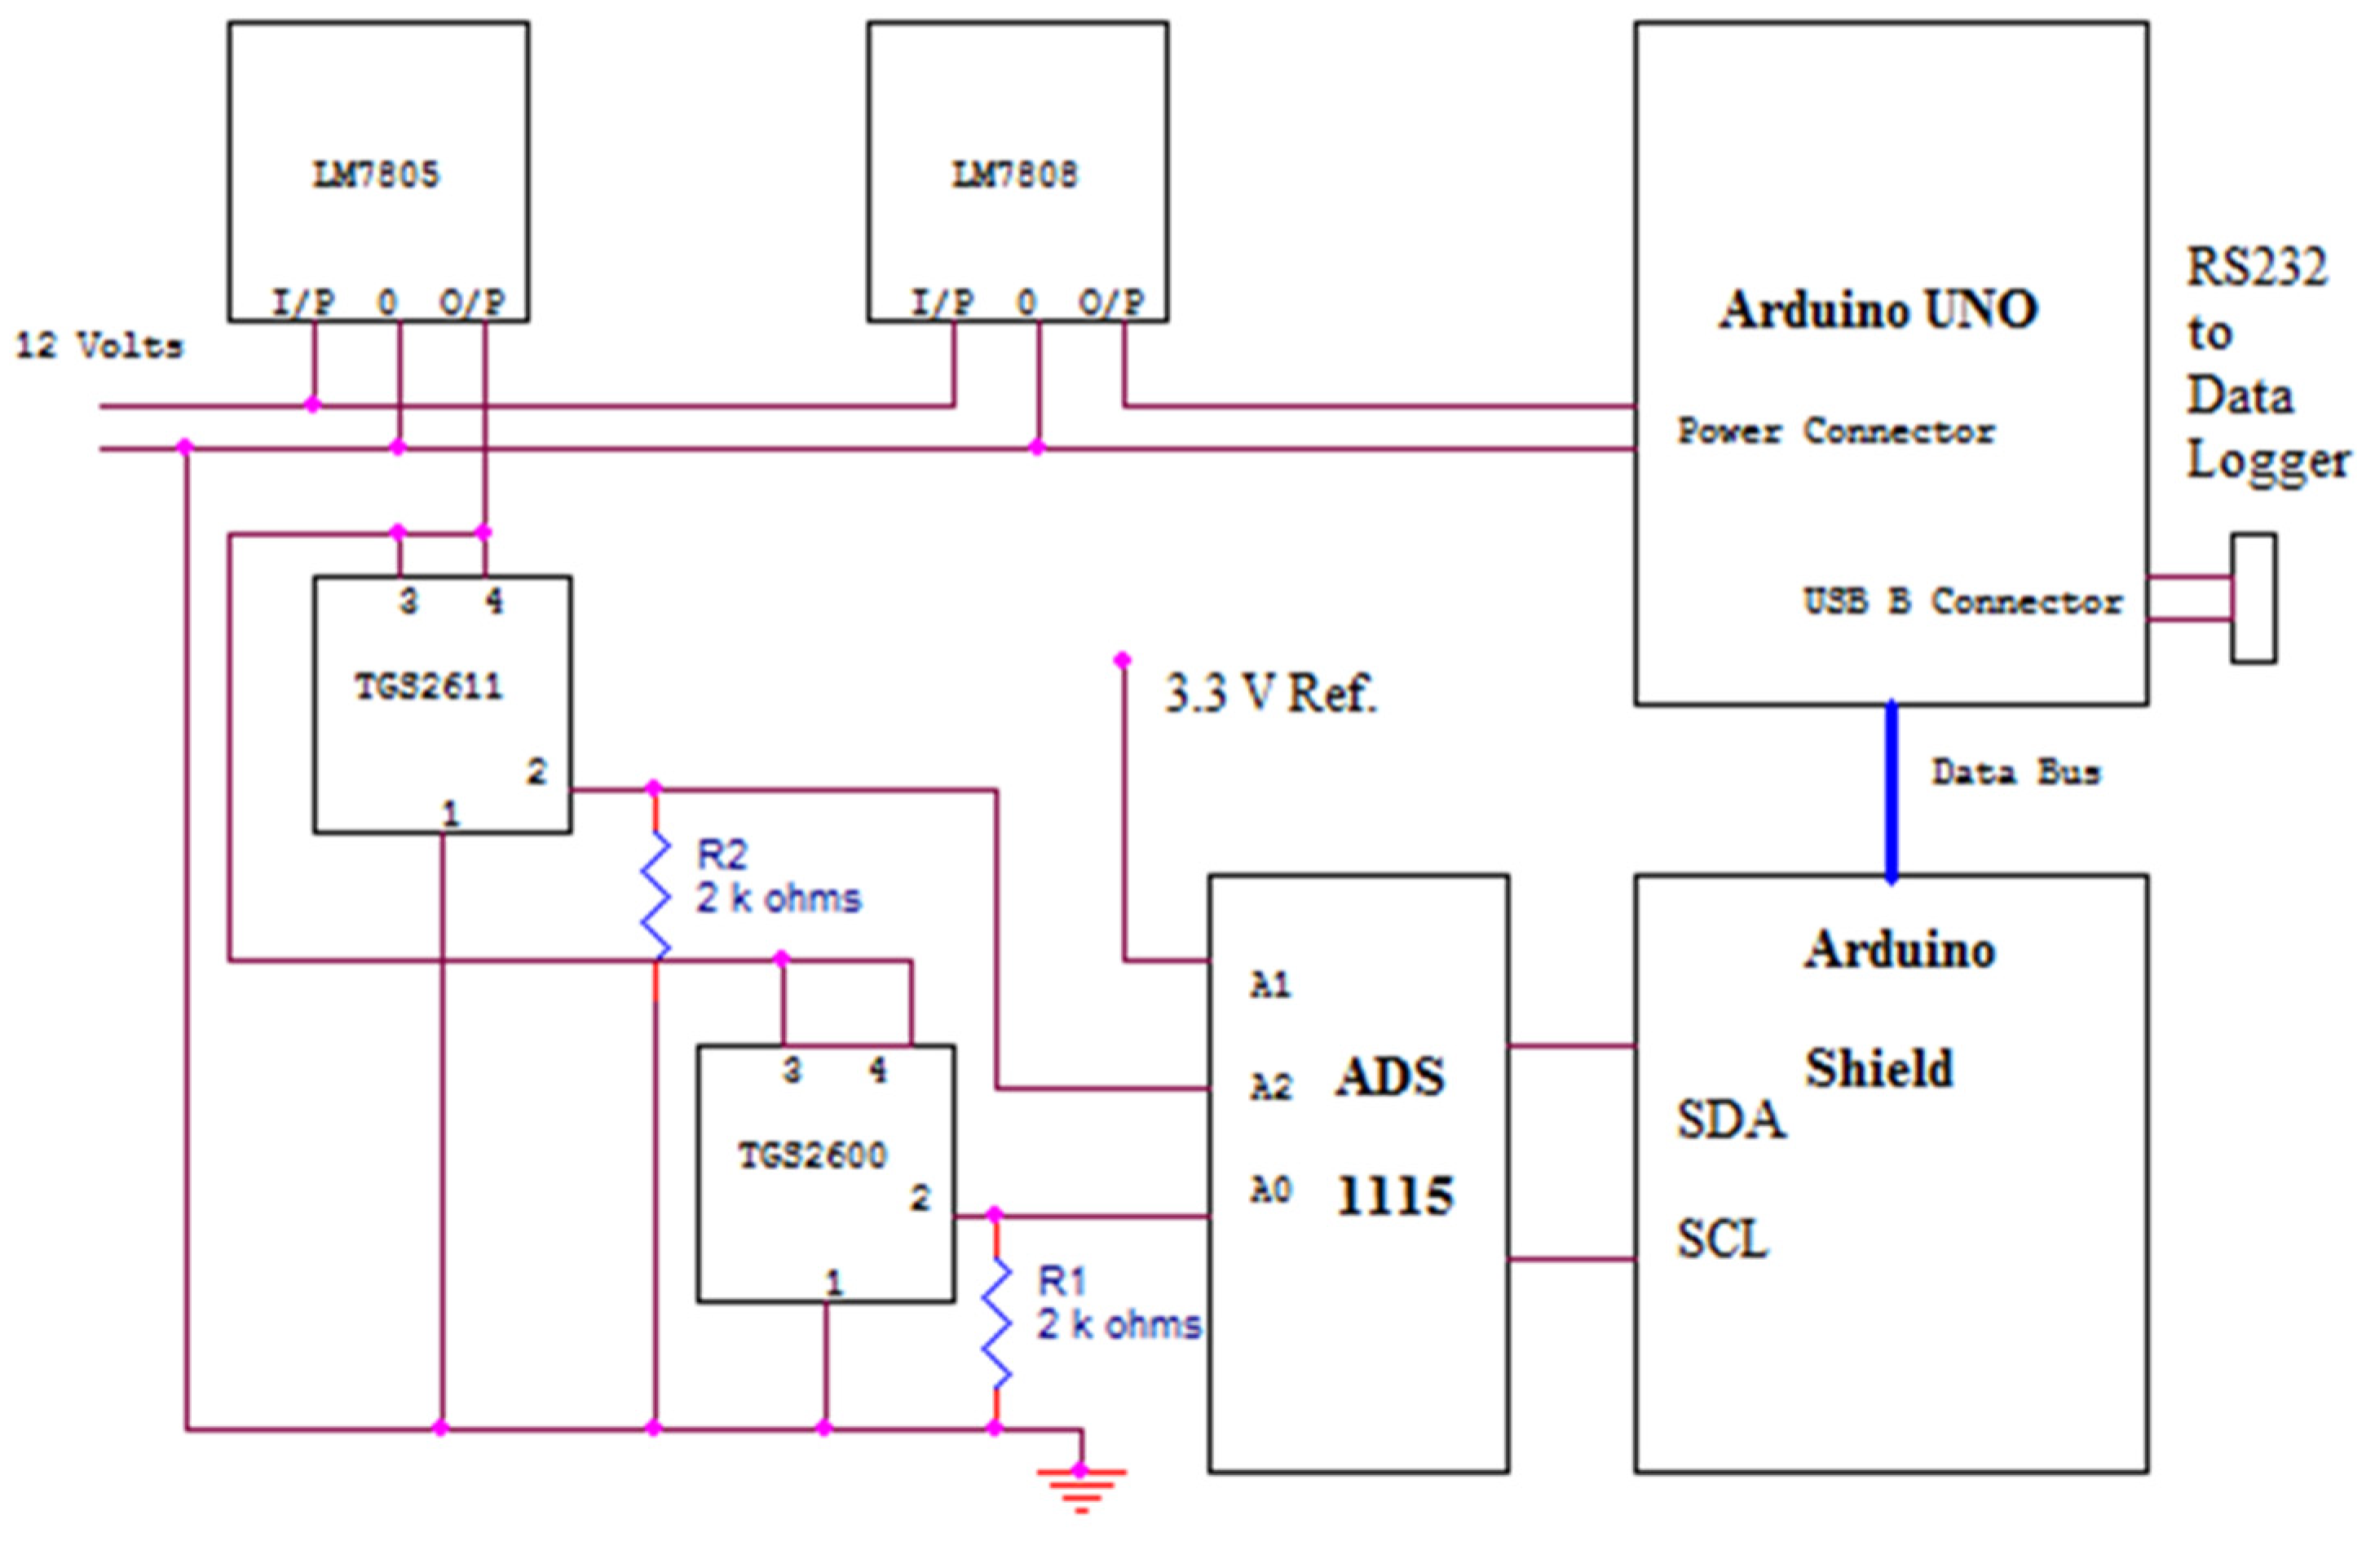
Figure 2.
Methane concentrations measured by the TDLAS during the MOx, NDIR and INIR calibration for a 1 g CH4 h-1 0.5% methane gas repeated over three times.
Figure 2.
Methane concentrations measured by the TDLAS during the MOx, NDIR and INIR calibration for a 1 g CH4 h-1 0.5% methane gas repeated over three times.
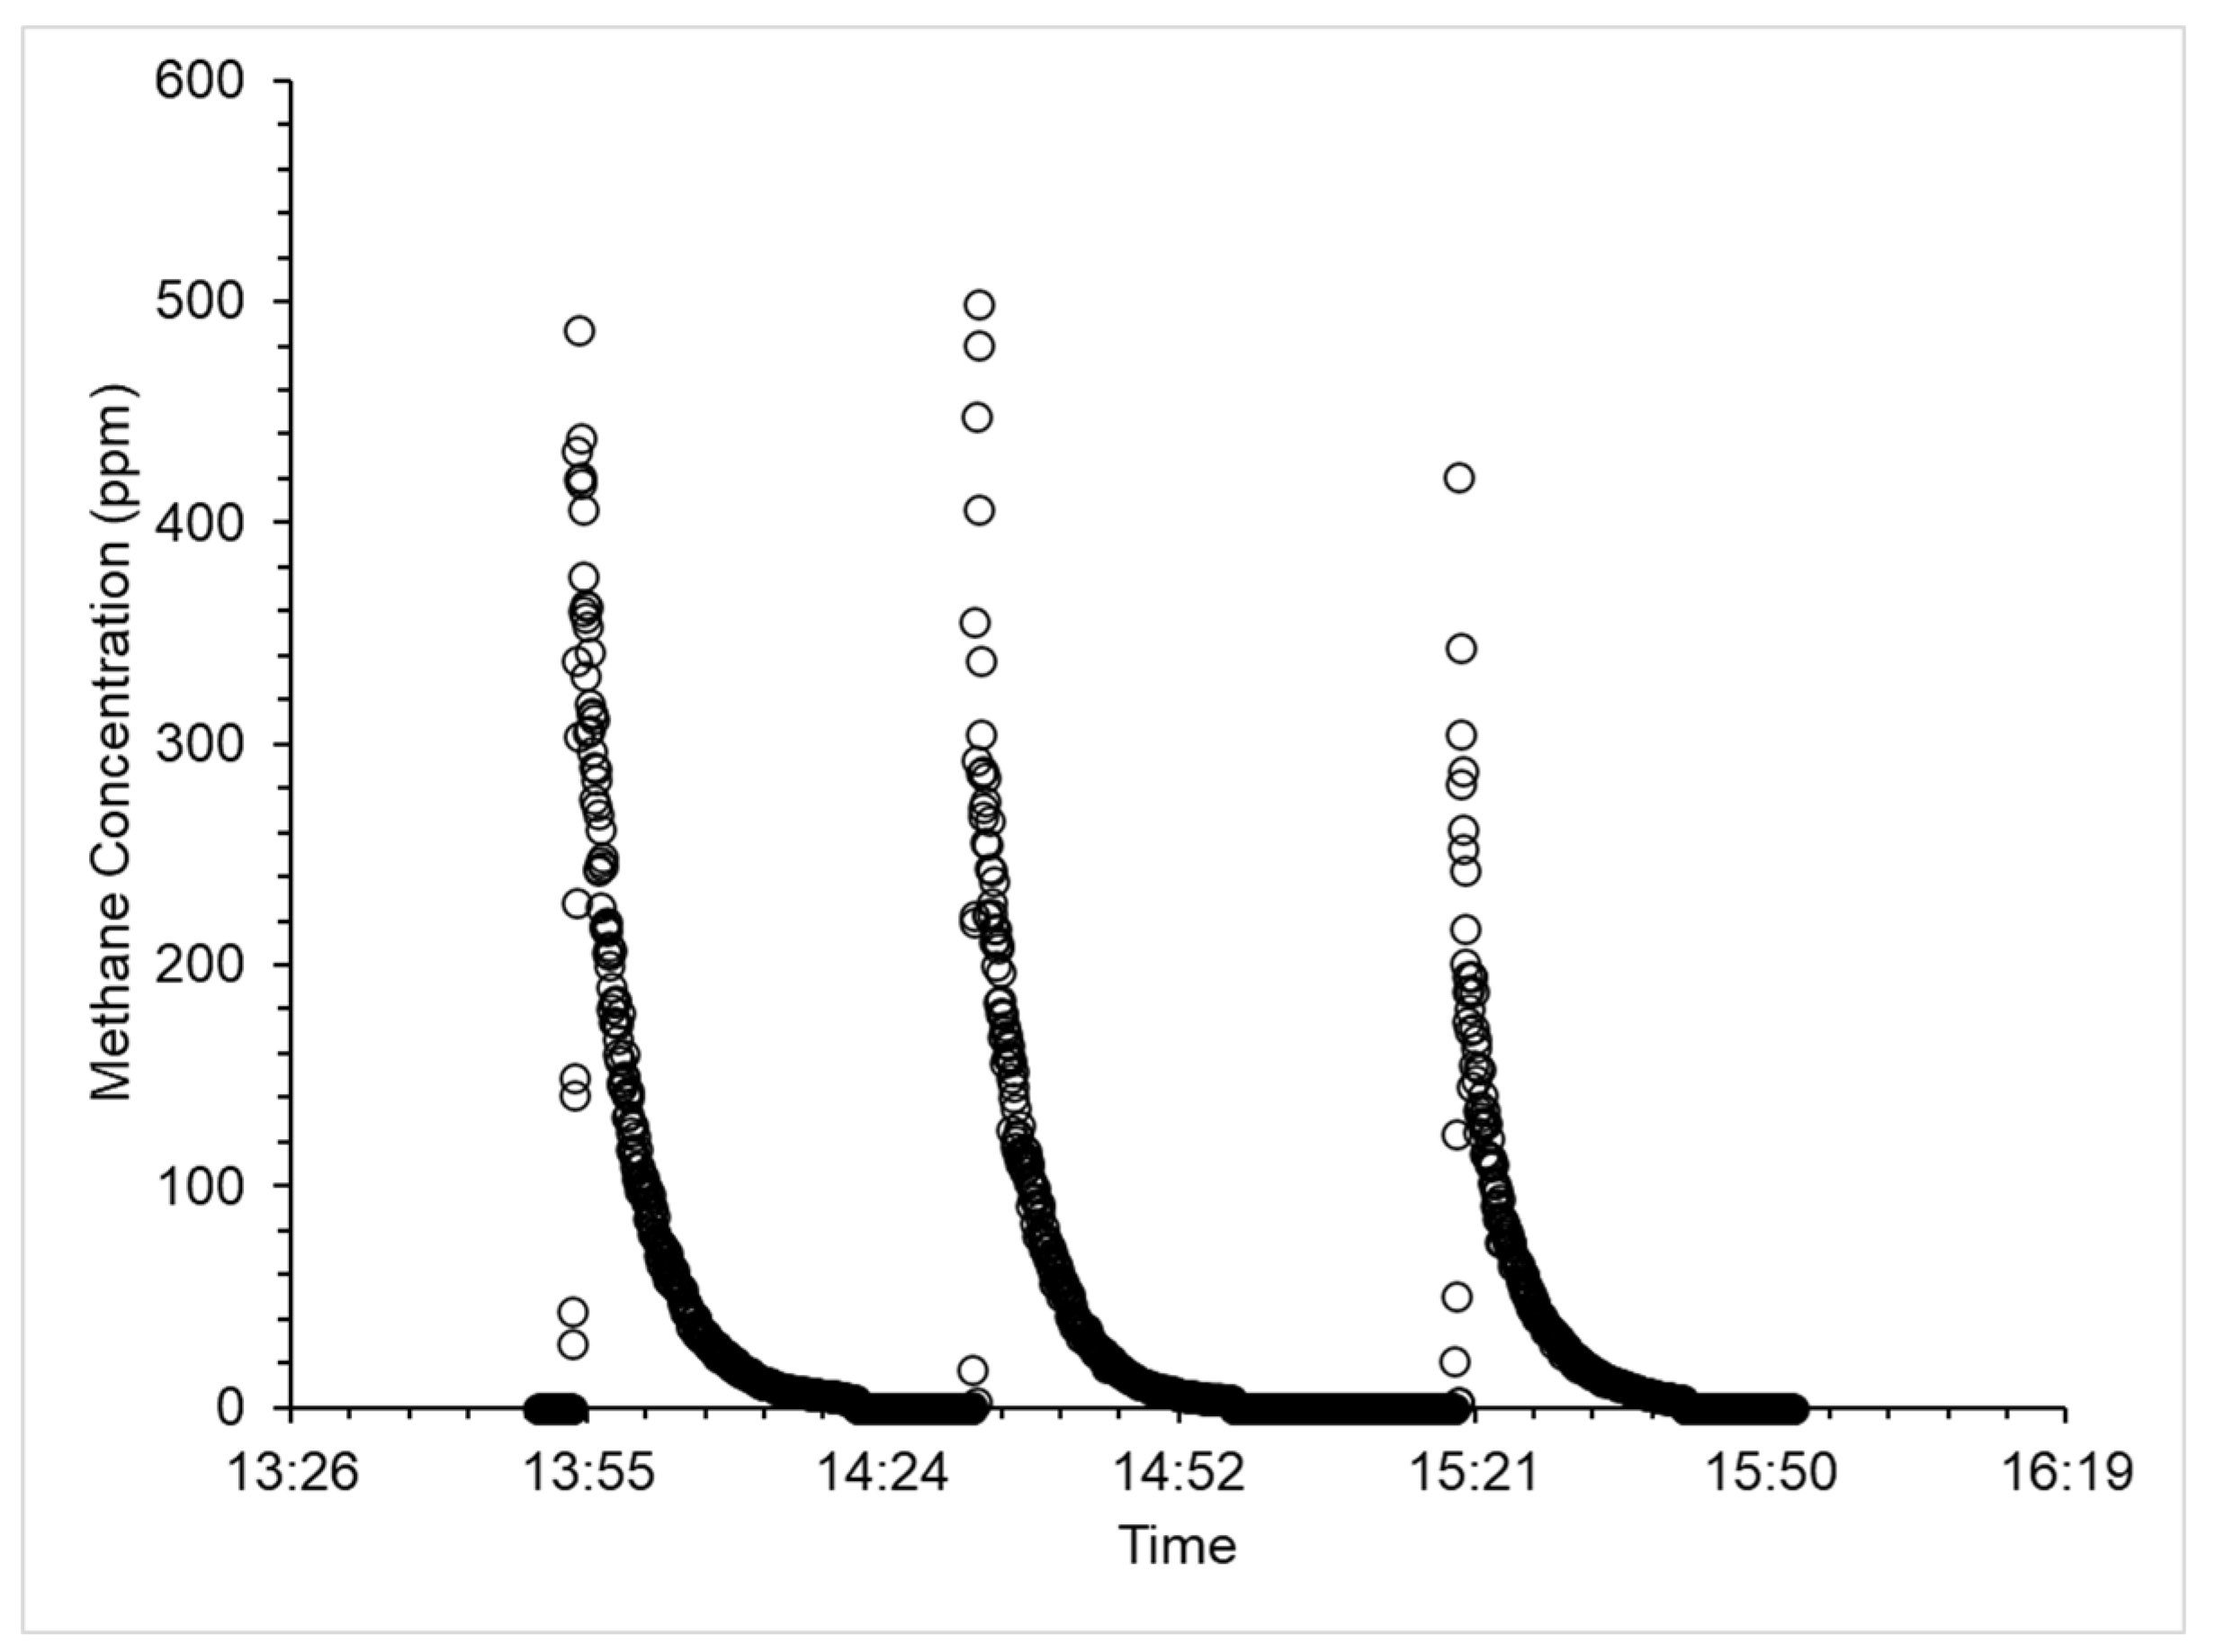
Figure 3.
The metal oxide (MOx) temperature and humidity corrected output sensor output data plotted against the TDLAS methane concentration data (ppm).
Figure 3.
The metal oxide (MOx) temperature and humidity corrected output sensor output data plotted against the TDLAS methane concentration data (ppm).
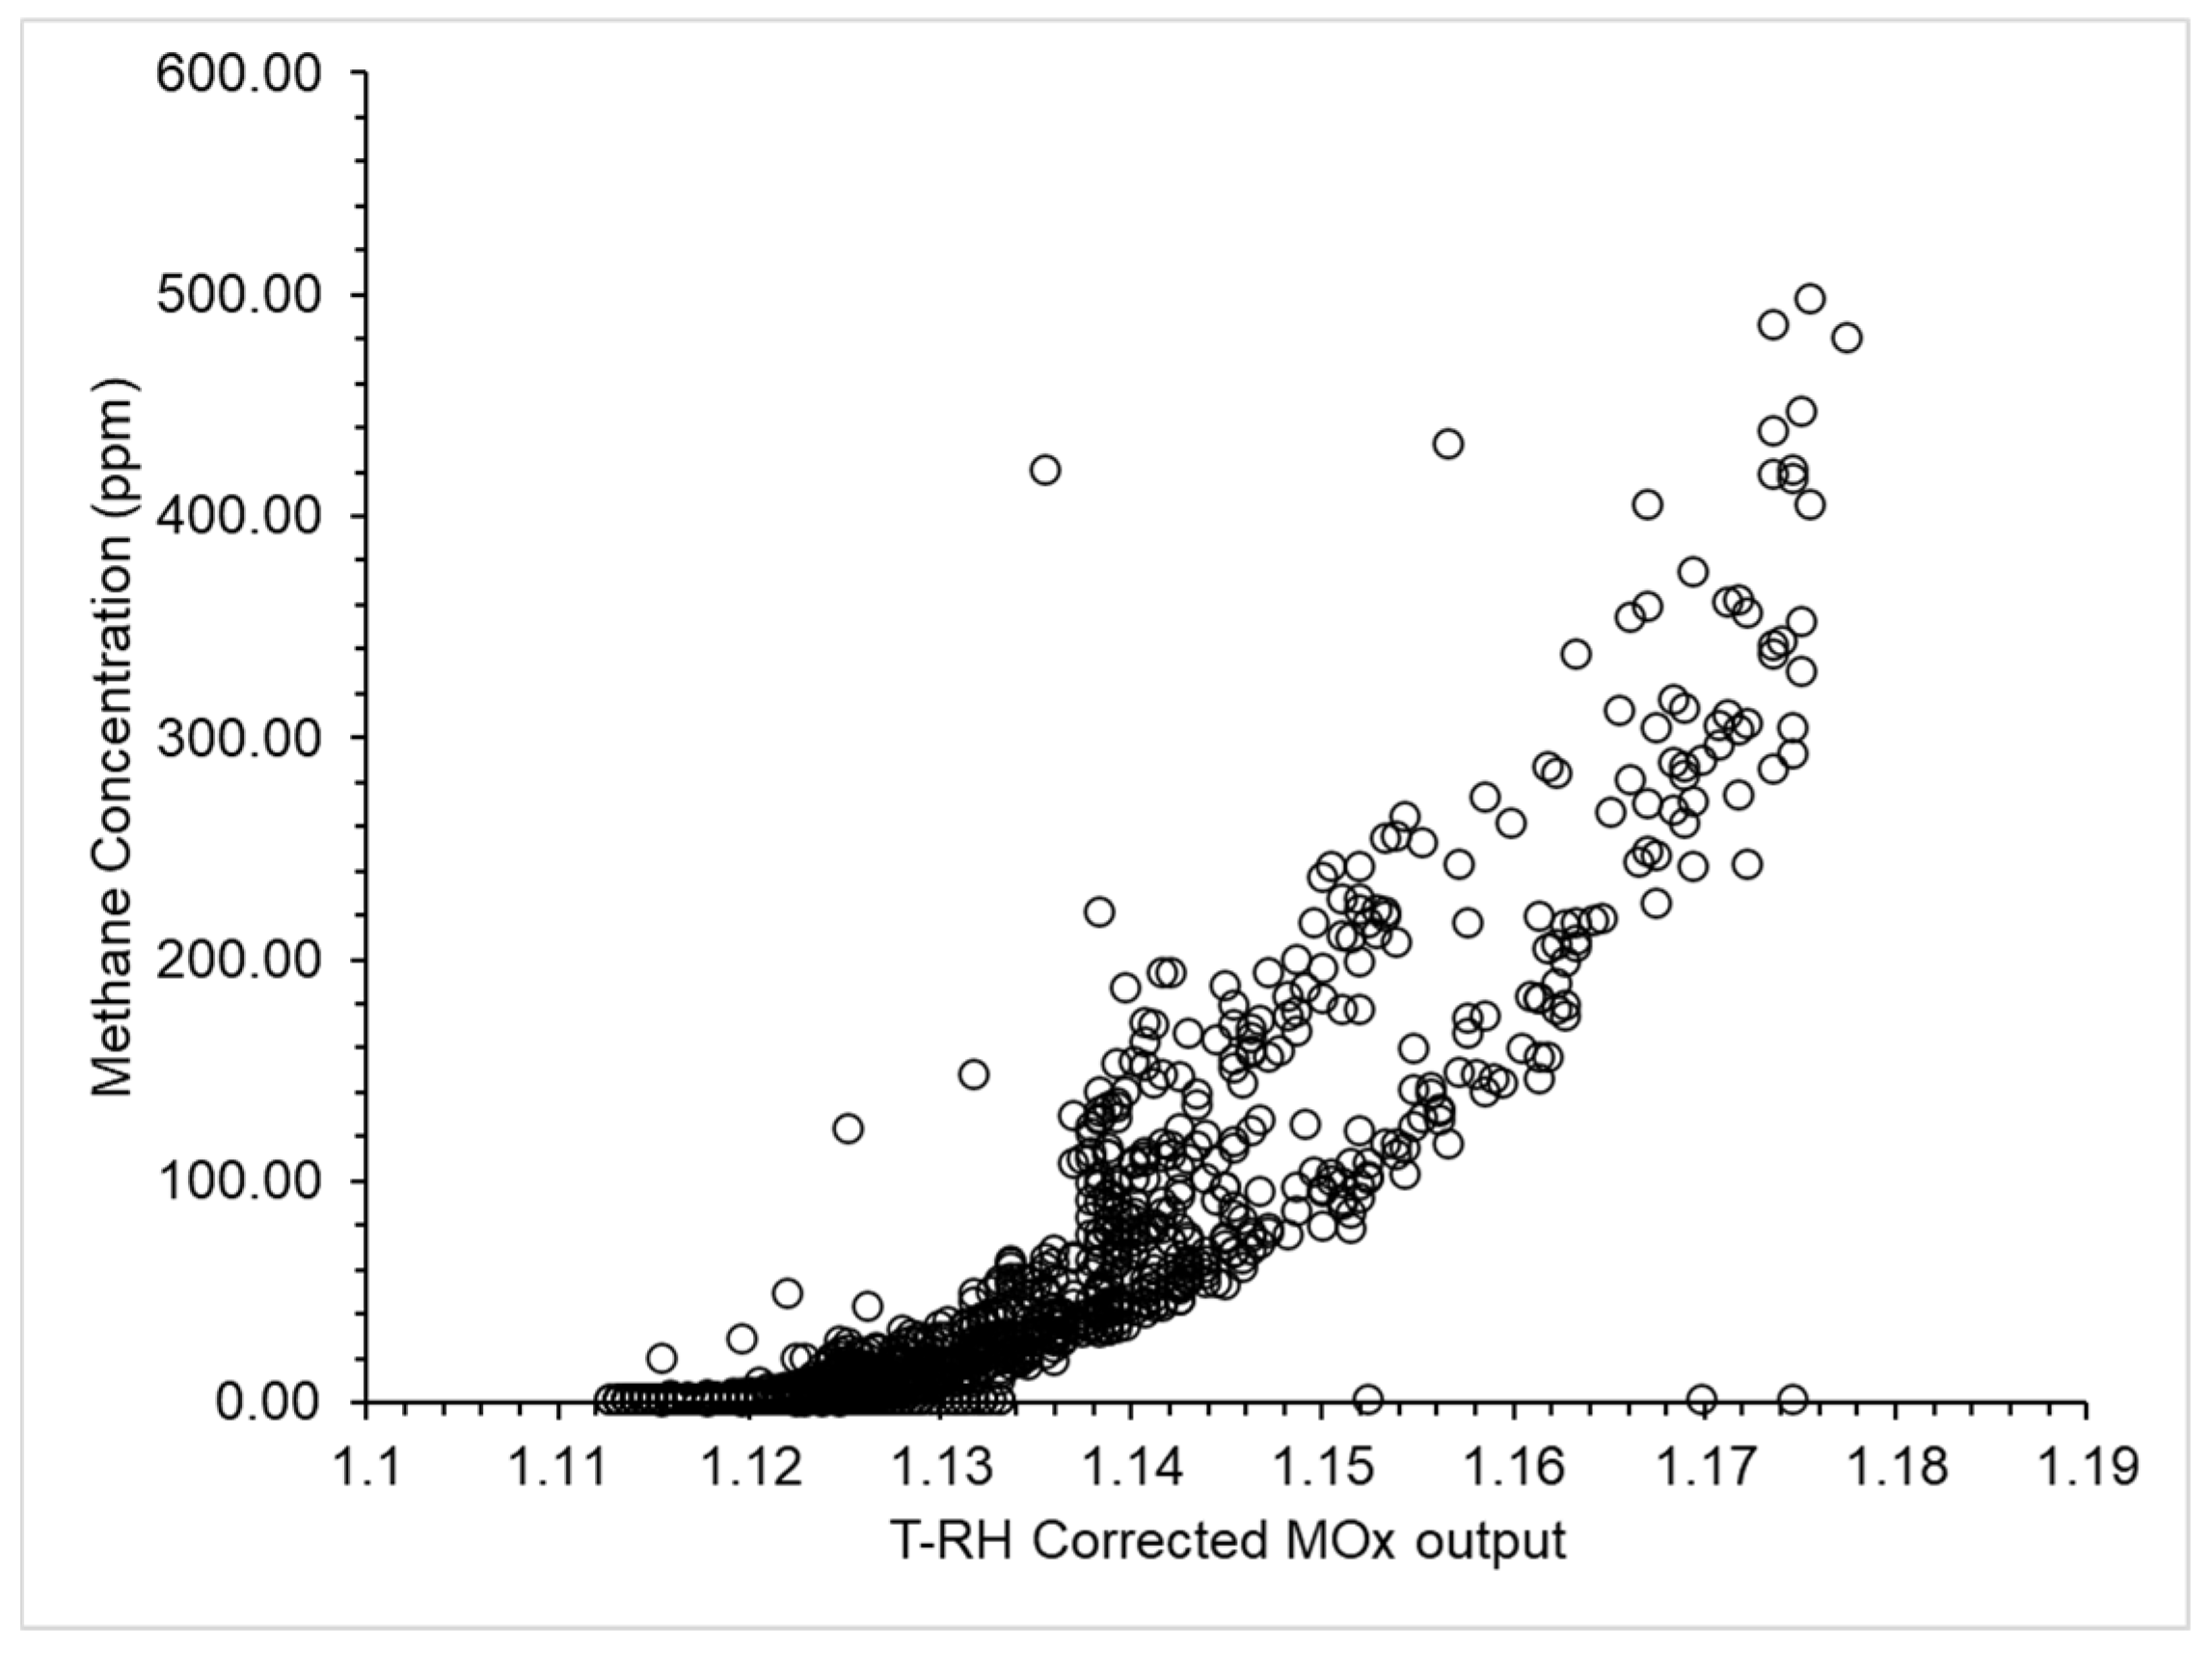
Figure 4.
The Non-dispersive infrared (NDIR) sensor output data plotted against the TDLAS methane concentration data (ppm).
Figure 4.
The Non-dispersive infrared (NDIR) sensor output data plotted against the TDLAS methane concentration data (ppm).
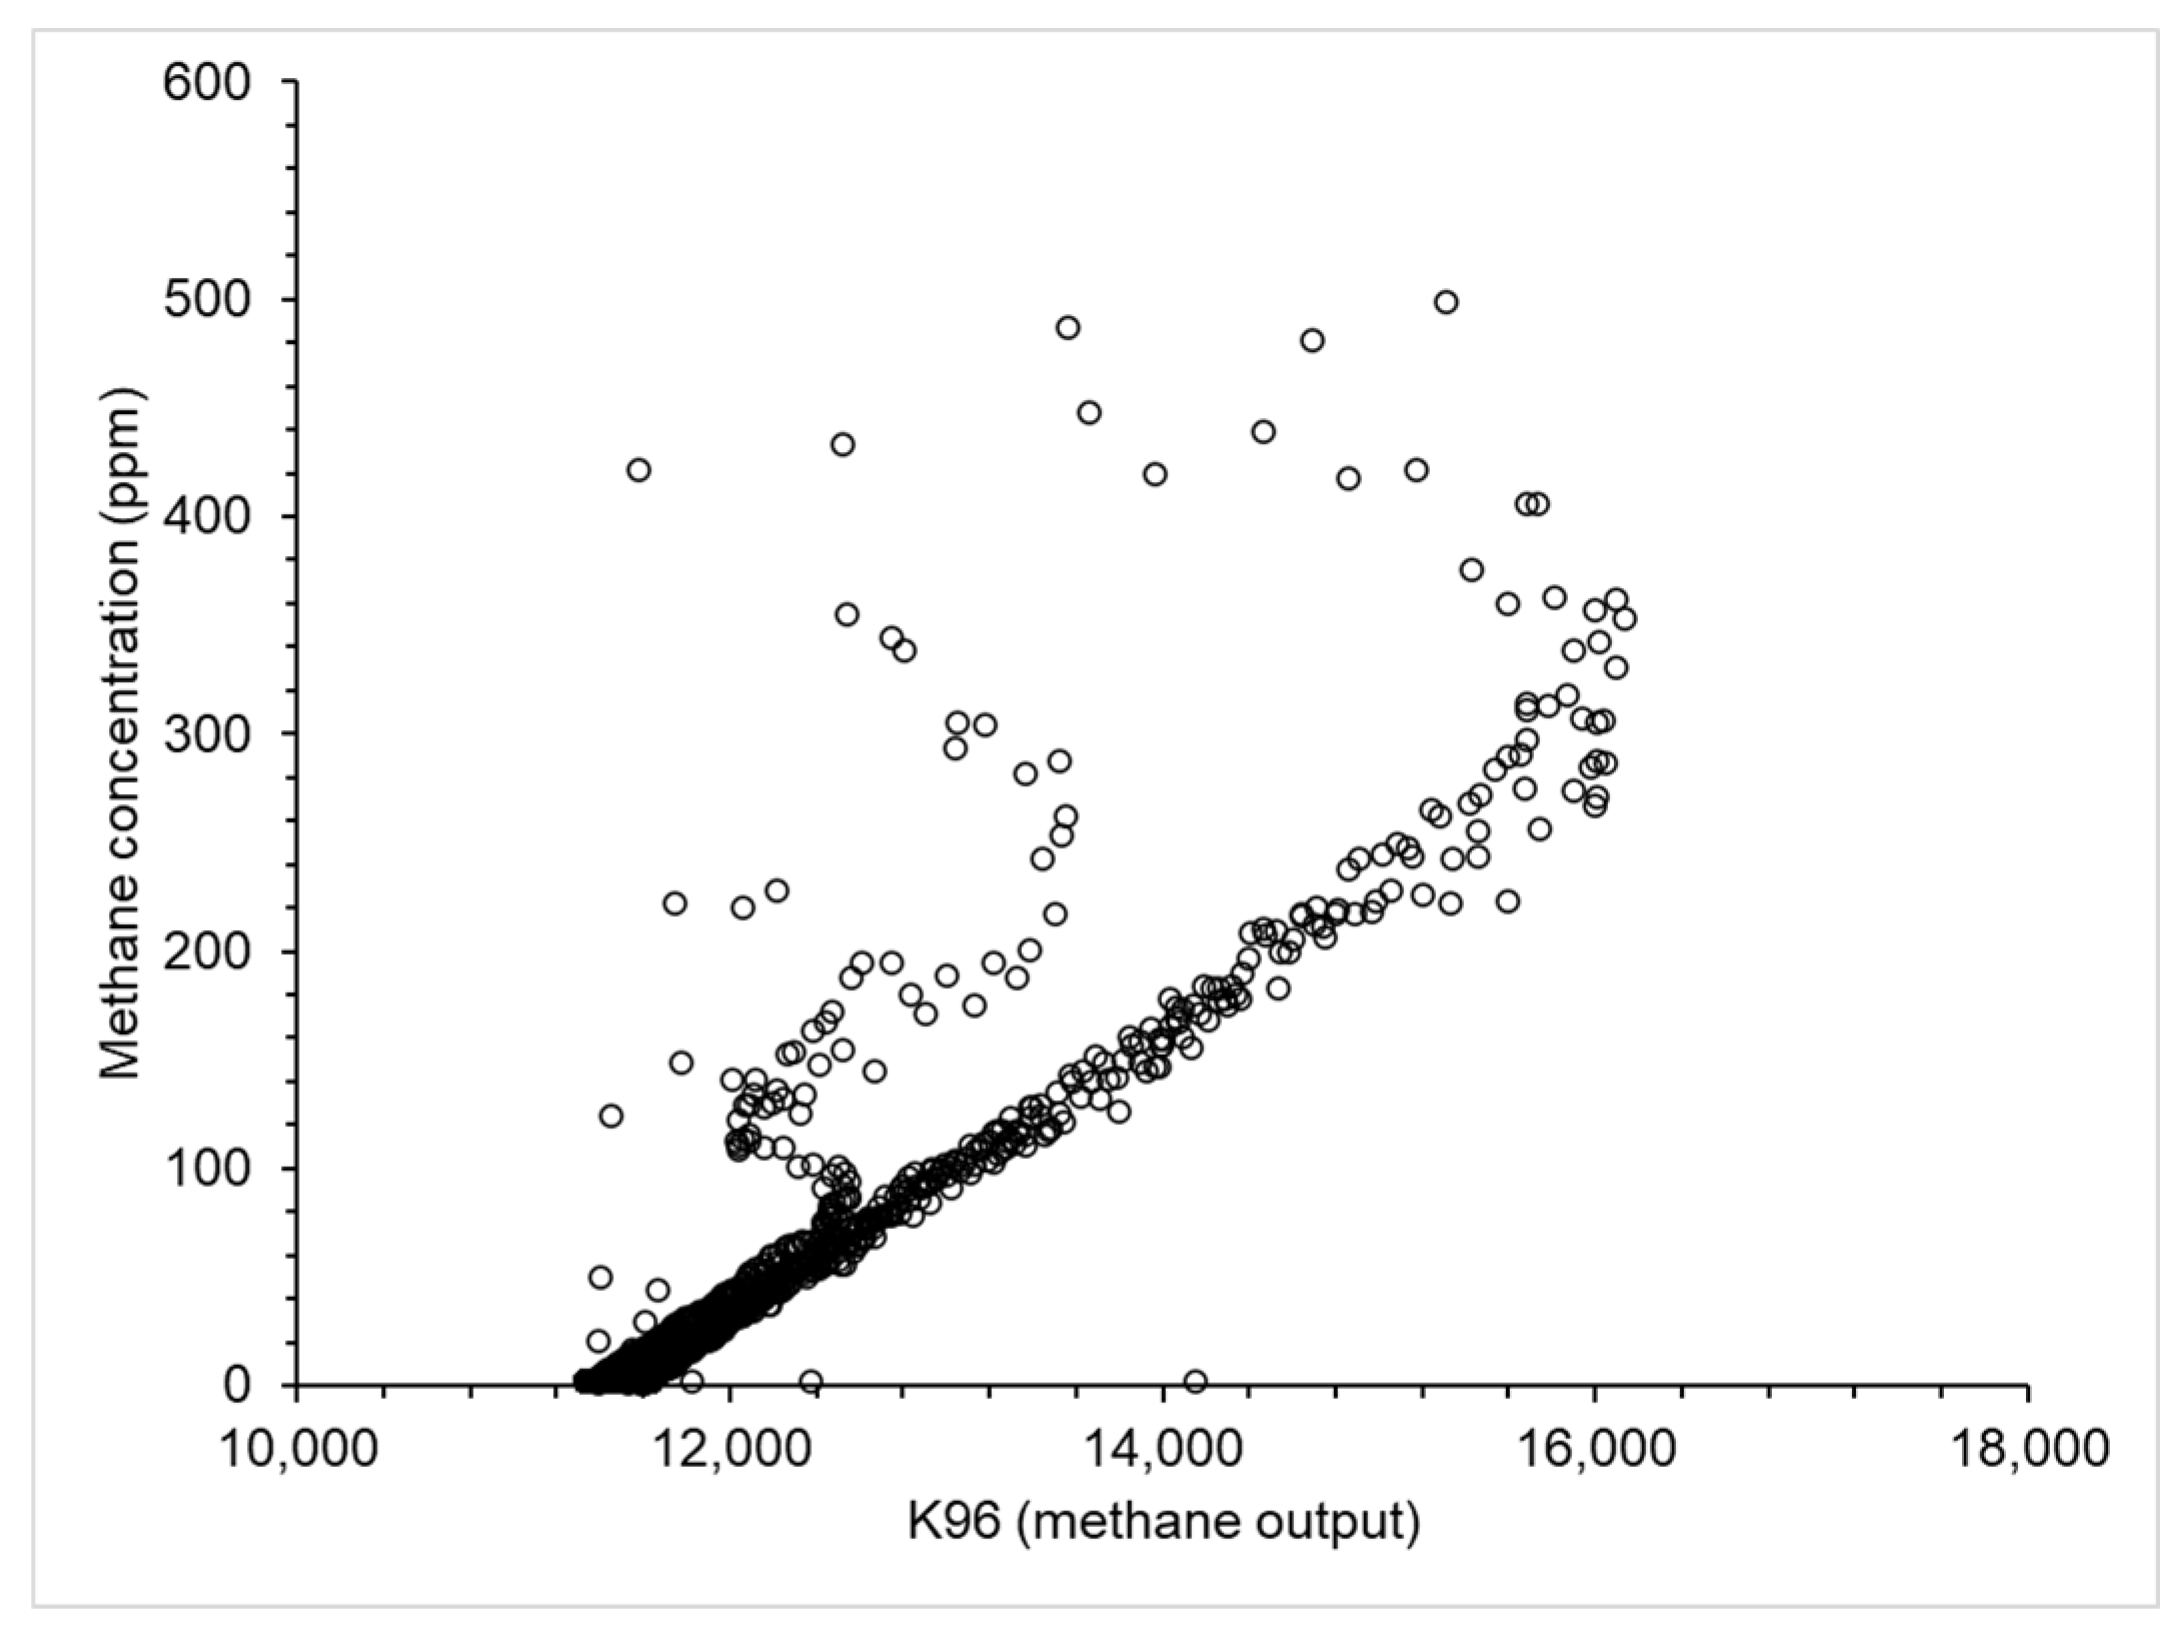
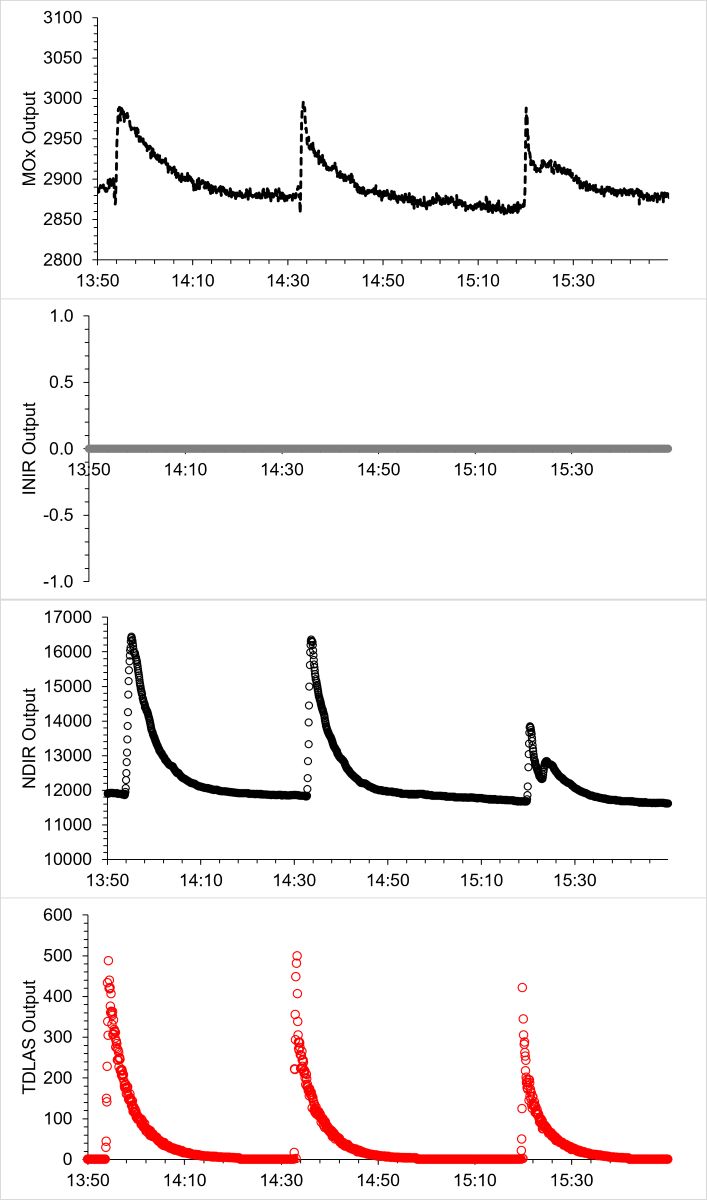
Figure 5.
Sensor response to methane released at 1 g CH4 h-1 released 0.5 m away and travelling at 3.5 m s-1. Sensors used were the Metal Oxide (MOx,), Non-dispersion Infrared (NDIR), and Tunable Diode Laser Absorption Spectrometer (TDLAS) sensors.
Figure 5.
Sensor response to methane released at 1 g CH4 h-1 released 0.5 m away and travelling at 3.5 m s-1. Sensors used were the Metal Oxide (MOx,), Non-dispersion Infrared (NDIR), and Tunable Diode Laser Absorption Spectrometer (TDLAS) sensors.
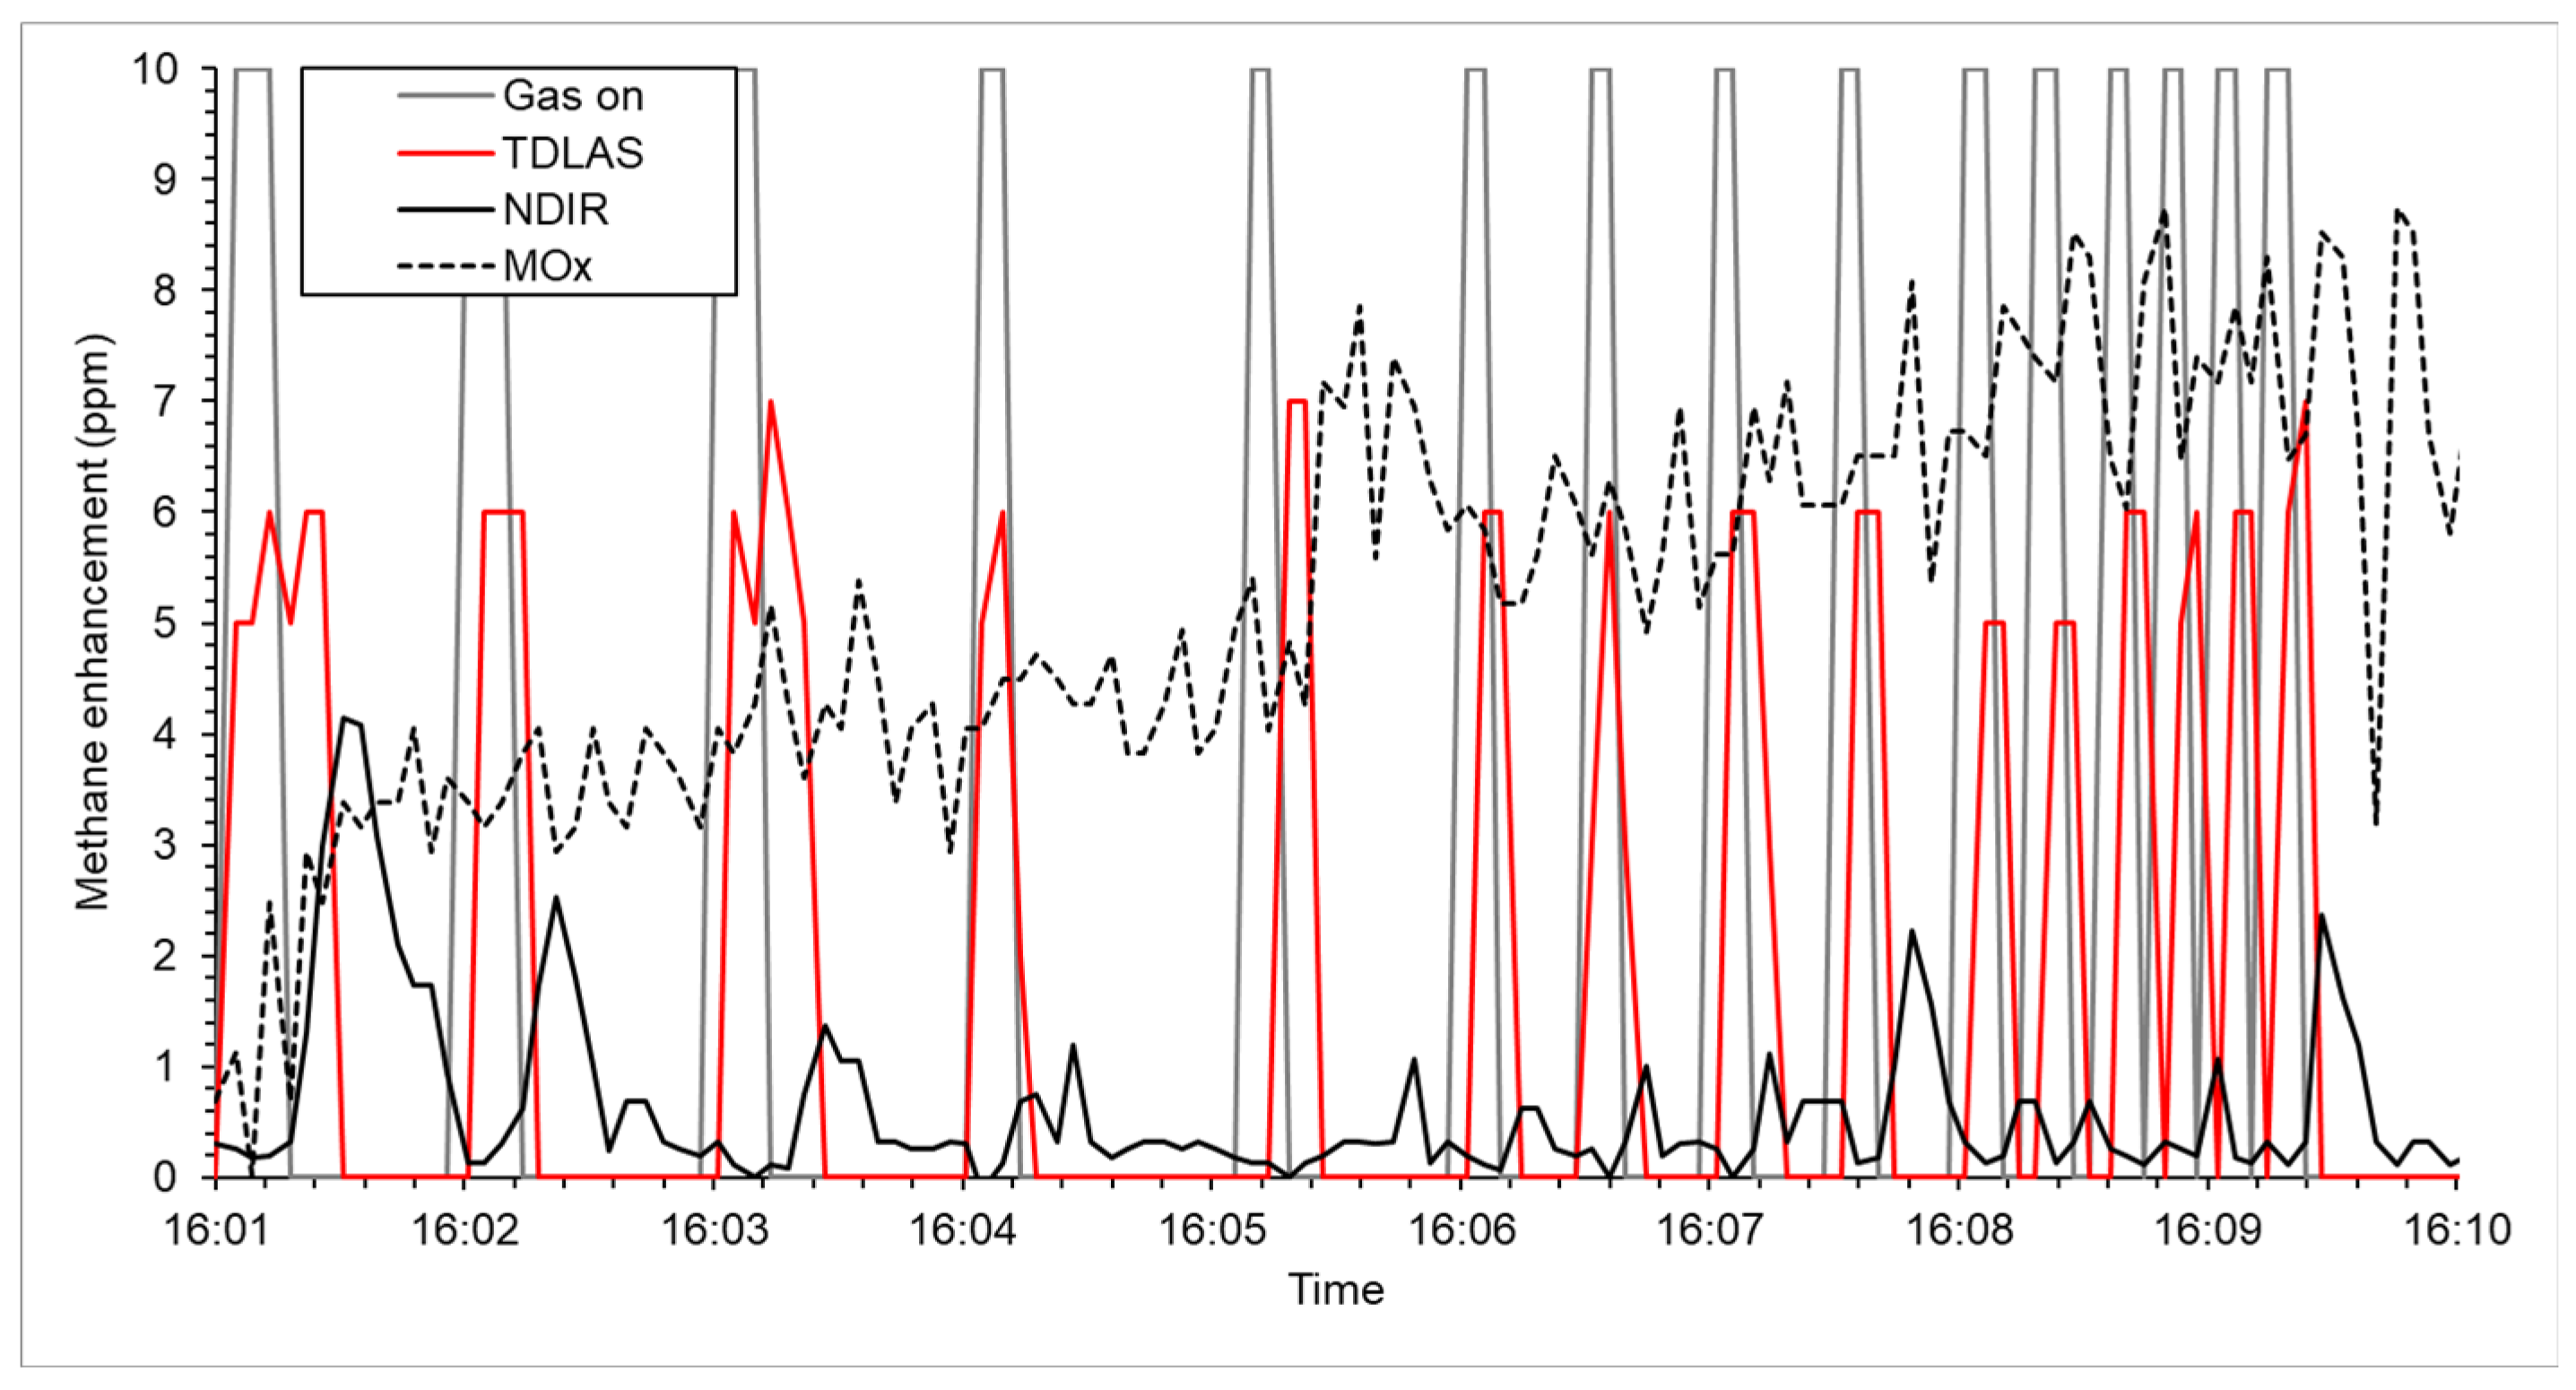

Table 1.
Headers of the text files written as output by the “AMMMU_Python_Code.py” code.
| Column | Header |
| 1 | HH:MM:SS |
| 2 | TGS2600 output (counts) |
| 3 | TGS2611 output (counts) |
| 4 | Reference output (counts) |
| 5 | K96 LPL (sum of CO2, N2O, and CH4 concentrations in ppm) |
| 6 | K96 SPL (CO2 concentration in ppm) |
| 7 | K96 MPL (H2O concentration in ppm) |
| 8 | K96 Pressure from BME280 sensor (10 Pa) |
| 9 | K96 Temperature from NTC0 (0.01 °C) |
| 10 | K96 Temperature from NTC1 (0.01 °C) |
| 11 | K96 Temperature from ADuC MCU (0.01 °C) |
| 12 | K96 RH from BME280 sensor (0.01 %) |
| 13 | Hawk output (CH4 concentration in ppm) |
| 14 | INIR output (CH4 concentration in ppm) |
| 15 | INIR Temperature (°C) |
| 16 | DHT11 Relative Humidity (%) |
| 17 | DHT Temperature (°C) |
Table 2.
Details of the five experiments conducted to investigate the response of the Metal Oxide (MOx,), Non-dispersion Infrared (NDIR), Integrated Infrared (INIR), and Tunable Diode Laser Absorption Spectrometer (TDLAS) sensors. Distance is the distance between the gas release point and the WATCH4ERS unit. Emission rate is the controlled emission rate of the gas (g CH4 h-1). The Duration ids the length of gas releases and the time between plume is the number of seconds between three consecutive releases.
| Experiment # | Distance (m) | Emission rate (g CH4 h-1) | Duration (s) | Time between plumes (s) |
| 1 | 0.5 | 1 | 10 | 50 |
| 2 | 0.5 | 1 | 5 | 55 |
| 3 | 0.5 | 1 | 5 | 30 |
| 4 | 0.5 | 1 | 5 | 15 |
| 5 | 0.5 | 1 | 5 | 5 |
Table 4.
The percentage of peaks observed (P), the average peak concentration (Av Peak) and the average time to detect the plume from initiation 0.5 m away.
Table 4.
The percentage of peaks observed (P), the average peak concentration (Av Peak) and the average time to detect the plume from initiation 0.5 m away.
| TDLAS | NDIR | MOx | |||||||
| Expt | P | Av Peak (ppm) | Av Lag (s) | # | Av Peak (ppm) | Av Lag (s) | # | Av Peak (ppm) | Av Lag (s) |
| 1 | 100 | 6.3 | 5 | 100 | 2.68 | 18 | 0 | N/A | N/A |
| 2 | 100 | 6.3 | 5 | 100 | 0.96 | 13 | 0 | N/A | N/A |
| 3 | 100 | 6.0 | 5 | 100 | 1.47 | 17 | 0 | N/A | N/A |
| 4 | 100 | 5.3 | 5 | 100 | 0.69 | 14 | 0 | N/A | N/A |
| 5 | 100 | 6.3 | 5 | 100 | 1.01 | 12 | 0 | N/A | N/A |
Disclaimer/Publisher’s Note: The statements, opinions and data contained in all publications are solely those of the individual author(s) and contributor(s) and not of MDPI and/or the editor(s). MDPI and/or the editor(s) disclaim responsibility for any injury to people or property resulting from any ideas, methods, instructions or products referred to in the content. |
© 2025 by the authors. Licensee MDPI, Basel, Switzerland. This article is an open access article distributed under the terms and conditions of the Creative Commons Attribution (CC BY) license (http://creativecommons.org/licenses/by/4.0/).
Copyright: This open access article is published under a Creative Commons CC BY 4.0 license, which permit the free download, distribution, and reuse, provided that the author and preprint are cited in any reuse.


