Preprint
Article

This version is not peer-reviewed.

Exploring Microbial Contamination in Water Sources in Limpopo Province and Gauteng Province

Submitted:

31 January 2025

Posted:

03 February 2025

You are already at the latest version

Abstract

Pollution of aquatic ecosystems is rising due to anthropogenic activities, with developing countries facing severe water contamination due to inadequate wastewater treatment, and limited access to clean water. This study investigates water microbial contamination in the Nandoni Dam, Thate Vondo Dam, Albasini Dam, the Xikundu Weir (Limpopo province), and the Orlando Dam (Gauteng province) in South Africa. Water quality was determined using possible human activities, physical parameters, and pathogenic indicators (Total coliforms (TC) and Escherichia coli (E. coli). TC and E. coli were detected using the Quanti-Tray®, and E. coli was characterized using multiplex Polymerase Chain Reaction (mPCR). The Vitek-2 automated system was used for isolate identification. The Electrical conductivity (EC) at all sites met South African water quality guidelines of DWAF and WHO, while other physical parameters (TDS, pH, and temperature) varied across the sites. TC levels exceeded the recommended limits and 85% of samples tested positive for E. coli. Five pathogenic E. coli were identified: Enterohaemorrhagic E. coli (EHEC), Enteropathogenic E. coli (EPEC), Enteroaggregative E. coli (EAEC), Enteroinvasive E. coli (EIEC), and Enterotoxigenic E. coli. Nandoni Dam and Orlando Dam showed a high diversity of bacterial species. Overall, the microbial quality of the assessed water was substandard.

Keywords: 
;  ;  ;  ;  

Introduction

Aquatic ecosystems are being severely polluted due to human activities, particularly in developing countries [1,2]. Rural and urban areas' lack of wastewater treatment systems and population growth contribute to water pollution [3]. This is a matter of concern as completed research has indicated the adverse detrimental effects pollution may impose on animals and human health [4,5,6]. Human population growth in rural areas exerts pressure on water quality, while urban areas face challenges from both increasing populations and rising levels of industrialization. Today, the water quality of freshwater systems is one of the major problems in the Vhembe district because of the pollution caused by nearby communities due to lack of access to clean municipal water [2], and unfortunately, human and livestock resort to using water from the same systems which receive domestic and industrial waste.
Water is the most important requirement for life however, it can also be the medium habitat for infectious and non-infectious parasites that cause various water-borne diseases in animals and human health [7]. Water-borne diseases are caused by microbes found in water or mistakenly transported into the surface water by sewage, livestock, wastewater effluents, rain runoffs from the surrounding areas, garbage disposal, and other human activities [8,9]. Animals encounter these diseases by drinking contaminated water. In contrast, humans get infected via washing, swimming, bathing, preparation of food [10] or indirectly via consuming the infected fish [11].
These diseases include worm infections campylobacteriosis, cholera, diarrhoea, typhoid, amebiasis, hepatitis, gastroenteritis, giardiasis, dysentery, and scabies. Several pathogens including Escherichia coli, Salmonella, Campylobacteria, Aeromonas, and Pleisiomonas found in pollutants infested water sources causes diarrhoea [2,3,12]. Water-borne diseases have started raising a concern in South Africa (SA) since 2000 [13]. In 2011, about 700,000 deaths caused by diarrheal disease from consumption of contaminated water were reported in children under the age of five (5) [14], however, there are limited studies on water-borne diarrhoea in rural communities of the Vhembe district [2]. Other types of water-borne diseases such as giardiasis, dysentery, and gastroenteritis are caused by pathogenic organisms such as Clostridium pafringens, Salmonella, and Protozoa whose presence is indicated by E. coli, Klebsiella, and Enterobacter species [3]. The Vhembe District is located on the northern side of Limpopo Province with a human population of close to 1.4 million since 2016 [15,16,17]. It is a poverty-stricken province consisting mainly of rural areas with most people being unemployed and others depending on their farming projects for a living [18]. Due to its growing population, and the struggle to maintain essential natural resources, communities rely on river water, ponds, streams, and abandoned boreholes for clean water supplies [12,14]. Most of the Vhembe district waters have been reported to have poor microbial quality by [19,18]. [14], mentioned that millions of South Africans are still lacking suitable access to clean water supply. As such, various anthropogenic activities such as soil bricklaying, swimming, body washing, clothes washing, animal grazing, farming, dumping sites, car washing near natural waters, and fishing imposing higher contamination of water were witnessed during sampling time at the sampling areas of current.
The Orlando Dam was used as a comparative site because of its current state indicating excessive pollution [20]. The dam is in the Klip River which is the largest tributary of the Vaal River, supplying water to the Gauteng Province [21]. The river flows through the township of Soweto, Johannesburg. Furthermore, it receives bacterial inflow from the surrounding areas and run-offs after soil erosion from the mining activities going on around Orlando Dam [20].
The purpose of the dams to the community is to supply safe drinking water that is adequate in quality and acceptable for human health. Failure to provide such is detrimental to life. It is essential to recognize that water quality and quantity must be prioritized. The water quality in this study can represent the health risks of the surrounding human community.
The main objective of this study was to investigate water quality by analysing the physical parameters (Temperature, Electrical conductivity (EC), Total dissolved solutes (TDS) and pH), anthropogenic (Human activities), and biological (Total coliform (TC), E. coli and isolates) quality of the 4 dams in the Limpopo province and one in the Gauteng province.

Materials and Methods

Study Area

The study was conducted in Limpopo Province in the Vhembe District. It involved four (4) dams which are the Nandoni Dam (ND), the Thate Vondo Dam (TD), the Albasini Dam (AD) and the Xikundu Weir (XD), and in Gauteng Province which involved one Dam in Soweto, the Orlando Dam (OD).

Sample Collection

Once-off Sampling was done in October 2020, during the wet season. Thirteen (13) surface water samples, 2 x five hundred millilitres (500 ml) each were collected using sterilized plastic bottles from the entry sources of five dam sites (ND (3 sites), TD (3 sites), AD (2 sites), XD (1 site) and OD (4 sites). The water samples were obtained approximately 45 cm below the surface. Sampling was carried out after the Animal, Environment approved ethical clearance, and Biosafety Research Ethics Committee at the University of Venda (SMNS/19/200/05/2802). The samples were stored at 4°C in the laboratory until further analysis.

Physical Parameters Measurements

The water samples were collected in the field and subsequently analysed in the laboratory. EC (µs/cm), TDS (mg/L), temperature (°C), and pH were measured using a multimeter Crison Multimeter MM40 (Crison, Spain). The results of the physical parameters were compared to
acceptable standards set by the South African Department of Water Affairs and Forestry (DWAF) for unpolluted fresh water, South African National Standards (SANS) 241-2011, and WHO [22].

Risk Assessment Analysis

The analysis was determined by observing and recording the human activities around the nearby water sources before sampling to determine risk activities likely to contaminate the water streams. The frequencies of activities identified from the nine activities, as indicated in Table 4, were quantified and expressed as percentages. Total coliform (TC) and E. coli contents were analysed on water samples and risk assessment scores were determined according to the WHO [23]: TC and E. coli contents have low-risk contamination (1–3) when equal 1 to 10 Most Probable Number(MPN)/100 mL; intermediate to high risk (4–6) equates to 11 to 100 MPN/100 mL; and when MPN/100 mL is >100, the contamination risk is very high (7–10) [18,24].

Enumeration of Escherichia coli and Determination of Total Coliform

The presence of E. coli and TC was determined by The Colilert Quanti-Tray®/2000 most probable number (MPN) method (IDEXX; Westbrook, ME; USA) as per the manufacturer’s instructions. The quanti-trays were incubated briefly, at 35C for 18h. Positive wells for TC were determined by visualisation of yellow wells and recorded for each sample. The quantity-trays were examined under a long wave (366 nm) ultraviolet light, and fluorescent wells were recorded as E. coli positive. The results were reported as MPN for each 100 ml sample. The TC and E. coli contents were analysed by comparing the scores with guidelines determined by the [25].
Ten wells of positive E. coli samples were selected randomly and transferred into 2ml Eppendorf tubes and kept at -20°C for molecular analysis.

Membrane Filtration Analysis

A 100 mL of the water samples were filtered onto 0.45µm nitrocellulose membranes using the membrane filtration system method. The chambers were sterilized with alcohol and fire before filtration occurred. Filtered samples on filter papers were placed onto E. coli/coliform chromogenic media and incubated at 35°C for 24h. The plates were then sub-cultured and incubated at 35°C for another 24h. Single colonies on selective E. coli media were supplemented in nutrient broth and kept on ice until further analyses at the University of Johannesburg (UJ) laboratory.

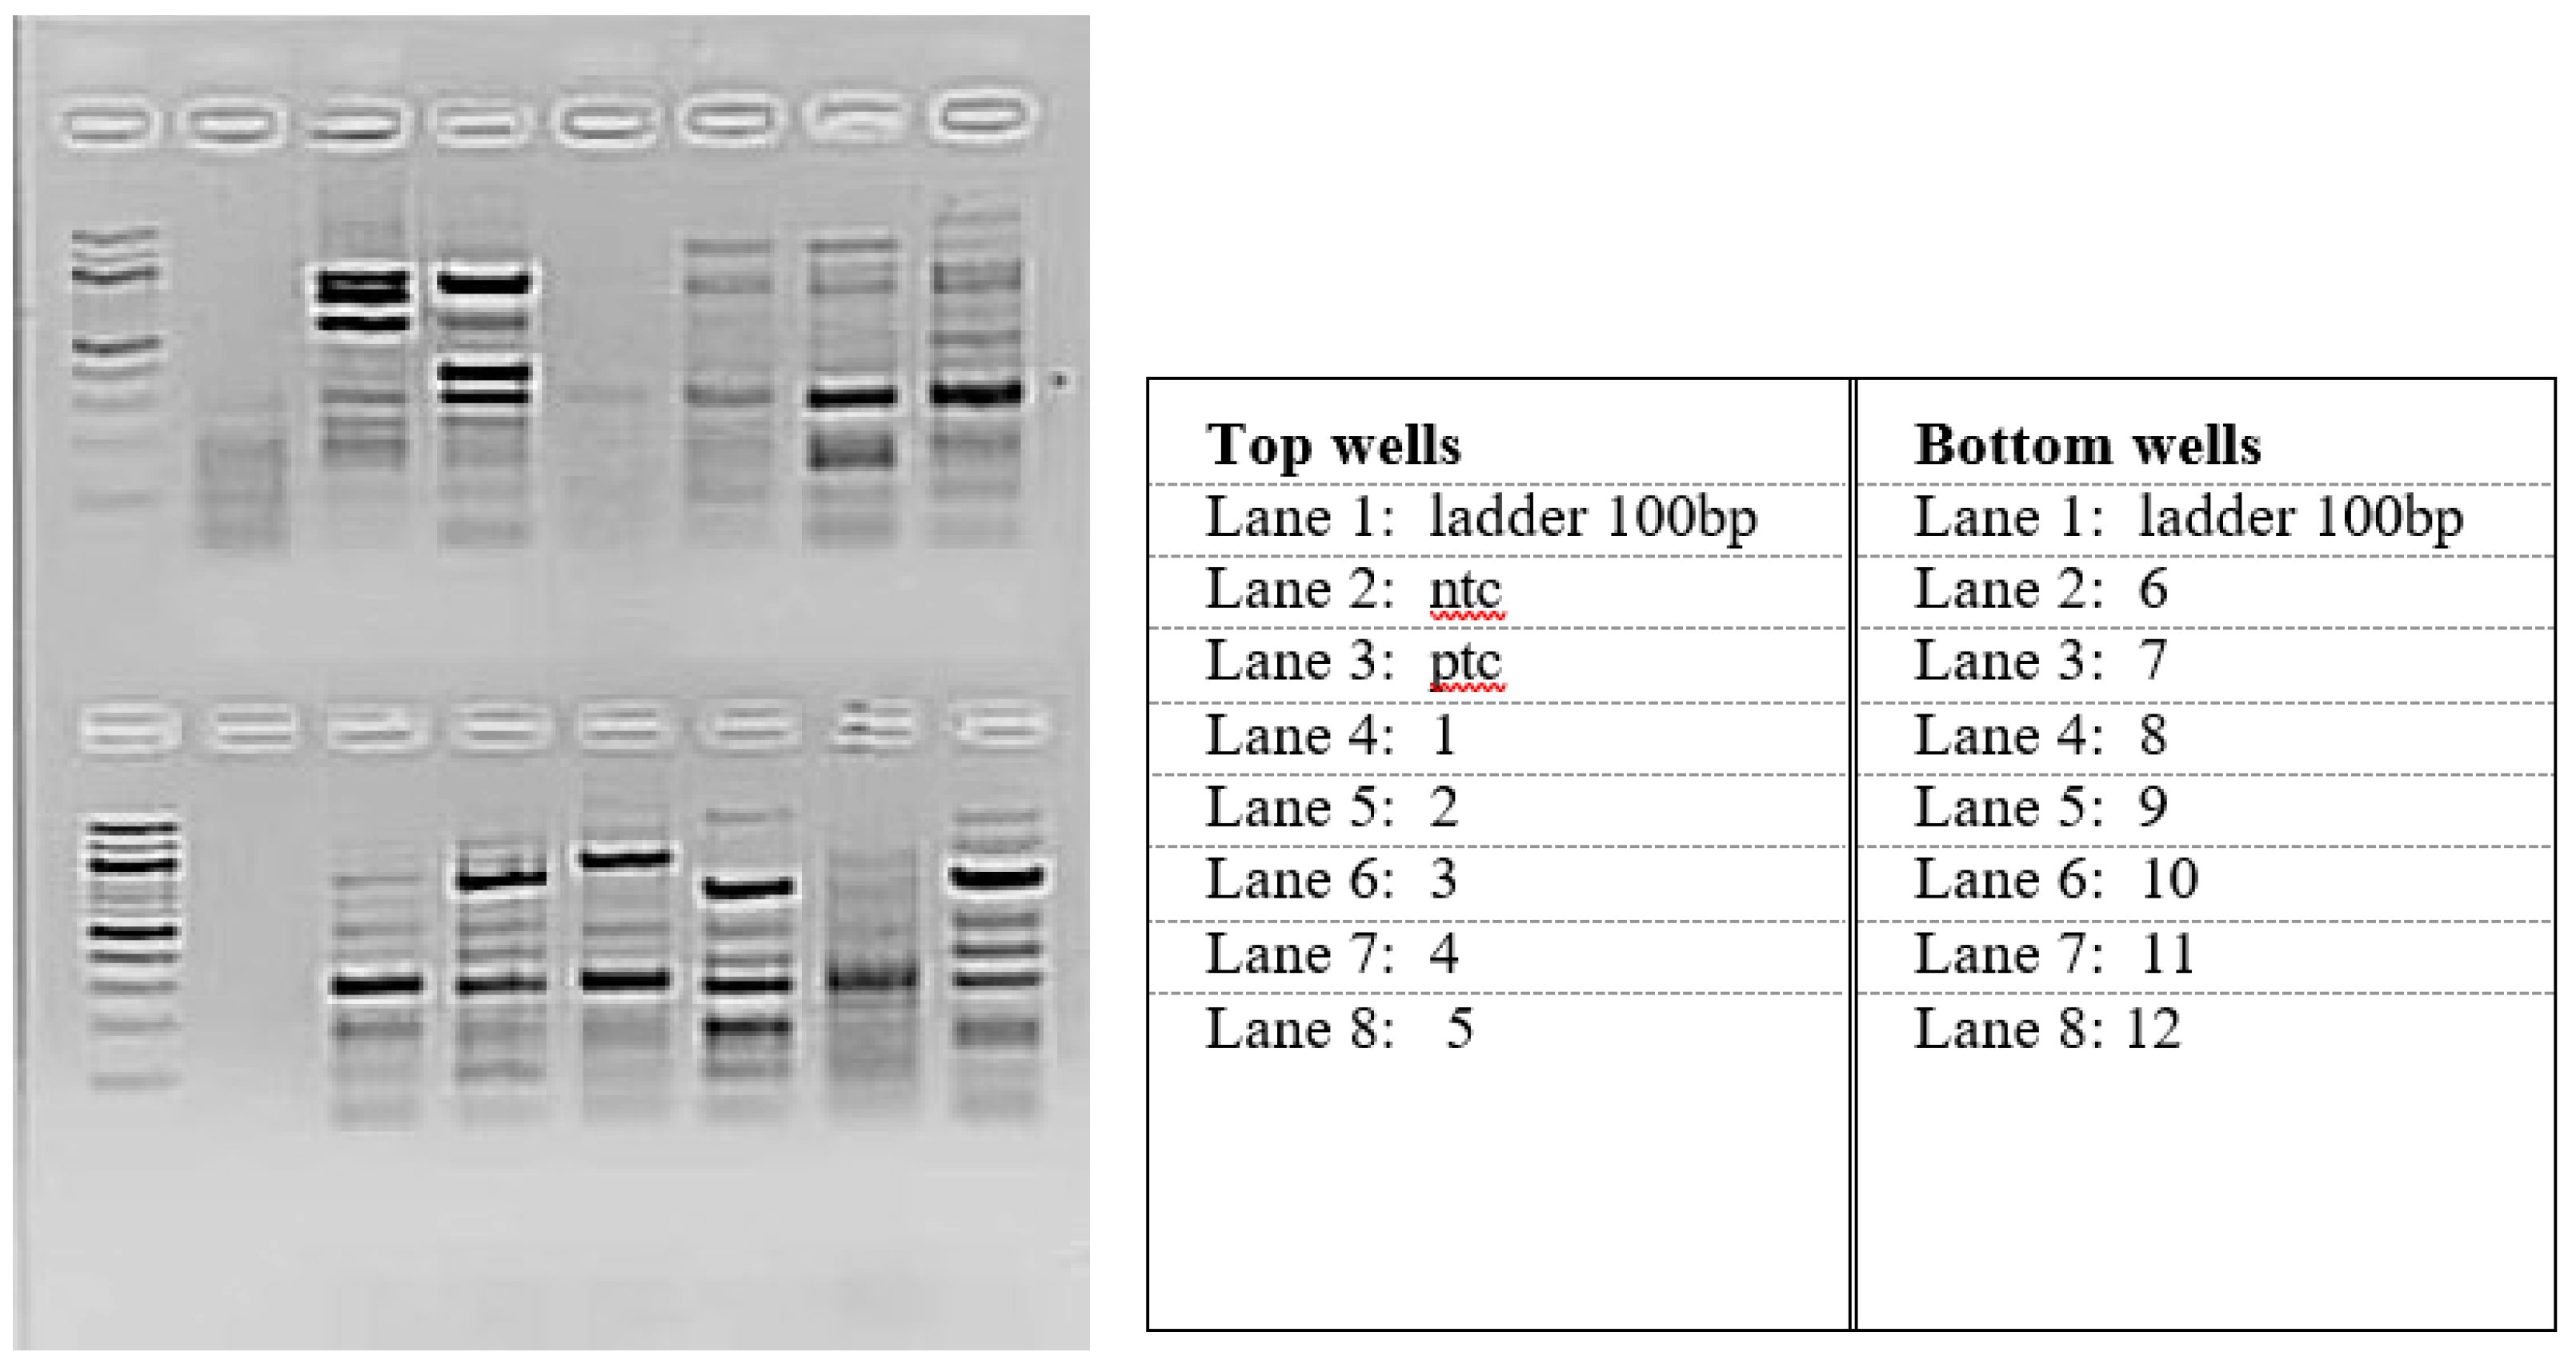
Multiplex PCR (mPCR)

The characterization of the E. coli communities in the samples that had positive E. coli was succeeded using the mPCR method developed by Omar and Barnard [26,18]. All PCRs were performed in a BIO-RAD® T100TM thermal Mycycler following the 11-gene mPCR protocol optimized by [27]. The samples were amplified in a 20µL reaction mixture containing 10µL of the 2 × Qiagen® m-PCR master mix (Hotstart Taq DNA polymerase, 10 × buffer, 2 mM MgCl2 and dNTP mix), 1µL 5 × Q- solution, 4.5µL of PCR grade water, 2µL MgCl2, 2µL of template DNA and 0.5µL of the primer mix (0.1µM of mdh and lt primers (Forward and Reverse), 0.2µM of ial, gapdh, eagg, asta, and bfp primers (Forward and Reverse), 0.3µM of eaeA and stx2 primers (Forward and Reverse), 0.5µM of stx1 and st primers (Forward and Reverse)). All PCR reactions were performed using enzyme activation at 95⁰C for 15 min, 35 cycles of DNA denaturation at 94⁰C for 45s, annealing at 55⁰C for 45s, elongation at 68⁰C for 2 min with a final elongation step at 72⁰C for 5 min. For the negative control reaction mixture, the template DNA was replaced with sterile PCR-grade water and the positive reaction contained DNA from E. coli reference strains [Table 1]. The DNA was visualized using a 2.5% (w/v) agarose gel in TAE buffer (40mmol l-1 Tris acetate; 2mmol l-1 EDTA, pH 8.3) with 0.5lg ml-1 ethidium bromide. Electrophoresis was done for 1–2 h in an electric field strength of 8V cm-1 gel and the DNA was visualized with UV light (Syngene, UK). The relative sizes of the DNA fragments were estimated by comparing their electrophoretic mobility with that of the standards 100bp and positive control run with the samples on each gel, (Fermentas, US).

Specificity of the m-PCR

The specificity of m-PCR was done according to the method of specifying m-PCR published by [26]. The bacterial strains that were included are E. coli strains, Shigella spp., Salmonella spp., Serovar, Vibrio spp., and the other strains of the Enterobacteriaceae family such as Klebsiella spp., Aeromonas spp., Pseudomonas aeruginosa, Bacillus subtilis, Bacillus cereus, Enterococcus spp. and Morganella morganni.

Identification of Isolates Using Vitek 2 Automated System

Thirteen (13) surface water samples were collected from the five dams mentioned above. The samples were isolated using selective media. The isolates were identified using the Vitek-2 automated system (bioMérieux, France) following the manufacturer’s instructions. In short, pure colonies of each strain were cultured in Tryptic Soy Agar (TSA) and suspended in sterile saline (0.45% NaCl) to a turbidity of McFarland 0.5 - 0.63. Bacteria were then injected into gram-positive (GP) cards, (bioMérieux) to conduct 43 biochemical tests using the following compounds on Appendix A.

Statistical Analysis

A one-way analysis of variance (ANOVA) was used to analyse the EC, TDS, temperature, and pH properties of the five (5) dams surveyed in this data. Further comparison of physical parameters was made between the ND and the OD using a one-way analysis of variance (ANOVA).

Results

Physical Parameters

The physical parameters at all sampling sites were investigated and presented in Table 2. The EC for all sampling sites and the TDS for the TD, ND, and XD fell below the guideline values (0 to 700 µs/cm) of the South African DWAF for unpolluted fresh water [28] and the Target Water Quality Range (TWQR) (100mg/L) for aquatic systems respectively. The maximum temperature was recorded at one sampling point in the OD (17.6⁰C) and the minimum was recorded at one sampling point in the AD (11.6⁰C).
The SA target pH range for aquatic ecosystems is between 6.5 and 8.5 [28,29]. All sampling sites, except TD, XD, and one sampling point of ND, had their pH values within the SA target range [28,29].

Comparison Between the Nandoni Dam and the Orlando Dam

Statistical analysis revealed significant differences in EC, TDS, and pH (p < 0.05) between the OD and the ND, with higher EC and TDS at the OD, and higher pH at the ND while the temperature differences were not significant (p = 0.614) [Table 3].

Risk Assessment

Human activities were observed at each sampling point before sampling. The activities are presented in Table 4. The overall percentage per risk activity for garbage disposal points was present in 76.9% of the total sampled sites. Body wash activity was the least observed at the ND site 3 and XD with 15.4%. Fecal matter, garbage disposal, and sewage discharge had a percentage risk activity of concern at 61.5%, 30.8%, and 53.8%, respectively.
Table 4. Human activities were assessed at each point of the sampling sites.
Assessed human activities
Sampling site Garbage point Animal grazing Bricklaying Farming Body wash Faecal matter Industrial waste Fishing Sewage discharge % of Risk per site
Nandoni dam 1 + + + - + + + + 77.8
Nandoni dam 2 + + + - - + + + 66.7
Nandoni dam 3 + + + - + + + + + 88.9
Orlando dam 1 + + + 33.3
Orlando dam 2 + + 22.2
Orlando dam 3 + + 22.2
Orlando dam 4 + + 22.2
Thate Vondo 1 + + - - - + - 33.3
Thate Vondo 2 - - - - - + - 11.1
Thate Vondo 3 + - - - - - - 11.1
Albasini dam 1 + + + 33.3
Albasini dam 2 + + + 33.3
Xikundu weir - + - + + + - 44.4
Percentage per risk activity 76.9 38.5 23.1 23.1 15.4 61.5 30.8 23.1 53.8
+= Activity observed; ⁻ = No activity observed
The most contaminated site that showed a high risk for contamination by human activities was the ND (mean = 77.8%, n = 3) followed by the XD (mean = 44.4%, n = 3). The ND displayed significant contamination, with various detrimental activities observed at all three sampling points.
These activities included garbage disposal, animal grazing, bricklaying, fecal matter, fishing, and sewage discharge.
Microbial results
MPN/100mL of TC at each sampling site exceeded the acceptable limits recommended by water quality standards (1-10 MPN/100 mL) [Table 5]. The MPN/100mL of all sampling points was >100, meaning the contamination risk is very high (7 - 10). All sites in the OD, ND, XD, and one site in the AD had higher TC concentration with the value ˃ 2419.6 MPN/100mL. Two sites in the TD had the least TC concentration compared to others. Of the 13 water samples collected, 11 tested positive for E. coli (85%). Eight sites had low risk (1 - 3) contamination for E. coli with MPN/100mL values ranging from 1 to 9.7 MPN/100mL. The XD 1 and the OD 1 exhibited intermediate to high-risk levels, with MPN/100mL values of 42.2 and 70, respectively, indicating E. coli contamination. In contrast, the OD 3 presented a very high risk (7-10), with an MPN/100mL value of 238.9.

The E. coli Strains Were Identified in Water Samples

A total of 13 water samples were collected of which 11 tested positive for E. coli. Of the 11 samples successfully run into multiplex PCR, all samples demonstrated the mdh gene, indicating the presence of E. coli microbial results and confirming isolates classification [Table 6]. There could be possible false positive/negative or PCR inhibition as two of the samples tested negative for the gapdh gene used as an external control. As stated by [26], it is important to include internal and external controls in the reactions to confirm that there were no PCR inhibitions and no false negative/positive. The relative percentage of E. coli strains is indicated in Table 6. The results indicated the high prevalence of EPEC, ETEC, and EAEC, respectively, from the water assessed. Enteroinvasive E. coli was detected in the AD only. There was an indication that pathogenic E. coli could be detected in a variety of combinations between the genes. Figure 1 shows the agarose gel of the PCR products obtained from samples. The figure demonstrates the target molecular weight of the expected bands.

Bacterial Isolates Identified by the Vitek-2 Automated System

Single colonies on selective E. coli media supplemented with nutrient broth were further identified by the Vitek-2 automated system. A total of 18 varieties of bacteria were identified [Table 7]. The bacterial diversity was high in the OD with ten species followed by the ND with five species.

Discussion

This study indicated that the OD in the Gauteng Province exhibited higher levels of contamination compared to the dams in the Limpopo Province. The findings highlight the potential water quality concerns, which can be attributed to location in urban areas. Urban areas are susceptible to water contamination due to anthropogenic factors such as sewage discharge, industrial runoffs, and illegal garbage disposal by human activities. The OD is the closest to the Chris Hani Baragwanath Academic Hospital and medical waste was observed in the OD during sampling. The surrounding area is characterized by overpopulation density (high population of shacks in a limited space), with residents keeping livestock that rely on the OD as a drinking source (personal observation).
Physical parameters assessed in all water samples included EC, TDS, pH, and temperature. The physical parameters have a significant influence on the microbial quality of water. The EC values observed at the AD, ND, and XD may be attributable to runoffs from adjacent agricultural areas, which often carry fertilizers, herbicides, insecticides, and pesticides [30]. Conversely, the lower EC recorded at the TD may indicate limited agricultural runoffs from surrounding farms. The TDS concentrations observed in the OD and the AD may have resulted from minerals associated with soil erosion and runoff. Additionally, algal growth (personal observation) in both dams may further contribute to elevated TDS levels. These levels can influence certain bacteria that grow vigorously in such conditions (USEPA). Increased concentrations of TDS can lead to water hardness, impart a bitter taste to human and aquatic organisms, and increase turbidity, which affects the penetration of light in aquatic systems. Consequently, enhanced algal growth can obstruct sunlight from reaching aquatic flora and fauna, leading to oxygen depletion in the water while favoring bacterial growth.
Although pH values from the water samples were not of concern, the activity, growth, and survival of microbes are influenced by neutral pH levels (6.5 to 7.5) [22]. Elevated alkaline pH levels may threaten human and aquatic fauna by increasing the toxicity of other substances in the water, leading to the quality of water being too acidic or saline. However, the pH levels in the OD, ND, AD, and XD would not affect human and wildlife health as they are slightly below and above the acceptable limit. On the contrary, TD’s pH level would be a little concerning.
[8] did a study on the Nandoni municipal sewage and detected physicochemical and microbiological values exceeding the Department of Water Affairs and Forestry (DWAF) and WHO [25] guidelines. The results are not surprising as sewage is expected to be highly contaminated. Significant risk assessments of the ND and the OD are attributed to their locations in areas surrounded by human settlements. The ND is deep within the rural community that lacks access to safe drinking water, as a result, the surrounding communities directly utilize its waters for various purposes, including body washing, laundry, bricklaying, and other construction activities ( [31]; personal observations) as shown in Table 4. Another contributing factor to the high-risk assessment of the ND is the direct discharge of effluents from the Thohoyandou sewage treatment plant into the Mvudi River, which subsequently deposits into the Dzindi River just upstream of the confluence with the Luvuvhu River [8]. The OD, situated in an urban area, is characterized by a large population with limited space, resulting in numerous illegal dumping sites that are challenging to manage. The TD and the AD exhibit similar and lower risk assessments than the other dams. The XD has a lot of crocodiles, so it subsequently becomes a no-go area for humans, thus reducing human activities. It is also restricted to human and livestock access.
The TC and E. coli are microbial organisms mostly used by microbiologists to detect microbial contamination of water systems [2]. E. coli is a more specific fecal contamination compared to the TC and is associated with waterborne diseases [22,23]. Microbial contamination has been reported to be the leading risk in fish food contamination [32]. The communities surrounding Vhembe District Dams use the dam water for household use and consume fish from the same environment [33]. However, strains of E. coli produce and release toxins in fish, leading to spoilage of fish food, which subsequently causes foodborne diarrheal diseases in humans [34,35]. This is especially true after the death of fish, where there was activity of spoilage bacteria increases [36]. The concentrations (MPN/100mL) of E. coli of the sampled dams, at OD1 & 2, and the XD confirmed the unsafety of these waters for drinking, as the estimated exceeded standards set by WHO [32]. Microorganisms have been reported to be related to TDS [37]. This can be seen in the levels of TDS reported at the OD. Ten (10) sites were confirmed to have water that may be unsafe from E. coli contamination for human and livestock health. The concentrations (MPN/100mL) of TC in all sampling points confirmed the unsafety of these waters for drinking by livestock and humans, as the estimated values do not fit the standards set by the WHO [25]. These results indicate ongoing contamination issues that necessitate immediate intervention. Total coliforms indicate the presence of fetal fecal matter [38], and the latter is not surprising as the fecal matter was observed at 61.5% of the sampling points. Animal grazing, garbage points (diapers seen) and sewage discharge could have influenced the results, too, as these human activities were observed during sampling. The high levels of microbial contamination could have been the result of sampling during the rainy season.
A study done in 2016 [18], conducted on the rivers in the Vhembe District, reported TC and
E. coli contents to be higher (TC > 2400 MPN/100mL & E. coli > 2000 MPN/100mL) than the acceptable limits proposed by the South African Department of Water and Sanitation (DWS). Similar studies done in the same district on eight rivers waters used as household drinking water [2] and in Mutangwi River [39] surprisingly showed similar results of indicator bacteria counts exceeding the South African drinking water quality guideline limits and pathogenic E. coli detected in the samples (TC = 1732 - 2420 MPN/100mL, E. coli = 57.1 - 1299.7 MPN/100mL and E. coli = 814.5 - 2169 respectively). These results correlate with the TC in all the sampling sites (TC = 1986,3 – > 2416.6) and E. coli in the OD (E. coli 70 and 238.9) of the current study. This elaborates on a health concern from the river/surface waters of the Vhembe district for both E. coli and TC. E. coli has some other types of strains that can cause serious illness in humans same as the TC consisting of different types of infectious bacteria. The main disease outbreaks reported from these regions caused by microbial contamination of water are diarrhoea and cholera.
Of the 13 surface water samples initially sampled, 11 of the water samples tested positive for E. coli making 85% of the water samples unsafe for domestic usage. Five pathogenic E. coli (EHEC, EPEC, EAEC, EIEC, and ETEC) were detected. The detection of EPEC in the water source is of concern as this pathogen binds to the epithelial cells of the human intestine, leading to watery diarrhoea [40], especially in infants [41], [42]. The ND and the OD had the most variety of E. coli strains compared to other sites. The E. coli strain ETEC reported by 2021 study [43] is known to alter the health of fish by causing histopathological changes, damage in muscle tissue, and mortality of Oreochromis niloticus, was the second to be prevalent in all assessed water.
The results are possibly associated with human activities observed during sampling which include agricultural runoffs, inadequate waste disposal, and possible sewage leaks, all of which could have potentially contributed to the increased levels of microbial contamination. These activities are often linked to the prevalence of nutrient loading in the water bodies, creating conditions that induce the growth of pathogenic microorganisms [44,45]. This finding raises a significant concern regarding water quality in the sampled areas. The presence of E. coli serves as a strong biological indicator of fecal contamination, which arises from various anthropogenic activities posing significant health risks to local communities. The consumption of contaminated water for domestic purposes can lead to complications such as gastrointestinal diseases and other health complications, particularly among vulnerable groups such as children, elderly people, and immunocompromised individuals [32]. The absence and low levels of E. coli in the TD and the AD, respectively, could be attributed to the low temperatures. Although E. coli can survive at the lowest temperatures it thrives best in warmer temperatures. Furthermore, these findings underscore the need to implement comprehensive water quality management strategies in the affected areas. Employing strategies to reduce contamination sources such as improving sanitation infrastructure, implementing awareness among farmers about the possible contaminations from pesticides and proper waste disposal to reduce microbial contamination would yield a better environment. It is not surprising for the OD to have quite a variety of bacterial species (10/18) compared to other dams, as it exhibited intermediate to high-risk levels of 70MPN/100mL and a very high risk of 238.9MPN/100mL. These results correspond with the relative percentage of E. coli strains, within the OD showing the highest level of contamination followed by the ND.

Conclusion

The results showed that the water quality of the water sources assessed was poor as indicator bacteria counts exceeded the South African drinking water quality guideline limits and pathogenic
E. coli was detected in the samples. Human activities were the contaminant of the water sources.
Therefore, the water quality from these five dams was proven to be unsafe for human consumption in terms of domestic use, irrigation, and recreation. It is of utmost importance to implement mitigation strategies that will reduce pollution imposed by the surrounding poor communities in the studied sampling sites. Providing clean water and awareness of these unpleasant effects could reduce the prevalence of diarrhoeal diseases.

Acknowledgments

This research was supported by funding from the National Research Foundation (NRF) Scholarship program under the South African Systems Analyses Centre (SASAC) and Professor IEJ Barnhoorn’s University of Venda research incentives funds. The authors have declared no conflict of interest.
Data available on request

Appendix A. Compounds used to perform 43 biochemical tests.

AMY = amygdalin; APPA = ala-phe-pro arylamidase; LEUA = L-leucine arylamidase ; ALAA = alanine arylamidase; DRIB = ribose; NOVO = novobiocin resistance; DRAF = raffinose; OPTO = optochin resistance; PIPLC = phosphatidylinositol - phospholipase C; CDEX = alpha-cyclodextrin; PROA = pro arylamidase beta-glucuronidase; TYRA = tyrosine arylamidase; ILATK = lactate; NC6.5 = growth in 6.5 NaCl; O129R = O/129 resistance; DXYL = xylose; ASPA = L-aspartic acid arylamidase; BGURR = beta glucorinidase; DSOR = sorbitol; LAC = lactose; DMAN = mannito; SAL = salicin; ADH1 = arginine dihydrolase; AGAL = alpha-galactosidase; URE = urease; NAG = N-acetyl-glucosamine; DMNE = mannose; SAC = sucrose; BGAL = beta- galactosidase; AMAN = alpha-mannosidase; PYRA = L-pyroglutamic acid arylamidase; POLYB = polymyxin B; DMAL = maltose; MBDG = methyl-beta-D-glucopyranoside; DTRE = trehalose; AGLU = alpha-glucosidase; PHOS = alkaline phosphatase; BGUR = beta-glucorinidase; DGAL = galactose; BACI = bacitracin resistance; PUL = pullulan and ADH2S = arginine dihydrolase.

References

  1. Nthunya, L.N; Khumalo, N.P; Verliefde, A.R; Mamba, B.B; Mhlanga, S.D. Quantitative analysis of phenols and pahs in the Nandoni dam in Limpopo Province, South Africa: A preliminary study for dam water quality management Physics and Chemistry of the Earth, pp. 228-238, 2019.
  2. Potgieter, N; Karambwe, S; Mudau, L.S; Barnard, T; Traoré, A. Human enteric pathogens in eight rivers used as rural household drinking water sources in the northern region of South Africa. International Journal O of Environmental Research and Public, 17(6), p. 2079, 2020.
  3. Onyango, A.E; Okoth, M.W; Kunyanga, C.N; Aliwa, B.O. Microbiological quality and contamination level of water sources in Isiolo County in Kenya. Journal of Environmental and Public Health, 2018. [Google Scholar]
  4. Ashbolt, N.J. Microbial contamination of drinking water and human health from community water systems. Current Environmental Health Reports, 2(1), pp. 95-106, 2015.
  5. Sankhla, M. S; Kumari, M; Nandan, M; Kumar, R; Agrawal, P. Heavy metals contamination in water and their hazardous effect on human health-a review. International Journal of Currents Mcrobiology and Applied Science, 5(10), pp. 759-766, 2016. [Google Scholar]
  6. Abdel-Shafy, H.I; Mansour, M.S. A review on polycyclic aromatic hydrocarbons: source, environmental impact, effect on human health and remediation. Egyptian journal of Petroleum, 25(1), pp. 107-123, 2016. [Google Scholar]
  7. Praveen, P. K; Ganguly, S, Wakchaure, R, Para, P.A, Mahajan, T, Qandri, K, Kamble, S, Sharma, R, Shekhar, S, Eds.; Dalai, N. Water-borne diseases and its effect on domestic animals and human health: A Review. International Journal of Advanced Research and Technology, pp. 242-245, 2016. [Google Scholar]
  8. Gumbo, J.R; Dzaga, R.A; Nethengwe, N.S. Impact on water quality of Nandoni water reservoir downstream of municipal sewage plants in Vhembe District, South Africa. Sustainability, 8(7), p. 597, 2016. [Google Scholar]
  9. Cissé, G. Food-borne and water-borne disease under climate change in low-and middle-income countries: Further efforts needed for reducing environmental health exposure risks. Acta Tropica, 194, pp. 181-188, 2019. [Google Scholar]
  10. Potgieter, N; Becker, P.J; Ehlers, M.M. Evaluation of the CDC safe water-storage intervention to improve the microbiological quality of point-of-use drinking water in rural communities in South Africa. Water SA, 2009.
  11. Barnhoorn, I.E.J; Bornman, M.S; Van Rensburg, C.J; Bouwman, H. DDT residues in water, sediment, domestic, and indigenous biota from a currently DDT-sprayed area. Chemosphere, 77(9), pp. 1236-1241, 2010. [Google Scholar]
  12. Obi, C. L; Potgieter, N; Bessong, P.O. Enteric Pathogens in Water Sources and Stools of Residents in the Venda Region of Limpopo Province. Water Research Commission, 2005. [Google Scholar]
  13. Edokpayi, J.N; Odiyo, J.O; Durowoju, O.S. Impact of wastewater on surface water quality in developing countries: a case study of South Africa. Water Quality, pp. 401-416, 2017. [Google Scholar]
  14. Edokpayi, J.N; Enittan, A. M; Mutileni, N; Odiyo, J.O. Evaluation of water quality and human risk assessment due to heavy metals in groundwater around Muledane area of Vhembe District, Limpopo Province, South Africa. Chemistry Central Journal, 2018; 2. [Google Scholar]
  15. Musetha, M.A. The impact of climate change on agricultural crop production in the Vhembe District Municipality, Limpopo Province South Africa (Doctoral dissertation). Doctoral dissertation, 2016. [Google Scholar]
  16. Nefale, T.A. The role of agricultural cooperatives in poverty reduction: A case study of selected cooperatives in the four local municipalities of Vhembe district municipality, Limpopo Province, South Africa (Doctoral dissertation). Doctoral dissertation, 2016. [Google Scholar]
  17. Vhembe District Municipality. Annual performance report 2021/2022. Final VDM annual performance report 2021-2022 financial year 31 august 202215h30," thohoyandou, 2022.
  18. Traoré, A. N; Mulaudzi, K; Chari, G.J; Foord, S.H; Mudau, L.S; Barnard, T.G; Potgieter, N. The impact of human activities on microbial quality of rivers in the Vhembe District, South Africa. International Journal of Environmental Research and Public Health, 13(8), p. 817, 2016. [Google Scholar]
  19. Sibada, T; Okoh, A.I. Real-time PCR quantitative assessment of hepatitis A virus, rotaviruses, and enteroviruses in the Tyume River located in the Eastern Cape Province, South Africa. Water SA, 2013.
  20. Bengu, T. S; Du Plessis, J; Modley, L.S van Dyk, J.C. Health effects in fish from the polluted Orlando Dam and Klipspruit wetland system, Soweto, South Africa. African Journal of Aquatic Science, 42(2), pp. 131-141. 2017. [Google Scholar]
  21. Pheiffer, W; Bortey-Sam, N; Ikenaka, Y; Nakayama, S.M.M; Mizukawa, H; Ishinuka, M; Smith, N.J; Pieters, R. First report on OH-PAHs in South African Clarias gariepinus bile from an urban impacted system. African Journal of Aquatic Science, 43(3), pp. 305-312, 2018.
  22. World Health Organization. Guidelines for drinking-water quality: second addendum. Vol. 1, Recommendations, 3rd ed. World Health Organization, 2008.
  23. World Health Organization. Assessing microbial safety of drinking water improving approaches and methods: Improving approaches and methods. OECD Publishing, 2003.
  24. World Health Organization. A toolkit for monitoring and evaluating household water treatment and safe storage programmes, 2012.
  25. World Health Organization. Guidelines for Water Quality. Health Criteria and Other Supporting Information. World Health Organization, Geneva, 1993.
  26. Omar, K.B; Barnard, T.G. Detection of diarrhoeagenic Escherichia coli in clinical and environmental water sources in South Africa using single-step 11-gene m-PCR. World Journal of Microbiology and Biotechnology, 30(10), pp. 2663-2671, 2014. [Google Scholar]
  27. Banu, O.K; George, B.T; Paul, J. Development of a competitive PCR assay for the quantification of total Escherichia coli DNA in water. African Journal of Biotechnology, 9(4), 2010. [Google Scholar]
  28. Department of Water Affairs and Forestry. South African Water Guidelines. Domestic Water Use, 1996.
  29. Department of Water Affairs and Forestry. South African Water Guidelines. Aquatic ecosystems, 1996.
  30. Odiyo, J. O; Chimuka, L; Mamali, M.A; Fatoki, O.S. Trophic status of Vondo and Albasini Dams; impacts on aquatic ecosystems and drinking water. International Journal of Science and Technology, 9,(2), pp. 203-218, 2012. [Google Scholar]
  31. Sinthumule, N.I. Window of economic opportunity or door of exclusion? Nandoni Dam and its local communities. Sustainability, 2021. [Google Scholar]
  32. World Health Organization. Water quality and health: Review of the health effects of chemicals on the quality of drinking-water. Geneva, WHO Press, 2017.
  33. Barnhoorn. I.E.J. Intersex in feral indigenous freshwater Oreochromis mossambicus, from various parts in the Luvuvhu River, Limpopo Province, South Africa. Ecotoxicology and Environmental Safety, 73(7), pp. 1537-1542, 2010.
  34. Mahmoud, A.F; Hafez, A.E.S.E; Seadawy, H.G; Mohamed, E.F; Abdalllah, K.M. Quality Assessment and Impact of Gamma Irradiation on Histamine Content in Some Fish. Journal of Advanced Veterianry Research, 12(6) pp. 760-767, 2022. [Google Scholar]
  35. Bedane, T. D; Megersa, B; Abunna, F; Waktole, H; Woldemariyam, F.T; Tekle, M; Shimelis, E; Gutema, F.D. Occurrence, molecular characterization, and antimicrobial susceptibility of sorbitol non-fermenting Escherichia coli in lake water, fish and humans in central Oromia, Ethiopia. Scientific reports, 14(1), p. 12461, 2024. [Google Scholar]
  36. Ali, M.Y; Sharif, M.I; Adhikari, R.K; Faruque, O. Post mortem variation in total volatile base nitrogen and trimethyl lamine nitrogen between Galda (Macrobrachium rosenbergii) and Bagda (Panaeus monodon). University Journal of Zoology, vol. 28, pp. 7-10, 2009. [Google Scholar]
  37. Hoorzook, K. B; Pieterse, A, Heine, L, Barnard, T, G, Eds.; van Rensburg, N.J. Soul of the Jukskei River: the extent of bacterial contamination in the Jukskei River in Gauteng Province, South Africa. International Journal of Environmental Research and Public Health, 18(16), p. 8537, 2021. [Google Scholar]
  38. Palamuneli, L; Akoth, M. Experimental contamination of drinking water with fecal coliforms: Effects on health. Canadian Journal of Microbiology, 39(1), pp. 101-105, 1993.
  39. Madilonga, R.T; Edokpayi, J.N; Volenzo, E.T; Durowujo, O.S; Odiyo, J.O. R.T. Water quality assessment and evaluation of human health risk in Mutangwi river, Limpopo province, South Africa. International Journal of Environmental Research and Public Health, 18(13), p. 6765, 2021. [Google Scholar]
  40. Geldreich, E.E. E; Gut feelings: enteropathogenic E. coli (EPEC) interactions with the host. Annual review of cell and developmental biology, 16(1), pp. 173-189, 2000. [Google Scholar]
  41. Ledwaba, S.E; Costa, D.V; Bolick, D. T; Giallourou, N; Medeiros, P.H; Swann, J.R; Traoré, A.N; Potgieter, N; Nataro, J.R; Guerrant, R.L. Enteropathogenic Escherichia coli infection induces diarrhea, intestinal damage, metabolic alterations, and increased intestinal permeability in a murine model. Frontiers in cellular and infection microbiology, 2020. [Google Scholar]
  42. Lee, J.B; Kim, S.K; Yoon, J.W. Pathophysiology of enteropathogenic Escherichia coli during a host infection. Journal of Veterinary Science, 23(2), 2022. [Google Scholar]
  43. Yacoub, A.M; Sabra, S.M; Al-Kourashi, M.K.D. A.M. Meat Quality and Hematological Indices of Oreochromis niloticus Fish Experimentally Exposed to Escherichia coli Toxins: A Recent Study. 2021.
  44. Hatt, B.E; Fletcher, T.D; Deletic, A. The influence of urbanization on the quality of stormwater runoff. Water Science and Technology, 49(7), pp. 63-70, 2004. [Google Scholar]
  45. McLennan, M.A. E. coli as an indicator of fecal contamination in the aquatic environment. Microbial Ecology, 48(3), pp. 259-269, 2004. [Google Scholar]
Figure 1. Agarose gel of the PCR products obtained from samples lanes 4 - 8 (top wells) and lanes 2 - 8 (bottom wells) for the E. coli multiplex PCR. Negative template control (ntc) in lane 2. Positive template control in lane 3.
Preprints 147846 g001
Table 1. Bacterial strains used in molecular characterization (Omar and Barnard (2014)).
Bacterial Strain Reference Use Genes Present
Escherichia coli (Commensal)a PCR Mdh
Enterohaemorrhaging (EHEC) ESCCO21b PCR Mdh, stx1, stx2 and aeaA
Enteroinvasive (EIEC) ESCCOS ATCC 43893b PCR Mdh and ial
Enterotoxigenic (EPEC) ESCCO 22b PCR Mdh, It and st
Enteropathogenic (EPEC) S-ESCCO 16 PIb PCR Mdh, eaeA, bfp
Enteroaggregative (EPEC) ESCCO 14b PCR Mdh and eagg
aEnvironmental isolate confirmed by API 20E (OMNIMED®, Moorestone, NJ, USA) and PCR as
commensal E. coli; bStrains purchased from National Health Laboratory Services (NHLS) confirmed with biochemical and PCR by the NHLS.
Table 2. Physical parameters were analysed to test water quality.
Sampling site Conductivity (µs/cm) TDS (mg/ℓ) Temp (°C) pH
OD1 379 243 17,6 7,67
OD2 377 241 16,9 8,17
OD3 349 223 16,4 8,17
OD4 343 220 16,1 7,9
ND1 129,8 83,1 16,4 8,6
ND2 138,5 88,9 17,2 8,2
ND3 142,2 91,1 17,4 8,5
TD1 24,6 15,6 13 8,4
TD2 31,9 20,4 13 8,9
TD3 42,1 26,4 12,7 8,8
AD1 184,1 117,4 12,5 8,3
AD2 182 116,6 11,6 8,35
XD 138,9 88,9 17,5 8,6
Table 3. Comparison of physical parameters between Orlando Dam and Nandoni Dam.
Parameter Orlando Dam
n = 4
Nandoni Dam
n = 3
(F-Test value) P.value
Conductivity Mean = 362, sd = 18,65 Mean = 136,8, sd = 6,37 F (1,5) = 386.3 p < 0.05
TDS Mean = 232, sd = 11.92 Mean = 87.7, sd = 4.13 F (1,5) = 385.9 P < 0.05
pH Mean = 7.98, sd = 0.24 Mean = 8.43, sd = 0,21 F (1,5) = 6.82 P < 0.05
Temp No significant difference No significant difference F (1,5) = 0.29 P = 0.614
Table 5. The total coliform (TC) and E. coli MPN/100mL values of all sampling sites.
Sampling site Total coliform (MPN)/100 ml E. Coli (MPN/100 mL)
Orlando Dam 1 ˃ 2419.6 70
Orlando Dam 2 ˃ 2419.6 238.9
Orlando Dam 3 ˃ 2419.6 9.7
Orlando Dam 4 ˃ 2419.6 9.7
Nandoni Dam 1 ˃ 2416.6 6.3
Nandoni Dam 2 ˃ 2416.6 3.1
Nandoni Dam 3 ˃ 2416.6 7.2
Thate Vondo Dam 1 2419.6 6.2
Thate Vondo Dam 2 1986.3 0
Thate Vondo Dam 3 1986.3 0
Albasini Dam 1 >2416.6 2
Albasini Dam 2 2419.6 1
Xikundu weir Dam 1 2416.6 42.2
Acceptable limits = 1-10 MPN/100 ml.
Table 6. PCR results for Escherichia coli strains from water samples from the Colilert ® Quanti- Tray®/2000.
Sample site N F Com EPEC EHEC EIEC ETEC EAEC
Orlando Dam 4 4 4(100%) 4(100%) 1(25%) 0(0%) 4(100%) 3(75%)
Nandoni Dam 3 3 3(100%) 4(100%) 3(100%) 0(0%) 2 (67%) 2(67%)
Thate Vondo Dam 3 1 1(33%) 1(33%) 0(0%) 0(0%) 1(33%) 1(33%)
Albasini Dam 2 2 2(100%) 2(100%) 1(50%) 1(50%) 1(50%) 1(50%)
Xikundu weir 1 1 1(100%) 1(100%) 0(0%) 0(0%) 1(100%) 1(100%)
N = Number of samples, F = fluorescence and turned yellow, E. coli positive. EHEC = Enterohaemorrhagic E. coli, EPEC = Enteropathogenic E. coli, EIEC = Enteroinvasive E. coli, ETEC = Enterotoxigenic E. coli, EAEC = Enteroaggregative E. coli, 1.
Table 7. Isolates identified by the Vitek-2 automated system.
Origin Identification
Orlando Dam 1 Pseudomonas stutzeri
Enterobacter cloacae complex
Klebiella pneumoniae spp ozaenae
Klebsiella oxytoca
Orlando Dam 2 Klepsiella pneumoniae spp pneumoniae
Enterobacter asburiae
Orlando Dam 3 Klepsiella pneumoniae spp pneumoniae
Aerococcus viridans
Citrobacter braakii
Citrobacter freundii
Orlando Dam 4 Serratia fonticola
Pseudomonas stutzeri
Citrobacter braakii
Nandoni Dam 1 Enterobacter cloacae complex
Citrobacter freundii
Alloicoccus otitis
Plesiomonas shigelloides
Nandoni Dam 2 Citrobacter freundii
Plesiomonas shigelloides
Nandoni Dam 3 Sphingomonas paucimobilis
Thate Vondo Dam 1 Citrobacter braakii
Thate Vondo Dam 2 Edwardsiella tarda
Thate Vondo Dam 3 Enterococcus faecalis
Enterobacter asbusiae
Albasini Dam 1 Klepsiella pneumoniae spp pneumoniae
Aeromonas sobria
Albasini Dam 2
Aeromonas sobria
Xikundu weir Enterobacter cloacae complex
Plesiomonas shigelloides
Disclaimer/Publisher’s Note: The statements, opinions and data contained in all publications are solely those of the individual author(s) and contributor(s) and not of MDPI and/or the editor(s). MDPI and/or the editor(s) disclaim responsibility for any injury to people or property resulting from any ideas, methods, instructions or products referred to in the content.
Copyright: This open access article is published under a Creative Commons CC BY 4.0 license, which permit the free download, distribution, and reuse, provided that the author and preprint are cited in any reuse.
Prerpints.org logo

Preprints.org is a free preprint server supported by MDPI in Basel, Switzerland.

Subscribe

Disclaimer

Terms of Use

Privacy Policy

Privacy Settings

© 2025 MDPI (Basel, Switzerland) unless otherwise stated