
Submitted:
31 January 2025
Posted:
31 January 2025
You are already at the latest version
Abstract
Background: Environmental and physiological factors influence human ionom, which requires the development of reliable region-specific reference intervals (RIs). This study aimed to establish population-based RIs of copper (Cu), zinc (Zn), selenium (Se), rubidium (Rb), and magnesium (Mg), in relation to age, sex, and physical activity. Methods: The RIs were established according to the CLSI EP28-A3c guidelines. A reference group of 120 directly selected healthy volunteers of Bulgarian nationality (60 males and 60 females, aged 18 to 65 years) were included in the study. The participants were separated into two groups: low (2 h/week, n=60) physical activity. Serum levels of Cu, Zn, Se, Rb, and Mg (sCu, sZn, sSe, sRb, sMg), were determined via collision cell inductively coupled plasma mass spectrometry (ICP-MS). Results: The RIs in this study are generally comparable to those in other countries. However, 43% of the participants had sSe lower than the threshold of 80 µg/L, correlating with the optimal expression of key selenoproteins. A significant sex-related difference was found for Cu (male vs female, p = 0.003), as well as an age-related significant difference for Cu between the groups of women below and above 30 years of age (p = 0.001). Conclusions: In this study, we verified the RIs of sCu, sZn, sSe, and sMg for the Bulgarian population with ICP-MS. A RI of sRb, missing up to the present was established, thus filling the gap. Specific sex-, age-, and physical activity-related associations of the elements were elucidated.
Keywords:
reference intervals
; inductively coupled plasma mass spectrometry
; minerals
; trace elements
; serum
; age
; sex
; physical activity
1. Introduction
Reliable reference intervals (RIs) are important benchmarks for adequately interpreting clinical laboratory results and defining their suitability for clinical use. The implementation in laboratory practice of the metrological traceability concept, based on legislative requirements, determines the standardization of laboratory results [1,2,3]. Along with the application of instrumental methods with high analytical reliability, it is a prerequisite for harmonization of both laboratory testing methods and RIs. RIs harmonization, aiming to investigate the applicability of common RIs, is supported by numerous coordinated national and international multicenter collaborations, conducting large RI studies [4]. Regardless of the undisputed feasibility of RI harmonization for most clinical chemistry parameters, some limitations concerning the essential microelements need to be considered [5,6,7]. The influence of specific local environmental, physiological, and cultural factors results in variable average microelement levels in different population groups. Factors like elemental content in soils and waters, lifestyle habits, sex and age, enzymatic and hormonal factors are crucial for human ionom [8,9].
Monitoring the status of essential macro- and micronutrients is recommended in multiple pathological conditions. There are studies reflecting the importance of the essential nutrients copper (Cu), zinc (Zn), selenium (Se), and magnesium (Mg) for human health. Cu, Zn, and Se are cofactors of some of the main antioxidant enzymes, Cu/Zn superoxide dismutase (Cu/Zn SOD) and glutathione peroxidase (GPx) [10,11]. Zn-containing enzymes control cell replication, membrane integrity, bone formation, growth, sexual maturation, and fetal development. Zn forms a complex with adrenocorticotropic hormone (ACTH) and insulin, participates in collagen formation, tightly involved in wound healing. It is important for sensory functions (taste, smell), as well as the immune and antioxidant defense [12,13]. Se is an essential trace element incorporated into the molecular structure of the so-called selenoproteins, containing selenocysteine. A large part of the selenoproteins (GPx1, GPx2, GPx4) are enzymes of key importance for the antioxidant and antiviral defense of the body, as well as for the maintenance of membrane integrity in the gastrointestinal tract, and male fertility [10,14,15,16]. The Se-dependent iodothyronine deiodinase enzymes (Dio1, Dio2) play a key role in intrathyroidal iodine metabolism [14]. Optimal Cu homeostasis is of particular importance for the immune and antioxidant defense of the body, iron metabolism, neurotransmission, energy metabolism system, erythropoiesis, skeletal development, and melanin synthesis [10,17,18,19]. Mg is an essential cofactor of more than 300 enzymes, participating in the glycolytic chain and transcellular ion transport, muscle contraction, and oxidative phosphorylation. It is important for the antioxidant and immune defense, RNA- and DNA synthesis, cellular energy metabolism, and neuromuscular excitability [20,21,22]. The clinical importance of Cu, Zn, Se, and Mg dyshomeostasis is an indication for multielement analysis in pathological conditions, based on processes such as oxidative stress and inflammation [10,22,23,24,25,26,27,28].
However, Rb is among the trace elements with biological significance still being studied. It is known that in terms of its participation in physiological processes, it resembles the behavior of potassium (K) and cesium and is closely related to K metabolism. Na+/K+ ATPase exhibits comparable affinity for K and Rb, but the ratio between intracellular and extracellular concentrations is higher for Rb [29,30]. In the synapses of the central nervous system, Rb increases the levels of neurotransmitters dopamine and norepinephrine and exhibits serotonin-like effects. Several large-scale studies involving experimental animals and humans demonstrate the benefits of Rb chloride administration as monotherapy or adjunctive therapy in patients with depressive disorders as analogs of tricyclic antidepressants but with fewer side effects [31,32].
Although interest in the element Rb has been growing in recent years, there is still scarce data in the scientific literature including groups of healthy individuals with relevant samples. To the best of our knowledge, there are no known RIs of Rb in healthy individuals from the Bulgarian population. Methodological challenges related to trace element quantification are the main reason for this gap. Analytical techniques such as atomic absorption spectrometry (AAS), inductively coupled plasma mass spectrometry (ICP-MS), and inductively coupled plasma optical emission spectrometry (ICP-OES) are most commonly used to determine trace elements in biological samples. These methods offer high analytical reliability for detecting trace elements, but on the other side are expensive and require highly specialized personnel. ICP-MS is widely recognized for its accuracy, sensitivity, and high performance, capable of performing rapid simultaneous multielement analysis [33].
RIs of serum Cu, Zn, Se, and Mg (sCu, sZn, sSe, sMg) were determined for the Bulgarian population in 1987 by AAS [34]. RIs of sCu and sZn were updated in 2014 and for sSe in pediatric groups in 2006 by AAS [35,36]. There is currently no data on RIs of serum Rb (sRb), as well as on RIs verified with inductively coupled plasma mass spectrometry (ICP-MS) for sCu, sZn, sSe and sMg in the Bulgarian population. These arguments highlight the need for the development of region-specific RIs. Our prospective study aimed to determine the RIs of the elements Cu, Zn, Se, Rb, and Mg in venous blood serum, via ICP-MS, in reference Bulgarian population, in relation to age, sex, and physical activity.
2. Materials and Methods
2.1. Reference Group
The RIs were established according to the CLSI EP28-A3c guidelines. [37]. The study was conducted in the period from 2017 to 2022 and included a reference group of 120 directly selected healthy volunteers of Bulgarian nationality, aged 18 to 65. The distribution of the participants by sex and age is presented in Table 1.
The inclusion criteria followed the generally accepted recommendations of CLSI [37]. Control of the reference individual’s clinical condition was accomplished at the Clinical Laboratory of UMHAT "Sаint George" in Plovdiv through anamnesis and routine clinical-laboratory blood tests (complete blood count, differential blood count, erythrocyte sedimentation rate, glucose, urea, creatinine, uric acid, C-reactive protein, total serum protein, albumin, alanine aminotransferase, aspartate aminotransferase, total cholesterol, triglycerides, HDL-cholesterol, LDL-cholesterol, sodium, potassium, chlorides, and calcium). All participants filled out a questionnaire with information about their weekly physical activity and were classified into two groups: 1) low physical activity - practicing sports up to 2 hours per week (n=60) and 2) intense physical activity - practicing sports more than 2 hours per week (n=60).
Exclusion criteria were as follows: acute inflammatory diseases in the previous 30 days, anemia, chronic diseases, obesity, alcohol abuse, smoking, drug addiction, occupational hazards, toxic exposure, night work, medicine intake, intake of dietary supplements containing Se, Zn, Cu, Rb and Mg in the previous 6 months, impaired glucose tolerance, pregnancy and lactation, surgical intervention up to 3 months before blood collection, severe injuries, severe physical and mental stress.
The study was conducted in accordance with the Declaration of Helsinki and approved by the Ethics Committee for Research of the Medical University of Plovdiv (protocol code №3/ 08.06.2017). Written informed consent was obtained from all subjects involved in the study.
2.2. Blood Sampling
Blood sampling was performed under fasting conditions, following the standard procedure for the collection of blood specimens. Blood used for multi-element analysis was collected in the second serum tube (Kabe Labortechnik, Primavette V Serum, 2.6 mL). Blood samples were allowed to clot for 20 minutes at room temperature and whereafter centrifuged at 3000 rpm for 10 min. All sera were evaluated macroscopically to reject samples with lipemia and hemolysis from the study. Serum subsamples were separated and stored at -70⁰ C until analysis. Twenty randomly selected subsamples were additionally mixed and homogenized, to be further used for the preparation of a quality control serum pool.
All labware used for blood sampling, storage, and analysis was previously tested for contamination with the elements of interest via in-house ICP-MS method [38].
2.3. Methods and Instruments
All chemicals used in this study, as well as the method for preanalytical preparation, the pseudomatrix-matched calibration, and the ICP-MS operating conditions, have all been previously thoroughly described [39]. Before measurement, an optimized simple microwave-assisted procedure for acid digestion of the serum samples was applied (Multiwave GO, Anton Paar, Graz, Austria). The determination of sCu, sZn, sSe, sRb, and sMg was carried out by ICP-MS (iCAP Qc, Thermo Fisher Scientific, Bremen, Germany) at the Research laboratory "Elemental analysis" by the Research Institute at the Medical University of Plovdiv. To overcome the isobaric spectral overlap interferences, and ensure the selectivity of the method, the following isotopes were identified as the most suitable: 24Mg, 65Cu, 66Zn, 78Se, 85Rb. The natural abundance (NA) of the isotopes was also taken into account, to guarantee maximum sensitivity. The signals of the isotopes chosen were measured using a collision cell in Kinetic energy discrimination (KED) mode, thus eliminating most of the polyatomic spectral interferences with the greatest prevalence for the selected isotopes (Table 2). To enable the analysis of the results the Thermo Scientific QtegraTM Software 2014 (Thermo Fisher Scientific Inc., Waltham, MA, USA) was used.
Accuracy and precision were checked with two levels of standard reference materials (Seronorm Trace Elements L1, L2, SERO AS, Norway). Additionally, a serum pool was prepared for the purposes of the internal quality control procedures.
2.4. Statistics
IBM SPSS Statistics 19 and Microsoft Office Excel 2010 software products were used for statistical data analysis. The level of statistical significance was set at p < 0.05. In the case of normally distributed values, the mean and the standard deviation (SD) were used for descriptive analysis. By deviation from normality, the median and the range (10th-90th percentile) were applied. The type of statistical distribution of the studied concentrations was evaluated by graphical analysis (histograms, boxplot diagrams), formal statistical tests (Kolmogorov-Smirnov and Shapiro-Wilk), and analysis of the determined coefficients of asymmetry (skewness and kurtosis). The presence of "fugitives" (outliers) was established by graphical analysis of the constructed boxplot diagrams - criterion 1.5 IQR (interquartile range).
A parametric method (mean ± 1.96.SD) was applied to determine the reference limits (RLs) of the investigated chemical elements with Gaussian distribution of the concentrations. Additional calculation of the 90% CI of the lower and upper reference limit (RL) was performed. In the case of a deviation from the normal distribution, two different approaches were applied: use of the parametric method (mean ± 1.96.SD), after transformation of the data using a decimal logarithm operator, or determination of the 2.5–97.5 percentile interval.
To evaluate the influence of age, sex, and physical activity on the concentrations of the analyzed parameters, T-test for independent samples (for two compared groups) and analysis of variance (ANOVA) (for more than two compared groups), in the case of Gaussian distributed quantities were applied. In cases where the concentrations of the chemical elements deviated from the normal distribution and/or the presence of "fugitives" was reported, non-parametric tests were applied, respectively Mann-Whitney and Kruskal-Wallis with Dunn post hoc analysis. The influence of patient's age on the levels of sMg, sZn, sCu, sSe, sRb was also evaluated by calculating the Kendall's Tau-b correlation coefficient.
3. Results
3.1. Quality Assurance
The internal laboratory quality control (IQC) procedure for each analytical series of 20 samples included the following steps:
Every batch of 12 samples was mineralized in the microwave oven in parallel with blank and QC samples;
Control of the linearity of the calibration curves;
Blank samples were included in the series after every 10th sample, to control the "carry-over" effect;
Control of random and systematic errors by testing QC samples using certified reference materials and in-house prepared control serum pool;
Testing of standard samples within the analytical series to monitor the instrumental drift.
For evaluation of the accuracy of measurements a recovery of the QC samples within the interval: target value ± 10% was accepted. The prepared serum pool was additionally used for evaluation of the QC results of Rb, as the available reference materials are missing target values in the concentration interval of interest. The mean and 95% CI for Rb in the serum pool have been calculated using the results of 22 measurements in different analytical series. The instrumental limits of detection (LoD), limits of quantification (LoQ), and the results of IQC for each of the elements are presented in Table 3.
Research laboratory "Elemental analysis" participated in the External Quality Assessment (EQAS) Program "Serum B and C, general clinical chemistry 2020/207" (LABQUALITY, Helsinki, Finland). The results are presented in Table 4.
3.2. Evaluation by Sex
In our study, a statistically significant difference between sexes was only found for the serum levels of Cu. The results of the measured sMg, sCu, sZn, sSe, and sRb in the total, male and female groups are presented in Table 5.
3.3. Evaluation by Age
To evaluate the influence of age on the concentrations of the studied elements, the distribution of their values in individual age groups by decades and by age intervals of 20 years was assessed. Since it was found that sex does not influence the concentrations of Mg, Zn, Se, and Rb, the statistical analysis was performed including the entire reference group for all four elements. Due to the proven statistically significant sex-related differences for sCu, the analysis groups were further stratified by sex.
Statistical analysis of the effect of age on Mg concentration showed the following: i) Kruskal-Wallis test: p = 0.163 and ii) Kendall's tau b: p = 0.031. Graphical analysis of the boxplot diagrams showed very close median values of Mg concentrations in the individual age groups, ranging from 19.0 to 20.9 mg/L. For this reason, we concluded that there is no clear trend of association between Mg concentration and the age of the reference individuals.
The results for sZn and sSe showed no influence of age on the concentrations of the elements (p > 0.05). The p-values from the statistical analysis of the influence of age on the concentration of Rb were very close to the limit level of significance (p ~ 0.04, Kruskal-Wallis, Kendall's tau b). Additional graphical analysis with boxplot diagrams by decade was performed. The results showed very close values for all patients, ranging from 146 to 282 µg/L, except one "fugitive" with sRb of 333 µg/L (Figure 1). Therefore we concluded, that there is no clinically significant association between Rb concentration and the age of the reference individuals.
To evaluate the influence of age on sCu levels, the reference group was stratified by sex in decades, due to the aforementioned sex-related differences. Age was found to have no statistically significant effect on Cu concentration in males (p > 0.05). However, a statistically significant difference (p = 0.001) was demonstrated between Cu concentration in women of different age groups. The highest concentrations were measured in women aged 51 to 60 years (Figure 2). By applying graphical analysis and the parametric ANOVA test with Post hoc analysis, multiple comparisons of arithmetic mean values between individual groups were made. The results showed a significant difference (p < 0.05) between Cu concentrations in women under 30 years of age vs women over 30 years of age.
3.4. Evaluation by Physical Activity
The influence of physical activity on the level of the elements Cu, Zn, Se, Mg, and Rb was evaluated for the whole reference group. Due to the significant influence of the factors sex and age on sCu level, the reference group was further stratified by sex and age for this element. The data obtained proved that both groups of physical activity: low and intense, had no statistically significant influence on the levels of the studied elements (p > 0.05).
3.5. Reference Limits
As the preliminary statistical analysis estimated no influence of sex and age on the concentrations of Mg, Zn, Rb, and Se, we determined common RLs of these elements for the entire reference group (Table 6). The analysis of sCu showed a statistically significant difference between the two sexes, as well as between the age groups up to 30 years, and above 30 years of age by women. Therefore, we determined separate RLs of sCu for men (18–65 years), women up to 30, and women above 30 years of age (Table 6).
Based on the data obtained for the normality of the distribution, a parametric method (mean ± 1.96.SD) for the calculation of the RLs was applied for the following elements: Mg and Se, Cu for men, and Cu for the group of women up to 30 years of age (95% CI). Due to a deviation from the normal distribution for the element Zn, a preliminary transformation of the data was performed, using a decimal logarithm operation. After normalization of the distribution, the aforementioned parametric method was applied to determine the RLs. The same approach was applied for sCu by women in the age interval from 31 to 65 years of age.
For the concentrations of Rb, a deviation from the normal statistical distribution and the presence of "outliers" were observed, which is why the RLs were determined by calculating the 2.5–97.5 percentile interval. Additional calculation of the 90% CI of the lower and upper RL was performed for all elements.
4. Discussion
In recent decades the personalized patient approach has become increasingly applicable regarding essential microelements, due to the lack of international consensus on the recommended daily intake. This approach would support the diagnosis, successful prevention, and compensation of clinically significant microelement deficiencies. Crucial to its implementation in practice is the use of reliable region-specific RIs.
The RIs of Cu, Se, and Zn of the present study were compared with literature data from representative samples of healthy subjects in studies conducted in 17 countries after 2005 (Table 7).
4.1. Serum Selenium RI
The arithmetic mean value of Se concentration in our reference group (83 µg/L) is within the interval of the values reported for healthy subjects from other European countries (65–111 µg/L) [40,41,43,48,52,55,56]. However, it is higher than the reported median (57 µg/L) for the Bulgarian population in 1987 by Tzatchev et al. [34]. Different dietary habits of Bulgarians 25–30 years ago, as well as the relatively lower number of participants in our study, should explain the discrepancies.
One of the most reliable approved biomarkers for evaluation of the adequacy of Se status is the sSe concentration. It correlates positively with the activity of the enzyme glutathione peroxidase (GPx) and selenoprotein P. The threshold Se level determining the optimal expression of these selenoproteins is about 80 µg/L, close to the arithmetic mean we found [57]. It should be noted, however, that 43% of the participants in our study had a concentration lower than 80 µg/L. Moreover, the lower RL determined by us is 55 µg/L, a value in the concentration range below 70 µg/L, associated with Se deficiency. Our findings should be attributed to the fact that Bulgaria, like most European countries, is among the Se-deficient areas on the world Se atlas [58]. In contrast, countries like the USA, Vietnam, and some areas of China reported mean sSe concentrations exceeding the limit of 120 µg/L [47,54,59]. Values of this order are interpreted as Se intoxication, associated with a high risk of metabolic syndrome and diabetogenic effects [60].
In our study, we found no significant statistical difference between male and female groups for sSe concentrations (p > 0.05). Our results corroborate the findings of previous studies [40,57]. However, higher sSe concentrations in men have been reported by some authors [49,62,63]. It is suggested that the higher muscle mass in males is the cause of the sex-related difference. Regarding age, our findings are in agreement with other studies reporting no influence of age on sSe levels in healthy subjects [40,49,62]. Chen et al. observed a statistically significant trend toward a decrease in Se concentrations after 40 years of age in a large-scale study (n=2755) conducted in Taiwan [61]. The authors hypothesize that the negative correlation between age and Se levels is due to the specific change in dietary habits of older individuals who are vegetarians for religious reasons.
Concerning the influence of physical activity on Se concentration, we found no statistically significant difference between the groups with weak and intense physical exertion. Our results corroborate the findings of other authors [64,65]. However, it should be taken into account that in the intensive load group (>2 hours per week) non-professional athletes were included. As opposed to our approach, Maynar et al. compared sCu, sZn, and sSe between professional athletes and sedentary individuals. Their results demonstrated a negative correlation of intense aerobic exercise with serum and urine concentrations of all three elements [66,67]. Under conditions of comparable dietary intake, the Se depletion found in these studies is logically associated with increased cellular metabolic demands for Se, due to the induced oxidative stress. Thereby the dynamics of Se status is associated with adaptive response through increased capacity of the protective intracellular and extracellular antioxidant mechanisms, including GPx and selenoprotein P [68]. Likely, several additional factors such as baseline Se status, type of exercise, and genetic factors influence the extent of Se depletion, as well as the redistribution between intracellular and extracellular Se pools.
4.2. Serum Copper RIs
The RLs of sCu determined by us are close to the reported values in healthy Bulgarians in 1987 and 2016 [34,35]. These fall within the range of 434–1896 µg/L summarized from other European studies (Table 7). The results from a large national survey (n = 6683) examining the health status and nutrition in the US population are in a much wider range of 247–3066 µg/L [54].
Our conclusions for the statistically significant sex-related differences of sCu confirm the findings of previous studies [35,40,41,46,49,62,63,69,70,71]. Some of them demonstrate up to twice higher values of sCu in female individuals, most probably caused by the estrogen-induced synthesis of ceruloplasmin in the liver. It is related to higher serum ceruloplasmin levels and increased Cu absorption in women aged 20–60 years. Moreover, estrogens, especially influenced by the intake of contraceptive drugs, directly affect the metabolism of Cu, contributing to increased sCu levels [72]. The effect of estrogens on Cu metabolism is highlighted in pregnant women, where serum levels are significantly higher compared to healthy non-pregnant women [73].
Regarding age, we found a positive correlation with sCu only in the female group. Our conclusions confirm the results published by other authors [35,40,52]. However, there are also studies in which no statistically significant influence of age on sCu levels has been found [49,62,69]. These discrepancies may be related to the specific influence of local geographical factors.
According to our data, no statistically significant influence of physical activity on sCu concentration was found, which we associate with the aforementioned characteristics of the representative sample. It is known that the enzyme synthesis of erythrocyte Cu/Zn-SOD increases during intense aerobic activity. This specific metabolic adaptation results in an intracellular retention of Cu, which improves antioxidant defense [74]. It has been experimentally demonstrated in professional athletes and is related to the simultaneous reduction of sCu and urinary Cu excretion [66,75].
4.3. Serum Zinc RIs
The RI determined in our study for sZn is close to the reported values for healthy individuals in other European countries (Table 7). The lower RL is in the range of 387–838 µg/L, with the lowest measured values in Serbia and the highest reported in England [40,52]. The upper RL is in the range of 839–1242 µg/L for European countries, significantly lower, compared to those reported for the USA (2325 µg/L) and Russia (1686 µg/L) [53,54]. sZn is a reliable laboratory indicator, both for diagnosing severe Zn deficiencies and for monitoring Zn supplementation. The Nutrition Biomarkers Expert Group and the International Zinc Nutrition Advisory Group recommend serum (plasma) Zn as the primary biomarker for assessing Zn status, along with two other criteria, namely dietary Zn intake and height-for-age ratio in infants and children [76]. Recommended guideline values for sZn have been determined as follows: 700 μg/L for females aged ≥10 years, and 740 μg/L for males aged ≥10 years [76]. According to these recommendations, 22% of our reference individuals in the male group and 10% of the female group met the criteria for deficiency but had levels close to the cut-off values. However, some additional factors that influence sZn should be considered, namely drugs, hormones, inflammatory processes, nutritional status, and alcohol consumption [77]. Regarding the influence of sex and age on sZn, we found no statistically significant sex- and age-related differences. Our results are in agreement with those of previous studies [35,40,41,46,49,62,71]. However, there are contradictory data in the scientific literature, possibly due to the influence of geographical factors and dietary habits. Healthy individuals from Great Britain, Serbia, and Portugal reported higher Zn values in men compared to women, while Switzerland and Russia estimated higher levels in females [40,52,53,63,70]. Some studies found a negative correlation between age and Zn concentration [46,70,77,78]. A possible explanation for these observations is the age-related reduction of intestinal absorption of some trace elements, including Zn [79]. However, Bocca et al., as well as Stojsavljević et al. reported statistically significant higher Zn concentrations in individuals over 40 years of age [52,69].
Zn plays a key role in the antioxidant defense as a component of erythrocyte Cu/Zn-SOD. Intense aerobic exercise induces enzyme synthesis and increases Zn requirements in athletes [74]. A recently published systematic review and meta-analysis summarizes that sZn is lower in athletes compared to sedentary individuals, despite increased dietary intake in athletes. This trend is probably related to the intracellular retention of Zn, providing antioxidant capacity and energy metabolism in the cell [80]. We did not observe such a tendency in our study, which has to be attributed to the characteristics of the representative sample.
4.4. Serum Rubidium RI
Rb is among the trace elements with significance for human organisms still being studied. According to the data of our study, the factors sex, age, and physical activity have no statistically significant influence on sRb. With this argument, we determined common RLs of sRb for men and women aged 18–65 years old (146–332 μg/L). The few published studies report similar levels for healthy individuals [41,53,70,81]. Relatively higher values were published in the study of Sivtseva et al. for a population inhabiting an arctic region in northern Russia (264–346 μg/L), as well as Cesbron et al. (207–1178) in France[53,82]. Significantly lower values were determined by Mueniz et al. in healthy subjects from Spain (83–195 μg/L) [83]. In a Swiss study of individuals above 70 years of age, Konz et al. reported relatively lower values than ours (98–215 μg/L) [70]. In contrast to our data, Sivtseva et al. found statistically significant (p = 0.005) higher sRb in men (323 μg/L) than in women (293 μg/L) [53]. Large-scale studies are needed to evaluate the influence of sex, age, and physical activity on sRb.
4.5. Serum Magnesium RI
The key role of Mg as an enzyme regulator involved in the processes of ATP synthesis and utilization has long been known. Serum and erythrocyte Mg concentrations decrease during exercise, and Mg supplementation has a protective effect against muscle damage [84,85,86]. Due to the increased Mg requirement in conditions of accelerated metabolism, physically active individuals need additional intake of Mg. Suboptimal or deficient sMg in subjects with increased physical exertion is associated with reduced efficiency of energy metabolism and reduced endurance capacity. Conversely, optimal Mg intake is associated with lower oxygen consumption and better cardiorespiratory indices during aerobic exercise [87].
The RI of Mg verified with the ICP-MS method in our study (15.8–24.1 mg/L) are close to the harmonized RLs used in practice (17.0–26.7 mg/L), as well as the reported RI for the Bulgarian population in 1987 (17.0–21.9 mg/L) measured by AAS [34]. Several multicenter studies conducted in Europe, the USA, China, Australia, and New Zealand established a low RL in the range of 17.0–19.4 mg/L and an upper RL in the range of 23.1–26.7 mg/L [27,88,89,90,91]. However, Shrivastava et al. published significantly higher values in a 2018 study with 120 healthy controls from central India (29.2 ± 5.3mg/L) [92]. Critical values related to medical decision-making have already been defined. A large prospective study (NHANES, n = 14353) conducted in the USA associated total sMg values below 17 mg/L with increased risk of cardiovascular disease and decreased overall survival [27]. According to our study, the factors sex, age, and physical activity have no statistically significant influence on the sMg, which is in agreement with the above-cited studies. Therefore, we can conclude that despite the variable RIs reported in the literature, the use of harmonized RI of total sMg (17.0–26.7 mg/L) is permissible, regardless of the analytical method used.
5. Conclusions
In this study, we verified the RLs of sCu, sZn, sSe, and sMg for the Bulgarian population with ICP-MS. Moreover, we established RLs of sRb, missing up to the present, thus filling the gap. The current manuscript has elucidated specific sex-, age-, and physical activity-related associations of the elements in healthy individuals. Our results are limited by a small number of subjects and a regional study population. However, the RLs determined are comparable with previously reported RLs for other European countries. This data may be helpful for the clinicians as a reference in the diagnosis and subsequent management of essential deficiencies, associated with specific pathological conditions.
Author Contributions
Conceptualization, D.D. and D.T.; methodology, D.D, G.K. and K.S.; software, D.D. and K.S.; validation, D.D.; formal analysis, D.D., G.K. and K.S.; investigation, D.D. and D.T.; resources, D.D. and D.T.; writing—original draft preparation, D.D.; writing—review and editing, D.D., D.T. and K.S.; visualization, D.D.; supervision, D.T.; project administration, D.D. and D.T. All authors have read and agreed to the published version of the manuscript.
Funding
This research was funded by MEDICAL UNIVERSITY OF PLOVDIV (project HO-1/ 2017). The APC was funded by MEDICAL UNIVERSITY OF PLOVDIV
Institutional Review Board Statement
The study was conducted in accordance with the Declaration of Helsinki and approved by the Ethics Committee for Research of the MEDICAL UNIVERSITY
Informed Consent Statement
Written informed consent was obtained from all subjects involved in the study.
Data Availability Statement
The data are not publicly available due to privacy restrictions.
Acknowledgments
We would like to thank Clinical laboratory at UMHAT “St. George”, Plovdiv for the help and support with collection of biological samples and performance of routine tests.
Conflicts of Interest
The authors declare no conflicts of interest.
References
- Regulation (EU) 2017/746 of the European Parliament and of the Council of 5 April 2017 on in vitro diagnostic medical devices and repealing Directive 98/79/EC and Commission Decision 2010/227/EU. Off J Eur Union 2017, 60, 176–332.
- ISO 17511:2020. In vitro diagnostic medical devices — requirements for establishing metrological traceability of values assigned to calibrators, trueness control materials and human samples. Geneva, Switzerland: International Organization for Standardization (ISO); 2020.
- Panteghini, M. An improved implementation of metrological traceability concepts is needed to benefit from standardization of laboratory results. Clin Chem Lab Med. 2024, 63, 270–278. [Google Scholar] [CrossRef] [PubMed]
- Doyle, K.; Bunch, D.R. Reference Intervals: Past, Present, and Future. Crit Rev Clin Lab Sci. 2023, 60, 466–482. [Google Scholar] [CrossRef]
- Bohn, M.K.; Bailey, D.; Balion, C.; Cembrowski, G.; Collier, C.; De Guire, V.; Higgins, V.; Jung, B.; Ali, Z.M.; Seccombe, D.; Taher, J.; Tsui, A.K.Y.; Venner, A.; Adeli, K. Reference Interval Harmonization: Harnessing the Power of Big Data Analytics to Derive Common Reference Intervals across Populations and Testing Platforms. Clin Chem. 2023, 69, 991–1008. [Google Scholar] [CrossRef] [PubMed]
- Adeli, K.; Higgins, V.; Trajcevski, K.; White-Al Habeeb, N. The Canadian Laboratory Initiative on Pediatric Reference Intervals: A CALIPER White Paper. Crit Rev Clin Lab Sci. 2017, 54, 358–413. [Google Scholar] [CrossRef]
- Friščić, I.; Perkov, S.; Radeljak, A. ; Stipanović-Kastelić, J; Paro, M.M.K. CLSI-based Verification and de Novo Establishment of Reference Intervals for Common Biochemical Assays in Croatian Newborns. Biochem Med (Zagreb). 2024, 34, е020705. 34,. [CrossRef]
- Dhaliwal, S.S.; Naresh, R.K.; Mandal, A.; Singh, R.; Dhaliwal, M.K. Dynamics and Transformations of Micronutrients in Agricultural Soils as Influenced by Organic Matter Build-up: a Review. Environ. Sustain. Indic. 2019, 1–2, e100007. [Google Scholar] [CrossRef]
- Rayman, M.P. Food-chain Selenium and Human Health: Emphasis on Intake. Br J Nutr. 2008, 100, 254–268. [Google Scholar] [CrossRef]
- Verma, P.; Sharma, A.K.; Shankar, H.; Sharma, A.; Rao, D.N. Role of Trace Elements, Oxidative Stress and Immune System: a Triad in Premature Ovarian Failure. Biol Trace Elem Res. 2018, 184, 325–333. [Google Scholar] [CrossRef]
- Skalny, A.A.; Tinkov, A.A.; Medvedeva, Y.S.; Alchinova, I.B.; Karganov, M.Y.; Skalny, A.V.; Nikonorov, A.A. Effect of Short-term Zinc Supplementation on Zinc and Selenium Tissue Distribution and Serum Antioxidant Enzymes. Acta Sci Pol Technol Aliment. 2015, 14, 269–276. [Google Scholar] [CrossRef]
- Oteiza, P.I. Zinc and the Modulation of Redox Homeostasis. Free Radic Biol Med. 2012, 53, 1748–1759. [Google Scholar] [CrossRef]
- Jarosz, M.; Olbert, M.; Wyszogrodzka, G.; Młyniec, K.; Librowski, T. Antioxidant and anti-inflammatory effects of zinc. Zinc-dependent NF-κB signaling. Inflammopharmacology 2017, 25, 11–24. [Google Scholar] [CrossRef] [PubMed]
- Rayman, M. P. Selenium and human health. Lancet 2012, 379, 1256–1268. [Google Scholar] [CrossRef]
- Köhrle, J.; Jakob, F.; Contempré, B.; Dumont, J.E. Selenium, the thyroid, and the endocrine system. Endocr Rev. 2005, 26, 944–984. [Google Scholar] [CrossRef] [PubMed]
- Hawkes, W.C.; Turek, P.J. Effects of dietary selenium on sperm motility in healthy men. J Androl. 2001, 22, 764–772. [Google Scholar] [CrossRef] [PubMed]
- Scheiber, I.F.; Dringen, R. Astrocyte functions in the copper homeostasis of the brain. Neurochem Int. 2013, 62, 556–565. [Google Scholar] [CrossRef]
- Scheiber, I.F.; Mercer, J.F.; Dringen, R. Metabolism and functions of copper in brain. Prog Neurobiol. 2014, 116, 33–57. [Google Scholar] [CrossRef]
- Uriu-Adams, J.Y.; Keen, C.L. Copper, oxidative stress, and human health. Mol Aspects Med. 2005, 26, 268–298. [Google Scholar] [CrossRef]
- Yamanaka, R.; Tabata, S.; Shindo, Y.; Hotta, K.; Suzuki, K.; Soga, T.; Oka, K. Mitochondrial Mg2+ homeostasis decides cellular energy metabolism and vulnerability to stress. Sci Rep. 2016, 6, 1–12. [Google Scholar] [CrossRef]
- Chacko, S.A.; Sul, J.; Song, Y.; Li, X.; LeBlanc, J.; You, Y.; Butch, A.; Liu, S. Magnesium supplementation, metabolic and inflammatory markers, and global genomic and proteomic profiling: A randomized, double-blind, controlled, crossover trial in overweight individuals. Am J Clin Nutr. 2011, 93, 463–473. [Google Scholar] [CrossRef]
- Fang, X.; Wang, K.; Han, D.; He, X.; Wei, J.; Zhao, L.; Imam, M. U.; Ping, Z.; Li, Y.; Xu, Y.; Min, J.; Wang, F. Dietary magnesium intake and the risk of cardiovascular disease, type 2 diabetes, and all-cause mortality: A dose-response meta-analysis of prospective cohort studies. BMC Med. 2016, 14, 210–223. [Google Scholar] [CrossRef]
- Jurowski, K.; Szewczyk, B.; Nowak, G.; Piekoszewski, W. Biological consequences of zinc deficiency in the pathomechanisms of selected diseases. J Biol Inorg Chem. 2014, 19, 1069–1079. [Google Scholar] [CrossRef] [PubMed]
- Mocchegiani, E.; Giacconi, R.; Muzzioli, M.; Cipriano, C. Zinc, infections and immunosenescence. Mech Ageing Dev. 2000, 121, 21–35. [Google Scholar] [CrossRef] [PubMed]
- Rayman, M.P. Selenium intake, status, and health: a complex relationship. Hormones (Athens). 2020, 19, 9–14. [Google Scholar] [CrossRef] [PubMed]
- Arora, M.; Mahat, R.K.; Kumar, S.; Mustafa, I.; Sah, S.P. Study of Trace Elements in Patients of Hypothyroidism with Special Reference to Zinc and Copper. Biomed J Sci Tech Res. 2018, 6, 11–16. [Google Scholar] [CrossRef]
- Zhang, X.; Xia, J.; Del Gobbo, L.C. , Hruby, A.; Dai, Q.; Song, Y. Serum magnesium concentrations and all-cause, cardiovascular, and cancer mortality among U.S. adults: Results from the NHANES I Epidemiologic Follow-up Study. Clin Nutr. 2018, 37, 1541–1549. [Google Scholar] [CrossRef]
- Kim, D.J.; Xun, P.; Liu, K.; Loria, C.; Yokota, K.; Jacobs, D.R.; He, K. Magnesium intake in relation to systemic inflammation, insulin resistance, and the incidence of diabetes. Diabetes Care 2010, 33, 2604–2610. [Google Scholar] [CrossRef]
- Ikehara, T.; Yamaguchi, H.; Sakai, T.; Miyamoto, H. (1984). Kinetic parameters and mechanism of active cation transport in HeLa cells as studied by Rb+ influx. Biochim Biophys Acta. 1984, 775, 297–307. [Google Scholar] [CrossRef]
- Nielsen, F. H. (2017). Nonessential Trace Minerals: Basic Nutritional and Toxicological Aspects. Mol Genet Nutr Asp Major Trace Miner. 2017, 1, 527–537. [Google Scholar] [CrossRef]
- Kordjazy, N.; Haj-Mirzaian, A.; Amiri, S.; Ostadhadi, S.; Kordjazy, M.; Sharifzadeh, M.; Dehpour, A.R. Elevated level of nitric oxide mediates the anti-depressant effect of rubidium chloride in mice. Eur J Pharmacol. 2015, 762, 411–418. [Google Scholar] [CrossRef]
- Krachler, M.; Wirnsberger, G.H. Long-term changes of plasma trace element concentrations in chronic hemodialysis patients. Blood Purif. 2000, 18, 138–143. [Google Scholar] [CrossRef]
- Ruggieri, F.; Alimonti, A.; Bocca, B. Full validation and accreditation of a method to support human biomonitoring studies for trace and ultra-trace elements. TrAC Trends Anal Chem. 2016, 80, 471–485. [Google Scholar] [CrossRef]
- Tzatchev, K.N. Reference limits of selenium, zinc, copper, iron and magnesium in blood serum and amniotic fluid and their informative content in some malignant diseases. Thesis for the award of the scientific degree “Candidate of Medical Sciences”, Medical University-Sofia, Bulgaria, 1987.
- Ivanova, I.D.; Atanasova, B.D.; Kostadinova, A.D.; Bocheva, Y.D.; Tzatchev, K.N. Serum Copper and Zinc in a Representative Sample of Bulgarian Population. Acta Medica Bulgarica 2016, 43, 21–31. [Google Scholar] [CrossRef]
- Tzatchev, K.N.; Lozanov, B.S. , Apostolova, E. H.; Dobrikov, P.; Atanasova, B.D.; Vasilev, V.G.; Deskova, D. Reference values for serum selenium of children in the Area of Smolyan, Bulgaria. Acta Medica Bulgarica. 2006, 33, 3–6. [Google Scholar]
- Clinical and Laboratory Standards Institute (CLSI). Defining, establishing, and verifying reference intervals in the clinical laboratory; approved guideline – third edition. CLSI document C28-A3c. Wayne: CLSI; 2008.
- Davcheva, *!!! REPLACE !!!*; D.M., *!!! REPLACE !!!*; Kirova, G.K.; Tsvetkova, T.Z.; Kmetov, V.J. 02–03 June 2018, Davcheva; D.M.; Kirova G.K.; Tsvetkova T.Z.; Kmetov, V.J. Contamination control in quantitative analysis of trace elements in human serum. In Proceedings of the National Scientific Conference “15 Years of Pharmacy in Medical University – Plovdiv”, Devin (Bulgaria), . 165–168.
- Davcheva, D.M.; Kirova, G.K.; Tsvetkova, T.Z.; Terzieva, D.D.; Kiryakova, M.T.; Kmetov, V.J. Preanalytical sample preparation and calibration optimization for ICP-MS analysis of copper, zinc, selenium, rubidium, strontium, magnesium, iron, molybdenum and barium. Bulg. Chem. Commun.
- Ghayour-Mobarhan, M.; Taylor, A.; New, S.A.; Lamb, D.J.; Ferns, G.A. Determinants of serum copper, zinc and selenium in healthy subjects. Ann Clin Biochem. 2005, 42, 364–375. [Google Scholar] [CrossRef] [PubMed]
- Arnaud, J.; de Lorgeril, M.; Akbaraly, T.; Salen, P.; Arnout, J.; Cappuccio, F.P.; van Dongen, M.C.; Donati, M.B.; Krogh, V.; Siani, A.; Iacoviello, L. European Collaborative Group of the IMMIDIET Project (2012). Gender differences in copper, zinc and selenium status in diabetic-free metabolic syndrome European population - the IMMIDIET study. Nutr Metab Cardiovasc Dis, 22. [CrossRef]
- Ghasemi, A.; Zahediasl, S.; Hosseini-Esfahani, F.; Azizi, F. Reference values for serum zinc concentration and prevalence of zinc deficiency in adult Iranian subjects. Biol Trace Elem Res. 2012, 149, 307–314. [Google Scholar] [CrossRef]
- Bülow Pedersen, I.; Knudsen, N.; Carlé, A.; Schomburg, L.; Köhrle, J.; Jørgensen, T.; Rasmussen, L.B.; Ovesen, L.; Laurberg, P. Serum selenium is low in newly diagnosed Graves' disease: a population-based study. Clin Endocrinol 2013, 79, 584–590. [Google Scholar] [CrossRef] [PubMed]
- Schultze, B.; Lind, P.M.; Larsson, A.; Lind, L. Whole blood and serum concentrations of metals in a Swedish population-based sample. Scand J Clin Lab Invest. 2014, 74, 143–148. [Google Scholar] [CrossRef]
- Christensen, K.; Werner, M.; Malecki, K. Serum selenium and lipid levels: Associations observed in the National Health and Nutrition Examination Survey (NHANES) 2011–2012. Environ Res. 2015, 140, 76–84. [Google Scholar] [CrossRef]
- Rocha, G.H.O.; Steinbach, C.; Munhoz, J.R.; Madia, M.A.O.; Faria, J.K.; Hoeltgebaum, D.; Barbosa, F.; Batista, B.L.; Souza, V.C.O.; Nerilo, S.B.; Bando, E.; Mossini, S.A.G.; Nishiyama, P. Trace metal levels in serum and urine of a population in southern Brazil. J Trace Elem Med Biol. 2016, 35, 61–65. [Google Scholar] [CrossRef]
- Zhang, H.; Yan, C.; Yang, Z.; Zhang, W.; Niu, Y.; Li, X.; Qin, L.; Su, Q. Alterations of serum trace elements in patients with type 2 diabetes. J Trace Elem Med Biol. 2017, 40, 91–96. [Google Scholar] [CrossRef]
- González-Estecha, M.; Palazón-Bru, I.; Bodas-Pinedo, A.; Trasobares, E.; Palazón-Bru, A.; Fuentes, M.; Cuadrado-Cenzual, M.Á. , Calvo-Manuel, E. Relationship between serum selenium, sociodemographic variables, other trace elements and lipid profile in an adult Spanish population. J Trace Elem Med Biol. 2017, 43, 93–105. [Google Scholar] [CrossRef] [PubMed]
- Kim, H.J.; Lim, H.S.; Lee, K.R.; Choi, M.H.; Kang, N.M.; Lee, C.H.; Oh, E.J.; Park, H.K. Determination of trace metal levels in the general population of Korea. Int J Environ Res Public Health. 2017, 14, 702. [Google Scholar] [CrossRef] [PubMed]
- Khatun, S.; Santhini, G.; Malligai, E.; Kumar, H.V. Evaluation of Serum Zinc, Copper Level and their Correlation with Cu/Zn Ratio and FT3/FT4 Ratio in Hypothyroidism. J Clin Diagnostic Res. 2019, 13, 13–15. [Google Scholar] [CrossRef]
- Salih, S.F.; Hussen, K.R.; Al-Timimi, D.J. Status of Serum Zinc Levels in Females with Thyroid Dysfunction. Duhok Med. J. 2019, 13, 74–82. [Google Scholar] [CrossRef]
- Stojsavljević, A.; Jagodić, J.; Vujotić, L.; Borković-Mitić, S.; Rašić-Milutinović, Z.; Jovanović, D.; Gavrović-Jankulović, M.; Manojlović, D. Reference Values for Trace Essential Elements in the Whole Blood and Serum Samples of the Adult Serbian Population: Significance of Selenium Deficiency. Environ Sci Pollut Res Int. 2020, 27, 1397–1405. [Google Scholar] [CrossRef]
- Sivtseva, A.I.; Sivtseva, E.N.; Shadrina, S.S.; Melnikov, V.N.; Boyakova, S.I.; Dokhunaeva, A.M. Microelement Composition of Serum in Dolgans, Indigenous Inhabitants of the Russian Arctic, in the Conditions of Industrial Development of Territories. Int J Circumpolar Health. 2020, 79, 1764304. [Google Scholar] [CrossRef]
- Bastola, M.M.; Locatis, C.; Maisiak, R.; Fontelo, P. Selenium, Copper, Zinc аnd Hypertension: An Analysis of the National Health and Nutrition Examination Survey (2011-2016). BMC Cardiovasc Disord. 2020, 20, 45. [Google Scholar] [CrossRef]
- Cabral, M.; Kuxhaus, O.; Eichelmann, F.; Kopp, J.F.; Alker, W.; Hackler, J.; Kipp, A.P.; Schwerdtle, T.; Haase, H.; Schomburg, L.; Schulze, M.B. Trace Element Profile and Incidence of Type 2 Diabetes, Cardiovascular Disease and Colorectal Cancer: Results from The EPIC-Potsdam Cohort Study. Eur J Nutr. 2021, 60, 3267–3278. [Google Scholar] [CrossRef]
- Bizerea-moga, T.O.; Pitulice, L.; Bizerea-spiridon, O.; Moga, T.V. Evaluation of Serum Selenium Status by Age and Gender: A Retrospective Observational Cohort Study in Western Romania. Nutrients 2021, 13, 1497. [Google Scholar] [CrossRef]
- Kipp, A.P.; Strohm, D.; Brigelius-Flohé, R.; Schomburg, L.; Bechthold, A.; Leschik-Bonnet, E.; Heseker, H.; German Nutrition Society (DGE). Revised Reference Values for Selenium Intake. J Trace Elem Med Biol. 2015, 32, 195–199. [Google Scholar] [CrossRef]
- Krustev, S.V.; Angelova, V.R.; Zaprjanova, P.S.; Nankova, M.I.; Ivanov, K.I. Selenium Content in Soil and Wheat Grain in Bulgaria. Acta sci. agric. 2020, 4, 26–31. [Google Scholar] [CrossRef]
- Tekeste, Z.; Amare, B.; Asfaw, F.; Fantahun, B.; van Nguyen, N.; Nishikawa, T.; Yabutani, T.; Okayasu, T.; Ota, F.; Kassu, A. Determination of Trace Elements in Ethiopian, Vietnamese, and Japanese Women Using High-resolution ICP-MS. Nutrition. 2015, 31, 1243–1246. [Google Scholar] [CrossRef] [PubMed]
- Stranges, S.; Marshall, J.R.; Natarajan, R.; Donahue, R.P.; Trevisan, M.; Combs, G.F.; Cappuccio, F.P.; Ceriello, A.; Reid, M.E. Effects of Long-Term Selenium Supplementation on the Incidence of Type 2 Diabetes: A Randomized Trial. Ann Intern Med. 2007, 147, 217–223. [Google Scholar] [CrossRef]
- Chen, C.J.; Lai, J.S.; Wu, C.C.; Lin, T.S. Serum Selenium in Adult Taiwanese. Sci Total Environ. 2006, 367, 448–450. [Google Scholar] [CrossRef] [PubMed]
- Clark, N.A.; Teschke, K.; Rideout, K.; Copes, R. Trace Element Levels in Adults from the West Coast of Canada and Associations with Age, Gender, Diet, Activities, and Levels of Other Trace Elements. Chemosphere 2007, 70, 155–164. [Google Scholar] [CrossRef]
- Viegas-Crespo, A.M.; Pavão, M.L.; Paulo, O.; Santos, V.; Santos, M.C.; Nève, J. Trace Element Status (Se, Cu, Zn) and Serum Lipid Profile in Portuguese Subjects of San Miguel Island from Azores'archipelago. J Trace Elem Med Biol. 2000, 14, 1–5. [Google Scholar] [CrossRef]
- Sánchez, C.; López-Jurado, M.; Aranda, P.; Llopis, J. Plasma Levels of Copper, Manganese and Selenium in an Adult Population in Southern Spain: Influence of Age, Obesity and Lifestyle Factors. Sci Total Environ. 2010, 408, 1014–1020. [Google Scholar] [CrossRef]
- Toro-Román, V.; Bartolomé, I.; Siquier-Coll, J.; Robles-Gil, M.C.; Muñoz, D.; Maynar-Mariño, M. Analysis of Intracellular and Extracellular Selenium Concentrations: Differences According to Training Level. Nutrients. 2022, 14, 1857. [Google Scholar] [CrossRef]
- Maynar, M.; Bartolomé, I.; Alves, J.; Barrientos, G.; Grijota, F.J.; Robles, M.C.; Muñoz, D. Influence of a 6-month physical training program on serum and urinary concentrations of trace metals in middle distance elite runners. J Int Soc Sports Nutr. 2019, 16, 53. [Google Scholar] [CrossRef]
- Maynar, M.; Muñoz, D.; Alves, J.; Barrientos, G.; Grijota, F.J.; Robles, M.C.; Llerena, F. Influence of an Acute Exercise Until Exhaustion on Serum and Urinary Concentrations of Molybdenum, Selenium, and Zinc in Athletes. Biol Trace Elem Res. 2018, 186, 361–369. [Google Scholar] [CrossRef]
- Baltaci, A.K.; Mogulkoc, R.; Akil, M.; Bicer, M. Review - Selenium - Its metabolism and relation to exercise. J Pharm Sci. 2016, 29, 1719–1725. [Google Scholar]
- Bocca, B.; Madeddu, R.; Asara, Y.; Tolu, P.; Marchal, J.A.; Forte, G. Assessment of reference ranges for blood Cu, Mn, Se and Zn in a selected Italian population. J Trace Elem Med Biol. 2011, 25, 19–26. [Google Scholar] [CrossRef] [PubMed]
- Konz, T.; Migliavacca, E.; Dayon, L.; Bowman, G.; Oikonomidi, A.; Popp, J.; Rezzi, S. ICP-MS/MS-Based Ionomics: A Validated Methodology to Investigate the Biological Variability of the Human Ionome. J Proteome Res. 2017, 16, 2080–2090. [Google Scholar] [CrossRef]
- Oddoze, C.; Lombard, E.; Portugal, H. Stability study of 81 analytes in human whole blood, in serum and in plasma. Clin Biochem. 2012, 45, 464–469. [Google Scholar] [CrossRef]
- Babić, Ž.; Tariba, B.; Kovačić, J.; Pizent, A.; Varnai, V.M.; Macan, J. Relevance of serum copper elevation induced by oral contraceptives: A meta-analysis. Contraception. 2013, 87, 790–800. [Google Scholar] [CrossRef] [PubMed]
- Bacelova, M.G.; Gatseva, P.D.; Deneva, T.I. , Davcheva, D.M., Bivolarska, A.V. Are the elements zinc, copper, magnesium, and rubidium related to nutrition and iodine deficiency in pregnant Bulgarian women from iodine deficient region? Cent Eur J Public Health. 2024, 32, 31–38. [Google Scholar] [CrossRef]
- Mena, P.; Maynar, M.; Gutierrez, J.M.; Maynar, J.; Timon, J.; Campillo, J.E. Erythrocyte free radical scavenger enzymes in bicycle professional racers. Adaptation to training. Int J Sports Med. 1991, 12, 563–566. [Google Scholar] [CrossRef]
- Muñoz, D.; Maynar, M.; Barrientos, G.; Siquier-Coll, J.; Bartolomé, I.; Grijota, F.J.; Robles, M.C. Effect of an Acute Exercise Until Exhaustion on the Serum and Urinary Concentrations of Cobalt, Copper, and Manganese Among Well-Trained Athletes. Biol Trace Elem Res. 2019, 189, 387–394. [Google Scholar] [CrossRef]
- King, J.C.; Brown, K.H.; Gibson, R.S.; Krebs, N.F.; Lowe, N.M.; Siekmann, J.H.; Raiten, D.J. Biomarkers of Nutrition for Development (BOND)-Zinc Review. J Nutr. 2015, 146, 858S–885S. [Google Scholar] [CrossRef]
- Yokokawa, H.; Fukuda, H.; Saita, M.; Miyagami, T.; Takahashi, Y.; Hisaoka, T.; Naito, T. Serum zinc concentrations and characteristics of zinc deficiency/marginal deficiency among Japanese subjects. J Gen Fam Med. 2020, 21, 248–255. [Google Scholar] [CrossRef]
- Rembach, A.; Hare, D.J.; Doecke, J.D.; Burnham, S.C.; Volitakis, I.; Fowler, C.J.; Cherny, R.A.; McLean, C.; Grimm, R.; Martins, R.; Ames, D.; Masters, C.L.; Bush, A.I.; Roberts, B.R. Decreased serum zinc is an effect of ageing and not Alzheimer's disease. Metallomics. 2014, 6, 1216–1219. [Google Scholar] [CrossRef]
- Holt, P.R. Intestinal malabsorption in the elderly. Dig Dis. 2007, 25, 144–150. [Google Scholar] [CrossRef] [PubMed]
- Chu, A.; Holdaway, C.; Varma, T.; Petocz, P.; Samman, S. Lower Serum Zinc Concentration Despite Higher Dietary Zinc Intake in Athletes: A Systematic Review and Meta-analysis. Sports Med. 2018, 48, 327–336. [Google Scholar] [CrossRef] [PubMed]
- Heitland, P.; Köster, H.D. Human biomonitoring of 73 elements in blood, serum, erythrocytes and urine. J Trace Elem Med Biol. 2021, 64. [Google Scholar] [CrossRef]
- Cesbron, A.; Saussereau, E.; Mahieu, L.; Couland, I.; Guerbet, M.; Goullé, J.P. Metallic profile of whole blood and plasma in a series of 106 healthy volunteers. J Anal Toxicol. 2013, 37, 401–405. [Google Scholar] [CrossRef] [PubMed]
- Muñiz, C.S.; Fernández-Martin, J.L.; Marchante-Gayón, J.M.; García Alonso, J.I.; Cannata-Andía, J.B.; Sanz-Medel, A. Reference values for trace and ultratrace elements in human serum determined by double-focusing ICP-MS. Biol Trace Elem Res. 2001, 82, 259–272. [Google Scholar] [CrossRef]
- Bohl, C.H.; Volpe, S.L. Magnesium and exercise. Crit Rev Food Sci Nutr. 2002, 42, 533–563. [Google Scholar] [CrossRef]
- Córdova, A.; Mielgo-Ayuso, J.; Roche, E. , Caballero-García, A.; Fernandez-Lázaro, D. Impact of Magnesium Supplementation in Muscle Damage of Professional Cyclists Competing in a Stage Race. Nutrients 2019, 11, 1927. [Google Scholar] [CrossRef]
- Maynar, M.; Crespo, C.; Llerena, F. , Grijota, F.; Alves, J.; Muñoz, D.; Caballero, M.J. Influence of physical exercise on serum concentration of magnesium and phosphorus. Med Dello Sport. 2015, 68, 577–84. [Google Scholar]
- Tardy, A.L.; Pouteau, E.; Marquez, D.; Yilmaz, C.; Scholey, A. Vitamins and Minerals for Energy, Fatigue and Cognition: A Narrative Review of the Biochemical and Clinical Evidence. Nutrients 2020, 12, 228. [Google Scholar] [CrossRef]
- Martinez-Sanchez, L.; Cobbaert, C.M.; Noordam, R.; Brouwer, N.; Blanco-Grau, A.; Villena-Ortiz, Y.; Thelen, M.; Ferrer-Costa, R.; Casis, E.; Rodríguez-Frias, F.; den Elzen, W.P.J. Indirect determination of biochemistry reference intervals using outpatient data. PloS one, 0268. [Google Scholar] [CrossRef]
- Rustad, P.; Felding, P.; Franzson, L.; Kairisto, V.; Lahti, A.; Mårtensson, A.; Hyltoft Petersen, P.; Simonsson, P.; Steensland, H.; Uldall, A. The Nordic Reference Interval Project 2000: recommended reference intervals for 25 common biochemical properties. Scand J Clin Lab Invest. 2004, 64, 271–284. [Google Scholar] [CrossRef] [PubMed]
- Tate, J.R.; Sikaris, K.A.; Jones, G.R.; Yen, T.; Koerbin, G.; Ryan, J.; Reed, M.; Gill, J.; Koumantakis, G.; Hickman, P.; Graham, P. Harmonising adult and paediatric reference intervals in australia and new zealand: an evidence-based approach for establishing a first panel of chemistry analytes. Clin Biochem Rev. 2014, 35, 213–235. [Google Scholar] [PubMed]
- Wang, J.L.; Weng, Y.L.; Pan, W.H.; Kao, M.D. Trends and nutritional status for magnesium in Taiwan from NAHSIT 1993 to 2008. Asia Pac J Clin Nutr. 2011, 20, 266–274. [Google Scholar] [PubMed]
- Shrivastava, S. , Shrivastava S. An evaluation of serum electrolytes level among patients having hypothyroidism. Int J Sci Res 2018, 7, 2277–8179. [Google Scholar]
Figure 1.
Box and whisker plots illustrating the distribution of sRb concentrations distributed by decade. Box, interquartile range; Bar, median; Whiskers, maximum and minimum values.
Figure 1.
Box and whisker plots illustrating the distribution of sRb concentrations distributed by decade. Box, interquartile range; Bar, median; Whiskers, maximum and minimum values.
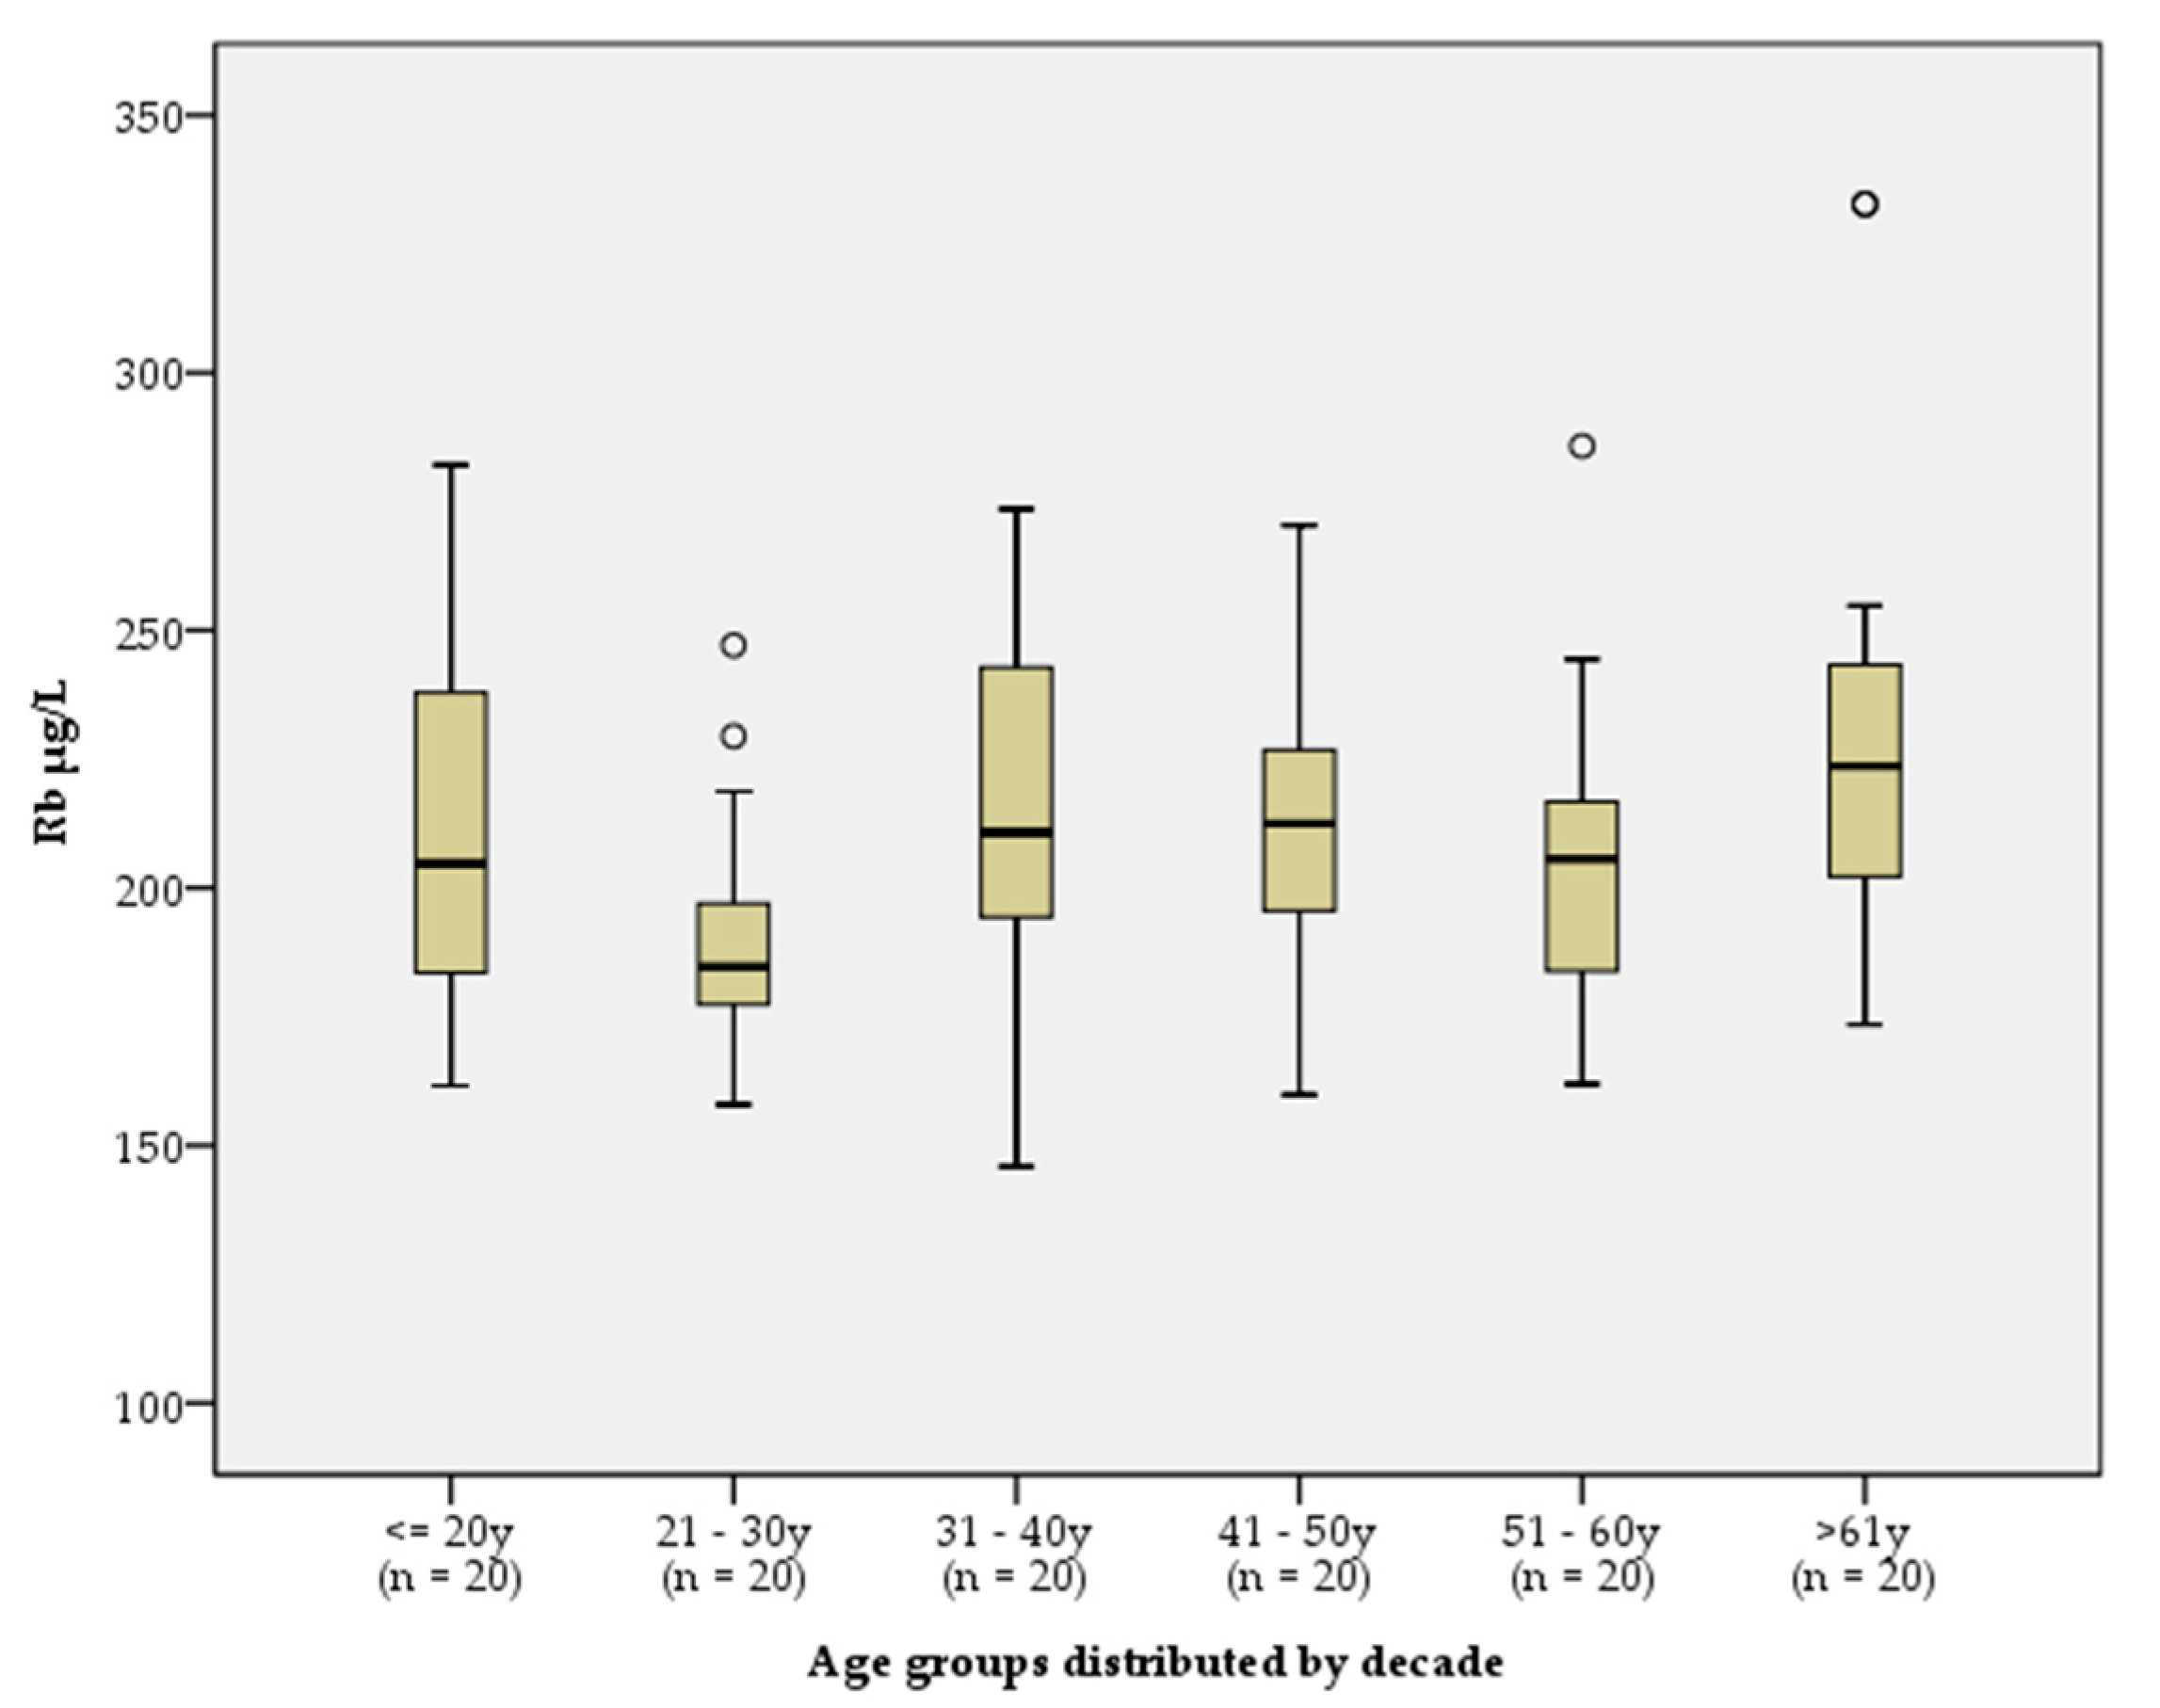
Figure 2.
Box and whisker plots illustrating the distribution of sCu concentrations by women, stratified by age. Box, range; Bar, mean; Whiskers, maximum and minimum values.
Figure 2.
Box and whisker plots illustrating the distribution of sCu concentrations by women, stratified by age. Box, range; Bar, mean; Whiskers, maximum and minimum values.
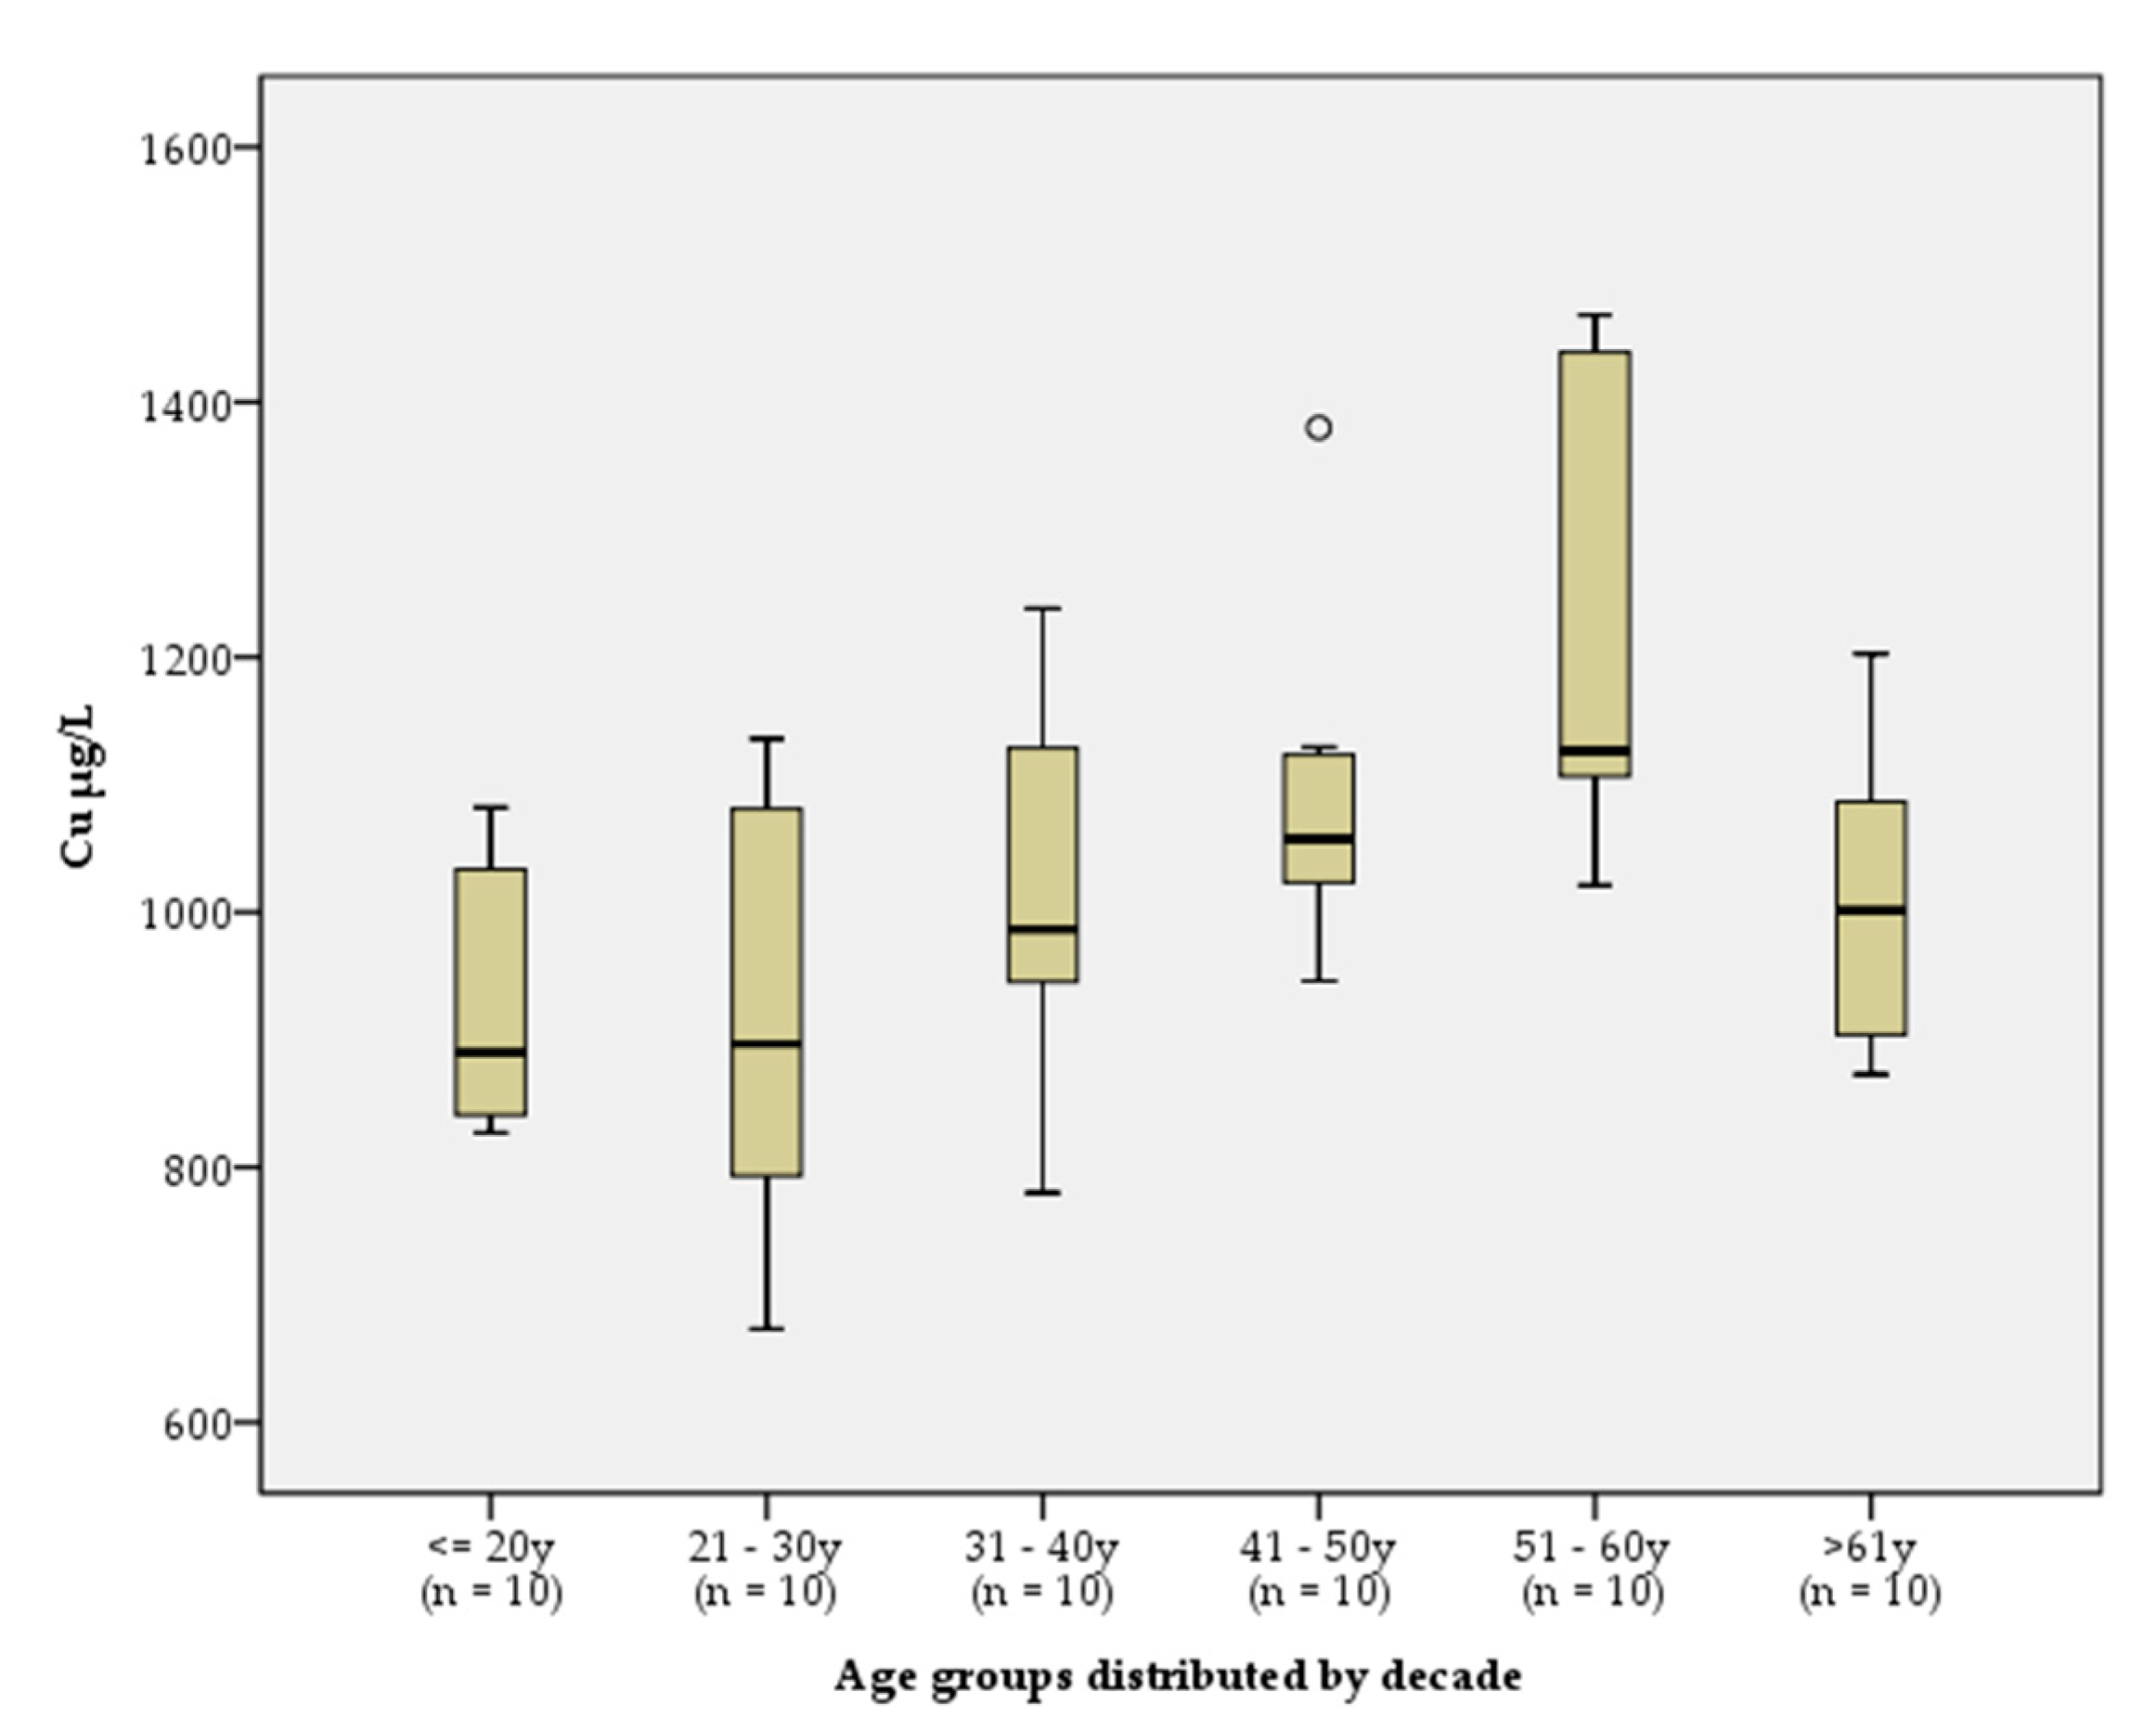

Table 1.
Distribution of the participants by sex and age.
| Variables | All participants | Age group (years) | ||
|---|---|---|---|---|
| 18–30 | 31–50 | 51–65 | ||
| Total (n) | 120 | 40 | 40 | 40 |
| Male/ Female (n) | 60/60 | 20/20 | 20/20 | 20/20 |
Table 2.
Isotopes of the investigated elements, NA, and potential polyatomic mass spectral interferences.
Table 2.
Isotopes of the investigated elements, NA, and potential polyatomic mass spectral interferences.
| Isotop | NA (%) | Polyatomic spectral interferences |
|---|---|---|
| 24Mg | 78.70 | 12C2, 1H23Na, 16O1H7Li, 14N10B |
| 65Cu | 30.3 | 14N51V, 16O1H48Ti, 1H64Zn, 40Ar25Mg, 12C53Cr, 40Ar24MgH |
| 66Zn | 27.9 | 14N52Cr, 1H65Cu, 40Ar26Mg, 12C54Fe, 16O50Cr, 12C54Cr |
| 78Se | 23.78 | 14N64Zn, 12C66Zn, 1H77Se, 16O1H61Ni, 40Ar38Ar, 40Ar37ClH, 38Ar40Ca |
| 85Rb | 72.20 | 40Ar45Sc, 16O69Ga, 1H84Kr, 14N71Ga, 16O1H68Zn |
Table 3.
LoD, LoQ and results of the IQC reported in µg/L/ *mg/L.
| Element | LoD1 | LoQ2 | SeronormTM Trace ElementsSerum L-1 |
SeronormTM Trace ElementsSerum L-2 |
||||
|---|---|---|---|---|---|---|---|---|
| Mean3 | Target value | 95% CI | Mean1 | Target value | 95% CI | |||
| Mg* | 0.0004 | 0.0014 | 17.0 | 16.8 | 13.4–20.1 | 33.6 | 33.9 | 27.1–40.7 |
| Cu | 0.003 | 0.011 | 1075 | 1088 | 999–1176 | 1801 | 1850 | 1700–2000 |
| Zn | 0.007 | 0.025 | 1077 | 1097 | 952–1242 | 1639 | 1617 | 1404–1831 |
| Se | 0.0065 | 0.02 | 84 | 87 | 76–99 | 137 | 138 | 120–157 |
| Rb | 0.043 | 0.17 | 5.1 | 4.3 | NA | 9.4 | 8.5 | NA |
| Rb | 0.043 | 0.17 | 229 | 2324 | 228–2374 | |||
1LoD = 3.SD/ √n; 2LoQ = 10.SD/ √n; 3Mean of the laboratory; 4Calculated mean and 95%CI of the in-house prepared control serum pool; NA – not reported by the provider.
Table 4.
Accuracy for EQAS Program LABQUALITY “Serum B and C, general clinical chemistry 2020/16”.
| Element | LABQUALITY Serum B | LABQUALITY Serum C | ||||
|---|---|---|---|---|---|---|
| Measured | Target | Dev% | Measured | Target | Dev% | |
| Mg (mmol/L) | 0.830 | 0.874 | 0.035 | 0.82 | 0.851 | 0.033 |
| Cu (µmol/L) | 16.60 | 15.00 | 2.57 | 16.10 | 14.77 | 2.15 |
| Zn (µmol/L) | 25 | 26.8 | 1.3 | 24 | 25.9 | 2 |
| Se (µmol/L) | 1.05 | 1.05 | 0.14 | 0.82 | 0.82 | 0.13 |
Table 5.
Serum concentrations of Mg, Cu, Zn, Se, and Rb in the total, male, and female groups, presented as median and percentile interval [P2.5, P97.5].
Table 5.
Serum concentrations of Mg, Cu, Zn, Se, and Rb in the total, male, and female groups, presented as median and percentile interval [P2.5, P97.5].
| Element | Total (n=120) | Male (n=60) | Female (n=60) | Significance | |||
|---|---|---|---|---|---|---|---|
| Med | [P2.5, P97.5] | Med | [P2.5, P97.5] | Med | [P2.5, P97.5] | ||
| Mg mg/L | 20.0 | [16.7, 23.4] | 20.1 | [16.8, 23.3] | 19.8 | [16.5, 24.8] | p = 0.7891 |
| Cu μg/L | 980 | [758, 1459] | 954 | [751,1202] | 1030 | [724, 1594] | p = 0.0031 |
| Zn μg/L | 817 | [649, 1102] | 863 | [613, 1125] | 811 | [654,1108] | p = 0.0522 |
| Se μg/L | 82 | [62, 117] | 83 | [61, 114] | 81 | [60, 145] | p = 0.2981 |
| Rb μg/L | 205 | [158, 286] | 205 | [151,262] | 209 | [159, 333] | p = 0.3152 |
1 The Independent Samples T-Test was applied. 2 The Mann-Whitney Test was applied.
Table 6.
Serum concentrations of Mg, Cu, Zn, Se and Rb, presented as median and interval [P2.5, P97.5], and calculated RIs.
Table 6.
Serum concentrations of Mg, Cu, Zn, Se and Rb, presented as median and interval [P2.5, P97.5], and calculated RIs.
| Element | Group | Median [P2.5, P97.5] | Calculated RI |
|---|---|---|---|
| Mg mg/L | Total | 20.0 [16.7, 23.4] | 15.8–24.1 |
| Zn μg/L | Total | 817 [649, 1102] | 634–1079 |
| Se μg/L | Total | 82 [62, 117] | 55–112 |
| Rb μg/L | Total | 205 [158, 286] | 146–332 |
| Cu μg/L | Male | 954 [751, 1202] | 685–1221 |
| Cu μg/L | Female < 30y | 891 [673, 1134] | 583–1259 |
| Cu μg/L | Female > 30y | 1106 [780, 1464] | 757–1533 |
Table 7.
Comparison of sCu, sSe and sZn (µg/L) in healthy individuals from different countries.
| Study | n (М/F) | Age (years) | Method | Cu | Se | Zn |
|---|---|---|---|---|---|---|
| Current study, 2017–2022 | 120 (60/60) | 18–65 | ICP-MS | 566–1533 | 55–112 | 634–1079 |
| Bulgaria, 1987 [34] | 345 | ААS/ ЕТААS | 681–1736 | 32–91 | 693–1242 | |
| Bulgaria, 2006 [36] | 143 | 6–10 | ЕТААS | - | 36–102 | - |
| Bulgaria, 2013–2015 [35] | 379 (172/207) | 12–95 | ААS | 630–1584 | - | 765–960 |
| England, 2005 [40] | 189 (94/95) | 20–70+ | ААS | 898–1158 | 77–83 | 838–936 |
| Italy, Belgium, England, 2012 [41] | 1609 (748/861) | 27–63 | ААS/ ЕТААS | 547–1896 | 59–135 | 595–1092 |
| Iran, 2012 [42] | 2632 (1920/712) | 20–94 | ААS | - | - | 608–2013 |
| Denmark, 2013 [43] | 830 (155/675) | 18–65 | F | - | 59–138 | - |
| Sweden, 2014 [44] | 1000 (498/502) | 70 | SFMS | 589–1332 | - | 503–961 |
| USA, 2015 [45] | 2287 (1107/1180) | 12–80+ | ICP-MS | - | 120–693 | - |
| Brazil, 2016 [46] | 240 (175/65) | 18–74 | ICP-MS | 736–2801 | - | 600–1228 |
| China, 2016 [47] | 1327 (446/881) | 40–70 | ICP-MS | 520–1540 | 100–300 | 550–1300 |
| Spain, 2016 [48] | 372 (60/312) | 20–70 | ЕТААS | - | 56–103 | - |
| Korea, 2017 [49] | 258 (119/139) | 12–78 | ICP-MS | 678–1545 | 79–167 | 555–1287 |
| India, 2019 [50] | 80 (7/73) | 18–55 | SPM | 991–1820 | - | 770–1247 |
| Iraq, 2019 [51] | 100 (F) | 25–70 | ААS | - | - | 598–1126 |
| Serbia, 2019 [52] | 295 (146/149) | 38–42 | ICP-MS | 434–1042 | 41–98 | 387–839 |
| Russia, 2020 [53] | 107 (35/72) | 34–60 | ICP-MS | 1004–1922 | - | 678–1686 |
| USA, 2020 [54] | 6683 (3289/ 3394) |
8–80 | ICP-MS | 247–3066 | 58–299 | 314–2325 |
| Germany 2021 [55] | 2087 | 35–64 | ICP-MS/MS | 688–1354 | 61–99 | 543–913 |
| Romania, 2021 [56] | 1264 (1053/211) | 16–89 | ICP-MS | - | 64–137 | - |
M, men; F, women; SPM, spectrophotometry; SFMS, sector field mass spectrometry; F, Fluorimetry; ICP-MS/MS, inductively coupled plasma tandem mass spectrometry.
Disclaimer/Publisher’s Note: The statements, opinions and data contained in all publications are solely those of the individual author(s) and contributor(s) and not of MDPI and/or the editor(s). MDPI and/or the editor(s) disclaim responsibility for any injury to people or property resulting from any ideas, methods, instructions or products referred to in the content. |
© 2025 by the authors. Licensee MDPI, Basel, Switzerland. This article is an open access article distributed under the terms and conditions of the Creative Commons Attribution (CC BY) license (http://creativecommons.org/licenses/by/4.0/).
Copyright: This open access article is published under a Creative Commons CC BY 4.0 license, which permit the free download, distribution, and reuse, provided that the author and preprint are cited in any reuse.


