
Submitted:
30 January 2025
Posted:
30 January 2025
You are already at the latest version
Abstract
Functional characterization of peptide fraction (PF) from snake venom has provided novel opportunities to investigate possible neuroprotective compounds relevant to pharmaceuticals. This study was performed to investigate the PF-mediated neuroprotection obtained from Naja mandalayensis snake venom, a member of the Elapidae family, using two neuronal cell lines: undifferentiated PC12 and differentiated mHippoE-18, in response to H2O2-induced oxidative stress. Cells were pretreated for 4 h with PF (10, 1, 0.01, and 0.001 μg mL⁻1), thereafter exposed to H2O2 (0.5 mmol L⁻1) for 20 h. Then, the oxidative stress markers and label-free differential proteome strategy were analyzed to understand the neuroprotective effects of PF. In PC12 cells, PF showed no neuroprotective effects against oxidative stress. In mHippoE-18 cells, PF at 0.01 and 0.001 μg mL⁻1 increased viability and metabolism of cells against H2O2-induced neurotoxicity, reducing reactive oxygen species (ROS) generation. Interestingly, PF also exhibited a substantial reduction in baseline ROS levels compared to the control, indicating that PF could have compounds with antioxidant features. The comparative proteomic profiling identified 53 proteins with differential expression related to antioxidant action, catalysis, molecular function regulators, structural molecule activity, translation regulatory activity, ATP, and binding. The PF + H₂O₂ group indicated that protein expression is 6% upregulated, 4% downregulated, and 94% unchanged compared to the H2O2 group. Three significant proteins upregulated in the PF + H2O2 group, including elongation factor 2 (P58252), proteasome subunit alpha type (E9Q0X0), and E2 ubiquitin-conjugating enzyme (A0A338P786), suggested that PF-mediated neuroprotection happens through translational regulation and the degradation of defective proteins via the proteasome complex. Additionally, differential protein expression in PF changed the metabolism, protein synthesis, synaptic activity, and intracellular transport, suggesting that PF contains the rich mixture of bioactive peptides of interest pharmacologically. Overall, this study offers new opportunities for evaluating whether PF's neuroprotective features in specific neuronal cells are maintained and to investigate neurodegenerative disease drug development processes.
Keywords:
Naja mandalayensis
; Neuroprotective
; Bioactive peptide
; Reactive oxygen species
; Label-free analysis
1. Introduction
Snake venom is a rich mixture of enzymatic and non-enzymatic compounds, including bioactive peptides [1,2,3]. Understanding the characteristics and variations of snake venom has led to the discovery of peptides with therapeutic properties of interest to the pharmaceutical industry [4] and the development of some drugs approved for commercialization based on peptides present in snake venom [4]. Previous studies have shown promising results in the bioprospecting of neuroprotective compounds in the low molecular weight fraction and in peptides from the venom of snakes Bothrops jararaca (B. jararaca) and Bothrops atrox (B. atrox), both family Viperidae, in different models for the study of neurodegenerative diseases [5,6,7,8,9,10,11]. Although the venom of snakes of the family Elapidae contains a wide variety of components with properties of pharmaceutical interest [12], their study for the bioprospecting of neuroprotective compounds is still little explored.
Neurodegenerative diseases (NDs) are characterized by the progressive loss of neurons, usually caused by metabolic or toxic disorders, and can lead to death [13,14]. Neurodegeneration is a complex process that shares many fundamental pathways associated with neuronal dysfunction, including oxidative stress, programmed cell death, neuroinflammation, excitotoxicity, mitochondrial dysfunction, lipid peroxidation, and protein misfolding [13,14,15,16]. Currently, some available therapies aim to improve the symptoms caused by NDs, however, these treatments do not address the underlying neurodegeneration associated with these conditions and often come with significant side effects [14,17]. Thus, given the current therapies available for the treatment of NDs, new searches for effective therapies for these diseases have sought to be based on possible pathways with neuroprotective potential [18].
Oxidative stress is considered a metabolic disorder characterized by an imbalance between the production of free radicals and the defenses of the antioxidant system to neutralize them [19,20,21]. If unchecked and not removed by antioxidant defenses, reactive oxygen species (ROS) cause cellular damage, including protein oxidation, DNA and RNA damage, and lipid peroxidation [22,23,24]. Oxidative stress is described as the basis of many NDs, and the use of in vitro models that mimic oxidative stress to understand the pathogenesis of NDs and to search for treatments for them has been well described [25], including the use of hydrogen peroxide (H2O2). The main cell lines used to study NDs are SH-SY5Y, SK-N-MC, and PC12 [26].
Snakes of the genus Naja spp. belong to the family Elapidae [27]. The snake Naja mandalayensis (N. mandalayensis) is endemic to the central region of Myanmar and is found in arid areas [28]. The proteomics of the crude venom of N. mandalayensis was described in 2021 by Beraldo and collaborators, which revealed a complex mixture of proteins [29]. Among the proteins identified in the venom of N. mandalayensis, some already known from snake venoms were identified, such as three-finger toxins (3FTx), phospholipases A2 (PLA2s), snake venom metalloproteinases (SVMPs), L-amino acid oxidases (LAAOs), cysteine-rich venom protein (CRISP), venom 5-nucleotidase (V5N) and venom nerve growth factor (VNGF) [29], with most of the proteins found being the 3FTx (cytotoxins and neurotoxins) [29]. Abdullah and collaborators recently reported the neuroprotective effects mediated by phospholipase A2 (A2-EPTX-NSm1a), isolated from the venom of the snake Naja sumatrana, in neuronal cells of the SH-SY5Y type against oxidative stress induced by H2O2 [30]. PLA2 belongs to the family of proteins with enzymatic activities and are well described as components of the venom of Viperidae and Elapidae snakes [2,4]. Although they have a higher molecular mass than the peptides of interest in the present study (< 10 kDa), these results, as well as the variation in elapid venom, show that the study of neuroprotective compounds in the venom of another snake of this family may be promising. Thus, the identification of neuroprotective pharmacological properties of interest found in the venom of snakes from the families Viperidae and Elapidae suggests that other compounds may be found in the venom of other snakes. Therefore, the present study sought to identify new neuroprotective compounds present in peptide fraction (PF) of N. mandalayensis, a snake of the family Elapidae, against oxidative stress using two cell lines: undifferentiated PC12 cells derived from rat adrenal medullary pheochromocytoma, capable of secreting catecholamines such as norepinephrine and dopamine [31,32,33,34]; and, differentiated mHippoE-18 derived from mouse embryonic hippocampus [35], exhibiting neuronal-like morphological and functional properties as well as neuronal markers [35].
2. Materials and Methods
2.1. Reagents and Cell Lines
The chemicals used in this research were obtained from Sigma Aldrich© (St. Louis, MO, USA) or comparable sources with above 98% analytical purity. The solutions were prepared using deionized water filtered through a 22 μM pore membrane and resistivity above 18.2 Ω (Merck Millipore; Burlington, Massachusetts, USA). Two cell lines were employed in the present study: Neuronal PC12 cell derived from a transplantable rat pheochromocytoma (CRL-1721™ from the American Type Culture Collection - ATCC, Manassas, VA, USA); and, hippocampal mHippoE-18 cells derived from primary culture of embryonic mouse hippocampal cell (CLU199, CELLutions Biosystems, Ontario, Canada).
2.2. Crude Venom and Obtaining PF
The crude venom of the N. mandalayensis snake obtained from individuals in captivity [29] and was provided by the Butantan Institute through a partnership with the Ministry of Health of Myanmar. The PF was prepared by Dr. Emidio Beraldo Neto, researcher of the Butantan Institute, using a molecular weight cut-off 10 kDa filter (Amicon Ultracel), according to the manufacturer’s specifications. The fraction obtained was lyophilized and stored at -20 ◦C until use.
2.3. PF Characterization by Mass Spectrometry
PF was analyzed by mass spectrometry on an ESI-IT-TOF coupled to a UFLC (20A Prominence, Shimadzu). The sample was injected into a C18 column (Kinetex C18, 5 μm; 50 × 2.1 mm) in a binary solvent system: solvent A containing water, acid (999:1); and solvent B containing ACN, water, and acid (900:99:1). The elution gradient used was 0-100% of solvent B for 20 min in a constant flow of 0.2 ml⋅min-1, after initial isocratic elution for 5 min. The interface was kept at 4.5 kV and 200°C. Detector operated at 1.95 kV. MS spectra were acquired in positive mode, in the 300–1900 m⋅z−1 range.
2.4. Culture and Maintenance
PC12 and mHippoE-18 cells were routinely cultured in low glucose (D10) and high medium (DH10) DMEM (Dulbecco's Modified Eagle Medium; Thermo Fisher Scientific Inc. MA, USA), respectively, and containing 10% fetal bovine serum (FBS) (Thermo Fisher Scientific Inc. MA, USA), inactivated at 56 °C in a water bath for 30 min. All medium were also supplemented with 1% (v⋅v⁻1) of 10000 U⋅mL⁻1 penicillin, 10 mg⋅mL⁻1 streptomycin and 25 µg⋅mL⁻1 amphotericin B solutions (Sigma-Aldrich, St. Louis, MO, USA). The cultures were kept at 37 ºC in a humidified atmosphere containing 5% CO2 and 95% air (Forma™ Series 3 Water Jacketed CO2 Incubator; Thermo Scientific Inc., MA, USA). Culture medium was replaced every 2-3 days, and at 80% confluence, cells were passaged using trypsin-EDTA solution [0.05% (m⋅v⁻1) trypsin and 0.02% (m⋅v⁻1) EDTA] to PC12 cells; and, Versene solution (140 mmol⋅L⁻1 NaCl, 2.7 mmol⋅L⁻1 KCl, 10 mmol⋅L⁻1 Na2HPO4, 1.8 mmol⋅L⁻1 KH2PO4, and 0.5 mmol⋅L⁻1 EDTA) to mHippoE-18 cells.
2.5. Cytotoxic Effects of PF
The assessment was conducted in PC12 and mHippoE-18 cells through a period of 24 h of treatment. Cells were cultured into 96-well plates (Nest Biotechnology, Rahway, NJ, USA), with a cell density of 5 x 10³ for PC12 cells and 2.5 x 10³ for mHippoE-18 cells per well in 100 μL of D10 or DH10 for 24 h, respectively. Subsequently, cells were treated with PF at 10, 1, and 0.01 μg⋅mL⁻1. Cell viability was assessed using two methods: cell integrity evaluated with crystal violet dye [36], and metabolic activity by the conversion of resazurin to resorufin [37]. All experiments included untreated cells (negative control) and exposed to acrylamide (100 mmol⋅L⁻1; positive control). Data were shown as box-and-whisker plots of three independent experiments in sextuplicate, and represent the percentage of cell integrity or metabolic in relation to the control.
2.6. Cell Integrity
Following the treatments, the medium was removed, and 50 μL of 0.5% violet crystal solution was introduced to each well. The plate was homogenized for 20 min (20 oscillations per min) (IKA KS 260 basic, South America, Brazil) at room temperature. Thereafter, the violet crystal solution was removed and the plate was subjected to two washes with deionized water. The plate was completely dried, then 200 μL of methanol was added. The absorbance of the violet samples was measured at 570 nm using a BioTek Epoch microplate reader (Santa Clara, CA, USA).
2.7. Metabolic Activity
Cells were exposed to different conditions in D10 or DH10 medium, containing resazurin at 40 μM. After 24 h of incubation, the fluorescence reading of the resazurin reduction in resorufin was done at these times in the microplate reader (BioTek Synergy HT Multi Mode Microplate Reader, Santa Clara, CA, USA), with 530 nm excitation and 590 nm emission.
2.8. Neuroprotection Against Oxidative Stress in PC12 and mHippoE-18 Cells
2.8.1. H2O2-Induced Oxidative Stress Effects
Initially, the H2O2-induced oxidative stress effects were evaluated in both cell types. PC12 and mHippoE-18 cells (5 x 10³ and 2.5 x 10³ in 100 μL per well, respectively) were plated in 96-well plates (Nest Biotechnology, Rahway, NJ, USA) and incubated for 24 h. After, the D10 or DH10 medium was replaced, and the cells were incubated at 37 °C for 4 h. Then, the medium was removed and a new medium was added containing different concentrations of H2O2 (2, 1, 0.5, and 0.3 mmol⋅L⁻1), and the cells were incubated again for 20 h at 37°C with 5% CO2. Untreated cells were included as control group. Cell viability measured the H2O2-induced oxidative stress effects in both cells using the crystal violet dye method previously described [36]. Subsequently, the resazurin method [37] and the 2′,7′-dichlorodihydrofluorescein diacetate (H2DCFDA; Sigma-Aldrich, St. Louis, MO, USA) staining [9,38], were employed to assess the impact of oxidative stress on the metabolic activity and ROS production of cells at a concentration of 0.5 mmol⋅L⁻¹ H₂O₂. Data were shown as box-and-whisker plots of three independent experiments in sextuplicate, and represent the percentage in relation to the control.
2.8.2. Neuroprotection Assay
In the neuroprotection model, cells were pretreated for 4 h with cell type-specific culture media containing PF at doses of 10, 1, and 0.01 μg⋅mL⁻1. After, the culture media was discarded and replaced with a fresh medium containing identical doses of PF and H2O2 (0.5 mmol⋅L⁻1) (PF + H2O2 group), followed by an incubation period of 20 h. Cells that were treated for 4 h only with culture medium and subsequently maintained in that medium (control group) or incubated exclusively with H2O2 (H2O2 group) for 20 h were also a part of the experiments. The evaluation of neuroprotective effects was conducted through the assessment of cell integrity, metabolism, and the ROS production. Additional tests were conducted in mHippoE-18 cells, utilizing PF concentrations of 0.001 μg⋅mL⁻1. Data were shown as box-and-whisker plots of three independent experiments in sextuplicate, and represent the percentage in relation to the control.
2.8.3. ROS Quantification
Briefly, 50 μL of culture medium from the experimental groups were distributed into a 96-well black plate (SPL Life Sciences, Korea), followed by the addition of 145 μL of PBS and 5 μL of H2DCF-DA at a concentration of 1 mmol⋅L-1 (Sigma Aldrich®, St. Louis, MO, USA). The plate was incubated at 37°C for 1.5 h. The fluorescence was subsequently assessed using a microplate reader (BioTek Synergy HT Multi Mode Microplate Reader, Santa Clara, CA, USA), employing 480 nm excitation and 530 nm emission wavelengths. The data were presented as percentages relative to the control, displayed in box-and-whisker plots.
2.8.4. Label-Free Quantitative Mass Spectrometry Analysis
The mHippoE-18 cells were seeded at 3.2 x 10⁴ per well in 12-well plates (Nest Biotechnology, Rahway, NJ, USA) and incubated for 24 h. Subsequently, different cell groups (control, H202, PF, PF + H202; 4 wells per group) were either untreated or subjected to treatment following previous experimental design (Figure 1) using 0.001 μg⋅mL⁻1 PF. Subsequently, the cells were washed with PBS twice, and total protein was extracted using methanol. In-solution digestion was performed on the cell culture samples. Samples were cleaned up using C18 ZipTips (Merck KGaA, Darmstadt, Germany). One microliter of the resulting solution, containing the tryptic peptides, was subjected to nano-ESI-LC-MS/MS using a Dionex Ultimate 3000 RSLCnano (Thermo Fisher Scientific, Waltham, MA, USA) coupled to an Impact II Mass spectrometer (Bruker Daltonics, Bremen, Germany). The samples were injected in a nano-trap Acclaim PepMap (Dionex-C18, 100 Å, 75 μm × 2 cm) in 2% solvent A2 (0.1% formic acid) for 2 min, under a 5 µL·min− 1 flow rate. Elution was performed by a linear gradient of 5–40% of solvent B2 (0.1% formic acid in ACN), for 120 min, under 350 µL·min− 1 flow rate. Mass spectra were acquired in positive mode. MS and MS/MS scans were acquired at 2 Hz, in a 50–2000 m·z− 1 range. CID energy ramped between 7 and 70 eV. Data were processed by Peaks Studio 8.5 (Bioinformatics Solution Inc., Waterloo, ON, Canada), and searched against the UniProt Mus musculus Reference Proteome (UP000000589). Label-free proteomic analyses were conducted using the PEAKS Q module in PEAKS Studio 8.5. Initially, the LC-MS/MS chromatographic data were aligned, followed by peptide identification and quantification through database searches using the Peaks DB algorithm. Relative changes in peptide abundance were calculated by comparing peak areas derived from the extracted ion chromatograms. The analysis parameters included a precursor ion mass tolerance of 15 ppm and normalization of the area under the curve (AUC) for each peptide based on the total ion current (TIC). Peptide ratios between experimental groups were estimated and filtered using the software's automated detection criteria [39].
2.9. Statistical Analyses
Data were analyzed using one-way analysis of variance (ANOVA) for between-groups comparisons followed by a Tukey’s post-hoc test for multiple comparisons or Tukey’s post-hoc test to compare each of a number of treatments with a single control. Values of p < 0.05 were considered to be statistically significant. The analyses were performed using GraphPad Prism 6.0 software (GraphPad Software, Inc., La Jolla, CA). Proteomic analyses were conducted using the PEAKS software, relying on its built-in statistical algorithms to identify proteins differentially expressed across experimental conditions.
3. Results
3.1. PF Analysis by Mass Spectrometry
PF was obtained by molecular cutting of the crude venom in Amicon Ultracel filter (10 kDa) and characterized by mass spectrometry using the LC-ESI-IT-MS/MS method. The chromatographic profile of PF indicated that the retention time of most compounds occurred from 6 to 15 min (Figure 1A). The molecular mass analysis of PF compounds with retention times between 6 and 15 min indicated that the present components have a molecular mass less than 10 kDa when analyzing the relations between intensity and mass/charge ratio (m·z− 1) (Figure 1 B-I).
3.2. Toxicological Profile of PF
PC12 cells treated with PF for 24 h decreased in cell viability at 10 and 0.01 μg⋅mL⁻¹, but increased at 1 μg⋅mL⁻¹ when compared to the control group (Figure 2A). PF at 1 and 0.01 μg⋅mL⁻¹ enhanced the metabolic activity of PC12 cells; however, this effect was not observed at a concentration of 10 μg⋅mL⁻¹ after 24 h of treatment (Figure 2B). In mHippoE-18 cells, PF increased cell viability only at a concentration of 0.01 μg⋅mL⁻¹, relative to the control group (Figure 2C). The metabolic activity of mHippoE-18 cells treated with PF decreased at all tested concentrations (Figure 2D). Acrylamide (100 mmol⋅mL⁻¹) in both cell types under the same treatment conditions resulted in decreased integrity and metabolism compared to the control (Figure 2A-D).
3.3. Oxidative Stress Model in PC12 and mHippoE-18 Cells
Cells were pre-treated for 4 h at 37°C with PF diluted in D10 or DH10 or only medium. After that, the mediums were replaced by mediums containing PF or/and H2O2 and incubated for 20 h more (Figure 3A). PC12 cells exposed to H2O2 at 2, 1, 0.5 and 0.3 mmol⋅mL⁻¹ for 20 h exhibited a dose-dependent loss of cellular integrity (Figure 3B). The 0.5 mmol⋅mL⁻¹ H2O2 diminished cell integrity by 23.67 ± 7.04% and cellular metabolism by 15.55 ± 6.65% (Figure 3C), while also elevating ROS generation by 48.7 ± 25.8% relative to the control (Figure 3D). In mHippoE-18 cells, a decrease in integrity was detected corresponding to the tested concentrations of H2O2 (Figure 3E). In these cells, H2O2 (mmol⋅mL⁻¹) diminished integrity by 28.89 ± 15.68%, decreased cellular metabolism by 10.24 ± 4.85% (Figure 2F), and elevated ROS generation by 9.5 ± 7.7% (Figure 3G).
3.4. PF-Mediated Neuroprotection Against Oxidative Stress in PC12 and mHippoE-18 Cells
The cell integrity of the PF + H2O2 group had no effect on the damage induced by H2O2 at all tested concentrations when compared to the results from the H2O2 group (Figure 4A) in PC12 cells. The PF + H2O2 group exhibited significantly higher cell metabolism at 10 and 1 μg⋅mL⁻¹ relative to the H₂O₂ group (Figure 4B). Despite this, the PF + H₂O₂ maintained levels of ROS generation comparable to the H₂O₂ group (Figure 4C). Cells in the H₂O₂ group exhibited diminished cell integrity and metabolic activity, with elevated ROS levels, in comparison to the control group (Figure 4A-C). In mHippoE-18 cells submitted to oxidative stress (H2O2 group), the cell integrity and metabolism were reduced compared to control, but these were restored when the cells were also treated with PF at 0.01 μg⋅mL⁻¹ (PF + H2O2 group) (Figure 4D and 4E). Also, cells treated with PF + H2O2 at 0.01 μg⋅mL⁻¹ increased metabolic activity compared to H2O2 group (Figure 4E). However, when ROS generation was measured in cells treated with PF + H2O2 at various doses, there was no reduction in ROS production compared to the H2O2 group. However, the PF + H2O2 group produced less ROS than the control group at doses of 0.01 and 0.001 μg⋅mL⁻¹ (Figure 4F). After analyzing the integrity and metabolism of the PF + H2O2 group, a lower concentration of PF (0.001 μg⋅mL⁻¹) was evaluated for preserving integrity. Cells treated with this dose showed higher integrity than cells treated with H2O2 (Figure 4G).
The relation between ROS production and cell viability in each condition indicated that the H2O2 group (1.38 ± 0.04; p < 0.001) exceeded the control group (1.00 ± 0.08), whereas the PF + H2O2 group at 0.001 μg⋅mL⁻¹ (1.07 ± 0.02; p < 0.001) was lower than the H2O2 group.
3.5. Quantitative Proteomics and Network Analysis
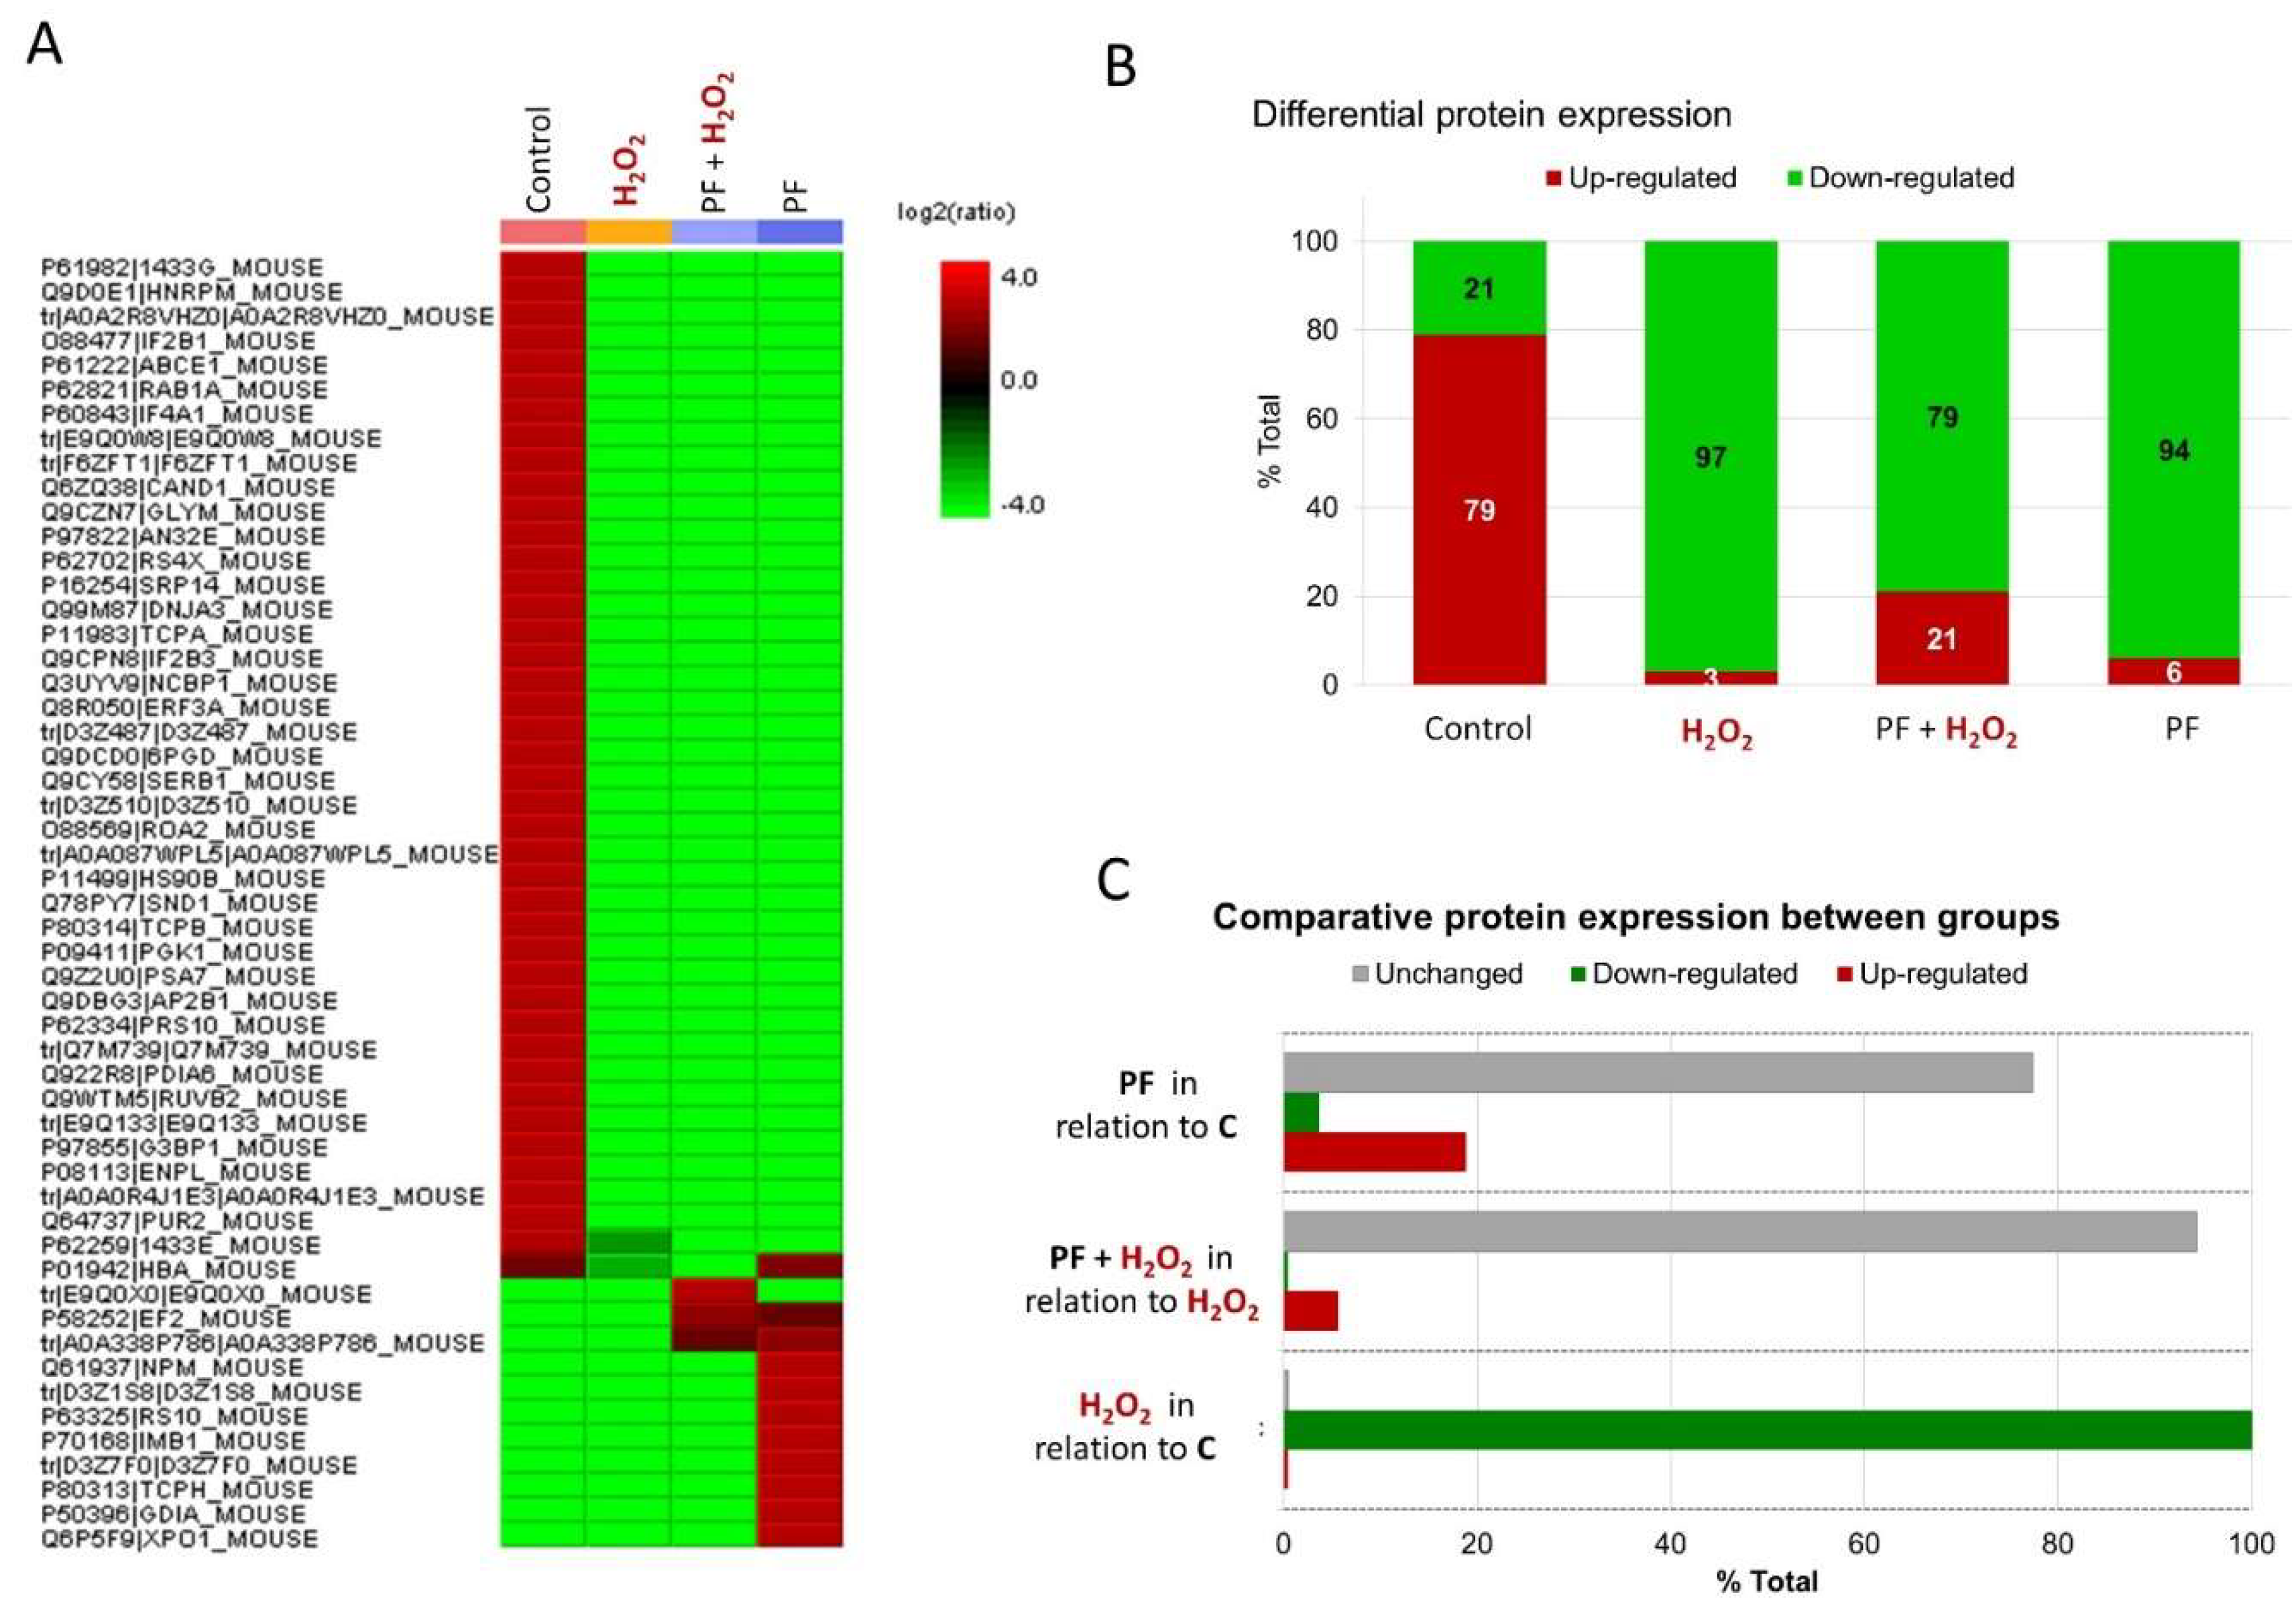
The proteomic label-free analysis was employed to understand the physiological phenomenon regarding cellular repair and the metabolic pathways involved in oxidative stress caused by H₂O₂ demonstrated by PF at 0.001 μg⋅mL⁻¹. The analysis identified 53 proteins (supplementary material 1) and differential protein expression were analyzed into four experimental groups (Control, H₂O₂, PF + H₂O₂, and PF) as represented in the heatmap (Figure 5A). Gene ontology (GO) analysis generally associated these proteins with signaling pathways for epidermal growth factor and fibroblast growth factor (EGF and FGF), purine and serine glycine biosynthesis, glycolysis, the pentose phosphate pathway, and the ubiquitin proteasome pathway, all of which have been related to Parkinson's disease (supplementary material 2). The molecular function analysis identified activities related to antioxidant action, catalysis, molecular function regulators, structural molecule activity, translation regulatory activity, ATP, and binding.
In the GO molecular function analysis, the control group had an overexpression of approximately 79% of total proteins identified (Figure 5B), many of which were linked to the binding process and catalytic activity. The H₂O₂-induced oxidative stress presented 97% of the proteins downregulated, including in relation to control (Figure 5B and C). PF + H₂O₂ group presented 79% down-regulated and 21% up-regulated of 53 proteins (Figure 5B). Also, PF + H₂O₂ indicated that 6% are upregulated, 4% are downregulated, and 94 % are unchanged protein expression when compared to the H₂O₂ group (Figure 5C). Three important upregulated proteins in the PF + H₂O₂ group were associated with binding, catalytic activity, and translation regulation. It is interesting that the proteasome subunit alpha type (E9Q0X0) is elevated exclusively in the PF + H₂O₂ group, whereas it decreased in the other groups. Additionally, PF + H₂O₂ group showed greater levels of key proteins such as elongation factor 2 (P58252) and protein synthesis protein (A0A338P786). The PF group had approximately 21% of proteins in upregulation and 79% in downregulation (Figure 5B) in relation to total protein, which included the molecular function of binding, regulatory activity of the molecular function, and structural molecule activity. Furthermore, PF had 19% upregulated, 77% downregulated, and 4% are unchanged in relation to control.
4. Discussion
The exploration of pharmaceutical compounds for neurodegenerative disease therapy has been highlighted, particularly the biological prospecting of molecules derived from snake venom with therapeutic and neuroprotective properties [1,2,40]. The snake venoms to the Elapidae family have considerable diversity of components of pharmacological relevance, and research on the bioprospecting of neuroprotective compounds within this group remains underexplored. This study presents, for the first time, that the PF comprised of low molecular mass fraction (< 10 kDa) derived from the venom of the N. mandalayensis snake exhibits neuroprotective properties against oxidative stress-induced neurotoxicity in differentiated mHippoE-18 cells, but not in undifferentiated PC12 cells.
Peptide fraction analysis of snake venom has been well reported in the literature, using conventional or modern protein chemistry techniques, including mass spectrometry [6,8,29,41,42]. Martins and colleagues studied the PF derived from the venom of the B. atrox snake (<14 kDa) using size exclusion chromatography (SEC) and subsequent sodium dodecyl sulfate–polyacrylamide gel electrophoresis (SDS-PAGE) [6]. Querobino and colleagues characterized the PF derived from the venom of the B. jararaca snake (<10 kDa) via vibrational spectroscopy methods, SDS-PAGE, gelatinolytic activity assays, and mass spectrometry [8]. In the present study, we employed the mass spectrometry (LC-ESI-IT-TOF-MS) for the PF characterization of N. mandalayensis venom, demonstrating high sensitivity for molecular identification. Our results indicated that the obtained PF contains no proteins exceeding 10 kDa.
The cytotoxic effects of PF were evaluated on the integrity and metabolism of neuronal cells of type PC12 and mHippoE-18 after 24 h of treatment at different concentrations. The concentrations of 10 and 0.01 μg⋅mL⁻¹ exhibited cytotoxic effects, but 1 μg⋅mL⁻¹ enhanced the integrity and metabolism of PC12 cells. In mHippoE-18 cells, PF at 0.01 μg⋅mL⁻¹ enhanced the integrity and decreased cellular metabolism, whereas other concentrations exhibited no evidence of cytotoxicity on integrity, but there are compounds in the PF that change the metabolism of these cells. The PF effects on cellular integrity and metabolism in PC12 and mHippoE-18 cells appear to correlate with the evaluated concentration, suggesting that the concentration of specific components within the PF composition is important to their distinct effects. PC12 cells are undifferentiated but have dopaminergic neurons characteristics [31,32,33,43]. The mHippoE-18 cells are differentiated, immortalized cells originating from primary cultures of mouse hippocampal cells [83,118]. Consequently, different differentiation conditions and phenotypes might be correlated with the different effects of PF on cell viability, suggesting further investigation.
PC12 and mHippoE-18 cells have been employed in neuprotection experiments against oxidative stress-induced neurotoxicity [11,42,44]. H2O2 is commonly used as a model to oxidative stress conditions and to investigate the protective effects of pharmacologically relevant compounds [19,22,45,46,47,48]. ROS are compounds that have only one electron in their last valence layer, which makes them highly reactive [49]. Neuronal cultures exposed H2O2 causes an imbalance in energy metabolism and can lead to the occurrence of deleterious effects of hydroxyl radicals and membrane proteins [50,51], increasing lipid peroxidation [8]. In our study, PC12 and mHippoE-18 cells exposed to H2O2 reduced cell integrity in concentration-dependent manner, according to reported in the literature [7,11,52]. At a concentration of 0.5 mmol·L⁻¹, H2O2 diminished metabolic activity and increased ROS production in both cell types; however, mHippoE-18 cells demonstrated greater resistance to oxidative stress-induced toxicity than PC12 cells, due to mHippoE-18 being differentiated neuronal cells that develop more effective antioxidant and repair mechanisms during maturation [53,54]. Furthermore, the downregulation of H2O2 group proteins compared to other groups in the label-free analysis indicated that H2O2-induced damage is associated with the degradation of specific proteins, disruption of mRNA translation that prevents protein synthesis, and the reactivity of heme group proteins with peroxide, potentially resulting from lipid peroxidation [55].
The neuroprotection mediated by snake venoms compounds against oxidative stress has been reported in the literature [1,2]. In our study, PC12 cells and mHippoE-18 were pre-treated for 4 h with different concentrations of PF, and then exposed at H2O2 (0.5 mmol·L⁻¹) in the PF presence and incubated for 20 h more. The PF did not show neuroprotective effects against oxidative stress in PC12 cells, although the cells treated at concentrations of 10 and 1 μg⋅mL⁻¹ increased mitochondrial metabolism in the presence of H2O2 in relation to cells treated only with H2O2. Nevertheless, PF at 0.01 μg·mL⁻¹ restored the integrity and metabolic activity of mHippoE-18 cells compromised by H2O2, without changing ROS production due to oxidative stress. However, mHippoE-18 cells treated with only PF at concentrations of 0.01 and 0.001 μg⋅mL⁻¹ exhibited a substantial reduction in baseline ROS levels compared to the control, indicating that PF could have antioxidant features. The number of viable cells present in experimental groups treated with PF (0.01 and 0.001 μg⋅mL⁻¹) in the presence and absence of H2O2 is a factor that should be included when investigating the generation of ROS against oxidative stress. Indeed, the H2O2 treatment significantly reduced the viability of cells compared to the PF + H2O2 group, but there were no significant differences in ROS production. Then we investigated the relationship between ROS generation and viability in all experimental groups, and we demonstrated that cells treated with PF + H2O2 exhibit lower levels of ROS than cells exposed just to H2O2, suggesting that PF possesses components with neuroprotective potential against oxidative stress.
The PF-induced neuroprotection was investigated to understand the possible cellular repair and the metabolic pathways involved in oxidative stress caused by H2O2, using proteomic label-free analysis. The proteasome subunit alpha type (E9Q0X0) constitutes a component of the proteasome complex responsible for the degradation of defective proteins [56], which was found upregulated in PF + H2O2 group possibly modulating H2O2-induced oxidative stress. The PF + H2O2 group also exhibited significant upregulation of key proteins in addition to the PF group, specifically elongation factor 2 (P58252), facilitating the translocation of tRNAs and mRNAs within the ribosome [57]. Additionally, the E2 ubiquitin-conjugating enzyme (A0A338P786) is associated with the ubiquitination process, which marks proteins for degradation by the proteasome [58,59]. Then, the restoration of protein expression, including proteasome subunit alpha type, elongation factor 2, and proteins involved in protein synthesis, after PF treatment under oxidative stress could be attributed to several pathways. One process is the activation of the nuclear factor erythroid-2 related factor 2 (Nrf2) pathway, which regulates an extensive spectrum of antioxidant enzymes that detoxify and reduce oxidative damage, involved in cellular defense systems [60]. Moreover, oxidative stress could cause problems with protein folding mechanisms due to its effect on redox homeostasis. The endoplasmic reticulum (ER) is essential for protein folding, and increased oxidative stress may impair its function, resulting in an accumulation of misfolded proteins. The interaction between oxidative stress and endoplasmic reticulum stress is crucial for comprehending biological responses and developing treatment alternatives [61]. Furthermore, oxidative stress also affects translation and protein synthesis, which is typically down-regulated [62]. The insights offer a framework for understanding how PF compounds could mitigate oxidative stress effects to enhance protein expression, emphasizing the significance of antioxidant pathways, protein folding mechanisms, and translational control in cellular recovery processes.
Proteomic label-free analysis indicated that cells treated alone with PF exhibited that the protein expression was 77% upregulated and 19% downregulated compared to the control. The differential protein expressions indicate that the composition of PF is complex and include peptides which affect essential neuronal processes, such as metabolism, protein synthesis, synaptic activity, and intracellular transport. The changes in protein expression suggested the PF induces toxic effects, along with cellular compensating efforts in response to stress in mHippo-E18 cells. The most relevant downregulated proteins suggest disruptions in essential neurons, while the upregulated proteins indicate adaptive mechanisms to alleviate these damages. Among the downregulated proteins, heat shock protein HSP90-beta (P11499) and endoplasmin (P08113) are critical for protein folding and stability [63], and their loss stimulates vulnerability to cellular stress. T-complex protein 1 subunit beta (P80314) and alpha (P11983) decreases also affect protein folding and cellular stability [64]. Vesicular transport and organelle distribution are affected by Ras-related protein Rab-1A (P62821) and AP-2 complex subunit beta (Q9DBG3) decrease in intracellular trafficking [65,66]. In terms of energy metabolism, the downregulation of fructose-bisphosphate aldolase A (D3Z510) and 6-phosphogluconate dehydrogenase (Q9DCD0) reduces consumption of energy [67], whereas decreased expression of cell signaling proteins including 14-3-3 gamma (P61982) and epsilon (P62259) reduces cytoskeletal integrity and signal transduction [68]. As a compensatory attempt, the upregulation of proteins such as Elongation Factor 2 (P58252) and ribosomal proteins [e.g., small ribosomal subunit protein uS7 (D3Z1S8), small ribosomal subunit protein eS10 (P63325)] suggests an effort to maintain protein translation. The increased expression of importin beta-1 (P70168) and exportin-1 (Q6P5F9) reflects a reorganization in nuclear-cytoplasmic transport [69], while the elevation of L-lactate dehydrogenase (D3Z7F0) suggests adaptation to metabolic stress through anaerobic metabolism [70].
5. Cconclusion
In summary, we reported for the first time that the peptide fraction obtained from N. mandalayensis snake venom exhibited neuroprotective properties against oxidative stress-induced toxicity in differentiated neuronal mHippoE-18 cells derived from the hippocampus. PF-mediated neuroprotection was characterized by a reduction in oxidative stress markers and the overexpression of important proteins involved in the degradation of defective proteins, including proteasome subunit alpha type and E2 ubiquitin-conjugating enzyme. However, a limitation of this study is that the proposed metabolic pathways were not validated through complementary techniques. Additionally, the PF contains rich mixture of bioactive peptides, which act on essential neuronal processes, such as metabolism, protein synthesis, synaptic activity, and intracellular transport; the isolation and identification of specific active peptides within the PF also limits the understanding of the precise components responsible for the observed effects, representing a key objective for future research. Taken together, these findings indicate that there are of previously uncharacterized molecules in the PF that could improve the understanding of the findings obtained, including novel applications of pharmacological interest.
Author Contributions
Conceptualization, C.A.-S.; Methodology, B.R.d.S., E.B.N. and L.C.M.; Formal analysis, C.A.-S., B.R.d.S., M.A.J., E.B.N., and L.C.M.; Investigation, B.R.d.S. and L.C.M.; Data curation, C.A.-S. and M.B.E.; Writing—original draft, C.A.-S., B.R.d.S., E.B.N., M.B.E. and L.C.M.; Funding acquisition, C.A.-S., M.A.J., and E.B.N. All authors have read and agreed to the published version of the manuscript.
Funding
This work was supported by the State of São Paulo Research Foundation (FAPESP; Grant 2023/03608-1 and 2018/13588-0), the Coordination for the Improvement of Higher Education Personnel (CAPES) (Finance Code 001), and UFABC Multiuser Central Facilities (CEM-UFABC).
Institutional Review Board Statement
Not applicable.
Informed Consent Statement
Not applicable.
Data Availability Statement
Raw data of mass spectrometry analysis is available at ProteomeXchange, ID PXD059516. (http://proteomecentral.proteomexchange.org/cgi/GetDataset?ID=PXD059516)
Acknowledgments
The authors would like to thank the technical group of the Experimental Morphophysiology Laboratory for their assistance in the analytical procedures, the administrative technical group of the Natural and Humanities Sciences Center for secretarial assistance and Dra Maria Aparecida Juliano from Department of Biophysics, Universidade Federal de São Paulo for sample analysis by QTOF equipment.
Conflicts of Interest
The authors declare that they have no known competing financial interests or personal relationships that could have appeared to influence the work reported in this paper.
Abbreviations
ACN: acetonitrile; ANOVA: one-way analysis of variance; ATP: adenosine triphosphate; AUC: area under the curve; B. atrox: Bothrops atrox; B. jararaca: Bothrops jararaca; CO2: Carbon dioxide; CRISP: cysteine-rich venom protein; D10: low glucose medium; DH10: high glucose medium; DMEM: Dulbecco’s modified Eagle’s medium; DMSO: dimethyl sulfoxide; DTT: dithiotreitol; EDTA: Ethylenediaminetetraacetic acid; EGF: epidermal growth factor; ER: endoplasmic reticulum; ESI-LC-MS/MS: Liquid Chromatography Electrospray Ionization Tandem Mass Spectrometric; 3FTx: three-finger toxins; FBS: fetal bovine serum; FGF: fibroblast growth factor; GO: gene ontology; H2DCF-DA: 2’,7’ - dichlorodihydrofluorescein diacetate; H2O2: Hydrogen peroxide; kDa: Kilodalton; LAAOs: L-amino acid oxidases; LC-ESI-IT-MS/MS: Liquid chromatography-electrospray ionization-ion trap-time of flight tandem mass spectrometry; LC-MS/MS: Liquid Chromatography coupled to Tandem Mass Spectrometry; mHippoE-18: neuronal cell line derived from mouse embryonic hippocampus; mRNA: messenger RNA; MS: Mass Spectrometric; MS/MS: Tandem Mass Spectrometry; NDs: neurodegenerative diseases; N. mandalayensis: Naja mandalayensis; Nrf2: nuclear factor erythroid-2 related factor 2; PBS - phosphate buffered saline; PC12: neuronal cell line derived from a transplantable rat pheochromocytoma; PF: peptide fraction; PLA2s: phospholipases A2; ROS: reactive oxygen species; SD: standard deviation; SDS-PAGE: subsequent sodium dodecyl sulfate- polyacrylamide gel electrophoresis; SEC: size exclusion chromatography; SH-SY5Y: neuronal cell line derived from a metastatic bone tumor; SK-N-MC: neuronal cell line derived from Askin tumor; SVMPs: snake venom metalloproteinases; TFA: trifluoroacetic acid; TIC: total ion current; tRNA: transfer RNA; V5N: venom 5-nucleotidase; VNGF: venom nerve growth factor.
References
- Alberto-Silva, C.; da Silva, B.R. Molecular and Cellular Mechanisms of Neuroprotection by Oligopeptides from Snake Venoms. BIOCELL 2024, 48, 897–904. [Google Scholar] [CrossRef]
- Alberto-Silva, C.; Portaro, F.C.V. Neuroprotection Mediated by Snake Venom. Natural Molecules in Neuroprotection and Neurotoxicity 2024, 437–451. [Google Scholar]
- Frangieh, J.; Rima, M.; Fajloun, Z.; Henrion, D.; Sabatier, J.M.; Legros, C.; Mattei, C. Snake Venom Components: Tools and Cures to Target Cardiovascular Diseases. Molecules 2021, 26. [Google Scholar] [CrossRef] [PubMed]
- de Oliveira Almeida, G.; de Oliveira, I.S.; Arantes, E.C.; Sampaio, S.V. Snake Venom Disintegrins Update: Insights about New Findings. J Venom Anim Toxins Incl Trop Dis 2023, 29, 20230039. [Google Scholar] [CrossRef]
- Martins, N.M.; Santos, N.A.G.; Sartim, M.A.; Cintra, A.C.O.; Sampaio, S.V.; Santos, A.C. A Tripeptide Isolated from Bothrops Atrox Venom Has Neuroprotective and Neurotrophic Effects on a Cellular Model of Parkinson’s Disease. Chem Biol Interact 2015, 235, 10–16. [Google Scholar] [CrossRef]
- Martins, N.M.; Ferreira, D.A.S.; Carvalho Rodrigues, M.A.; Cintra, A.C.O.; Santos, N.A.G.; Sampaio, S.V.; Santos, A.C. Low-Molecular-Mass Peptides from the Venom of the Amazonian Viper Bothrops Atrox Protect against Brain Mitochondrial Swelling in Rat: Potential for Neuroprotection. Toxicon 2010, 56, 86–92. [Google Scholar] [CrossRef]
- Querobino, S.M.; Ribeiro, C.A.J.; Alberto-Silva, C. Bradykinin-Potentiating PEPTIDE-10C, an Argininosuccinate Synthetase Activator, Protects against H2O2-Induced Oxidative Stress in SH-SY5Y Neuroblastoma Cells. Peptides (N.Y.) 2018, 103, 90–97. [Google Scholar] [CrossRef]
- Querobino, S.M.; Carrettiero, D.C.; Costa, M.S.; Alberto-Silva, C. Neuroprotective Property of Low Molecular Weight Fraction from B. Jararaca Snake Venom in H2O2-Induced Cytotoxicity in Cultured Hippocampal Cells. Toxicon 2017, 129, 134–143. [Google Scholar] [CrossRef]
- Querobino, S.M.; Costa, M.S.; Alberto-Silva, C. Protective Effects of Distinct Proline-Rich Oligopeptides from B. Jararaca Snake Venom against Oxidative Stress-Induced Neurotoxicity. Toxicon 2019, 167, 29–37. [Google Scholar] [CrossRef]
- Alberto-Silva, C.; Pantaleão, H.Q.; da Silva, B.R.; da Silva, J.C.A.; Echeverry, M.B. Activation of M1 Muscarinic Acetylcholine Receptors by Proline-Rich Oligopeptide 7a (<EDGPIPP) from Bothrops Jararaca Snake Venom Rescues Oxidative Stress-Induced Neurotoxicity in PC12 Cells. J Venom Anim Toxins Incl Trop Dis 2024, 30. [Google Scholar]
- Pantaleão, H.Q.; Araujo da Silva, J.C.; Rufino da Silva, B.; Echeverry, M.B.; Alberto-Silva, C. Peptide Fraction from B. Jararaca Snake Venom Protects against Oxidative Stress-Induced Changes in Neuronal PC12 Cell but Not in Astrocyte-like C6 Cell. Toxicon 2023, 231. [Google Scholar] [CrossRef] [PubMed]
- Munawar, A.; Ali, S.A.; Akrem, A.; Betzel, C. Snake Venom Peptides: Tools of Biodiscovery. Toxins (Basel) 2018, 10. [Google Scholar] [CrossRef]
- Dugger, B.N.; Dickson, D.W. Pathology of Neurodegenerative Diseases. Cold Spring Harb Perspect Biol 2017, 9. [Google Scholar] [CrossRef]
- Gadhave, D.G.; Sugandhi, V.V.; Jha, S.K.; Nangare, S.N.; Gupta, G.; Singh, S.K.; Dua, K.; Cho, H.; Hansbro, P.M.; Paudel, K.R. Neurodegenerative Disorders: Mechanisms of Degeneration and Therapeutic Approaches with Their Clinical Relevance. Ageing Res Rev 2024, 99, 102357. [Google Scholar] [CrossRef]
- Perlikowska, R. Whether Short Peptides Are Good Candidates for Future Neuroprotective Therapeutics? Peptides (N.Y.) 2021, 140. [Google Scholar] [CrossRef]
- Zong, Y.; Li, H.; Liao, P.; Chen, L.; Pan, Y.; Zheng, Y.; Zhang, C.; Liu, D.; Zheng, M.; Gao, J. Mitochondrial Dysfunction: Mechanisms and Advances in Therapy. Signal Transduction and Targeted Therapy 2024, 9, 1–29. [Google Scholar] [CrossRef]
- Durães, F.; Pinto, M.; Sousa, E. Old Drugs as New Treatments for Neurodegenerative Diseases. Pharmaceuticals 2018, 11, 44. [Google Scholar] [CrossRef]
- Leng, F.; Edison, P. Neuroinflammation and Microglial Activation in Alzheimer Disease: Where Do We Go from Here? Nat Rev Neurol 2021, 17, 157–172. [Google Scholar] [CrossRef]
- Kumar, H.; Dhalaria, R.; Guleria, S.; Cimler, R.; Sharma, R.; Siddiqui, S.A.; Valko, M.; Nepovimova, E.; Dhanjal, D.S.; Singh, R.; et al. Anti-Oxidant Potential of Plants and Probiotic Spp. in Alleviating Oxidative Stress Induced by H2O2. Biomedicine & Pharmacotherapy 2023, 165, 115022. [Google Scholar]
- Chaudhary, M.R.; Chaudhary, S.; Sharma, Y.; Singh, T.A.; Mishra, A.K.; Sharma, S.; Mehdi, M.M. Aging, Oxidative Stress and Degenerative Diseases: Mechanisms, Complications and Emerging Therapeutic Strategies. Biogerontology 2023, 24, 609–662. [Google Scholar] [CrossRef]
- Demirci-Çekiç, S.; Özkan, G.; Avan, A.N.; Uzunboy, S.; Çapanoğlu, E.; Apak, R. Biomarkers of Oxidative Stress and Antioxidant Defense. J Pharm Biomed Anal 2022, 209. [Google Scholar] [CrossRef] [PubMed]
- Jiang, J.; Yu, S.; Jiang, Z.; Liang, C.; Yu, W.; Li, J.; Du, X.; Wang, H.; Gao, X.; Wang, X. N-Acetyl-Serotonin Protects HepG2 Cells from Oxidative Stress Injury Induced by Hydrogen Peroxide. Oxid Med Cell Longev 2014, 2014. [Google Scholar] [CrossRef] [PubMed]
- Alberto-Silva, C.; da Silva, B.R.; da Silva, J.C.A.; Cunha e Silva, F.A. da; Kodama, R.T.; da Silva, W.D.; Costa, M.S.; Portaro, F.C.V. Small Structural Differences in Proline-Rich Decapeptides Have Specific Effects on Oxidative Stress-Induced Neurotoxicity and L-Arginine Generation by Arginosuccinate Synthase. Pharmaceuticals (Basel) 2024, 17, 931. [Google Scholar] [CrossRef] [PubMed]
- Al-Shehri, S.S. Reactive Oxygen and Nitrogen Species and Innate Immune Response. Biochimie 2021, 181, 52–64. [Google Scholar] [CrossRef]
- Gandhi, S.; Abramov, A.Y. Mechanism of Oxidative Stress in Neurodegeneration. Oxid Med Cell Longev 2012, 2012, 11. [Google Scholar] [CrossRef]
- Salari, S.; Bagheri, M. In Vivo, in Vitro and Pharmacologic Models of Parkinson’s Disease. Physiol Res 2019, 68, 17–24. [Google Scholar] [CrossRef]
- Casewell, N.R.; Jackson, T.N.W.; Laustsen, A.H.; Sunagar, K. Causes and Consequences of Snake Venom Variation. Trends Pharmacol Sci 2020, 41, 570. [Google Scholar] [CrossRef]
- Slowinski JB, W.W. A New Cobra (Elapidae: Naja) from Myanmar (Burma) on JSTOR. Available online: https://www.jstor.org/stable/3893276 (accessed on 22 September 2024).
- Neto, E.B.; Coelho, G.R.; Sciani, J.M.; Pimenta, D.C. Proteomic Characterization of Naja Mandalayensis Venom. J Venom Anim Toxins Incl Trop Dis 2021, 27. [Google Scholar]
- Abdullah, N.A.H.; Sainik, N.Q.A.V.; Esa, E.; Muhamad Hendri, N.A.; Ahmad Rusmili, M.R.; Hodgson, W.C.; Shaikh, M.F.; Othman, I. Neuroprotective Effect of Phospholipase A2 from Malaysian Naja Sumatrana Venom against H2O2-Induced Cell Damage and Apoptosis. Front Pharmacol 2022, 13. [Google Scholar] [CrossRef]
- Duan, X.-H. n; Wang, W.-L.; Dai, R.; Yan, H.-W.; Han, C.-N.; Liu, L.-S. Current Situation of PC12 Cell Use in Neuronal Injury Study. Int J Biotechnol Wellness Ind 2015, 4, 61–66. [Google Scholar] [CrossRef]
- de los Rios, C.; Cano-Abad, M.F.; Villarroya, M.; López, M.G. Chromaffin Cells as a Model to Evaluate Mechanisms of Cell Death and Neuroprotective Compounds. Pflugers Arch 2018, 470, 187–198. [Google Scholar] [CrossRef] [PubMed]
- Wiatrak, B.; Kubis-Kubiak, A.; Piwowar, A.; Barg, E. PC12 Cell Line: Cell Types, Coating of Culture Vessels, Differentiation and Other Culture Conditions. Cells 2020, 9. [Google Scholar] [CrossRef] [PubMed]
- Greene, L.A.; Tischler, A.S. Establishment of a Noradrenergic Clonal Line of Rat Adrenal Pheochromocytoma Cells Which Respond to Nerve Growth Factor. Proc Natl Acad Sci U S A 1976, 73, 2424–2428. [Google Scholar] [CrossRef] [PubMed]
- Gingerich, S.; Kim, G.L.; Chalmers, J.A.; Koletar, M.M.; Wang, X.; Wang, Y.; Belsham, D.D. Estrogen Receptor α and G-Protein Coupled Receptor 30 Mediate the Neuroprotective Effects of 17β-Estradiol in Novel Murine Hippocampal Cell Models. Neuroscience 2010, 170, 54–66. [Google Scholar] [CrossRef]
- Feoktistova, M.; Geserick, P.; Leverkus, M. Crystal Violet Assay for Determining Viability of Cultured Cells. Cold Spring Harb Protoc 2016, 2016, 343–346. [Google Scholar] [CrossRef]
- Pinho, B.R.; Reis, S.D.; Hartley, R.C.; Murphy, M.P.; Oliveira, J.M.A. Mitochondrial Superoxide Generation Induces a Parkinsonian Phenotype in Zebrafish and Huntingtin Aggregation in Human Cells. Free Radic Biol Med 2019, 130, 318–327. [Google Scholar] [CrossRef]
- Rosseti, I.B.; Rocha, J.B.T.; Costa, M.S. Diphenyl Diselenide (PhSe)2 Inhibits Biofilm Formation by Candida Albicans, Increasing Both ROS Production and Membrane Permeability. J Trace Elem Med Biol 2015, 29, 289–295. [Google Scholar] [CrossRef]
- Beraldo-Neto, E.; Ferreira, V.F.; Vigerelli, H.; Fernandes, K.R.; Juliano, M.A.; Nencioni, A.L.A.; Pimenta, D.C. Unraveling Neuroprotection with Kv1.3 Potassium Channel Blockade by a Scorpion Venom Peptide. Sci Rep 2024, 14. [Google Scholar] [CrossRef]
- de Souza, J.M.; Goncalves, B.D.C.; Gomez, M.V.; Vieira, L.B.; Ribeiro, F.M. Animal Toxins as Therapeutic Tools to Treat Neurodegenerative Diseases. Front Pharmacol 2018, 9. [Google Scholar] [CrossRef]
- Munawar, A.; Trusch, M.; Georgieva, D.; Hildebrand, D.; Kwiatkowski, M.; Behnken, H.; Harder, S.; Arni, R.; Spencer, P.; Schlüter, H.; et al. Elapid Snake Venom Analyses Show the Specificity of the Peptide Composition at the Level of Genera Naja and Notechis. Toxins (Basel) 2014, 6, 850–868. [Google Scholar] [CrossRef]
- Tasoulis, T.; Isbister, G.K. A Current Perspective on Snake Venom Composition and Constituent Protein Families. Archives of Toxicology 2022, 97, 133–153. [Google Scholar] [CrossRef] [PubMed]
- Peng, Y.; Chu, S.; Yang, Y.; Zhang, Z.; Pang, Z.; Chen, N. Neuroinflammatory In Vitro Cell Culture Models and the Potential Applications for Neurological Disorders. Front Pharmacol 2021, 12. [Google Scholar] [CrossRef] [PubMed]
- Rao, W.Q.; Kalogeropoulos, K.; Allentoft, M.E.; Gopalakrishnan, S.; Zhao, W.N.; Workman, C.T.; Knudsen, C.; Jiménez-Mena, B.; Seneci, L.; Mousavi-Derazmahalleh, M.; et al. The Rise of Genomics in Snake Venom Research: Recent Advances and Future Perspectives. Gigascience 2022, 11. [Google Scholar] [CrossRef] [PubMed]
- Feng, C.; Luo, T.; Zhang, S.; Liu, K.; Zhang, Y.; Luo, Y.; Ge, P. Lycopene Protects Human SH-SY5Y Neuroblastoma Cells against Hydrogen Peroxide-Induced Death via Inhibition of Oxidative Stress and Mitochondria-Associated Apoptotic Pathways. Mol Med Rep 2016, 13, 4205. [Google Scholar] [CrossRef]
- Lee, A.Y.; Wu, T.T.; Hwang, B.R.; Lee, J.; Lee, M.H.; Lee, S.; Cho, E.J. The Neuro-Protective Effect of the Methanolic Extract of Perilla Frutescens Var. Japonicaand Rosmarinic Acid against H₂O₂-Induced Oxidative Stress in C6 Glial Cells. Biomol Ther (Seoul) 2016, 24, 338–345. [Google Scholar] [CrossRef]
- Wang, Q.; Ju, X.; Chen, Y.; Dong, X.; Luo, S.; Liu, H.; Zhang, D. Effects of L-Carnitine against H2O2-Induced Oxidative Stress in Grass Carp Ovary Cells (Ctenopharyngodon Idellus). Fish Physiol Biochem 2016, 42, 845–857. [Google Scholar] [CrossRef]
- Mansor, N.I.; Ling, K.H.; Rosli, R.; Hassan, Z.; Adenan, M.I.; Nordin, N. Centella Asiatica (L.) Urban. Attenuates Cell Damage in Hydrogen Peroxide-Induced Oxidative Stress in Transgenic Murine Embryonic Stem Cell Line-Derived Neural-Like Cells: A Preliminary Study for Potential Treatment of Alzheimer’s Disease. Journal of Alzheimer’s Disease 2023, 94, S21. [Google Scholar] [CrossRef]
- Collin, F. Chemical Basis of Reactive Oxygen Species Reactivity and Involvement in Neurodegenerative Diseases. International Journal of Molecular Sciences 2019, 20, 2407. [Google Scholar] [CrossRef]
- Lingappa, S.; Shivakumar, M.S.; Manivasagam, T.; Somasundaram, S.T.; Seedevi, P. Neuroprotective Effect of Epalrestat on Hydrogen Peroxide-Induced Neurodegeneration in SH-SY5Y Cellular Model. J Microbiol Biotechnol 2021, 31, 867–874. [Google Scholar] [CrossRef]
- Zhang, S.; Ye, J.; Dong, G. Neuroprotective Effect of Baicalein on Hydrogen Peroxide-Mediated Oxidative Stress and Mitochondrial Dysfunction in PC12 Cells. J Mol Neurosci 2010, 40, 311–320. [Google Scholar] [CrossRef]
- Gerszon, J.; Rodacka, A. Determination of Trans-Resveratrol Action on Two Different Types of Neuronal Cells, Neuroblastoma and Hippocampal Cells. Czech Journal of Food Sciences 2016, 34, 118. [Google Scholar] [CrossRef]
- Ghosh, D.; Kumar, A. Harnessing Mitophagy for Therapeutic Advances in Aging and Chronic Neurodegenerative Diseases. Neuroglia 2024, 5, 391–409. [Google Scholar] [CrossRef]
- Houldsworth, A. Role of Oxidative Stress in Neurodegenerative Disorders: A Review of Reactive Oxygen Species and Prevention by Antioxidants. Brain Commun 2024, 6. [Google Scholar] [CrossRef]
- Marinho, H.S.; Real, C.; Cyrne, L.; Soares, H.; Antunes, F. Hydrogen Peroxide Sensing, Signaling and Regulation of Transcription Factors. Redox Biol 2014, 2, 535–562. [Google Scholar] [CrossRef]
- Raynes, R.; Pomatto, L.C.D.; Davies, K.J.A. Degradation of Oxidized Proteins by the Proteasome: Distinguishing between the 20S, 26S, and Immunoproteasome Proteolytic Pathways. Mol Aspects Med 2016, 50, 41–55. [Google Scholar] [CrossRef]
- Ayala, A.; Parrado, J.; Bougria, M.; Machado, A. Effect of Oxidative Stress, Produced by Cumene Hydroperoxide, on the Various Steps of Protein Synthesis. Modifications of Elongation Factor-2. J Biol Chem 1996, 271, 23105–23110. [Google Scholar] [CrossRef]
- Wijk, S.J.L.; Timmers, H.T.M. The Family of Ubiquitin-Conjugating Enzymes (E2s): Deciding between Life and Death of Proteins. FASEB J 2010, 24, 981–993. [Google Scholar] [CrossRef]
- Jørgensen, R.; Merrill, A.R.; Andersen, G.R. The Life and Death of Translation Elongation Factor 2. Biochem Soc Trans 2006, 34, 1. [Google Scholar] [CrossRef]
- Ngo, V.; Duennwald, M.L. Nrf2 and Oxidative Stress: A General Overview of Mechanisms and Implications in Human Disease. Antioxidants 2022, 11, 2345. [Google Scholar] [CrossRef]
- Bhattarai, K.R.; Riaz, T.A.; Kim, H.R.; Chae, H.J. The Aftermath of the Interplay between the Endoplasmic Reticulum Stress Response and Redox Signaling. Experimental & Molecular Medicine 2021, 53, 151–167. [Google Scholar]
- Dasuri, K.; Zhang, L.; Keller, J.N. Oxidative Stress, Neurodegeneration, and the Balance of Protein Degradation and Protein Synthesis. Free Radic Biol Med 2013, 62, 170–185. [Google Scholar] [CrossRef] [PubMed]
- Zuehlke, A.; Johnson, J.L. Hsp90 and Co-Chaperones Twist the Functions of Diverse Client Proteins. Biopolymers 2010, 93, 211–217. [Google Scholar] [CrossRef] [PubMed]
- Seixas, C.; Cruto, T.; Tavares, A.; Gaertig, J.; Soares, H. CCTα and CCTδ Chaperonin Subunits Are Essential and Required for Cilia Assembly and Maintenance in Tetrahymena. PLoS One 2010, 5, e10704. [Google Scholar] [CrossRef]
- Wang, C.; Yoo, Y.; Fan, H.; Kim, E.; Guan, K.L.; Guan, J.L. Regulation of Integrin β 1 Recycling to Lipid Rafts by Rab1a to Promote Cell Migration. J Biol Chem 2010, 285, 29398–29405. [Google Scholar] [CrossRef]
- Marcello, E.; Saraceno, C.; Musardo, S.; Vara, H.; De La Fuente, A.G.; Pelucchi, S.; Di Marino, D.; Borroni, B.; Tramontano, A.; Pérez-Otaño, I.; et al. Endocytosis of Synaptic ADAM10 in Neuronal Plasticity and Alzheimer’s Disease. J Clin Invest 2013, 123, 2523–2538. [Google Scholar] [CrossRef]
- Kawai, K.; Uemura, M.; Munakata, K.; Takahashi, H.; Haraguchi, N.; Nishimura, J.; Hata, T.; Matsuda, C.; Ikenaga, M.; Murata, K.; et al. Fructose-Bisphosphate Aldolase A Is a Key Regulator of Hypoxic Adaptation in Colorectal Cancer Cells and Involved in Treatment Resistance and Poor Prognosis. Int J Oncol 2017, 50, 525–534. [Google Scholar] [CrossRef]
- Freeman, A.K.; Morrison, D.K. 14-3-3 Proteins: Diverse Functions in Cell Proliferation and Cancer Progression. Semin Cell Dev Biol 2011, 22, 681–687. [Google Scholar] [CrossRef]
- Ullman, K.S.; Powers, M.A.; Forbes, D.J. Nuclear Export Receptors: From Importin to Exportin. Cell 1997, 90, 967–970. [Google Scholar] [CrossRef]
- Farhana, A.; Lappin, S.L. Biochemistry, Lactate Dehydrogenase. StatPearls 2023. [Google Scholar]
Figure 1.
Characterization of PF from Naja mandalayensis venom by mass spectrometry. Base peak chromatogram of total time analyzed and (A) zoom into the retention time analyzed peaks from the fraction of Naja mandalayensis venom after molecular filtration with a 10 kDa cutoff. The molecular mass analysis confirming the efficiency of the peptide fraction obtention from crude venom. The result displays intensity analysis by m/z ratio, of the following retention times: (B) 6.077 -> 7.368 Scan: 730 -> 885; (C) 7.352 -> 7.993 Scan: 883 -> 960; (D) 7.968 -> 8.985 Scan: 957 -> 1079; (E) 8.960 -> 9.993 Scan: 1076 -> 1200; (F) 9.968 -> 11.002 Scan: 1197 -> 1321 (G) 11.002 -> 12.010 Scan: 1321 -> 1442; (H) 11.985 -> 13.010 Scan: 1439 -> 1562; (I) 13.002 -> 15.060 Scan: 1561 -> 1808.
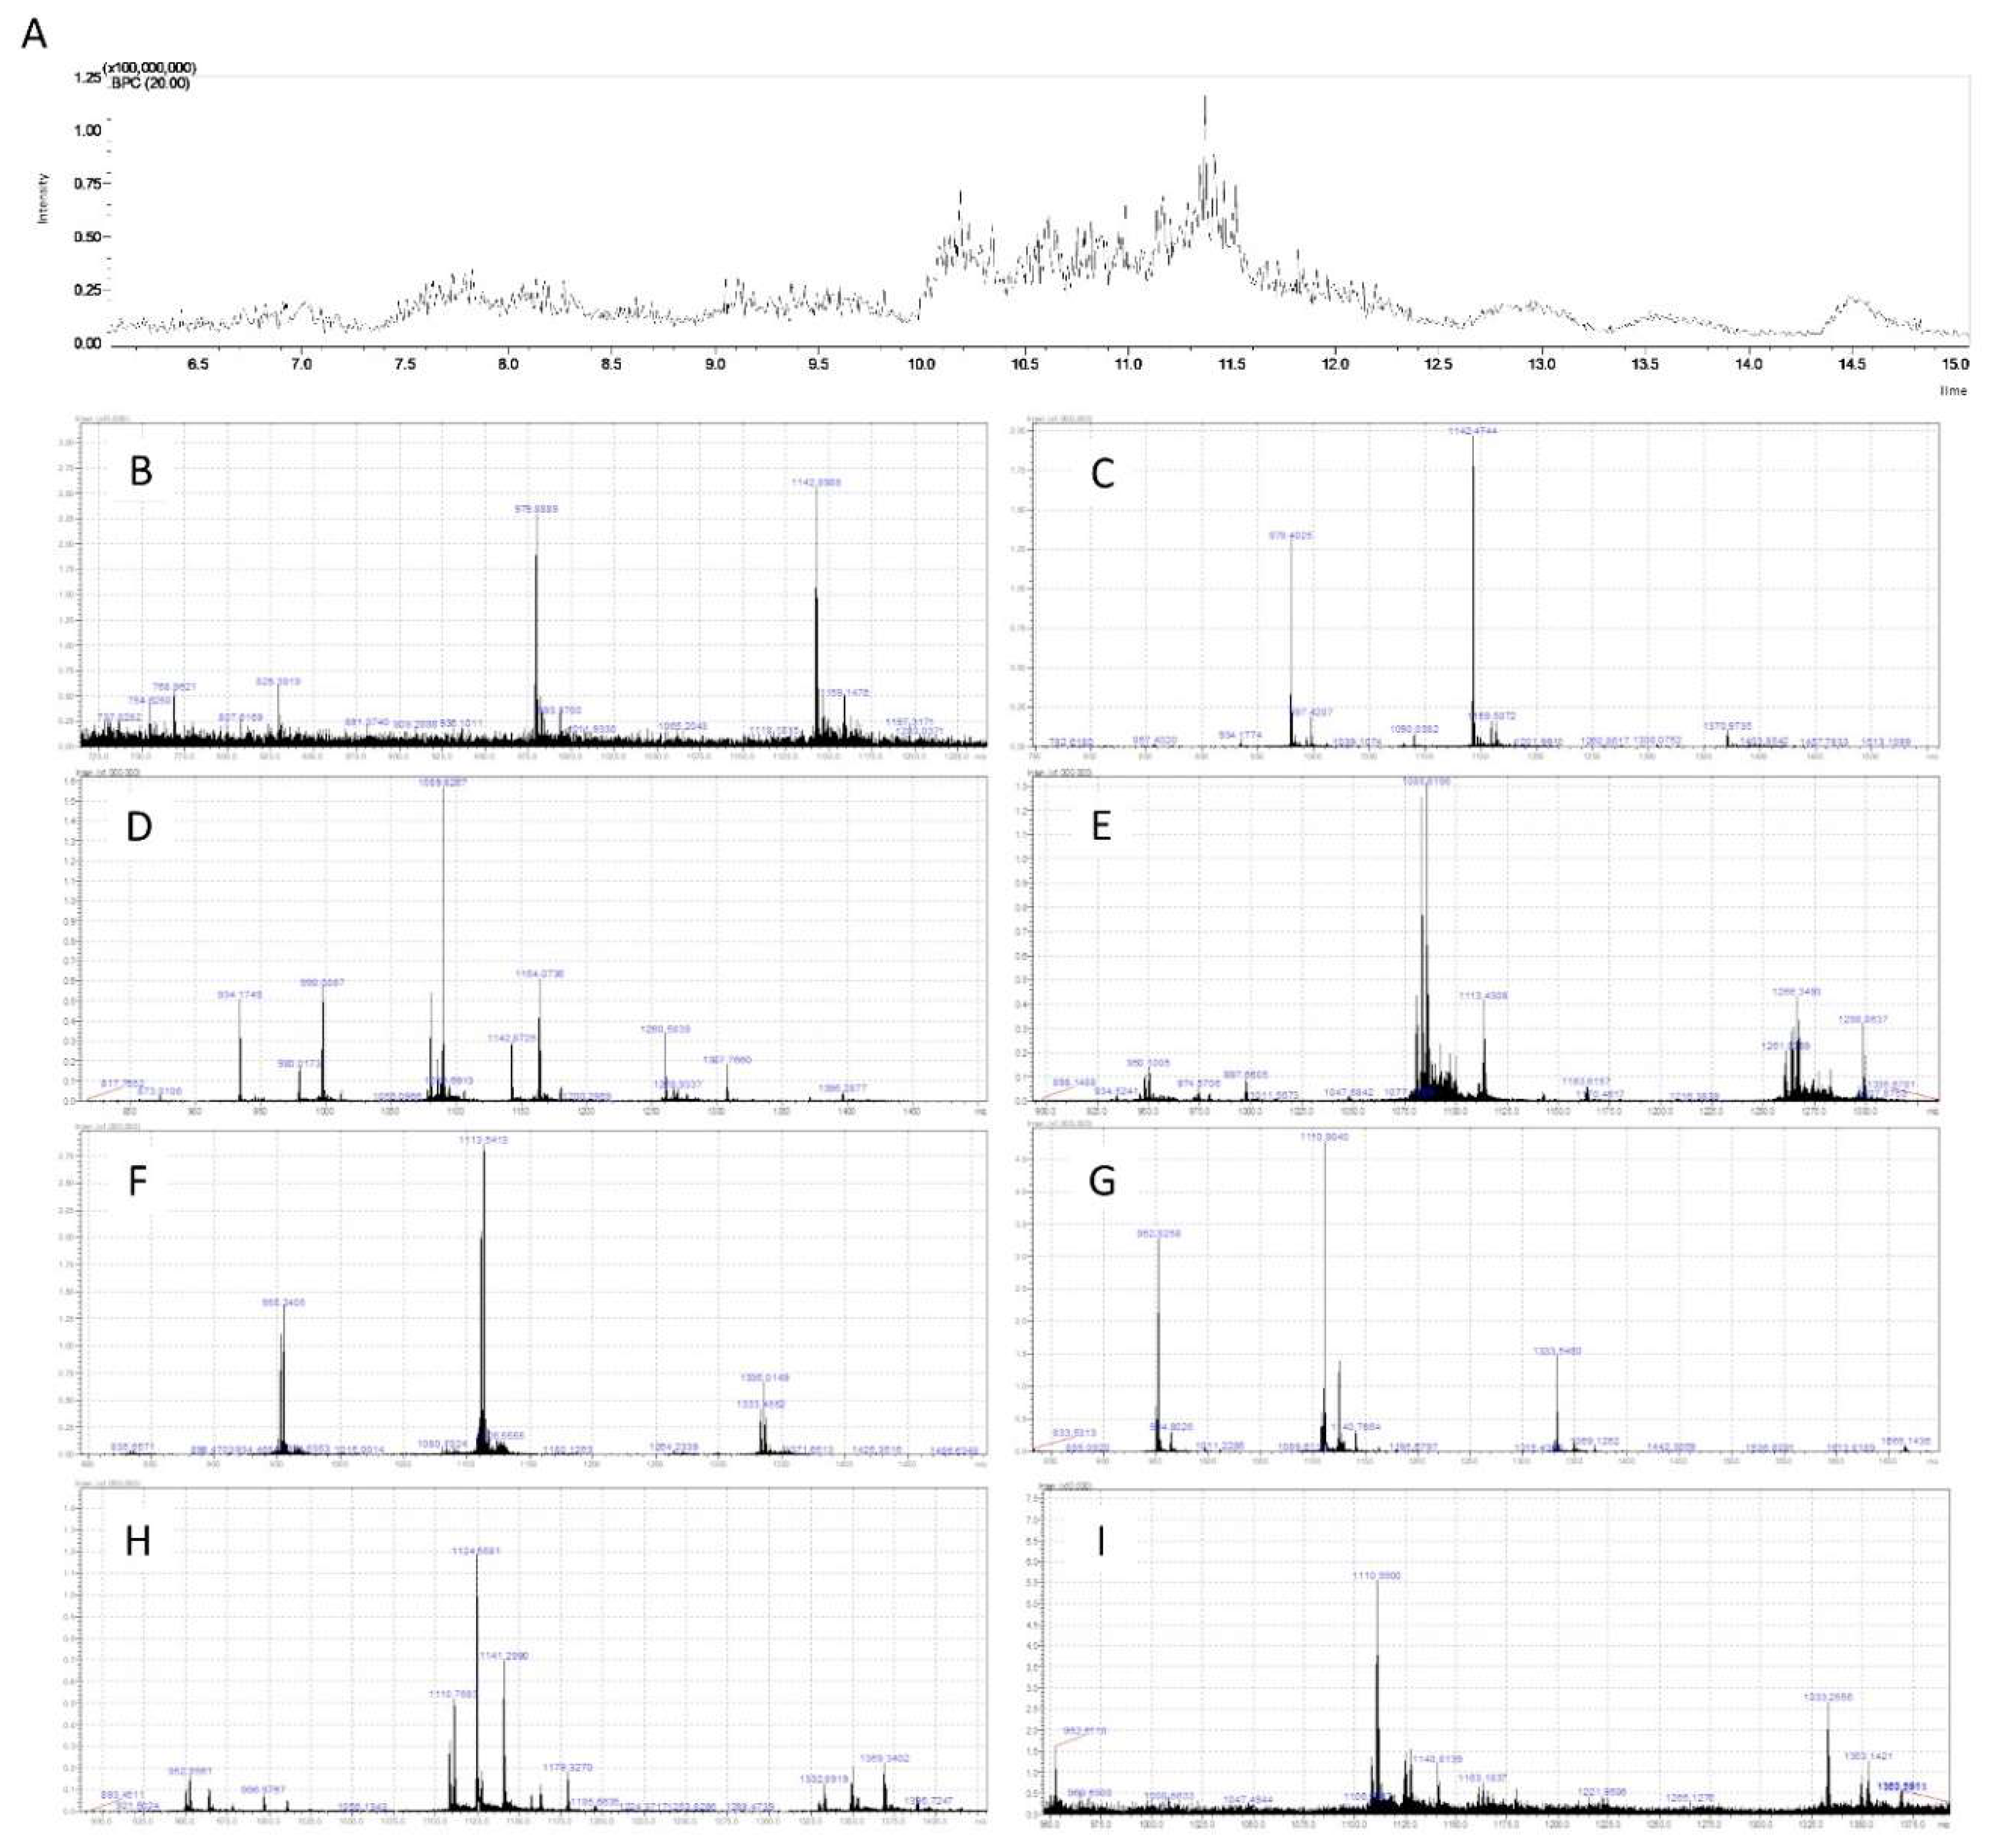
Figure 2.
Toxicity of PF in neuronal PC12 cells and hippocampal mHippoE-18 cells. The viability of the cells was assessed by examining their integrity (A and C) and metabolism (B and D) after 24 h of PF treatment. The values were expressed as a percentage relative to the control, presented in box-and-whisker plots obtained from three independent sextuple experiments, and analyzed using one-way ANOVA, followed by a Tukey post-test. (a) Statistical significance was observed with p < 0.05 compared to the control group. C: untreated cell group; C+: cell group treated with acrylamide; PF: cell group treated with a peptide fraction.
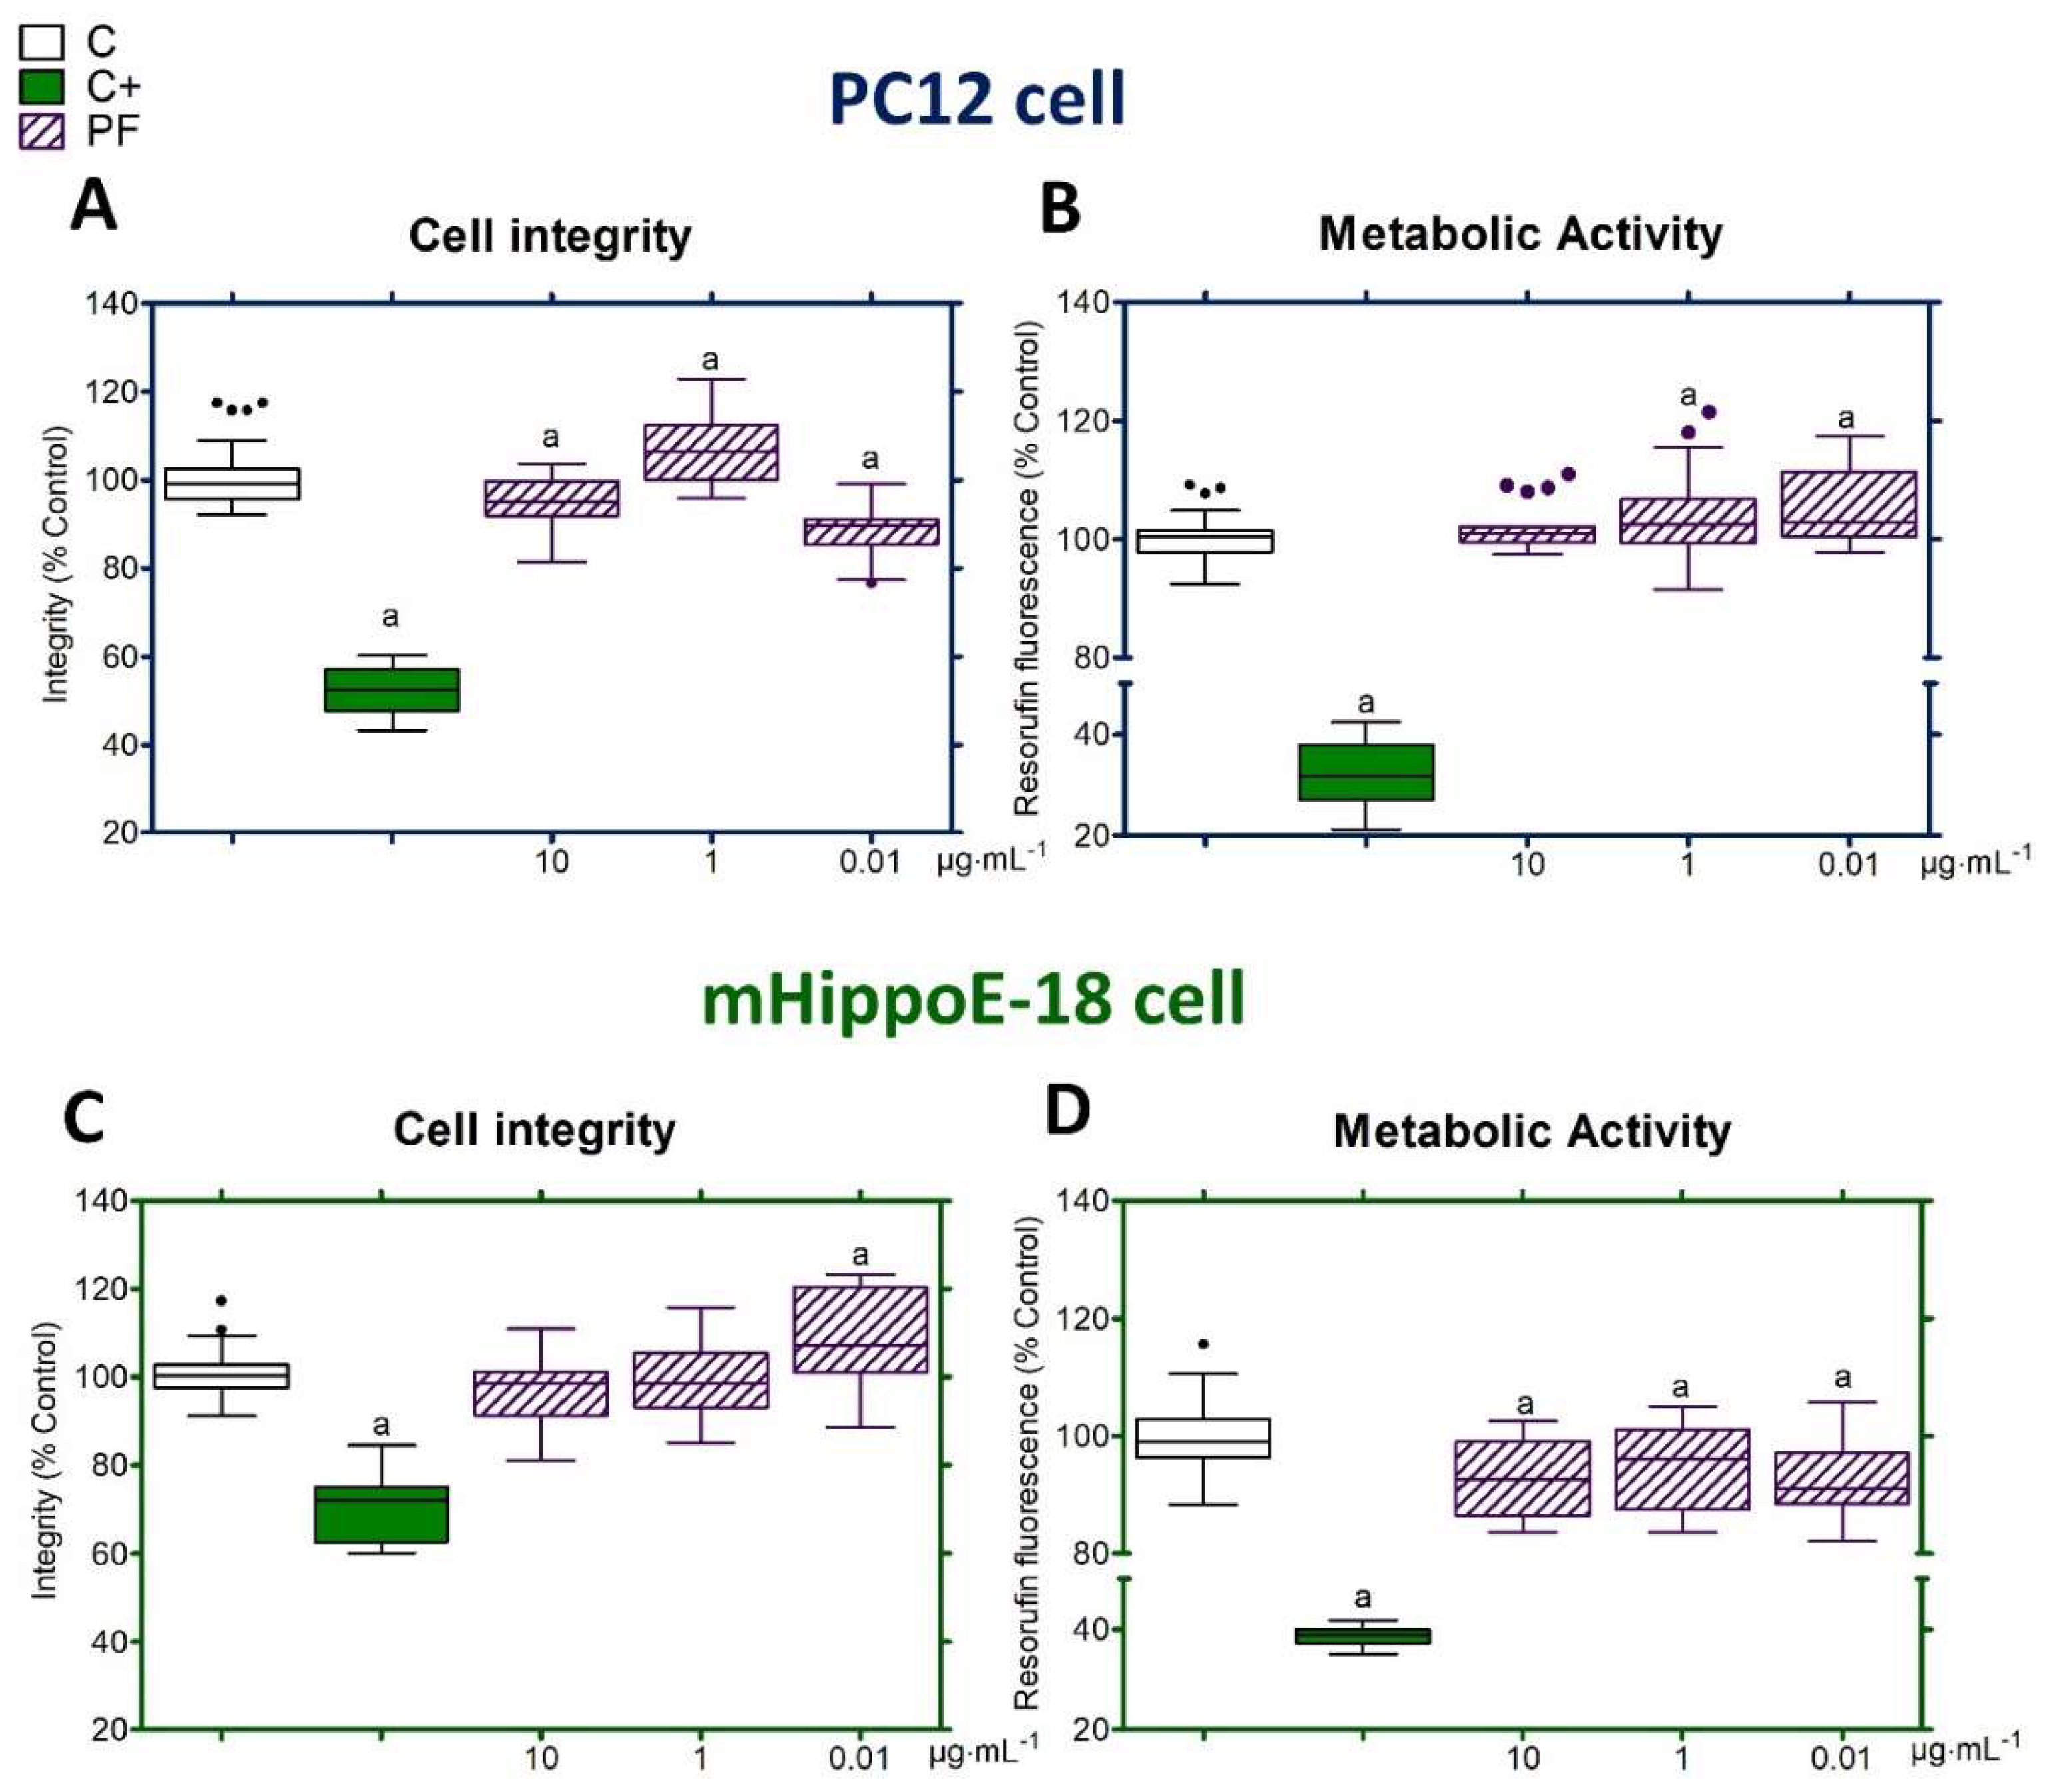
Figure 3.
Effects of H2O2-induced oxidative stress in PC12 (▬) and mHippoE-18 cells (▬). Schematic representation of neuroprotection model adopted in PC12 and mHippoE-18 cells, as shown in a typical photomicrograph (magnification: ×80) (A). Both cell types were exposed to different concentrations of H2O2 (2, 1, 0.5, and 0.3 mmol⋅L⁻1), and after 20 h, the cell integrity was evaluated (B and E). The concentration of 0.5 mmol⋅L⁻1 was selected for the analysis of cellular metabolism (C and F) and production of ROS (D and G) in the cells PC12 and mHippoE-18, respectively. Values were shown as box-and-whisker plots of three independent experiments in sextuplicate, and represent the percentage in relation to the control. Data were analyzed by one-way ANOVA followed by Tukey’s post-test. (a) p < 0.05 for differences in relation to control group.
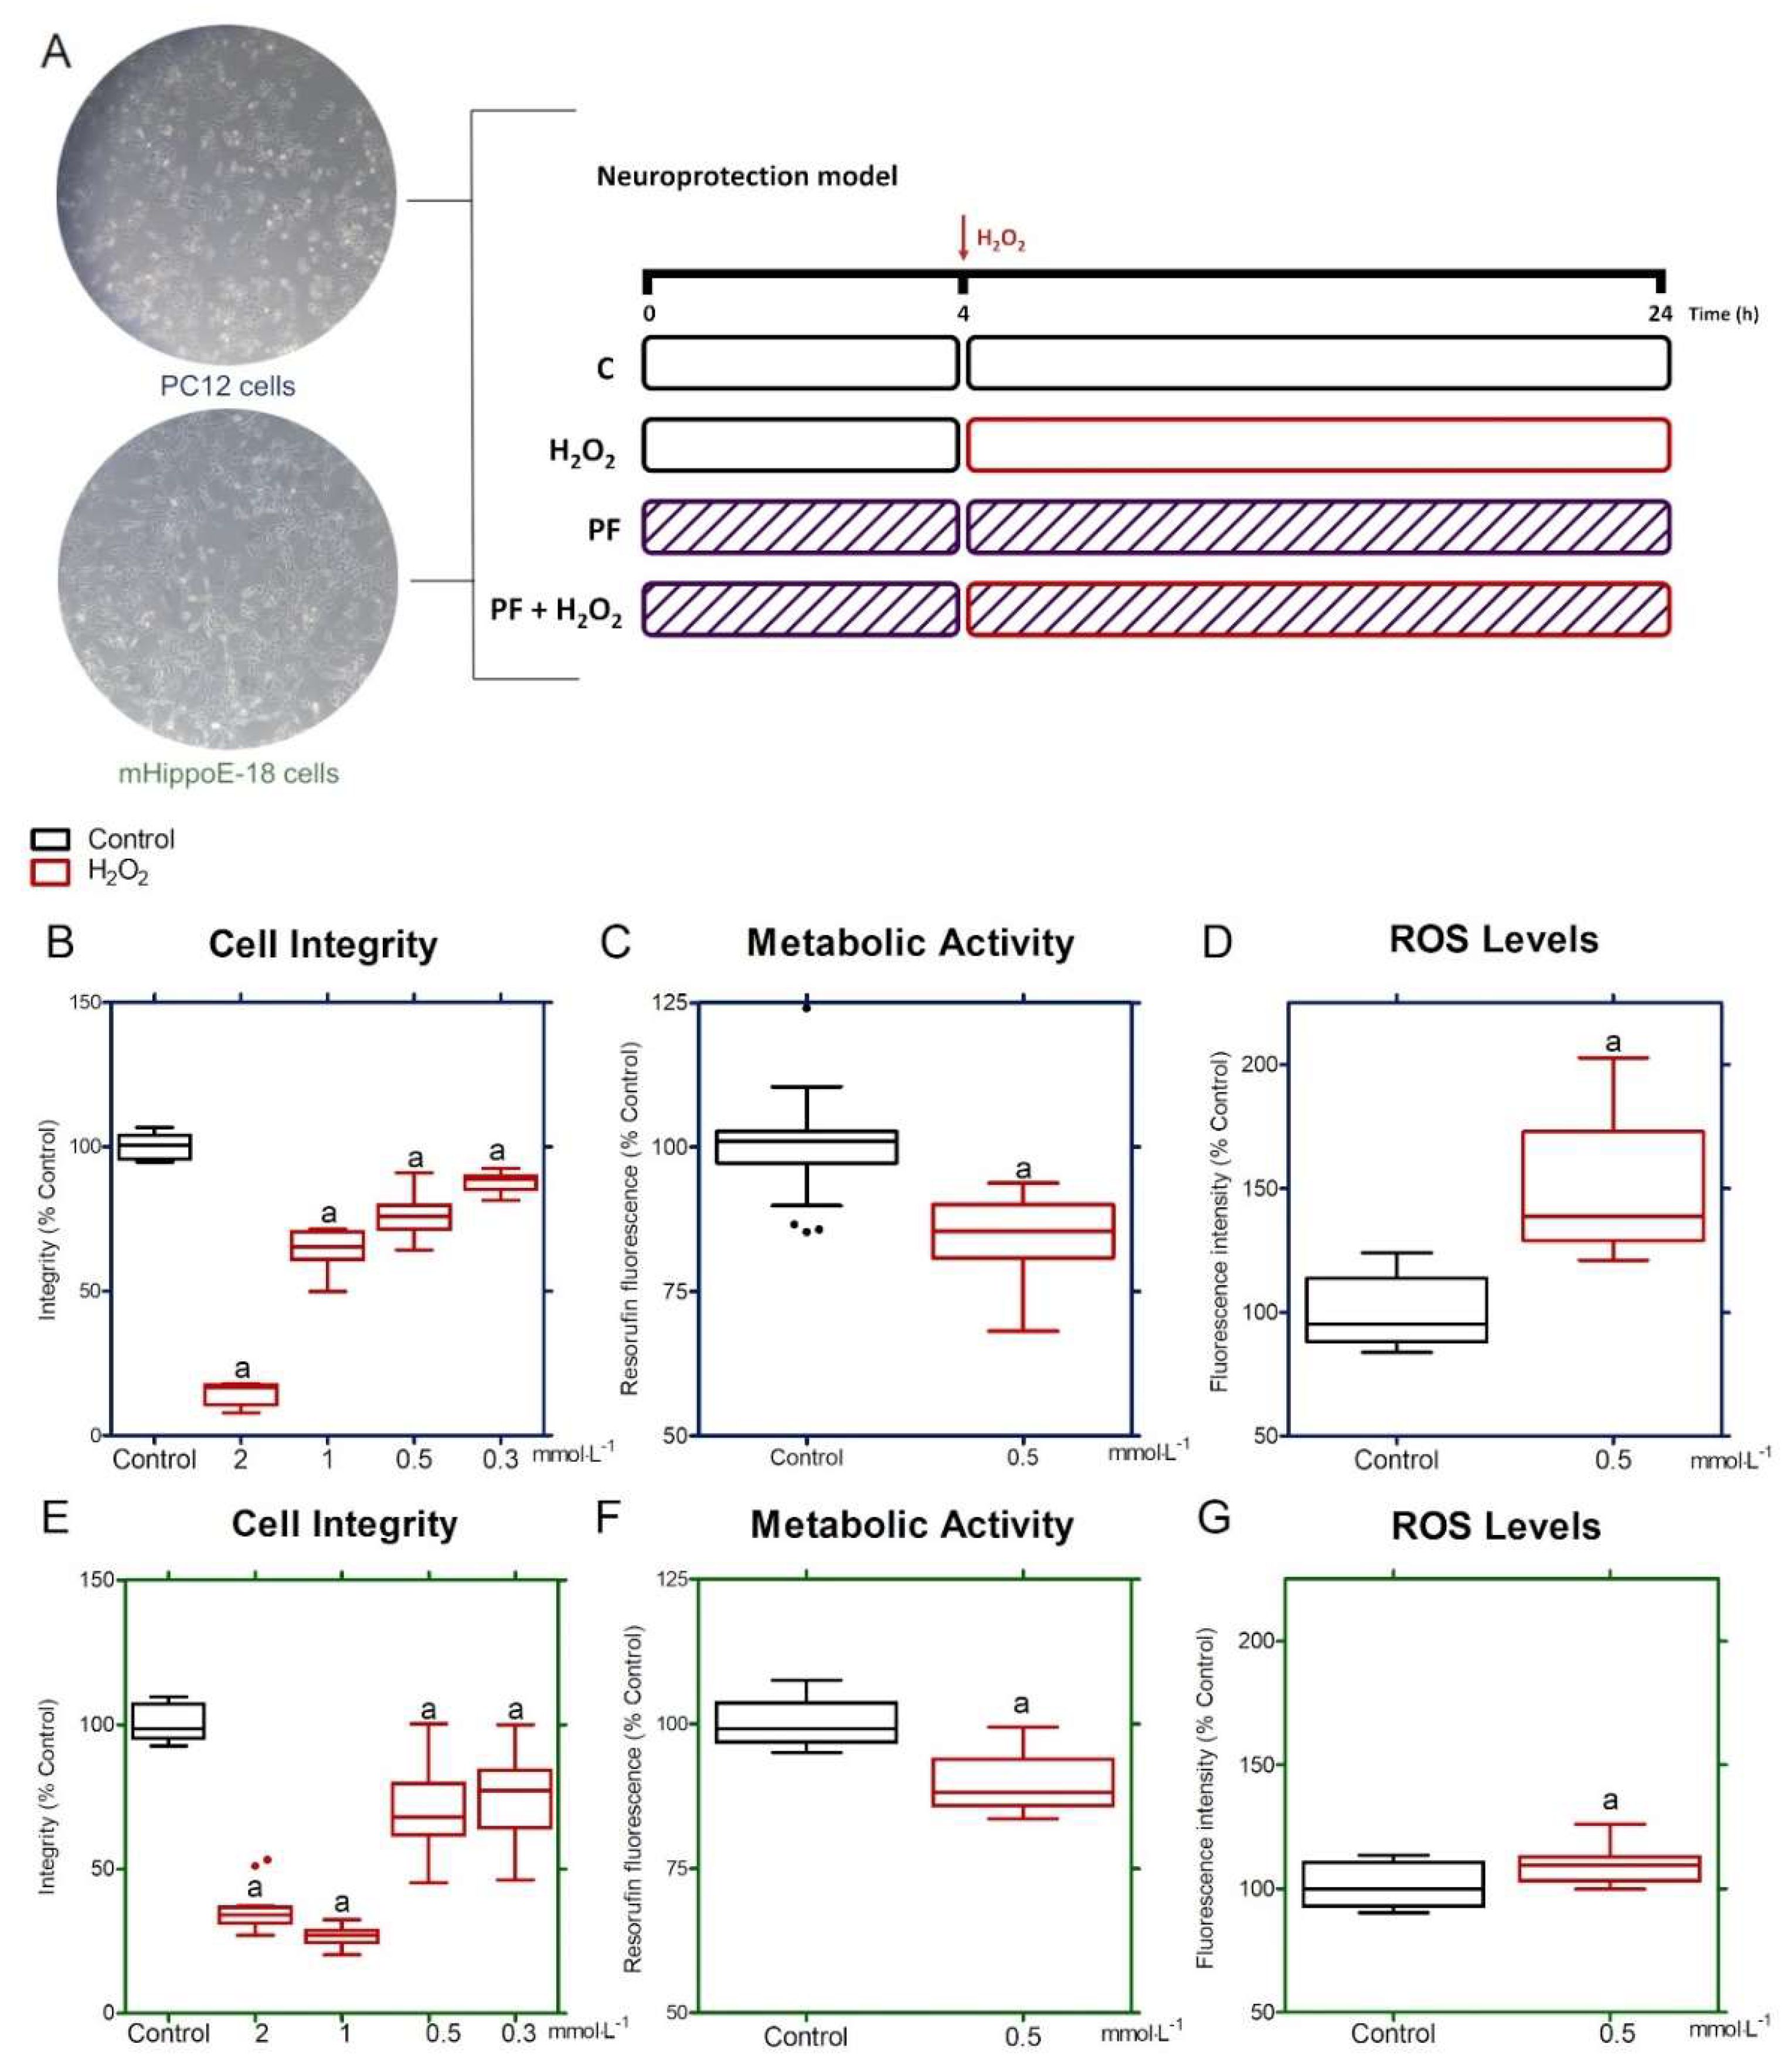
Figure 4.
PF-mediated neuroprotection on oxidative stress-induced changes in PC12 and mHippoE-18 cells. PF effects at 10, 1, and 0.01 μg⋅mL⁻1against oxidative stress-induced neurotoxicity were evaluated on cell integrity (A and D), metabolic activity (B and E), and ROS generation (C and F) in both cell type. Additional experiments were performed with PF at 0.001 μg⋅mL⁻1 in mHippoE-18 cells (G). Values were presented as box-and-whisker plots from three independent experiments in sextuplicate. Data were analyzed by one-way ANOVA followed by Tukey’s post-test. p < 0.05 for differences in relation to control (a); p < 0.05 for differences in relation to H2O2 (b).
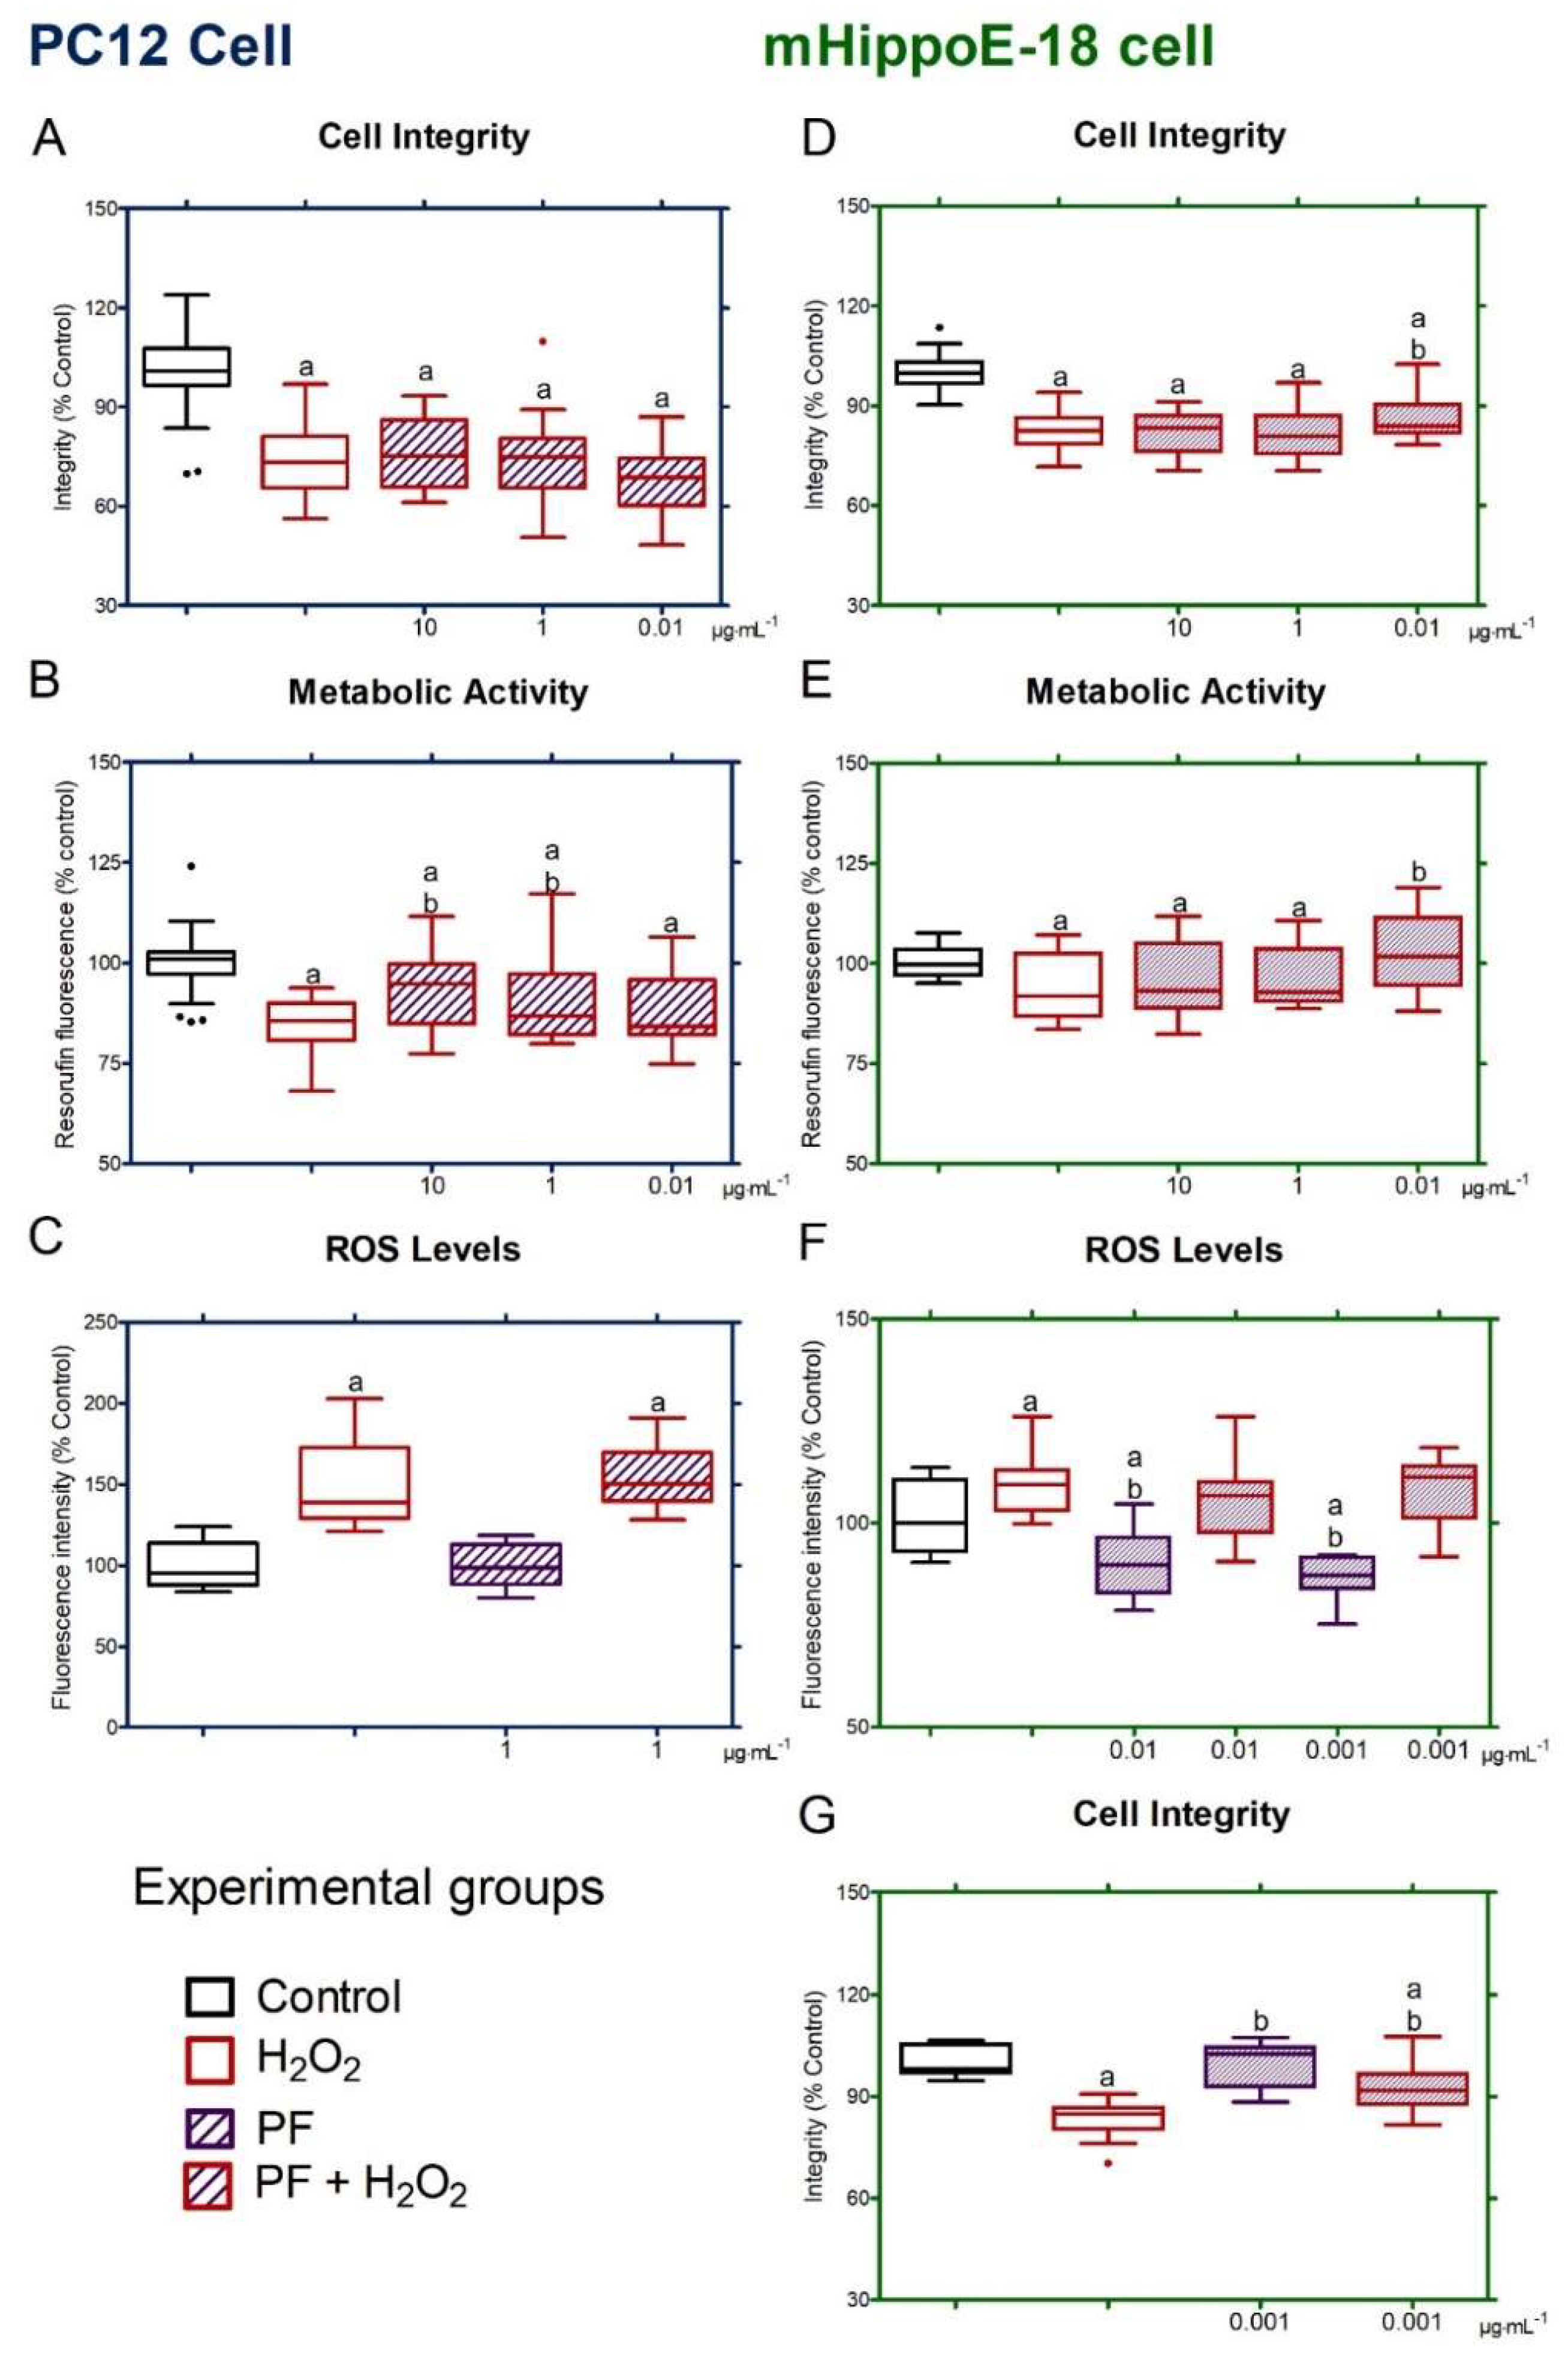
Figure 5.
Characterization of differentially expressed proteins of four experimental groups by PEAKS Studio proteomics software (Version X, https://www.bioinfor.com/peaks-studio/). (A) Label-free proteomic analysis presented in heatmap layout, used to calculate the ratio of relative abundances. (B) Differential protein expression of total proteins classified as up-regulated or down-regulated for each experimental group. (C) Differential protein expression of total proteins classified as up-regulated, down-regulated, or unchanged between different groups.
Disclaimer/Publisher’s Note: The statements, opinions and data contained in all publications are solely those of the individual author(s) and contributor(s) and not of MDPI and/or the editor(s). MDPI and/or the editor(s) disclaim responsibility for any injury to people or property resulting from any ideas, methods, instructions or products referred to in the content. |
© 2025 by the authors. Licensee MDPI, Basel, Switzerland. This article is an open access article distributed under the terms and conditions of the Creative Commons Attribution (CC BY) license (http://creativecommons.org/licenses/by/4.0/).
Copyright: This open access article is published under a Creative Commons CC BY 4.0 license, which permit the free download, distribution, and reuse, provided that the author and preprint are cited in any reuse.


