
Submitted:
29 January 2025
Posted:
30 January 2025
You are already at the latest version
Abstract
The development of the city's transport and logistics infrastructure is associated with many problematic issues, such as a decrease in the quality of life of the population, insufficient connectivity of territories, uneven intensity of traffic flows, and ecological impact. The article presents theoretical and practical foundations for improving the city's transport and logistics infrastructure by using graph theory method. The primary results were obtained by dividing the city's territory into meso-districts, determining the poles and vectors of the city's meso-district graph, their territorial placement and connectivity with other districts, considering the availability and provision of industrial, social, institutional and environmental infrastructure. For this purpose, based on expert assessments and sample data from infrastructure facilities, the indices of meso-district congestion by enterprises and institutions were determined. Based on statistical data, the contribution of the studied indicators to the overall polarity of the city's meso-districts was determined. The results allowed us to determine the most problematic meso-districts in the city, to identify the directions of logistics flows in the city. The data obtained allowed us to determine the directions of development of the transport and logistics infrastructure (TLI) in the city. In addition, the polarity of the graph of meso-districts of the city characterizes the state of traffic jams on the roads of meso-districts and the impact on the environment, which makes it possible to adjust when planning the development of the TLI of the city. The proposed methodological approach and the results of the study allow making scientifically based decisions in the formation and development of TLI. The study reveals the practical prospects for using this methodological approach in developing a concept for the development of TLI in any large city. The results provide valuable information for stakeholders, policy makers, local authorities and state bodies to implement specific actions.
Keywords:
urban logistics
; city mesodistrict
; transport and logistics infrastructure
; passenger flow
; tourist flow
; city logistics infrastructure
; logistics
; graph theory
; sustainability
; accessibility
1. Introduction
In the conditions of urbanization of cities, constant increase in the volume of cargo flows, passenger flows and turnover of goods in cities, problems of congestion, ecology, and declining quality of life arise. In order to solve them, planning and rational placement of logistics and transport infrastructure in cities [1], planning the movement of goods and passengers [2], determining the location of urban areas, socio-cultural and logistics facilities [3], corporate management and social responsibility in the management of urban logistics facilities [4] play a significant role.
A major problem in city planning is the suboptimal location of industrial zones, socio-cultural, administrative facilities, which seriously affects for transport situation and quality of life. Uneven distribution of logistics, industrial, socio-cultural, commercial facilities and municipal institutions in the city and adjacent areas to the city can affect the choice of direction for the development of transport and logistics infrastructure [5].
Transport and logistics infrastructure has a significant impact on the quality of service for freight and passenger flows in Kazakhstan, as well as on the increase in the number of attracted tourist flows to the country's tourist sites [6]. Evaluation of the efficiency of the transport infrastructure in Kazakhstan shows a decline in its indicators. For example, in the IMD World Competitiveness Ranking by the "Infrastructure" criterion in 2023, there is a deterioration in Kazakhstan's indicators (a decrease from 46th to 47th place) among 67 countries in the world [7]. In the Logistics Performance Index (LPI) of the World Bank, Kazakhstan ranked 79th among 138 countries in 2023. Of these, according to the "Quality of Transport Infrastructure" criterion - 80th place (in 2018 - 81st place) [8]. In the latest version of the Travel and Tourism Development Index (TTDI) for 2021, Kazakhstan ranked 66th out of 117 countries [9]. Of these, according to the criterion “Ground and port infrastructure” - air transport, roads, railway lines and stations - 80th place, “Air transport infrastructure” - capacity of airlines, number of destinations - 73rd place.
The problems of transport and logistics infrastructure in large cities of Kazakhstan (Astana, Almaty and Shymkent) are insufficient integration of suburban areas, congestion of the transport network, insufficiency and uneven distribution of logistics, industrial, socio-cultural and trade facilities throughout the city. The problems are solved by the presence of an intelligent transport system (ITS), smart traffic lights, logistics services for the distribution of small loads through self-service terminals [6], etc.
The city of Astana, located on the Ishim River, on an area of 797.33 square kilometers, was chosen as the object of this study. Currently, the city's population is more than 1.50 million people, but the city is developing dynamically, and by 2035 the estimated population will be 2.5 million people [10]. Due to the active population growth, the need for housing, connection links and communications is growing. The growth of the population, the number of transports, socio-cultural (restaurants, cafes, schools, shops, etc.), tourist and administrative facilities are proceeding at a high rate, outpacing the growth of transport and logistics infrastructure.
Astana and its suburbs are monocentric agglomeration. However, the new general plan for the development of Astana until 2035, adopted in 2023, provides recommendations for the development of a polycentric urban development concept [10].
The new Concept provides for an increase in the length of streets and roads, the number of bus stations, railway stopping stations, and the completion of the light rail line. It is planned to increase from 2024 to 2035 the density of the street and road network (km/km 2) - from 4.4 to 5.2; the number of cars (thousand units) - from 347.2 to 583.9; the level of motorization (cars/thousand residents) - from 235 to 260; the number of automobile interchanges at different levels - from 24 to 41. Over the past three years (2021-2023), there has been an increase in freight turnover by an average of 12.3%, passenger turnover - 3.5%, tourist flows - 40.6%, the number of personal cars - 16.1%, retail trade - by 23.6% per year.
As can be seen from these data, the multiple increase in transport, logistics, retail and freight turnover indicators in the coming years cannot be achieved without significant development of existing and creation of new transport, logistics and trade capacities. This will require new approaches to research and development of a strategy for the development of transport and logistics infrastructure in large cities.
Despite numerous scientific developments on the choice of location of transport and logistics facilities in cities, their planning and design, as well as the assessment of the effectiveness of their activities, it can be stated that the existing solutions to the scientific problem around organizational and methodological support for the formation of logistics infrastructure in cities require more detailed study.
The problem of uneven development of the city's logistics infrastructure (CLI) is that the applied method of local solution of problem areas of the logistics infrastructure within individual cities and city districts does not allow for optimization of material and human flows in the logistics infrastructure.
This is due, firstly, to the specifics of the functioning of logistics infrastructures in cities related to servicing cargo and passengers, their impact on the environment. Secondly, significant shortcomings in the methodological tools - a shortage of modern methods based on scientifically substantiated criteria for assessing the rational placement of logistics facilities, which determined the choice of the goal and objectives of the study. With a small area of cities, high population density and placement of TLI, this task requires its own scientifically substantiated solution considering various factors that affect the choice and efficiency of the logistics infrastructure.
Currently, large cities are acutely aware of the lack of quality transport and logistics infrastructure. The problem is getting worse from year to year, the costs of their availability are increasing, worsening the quality of life. To solve the problem, the issue of proper planning of the development of TLI is becoming acute, based on the capacity and sources of logistics flows, their location and functioning.
At the same time, the location of most buildings in meso-districts without internal streets indicates insufficient transport accessibility inside [10]. Because of this, the entire load falls on the main streets along the perimeter, without the possibility of distributing vehicles along smaller streets.
Existing studies of transport and logistics infrastructure in cities mainly focus on macroeconomic and fragmentary analysis of large cities, ignoring the importance of intra-city logistics flows, not taking into account the actual configuration and location of infrastructure facilities in the city, which is the reason for the lack of a coherent tool for the formation and development of TLI. The purpose of the study is to use graph theory to improve methodological tools for the formation and development of urban logistics infrastructure using the example of Astana (Kazakhstan). In determining the relationship between the location of city logistics infrastructure facilities in the city's meso-districts, their impact on the availability of TLI, and on this basis - determining the direction of its development.
This study focuses on the objects of the transport and logistics infrastructure that ensure the full functioning of the process of transportation of goods and passengers: economic (transport, logistics, industry, trade, information and communication); social (social-cultural objects), institutional (government bodies, financial and insurance institutions, marketing organizations, etc.), environmental (land resources, the presence of municipal waste and emissions of pollutants into the atmosphere, environmental costs), related to the group of system-forming factors influencing the development of the transport and logistics infrastructure.
2. Literature Review
2.1. Theoretical Approaches to the Formation of the City's Logistics Infrastructure
Transport and logistics infrastructures play a vital role in the functioning of the city, influencing the efficiency and availability of cargo and passenger transportation and the city’s attractiveness for tourists.
Most publications on freight or passenger transportation in urban areas consider the activities of shippers or carriers, planning and routing of delivery vehicles, planning freight distribution, and optimizing passenger flow [11,12]. Transportation is carried out throughout the entire city, but due to the density of land use in each part of the city, organizational and technological solutions for TLI differ.
Urban logistics planning models usually consist of two-tier urban logistics systems, where the first tier is most often located on the outskirts of the city – these are urban distribution centers, the second tier consists of satellite platforms, satellites at close range inside the city [13]. Application in cities intermodal logistics platforms [14], innovative technologies (information and communication technologies) [15], intelligent transport systems [13] contributed to the implementation of effective measures for the placement and management of transport and logistics infrastructure in urban logistics [16].
Among the studies that reveal to one degree or another the problems of forming a logistics infrastructure, the works of D.J. Bowersox, D.J. Kloss, W.F. James [17], M. Christopher [18], J. Mangan [19] and others.
One of the modern approaches to building a logistics infrastructure in a limited area was proposed by the American economist E. Hoover [20] and generalized by Russian scientists V.I. Sergeev [21]. The issues of designing effective logistics distribution and warehouse network are considered in the works [22,23,24].
The practice of creating logistics infrastructures in the city, the joint functioning of elements of the logistics infrastructure in individual administrative-territorial entities of the city often remain uncoordinated, which leads to disproportion in the development of the CLI [25]. One of the reasons for the disproportions is the non-systemic development of the logistics infrastructure, which is expressed in the fact that the methods used for local resolution of problem areas within individual cities or districts in the urban agglomeration do not allow solving the problem of optimizing material and other flows of the logistics infrastructure in an integrated format and lead to an uneven load on individual links of the logistics infrastructure [11].
The paper [26] proposed an innovative approach to solving the problem of urban logistics by adopting a spatial participatory process that combines GIS models and real-time spatial Delphi to identify suitable locations for logistics facilities; a two-stage cluster analytical approach was used to segment the capitals of EU countries based on their urban logistics performance [27].
The paper [28] presents a three-tier hub system, where the first tier is located on the outskirts of the city, the second in the city center, and the third in consumer quarters. The authors believe that this three-tier hub system increases the motivation of competitors to cooperate and reduces the transport load on the urban environment.
In the formation of the logistics system and its infrastructure, a certain role is played by the integral paradigm, in which, at present, the concept of supply chain management (SCM) is becoming relevant. SCM in the framework of this study is applied in the management of flows through functional objects of social, economic and institutional infrastructure.
The advantage of forming models with a multi-level management structure is that it provides the opportunity to take into account the interests of all levels [29]. A multi-level approach to forming a CLI allows us to come close to solving the problems of coordinating a group of cities and administrative districts in an agglomeration.
The infrastructure of the transport system forms the urban spatial structure. In the process of urbanization, it has changed in type and location. If there was an industrial park before, now there are commercial centers [30]. Due to the increase in e-commerce, distribution centers for goods have increasingly appeared in cities.
A new framework [31] is proposed for the integration of freight transport, urban land management and infrastructure management in accordance with the principles of economic geography (location, agglomeration and urbanization), spatial analysis of freight traffic area, clustering to determine the optimized and integrated freight traffic area.
In work [32], the method for determining the placement of logistics infrastructure facilities is supplemented by a more detailed consideration of the specialization of regions and the economic potential of regions, the operating features of warehouse, sales and trade infrastructure facilities, which makes it possible to take into account the specifics of each region or city.
Recently, tourism has made a significant contribution to the development of urban traffic and urban logistics, exerting a positive external impact on public transport [33]. Analysis shows [34] that all urban entities - municipal authorities, logistics operators, citizens and tourists - will benefit from the development of urban logistics. To ensure transport and tourist flows using various types of urban transport are proposed [35]: integrated logistics centers, urban light rail transport, management of urban transport flows, including tourist flows, development of rural areas bordering cities.
Thus, the city's transport and logistics infrastructure have a complex impact on cargo transportation, passenger traffic and tourism development. The issue of planning and developing transport and logistics facilities in the city should take into account not only external factors, but also the placement and interconnection of facilities located within the city's meso-districts, which affect sustainability, environmental friendliness and quality of service, and are key to creating a comfortable urban environment.
2.2. Methods of Formation of Transport and Logistics Infrastructure of the City and Factors Influencing It
The conducted analysis of scientific literature allowed us to identify a significant number of works that propose mathematical methods and models or approaches to determining the location of transport and logistics infrastructures in a city or region.
1. Simple methods and models. These methods allow us to determine the location of both individual objects of the logistics infrastructure and their networks. Among the models and methods that have found wide practical application, it is necessary to highlight the Ardalan method [36], which allows to determine the optimal location of warehouses in the distribution network taking into account the influence of factors, the model of the "General Optimal Market Service Area" of Rutten [37], commercial attraction and the methods of Arthur Geoffrion [38], the center of gravity. They are based on a large number of assumptions and represent an express assessment of the proposed logistics infrastructure.
2. Complex methods and models. Researchers A. Klose and A. Drexl proposed dividing complex methods and models into three large groups: methods of network modeling, continuous and discrete optimization [39]. Network modeling methods allow determining the location and capacity of the main objects of the logistics infrastructure. The disadvantages of these methods are the limited space of the graph nodes and the low efficiency of the solution with a significant number of options for the location of key components of the transport and warehouse infrastructure.
To solve the placement problems, methods and models of mathematical programming and discrete optimization are used [40]. With a significant number of possible locations of logistics infrastructure facilities, approximate heuristic methods are used [41]. These methods allow for obtaining a location of the network of transport and warehouse infrastructure facilities close to the optimal one “in a reasonable time”.
To solve the problems of the functioning of the logistics infrastructure and the formation of its development vectors, the application of graph theory, which integrates the analytical capabilities of logistics and mathematical analysis, is of interest. The application of graph theory to the problem of the layout and placement of objects has been widely studied [42,43].
At present, there are many methods in graph theory for solving general problems. Authors who applied graph theory in the formation and evaluation of individual aspects of logistics systems [17,18,44] solved various problems in logistics.
The models and methods for determining the optimal location of logistics infrastructure facilities that are widely used in practice provide an approximate solution and do not allow for the simultaneous determination of their capacity and type of cargo carrier. In addition, they do not provide for the formation of interconnected warehouse and transport infrastructure on the territory of the region.
In the work [45,46] it is proposed to use graph theory in developing methods for determining strategic directions for the development of the CLI. The essence lies in the decomposition of a large city territory into small territorial entities - meso-districts, which have in their composition the same or close to this level economic, social and institutional infrastructure objects. In this case, the population of meso-districts, their territorial location and connectivity with other meso-districts, as well as their provision with industrial, social and institutional infrastructure objects are taken into account.
The conducted analysis of scientific literature allowed us to identify a significant number of works that propose mathematical methods and models or approaches to determining the location of a network of warehouses, transport and logistics terminals in region [32]. To select indicators in each group of factors, an analysis of the most frequently used indicators was conducted.
Thus, elements of graph theory make it possible to determine the directions of logistics flows and the development of transport and logistics infrastructure.
2.3. Model of Development of Transport and Logistics Infrastructure of the City
The results of the study showed that the flow of urban freight has a tendency to grow steadily. The main drivers of this steady growth are population growth, urbanization, densification, globalization, online and multi-channel retail, and the development of the urban economy [47].
The organizational and functional model of the CLI, which uses a systems approach as its basis, presented in the work [48], consists of social, economic and institutional spheres, which are coordinated with each other by the city’s logistics infrastructure.
One of the most important structural components of urban logistics is the logistics system of goods and passenger movement and their infrastructure, i.e. the logistics infrastructure of freight transportation in the city and the logistics infrastructure of passenger transportation in the city (Figure 1).
The basis of the logistics flow in the city is the totality of material, information, financial and other flows that circulate within the urban area and are associated with the movement of goods, services, passengers, transport and resources. Factors influencing the logistics flow of the city: transport and logistics infrastructure, geographic location, technology, urbanization and demography, environmental requirements, e-commerce [49].
The key task of the CLI is to organize the joint functioning of three spheres of the city economy: economic, social and institutional, which, in our opinion, should lead to the optimization of logistics flows in the city. In this case, the CLI is divided into a number of corresponding subsystems in the specified spheres.
Optimization of logistics flows involves, first of all, improving the planning of the placement of economic, socio-cultural, and logistics facilities, developing infrastructure, integrating technologies, and greening processes [47].
Based on the analysis conducted, we propose the formation of the composition of the transport and logistics infrastructure of a region or city based on the identification of four levels of coordination of logistics flows in the transport and logistics infrastructure (Figure 1): economic, social, institutional and environmental.
The economic sphere includes objects of the trade and service segment, the production and agricultural segment of the economy, transport, tourism, information and communications. The social sphere - objects of the public utilities sector, health care, cultural and educational institutions, social security, sports sphere. Institutional sphere - objects of public security services, administration, credit and financial institutions, scientific organizations. Ecological sphere - objects of the natural environment and resources, a complex of protected areas, waste removal and disposal systems, systems for the extraction and delivery of resources to production, buildings and engineering structures, warehouses, etc.
The task of developing transport and logistics infrastructure in the urban environment is to manage the logistics flow through: a) transport infrastructure (impact on freight transportation, passenger flow, attraction of tourist flow), b) logistics infrastructure (optimization of transport routes, development of warehouse infrastructure, digitalization of logistics, improvement of the “last mile”, implementation of sustainable solutions).
Thus, the management of the logistics flow will contribute to solving the problem of economic development of the city, improving transport accessibility, social impact (meeting the needs of the population, improving the quality of life of people), urban infrastructure and planning (optimal placement of facilities and cost reduction) through the development of TLI.
3. Materials and Methods
The study of the development of TLI was carried out in a sequence that included the following stages.
Stage 1. Determination of indicators reflecting the work of TLI elements.
At the first stage, we selected indicators influencing the TLI from various literary sources. Calculating the correlation matrix for the variables involved in the analysis allowed us to exclude dependent (correlating) parameters and select the most significant 14 indicators:
1) economic factors: Volume of innovative products (VIP), billion tenge/year; Volume of sales of goods and services (retail and wholesale trade, food, vehicle maintenance and repair) (VSGS), billion tenge; Volume of industrial production (VIPn), billion tenge/year; Number of business entities (NBE), thousand units; Transportation of freight and baggage (TBG), thousand tons; Number of passengers transported (NP), million people/year;
2) social factors: Volume of services rendered (VSR), billion tenge/year; Average annual population (AAP), thousand people; Number of social and cultural facilities (NSCF), units;
3) institutional factors: Number of subjects of public administration and defense; compulsory social security (NSPA), units.
4) environmental factors: Land resources (LR), billion tenge; Volume of collected municipal waste (VCMW), tons; Emissions of pollutants into the atmosphere (EPA), tons; Environmental protection costs (EPC), million tenge
Stage 2. Division of the city territory into meso-districts.
In developing methods for determining strategic directions for the development of CLI, a method of decomposing a large city territory into small territorial entities - meso-districts, which have the same or similar economic, social, institutional and environmental infrastructure objects in their composition, was used. In the study, it is assumed that the vertices of the graph are the city's meso-districts, nodal objects of industrial, social, institutional and environmental infrastructure, and the edges are the communications between them.
For a more detailed analysis of the logistics infrastructure, based on the graph theory proposed in the work [45], we divided the city core into meso-districts, based on the historical features of the development and location of the basic objects of the logistics infrastructure: buildings (low-rise, high-rise, residential area, non-residential), recreational potential, industrial potential, institutional and commercial center, transport potential (transport hub, transport communications center).
The division of the city territory into meso-districts is shown in Figure 2.
The essence of the algorithm for calculating the poles and vectors of a city graph is that for each point N of a graph G, the minimum distances from this point to all points of the graph under consideration are calculated [45,50].
The maximum value is selected among all the minimum distances between points - as a result, the value R(N) is determined, characterizing this point in the graph G [51]. Among the possible values of R(N), the minimum value is selected, which is the radius M of the graph G. The centers of the graph under study are the points at which the value of R(N) is equal to the value of M [52]. The center is found to be one of the elements of the adjacency matrix DN, the value of the i, j-th element of which is - i, j is the shortest distance from the vertex i to the vertex j.
where i, j - the elements of the adjacency matrix, the values of which are equal to the number of paths (edges) from the i-th vertex of the graph to the j-th vertex.
For each pair of points i, j, the minimum distance L (i, j) between them is considered. The maximum among the values of L (i, j) is the diameter of the graph. Calculations are carried out in a similar manner for all vertices a i j of the graph. For each point, the minimum distance from all points of the graph is calculated [46, p. 34]. The maximum among the minimum values of distances is selected. Accordingly, this algorithm can be expressed by formula (2). When determining the diameter of the graph, defined by the adjacency matrix DN, the largest distance from expression (3) is determined:
where: МрВВ(X) is the minimum distance between the vertices of the graph, МрВВ(i) is the maximum distance between each pair of vertices of the graph.
MrBB (X) = min {МрВВ (i)}
MrBB (X) = max {МрВВ (i)},
Each edge for a pair of nodes of an undirected graph is simultaneously both positive and negative, since it can be characterized by both incoming and outgoing flows. To determine the basic vectors of movement of logistic flows, an adjacency matrix is determined, which allows us to determine the direct interaction between each pair of meso-districts of the city at each level of sections.
The adjacency structure of the graph of the core of the city of Astana, calculated in the Excel software environment, is shown in Figure 3.
This division can be used to determine the model of development and management of the CLI, to determine and calculate the shortest route of movement of a vehicle during transportation and distribution of goods throughout the city.
To assess the accessibility of social, industrial, institutional and ecological infrastructure facilities for each meso-district, a method for determining the poles of a meso-district graph was used. In this paper, polarity is understood as the degree of accessibility of the poles of the considered meso-district graph to the social, industrial, institutional and ecological infrastructure facilities of the city, measured using accessibility indicators [54].
The main point of Table 1 is to determine the most congested and densely populated meso-districts of Astana. For this purpose, the indices of congestion of meso-districts by enterprises and institutions were determined empirically. The congestion index was determined within the range from 0 to 6.
The population of the city's meso-districts, their territorial distribution and connectivity with other districts, as well as their provision with industrial, social, institutional and environmental infrastructure facilities were taken into account. 12% of the basic infrastructure facilities from the total volume of subjects were selected for the study, which is sufficient to characterize the objects of study. Table 1 provides some descriptive statistics for the polarity indices studied in this study. Standard deviations in all meso-regions are relatively low (below 5%), indicating a stable level of participation in the analyzed area.
The initial data from the experts’ assessment of the polarity of the meso-regions of Astana are provided in Table A1. The significance of indicators reflecting the relationship between the meso-districts of Astana was assessed. Table A2 of Appendix A presents the results of the assessment of significant correlation indicators by p-value: p< 0.05; p<0.01; p<0.001.
Algorithm for calculating the poles and vectors of a city graph: 1. collecting statistical data on the city’s logistics infrastructure; 2. analyzing the data; 3. software processing of the data and obtaining the result. The initial data are given in Table A3.
4. Results
The heterogeneity of indicators influencing the activities of the TLI (Table 2) by meso-districts confirms the unevenness of planning and distribution of infrastructure in the city of Astana.
In the paper, meso-districts are classified in relation to the average city indicators of paid, commercial and household services per capita. As can be seen from Table 2, a number of meso-districts have significantly larger volumes of these services than other meso-districts, which allows them to concentrate material, human and other flows from less “provided” meso-districts.
The vertices of the graph are the meso-districts of the city under study, the nodal objects of economic, social, institutional and environmental infrastructure, and the edges are the communications between them.
From the analysis of Table 2 it is evident that the structures of indicators for each of the four administrative districts of Astana (Yesil, Almaty, Saryarka and Baikonur) differ greatly in the total volume for each indicator.
The structure according to the VIP indicator is by districts (in %): Yesil - 30; Almaty - 6; Saryarka - 64; Baikonur - 0.01; VSGS - 38.4; 17.5; 13.4: 30.7 respectively; VIPn: 13; 33; 17; 37 respectively. VSR: 35; 19; 15; 31 respectively TBG: 3.3; 77.7; 17; 1.9. The structure of land resources (VCMW and EPA), respectively: 10 and 4; 6.0 each; 3.0 each; 82 and 87. The structure of the EPC: 56.0; 2.0; 10.0; 32.0 respectively.
The highest level of concentration of services rendered is in the Yesil district. These are the very same meso-districts that belong to the left bank (the new city center, the south and southwest in Figure 2), and where the largest number of city residents is. The highest level of transported cargo is in the Almaty district (78%), although less than the VSR (19%). The high level of concentration by NSPA and by NSCF is in the Yesil district - 42 and 28%, respectively. The high level of VCMW and EPA is in the Baikonur district - 82 and 87%, although there are relatively low EPC (32%).
The results of the analysis of Table 2, Figure 2 and Figure 3 show that a high concentration of VIP is observed in the old city center (mesorieties 13 and 14), a high concentration of VSGS - in the southwest (mesorieties 6 and 7) and on the northern outskirts (20 and 21). A high density of VIPn is found in the northeast (14 and 15), southeast (8, 9, 10, 11 and 12) and the old center (13, 14, 16) of the city.
High volumes of freight traffic are observed in the south-east (8, 9, 10, 11, 12 and 13) and north-east (16) of the city, which is explained by the absence or insufficiency of transport, logistics and distribution centers in other areas of the city. High passenger traffic density is in the center (10), the old center (14) and on the outskirts of the city - the north and north-east (15, 20 and 21), which is explained by the pendulum movement of the workforce from residential areas to the city center for work.
The high density of public institutions in the new city center in meso-districts 1-4, as well as in the old city center (13, 14, 15 and 16) indicates a high concentration of objects in these meso-districts. The population is distributed relatively evenly, except for the meso-districts, where the high density is in the south-east (8, 10 and 11) and in the north-west (18 and 19). A high density of socio-cultural facilities is found in the north-west (18, 19), north-east (14-15) and north (20, 21), and government and financial institutions are concentrated in the new - in the south and south-east (2, 4, 6) and old (17, 18, 19) city center. The largest share of land resources for the development of infrastructure facilities is in the south (1-3), in the new center (7), in the northwest (19), in the north (21) and northeast (15). In the central part of the city there are no land resources for the construction of large logistics facilities.
The results of the analysis of Table A1 (Appendix) show that the locations of infrastructure facilities in the city's meso-districts significantly affect the availability of TLI both in local and neighboring meso-districts for all values of the coefficients in the correlation matrix (Table A1). Comparison of the locations of meso-districts (Figure 2) and their correlation coefficients shows that neighboring meso-districts have a strong connection (from 0.53 to 0.98) (highlighted in red in Table 1). Those meso-districts that are located between themselves through one or two meso-districts also have a close connection from 0.47 to 0.90 (highlighted in yellow). Meso-districts located on the outskirts of the city have a weaker connection with meso-districts at the other end of the city and with the central meso-districts. That is, the meso-districts located on the outskirts of the city have a smaller connection with the central meso-districts - they have a connection with coefficients from 0.41 to 0.83 (highlighted in green, for example, A2 with A10-A20, A7 with A11-A21 or A16 with A11-A15, A8 with A17-A21, A9 with A16-A21, respectively). This circumstance suggests that geographically nearby meso-districts have a greater influence on the development of transport and logistics infrastructure with a coefficient of 0.53 and higher (p < 0.01 and p < 0.05) than those meso-districts that are located further from the center.
Less connection between the outlying meso-districts with the central meso-districts indicates the functional and spatial hierarchy of the urban area. This phenomenon indicates several aspects: 1) poor transport accessibility. Outlying areas are usually worse provided with transport infrastructure compared to the central parts of the city, which leads to lower connectivity. 2) Geographic isolation. Large distances and the lack of developed transport hubs complicate communication with the city center. 3) Mon centricity of development. Peripheral meso-districts do not have their own local centers and depend on the central meso-districts.
5. Discussion of Results
The method of determining the poles of the meso-district graph allows identifying the directions of logistics flows [54], managing transport links in logistics [55] (Table 2). It has been determined that flows from meso-districts with the highest accessibility index are directed to meso-districts with the lowest accessibility index, which allows determining the vectors of movement of goods and other flows within the city boundaries, their capacity depending on the population density and provision of social, economic, institutional, and environmental infrastructure facilities, as well as calculating the intersection centers of these flows, and managing transport links in logistics.
The distribution of infrastructure facilities that influence the development of the city's TLI is uneven and is based on the analysis of the indicators given in Table 1 and Table 2.
The study revealed that the meso-regions with the lowest polarity remain the meso-regions of the right bank of Astana (Baikonur - 14, 15, 20, 21, with a polarity index of 3.6; Saryarka - 13, 16, 17, 18, 20, with a polarity index of 3.3). The highest flow load index is 6.
Low polarity indicators indicate a low concentration of congestion in these areas with transport and logistics infrastructure and a low concentration of large trade, banking, social and business structures.
Astana is characterized by a high concentration of traffic congestion and trade, banking, social and government structures. The Yesil district (1, 2, 3, 4, 7) - the pole indicator is 4.78 and the Almaty district (8, 9, 10, 11, 12) - the pole indicator is 4.41.
Thus, the analysis shows that the left bank of Astana is oversaturated with commercial, educational, cultural, and government structures and contributes to the formation of traffic congestion.
The study revealed that the meso-districts with the lowest polarity (Figure 4) are the historical center of Astana (meso-district 16), as well as the Yesil district (meso-districts 5 and 6).
The analysis of polarity indices shows that, in general, there is a high congestion in meso-districts 3 and 4 (Yesil district), the polarity index of which is on average 5.3, and meso-district 16 (the central part of the city).
In meso-districts 10, 11, 12, 13, 14, 15 (the intersection of Almaty, Saryarka districts), the polarity index is on average 4.2. High congestion is at the intersection of the right and left banks.
In meso-districts 1, 4, 5, 7, 8, 17, 18, 19, 20, 21, the polarity index is on average 3.4. The indicator 3.4 indicates average congestion of meso-districts, but this indicates that these meso-districts are located on the outskirts of the city. Thus, at present, the vectors of goods movement in the city's logistics infrastructure are directed from the peripheral meso-districts to 2 designated centers (line A-B and line A-D in Figure 5).
In our opinion, the directions of flows in the logistics infrastructure of Astana indicate one of the main problems of the city - the difficult functioning of the distribution network, which is evident from Figure 5, which provides data on the capacity of the road transport network of the city's meso-districts. The assessment is based on the analysis of the existing road infrastructure, taking into account the standard capacity of single- and multi-lane roads (at an average speed of 20 km / h).
Taking into account the peculiarity of city planning, let us consider, first of all, the logistics infrastructure of the city.
The main share of basic objects of the economic, social, institutional and environmental infrastructures of the city core are located along 2 axes: North-West-South-East and North-Center-South (Figure 5). The largest number of these objects are located in the historical center of the city (point A), as well as in the area of the old railway station (point B).
It can be concluded that the result of the existing territorial structure, insufficient connectivity of transport communications between the city districts has become an increased load on the road and transport network of the city center, as well as insufficient capacity of existing communications. The total capacity of the road and transport network between the central and peripheral districts does not exceed 2,000 transport units per hour for the center (Figure 4 and 6). The traffic flow from other meso-districts is significantly inferior to the most intensive directions.
The study established that insufficient connectivity of logistics infrastructure elements is one of the most pressing problems in the development of Astana: transport communications are largely absent or have insufficient capacity. This factor further increases the load on the logistics infrastructure of the central districts of the city core and, thus, directly hinders its integration at the city/urban agglomeration level. While some communications are overloaded (meso-districts 3, 4, 10, 13, 16), the use of alternative routes is impossible due to traffic jams or the absence of roads connecting meso-districts 3 and 4 (the center of the left bank), 13 and 16 (the historical old center) (Figure 2 and Figure 4).
In addition, the insufficient connectivity of meso-districts leads to even greater stress on these poles due to transit flows from peripheral mesoregions.
It can be concluded that increasing the connectivity of the road transport network by constructing new communication routes between meso-districts (both diametrical and chord) will allow for a more even distribution of the load on the elements of the city’s logistics infrastructure and thereby increase the efficiency of its operation.
The second of the most pressing problems is the insufficient capacity between the right and left bank parts of Astana, especially between the meso-districts of the left bank and the historical center (Figure 6). This problem is aggravated by the overlap of material and human flows of the western left bank part of the city, as well as peripheral areas.
The analysis of the city's development vectors taking into account the peripheral areas confirmed the results of the analysis of the city's core. The meso-districts with the lowest average polarity in the model are meso-districts 3, 4, 10, 13 and 16.
This confirms the advisability of the transition to polycentric development of the city of Astana.
Thus, the main priority vectors of strategic development of the city’s logistics infrastructure are the West-Center-East and Center-Right Bank directions, which are indicated by dotted arrows in Figure 4 and Figure 7.
The conducted studies emphasize the need to link a certain number of goods flows entering the city before the city limits and thus create effective forms of distribution through targeted cooperation of all participants in the movement of goods - the creation of logistics trade and distribution centers.
Analysis of the results of data in Table 1 and Table 2, Figure 6 allows us to identify areas in the city that are favorable or unfavorable for the further development of TLI objects.
The uneven distribution of logistics facilities across the city's meso-districts leads to an inadequate increase in the volume of logistics flows in some meso-districts, where there is a high density of infrastructure facilities, and a low density of placement in other meso-districts of the city, which affects the congestion of city streets with traffic flows.
Based on this, it follows that when constructing or modernizing existing transport and logistics infrastructure facilities in Astana, it is necessary to take into account the directions and capacities of the city’s logistics flows.
1. In accordance with accepted international practice, terminal complexes and logistics centers are located outside large cities in adjacent territories [1,3,5]. In the case of Astana, they should be located outside the city bypass road, primarily on the outskirts, closer to the intersection of automobile and railway transport hubs.
In this case, the most effective placement of terminals should be considered at the intersections of radial and ring highways, which have been assigned to the status of international highways, at the intersections of highways and railways [56,57].
2. It is advisable to construct large multimodal terminal complexes that perform the functions of logistics transport and distribution centers in the nodes of the transport network where the highest concentration of freight flows is predicted: firstly, in meso-districts 1, 2 and 3, secondly, in meso-districts 8, 9 and 12, and thirdly, in meso-districts 13, 16 and 18.
3. In the city of Astana itself, we propose placing four large transport and logistics centers, each with an area of 30-40 hectares: 1) in the south-east, towards the Karaganda highway, near the ring road at the intersection of the road and railway (at the junction between meso-districts 8, 9 and 12; 2) an automobile terminal - in the north-east, towards the Pavlodar highway (meso-district 15), 3) in the north-west, near the ring road, at the intersection of the road and railway before entering the city (meso-districts 16 and 18); 4) an automobile and air terminal - in the south-west direction (meso-districts 1 and 2).
4. Large transfer points for public transport should be located at the junction of meso-districts where the greatest number of passenger flows is observed: between meso-districts 3, 4 and 5; 10 and 11; 16 and 17; 15, 20 and 21.
5. Large blocks in meso-districts should be divided into smaller streets through and through. This will also help in the fight against traffic jams, i.e. large highways will be relieved.
Analyzing the movement of material flows between the peripheral and central areas of the city, the most problematic in terms of operation is the north-eastern direction, as well as the north-western direction, connecting Astana with nearby settlements. As a priority measure, we propose the development of logistics centers for construction and household products, electrical, automotive and light industry goods in the north-western direction, based on the intersection of railway and highways, which will concentrate the cargo flows of automobile and rail transport of the eastern and north-eastern districts of Astana, as well as in the south-eastern direction - a multifunctional logistics terminal. Also in the north-eastern direction, towards the Pavlodar highway, at the intersection of the bypass road, a large wholesale distribution center for agricultural products should be located. It is also necessary to plan in the future for the construction of another railway passenger terminal for servicing the population and tourists.
These measures ensure a balance between economic benefits, environmental sustainability and social convenience, promoting the development of efficient urban logistics.
To develop transport and logistics infrastructure on the outskirts of the city, where meso-districts have less connection with the central areas, it is possible to use a comprehensive approach, including various measures: development of public transport; development of the road network; implementation of intelligent transport systems (ITS); creation of logistics hubs (transport and logistics centers and transfer points on the outskirts of the city); development of non-motorized transport (bicycle paths, pedestrian routes, bicycle and electric scooter rental); decentralization of urban functions (with the creation of new business and cultural centers, tourist facilities on the outskirts of the city, stimulating the development of jobs on the outskirts of the city ); creation and expansion of parking infrastructure; use of environmentally friendly transport.
These measures will help reduce the gap in transport accessibility between the outskirts and the center, increase population mobility, improve the quality of life and stimulate economic development on the outskirts of the city.
Also, these measures will not only stimulate the economic development of the city but also create comfortable conditions for the city’s population and tourists, increasing its attractiveness as a tourist destination.
The implementation of these measures will allow the city to become a major transport, logistics and tourism hub.
Based on the studied strategic directions of development of transport and logistics infrastructure of the city, we propose: to establish river navigation on the Ishim River as one of the urban modes of transport and for tourism purposes; construction of two multimodal logistics centers for cargo handling and one information logistics center for transport and logistics services for tourists; increase the length of high-speed roads of continuous movement, which will lead to a decrease in the average polarity indicator of meso-districts of Astana from 4.1 to 3.9. Considering that the optimal value of this indicator tends to one, our proposal will contribute to improving the quality of the transport and logistics infrastructure of the city and increasing the synergistic effect from its implementation.
6. Conclusions
Based on research using elements of graph theory, proposals are presented for the development of a conceptual scheme for the development and placement of terminal complexes and logistics centers for transport and logistics services for freight and passenger flows, including tourist flows, on the territory of the Astana transport hub, taking into account the specifics of its development.
The directions of the urban logistics development strategy have been defined. To solve problems in the area of organizing the movement of goods, priority practical measures for the implementation of the planned strategies are proposed.
The proposed measures will allow optimizing the city's logistics infrastructure by modernizing existing logistics infrastructure facilities in conjunction with the general plan for constructing new ones, as well as increasing the sustainability of the city's transport and logistics infrastructure and effectively using integrated logistics flows.
The data presented on the meso-districts of Astana, taking into account additional research, will allow in the future to develop a model and strategy for the development and management of the city's transport and logistics infrastructure, and recommendations for other large cities.
7. Limitations and Future Prospects
The authors suggest that future research directions, as information on the relationship between meso-district indicators and the availability, quality and sustainability of TLI development accumulates, will include more and more additional indicators for each meso-district, which will improve the quality of the study. In addition, future research can be improved by further investigating the multi-faceted relationships between meso-districts and key indicators of logistics flows.
Author Contributions
Conceptualization, Z.R.; Methodology, B.S.; Software, Z.R.; Formal analysis, B.S., Z.R. and B.R.; Investigation, Z.R. and D.Z.; Resources, B.S.; Data curation, D.Z.; Writing-original draft, Z.R. and B.S.; Writing-review & editing, B.S and B.R.; Validation, B.S. and B.R.; Visualization, B.S. and D.Z.; Supervision, Z.R. and B.S. All authors have read and agreed to the published version of the manuscript.
Funding
This study is funded by the Science Committee of the Ministry of Science and Higher Education of the Republic of Kazakhstan (Grant No. AP26195433).
Data Availability Statement
There are no restrictions on the availability of this data. The data were obtained from the Bureau of National Statistics of the Agency for Strategic Planning and Reforms of the Republic of Kazakhstan (at URL https://stat.gov.kz/official/industry).
Conflicts of Interest
The authors declare no conflict of interest.
Appendix A

Table A1.
Initial data of experts' assessment of the polarity of Astana city meso-districts.
| Item №. | Experts' assessment of polarity | Distribution of NBIO | ||||||||||||||||||
| E | S | I | ECO | |||||||||||||||||
| 1 | 2 | 3 | 4 | 5 | 6 | 7 | 8 | 9 | 10 | 11 | 12 | 13 | 14 | 15 | 16 | 17 | 18 | 19 | 20 | 21 |
| 1 | 4 | 6 | 5 | 5 | 6 | 2 | 5 | 4 | 6 | 5 | 1 | 1 | 4 | 4 | 4 | 4 | 6 | 2 | 4 | 1 |
| 2 | 4 | 4 | 5 | 5 | 5 | 2 | 3 | 4 | 5 | 5 | 6 | 1 | 5 | 5 | 6 | 6 | 5 | 2 | 1 | 1 |
| 3 | 6 | 6 | 6 | 6 | 6 | 3 | 5 | 4 | 6 | 6 | 6 | 2 | 6 | 6 | 6 | 6 | 15 | 8 | 4 | 3 |
| 4 | 6 | 6 | 5 | 6 | 6 | 2 | 5 | 4 | 6 | 6 | 6 | 1 | 6 | 6 | 6 | 6 | 17 | 7 | 5 | 4 |
| 5 | 4 | 3 | 3 | 3 | 3 | 2 | 2 | 3 | 3 | 3 | 1 | 1 | 3 | 3 | 4 | 4 | 7 | 4 | 3 | 1 |
| 6 | 3 | 3 | 3 | 3 | 3 | 4 | 3 | 3 | 4 | 3 | 1 | 2 | 2 | 3 | 3 | 4 | 6 | 2 | 2 | 2 |
| 7 | 4 | 4 | 6 | 4 | 5 | 6 | 4 | 4 | 5 | 5 | 5 | 3 | 6 | 5 | 6 | 6 | 10 | 3 | 3 | 2 |
| 8 | 4 | 3 | 3 | 4 | 4 | 5 | 4 | 4 | 4 | 6 | 1 | 4 | 4 | 4 | 4 | 4 | 7 | 6 | 2 | 2 |
| 9 | 4 | 3 | 3 | 4 | 4 | 5 | 4 | 3 | 4 | 4 | 1 | 5 | 4 | 4 | 4 | 4 | 5 | 3 | 1 | 2 |
| 10 | 6 | 6 | 5 | 5 | 6 | 5 | 4 | 4 | 5 | 6 | 4 | 4 | 6 | 6 | 6 | 6 | 16 | 12 | 6 | 4 |
| 11 | 6 | 5 | 4 | 5 | 6 | 4 | 5 | 4 | 6 | 5 | 2 | 4 | 4 | 4 | 4 | 4 | 12 | 4 | 2 | 2 |
| 12 | 4 | 4 | 4 | 4 | 6 | 4 | 4 | 4 | 6 | 4 | 1 | 6 | 6 | 6 | 6 | 6 | 13 | 5 | 3 | 1 |
| 13 | 5 | 5 | 5 | 5 | 5 | 5 | 4 | 4 | 5 | 5 | 1 | 5 | 4 | 4 | 4 | 4 | 11 | 7 | 4 | 3 |
| 14 | 4 | 5 | 4 | 4 | 4 | 5 | 4 | 4 | 4 | 5 | 1 | 4 | 4 | 4 | 4 | 4 | 15 | 7 | 3 | 2 |
| 15 | 4 | 3 | 2 | 4 | 3 | 5 | 4 | 3 | 4 | 4 | 1 | 4 | 4 | 4 | 4 | 6 | 13 | 3 | 1 | 2 |
| 16 | 3 | 2 | 3 | 3 | 2 | 3 | 2 | 3 | 3 | 2 | 2 | 3 | 3 | 3 | 3 | 3 | 7 | 5 | 2 | 1 |
| 17 | 4 | 5 | 4 | 4 | 4 | 5 | 3 | 4 | 4 | 4 | 1 | 3 | 4 | 4 | 4 | 4 | 9 | 3 | 1 | 1 |
| 18 | 4 | 3 | 4 | 4 | 4 | 3 | 3 | 4 | 4 | 3 | 1 | 4 | 4 | 4 | 4 | 4 | 6 | 5 | 3 | 2 |
| 19 | 4 | 3 | 4 | 4 | 4 | 4 | 3 | 3 | 4 | 3 | 1 | 6 | 4 | 4 | 4 | 4 | 7 | 4 | 3 | 4 |
| 20 | 4 | 3 | 2 | 3 | 3 | 4 | 3 | 3 | 4 | 3 | 1 | 4 | 5 | 5 | 5 | 5 | 5 | 2 | 1 | 1 |
| 21 | 4 | 3 | 2 | 3 | 3 | 4 | 3 | 3 | 4 | 3 | 1 | 6 | 4 | 4 | 4 | 4 | 4 | 2 | 2 | 1 |
| Average value | 9.3 | 4.6 | 2.7 | 2.0 | ||||||||||||||||
Table A2.
Correlation coefficients reflecting the relationship between the meso-districts of Astana.
Table A2.
Correlation coefficients reflecting the relationship between the meso-districts of Astana.
| A1 | A2 | A3 | A4 | A5 | A6 | A7 | A8 | A9 | A10 | A11 | A12 | A13 | A14 | A15 | A16 | A17 | A18 | A19 | A20 | A21 | |
| A1 | 1.00 | ||||||||||||||||||||
| A2 | 0.36* | 1.00 | |||||||||||||||||||
| A3 | 0.60** | 0.87*** | 1.00 | ||||||||||||||||||
| A4 | 0.61** | 0.86*** | 0.98*** | 1.00 | |||||||||||||||||
| A5 | 0.61** | 0.53** | 0.58** | 0.59 | 1.00 | ||||||||||||||||
| A6 | 0.59** | -0.03 | 0.02 | 0.01 | 0.55** | 1.00 | |||||||||||||||
| A7 | 0.05 | 0.53** | 0.37 | 0.28 | 0.35 | 0.26 | 1.00 | ||||||||||||||
| A8 | 0.25* | -0.28 | -0.22 | -0.19 | 0.33 | 0.58 | 0.05 | 1.00 | |||||||||||||
| A9 | 0.06 | -0.52** | -0.42 | -0.42 * | 0.17 | 0.53 | -0.04 | 0.80*** | 1.00 | ||||||||||||
| A10 | 0.46* | 0.45 * | 0.58** | 0.56 | 0.74** | 0.34 | 0.54 | 0.34 | 0.25 | 1.00 | |||||||||||
| A11 | 0.73*** | -0.11 | 0.20 | 0.23 | 0.46* | 0.54** | -0.27 | 0.50* | 0.48 | 0.67** | 1.00 | ||||||||||
| A12 | 0.28 | -0.03 | -0.04 | -0.03 | 0.42* | 0.41* | 0.17 | 0.58* | 0.70 | 0.45* | 0.59** | 1.00 | |||||||||
| A13 | 0.50** | -0.39* | -0.16 | -0.21 | 0.36* | 0.62** | -0.15 | 0.68** | 0.73*** | 0.34 | 0.75*** | 0.50** | 1.00 | ||||||||
| A14 | 0.46* | -0.37* | -0.17 | -0.19 | 0.41* | 0.67** | 0,00 | 0.80*** | 0.72*** | 0.43 | 0.58 | 0.47* | 0.87*** | 1.00 | |||||||
| A15 | 0.06 | -0.19 | -0.19 | -0.15 | 0.39 | 0.66** | 0.14 | 0.71** | 0.80*** | 0.36 | 0.31 | 0.60** | 0.45* | 0.58** | 1.00 | ||||||
| A16 | -0.21 | -0.08 | -0.23 | -0.27 | 0.31 | 0.30 | 0.20 | 0.19 | 0.41* | 0.04 | -0.07 | 0.44 * | 0.25 | 0.15 | 0.42 | 1.00 | |||||
| A17 | 0.60** | -0.14 | 0.01 | -0.02 | 0.597** | 0.74 ** | 0.20 | 0.62** | 0.57** | 0.57 ** | 0.53** | 0.47* | 0.79*** | 0.90*** | 0.52** | 0.41 | 1.00 | ||||
| A18 | 0.41* | -0.05 | -0.02 | -0.03 | 0.60 | 0.48* | 0.01 | 0.49* | 0.64** | 0.36 | 0.51** | 0.81*** | 0.69** | 0.55** | 0.49* | 0.65** | 0.60** | 1.00 | |||
| A19 | -0.02 | -0.45* | -0.42* | -0.46* | 0.15 | 0.31 | -0.11 | 0.47* | 0.83*** | 0.17 | 0.35 * | 0.77** | 0.69** | 0.51** | 0.54** | 0.61** | 0.54** | 0.79*** | 1.00 | ||
| A20 | 0.03 | -0.04 | -0.06 | -0.03 | 0.49* | 0.42 * | 0.25 | 0.51** | 0.69** | 0.52 * | 0.19 | 0.82*** | 0.32 | 0.45* | 0.80*** | 0.58** | 0.49* | 0.63** | 0.62** | 1.00 | |
| A21 | -0.18* | -0.52** | -0.51** | -0.48* | 0.09 | 0.27 | -0.19 | 0.53** | 0.83*** | 0.16 | 0.27 | 0.75*** | 0.49* | 0.48* | 0.71** | 0.53 ** | 0.35* | 0.60** | 0.85*** | 0.79*** | 1,00 |
Note: Calculated on the basis of expert assessment data, the correlation coefficient is significant at *p<0.05; **p<0.01; ***p<0.001.
Table A3.
Initial data for calculating the poles and vectors of the graph by meso-districts of Astana, in km.
Table A3.
Initial data for calculating the poles and vectors of the graph by meso-districts of Astana, in km.
| 1 | 2 | 3 | 4 | 5 | 6 | 7 | 8 | 9 | 10 | 11 | 12 | 13 | 14 | 15 | 16 | 17 | 18 | 19 | 20 | 21 | |
| 1 | 0 | 2.66 | 3.94 | 5.58 | 6.06 | 5.56 | 6.89 | 10.1 | 13.8 | 7.72 | 9.3 | 10.6 | 8.5 | 9.65 | 13.6 | 8.84 | 9.68 | 12.8 | 14.3 | 17.9 | 16.0 |
| 2 | 2.57 | 0 | 5.11 | 6.82 | 10.4 | 6.8 | 8.55 | 10.7 | 15.1 | 7.3 | 8.74 | 14.5 | 10.3 | 11.5 | 14.1 | 12.4 | 13.0 | 15.0 | 16.4 | 18.5 | 20.3 |
| 3 | 3.92 | 5.48 | 0 | 2.43 | 4.33 | 3.84 | 4.99 | 7.87 | 10.6 | 3.5 | 4.8 | 9.0 | 6.48 | 6.79 | 9.72 | 6.38 | 8.35 | 11.9 | 10.3 | 10.6 | 13.6 |
| 4 | 6.6 | 8.17 | 2.71 | 0 | 3.13 | 3.34 | 7.74 | 7.11 | 11.9 | 4.54 | 6.03 | 11.1 | 4.26 | 4.04 | 8.51 | 4.99 | 5.04 | 5.95 | 5.6 | 10.4 | 13.2 |
| 5 | 7.0 | 8.82 | 5.0 | 1.49 | 0 | 4.47 | 7.92 | 8.63 | 12.0 | 4.44 | 5.79 | 7.15 | 3.68 | 14.5 | 8.62 | 5.58 | 4.43 | 6.11 | 7.03 | 10.2 | 8.87 |
| 6 | 5.82 | 7.77 | 3.42 | 4.15 | 5.95 | 0 | 7.57 | 9.19 | 13.2 | 6.41 | 8.09 | 9.77 | 5.17 | 8.92 | 13.1 | 7.02 | 7.57 | 9.62 | 10.8 | 11.9 | 14.2 |
| 7 | 6.89 | 8.55 | 4.99 | 7.74 | 7.92 | 7.57 | 0 | 5.08 | 12.0 | 6.92 | 5.0 | 9.73 | 10.9 | 10.0 | 4.0 | 9.48 | 14.5 | 17.1 | 7.25 | 18.0 | 16.0 |
| 8 | 10.1 | 10.7 | 7.87 | 7.11 | 8.63 | 9.19 | 5.08 | 0 | 6.5 | 6.38 | 2.5 | 5.14 | 10.6 | 6.1 | 3.2 | 11.2 | 17.1 | 18.6 | 6.53 | 18.3 | 17.0 |
| 9 | 15.0 | 14.0 | 12.0 | 9.4 | 11.0 | 17.0 | 12.0 | 6.5 | 0 | 7.6 | 6.9 | 4.3 | 7.2 | 5.9 | 5.7 | 8.5 | 12.0 | 12.0 | 13.0 | 11.0 | 12.0 |
| 10 | 7.72 | 7.3 | 3.5 | 4.54 | 4.44 | 6.41 | 6.92 | 6.38 | 7.6 | 0 | 1.44 | 5.43 | 5.98 | 4.1 | 16.0 | 9.25 | 10.3 | 10.5 | 6.26 | 12.0 | 10.0 |
| 11 | 8.2 | 8.0 | 5.8 | 6.0 | 7.0 | 8.0 | 5.0 | 2.5 | 7.0 | 1.11 | 0 | 7.0 | 4.0 | 3.0 | 6.0 | 6.2 | 9.0 | 11.0 | 11.5 | 10.0 | 12.0 |
| 12 | 10.6 | 14.5 | 9.0 | 11.1 | 7.15 | 9.77 | 9.73 | 5.14 | 4.3 | 5.43 | 7.0 | 0 | 6.81 | 6.9 | 8.0 | 6.21 | 10.8 | 12.5 | 7.64 | 14.0 | 12.0 |
| 13 | 8.5 | 10.3 | 6.48 | 4.26 | 3.68 | 5.17 | 10.9 | 10.6 | 7.2 | 5.98 | 4.0 | 6.81 | 0 | 2.6 | 8.2 | 2.23 | 6.29 | 6.21 | 4.28 | 8.34 | 7.4 |
| 14 | 9.9 | 11.0 | 7.3 | 4.5 | 6.4 | 9.7 | 10.0 | 6.1 | 8.3 | 4.1 | 3.1 | 6.9 | 2.6 | 0 | 5.1 | 4.1 | 5.9 | 7.9 | 8.8 | 10.0 | 9.4 |
| 15 | 13.6 | 8.0 | 2.0 | 2.0 | 3.0 | 11.0 | 4.0 | 3.2 | 2.0 | 16.0 | 1.44 | 8.0 | 8.2 | 4.0 | 0 | 11.0 | 6.0 | 2.5 | 10.0 | 1.0 | 7.0 |
| 16 | 8.84 | 12.4 | 6.55 | 4.26 | 5.21 | 4.55 | 9.48 | 11.2 | 14.5 | 9.25 | 1.20 | 6.21 | 2.23 | 3.52 | 5.86 | 0 | 1.54 | 2.37 | 3.12 | 5.5 | 7.2 |
| 17 | 9.68 | 13.0 | 8.35 | 5.04 | 4.43 | 7.57 | 14.5 | 17.1 | 12.0 | 10.3 | 9.0 | 10.5 | 6.29 | 5.9 | 6.0 | 1.54 | 0 | 2.83 | 1.56 | 9.2 | 10.0 |
| 18 | 12.8 | 15.0 | 11.9 | 5.95 | 6.11 | 9.62 | 17.1 | 18.6 | 12.0 | 10.5 | 11.0 | 12.0 | 6.21 | 7.9 | 2.5 | 2.37 | 2.83 | 0 | 3.04 | 5.8 | 10.0 |
| 19 | 8.15 | 9.28 | 7.31 | 5.06 | 4.43 | 5.68 | 7.25 | 6.53 | 11.7 | 6.26 | 8.02 | 7.64 | 4.28 | 5.94 | 7.59 | 3.36 | 1.56 | 3.04 | 0 | 5.29 | 9.73 |
| 20 | 17.9 | 19 | 14.0 | 12 | 13 | 12 | 18 | 18.3 | 14 | 12.0 | 12.0 | 14.0 | 8.4 | 9.4 | 8.8 | 8.6 | 9.2 | 5.8 | 7.8 | 0 | 2.6 |
| 21 | 16.0 | 20.3 | 13.6 | 8.87 | 13.2 | 14.2 | 16.0 | 17.0 | 12.0 | 10 | 12.0 | 12.0 | 7.4 | 9.4 | 7.0 | 7.2 | 10.0 | 10.0 | 9.73 | 2.6 | 0 |
References
- Crainic, T.G.; Gendreaua, M.; Jemai, L. Planning hyperconnected, urban logistics systems. In Proceedings of the 22nd EURO Working Group on Transportation Meeting, Barcelona, Spain, 18–20 September 2019. Available online: http://www.sciencedirect. com/science/article/pii/S2352146520302490 (accessed on 15 Аugust 2024). [Google Scholar]
- Fatnassi, E.; Chaouachi, J.; Klibi, W. Planning and operation a shared goods and Passengers on-demand rapid transit system for Sustainable city-logistics. Transportation research Part B-Methodological. 2015, 81, 440–460. [Google Scholar] [CrossRef]
- Kevin, C. Global city regions and the location of logistcs activity. Journal of Transport Geography. 2010, 18, 354–362. [Google Scholar]
- Mansouri, B.; Sahu, S.; Ülkü, M.A. Toward Greening City Logistics: A Systematic Review on Corporate Governance and Social Responsibility in Managing Urban Distribution Centers. Logistics 2023, 7, 19. [Google Scholar] [CrossRef]
- Raimbekov, Zh.; Syzdykbayeva, B.; Zhenskhan, D.; Mukanov, A. Evaluation the Efficiency of Functioning and Development of Regional Distribution Networks. Economic Annals-XXI 2021, 191, 114–126. [Google Scholar] [CrossRef]
- The Concept for the Development of the Transport and Logistics Potential of the Republic of Kazakhstan until 2030. Decree of the Government of the Republic of Kazakhstan No. 1116 dated December 30, 2022. https://adilet.zan.kz/rus/docs/P2200001116/links - дата oбращения 03.10.2024 (in Russian).
- International Institute for Management Development. IMD World Competitiveness Yearbook. - Lausanne, Switzerland: IMD [URL: worldcompetitiveness.imd.org]. (access date 15.12.2024).
- Logistics Performance Index (LPI) https://lpi.worldbank.org/international/global (access date 16.12.2024).
- Travel & Tourism Development Index 2021 Rebuilding for a Sustainable and Resilient Future INSIGHT REPORT MAY 2022. chrome-extension:// efaidnbmnnnibpcajpcglclefindmkaj/ https://www3.weforum.org/ docs/WEF_Travel_Tourism_Development_2021.pdf.
- The General Plan of the City of Astana until 2035. Decree of the Government of the Republic of Kazakhstan No. 33 dated January 25, 2024. https://adilet.zan.kz/rus/docs/P2400000033 (in Russian).
- Dablanc, L. Goods transport in large European cities: Difficult to organize, difficult to modernize. Transportation research part a-policy and practice. 2007, 41, 2007–280. [Google Scholar] [CrossRef]
- Crainic, T.; Ricciardi, N.; Storchi, G. Models for Evaluating and Planning City Logistics Transportation Systems. Transportation Science. 2009, 43, 432–454. [Google Scholar] [CrossRef]
- Crainic, T.G.; Ricciardi, N. Storchi G. Advanced freight transportation systems for congested urban areas. Transportation Research Part C. 2014, 12, 119–137. [Google Scholar] [CrossRef]
- Antún, J.P.; Lozano, A.; Alarcón, R.; Granados, F.; Guarneros, L. The physical distribution of goods in a megalopolis: Strategies for policies on the location of logistics facilities within the Central Region of Mexico. Procedia - Social and Behavioral Sciences. 2010, 2, 6130–6140. [Google Scholar] [CrossRef]
- Taniguchi, E.; Thompson, R.G.; Yamada, T. Emerging Techniques for Enhancing the Practical Application of City Logistics Models. Procedia - Social and Behavioral Sciences. 2012, 39, 3–18. [Google Scholar] [CrossRef]
- Taniguchi, E. Concepts of City Logistics for Sustainable and Liveable Cities. Procedia - Social and Behavioral Sciences. 2014, 151, 310–317. [Google Scholar] [CrossRef]
- Bowersox, D.J.; Klos, D.J. Logistics: an integrated supply chain. /D. J. Bowersox, D. J. Klos. – Transl. s. Eng. – M.: ZAO Olimp-Business, 2005. – 640 p. (in Russian).
- Christopher, M. Logistics and Supply Chain Management [Text] / Under the general editorship of V. S. Lukinsky. – St. Petersburg: Piter, 2004. – 316 p. (in Russian).
- Mangan, J; Lalwani, C. ; Butcher, Т. Global Logistics and Supply Chain Маnagement. New York: John Wiley and Sons, 2008.
- Hoover, E. M. The Location of Economic Activity. - New York: McGraw Hill Book Company, 1948. 336.
- Sergeev, V. I. Logistics in business: Textbook / V. I. Sergeev. - M .: INFRA-M, 2001. 608. (in Russian).
- Romeijn, H.E.; Shu, J.; Teo, C.-P. Designing Two-Echelon Supply Network. Eur. J. of Operational Research. 2007, 178, 449–462. [Google Scholar] [CrossRef]
- Romeijn, H.E.; Al-Gwaiz, M.; Chao, X. Capacity Expansion and Cost Efficiency Improvement in the Warehouse Problem. Naval Research Logistics. 2016, 63, 367–373. [Google Scholar]
- Geunes, J.; Romeijn, H.E.; Van Den, H.W. Improving the Efficiency of Decentralized Supply Chains with Fixed Ordering. Eur. J. of Operational Research. 2016, 252, 815–828. [Google Scholar] [CrossRef]
- Savelsbergh, M.; Woensel, T.V. 50th Anniversary Invited Article—City Logistics: Challenges and Opportunities. Transportation Science, 2016, 50, 579–590. [Google Scholar] [CrossRef]
- Giuffrida, N.; Calleo, Y.; Di Zio, S.; Pilla, F.; Ottomanelli, M. Spatial participatory planning for urban logistics: A GIS-enhanced Real-Time Spatial Delphi approach. Research in Transportation Economics 2024, 108. [Google Scholar] [CrossRef]
- Škultéty, F. , Beňová, D., & Gnap, J. City Logistics as an Imperative Smart City Mechanism: Scrutiny of Clustered EU27 Capitals. Sustainability, 2021, 13, 3641. [Google Scholar]
- Scherrer, M. Coopetitive urban logistics to decrease freight traffic and improve urban liveability. In book: The Palgrave Handbook of Supply Chain Management. 2024, 747–768. 2024. [Google Scholar]
- Lukinykh, V.F. Methodology of managing a multi-level regional logistics system [Text] / V.F. Lukinykh; Krasnoyarsk, 2010, 292. (in Russian).
- Thu, L.T.B. Interactions Between Urbanization and Logistics Infrastructure in Suburbs of Ho Chi Minh City. Lecture Notes in Civil Engineering, 2024, 442, 110–118. [Google Scholar]
- Barrera-Jiménez, H.; Pineda-Jaramillo, J. A Framework for Integrating Freight Transport, Urban Land Planning, and Infrastructure Management under Economic Geography Principles. Urban Science, 2024, 8, 30. [Google Scholar] [CrossRef]
- Raimbekov. Z.; Syzdykbayeva, B.; Rakhmetulina, A.; Rakhmetulina, Z.; Abylaikhanova, T.; Doltes, L.; Kinasheva, Z. Designing and improving the efficiency of placement of logistics infrastructure for storage, distribution and trade of agri-food products. J. Ind. Eng. Manag. 2024, 17, 777–808. [Google Scholar]
- Albalate, D.; Germà, B. Tourism and urban public transport: Holding demand pressure under supply constraints. Tourism Management 2010, 31, 425–433. [Google Scholar] [CrossRef]
- Hącia, E.; Wagner, N.; Łapko, A. The Importance of City Logistics for Urban Tourism Development: Searching for a New Research Field. Energies 2023, 16, 175. [Google Scholar] [CrossRef]
- Sushchenko, R.; Zapara, Y.; Saienko, V.; Kostiushko, V.; Lytvynenko, L.; Pron, S. Urban transport, logistics, and tourism: Review of a cutting-edge socially-oriented approach to industrial development. Acta Scientiarum Polonorum, Administratio Locorum 2023, 22, 101–111. [Google Scholar] [CrossRef]
- Ardalan, A. An Efficient Heuristic for Service Facility Location. Proceedings, Northeast Decision Sciences Institute Conference, 1984, 181–182.
- Rutten, W.G.M.M.; Van Laarhoven, P.J.M.; Vos, B. The extension of GOMA model for determining the optimal number of depots. IIE Transactions, 2003, 33, 1031–1036. [Google Scholar] [CrossRef]
- Geoffrion, A. M.; Morris, J.; Webster, S. Distribution System Design. Facility Location: A Survey of Applications and Methods / Ed. Z. Drezner. - New York: Springer, 1995. - 572 p. - pp. 181–198.
- Klose, A.; Drexl, А. Facility location models for distribution system design. Eur. J. Oper. Res 2005, 162, 4–29. [Google Scholar] [CrossRef]
- Land, A. H.; Doig, A. G. An Automatic Method of Solving Discrete Programming Problems. Econometrica. 1960, 28, 497–520. [Google Scholar] [CrossRef]
- Megiddo, N.; Supowit, K. J. On the complexity of some common geometric location problems. SIAM. Journal on Computing. 1984, 13, 182–196. [Google Scholar]
- Hammouche, A.; Webster, D.B. Evaluation of an application of graph theory to the layout problem. Int. J. Prod. Res. 2007, 23, 987–1000. [Google Scholar] [CrossRef]
- Mohsen, H.; Gary, L. Hogg. A review of graph theory application to the facilities layout problem. Omega. 1987, 15, 291–300. [Google Scholar]
- Sergeev, V.I. Corporate logistics. 300 answers to questions from professionals. edited by V.I. Sergeev. M. INFRA-M, 2005. 976. (in Russian).
- Shvalov, P.G.; Tarasov, S.A.; Lukinykh, V.F. A Model of Development Vectors for the Logistics Infrastructure of the Krasnoyarsk Urban Agglomeration [Electronic resource]. Management of Economic Systems: Electronic Scientific Journal. 2013. Issue 6. Available at: http://www.uecs.ru/index.php. (in Russian).
- Shvalov, P.G.; Tarasov, S.A.; Lukinykh, V.F. Development of the Logistics Infrastructure of the Krasnoyarsk Urban Agglomeration. RISK: Resources, Information, Supply, Competition. 2013, 3, 33–39. (in Russian). [Google Scholar]
- Bosona, T. Urban Freight Last Mile Logistics - Challenges and Opportunities to Improve Sustainability: A Literature Review. Sustainability 2020, 12, 8769. [Google Scholar] [CrossRef]
- Lukinykh, V.F.; Shvalov, P.G. Model of development of logistics infrastructure of the urban agglomeration in Krasnoyarsk Krai. Journal of Siberian Federal University. Humanities & Social Sciences. Supplement. 2015, 8, 190–208. (in Russian). [Google Scholar]
- Savelsbergh, M.; Van Woensel, T. 50th Anniversary Invited Article—City Logistics: Challenges and Opportunities. Transportation Science 2016, 50, 579–590. [Google Scholar] [CrossRef]
- Dijkstra. E.W. A note on two problems in connexion with graphs. Numerische Mathematik. 1959, 1, 269–271. [Google Scholar] [CrossRef]
- Ore, O. Theory of Graphs. American Mathematical Society Colloquium Publications, 38 (American Mathematical Society, Providence, RI). 1962.
- Tutte, W.T. Graph Theory. Cambridge University Press, Jan 29, 2001 - Mathematics, 333.
- Oscar, Levin. Discrete Mathematics: An Open Introduction. University of Northern Colorado 2017, 345 https://discrete.openmathbooks.org/dmoi3.html.
- Tarasov, S.A.; Tarasov, Yu.S.; Shvalov, P.G. Method for determining the poles of the meso-region graph of the logistics infrastructure of a megalopolis. Proceedings of the VIII Int. scientific-practical. conf. (May 16-18, 2013, Krasnoyarsk). Part 1. / Krasnoyarsk State Agrarian University, - Krasnoyarsk, 2013. – 597 (in Russian).
- Shuangdong, Li; Jing, Xu; Ste, Cele. Application of graph theory in transportation linkage in logistics management and its computer aided model design. Journal of Intelligent & Fuzzy Systems 2019, 37, 1–8. [Google Scholar]
- Congjun Rao, Mark Goh, Yong Zhao, Junjun Zheng. Location selection of city logistics centers under sustainability. Transportation Research Part D. 2015, 36, 29–44. [Google Scholar] [CrossRef]
- Raimbekov, Z.; Syzdykbayeva, B.; Mussina, K.; Dulatbekova, Z.; Sadykov, B. The impact of international transport corridors on the economic development of regions (on the example of the Kazakhstani railway corridor). Int. J. Econ. Policy Emerg. Econ. 2022, 15, 46–69. [Google Scholar] [CrossRef]
Figure 1.
Scheme of the model of transport and logistics infrastructure of the city.
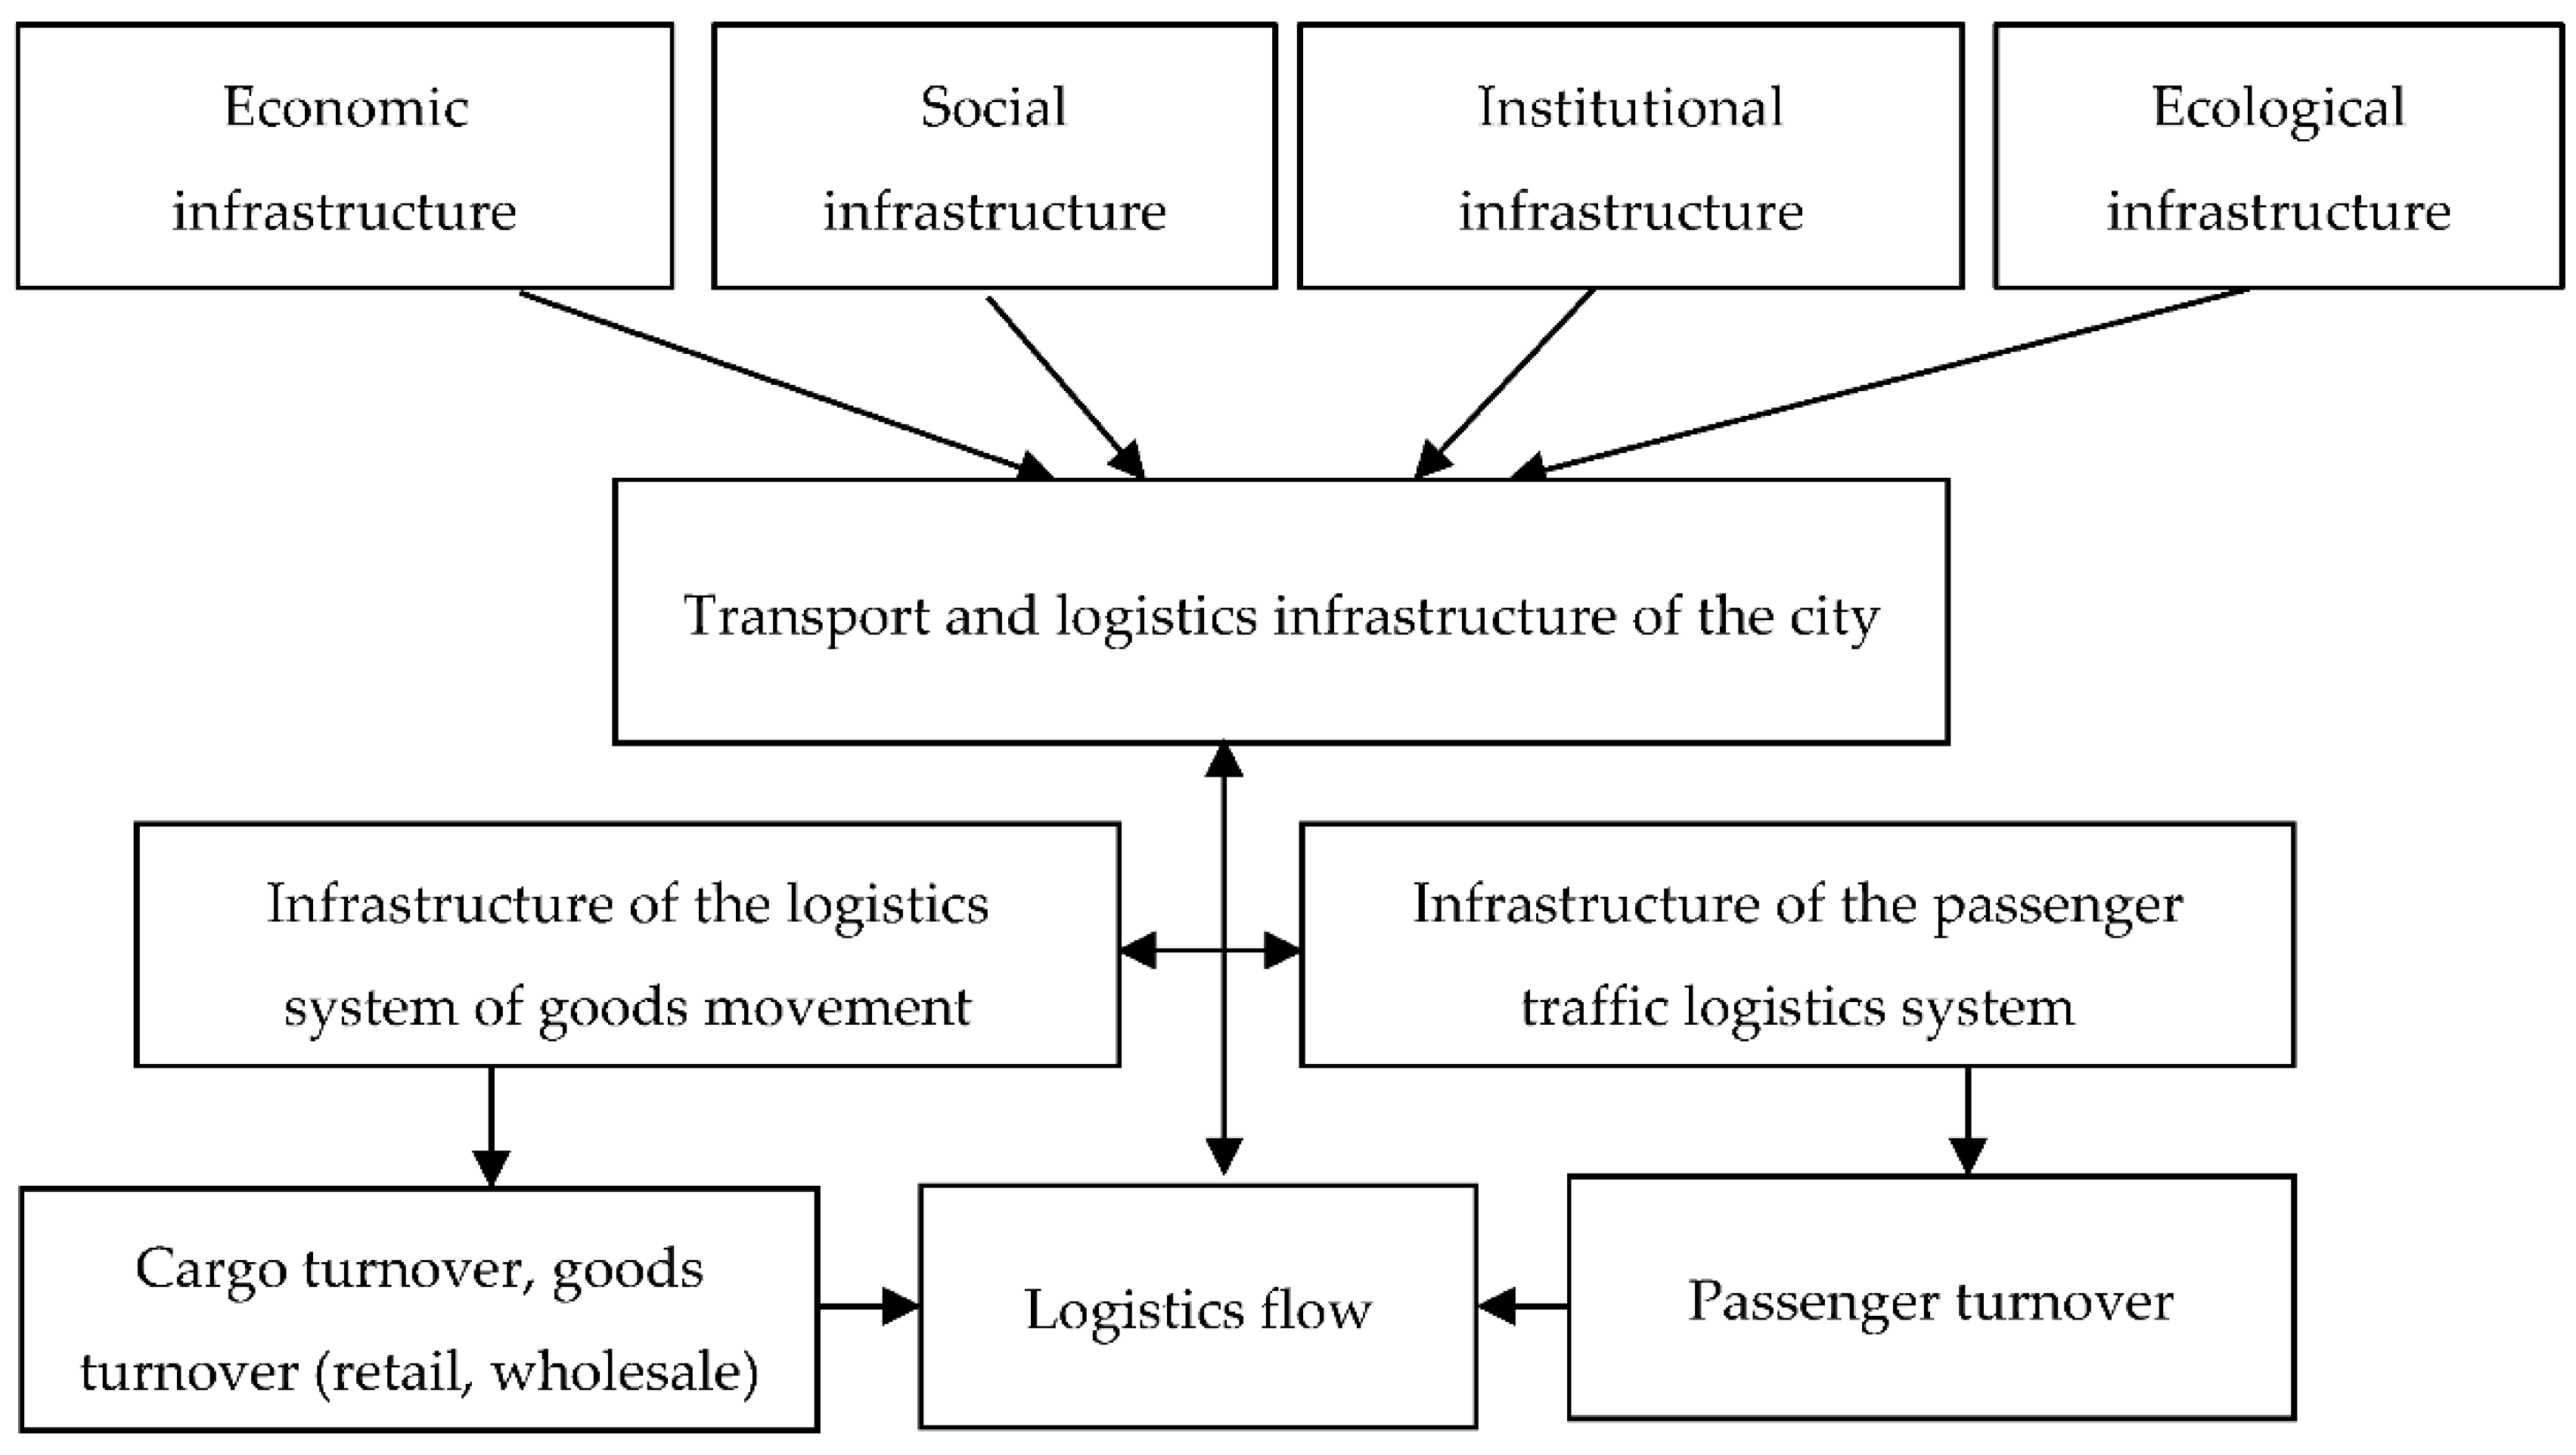
Figure 2.
Division of the urban area into meso-districts (using the city of Astana as an example).
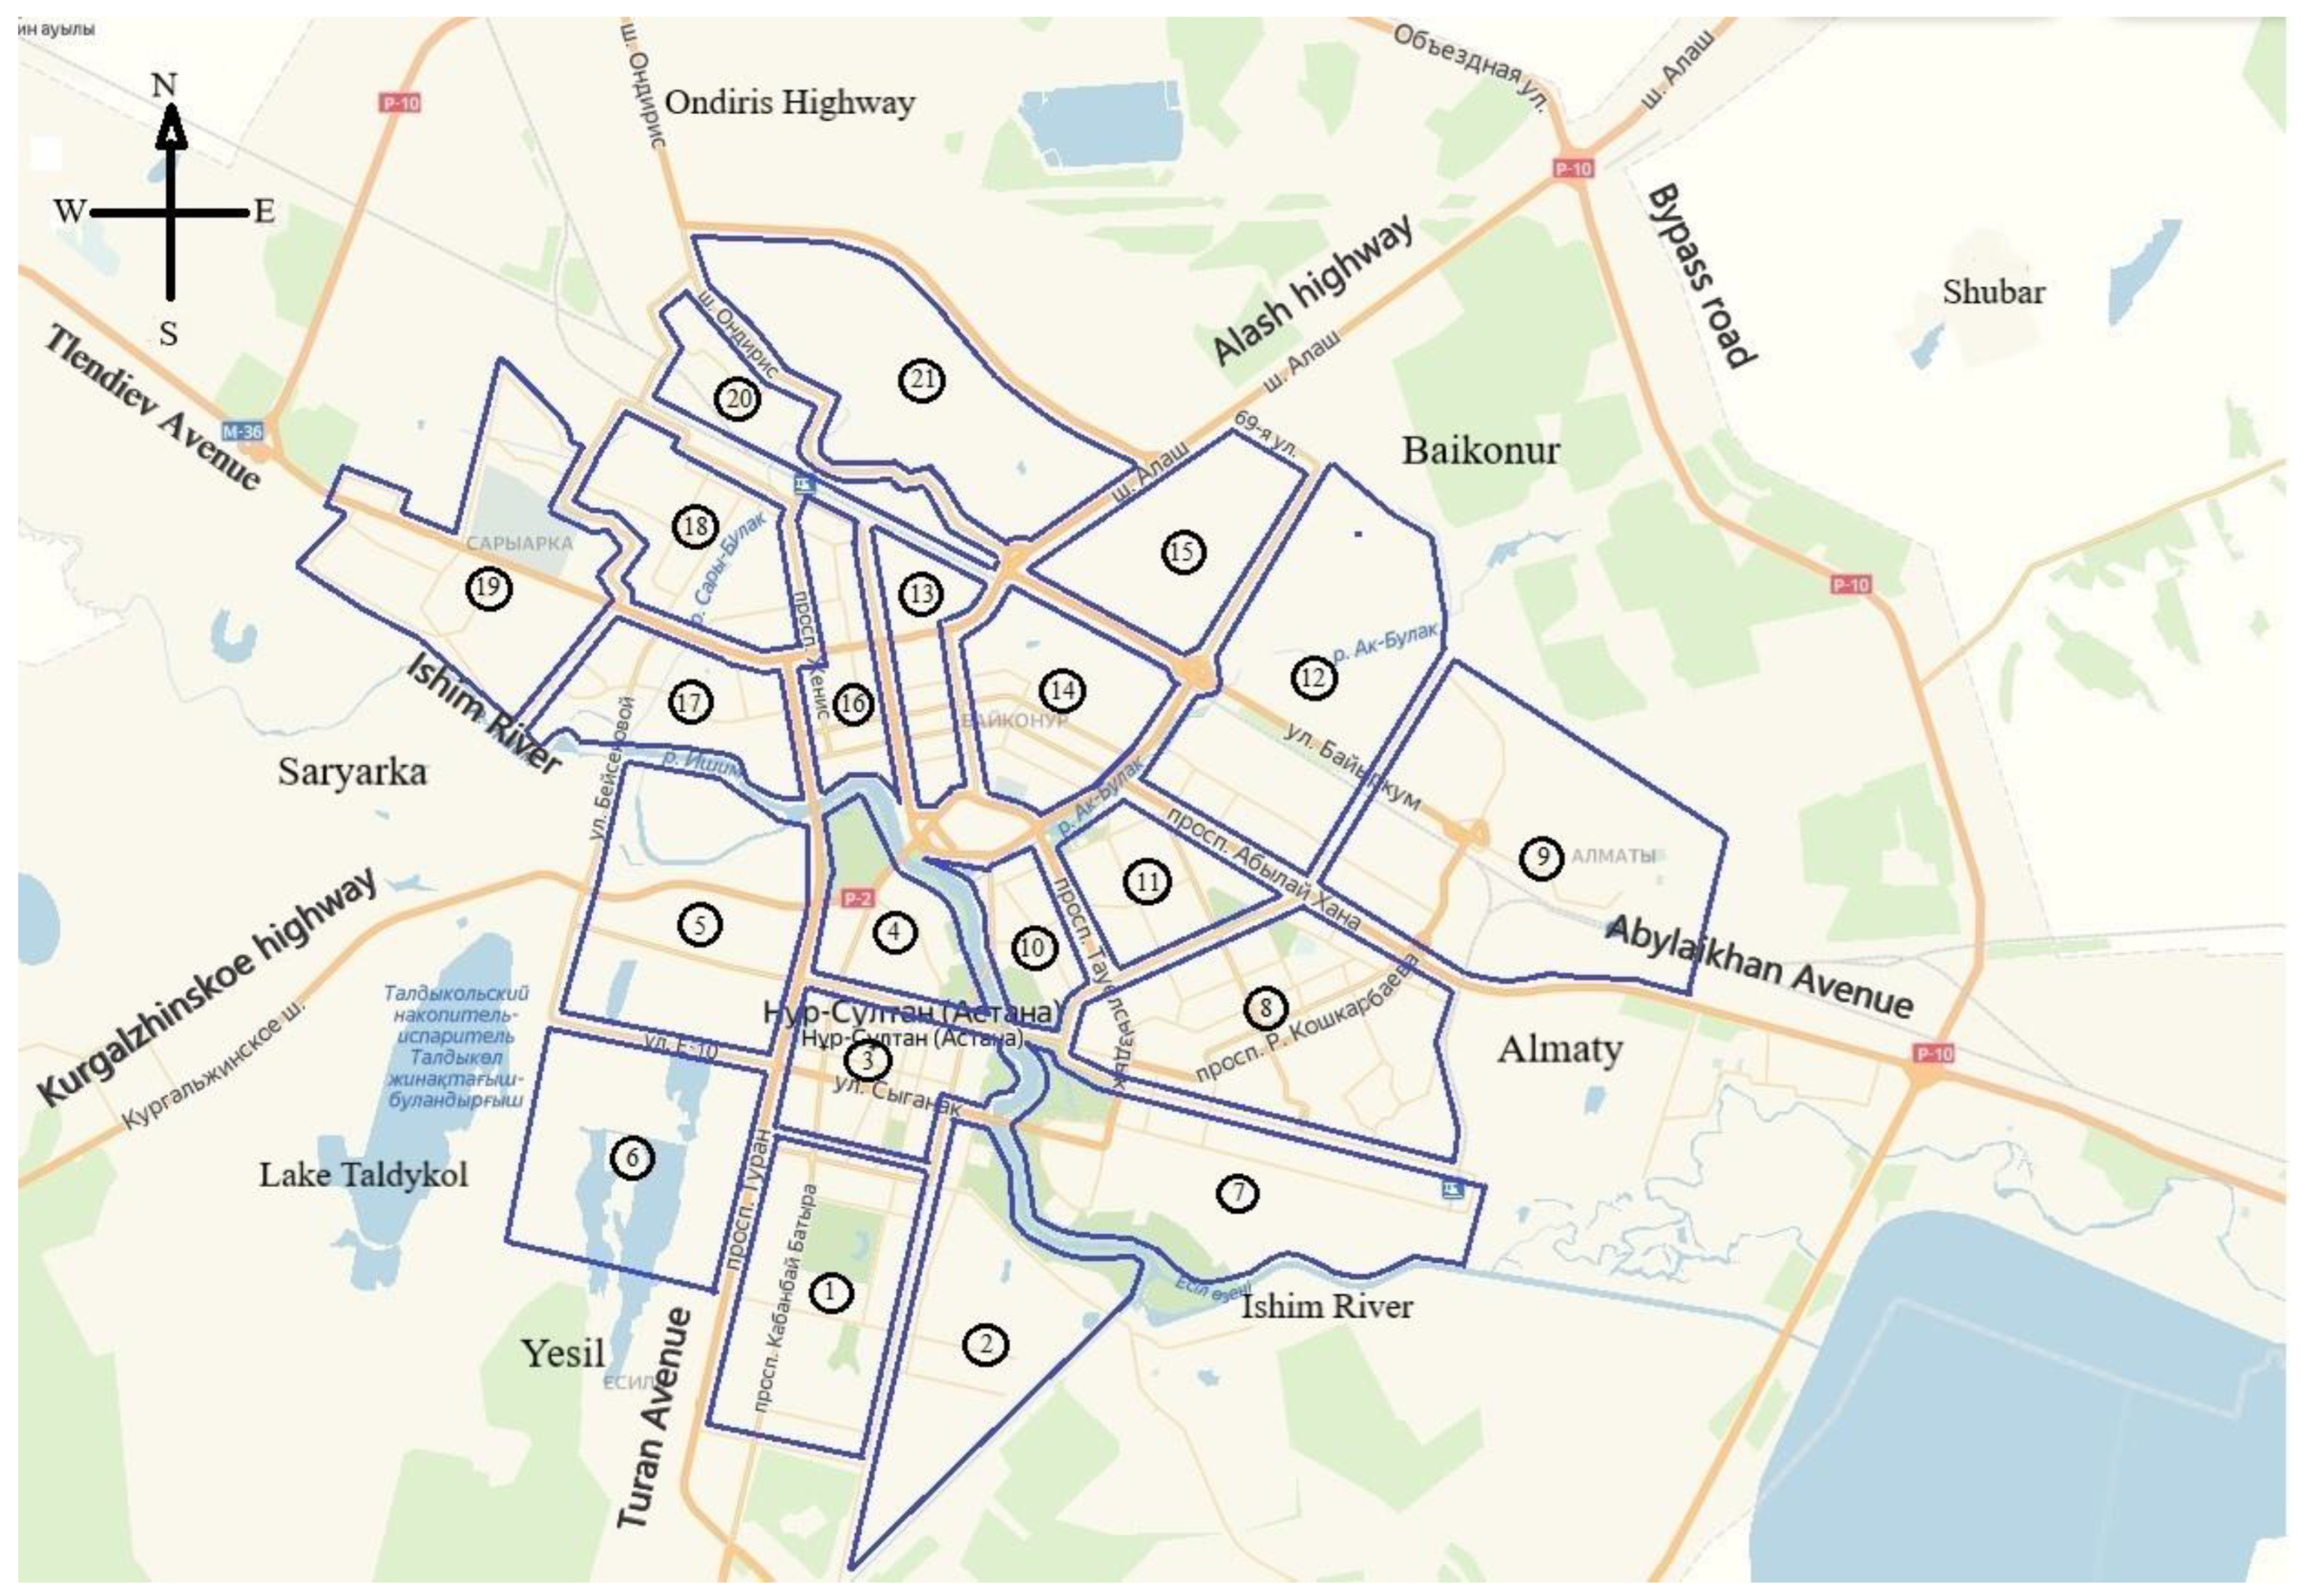
Figure 3.
The adjacency structure of graph G of the core of a city model (using the city of Astana as an example).
Figure 3.
The adjacency structure of graph G of the core of a city model (using the city of Astana as an example).
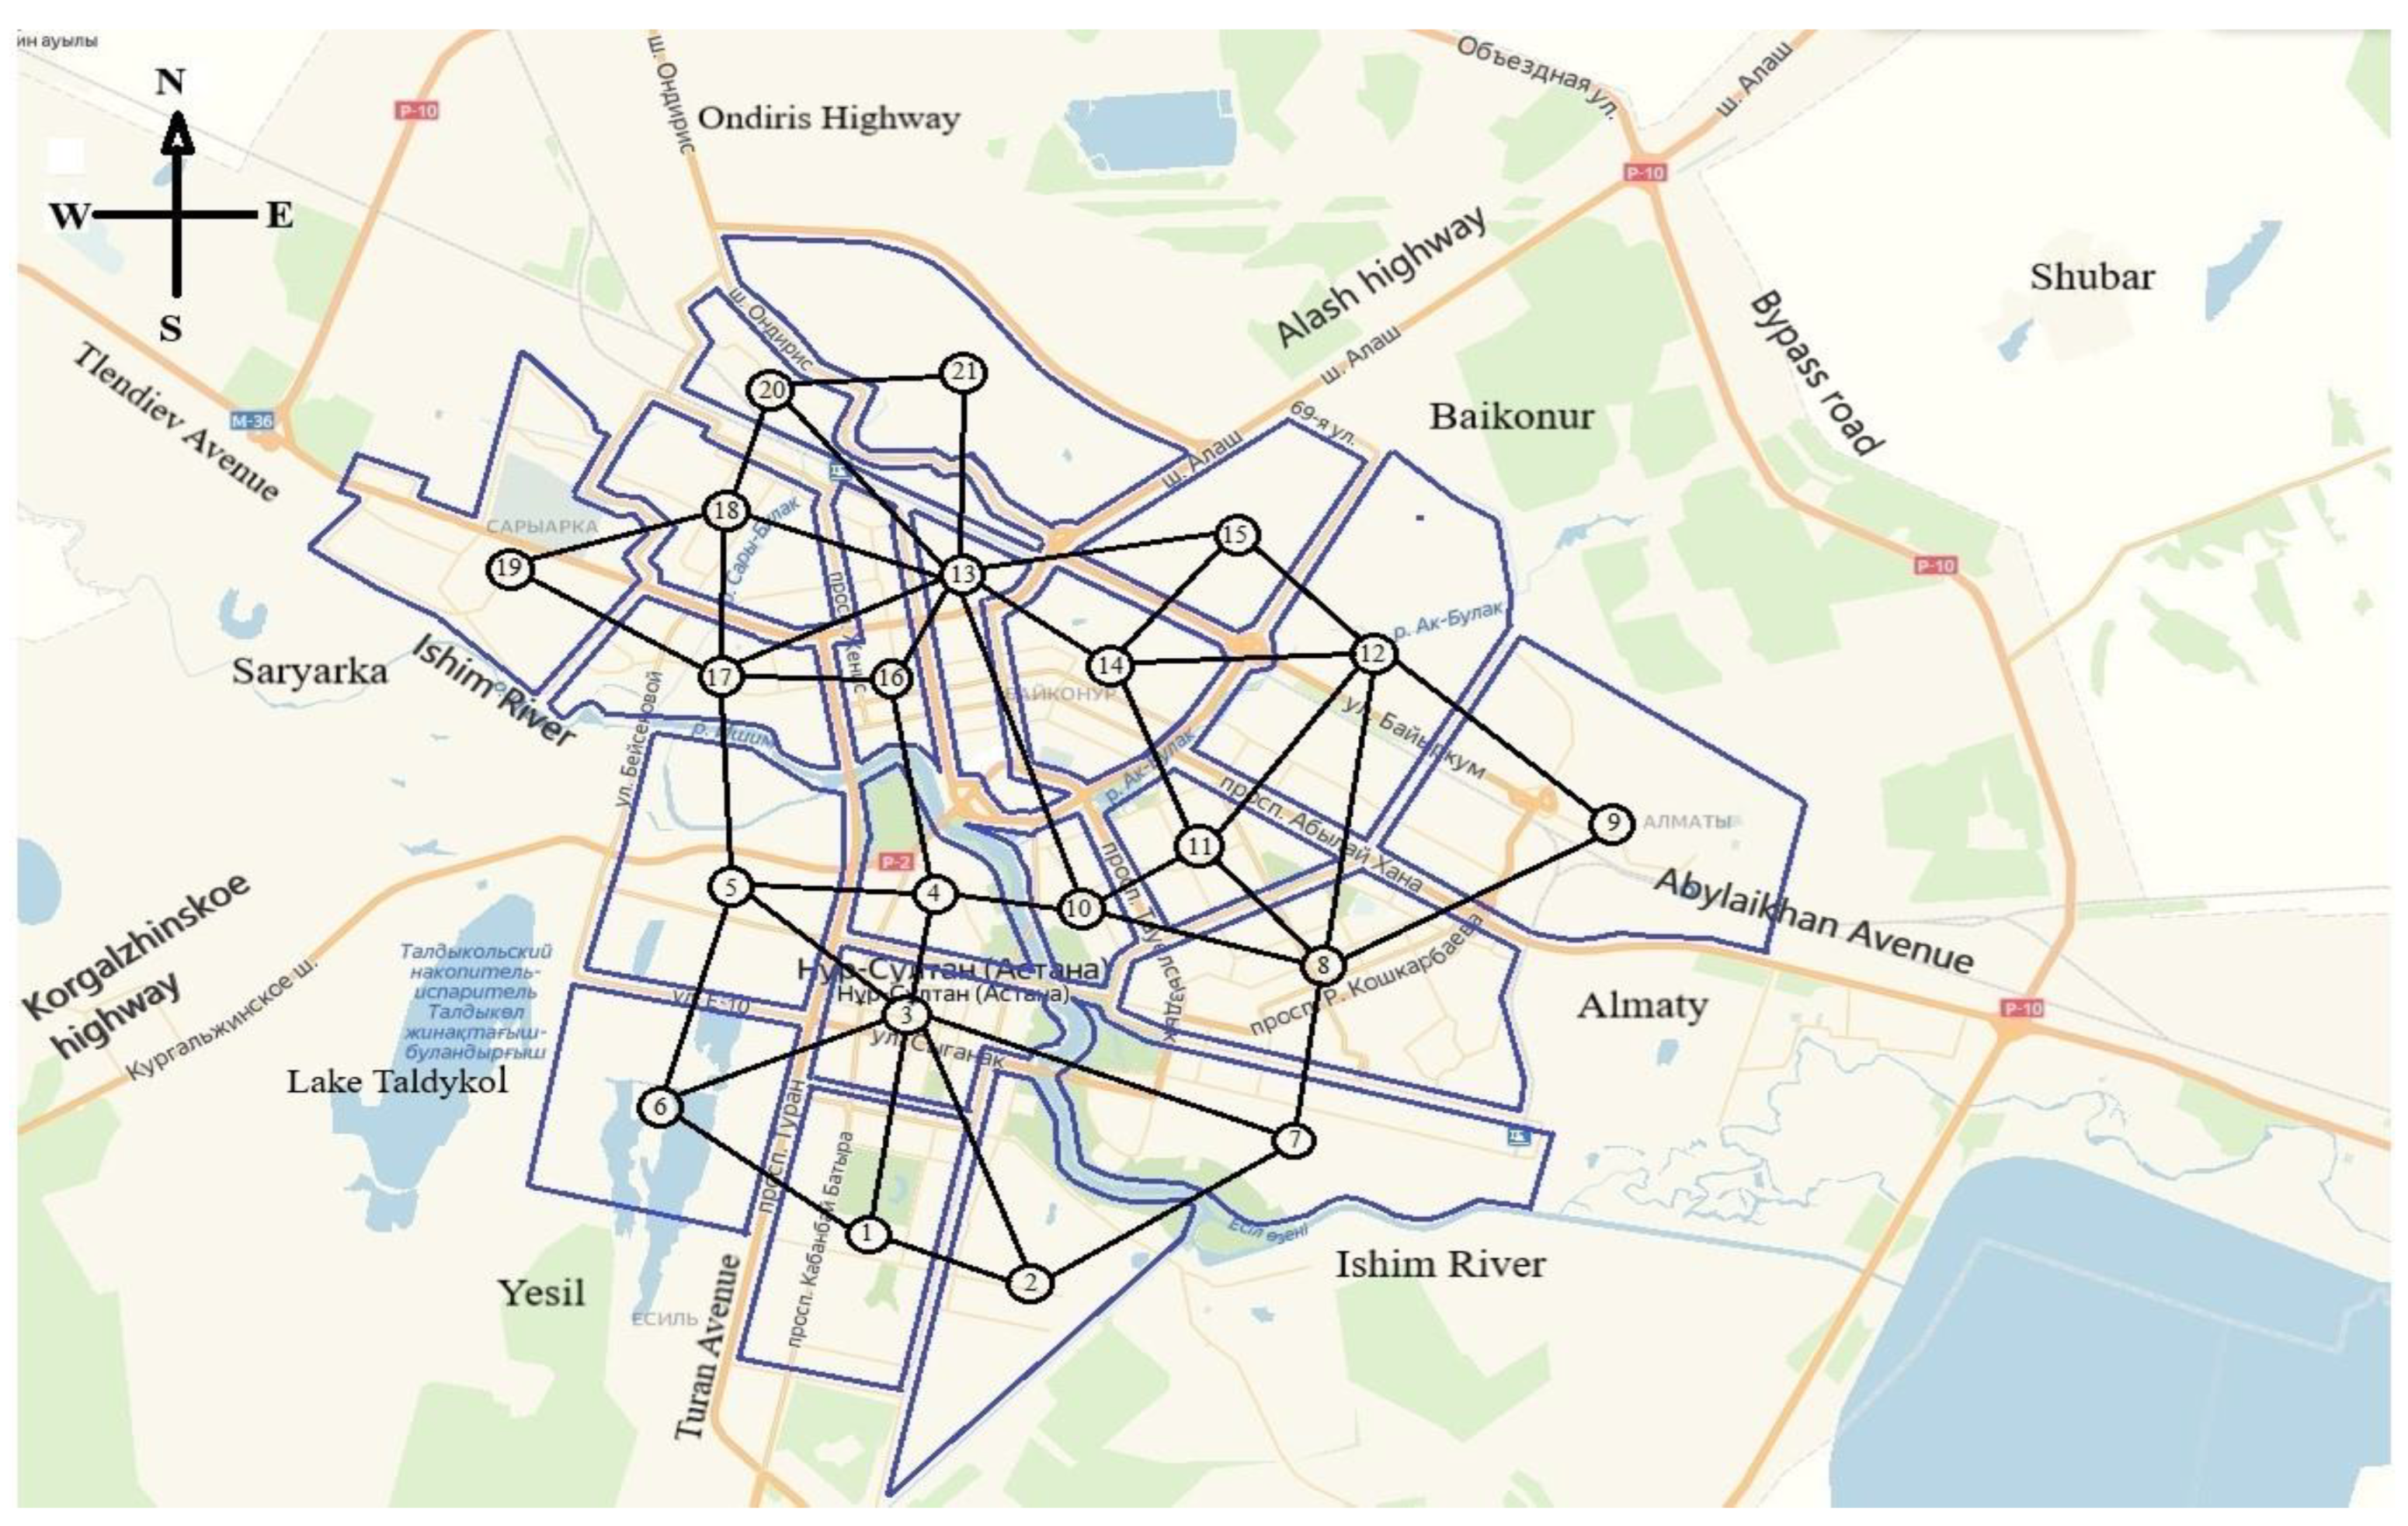
Figure 4.
Capacity of the road transport network and average polarity of the meso-districts of Astana.
Figure 4.
Capacity of the road transport network and average polarity of the meso-districts of Astana.
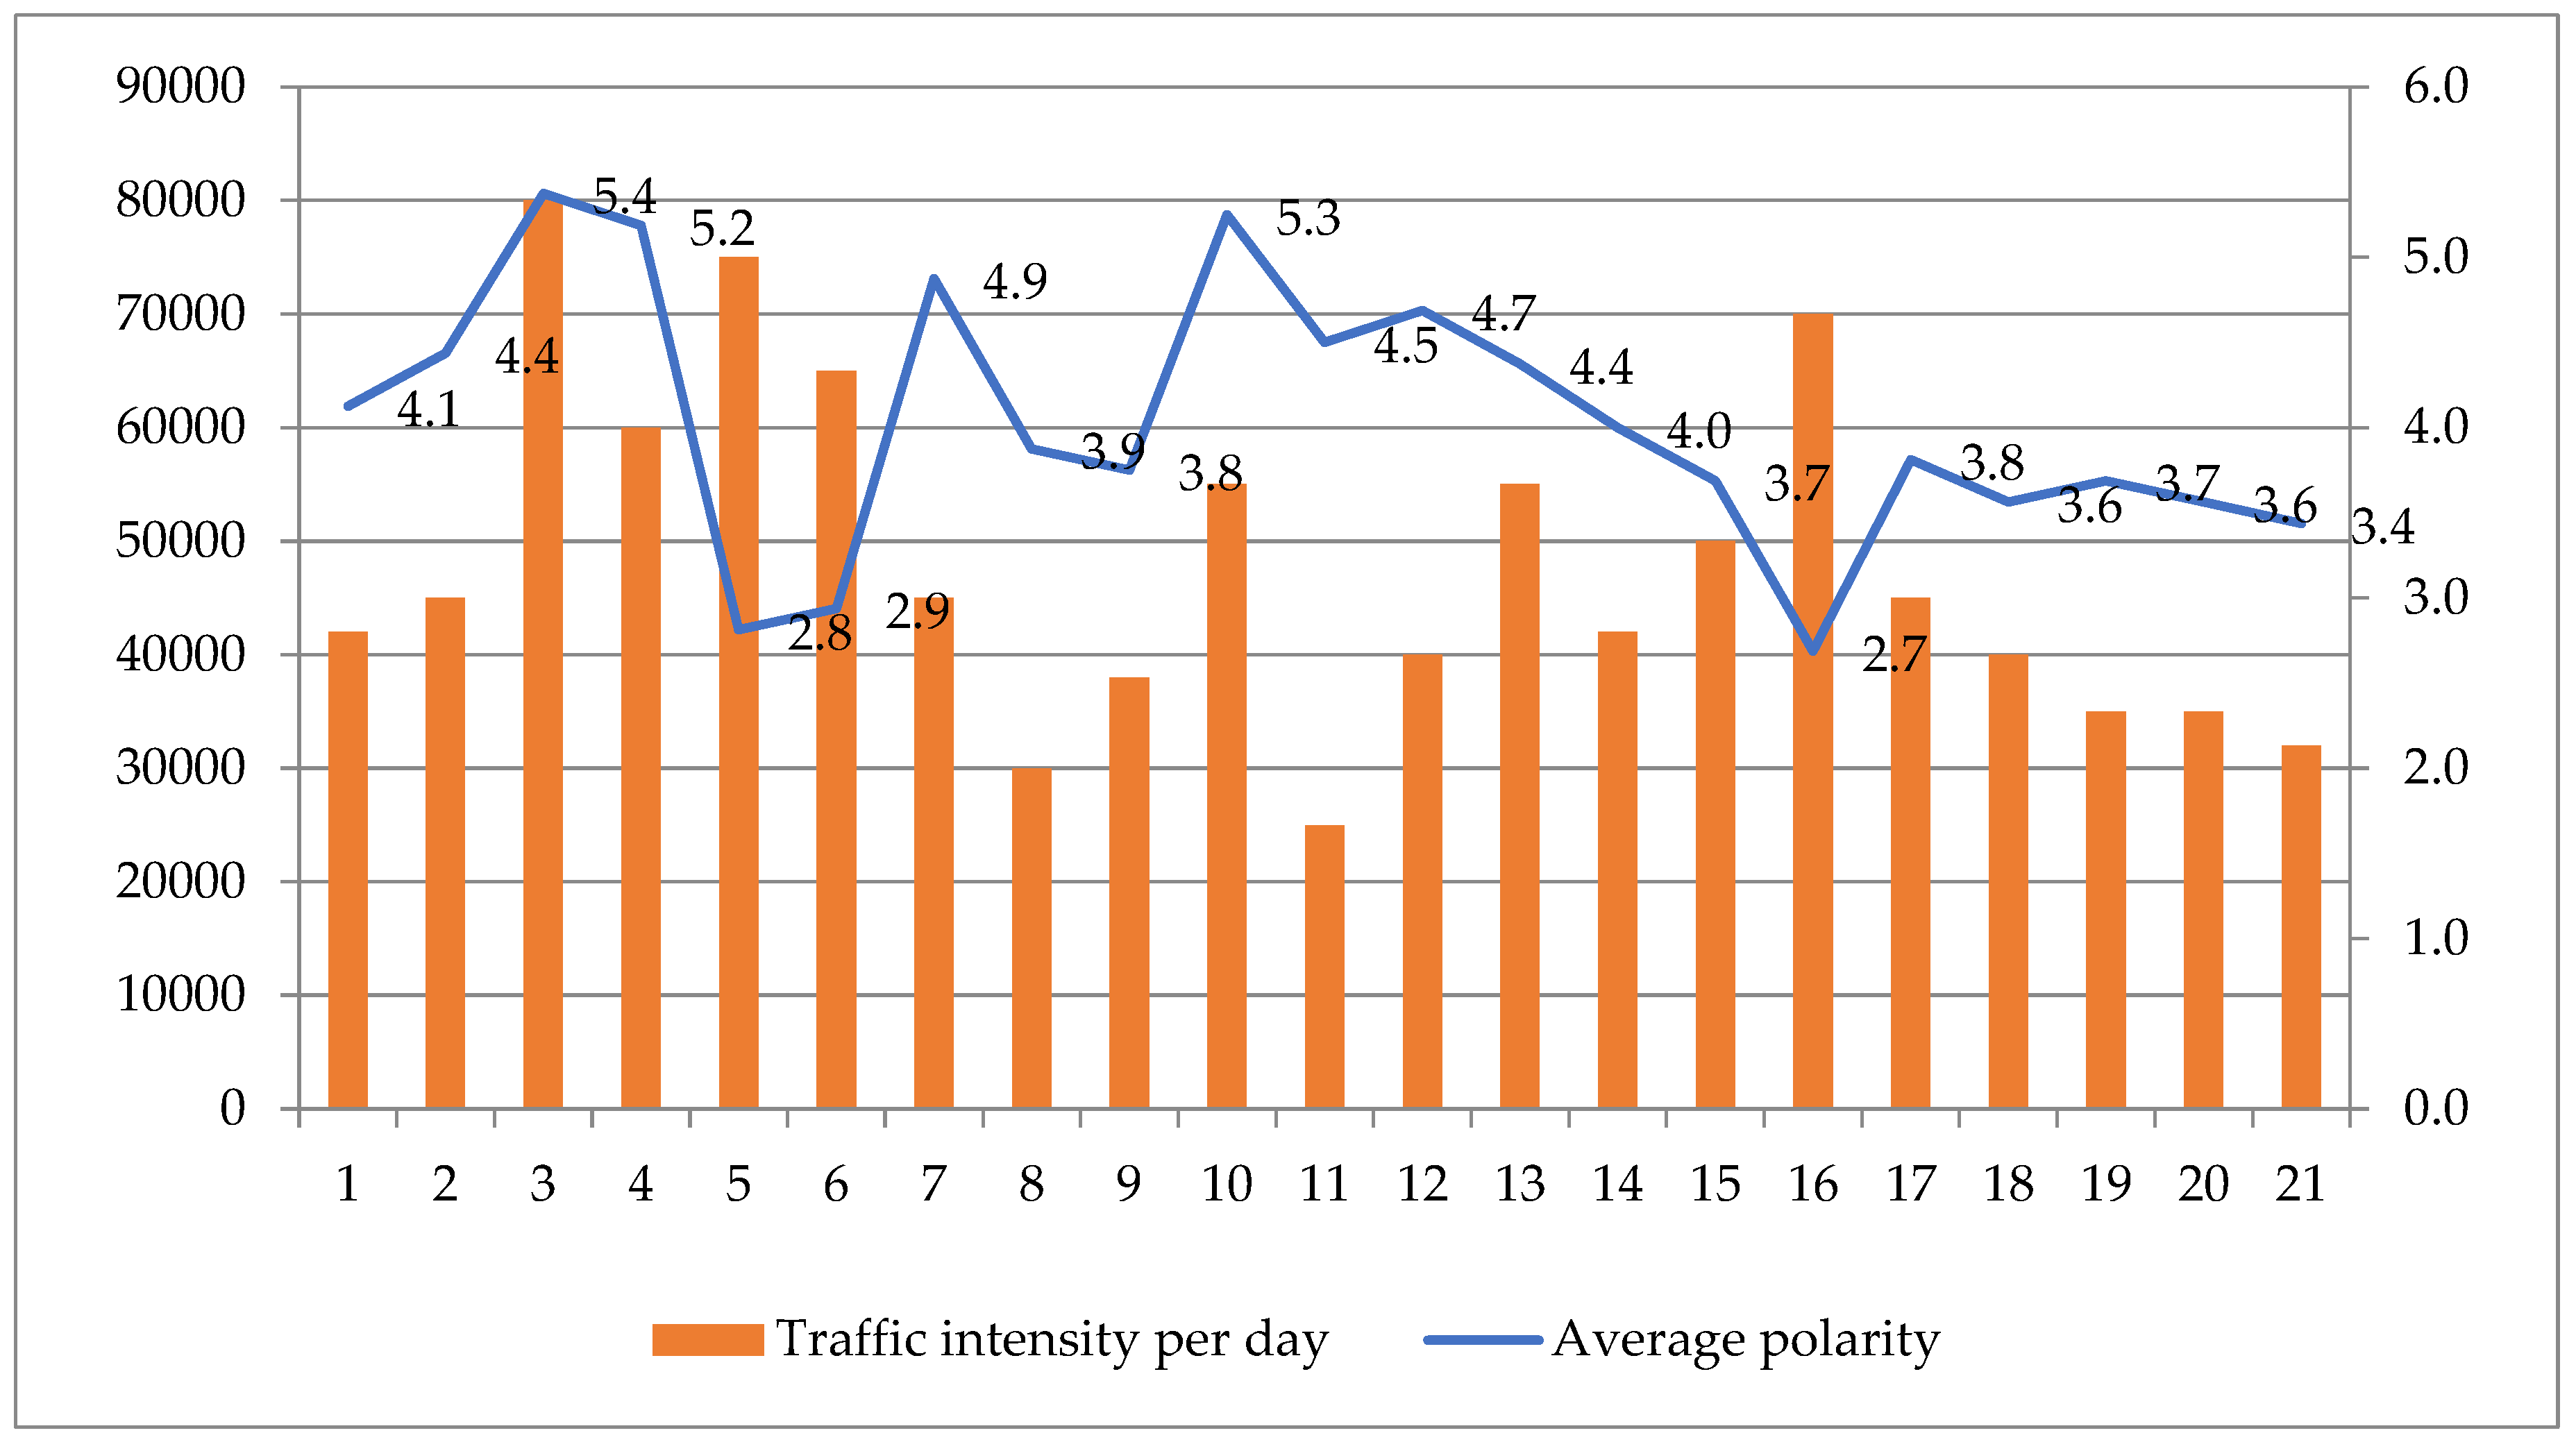
Figure 5.
Layout of economic, social, institutional and environmental infrastructure facilities, where A is the area of the historical center of Astana, B and C are the area of the old and new railway stations, D is the area of the airport. Note: WRTN - wholesale and retail trade network; CDC - consolidated distribution center; WM - wholesale markets; CFM - central food market; CMVF - central market vegetables and fruit; TC and LC - transport companies and logistics centers.
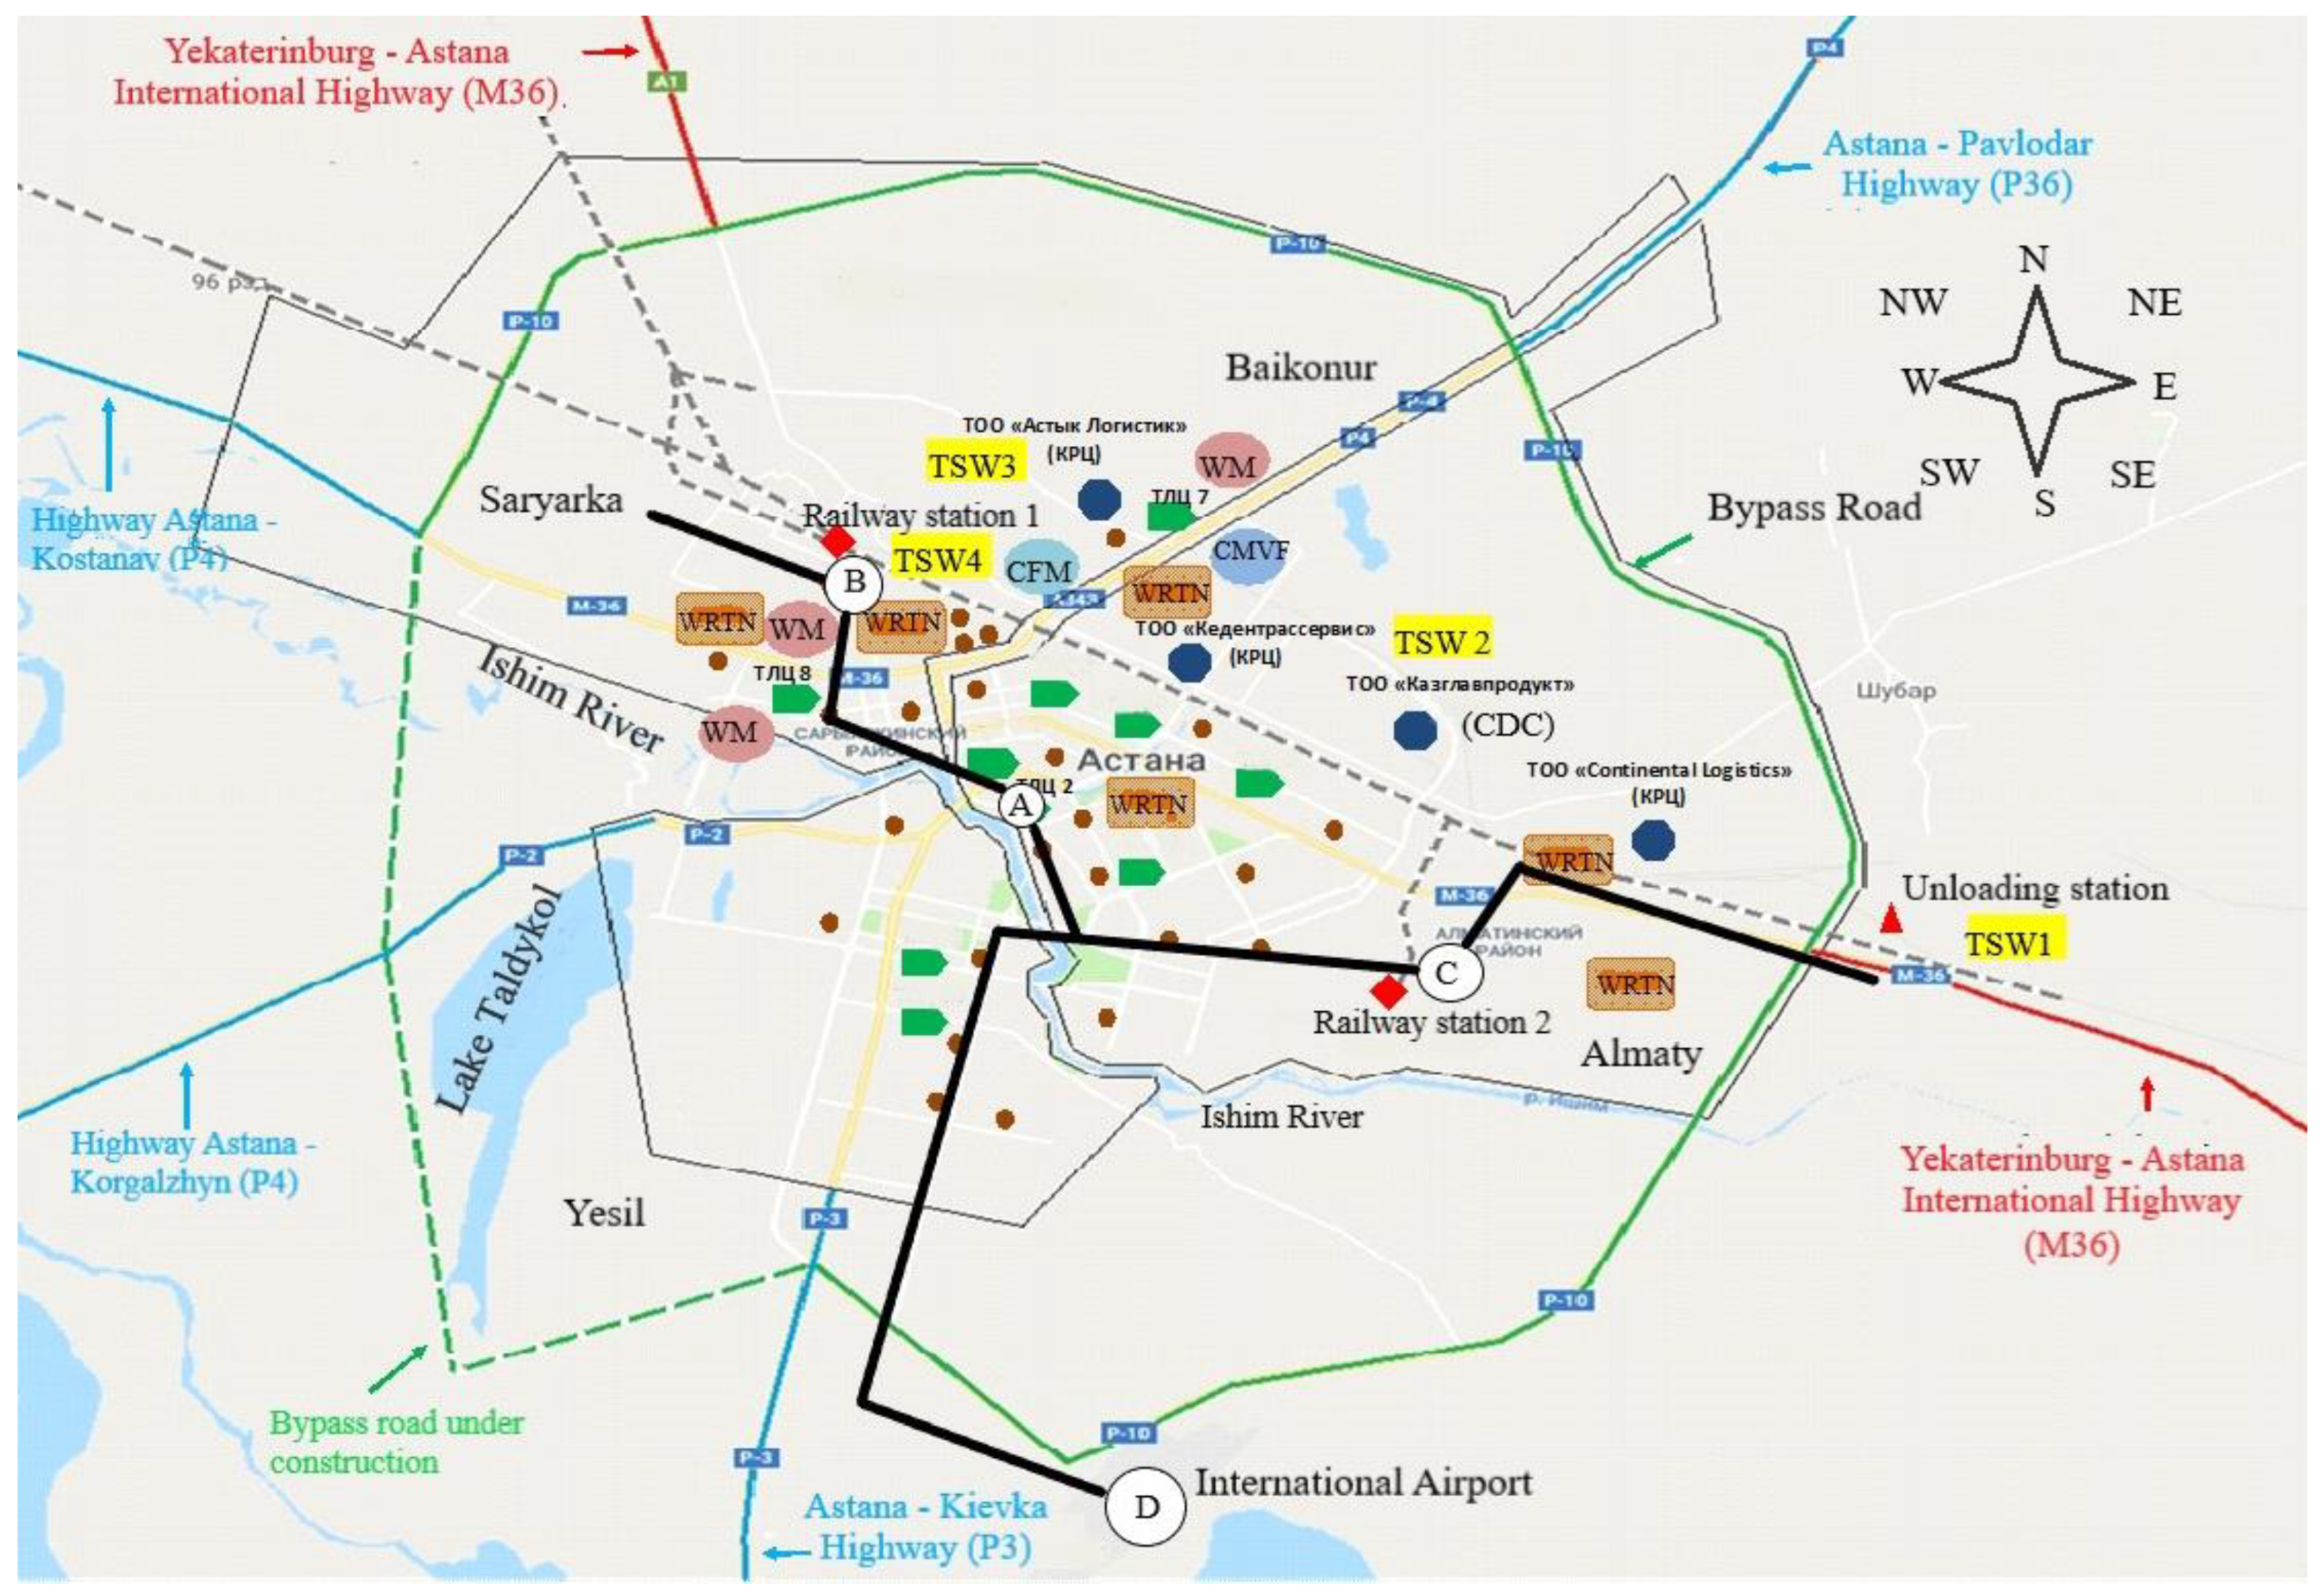
Figure 6.
Average daily speed of motor vehicles in the city core by map https://yandex.kz/maps/:. V - average daily speed of movement of vehicles; - meso-districts with a high level of traffic congestion during rush hours (8.45-9.45; 12.40-13.45; 17.30-18.30 hours).
Figure 6.
Average daily speed of motor vehicles in the city core by map https://yandex.kz/maps/:. V - average daily speed of movement of vehicles; - meso-districts with a high level of traffic congestion during rush hours (8.45-9.45; 12.40-13.45; 17.30-18.30 hours).
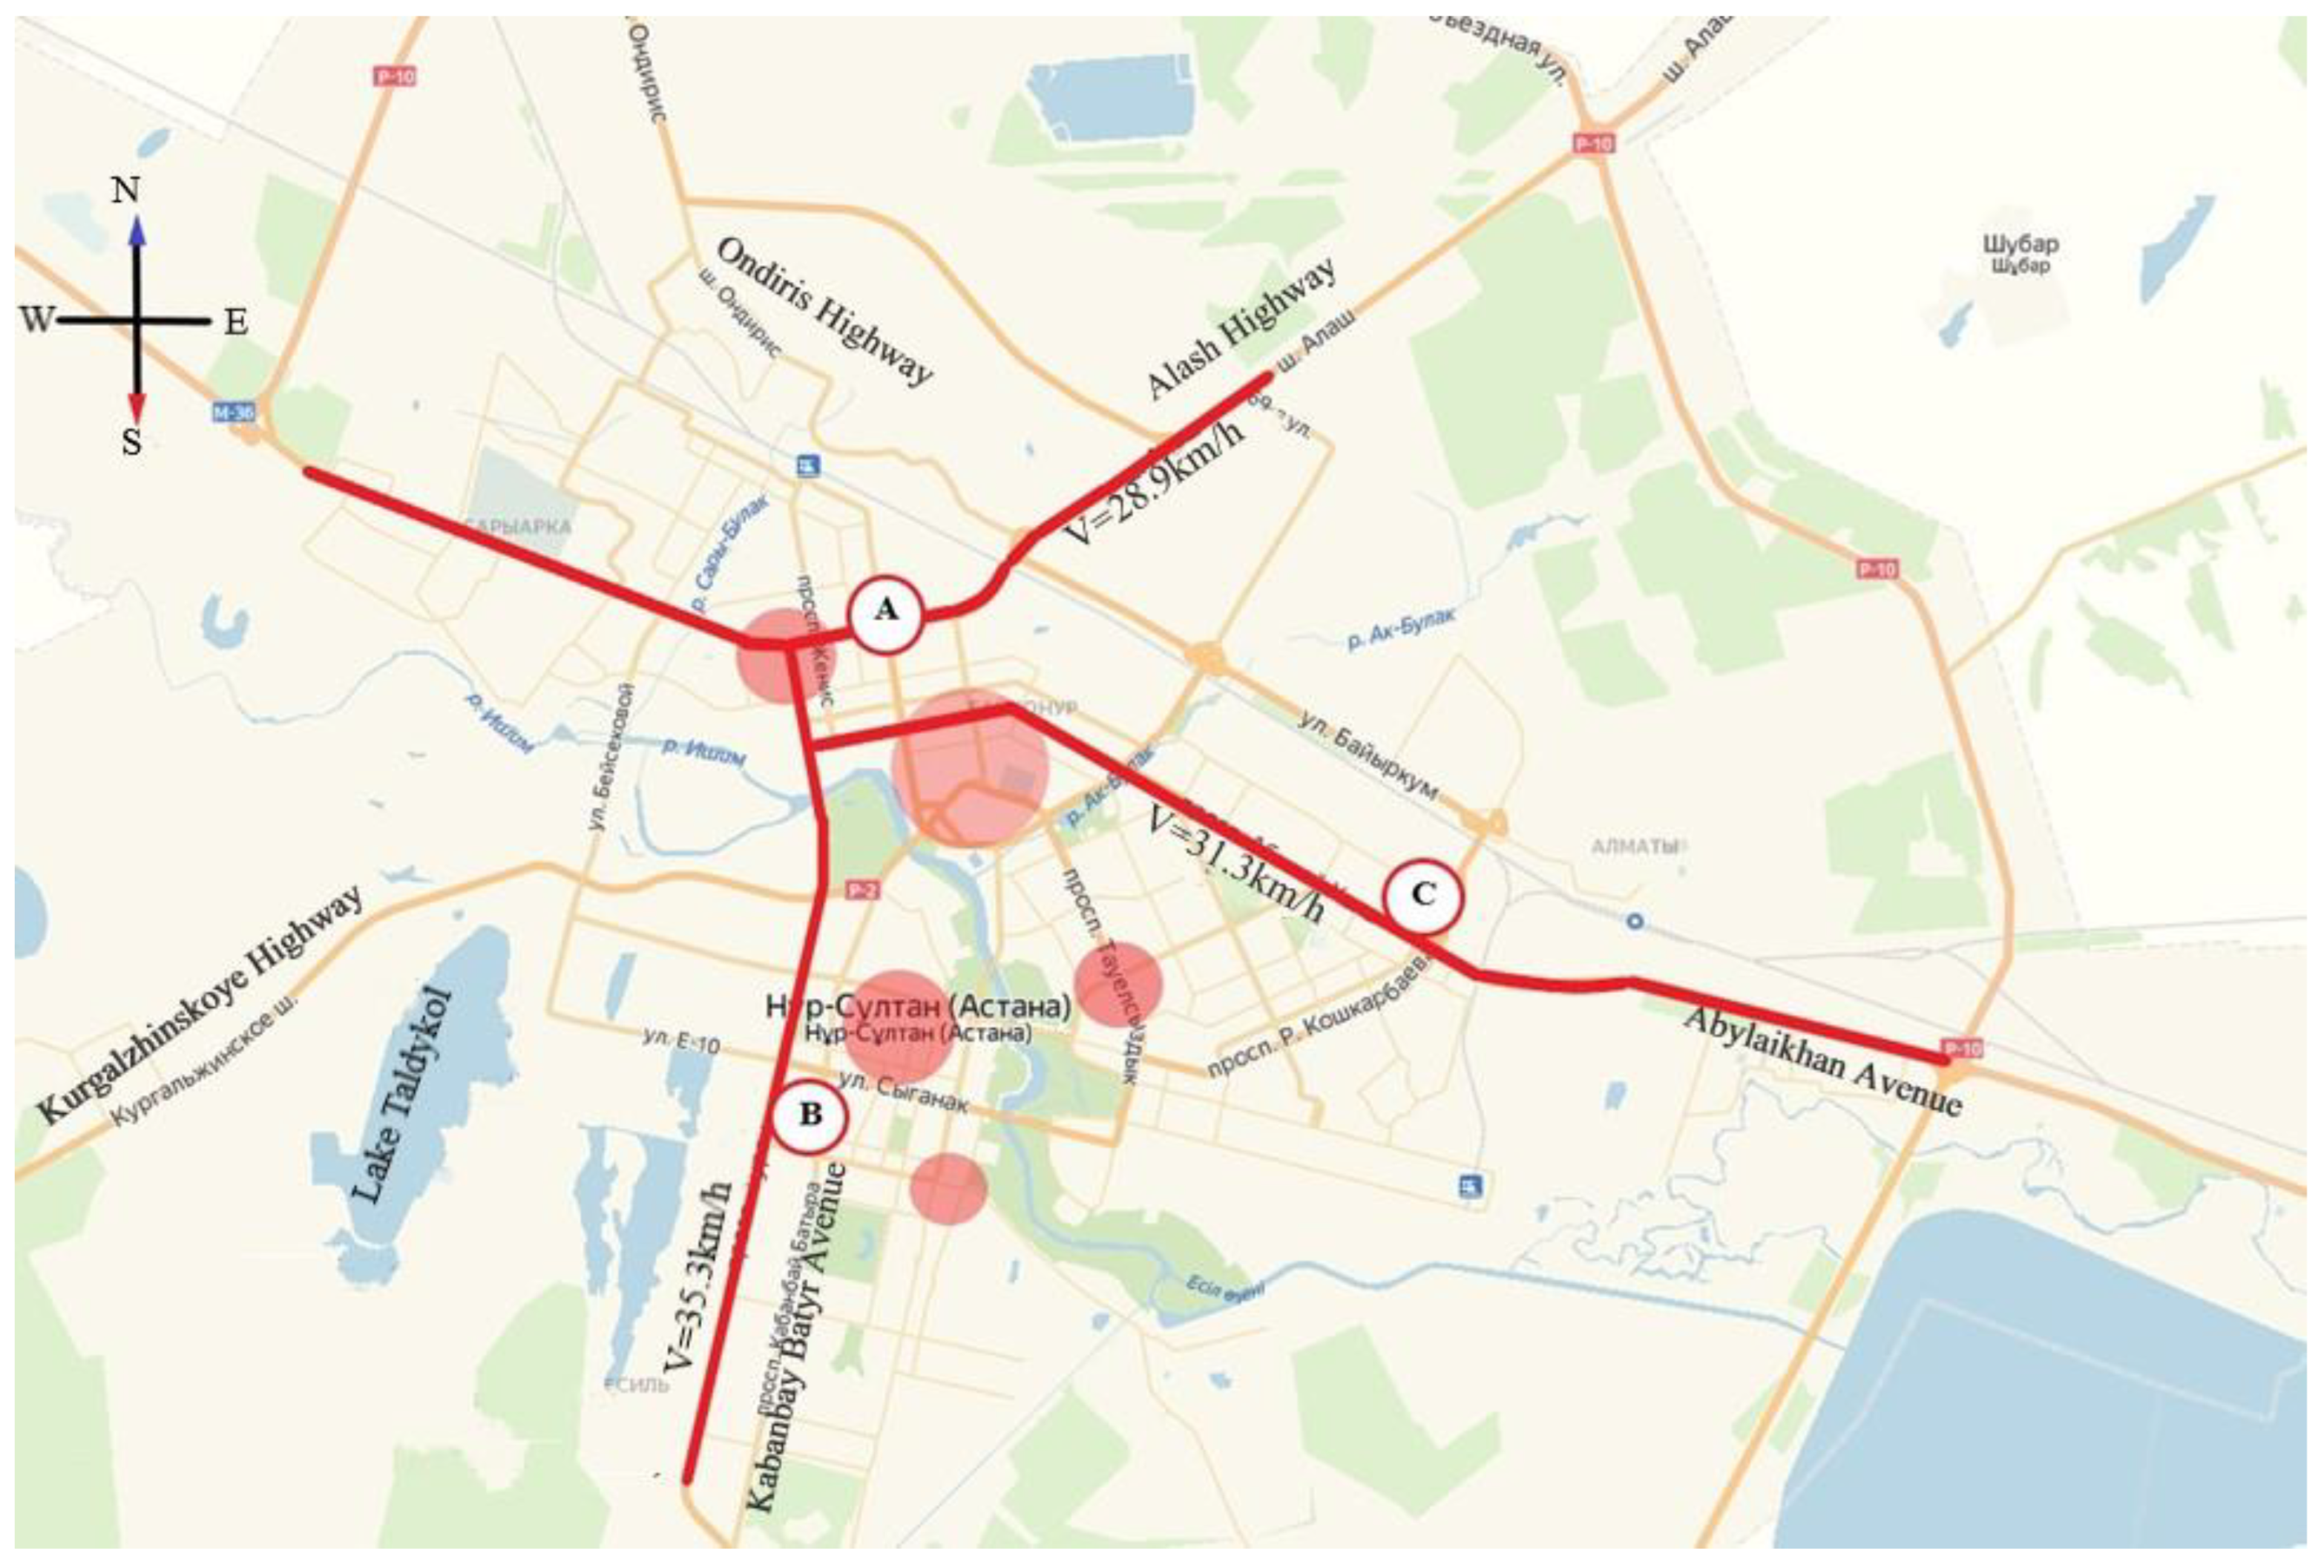
Table 1.
Descriptive characteristics of the polarity indices of the meso-regions of the core of Astana.
Table 1.
Descriptive characteristics of the polarity indices of the meso-regions of the core of Astana.
| №Pole number in order | Distribution of NBIO | AVP | SE | max | min | SD | SL | |||
| E | S | I | ECO | |||||||
| 1 | 6 | 2 | 4 | 1 | 4.13 | 0.40 | 6 | 1 | 1.59 | 0.74 |
| 2 | 5 | 2 | 1 | 1 | 4.44 | 0.35 | 6 | 1 | 1.41 | 0.55 |
| 3 | 15 | 8 | 4 | 3 | 5.38 | 0.31 | 6 | 2 | 1.26 | 0.57 |
| 4 | 17 | 7 | 5 | 4 | 5.19 | 0.39 | 6 | 1 | 1.56 | 0.63 |
| 5 | 7 | 4 | 3 | 1 | 2.81 | 0.23 | 4 | 1 | 0.91 | 0.48 |
| 6 | 6 | 2 | 2 | 2 | 2.94 | 0.19 | 4 | 1 | 0.77 | 0.41 |
| 7 | 10 | 3 | 3 | 2 | 4.88 | 0.24 | 6 | 3 | 0.96 | 0.51 |
| 8 | 7 | 6 | 2 | 2 | 3.88 | 0.26 | 6 | 1 | 1.02 | 0.54 |
| 9 | 5 | 3 | 1 | 2 | 3.75 | 0.23 | 5 | 1 | 0.93 | 0.49 |
| 10 | 16 | 12 | 6 | 4 | 5.25 | 0.21 | 6 | 4 | 0.86 | 0.45 |
| 11 | 12 | 4 | 2 | 2 | 4.50 | 0.26 | 6 | 2 | 1.03 | 0.55 |
| 12 | 13 | 5 | 3 | 1 | 4.69 | 0.35 | 6 | 1 | 1.40 | 0.44 |
| 13 | 11 | 7 | 4 | 3 | 4.38 | 0.26 | 5 | 1 | 1.02 | 0.54 |
| 14 | 15 | 7 | 3 | 2 | 4.00 | 0.22 | 5 | 1 | 0.89 | 0.47 |
| 15 | 13 | 3 | 1 | 2 | 3.69 | 0.28 | 6 | 1 | 1.14 | 0.50 |
| 16 | 7 | 5 | 2 | 1 | 2.69 | 0.12 | 3 | 2 | 0.48 | 0.25 |
| 17 | 9 | 3 | 1 | 1 | 3.81 | 0.23 | 5 | 1 | 0.91 | 0.48 |
| 18 | 6 | 5 | 3 | 2 | 3.56 | 0.20 | 4 | 1 | 0.81 | 0.43 |
| 19 | 7 | 4 | 3 | 4 | 3.69 | 0.25 | 6 | 1 | 1.01 | 0.54 |
| 20 | 5 | 2 | 1 | 1 | 3.56 | 0.29 | 5 | 1 | 1.15 | 0.61 |
| 21 | 4 | 2 | 2 | 1 | 3.44 | 0.27 | 6 | 1 | 1.09 | 0.58 |
| 9.3 | 4.6 | 2.7 | 2 | 4.03 | ||||||
Note: 1) NBIO - the number of basic infrastructure objects (E-economic, S-social, I-institutional, ECO-ecological); AVP - average value of polarity (mean); SE - standard error; SD - standard deviation (std.Dev); SL - significance level ( SL ) at p ≤ 0.05%. 2) where: 1 - polarity of meso-districts in relation to each other, 2 - polarity of credit and financial institutions, 3 - polarity of administrative institutions, 4 - polarity of security service facilities, 5 - polarity of children's educational institutions, 6 - polarity of public utilities facilities, 7 - polarity of healthcare facilities, 8 - polarity of social service facilities, 9 - polarity of pre-school educational institutions, 10 - polarity of cultural and educational institutions, 11 - polarity of sports facilities, 12 - polarity of recreational facilities not related to the previous categories, 13 - polarity of industrial enterprises, 14-17 - polarity of commercial and trade facilities (shopping and entertainment complexes, shopping centers, wholesale bases, business centers).
Table 2.
Logistics flow of the city of Astana.
| No. meso- districts |
VIP | VSGS | VIPn | NBE | TBG | NP | VSR | AAP | NSCF | NSPA | LR |
|---|---|---|---|---|---|---|---|---|---|---|---|
| 1. Yesil district | |||||||||||
| 1 | 2.24 | 555.8 | 59.0 | 10.8 | 1190.2 | 19.5 | 178.4 | 42.5 | 19.7 | 16.2 | 26.0 |
| 2 | 2.15 | 432.3 | 56.4 | 8.4 | 1138.4 | 18.2 | 171.0 | 58.0 | 26.9 | 22.1 | 31.4 |
| 3 | 2.05 | 277.9 | 53.8 | 5.4 | 1086.7 | 23.5 | 163.2 | 50.3 | 23.3 | 19.2 | 20.5 |
| 4 | 1.95 | 154.4 | 51.3 | 3.0 | 1034.9 | 25.4 | 155.4 | 65.7 | 30.4 | 25.1 | 6.8 |
| 5 | 0.48 | 463.1 | 12.8 | 9.0 | 258.7 | 24.1 | 39.1 | 58.0 | 26.9 | 22.1 | 5.5 |
| 6 | 0.58 | 555.8 | 15.4 | 10.8 | 310.5 | 13.5 | 46.8 | 65.7 | 30.4 | 25.1 | 4.1 |
| 7 | 0.36 | 648.4 | 7.7 | 12.5 | 155.2 | 17.5 | 23.6 | 46.4 | 21.5 | 17.7 | 42.3 |
| Total of 1 | 9.80 | 3087,5 | 256.4 | 59.7 | 5174.6 | 141.7 | 777,5 | 386.6 | 179.0 | 147.4 | 136.6 |
| Share by 1, % | 29.6 | 38.4 | 13.0 | 28.6 | 3.3 | 29.0 | 35.0 | 29.2 | 27.7 | 0.4 | 58.6 |
| 2. Almaty district | |||||||||||
| 8 | 0.44 | 450.3 | 143.2 | 21.2 | 26490,3 | 21.3 | 92.9 | 75.5 | 29.8 | 10.3 | 4.1 |
| 9 | 0.42 | 492.5 | 136.7 | 23.2 | 25286.2 | 23.3 | 88.7 | 57.6 | 22.7 | 7.9 | 3.3 |
| 10 | 0.40 | 98.5 | 130.2 | 4.6 | 24082,1 | 31.3 | 84.5 | 86.3 | 34.1 | 11.8 | 2.1 |
| 11 | 0.36 | 126.6 | 117.2 | 6.0 | 21673.9 | 25.8 | 76.0 | 75.5 | 29.8 | 10.3 | 2.4 |
| 12 | 0.38 | 239.2 | 123.7 | 11.3 | 22878,0 | 20.5 | 80.3 | 64.8 | 25.6 | 8.8 | 5.3 |
| Total of 2 | 2.02 | 1407.1 | 650.9 | 66.3 | 120410,6 | 122.2 | 422.1 | 359.7 | 142.0 | 49.1 | 17.2 |
| Share by 2, % | 6.1 | 17.5 | 33.0 | 31.7 | 77.7 | 25.0 | 19.0 | 27.1 | 22.0 | 14.0 | 7.4 |
| 3. Saryarka district | |||||||||||
| 13 | 8.08 | 183.2 | 125.3 | 8.3 | 9863.8 | 21.2 | 124.4 | 51.6 | 24.6 | 16.3 | 1.4 |
| 16 | 8.51 | 140.1 | 135.5 | 6.4 | 10663,6 | 15.5 | 134.5 | 51.6 | 24.6 | 16.3 | 2.1 |
| 17 | 1.49 | 161.6 | 23.7 | 7.3 | 1866.1 | 27.9 | 23.7 | 62.0 | 29.5 | 19.6 | 3.5 |
| 18 | 2.13 | 258.6 | 33.9 | 11.7 | 2665.9 | 13.7 | 33.7 | 82.6 | 39.4 | 26.1 | 4.4 |
| 19 | 1.06 | 334.0 | 16.9 | 15.2 | 1332.9 | 14.5 | 16.9 | 96.4 | 45.9 | 30.5 | 11.8 |
| Total of 3 | 21.27 | 1077.4 | 335.3 | 48.9 | 26392,3 | 92.8 | 333.2 | 344.2 | 164.0 | 108.8 | 23.1 |
| Share by 3, % | 64.3 | 13.4 | 17.0 | 23.4 | 17.0 | 19.0 | 15.0 | 26.0 | 25.4 | 0.3 | 9.9 |
| 4. Baikonur district | |||||||||||
| 14 | 0,00 | 296.2 | 277.3 | 4.1 | 1139.4 | 35.9 | 261.4 | 58.7 | 40.3 | 11.4 | 9.5 |
| 15 | 0,00 | 419.6 | 262.7 | 5.8 | 1079.4 | 31.2 | 247.7 | 49.3 | 33.8 | 9.6 | 14.0 |
| 20 | 0,00 | 715.8 | 109.5 | 9.9 | 449.8 | 35.2 | 103.5 | 54.0 | 37.0 | 10.5 | 9.5 |
| 21 | 0,00 | 1036.7 | 80.3 | 14.3 | 329.8 | 29.7 | 76.0 | 72.7 | 49.9 | 14.1 | 23.0 |
| Total of 4 | 0,00 | 2468.4 | 729.8 | 34.1 | 2998,4 | 132.0 | 688.7 | 234.6 | 161.0 | 45.6 | 56.2 |
| Share by 4, % | 0,00 | 30.7 | 37.0 | 16.3 | 1.9 | 27.0 | 31.0 | 17.7 | 24.9 | 0,1 | 24.1 |
| Total by p. 1-21 |
33.1 | 8040,5 | 1972,4 | 209.1 | 154975,9 | 488.7 | 2221.9 | 1325.1 | 646,0 | 351,0 | 233.1 |
| Average p.1-21 |
1.6 | 382.9 | 93.9 | 10.0 | 7379.8 | 23.3 | 105.8 | 63.1 | 30.8 | 16.7 | 11.1 |
| SD | 2,3 | 228.8 | 73.3 | 5.1 | 9763,5 | 6.6 | 68.5 | 13.7 | 7.8 | 6.4 | 11.0 |
| SE | 0.51 | 49.9 | 16.0 | 1,12 | 2130,5 | 1.44 | 14.9 | 3.0 | 1.71 | 1.40 | 2.40 |
| RL | 1.05 | 104.1 | 33.3 | 2,3 | 4444,3 | 3.0 | 31.2 | 6.2 | 3.5 | 2.9 | 5.0 |
Source: Data from the Bureau of National Statistics of the Republic of Kazakhstan. Note: 1) Meso-districts: Saryarka -13, 16, 17, 18, 19; Almaty – 8, 9, 10, 11, 12; Yesil – 1, 2, 3, 4, 5, 6, 7; Baikonur – 14, 15, 20, 21. 2) SD - standard deviation, SE - standard error, RL - reliability level at 95.0%.
Disclaimer/Publisher’s Note: The statements, opinions and data contained in all publications are solely those of the individual author(s) and contributor(s) and not of MDPI and/or the editor(s). MDPI and/or the editor(s) disclaim responsibility for any injury to people or property resulting from any ideas, methods, instructions or products referred to in the content. |
© 2025 by the authors. Licensee MDPI, Basel, Switzerland. This article is an open access article distributed under the terms and conditions of the Creative Commons Attribution (CC BY) license (http://creativecommons.org/licenses/by/4.0/).
Copyright: This open access article is published under a Creative Commons CC BY 4.0 license, which permit the free download, distribution, and reuse, provided that the author and preprint are cited in any reuse.


