
Submitted:
18 March 2024
Posted:
19 March 2024
You are already at the latest version
Abstract
The administration and management of urban transport has become an urgent need, in the context of the increasing congestion problems and the environmental and economic damage, resulting from rapid urban expansion witnessed by the Algerian cities in recent times, in order to achieve prosperity and quality of urban life. It became necessary to use the tools of modern technology, which administrative and technical departments are seeking to use primarily to support ways of decision-making and actions required. Boosted by high capabilities in the statistical data and other information is stored, and coordination and tabulation, with the possibility of installation and analysis by operations. Especially against the inability of traditional methods, which have become less able to cope with the changes that led to the urban dynamic currently experienced by urban communities in our country. This research aims to employ geographic information systems in the administration and management of the urban transport network, facing both the population and the local administration of the city of Batna. Which was chosen as a model for major Algerian cities, which is suffering more than ever of transportation bottlenecks, as well as the unintended damage for these networks and other networks. Hence the importance of the subject of our research, which aims to use GIS MapInfo systems as a means to snipe (Data Capture) and storage (Data Storage) and address (Data Processing) and directed by spatial information (Spatial Data) and link them to the descriptive information (Attribute Data). To develop a modern digital data and charts the base of each of these elements of the urban service lines equipment and mechanisms, ... etc. As a tool available to those creating and carrying out urban spaces, as well as decision-makers. It was concluded that the possibilities offered by this system would facilitate the processes of monitoring and management in order to ensure the quality of the service.
Keywords:
City of Batna
; Geographic information systems
; urban transport network
; digital plans
1. Introduction
Urban transport is one of the basic elements of urban life, as it provides people reaching various other urban services, the urban transport system has evolved with the increasing changes in the urban tissue and economic activity growth as well as changes in the people's livelihood patterns, and their trendy life obliged them to expend their daily movement circle outside the boundaries of their housing areas.
Based on the above, this paper aimed at explaining and analyzing a view of establishment of a geographical information system, particular to urban transport network in the city of Batna in order to achieve good monitoring of its components through the construction of geographic databases of their own. And the completion of a modern, easy-to-update digital maps, which allows us to provide the raw material for an objective analysis in a short time through the distribution of the components of the urban service.
2. Introducing Urban Transport Network in Batna
The city of Batna is one of the largest cities in the east of Algeria, located about 500 km southeast of the capital of the country. Created by the French colonialists in 1844. Now, the city has a population of 297,814 people, which shows the excessive expansion of the urban fabric. This expansion has several needs, including the growing need for urban transport, which is the subject of our research.
The study of the urban transport system needs a field investigation to collect data and before carrying the survey and the census the city must be divided into urban sectors, as a base for the analysis of line paths and identifying urban sectors that don’t benefit from the network coverage.
This network, which consists of a set of lines or tracks related to stop stations. Where the transport means (buses, taxis) move from the major stations that are located at the beginning and end of each line, within a network of urban roads, called main roads.
Urban transport is an important way to connect the urban assembly points, it is the artery connecting between them, as well as being the main engine of urban gathering, and aims to give a dynamic and continuity in the city in its various configurations [1].
2.1. Urban Transport Bus
Since its inception, on October 1st, 1971 [2], the collective urban transport bus in the city of Batna seeks to focus on the link between the various districts of the city and the city center on one hand, as well as linking neighborhoods with one another on the other hand. The plan aims to achieve greater connectivity and dynamism between all parts of the urban fabric. Especially, now since the collective urban transport network of the city of Batna is made up of 290 collaborator from the private sector that has 393 buses in addition to the public institution of urban transport (ETUB) [3]

Table 1.
The city of Batna evolution of the urban bus transport network.
| The year | the number of lines | the number of buses | the number of seats |
|---|---|---|---|
| 1971 | 02 | 03 | 300 |
| 1987 | 07 | 23 | 2278 |
| 1996 | 09 | 67 | 6700 |
| 2007 | 10 | 192 | 19200 |
| 2014 | 15 | 395 |
Source: done by the researcher According to data of Transportation Directorate of Batna.
Table (02) shows the great development of the urban buses depot, from one bus every 34 thousand people in the seventies to one bus for every 750 people in 2014. This quantitative development of the number of urban transport buses, agrees with the growth and extension of the transport network, which was estimated to 46 km in 2013, divided into 14 lines as illustrated in Figure (03).
In order to give further information about the collective urban transport network we inserted the table (03) which explains the importance of each line of network and the number of individuals being transported during the day. In addition to the inclusion of Figure (03) that shows all the urban transport lines, which are either tangential lines (lignes tangentielles) that connects most of the suburbs with the city center, radial lines (lignes radiales) that connects suburbs passing through the city center.
Table 2.
The city of Batna- Distribution the destinations and the capacity of urban mass transit lines.
Table 2.
The city of Batna- Distribution the destinations and the capacity of urban mass transit lines.
| Number | The line | The number of dealers | The number of vehicles | The number of seats |
|---|---|---|---|---|
| 01 | City center- 1200 residence section | 24 | 35 | 3217 |
| 02 | City center- Bouâakal section | 25 | 29 | 2729 |
| 03 | City center- Lembarkia section | 27 | 31 | 2989 |
| 04 | City center- 1020 residence section | 28 | 30 | 2916 |
| 05 | City center- Kchida section | 15 | 15 | 1328 |
| 06 | City center- Lembarkia - B section | 1 | 1 | 80 |
| 07 | City center- Tamechit section | 22 | 23 | 2054 |
| 08 | City center- The hospital | 8 | 8 | 281 |
| 09 | City center- Eldjadida station | 24 | 24 | 2317 |
| 10 | City center- Ouled Bchina | 15 | 15 | 1497 |
| 11 | Esalsabil section/ Chikhi 500 residence section | 1 | 4 | 404 |
| 12 | Sonatiba section- Chelia hotel | 1 | 6 | 606 |
| 13 | Bouzourane section- El djadida | 28 | 37 | 3479 |
| 14 | Tazoult- Batna | 69 | 81 | 3810 |
| 15 | Esalsabil section- Eriadh section | 1 | 4 | 404 |
Source: Zakaria Meglati by the directorate of transport of the city of Batna.
Figure 1.
Distribution of urban transport lines.
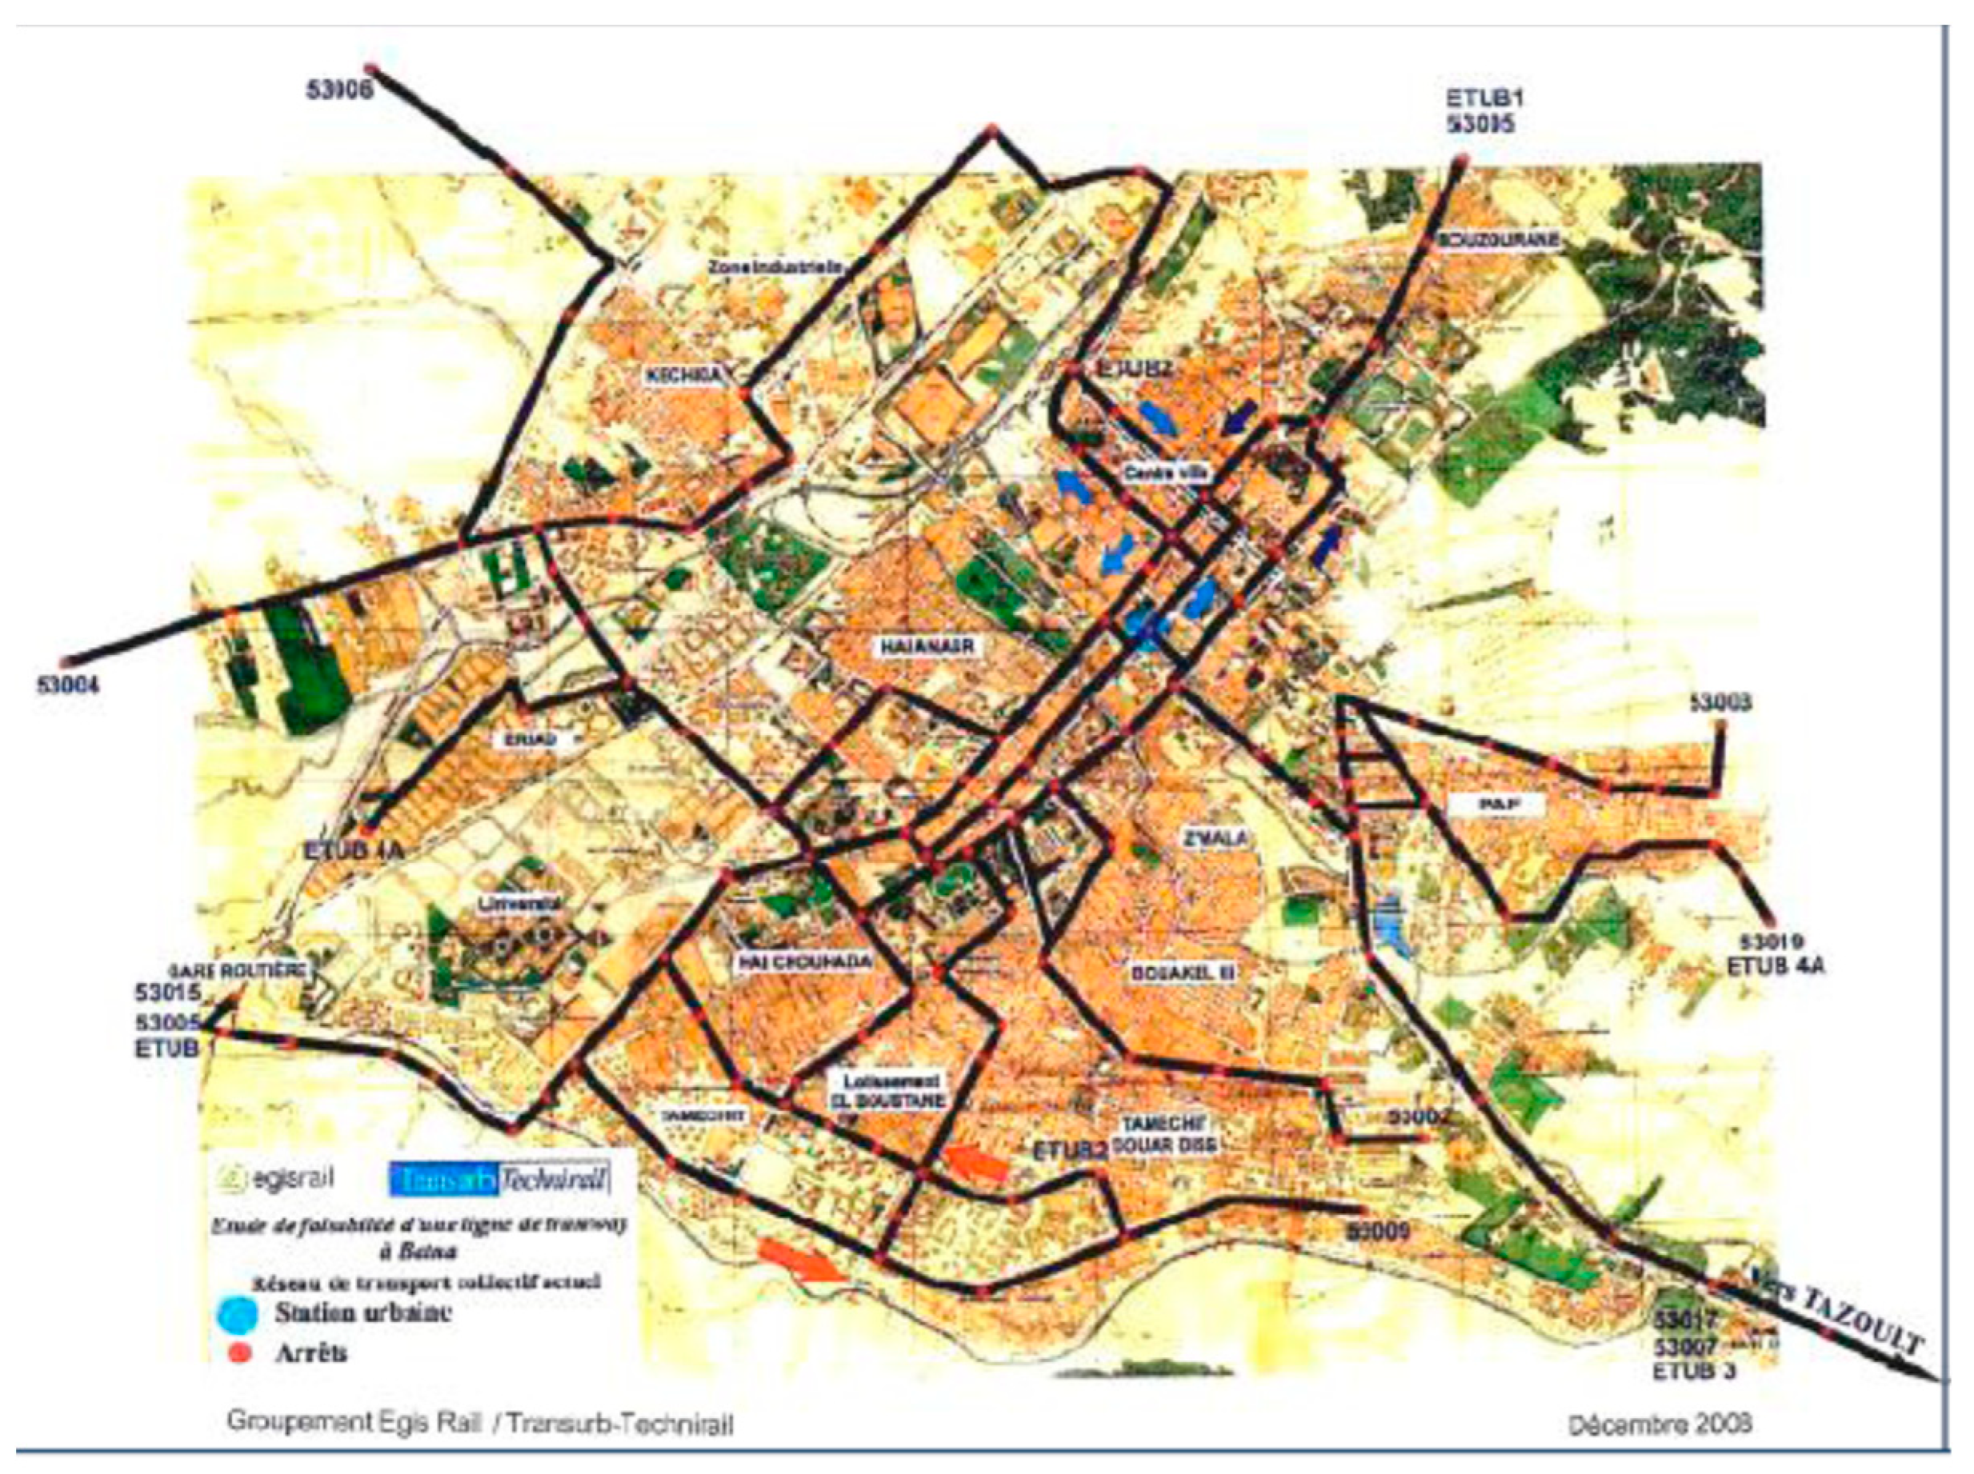
It’s worthy here to note that the field audit data shows that the level of all the urban transport lines, the average number of persons transported per day is between 14.67% and 07.04% of the total theoretical number of people being transported within the city. This convergence reflects the good distribution of the urban transport lines on the total area of the city.
2.2. Urban Taxiing
Taxis are characterized by flexibility and speed of movement, as well as comfort provided to customers. Among the most important peculiarities of urban transport by taxi in the city of Batna we mention, the individual catering system and not mass transit since it does not use a single-seat pricing system. However, the customer have to pay for all the seats. Contrary to the system applied in major cities such as Constantine, due to the fact that taxis in the field of the study do not have neither a specific itinerary nor a determined network so most of time, the price is agreed by the customer and the taxi driver.
The number of regular taxis and cars engaged in urban transport in the city of Batna was estimated in 2007 to 325 licenses, including 65 taxi of Radio Taxi enterprise (TAXI RADIO). The investigation in the field of study has shown the enormous number of illegal taxis engaged that spread across the city, especially at major junctions of the city, with an estimated number of more than 200 illegal taxis.
Figure (1), shows the distribution of taxi stop places, records show 19 points, four of which are in the city center. They also spread in urban parties, through the sectors (10) and (13) because of the high population density. Because of the distance from the city center. Overall, all the taxi stop places are unprepared and mainly are parts of main streets, which cause traffic.
3. Geographic Information System for Urban Transport Network in Batna
3.1. Methodology
In this research, we used many data that has been collected from various sources. Among which are the responsible services for monitoring the network, in addition to the plan of the city that is available at the Institute's library level. The following figure summarizes the technical stages of the system design.
Figure 2.
Work Methodology.

According to Figure (04) after the raw data collection process and in terms of geographical data, we went through the process of signature of data and digitization schemes, this stage included the following operations:
- Scan paper charts of (the city plan, the plan of bus lines and the plan of taxi stop stations).
- The completion of the digital model of the previous schemes: this process was carried out by means of spatial representation of building and construction sectors frame. In addition, to the use of linear representation to represent the lines parts through the private choices of type of the line according to the importance of the category that each section belongs to. The representation of the bullet representation has been used to represent the components of both networks (such as stop places, stations ... etc).
- As for the metadata, both technical and statistical, it has been processed and incorporated into the files of DAT type. Where we linked geographic data with their descriptive characteristics.
Thus, we obtained all digital components that our system needs. And that after the design of the network databases according to the needs and goals we are seeking to achieve, which are:
- Facilitate recognition of the geographical distribution of the components of the network.
- Facilitate management and monitoring of the network.
- Facilitate geographic analyses of the distribution of the network components.
4. Methodology for the Network Database Design
4.1. The Concept of the Database
The database is a set of structured data associated with each other to achieve a particular goal. The databases used in geographic information systems differ from other databases by the fact that they deal with metadata that have a geographical aspect. i.e: they are distributed according to the system of coordinates [4]. Geographical databases appear in the format of tables containing a set of columns each of them includes a single geographical status of the geographical asset.
Geographic information systems (GIS) guarantee the preservation, processing and output of large amounts of data and thus it is the confluence point of the inflows and outflows of data, moreover, it is the center where data are processed and stored for further use [5].
Geographic information systems are complex [6] object, so it was necessary to illustrate it by a simple representation to clarify the reality of this system. This process is called modeling [7] (modélisation) that is made first by counting all the data contained in the field and then studied in a second phase to identify the relationship between them.
4.2. Modeling of Urban Transport Network Data
For this network data modeling, we need to know the possible needs of these data [8] , which are many and multi has been formulated based on the functions performed by the responsible services the mangement of this network which are as follows:
- Find out the completed tracks.
- Know the number of vehicles that make up the network.
- Know the different technical characteristics of linear components that make up the raster of the network, such as (Passenger capacity, license number, commercial speed, the date of the beginning of the service, etc ...).
- Conducting surveillance and technical maintenance.
- Follow-up the quality of the service provided.
- Follow-up reports and citizens' protests.
After that, we must know the rules that govern the conduct of this network, which are numerous other has been formulated in the same way. They are as follows:
- Each stop station is characterized by a set of technical characteristics.
- Each track is characterized by a set of technical characteristics, including the departure point and arrival point.
- Each vehicle is characterized by a set of technical characteristics.
- Each stop station links the beneficiary and the path of the network.
- Each stop station, or path has specific geographic coordinates.
4.2.1. The Development of the Data Model
Urban transport network consists of two types of assets (Entités), they are:
- Linear Assets: The types of lines in sections that make up the network.
- Raster Assets: The arrival or departure points, stops, transporters, and complaints.
- The following table shows all the assets of this network and its characteristics
Table 1.
Descriptive characteristics of the geographical assets for urban transport network.
| Assets | Characteristics |
|---|---|
| Track | ID of the track, track name, track type, line capacity, completion date, line status, neighborhoods it serves, notes |
|
Vehicle (Bus, car) |
Number of the vehicle, the type of the vehicle, the theoretical capacity of the vehicle, date of last technical review, the status of the vehicle, neighborhoods it serves, the number of daily tours, the ticket price, notes |
| Stop station | The station ID, station name, station type, the dimensions of the plant, the date of the completion of the station, the status of the station, the station furnishing status, the station coordinates, notes |
| Arrival point or departure | Departure station ID, arrival station ID, name of the manager, capacity, station equipment, departure coordinates, arrival coordinates, neighborhoods it serves, notes. |
| Transporters | Transporter ID, transporter name, date of benefit, taxing number, the number of employees, notes |
| The complaint | Complaint ID, complainer name, complainer address, delivery number, the date of the complaint, the cause of the complaint. |
Figure 3.
Conceptual model for urban transport network data.
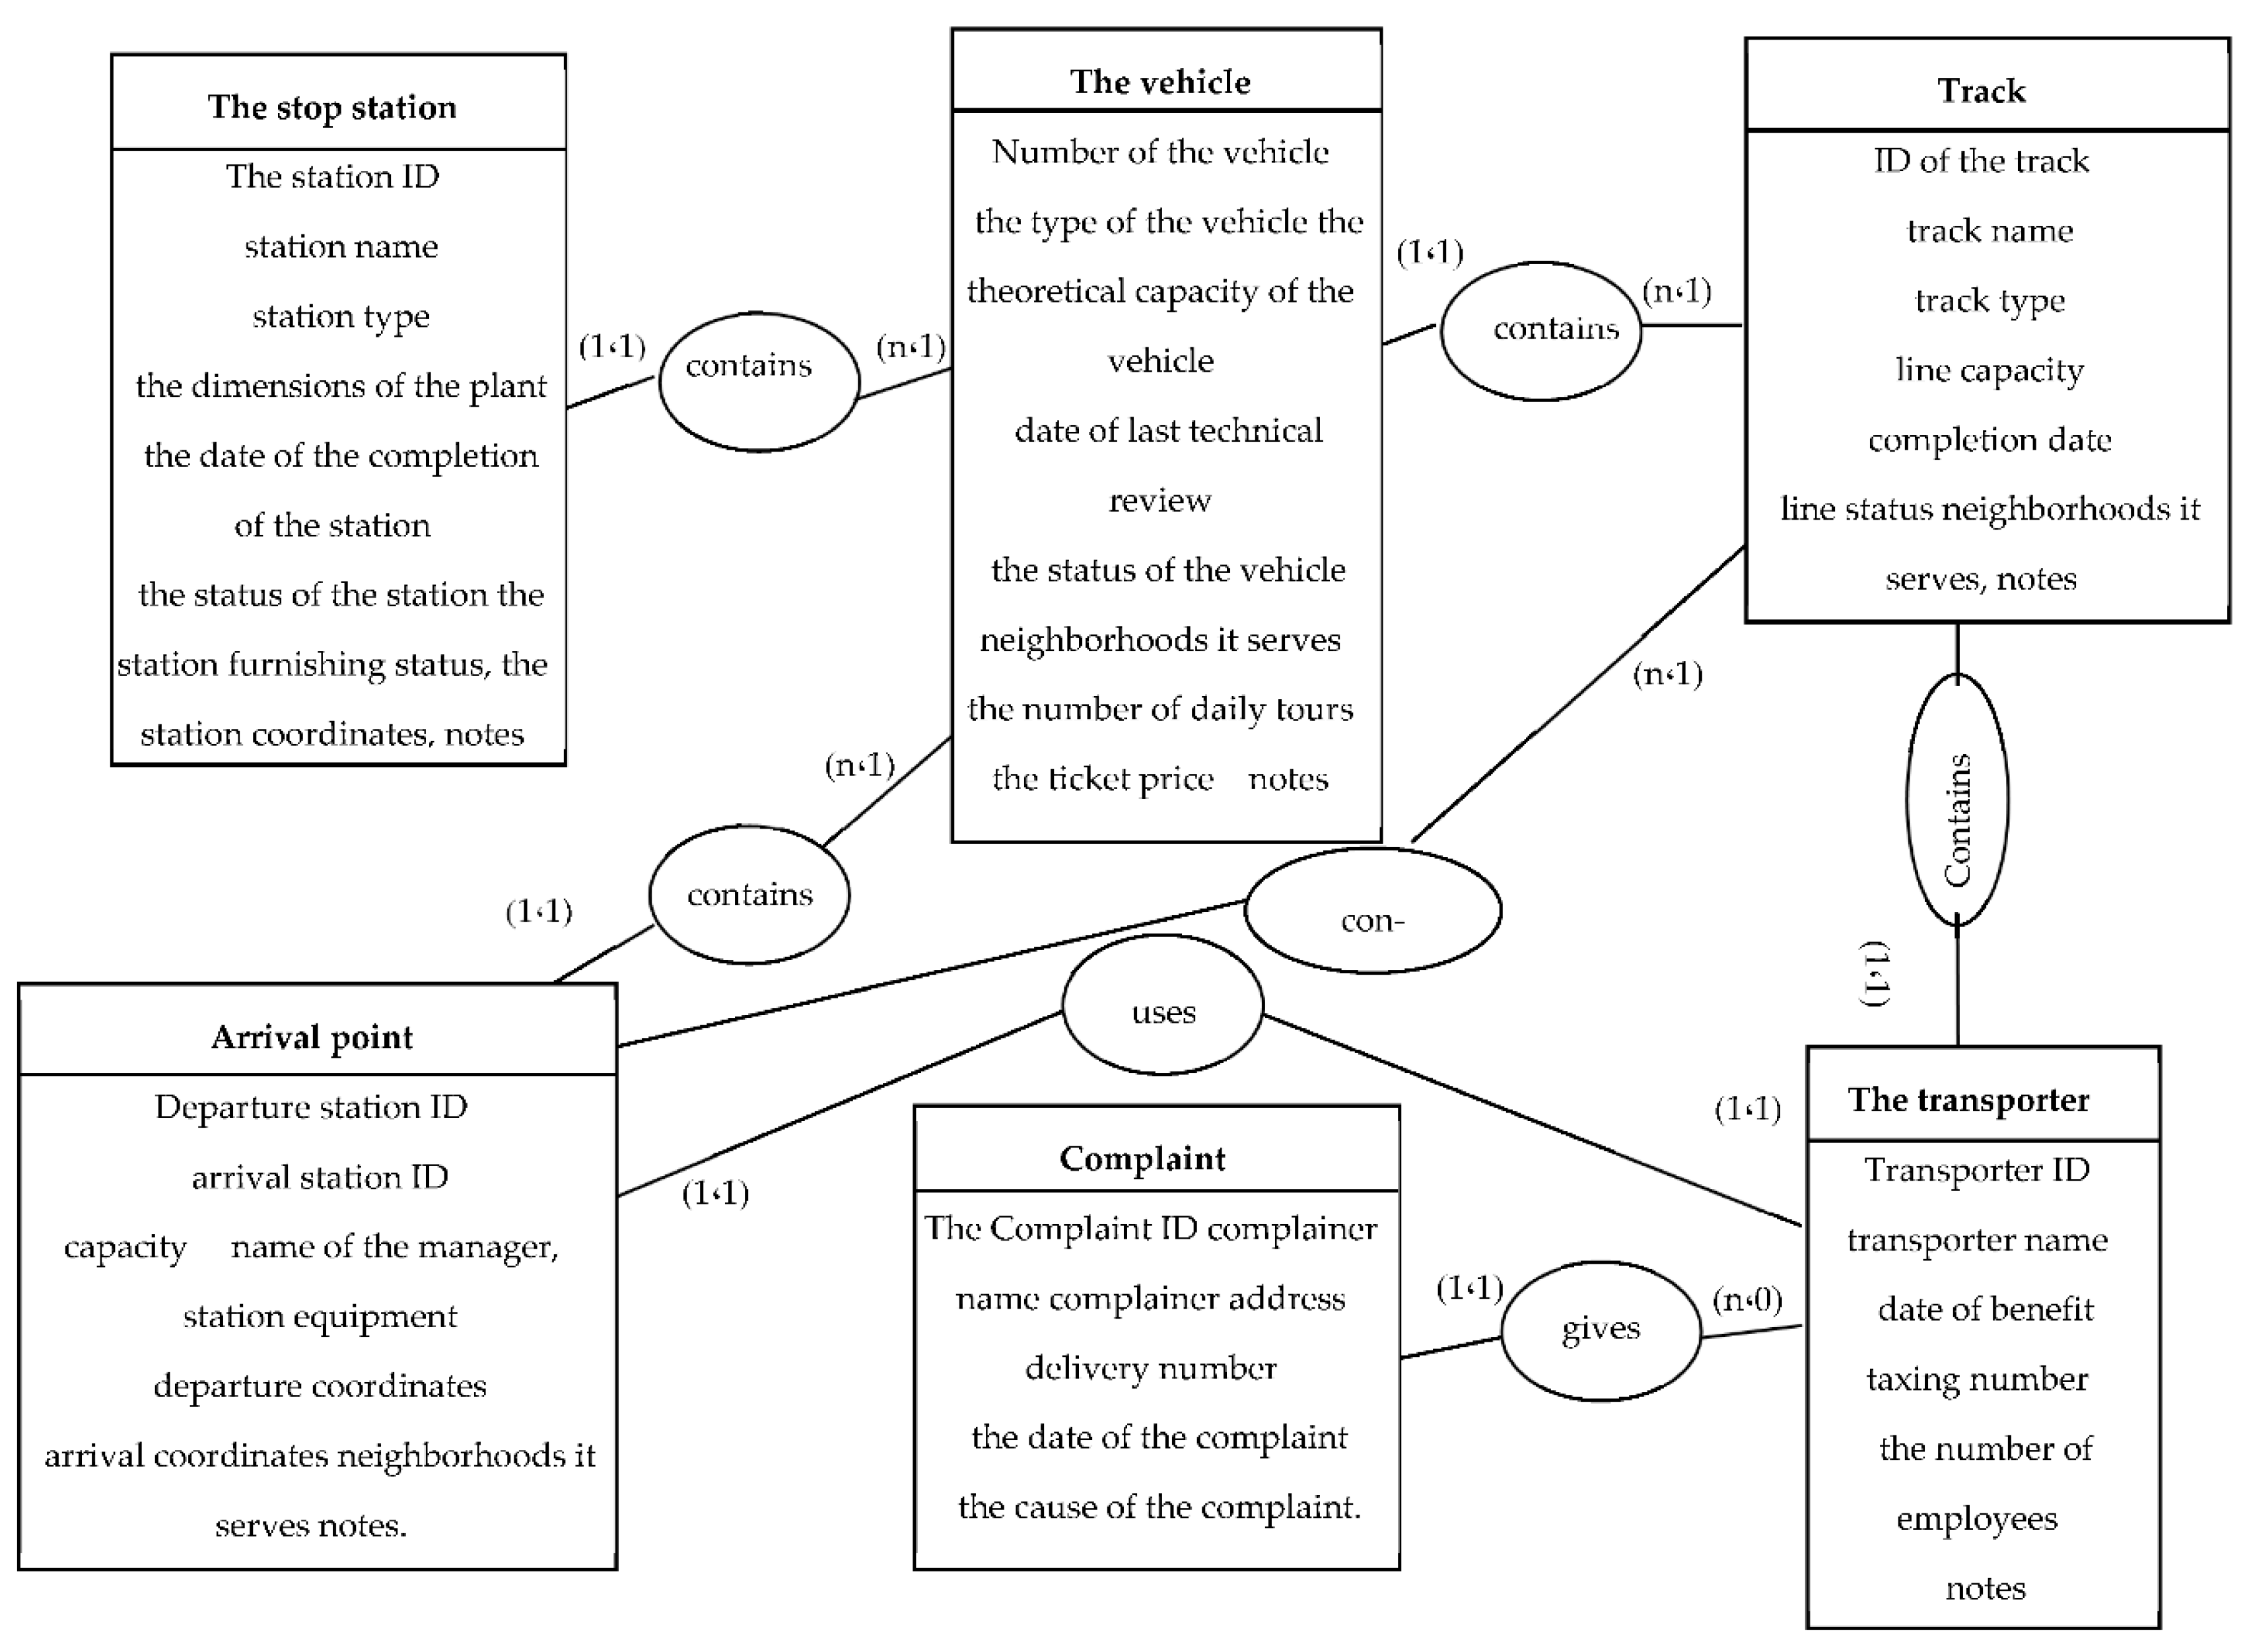
4.3. The Urban Transport Network Databases Combination
Represents the list of databases that that was revealed by the result of this conceptual [9] analysis, which was relied on to propose 06 private urban transport network basic points: track (line), the vehicle, stop station, arrival or departure station, bus (the line owner) and the complaint (citizen). The following are examples of these conceptual rules supposedly designed by specialists in automated media software
Figure 4.
Virtual image of the structure of the database of urban transport stop stations.
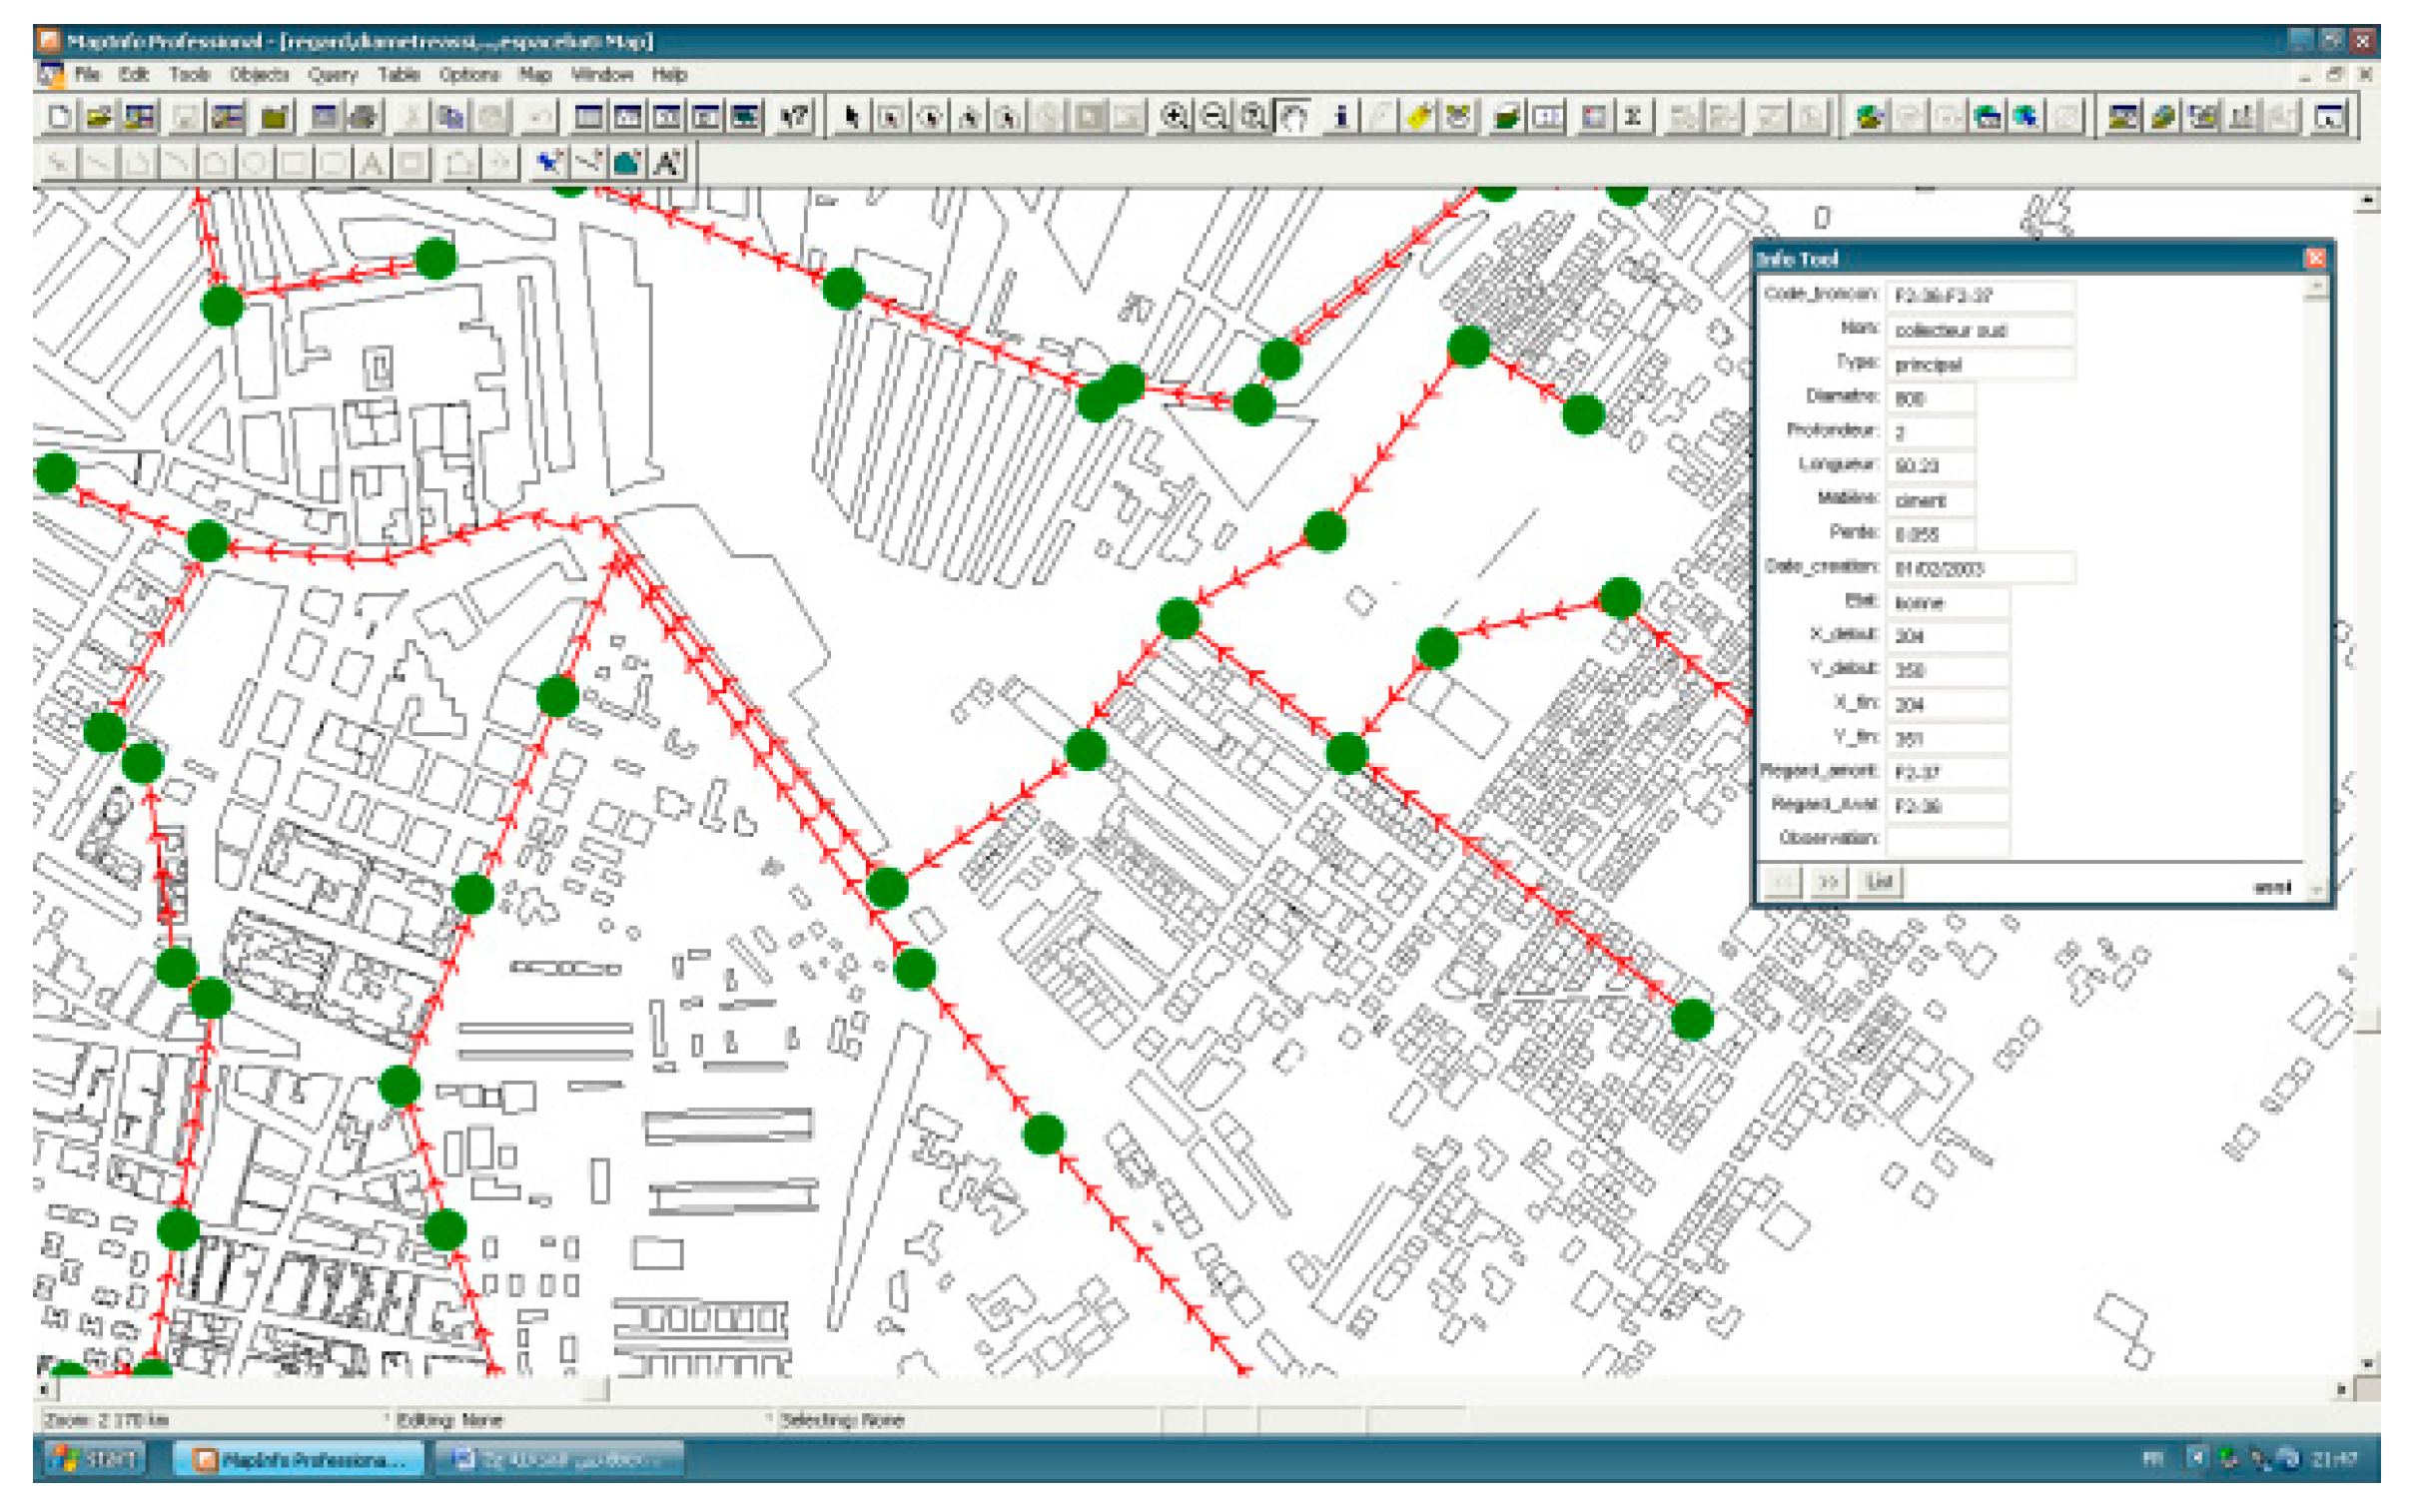
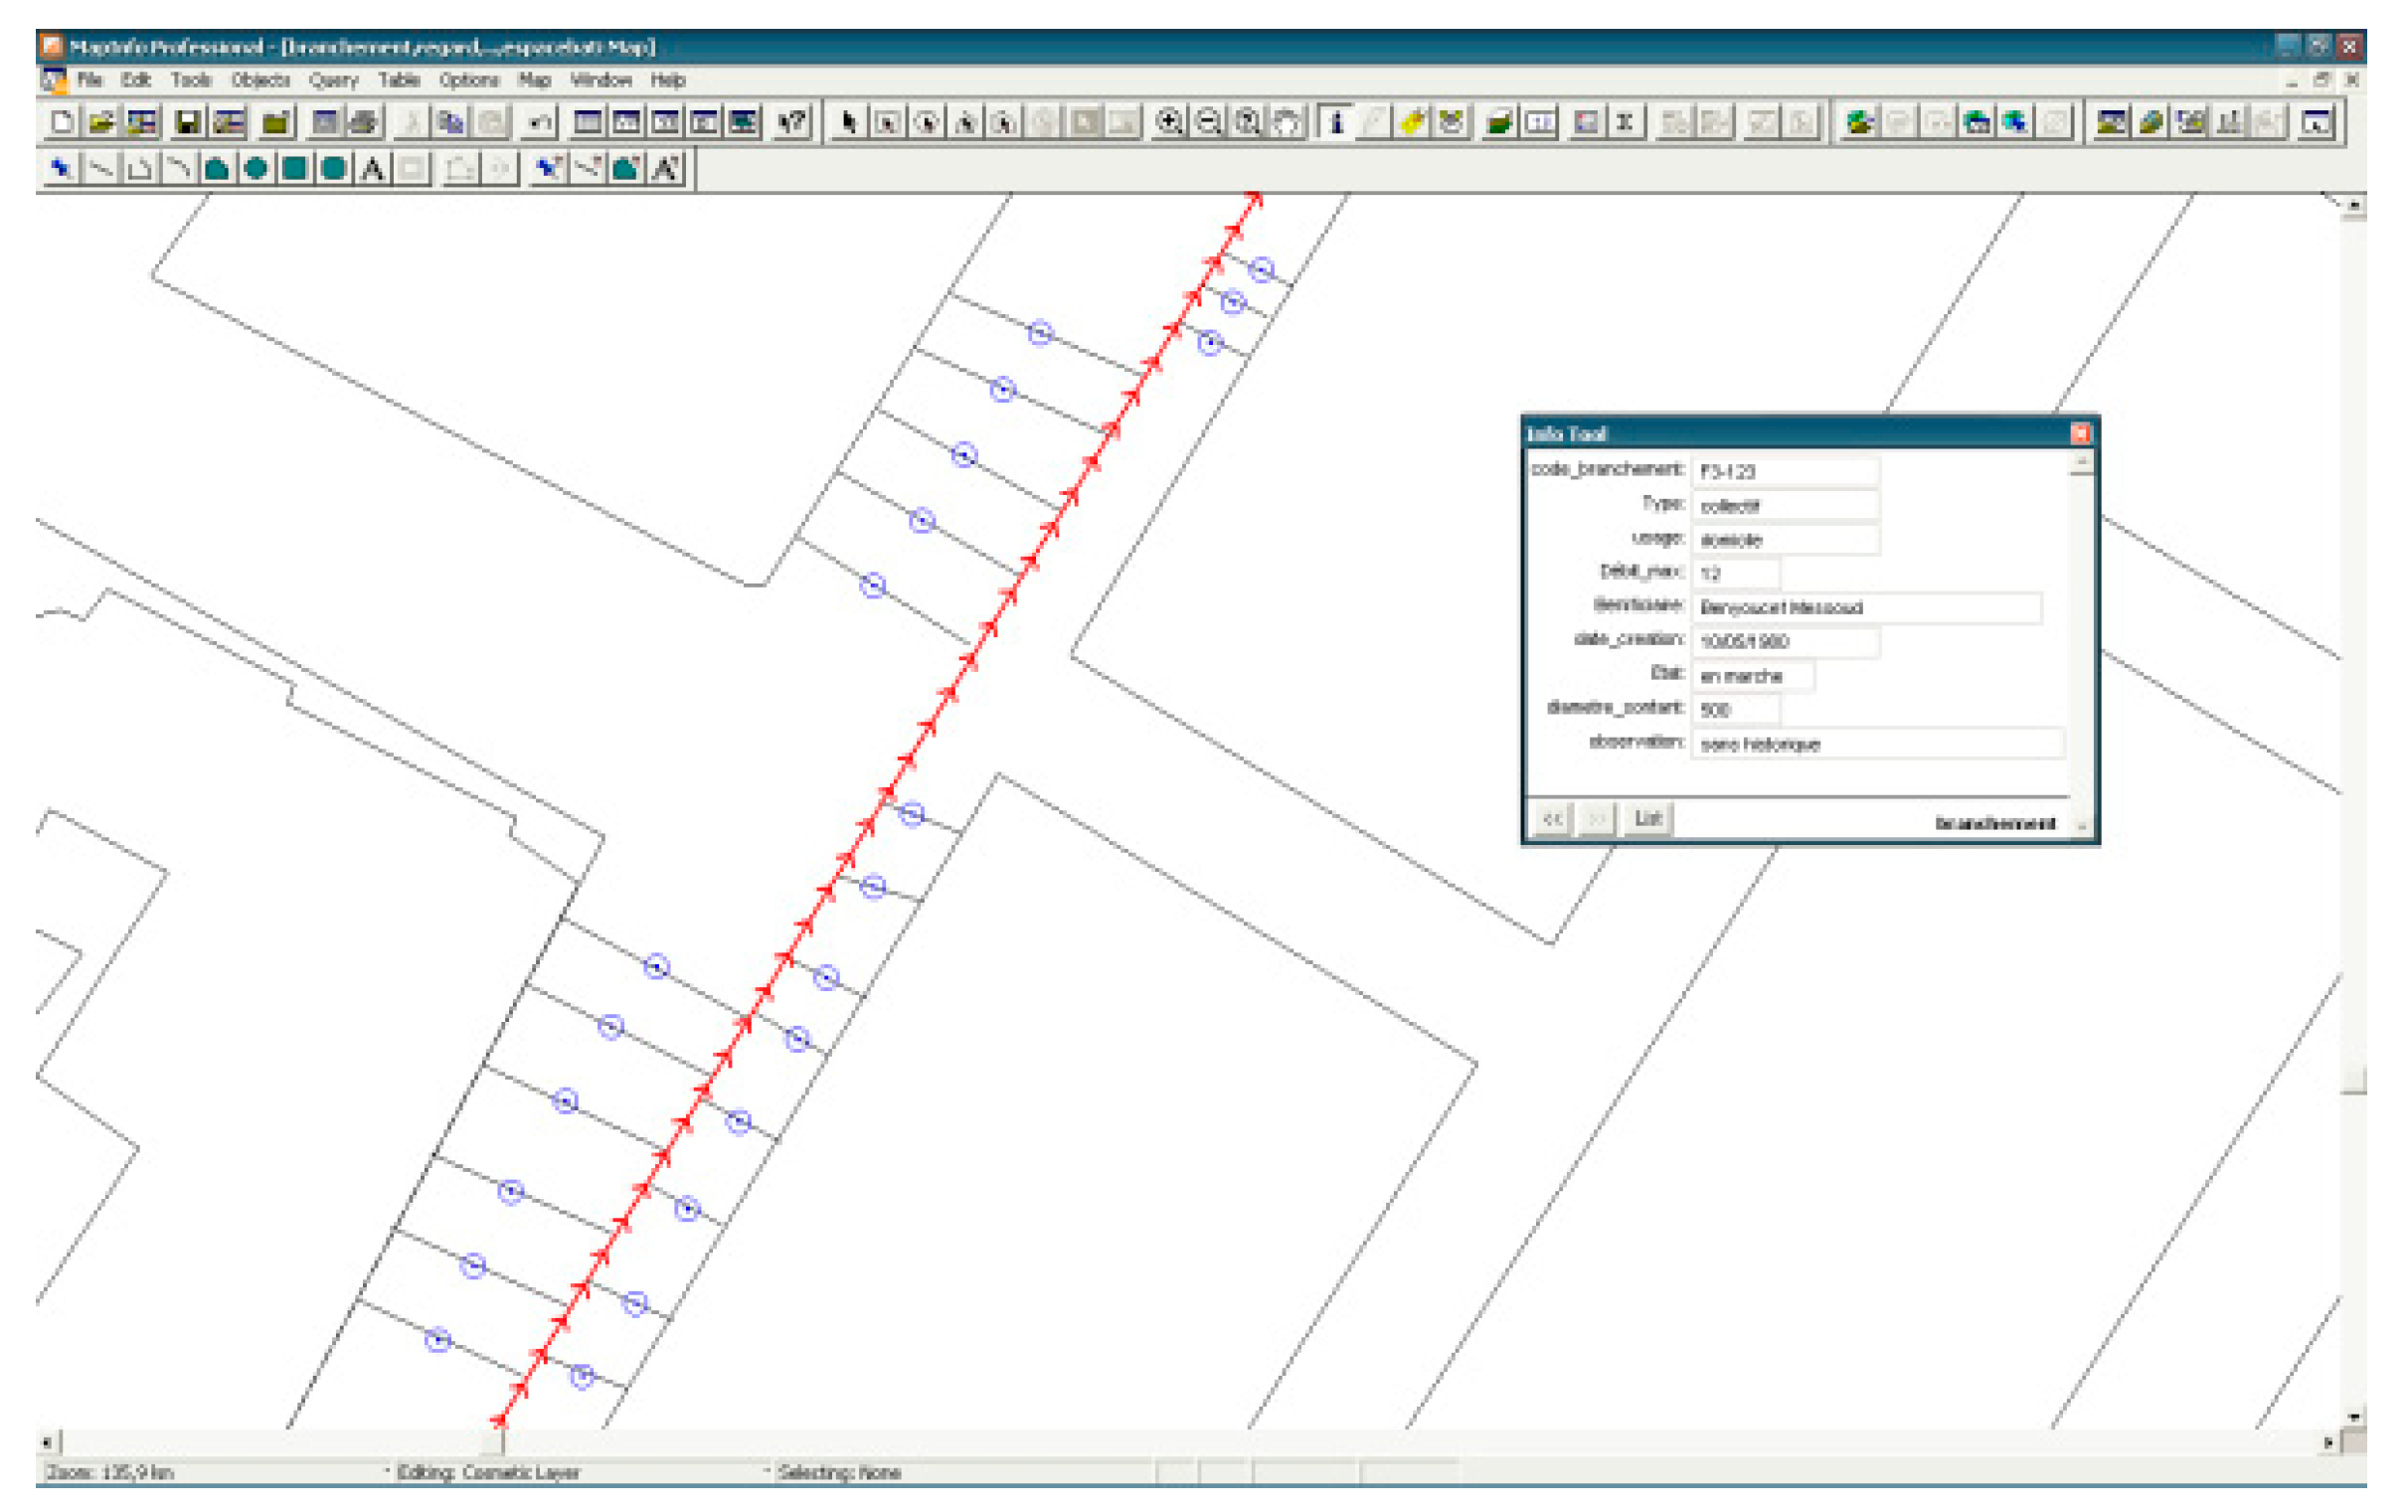
Figure 5.
Image of a virtual structure of the database related to organizing the departure station.
5. The Plans and the Queries
Now, paper charts are used to display the geographic distribution of the components of any network. However, the weakness of these schemes is that they are large and difficult to process, fixed drawing measures, they also damage quickly and the difficulty to access to some of the components of the network data, in addition to other difficulties. As for digital schemes that were completed within the geographic information system could be seen as a dynamic tool interacts directly with the user’s [10] desire. While its drawing measures changes by a simple movement. Thus, it gives users the opportunity to see reality in several dimensions within a very short time. Moreover, they are allowed to change its contents and control it by making simple choices. As well as you can simply copy and transfer and print these schemes or parts of them. Moreover, these schemes that are linked automatically metadata allow the access to new schemes as a result of the implementation of certain queries on this data [11]. For our case we can carry out many inquiries that serve to guide the work of monitoring and management, as well as maintenance and monitoring, and facilitates coping with the citizens' complaints through the use of search options accompanied by geographical delineation of the elements that we are looking for in the database. Therefore, the possibility to see them on the screen or print as a whole or in parts.
These queries can be stated as follows:
Queries concerning the search for one of the components of the network and determine its characteristics: for example: Where is the track (line) located? What are its beginning and the end coordinates? When was it made? How many vehicles operate on it? Where is the stop station? What are all its technical characteristics? In addition to other potentially raised queries which are supposed to be answered by our system very quickly and efficiently.
Queries concerning research on the distribution of a set of components that respond to a range of conditions that can be identified by the user as needed. For example, you can inquire about:
- The geographical distribution of the total lines that go through the city center?
- The geographical distribution of lines that have been completed before a certain date?
- The geographical distribution of the stop stations that witness bottlenecks and was reported by the population?
Here are some examples of the results of some of these queries:
Figure 6.
Virtual image of the answering result of query within the information system.
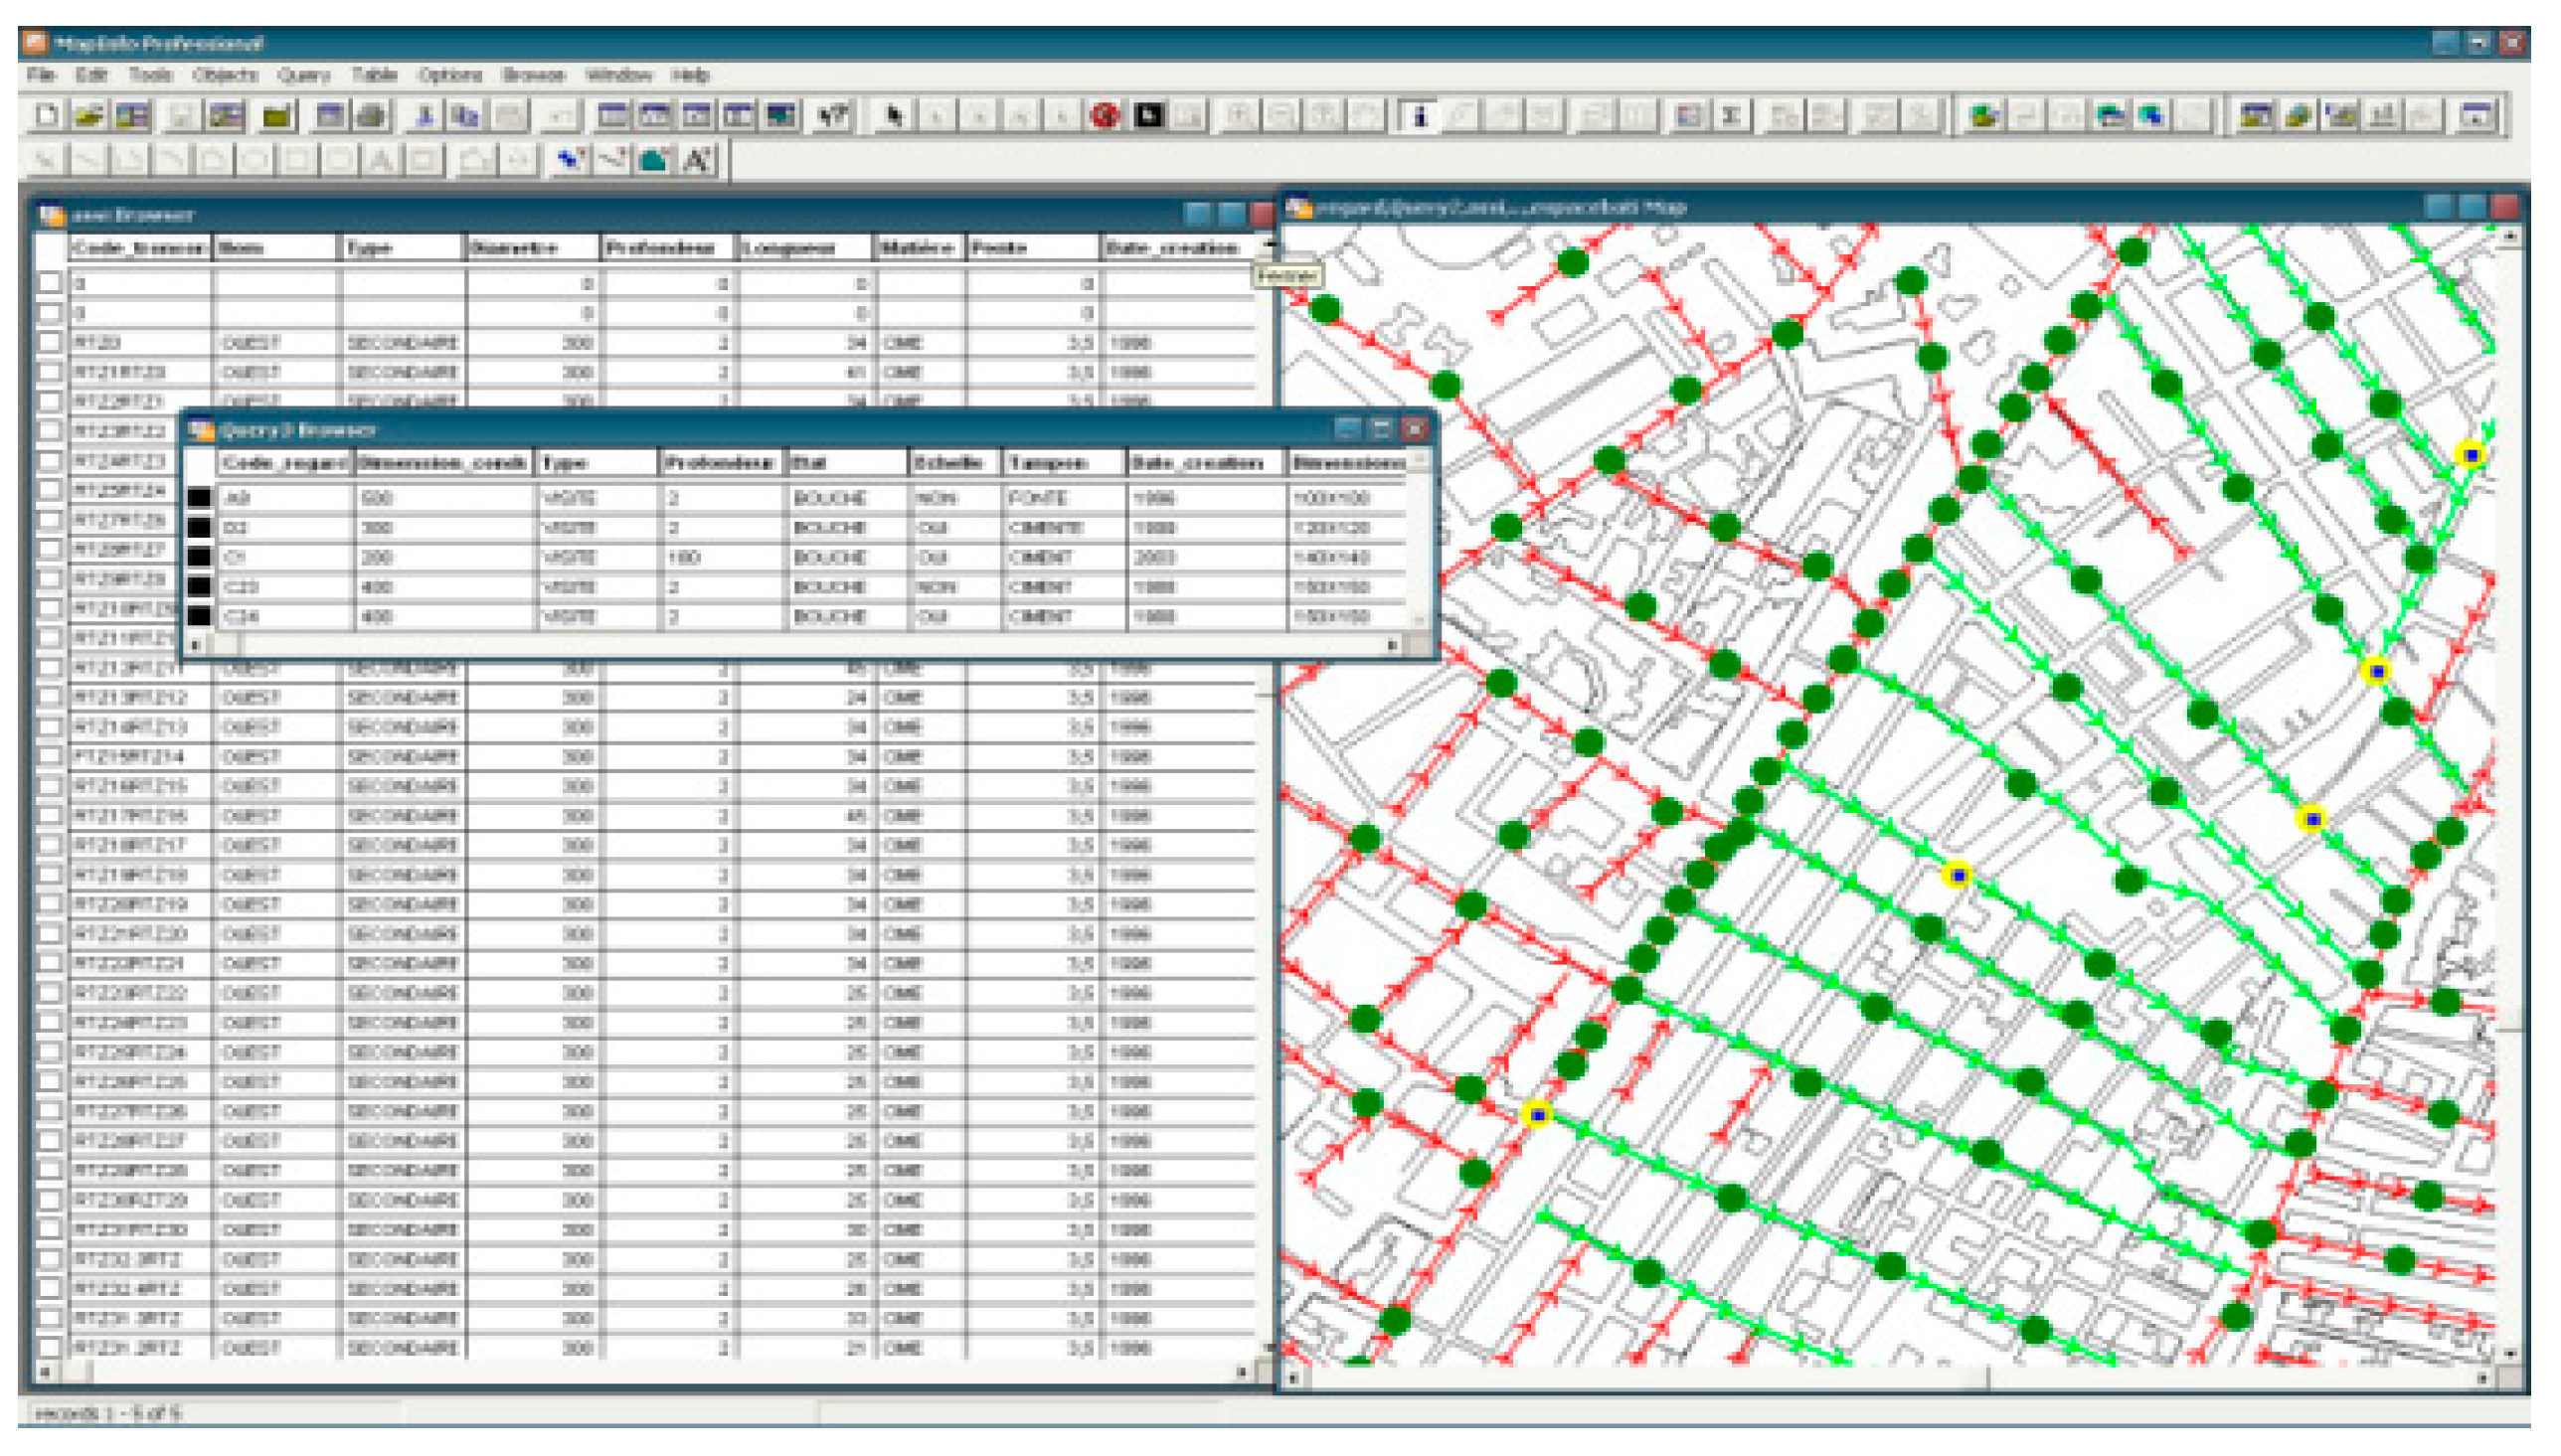
Enquiry: What are the stations that suffer from bottlenecks?
Answer: The stations that the system colored them in yellow and mentioned their characteristics in the small window.
Figure 7.
Virtual image of the answering result of query within the information system.
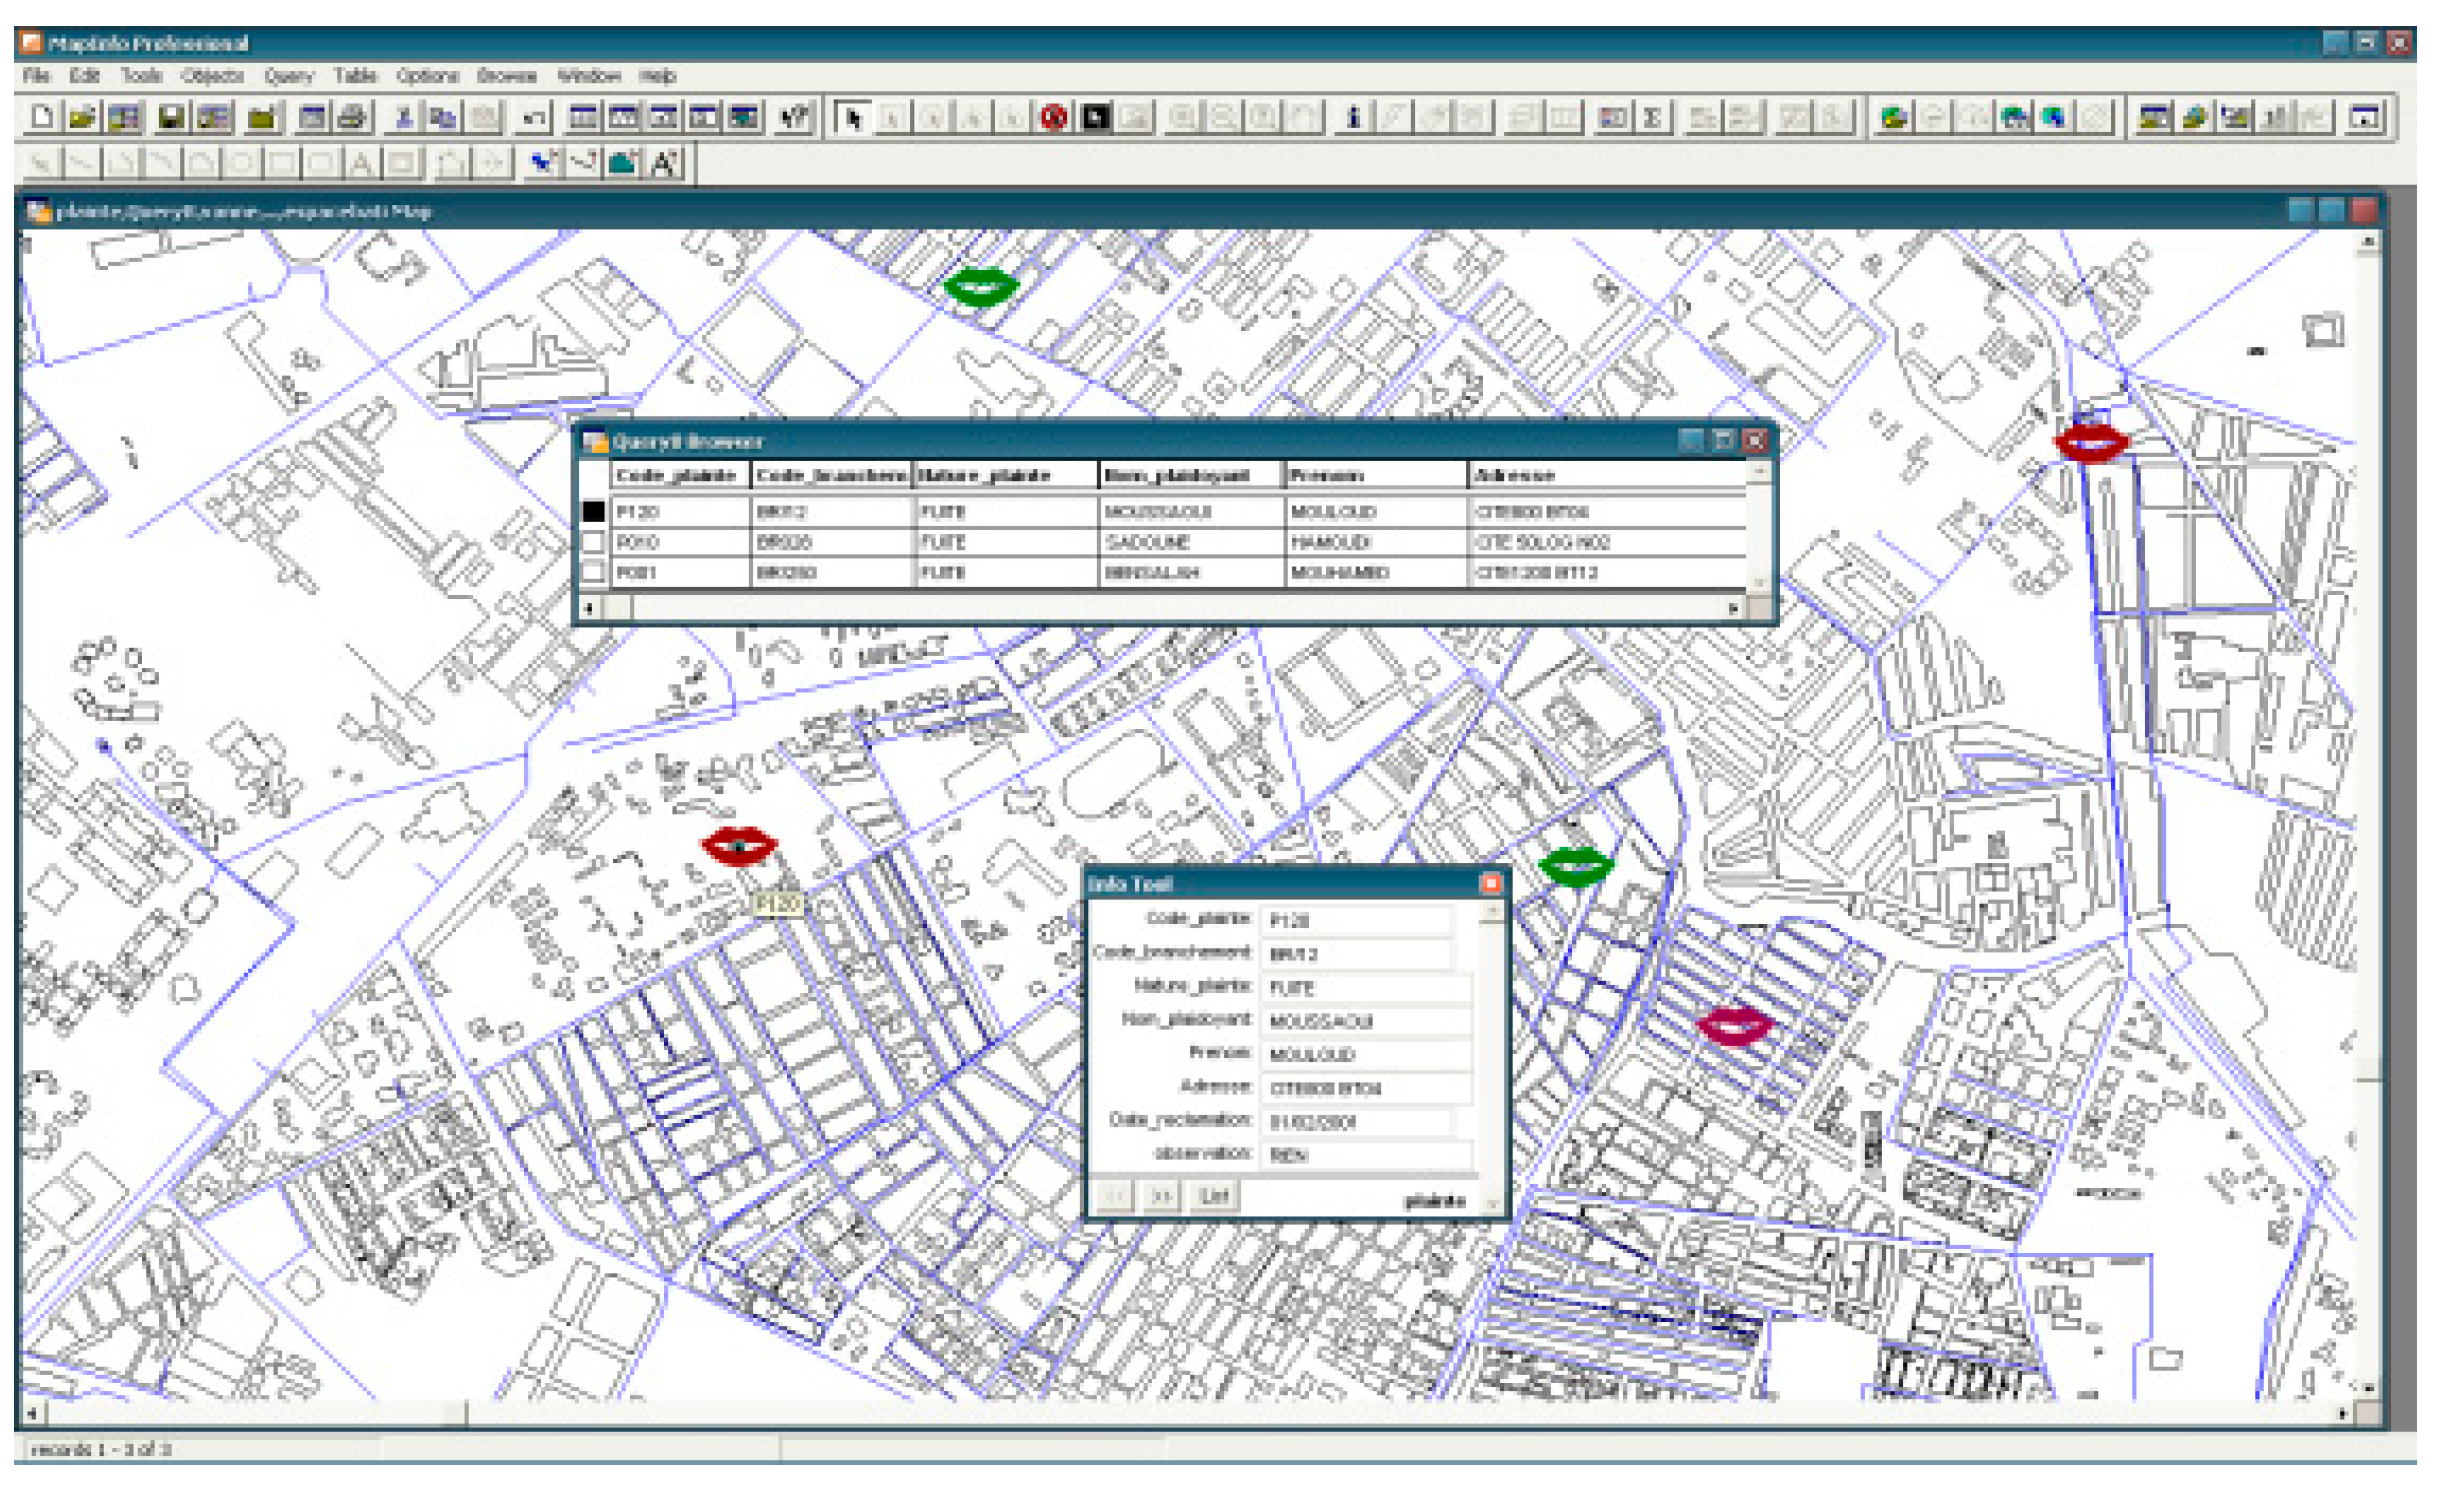
Enquiry: Where are the complaints of citizens which have been recorded on 01/02/2001?
The answer: they are spots colored in brown and their data are presented in the small window.
6. Conclusions
In this paper, we presented theoretical conception of an applied work about one of the most important urban functions, namely urban transport, where the aim is to adjust and update the data concerning the management and conduct of the network using geographic information systems Mapinfo. In order to develop a practical tool for the personal responsible of the configuration and management of urban areas of the city of Batna, as well as to those interested in the the urban economy to benefit from the advantages offered by this modern technology.
There were attempts to model the urban transport system after the pictorial study of its structure, which can be enriched in association with specialists from the transport sector. Our attempt was fulfilled by determining the necessary databases to achieve this goal. Where all geographic components were inserted in special classes. Then they were linked to their descriptive data. Thus, the system not only provided the possibility of digital management and control of the network, furthermore, it become able to answer ,with precision and in a very short time, many queries about the features and the status of its various components depending on the nature of their characteristics. Thus, save time, effort and money and ameliorate the service performance.
We also hope the future expansion in the aspects of this system, through the possible inclusion of new elements related to the semi-urban transport network and regional transport.
References
- Ministerial Decree dated on 20.7.1983 containing the organization of vehicles used for transport .j R. Page number 38 in 2298.
- According to transport directorate of the city of Batna. 2007.
- Zakaria Meglati, analytical study of mass transit in urban areas. Urban transport institution Batna sample, Batna University 2011.s 41.
- Pornon, H. 1995,« des SIG dans des communes de moins de 3000 habitants », Revue internationale de géomatique, vol. 5, n° 1, pp. 12-26.
- Pham,T., 1995, merise appliquée : conception des systèmes d’information de la théorie à la pratique méthode et outils, éd. Chihab-Eyrolles, p.254.
- Patricia, B. 2002. SIG concepts, outils et données, Paris, Hermès science publication, p. 214.
- Henri, P. 1995. les SIG mise en œuvre et applications, Hermès, pp.15-19.
- Roland, P. 1995, système d’information et gestion du territoire : approche systémique et procédure de réalisation, presses polytechnique et universitaire Romandes, collection Méta, p. 328p.
- Cédric, P. 2020. «conception et utilisation d’un SIG pour l’étude et le suivi des sites industriels pollués », Revue internationale de géomatique, vol. 10, n° 2, pp. 120-135.
- Erwan, Q. 2000 « système d’information géographique et acoustique urbaine », Revue internationale de géomatique, vol. 10, n° 2, pp. 61-87.
- Hamdani, H. 1999, « le SIG au service de l’urbanisme et de l’aménagement du territoire », in acte du colloque du Conseil national de l’information géographique, Alger « AL-SIG », pp. 21-36.
Disclaimer/Publisher’s Note: The statements, opinions and data contained in all publications are solely those of the individual author(s) and contributor(s) and not of MDPI and/or the editor(s). MDPI and/or the editor(s) disclaim responsibility for any injury to people or property resulting from any ideas, methods, instructions or products referred to in the content. |
© 2024 by the authors. Licensee MDPI, Basel, Switzerland. This article is an open access article distributed under the terms and conditions of the Creative Commons Attribution (CC BY) license (http://creativecommons.org/licenses/by/4.0/).
Copyright: This open access article is published under a Creative Commons CC BY 4.0 license, which permit the free download, distribution, and reuse, provided that the author and preprint are cited in any reuse.


