1. Introduction
Living systems are huge and dynamically functioning molecular assemblies that can rapidly and skillfully respond to rapid changes in the external environment. As research at the molecular level advances rapidly and the types of biomolecules being dealt with continue to increase, it is becoming increasingly difficult to accurately grasp the dynamic mechanisms of the entire life phenomenon. Just as a drama is made up of leading and supporting characters, there are leading and supporting characters in life systems as well. The story of a drama progresses with the leading character at the center. Similarly, life systems are thought to progress with the leading character at the center. The problem is that as the amount of information increases, it becomes more difficult to determine which molecules are leading and which are supporting characters. Making a mistake in this judgment will result in a misreading of the story of the mechanism. It is expected that constructing a mathematical model for a life system will lead to identifying the main molecules among many molecules and deciphering the story of the hidden mechanisms, some of which are limited to a specific biological species and others which are common to all life systems.
Here, we begin by using the cellular slime mold
Dictyostelium discoideum (Dicty)[
1,
2,
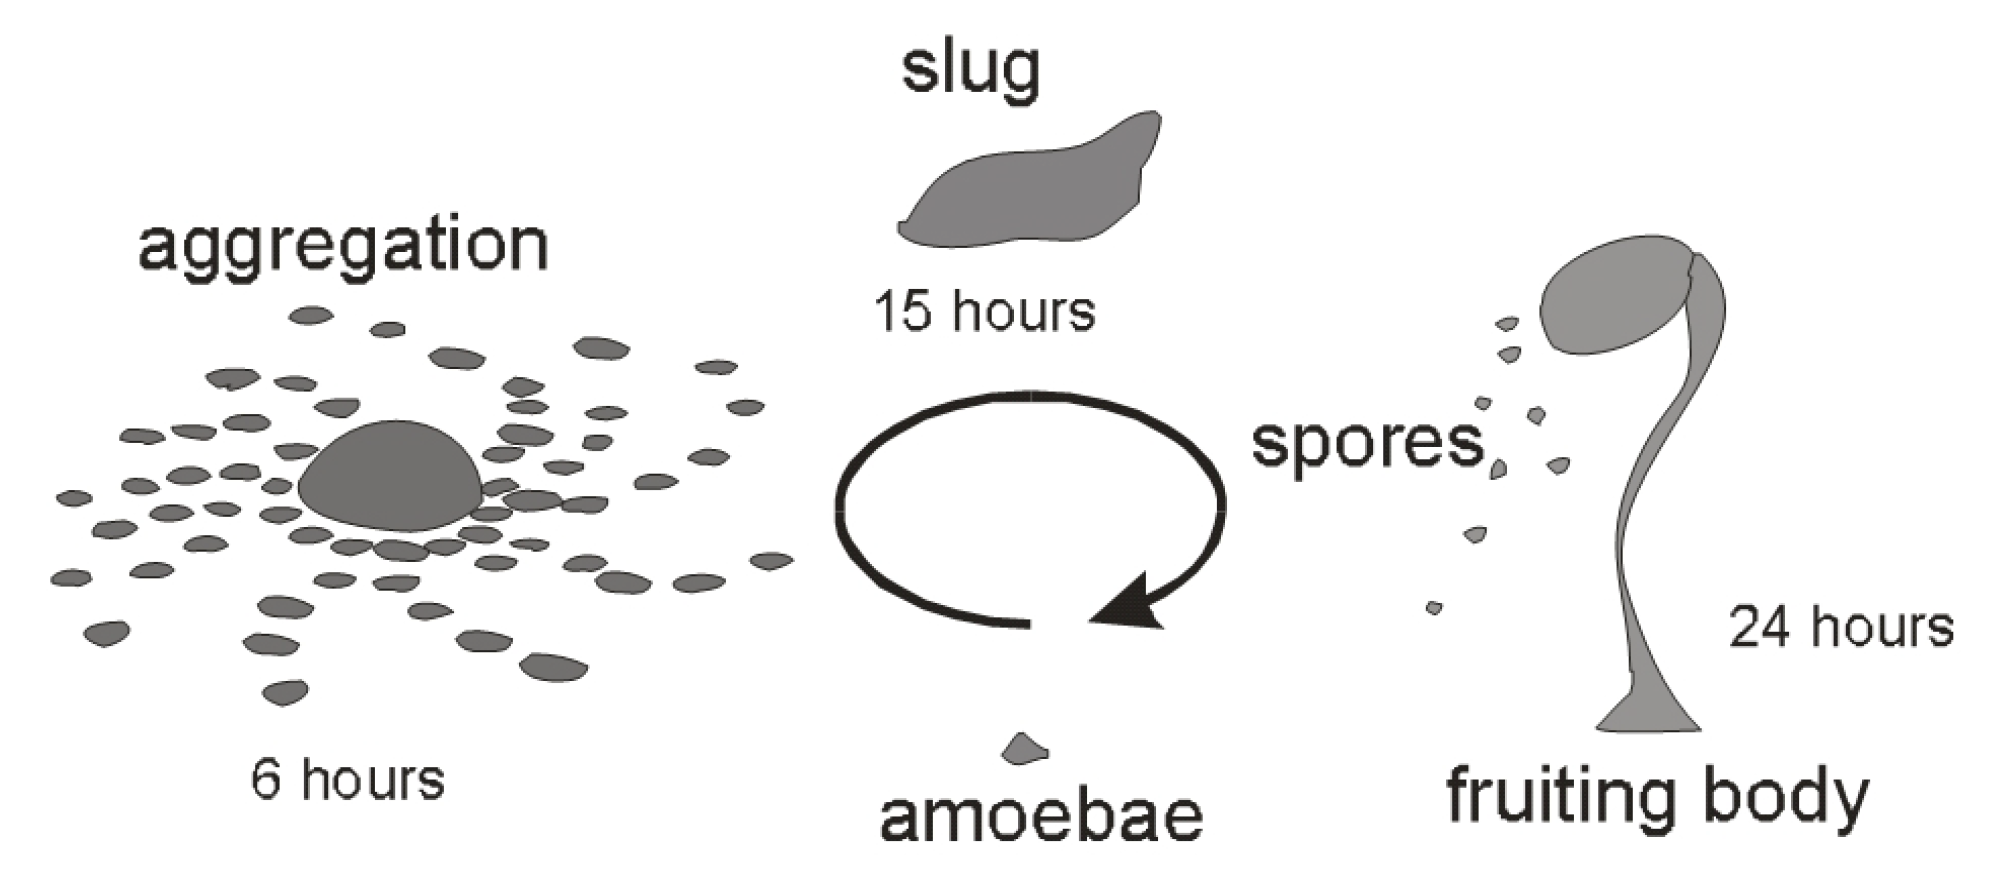
3] as a model organism. When food source is available, Dicty cells exist as free-living amoebas. However, when starved, Dicty cells aggregate into a multicellular slug and finally form a fruiting body, whose spores germinate into amoebas, completing the cycle. It takes about 24 hours from aggregation to spore formation.
Figure 1.
Lifecycle of Dictyostelium discoideum.
Figure 1.
Lifecycle of Dictyostelium discoideum.
There are already many excellent reviews on Dicty as a biological research subject[
4,
5,
6,
7,
8,
9,
10,
11]. Therefore, this review focuses on the hidden features of receptor-ligand interactions and the synchronization behind them that have been revealed by the cellular dynamics (CD) simulation study of Dicty. While molecular dynamics (MD) was developed to deal with multi-particle systems, CD is the biological version of MD for multi-cellular systems.
The strength of the CD method is that it allows for a variety of simulation experiments, such as incorporating or inhibiting cell movement, knocking down specific intracellular molecules from molecular networks, changing the diffusion rate of extracellular molecules, etc. Furthermore, it allows for the verification of hypotheses introduced by comparing simulation experiments with biological experiments, enabling more precise investigation of the dynamic mechanisms of biological phenomena. We have developed two types of CD methods: one (CD1)[
12] that deals with the function of cAMP receptor (cAR1) phenomenologically, and the other (CD2)[
13] that includes cAR1 as a G-protein coupled receptor (GPCR) in the molecular network. Here, we first explain the two CD methods in detail, and then introduce the results obtained from their simulation experiments and some of the research that mathematically generalizes the results of the Dicty research.
Before 2000, intracellular information on Dicty was still limited. However, because cAMP was an important molecule that also functioned outside the cell, the identification and quantitative properties of the cAMP receptors (cARs) had already been clarified. The author has already introduced in detail the mathematical model research on Dicty before 2000 in “Modeling the Model Organism
Dictyostelium discoideum”[
14]. The major change since 2000 is that the progress of single-molecule measurement techniques has enriched our knowledge of intracellular molecules, making it possible to incorporate intracellular information into the CD simulations of Dicty cells.
The report of the Belousov-Zhabotinskii (BZ) reaction pattern[
15] in Dicty cell aggregation[
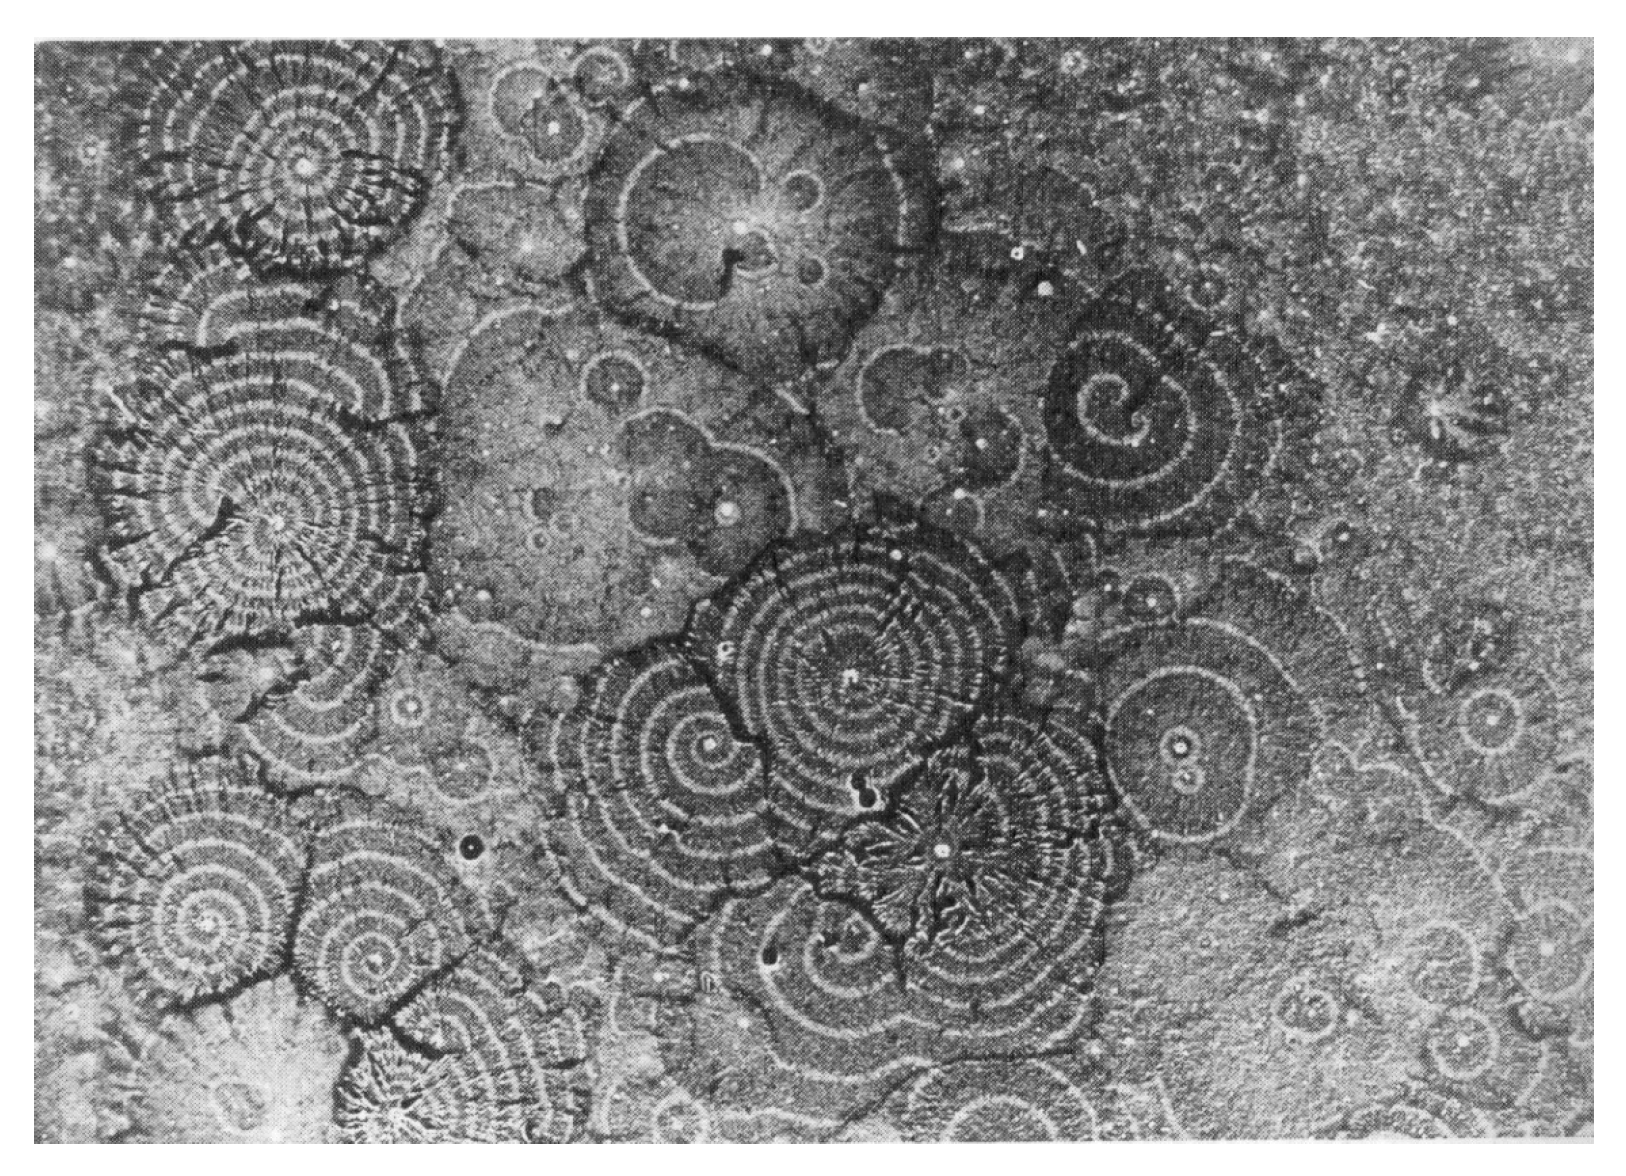
16] was what drew the attention of this organism to people other than biologists as well. It was a great surprise that the periodic chemical reaction patterns observed in flasks also exist in living systems, and the report raised hopes that some universality of life might be hidden there.
Figure 2.
Belousov-Zhabotinskii (BZ) reaction pattern in the aggregation of Dicty cells[
16]. The light and dark bands arise from the different optical properties between moving and stationary amoebas. The cells look bright when moving and dark when stationary. The area is 6cm x 8cm. Photograph is courtesy of Dr. Peter C. Newell.
The BZ reaction is a cyclical chemical reaction. From this, the first thing that caught our attention was the experimental fact that cAMP is secreted outside the cell with a cycle of about 7 minutes[
1] when Dicty cells aggregate. At the same time, we were also interested in the background of how a large number of cells can cooperate to form a huge and beautiful pattern. Slugs, which are multicellular animals, also have mysterious characteristics. That is, there is an upper limit to the number of cells contained in one slug, and when a slug is divided into two, each is then reconstituted as two independent slugs[
17]. This also means that all cells in the slug sense the division in some way. In other words, the slug behaves as an autonomous distributed system that can be divided using a mechanism that we do not know.
In this review, we would like to first introduce the progress of research on the mechanism of cAMP secretion with a cycle of approximately 7 minutes. The next issue is the relationship between intracellular biochemical reactions and intercellular interactions when forming a multicellular system. The CD method, which includes intracellular biochemical reactions, has made a major contribution here. A notable discovery obtained from CD simulations is the discovery of intercellular synchronization of intracellular biochemical reactions[
12]. The key player here is precisely the receptor-ligand interaction. Surprisingly, the mechanism of intercellular synchronization is completely different from conventional mathematical methods. Details will be explained in
Section 9. The essence of the intercellular synchronization method has also been mathematically generalized, making it possible to apply it to engineering.
In this review, limit cycle oscillators[
18] often appear as the basis of theory. The major difference between limit cycle oscillators and other oscillators is that no matter what initial state we adopt, limit cycle oscillators can eventually return to their inherent stable oscillation state. This is highly similar to the concept of homeostasis in biological systems.
2. Cyclic Secretion of cAMP Outside the Cell
Around 2000, it had already been experimentally reported that Dicty secretes cAMP extracellularly in a cycle of about 7 minutes under starvation conditions, but intracellular information was still limited. Nevertheless, several mathematical modelsl[
19,
20,
21] had been proposed to explain this cycle. Among them, Mattiel and Goldbeter’s proposal[
19] (MG model), that the origin of the 7-minute cycle is the turnover between the active and inactive states of the cAMP receptor, still seems to capture the essential aspects of this phenomenon today. Tan and Othmerr[
21] focused on the relationship between adaptation and G proteins, and although they are correct in this respect, their model does not fully align with current experimental results.
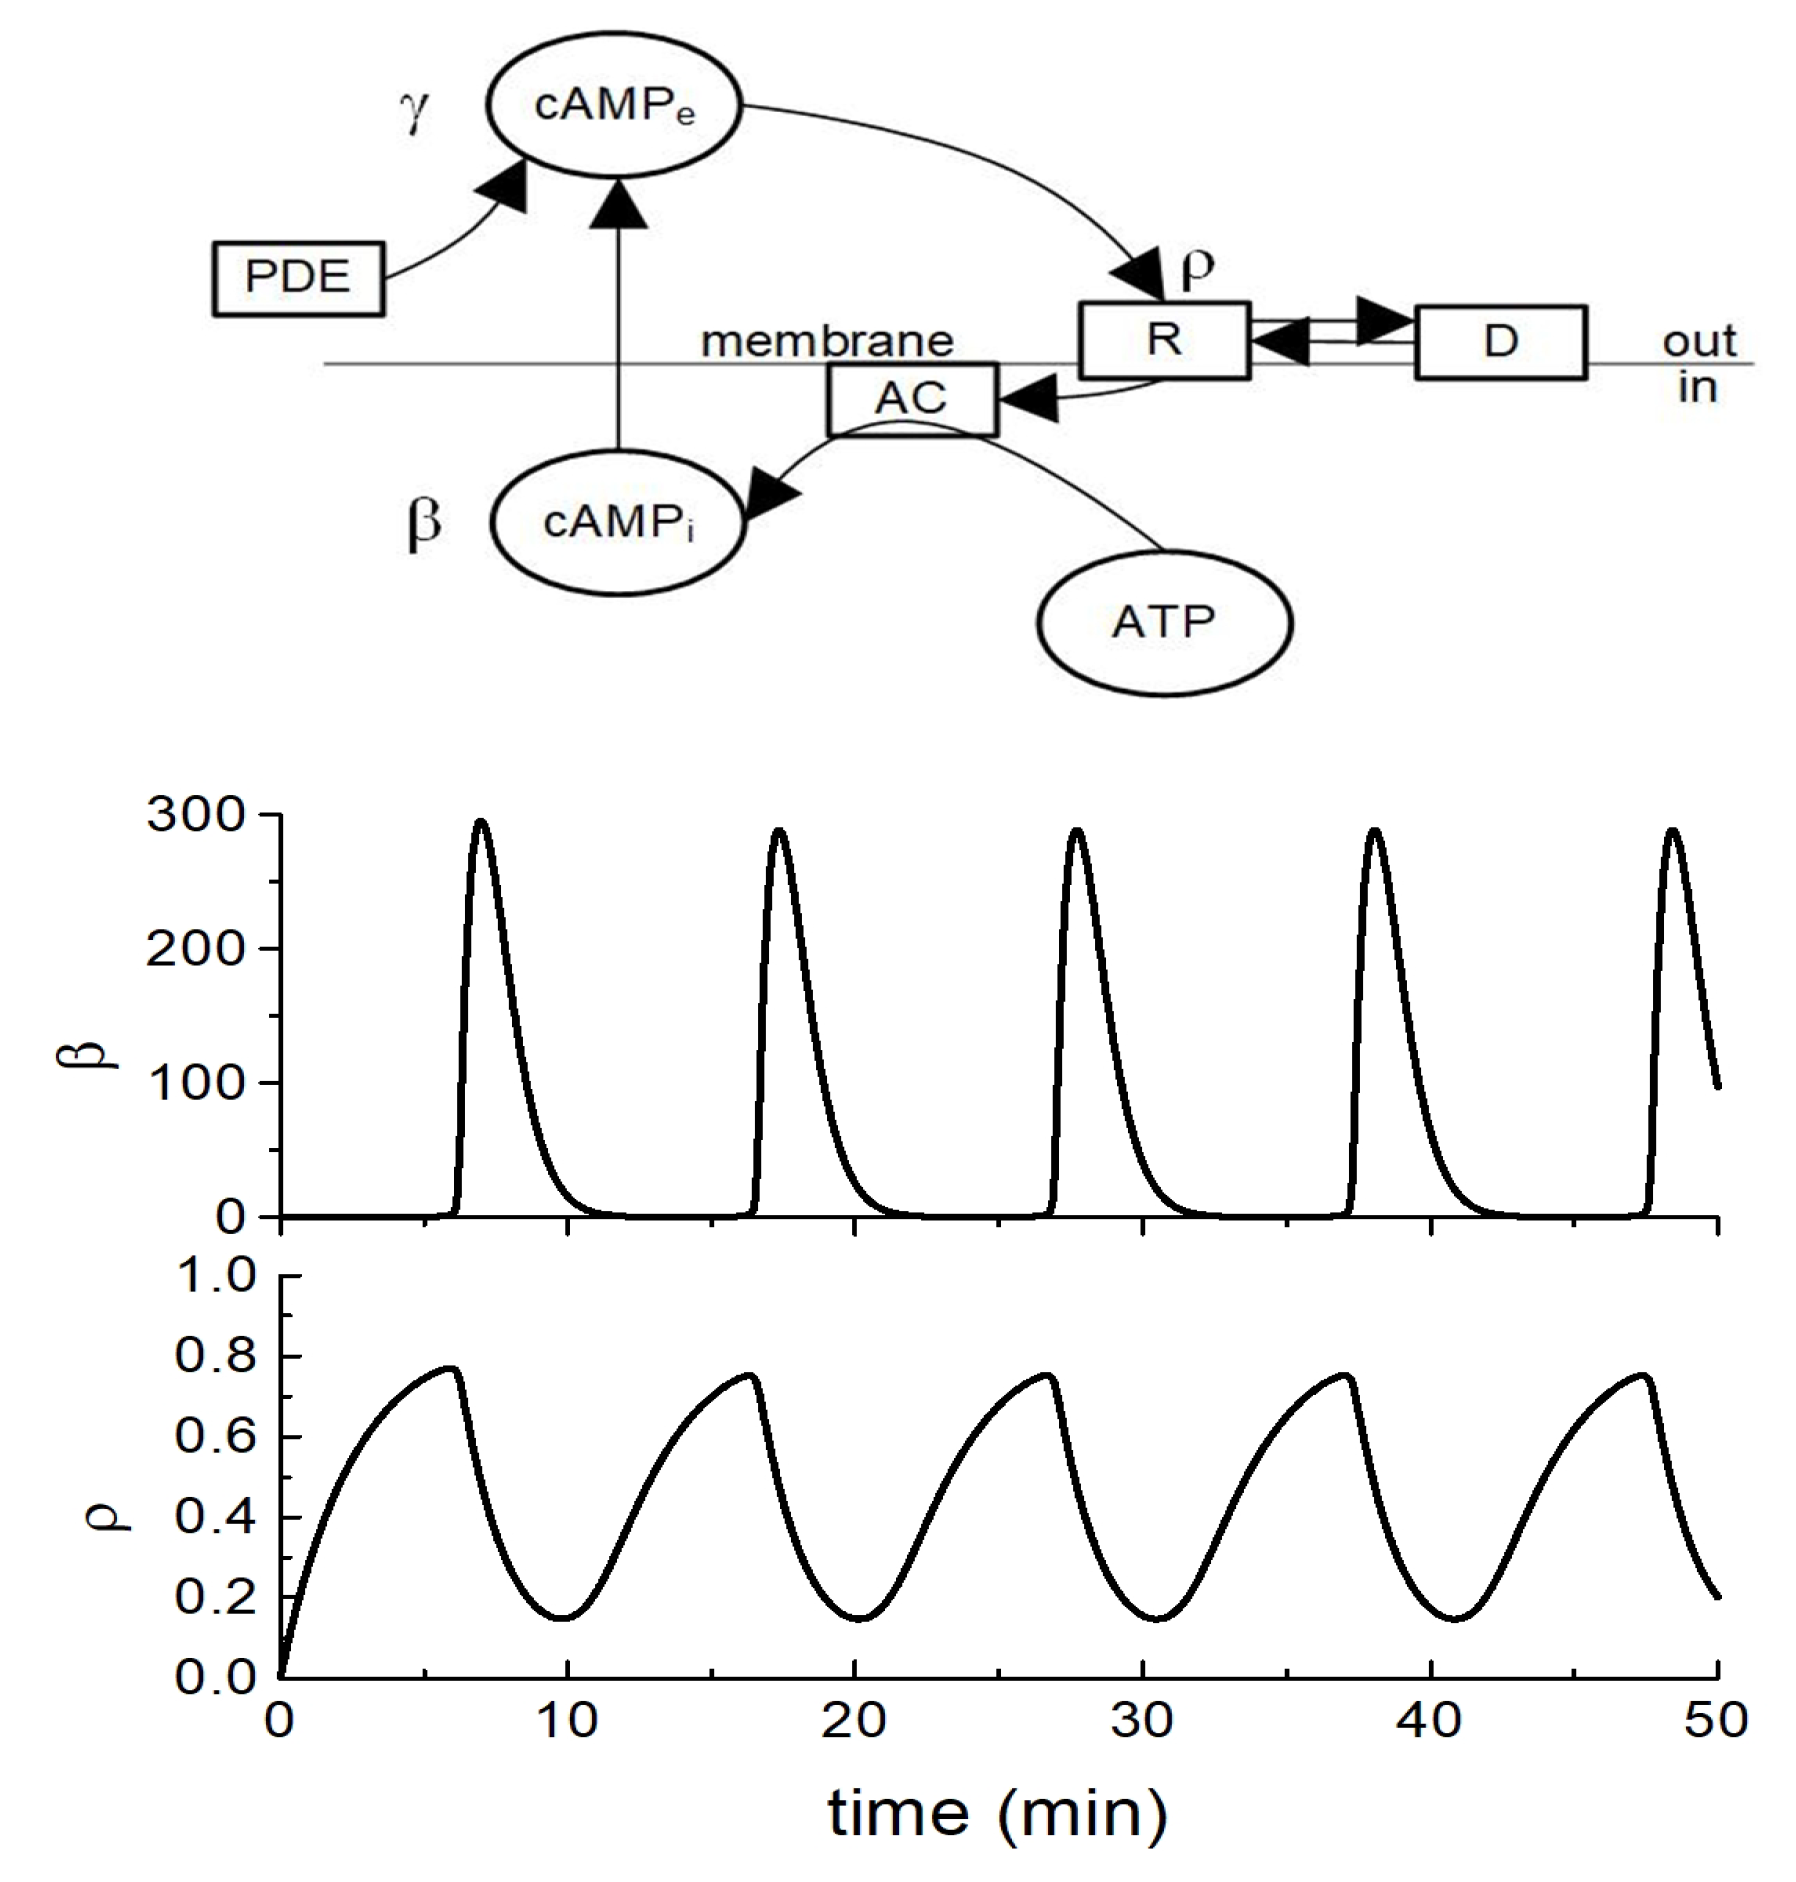
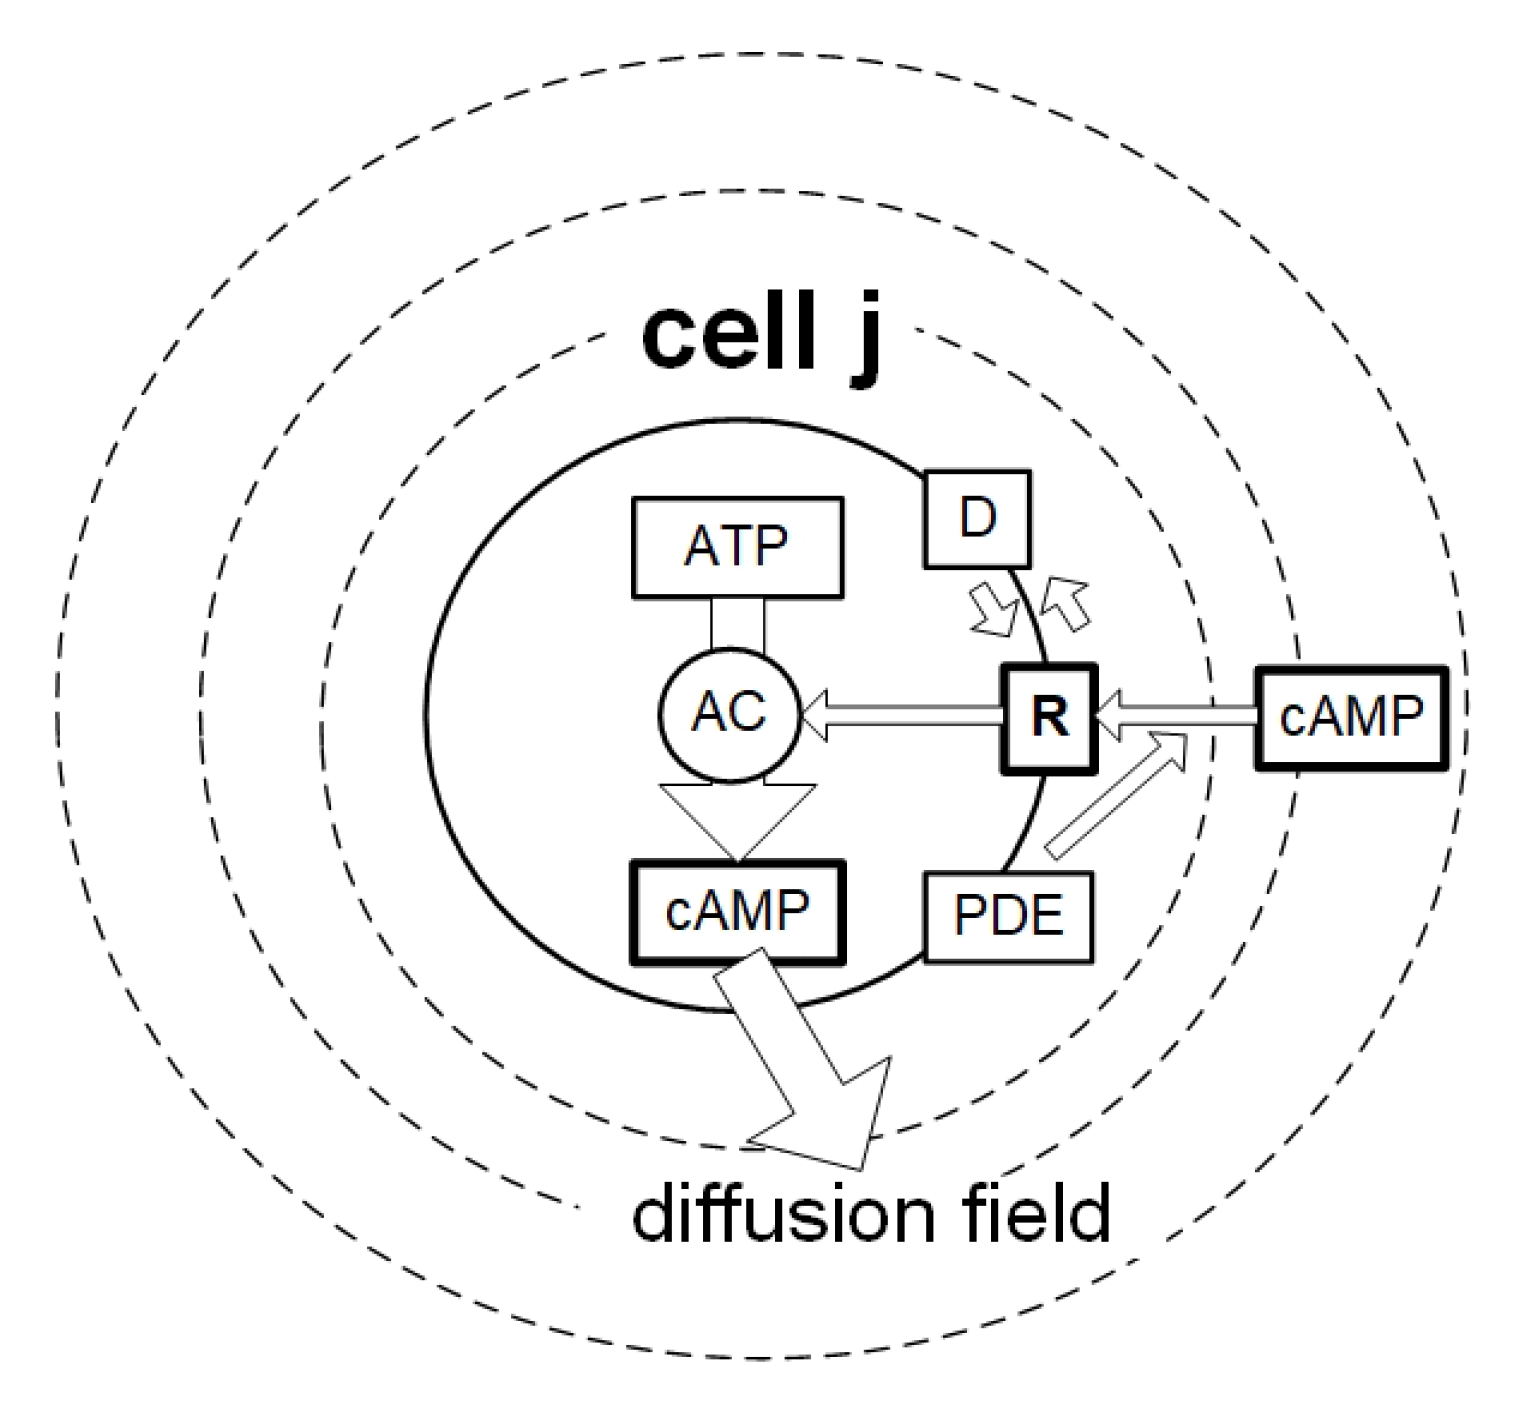
The MG model shown in
Figure 3 is as follows. During starvation, intracelular cAMP (
) is secreted outside the cell at some rate. Binding of the extracellular cAMP to the surface cAMP receptor (R) leads to further activation of adenylate cyclase (AC), and the cAMP is newly synthesized from the intracellular ATP, then secreted to the extracellular medium. A few minutes later, the response ceases as the cells adapt to the persistent stimulation. When extracellular cAMP is destroyed by the cAMP phosphodiesterase (PDE), this stimulus can be removed, then the cells resensitize, and the next cycle is initiated a few minutes later. The cAMP receptor oscillates between two interconvertible forms designated R and D in parallel with the oscillations in cAMP synthesis, where D is the modified desensitized receptor. Stimulation with cAMP converts the R form to the D form.
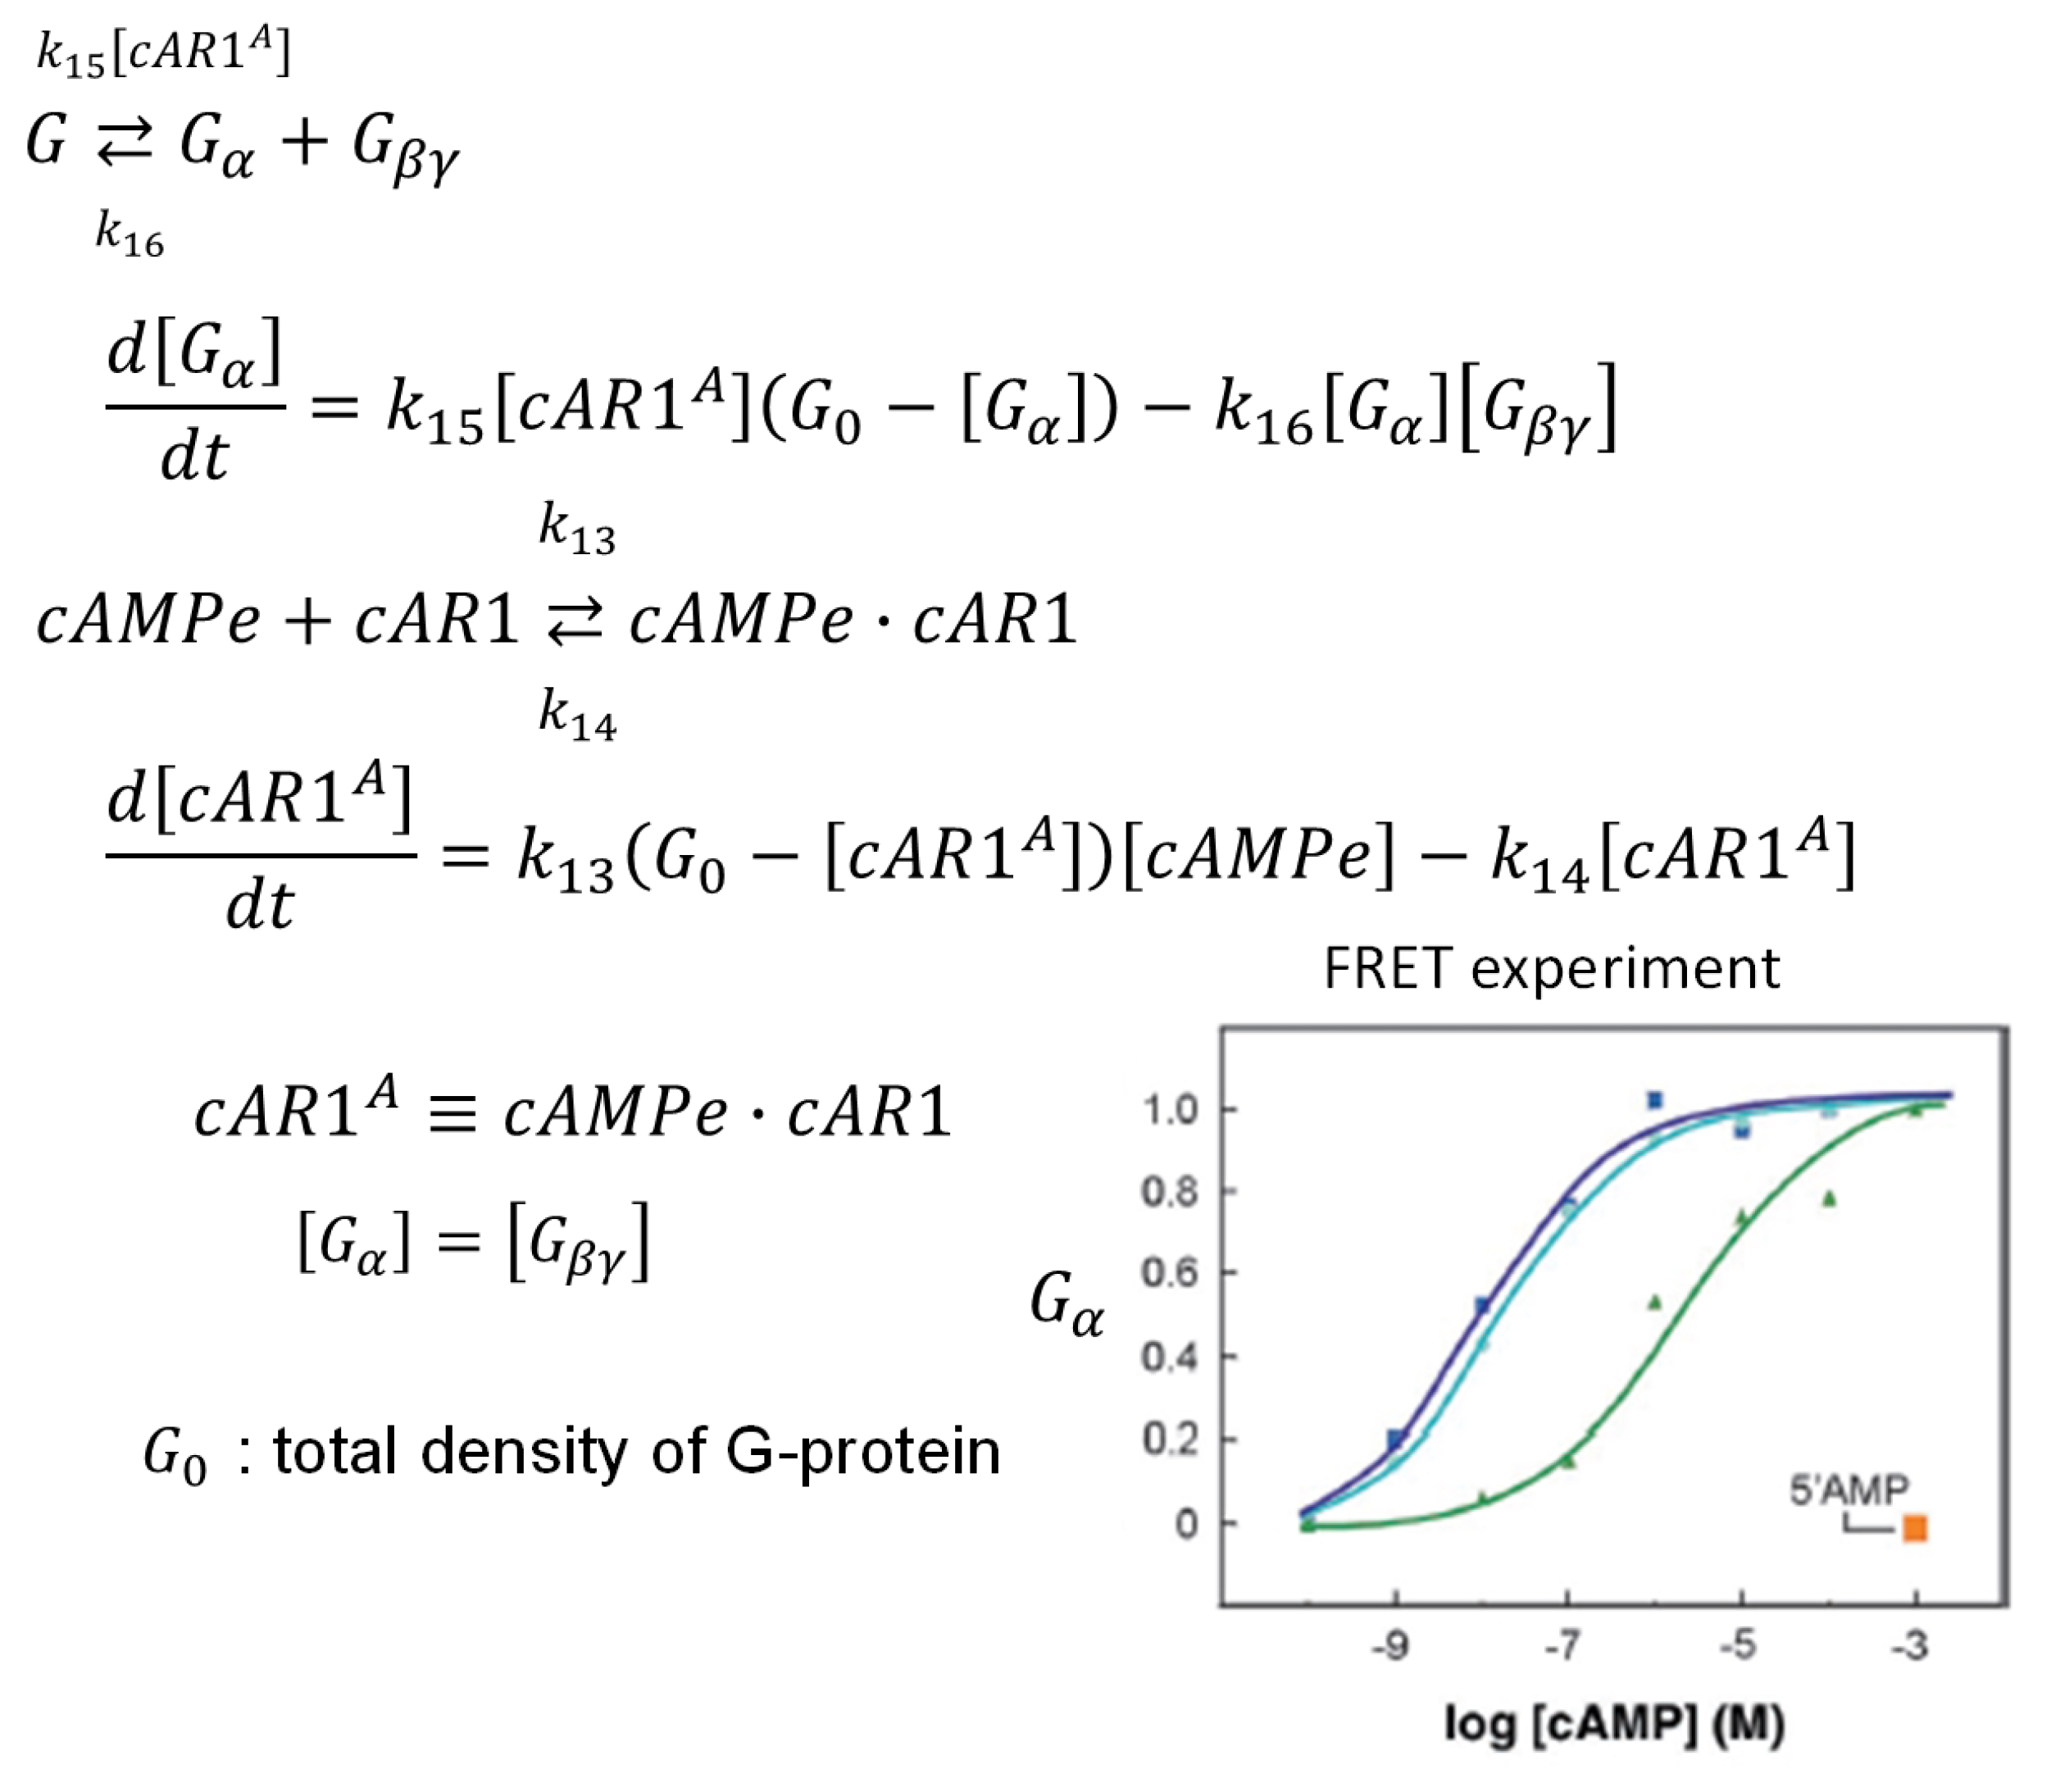
After their model was proposed, Dicty’s biochemical knowledge gradually increased over time. In 2001, Janetopoulos et al.[
22] found that there was a hysteresis effect on the density of the G protein subunit
as shown in the inset in
Figure 4. The rate equation for [G] shows that as the cAMP concentration increases,
increases in proportion to
, resulting in a gradual decrease in the rate of increase, while the rate of decrease is proportional to
, causing a rapid decrease in
, which results in the reported hysteresis phenomenon[
13].
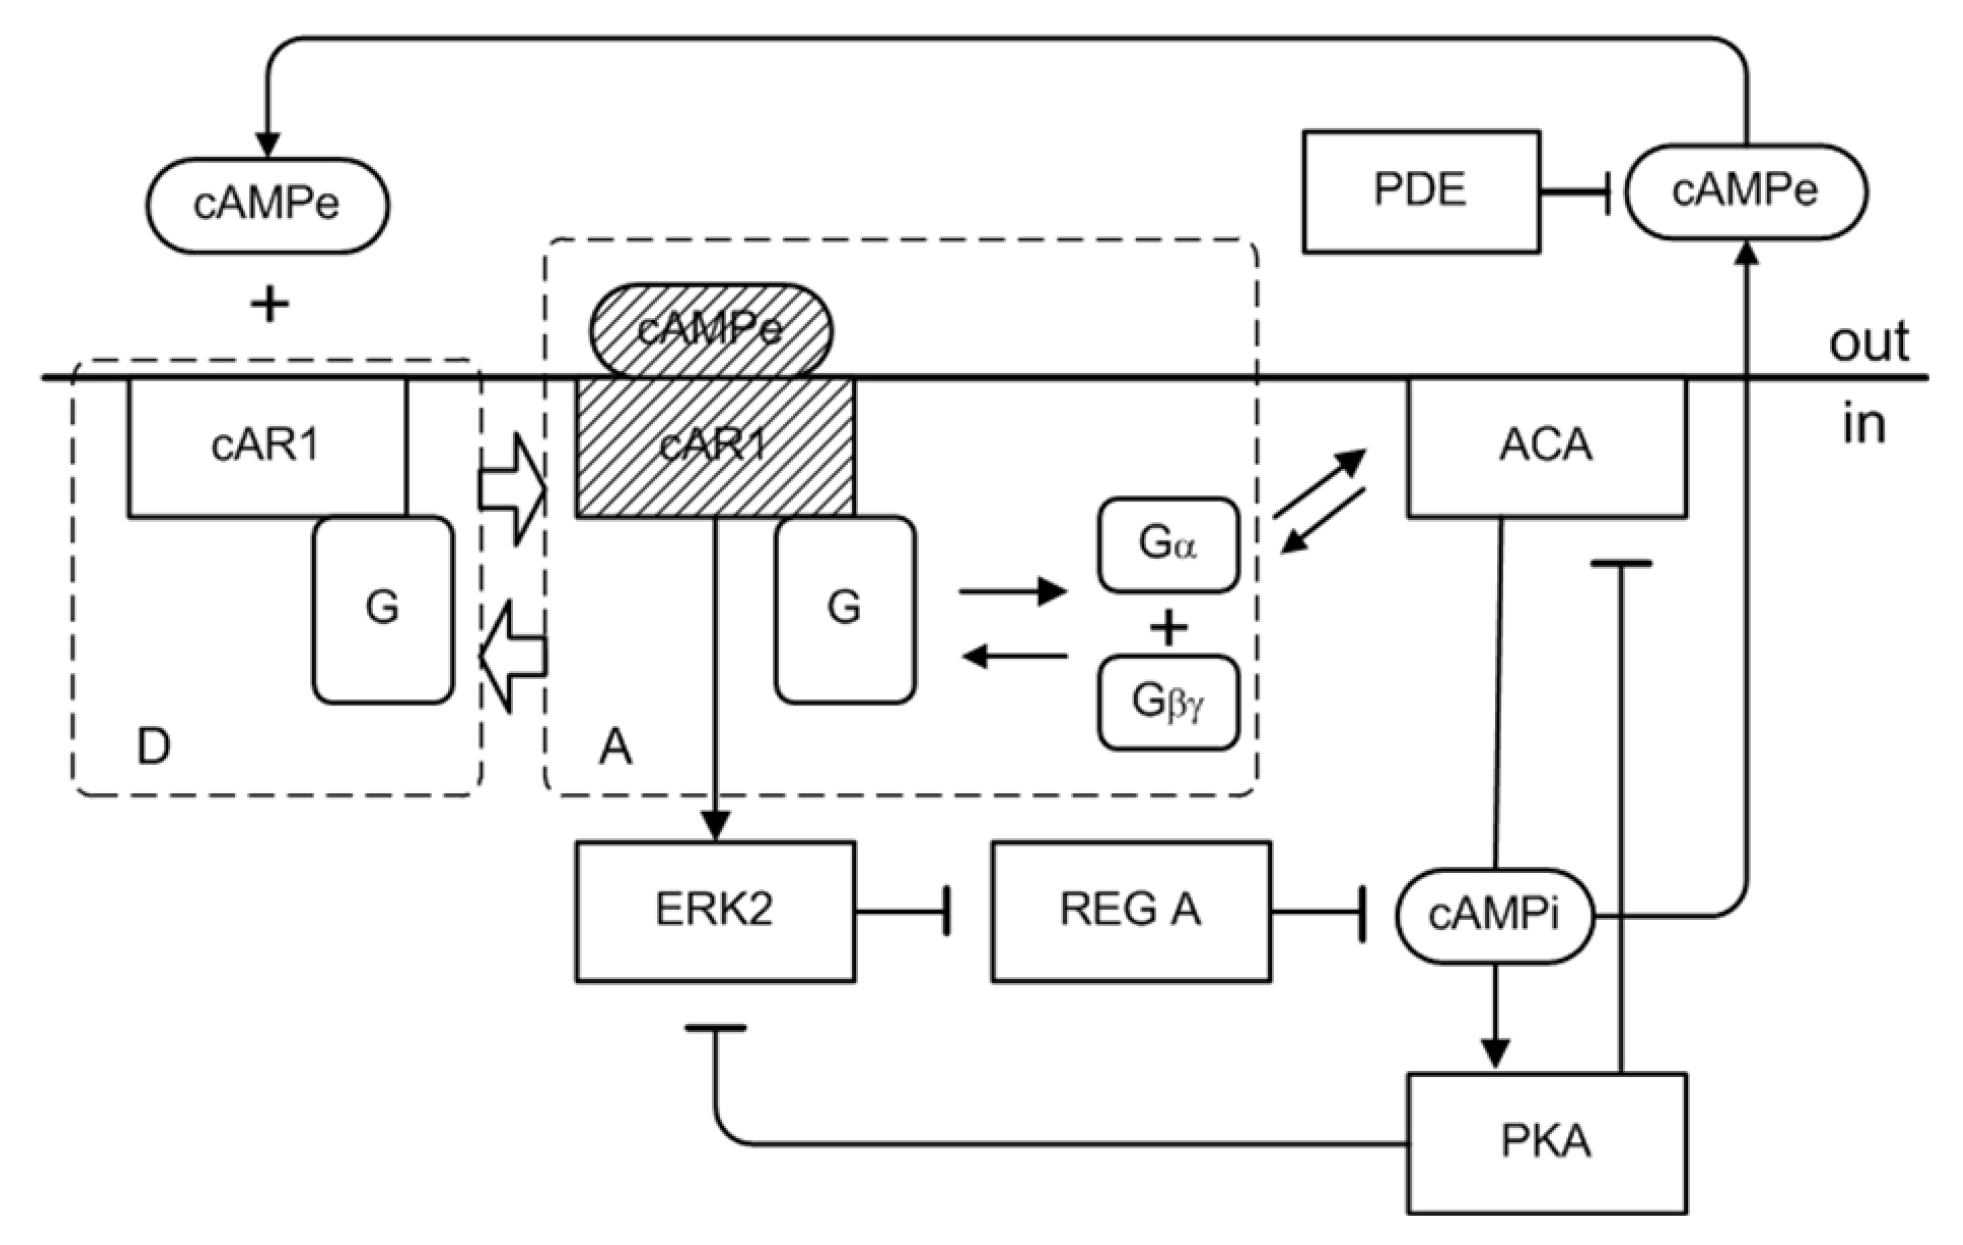
Combined with other experimental information, we could construct a molecular network like the one shown in
Figure 5[
13].
The scheme shown in
Figure 5 is as follows. The binding of cAMPe to the cAMP receptor (cAR1) triggers a conformational change in cAR1. This is accompanied by the exchange of GDP for GTP on its G
subunit followed by the dissociation of the heterotrimeric G-protein into G
and G
subunits. ACA is activated by G
for cAMP production, and ERK2 is also activated by ligand-bound cAR1. cAMPi activates cAMP-dependent protein kinase A (PKA), which in turn inhibits the mitogen-activated protein (MAP) kinase (ERK2) and ACA activation, while RegA degrades cAMPi. cAMPi is secreted out of the cell as cAMPe, where it binds to cAR1 or it is degraded by the extracellular phosphodiesterase (PDE).
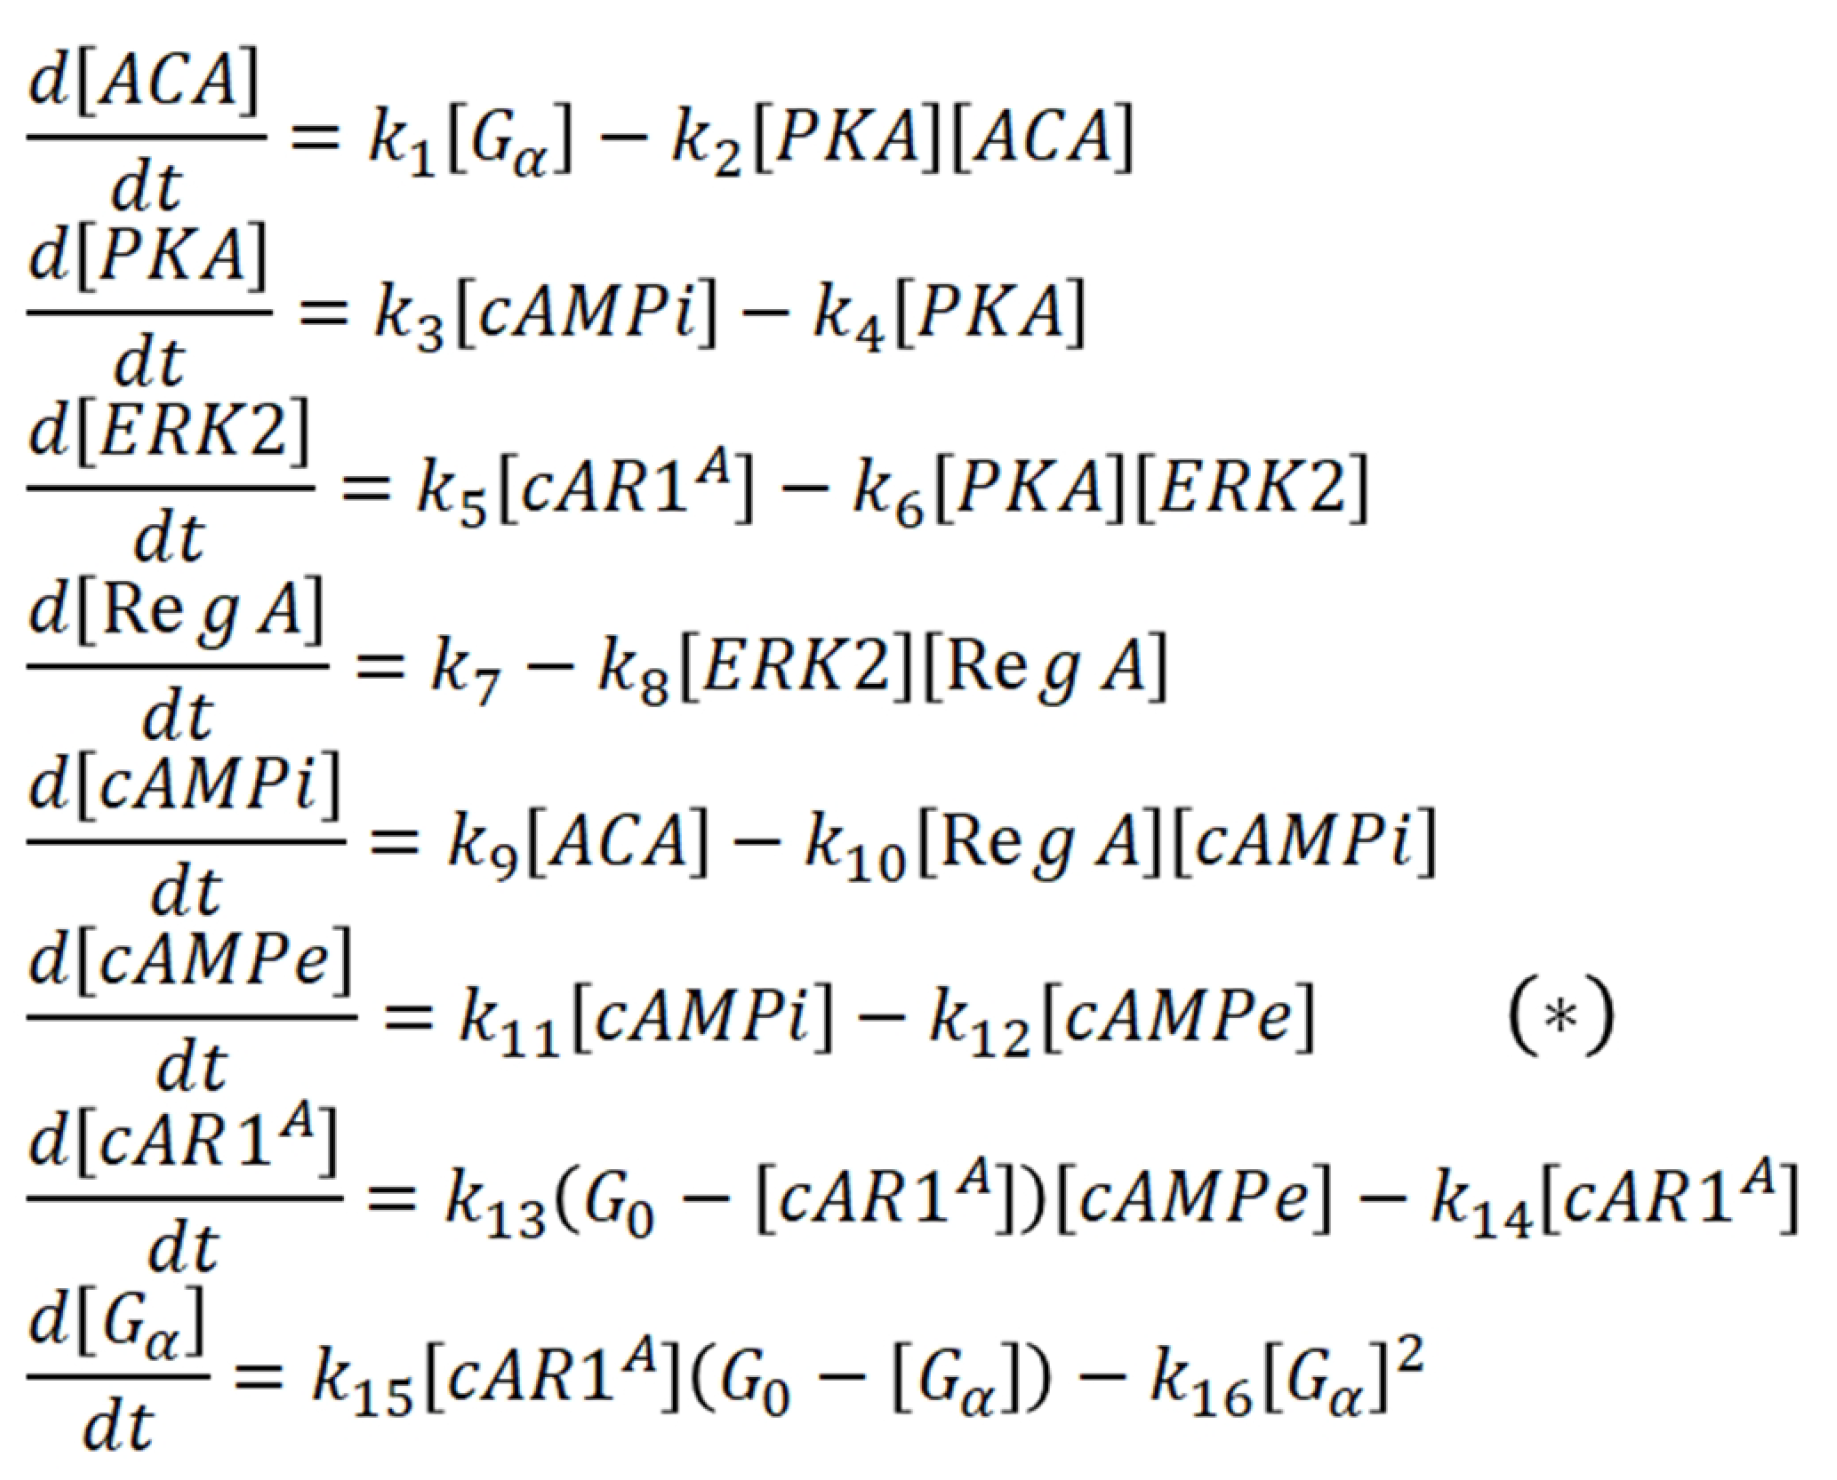
A set of rate equations corresponding to the scheme in
Figure 5 is shown in
Figure 6.
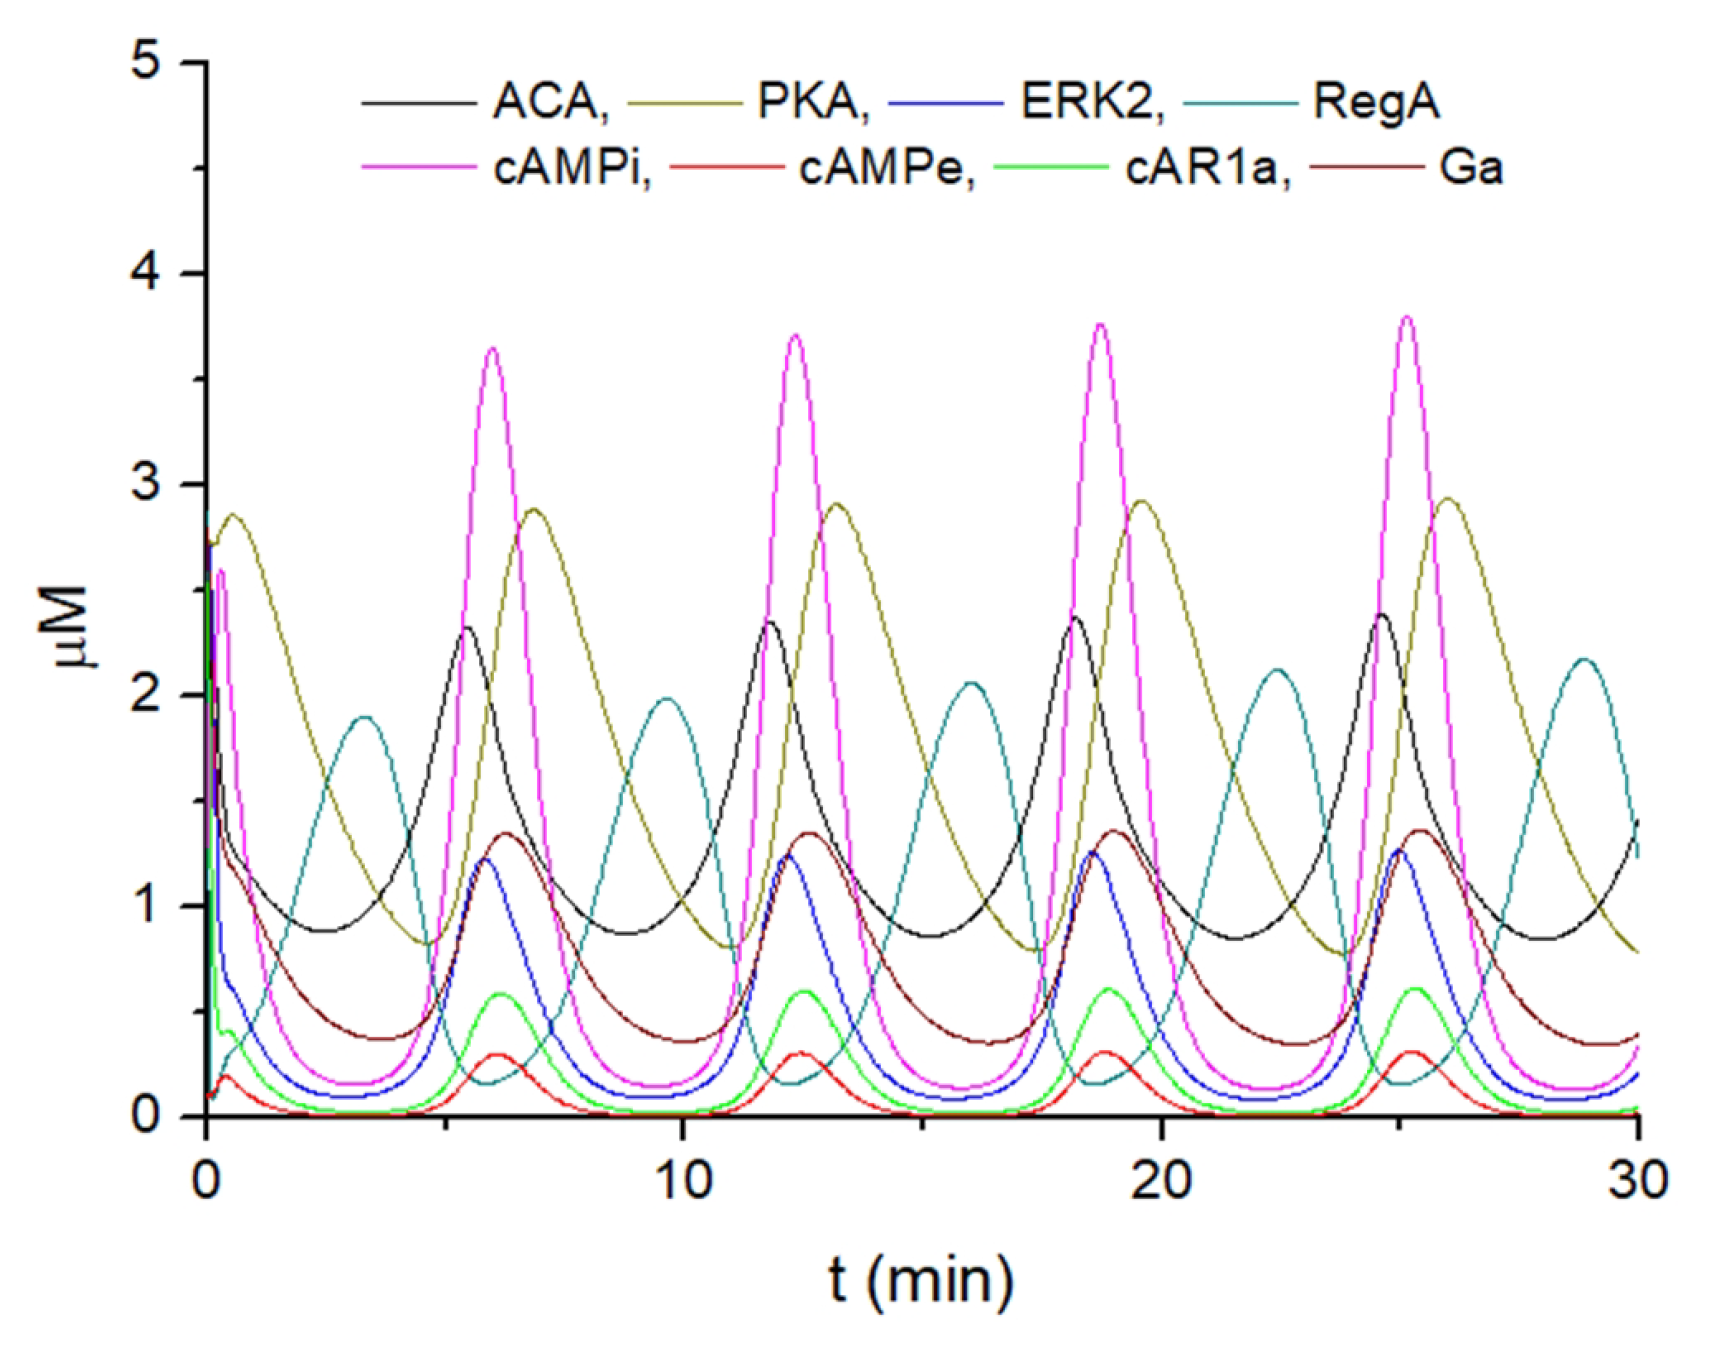
Their numerical calculations, shown in
Figure 7, demonstrate that our molecular network can reproduce the periodicity of cAMP production reported in experiments.
Figure 6 shows a closed set of rate equations, and no special functions were introduced to reproduce the 7-min period of cAMP production. On the other hand, in the case of the MG model, due to the lack of intracellular information, it was necessary to introduce phenomenological functions to reproduce the 7-min period. The alternation of state D in the dotted square (undissociated state of G-protein) and state A in the dotted square (dissociated state of G-protein) in
Figure 5 generates the periodicity of cAMP concentration. This corresponds to the molecular explanation for introducing two states R and D into the cAMP receptor in the MG model in
Figure 3.
Maeda et al.[
23] reported that they could reproduce the periodicity of cAMP production using a molecular network that did not include G protein dynamics. However, their numerical calculations showed a problem that the increase in extracellular cAMP concentration precedes the increase in intracellular cAMP concentration. We investigated this problem in detail, but could not solve it without introducing a phenomenological function that mimics the G protein dynamics in the molecular network[
24] or including the G protein dynamics in the molecular network as shown in
Figure 4.
3. Cellular Dynamics Simulations of Dictyostelium Discoideum
To investigate the dynamic behavior of individual cells, including intracellular biochemical reactions, we first change the horizontally drawn cell membrane to a circular closed cell membrane, and confine the location of biochemical reactions to the inside surrounded by the cell membrane, as shown in
Figure 8 .
Then, cAMP produced inside the cell is secreted outside the cell, forming a cAMP diffusion field. Meanwhile, the cAMP receptor senses the extracellular cAMP concentration and adjusts the biochemical reactions within the cell. At the same time, each cell moves within a field of forces acting on it. This is the overall picture of the CD methods[
12,
13]. For the biochemical reactions within the cell, the phenomenological MG model in
Figure 3 (CD1) or the molecular network in
Figure 6 (CD2) is adopted.
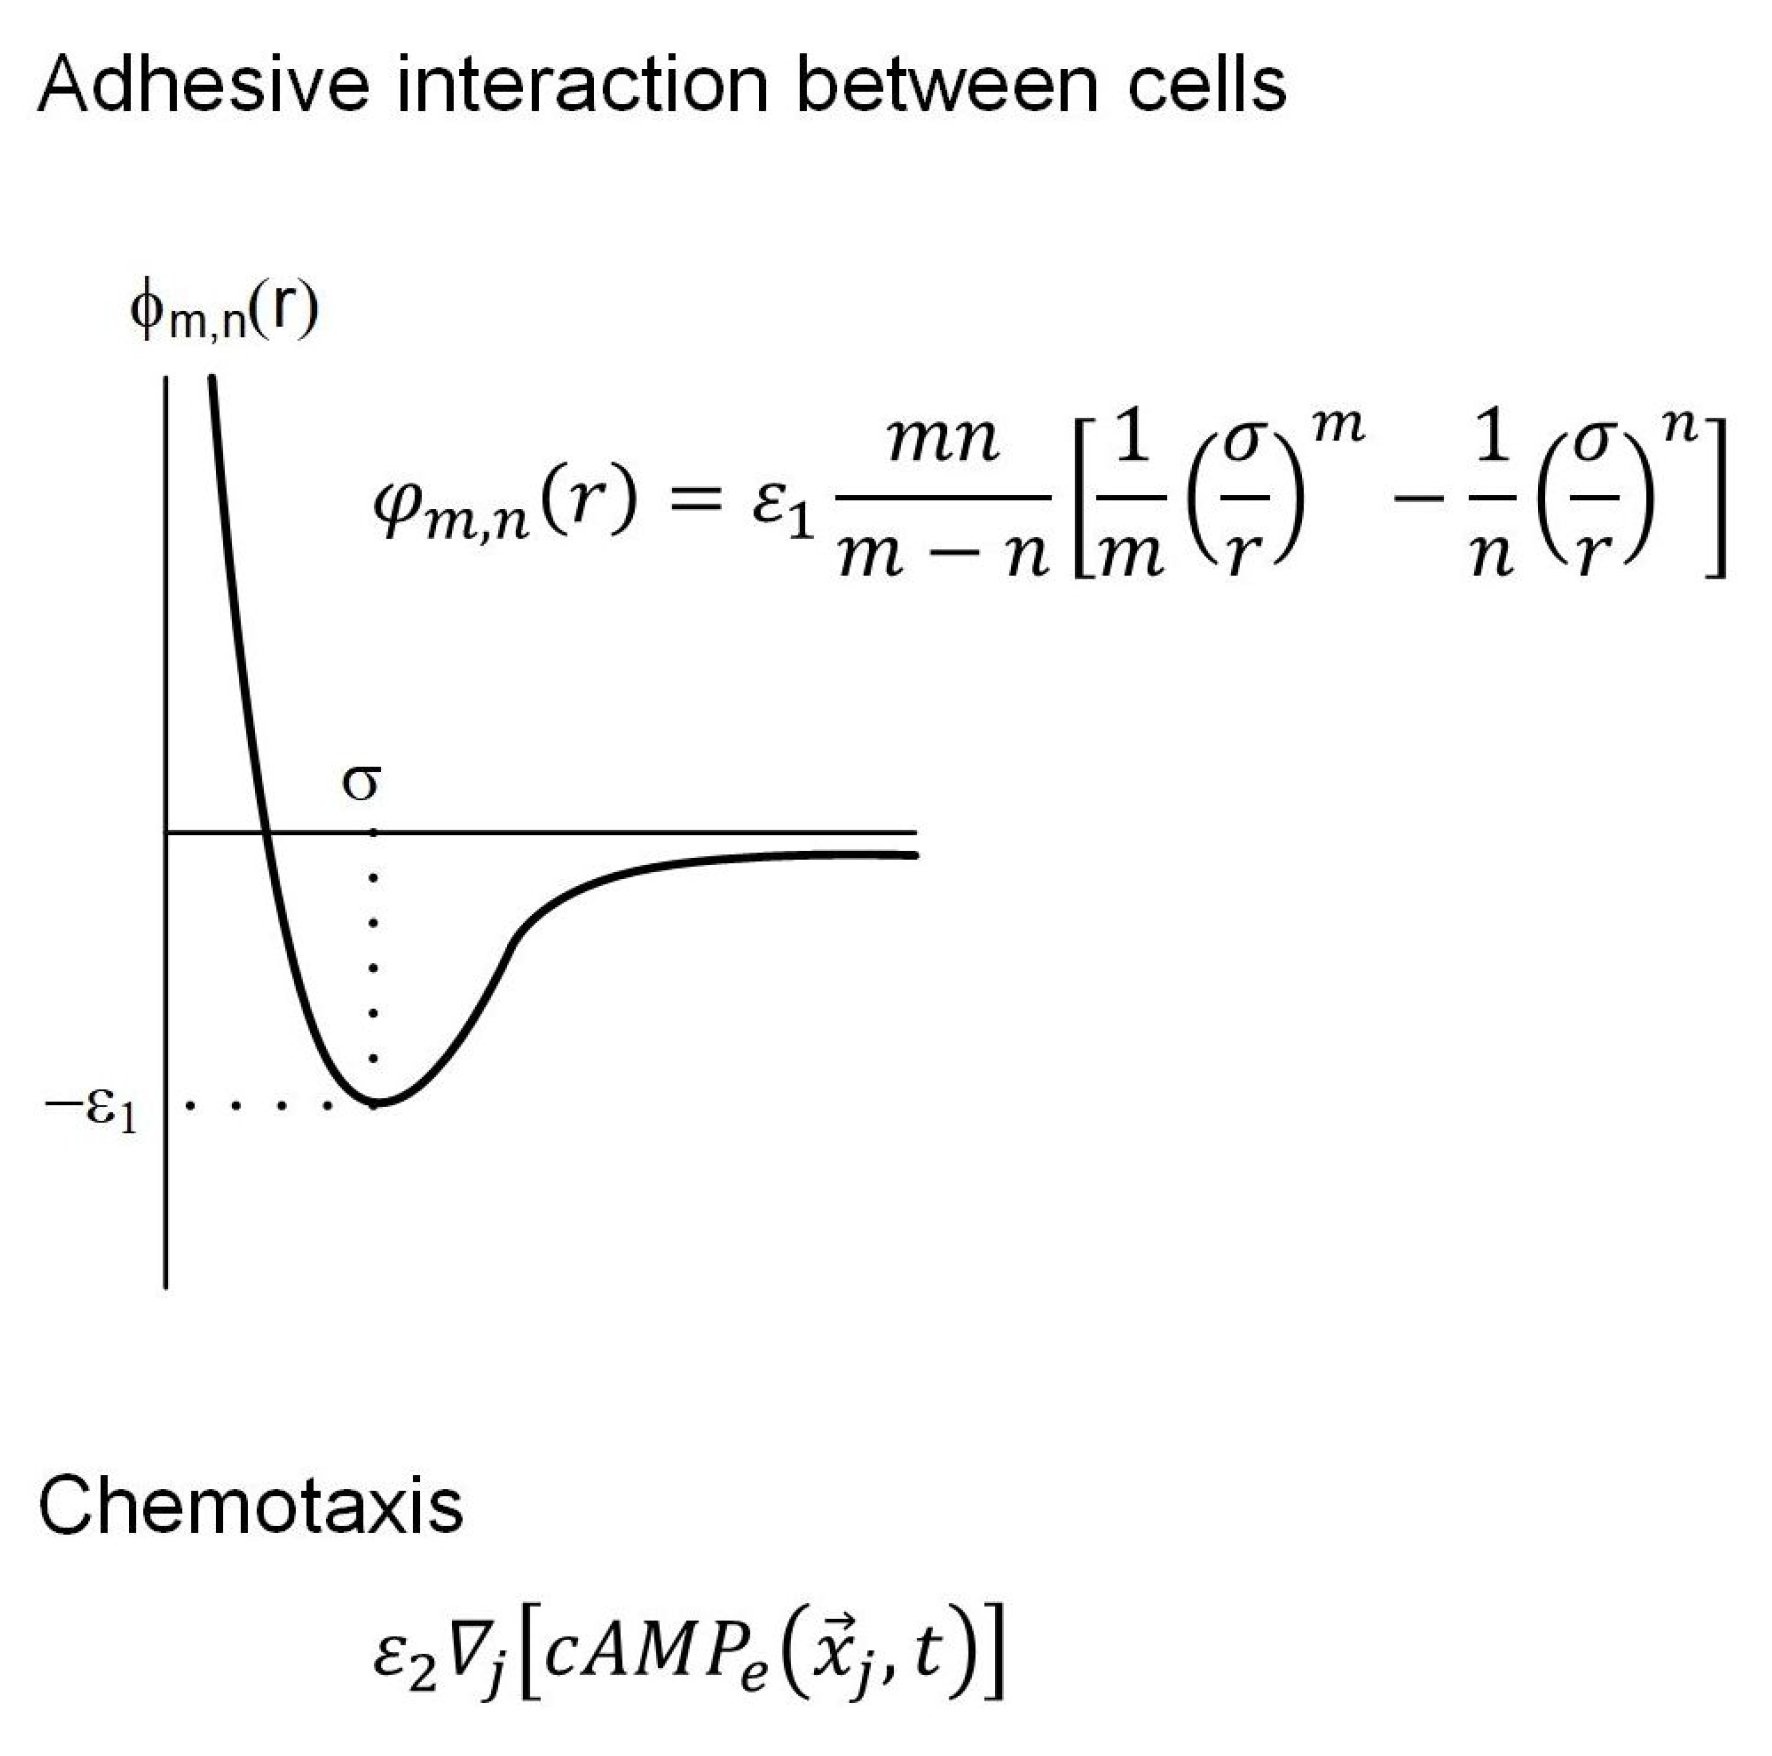
There are two types of forces that act on cells. One is adhesive force. It is known that when cells are in a state of starvation, adhesion molecules[
25] are secreted onto the cell surface, making the cells adhesive. This force acts only when cells are in contact with each other, so it is a short-range force and can be treated as a Lennard-Jones type interaction. The other force is chemotactic force[
26]. Each cell has the tendency to move in the direction of higher cAMP density. This force acts even when cells are far apart, so it is a long-range force.
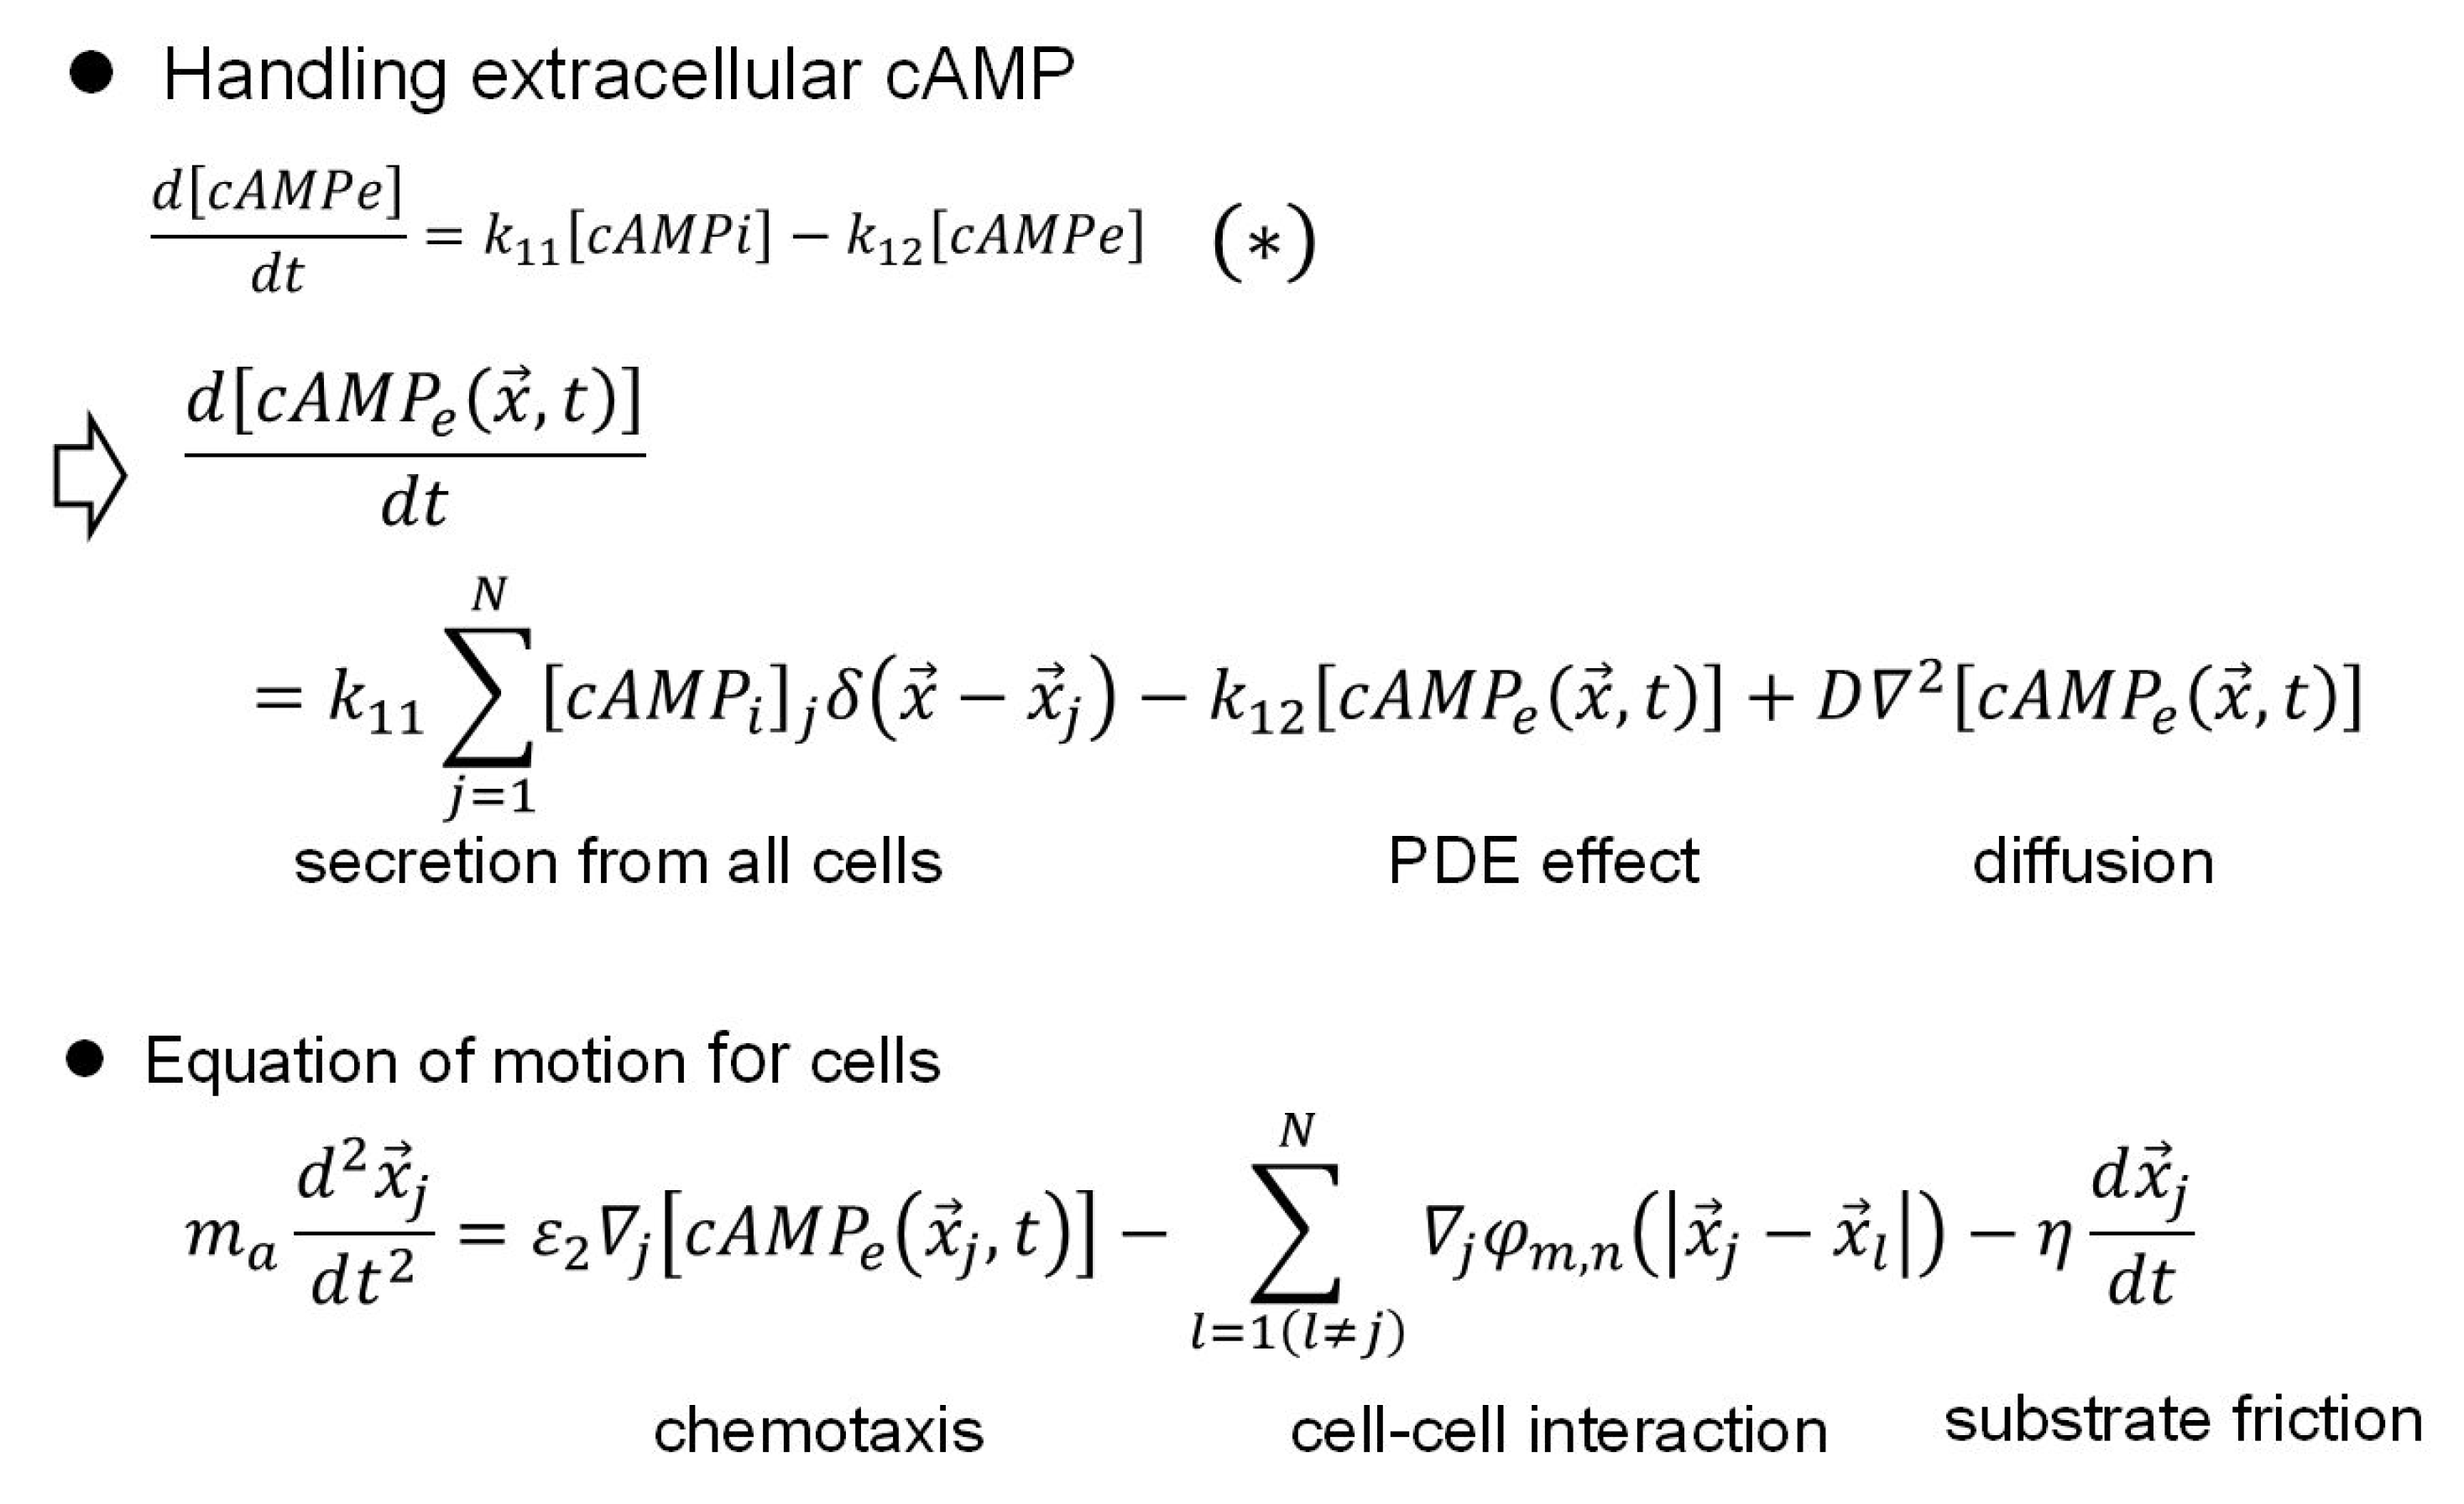
On the other hand, the extracellular cAMP field is formed by the superposition of cAMP secreted from individual cells and diffused outside the cell. To do this, we need to change the formula marked with (*) in
Figure 6 to the formula in
Figure 10. As a result, cAMP secreted from each cell diffuses, and the cAMP concentration at any given location can be calculated. The equations of motion for individual cells are also shown in
Figure 10.
The cAMP produced in cell j at position is secreted outside the cell with a leakage rate . After that, cAMP is phosphorylated by PDE or diffuses into the medium. This process is carried out in all cells, and the density of cAMP sensed by cell j, , is determined. Cell movement is determined by two force fields: chemotaxis, a long-range force that acts according to the concentration gradient of cAMP concentration sensed by each cell, and short-range force, which is the adhesion force between cells. In addition, when cells move, they are also subjected to friction from the medium.
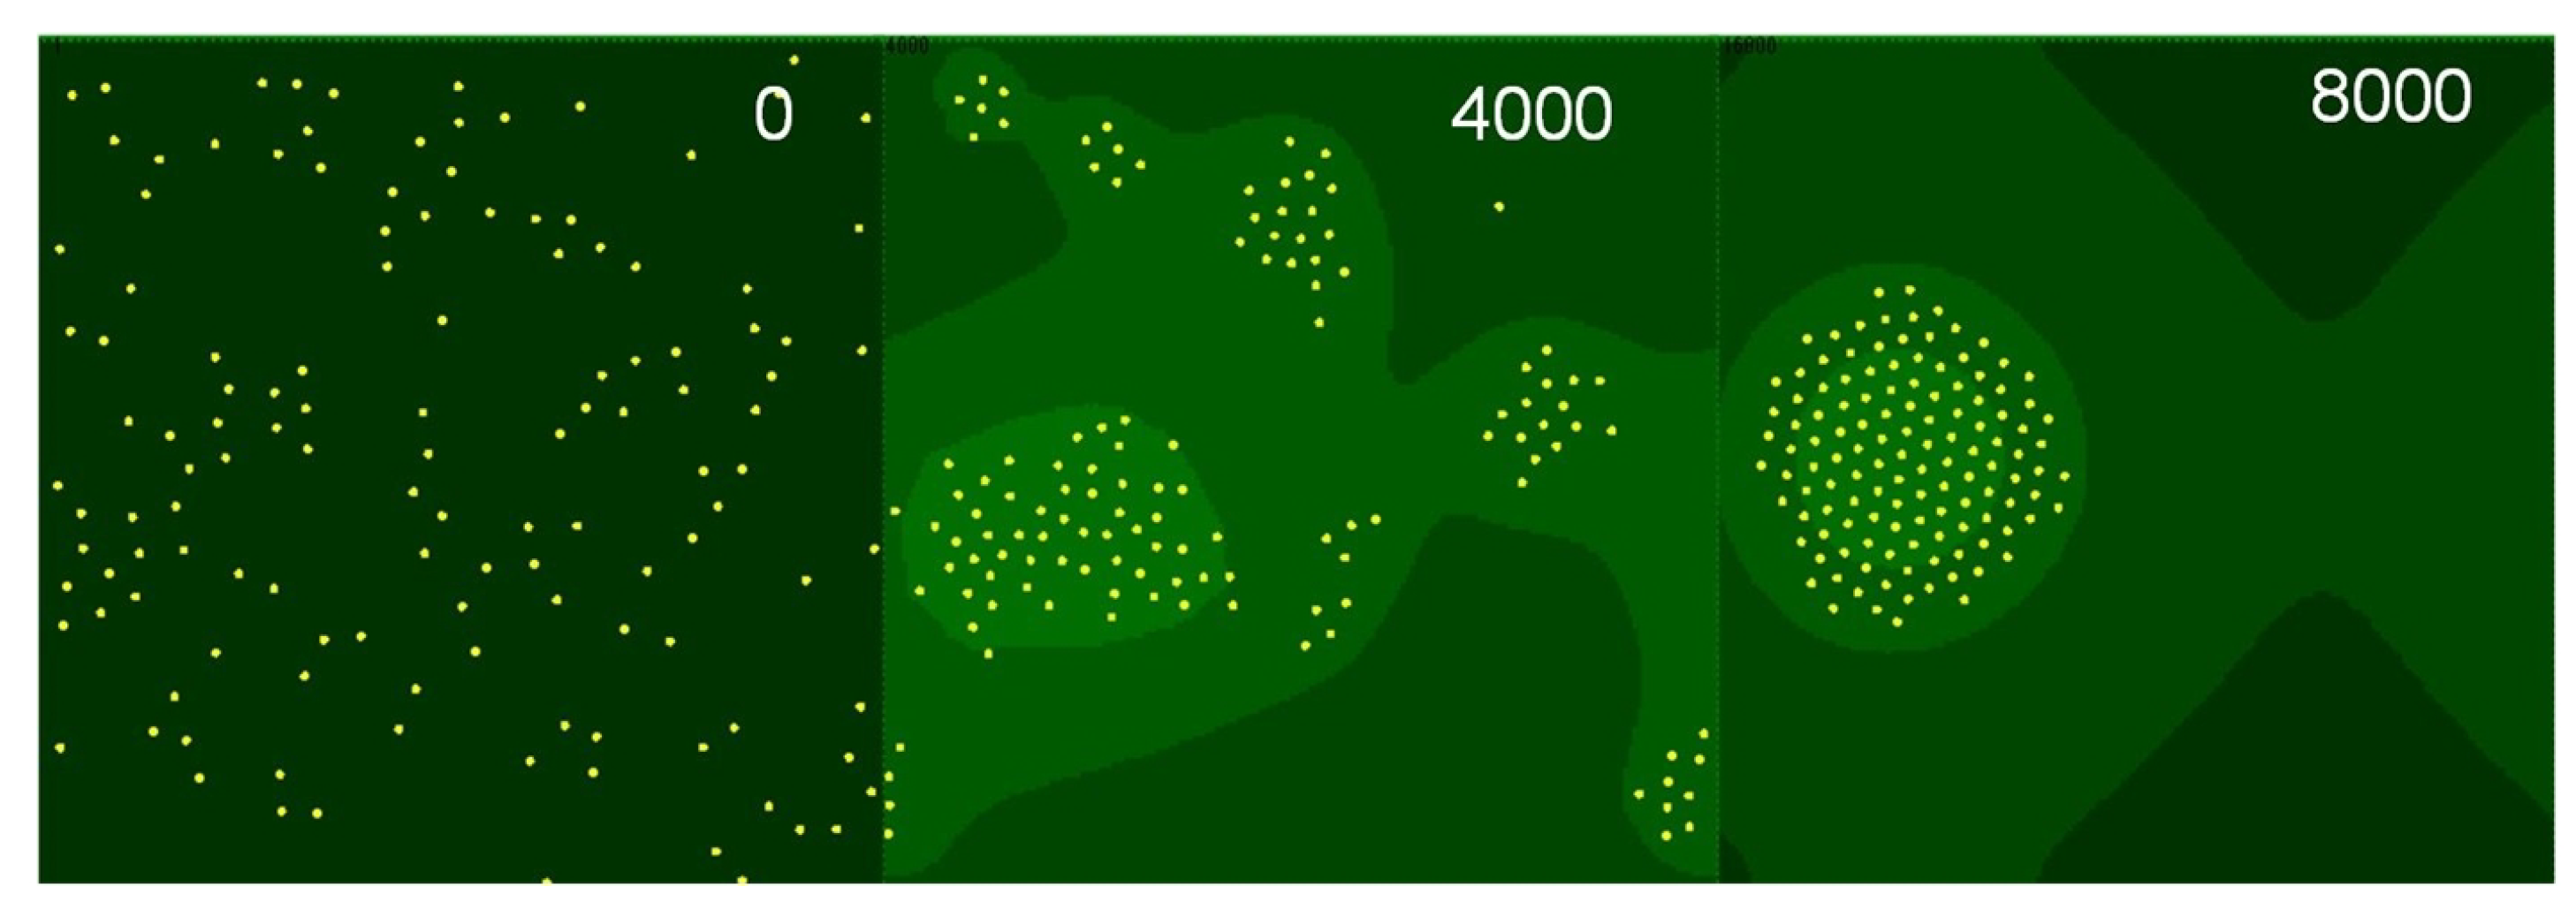
A sample case of the simulation study is shown in
Figure 11. Each cell moves while secreting cAMP outside the cell, forming a cAMP diffusion field that changes as the cell arrangement changes. This cAMP diffusion field is sensed by the cAMP receptor, and if the sensed concentration of extracellular cAMP is too high, cAMP production is reduced inside the cell, and conversely, if it is too low, it is produced more, and the amount of cAMP secreted outside the cell is constantly adjusted. At the same time, each cell chemotactically moves toward the higher cAMP concentration, and when the cells get close enough to each other, they stick together by the adhesive substances on the cell surface. In cell aggregation, this process is carried out continuously over time. In the case of CD1, the key to regulating intracellular cAMP production is the switching between the R and D states of the cAMP receptor shown in
Figure 3, and in the case of CD2, it is the coordinated reaction between cAR1 and G protein shown in
Figure 4.
When the MG model is adopted in cells (CD1), only wild-type strains can be treated. In that case, the simulation results using CD1 and CD2 are similar. However, when the molecular network of
Figure 5 is adopted (CD2), it is also possible to compare with experiments in which a specific molecule is knocked down..
4. Robustness of Cell Aggregation and Cell-Cell Synchronization
For those with experience in MD simulations of multi-particle systems, Dicty’s cell aggregation seemed too efficient. In general, the interactions between particles become weaker with distance, so as the aggregate grows larger, the energy difference between different particle configurations on the periphery of the aggregate becomes smaller, making it more difficult to neatly align the particles. In contrast, in Dicty, the cells within the aggregate always remained neatly aligned, even when the number of cells was increased as much as possible.
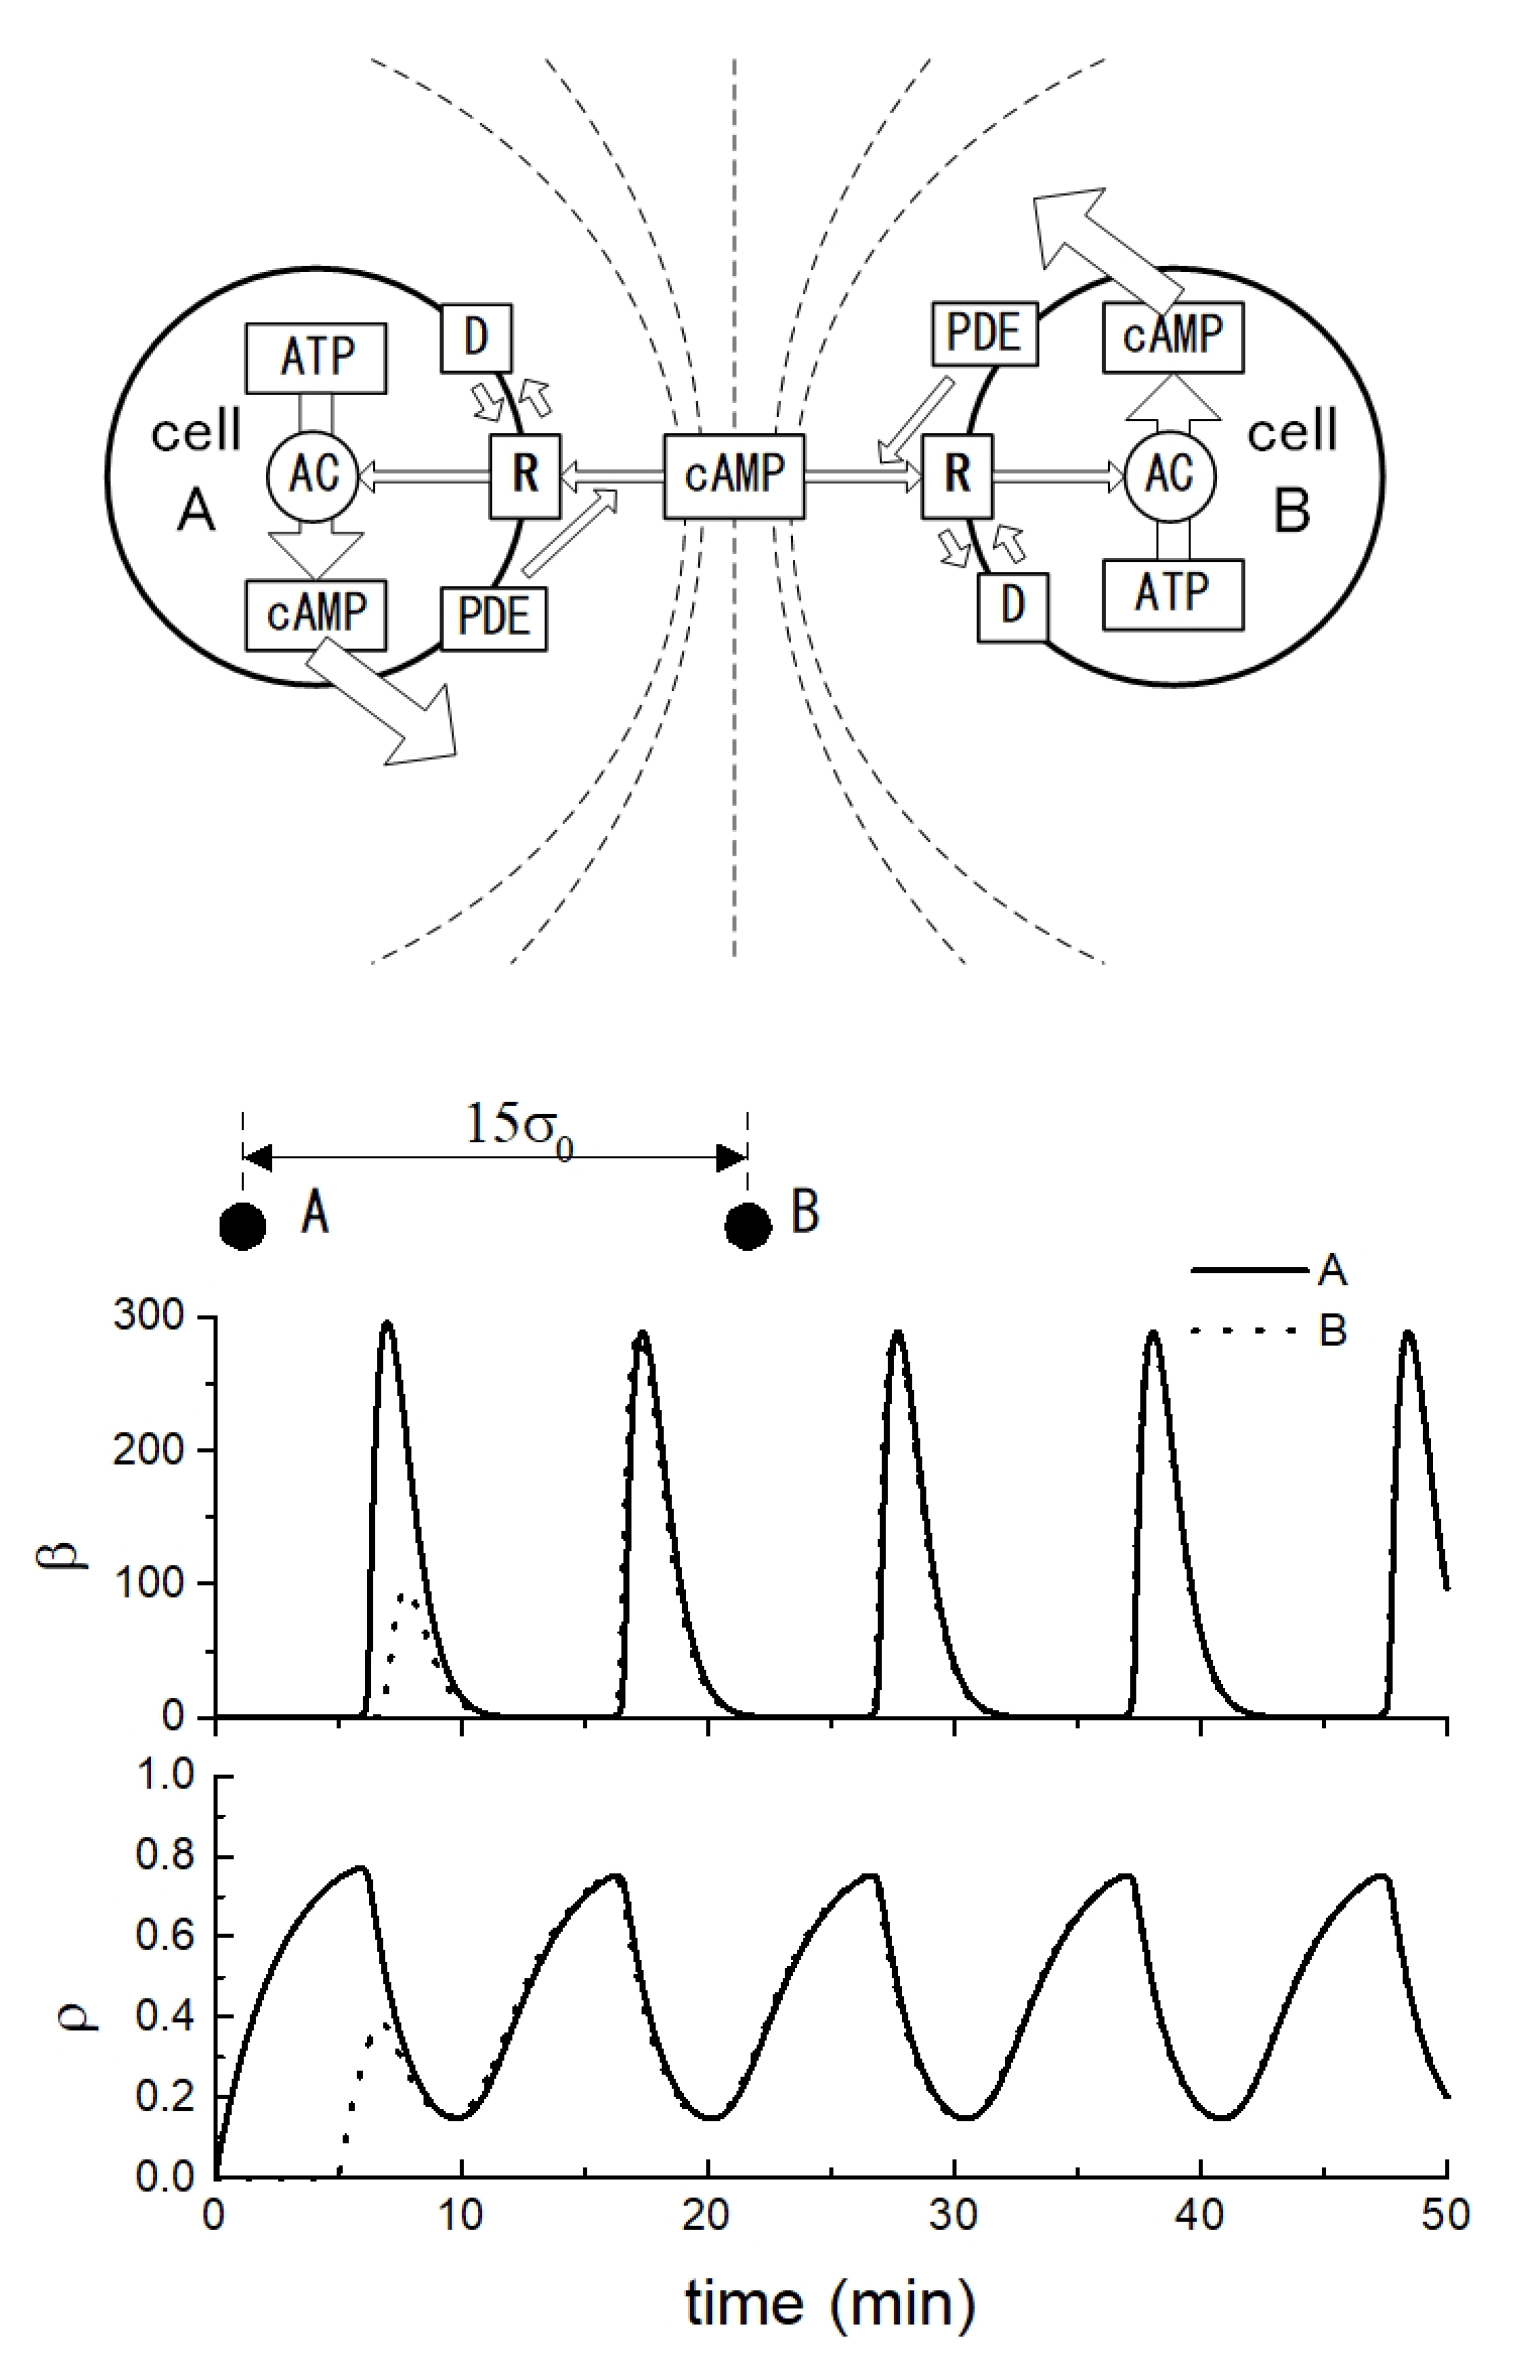
We therefore performed a computational experiment using CD in which two cells were stopped at a distance of 15 times the cell diameter and biochemical reactions in each cell were started with a 5-minute difference. As a result, we discovered that the intracellular biochemical reactions were synchronized between the cells[
12], as shown in
Figure 12. In other words, it was revealed that the synchronization phenomenon is behind the efficient aggregation of Dicty cells.
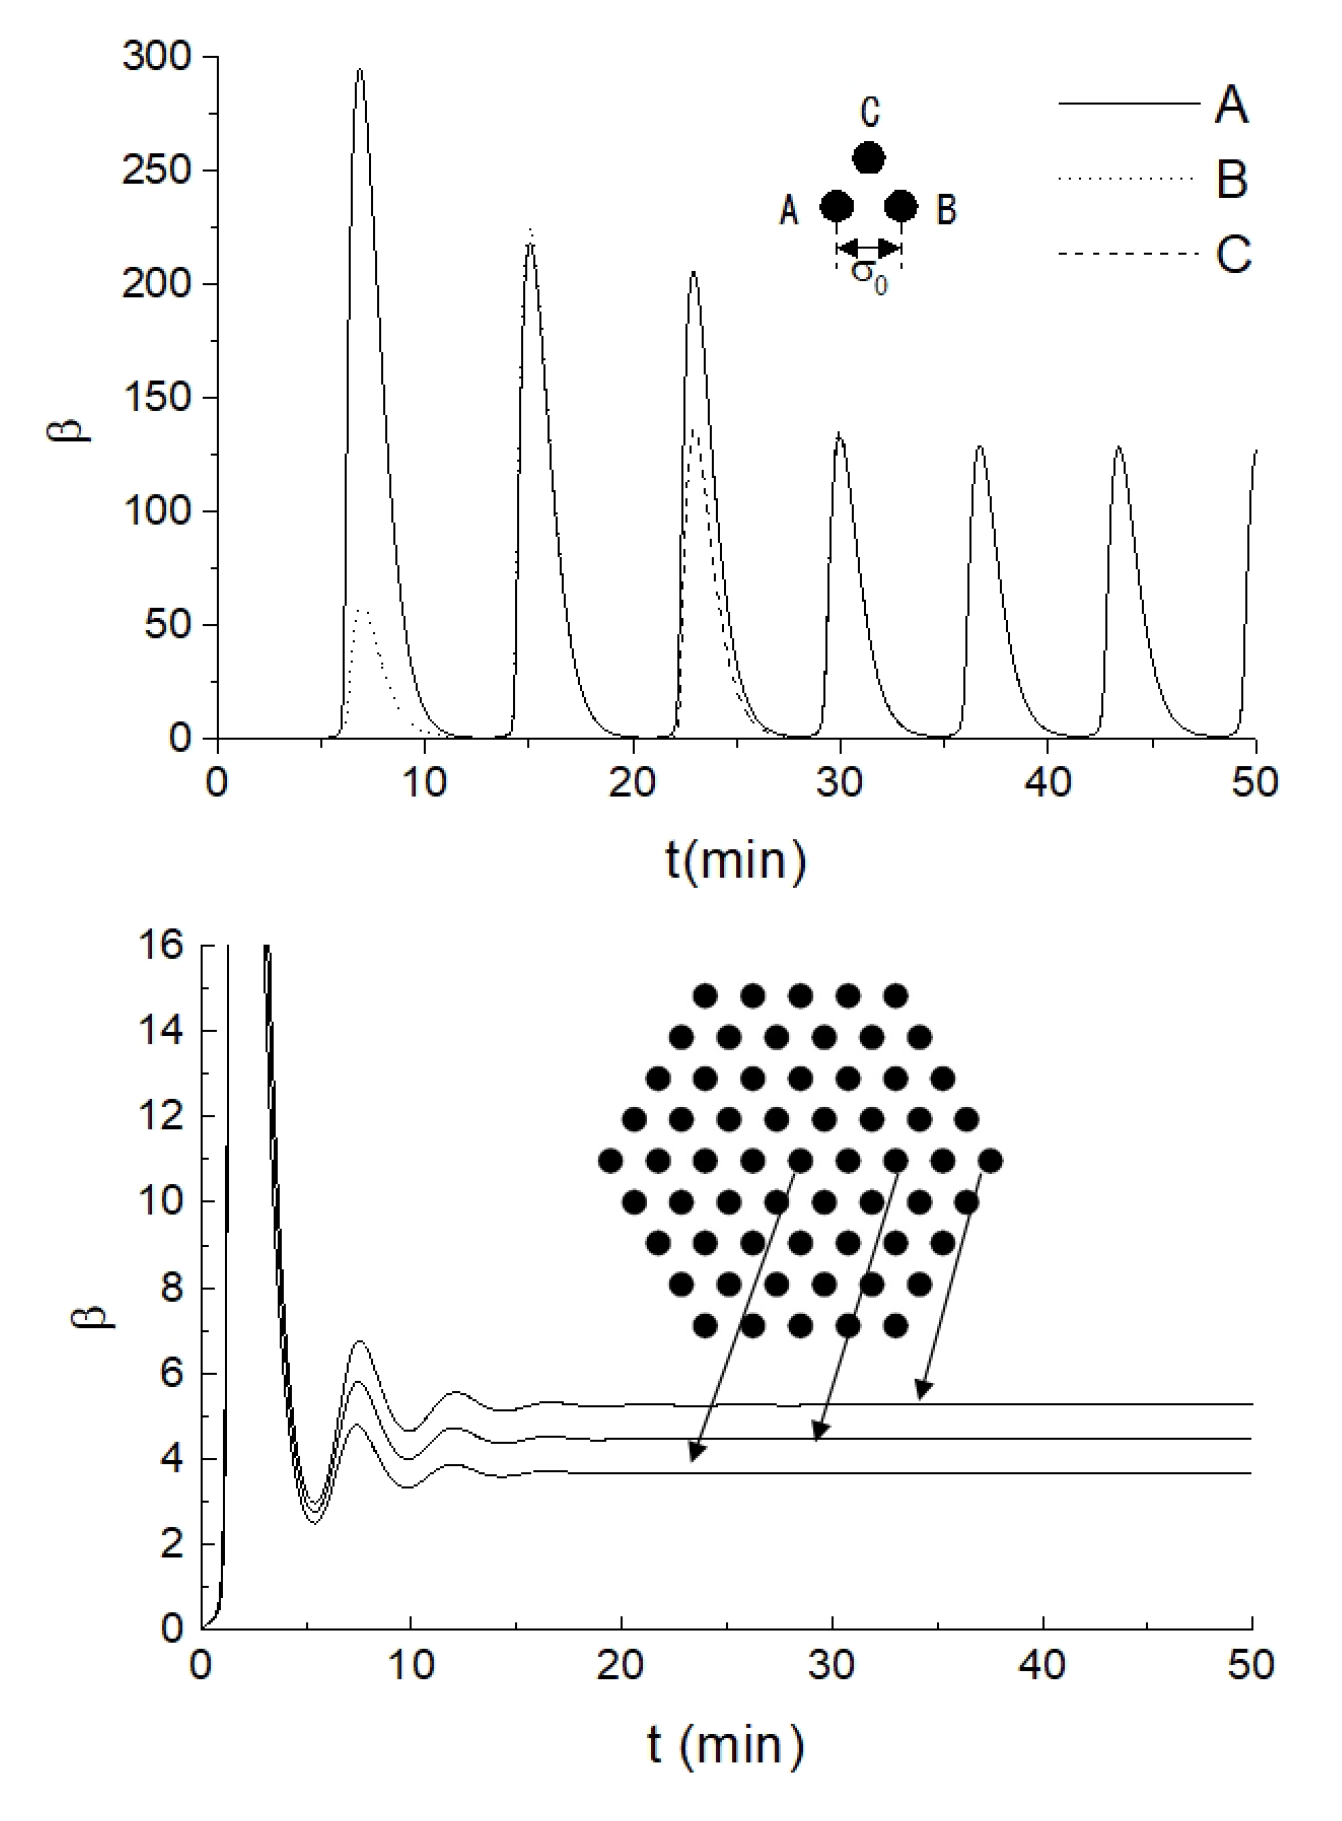
Furthermore, three cells were attached to each other as shown in
Figure 13, and biochemical reactions were initiated at different times for each cell.
As a result, not only were the reactions synchronized, but the amount of cAMP produced by each cell also decreased. The amount of cAMP produced by the cells periodically changes between a maximum value and zero, but the maximum value of the periodic oscillation of cAMP decreases with increasing cell number and eventually stops. When the oscillation stops, the intracellular cAMP concentration is maintained at a constant level. However, when the aggregate is divided into two, the periodic oscillation of cAMP concentration resumed.
How does intercellular synchronization affect cell aggregation? When Dicty cells receive periodic cAMP waves, they are swayed back and forth by chemotaxis. However, the above analysis shows that the amplitude of the cAMP waves sent inside and outside the aggregate varies greatly depending on the size of the aggregate. As a result, in the case of small aggregates, the adhesive substances cannot withstand the shaking caused by chemotaxis, causing the cells that make up the aggregate to disperse. On the other hand, in the case of large aggregates, the amplitude of the cAMP concentration sent inside and outside the aggregate is relatively small, and the shaking of the aggregate is also relatively small. As a result, the larger the aggregate, the more stable it can exist. If there is a defect in the aggregate, the surrounding cells generate larger cAMP waves, which promotes the rearrangement of the surrounding Dicty cells, resulting in the formation of a densely packed aggregate.
The synchronous production of cAMP is biologically meaningful, too. In Dicty, cAMP is used for chemotactic aggregation. On the other hand, cAMP is synthesized from limited amounts of ATP under starvation conditions. Synchronous extracellular secretion of cAMP can create large amplitude cAMP waves that aid chemotaxis while suppressing ATP consumption. If intracellular ATP is depleted before aggregation is complete, sporulation fails. As shown in
Figure 13, when a sufficient number of amoebas aggregate, the cyclic production of cAMP stops and a constant intracellular cAMP density is maintained. On the other hand, it is known experimentally that the continuation of the chemical reaction of sporulation requires the maintenance of a constant intracellular cAMP concentration. Therefore, the cessation of oscillation of intracellular biochemical reactions indicates that individual cells can grasp the total cell number of the aggregate. In this way, it can be seen that intercellular mutual synchronization of intracellular biochemical reactions via receptors plays an essential role in Dicty.
Although we do not show the results of simulations here, when the periodicity of cAMP production was eliminated, the aggregation time became significantly longer and aggregation often failed compared to when the periodicity was maintained. In other words, we found that the periodic cAMP wave significantly promoted chemotaxis, like a surfing effect.
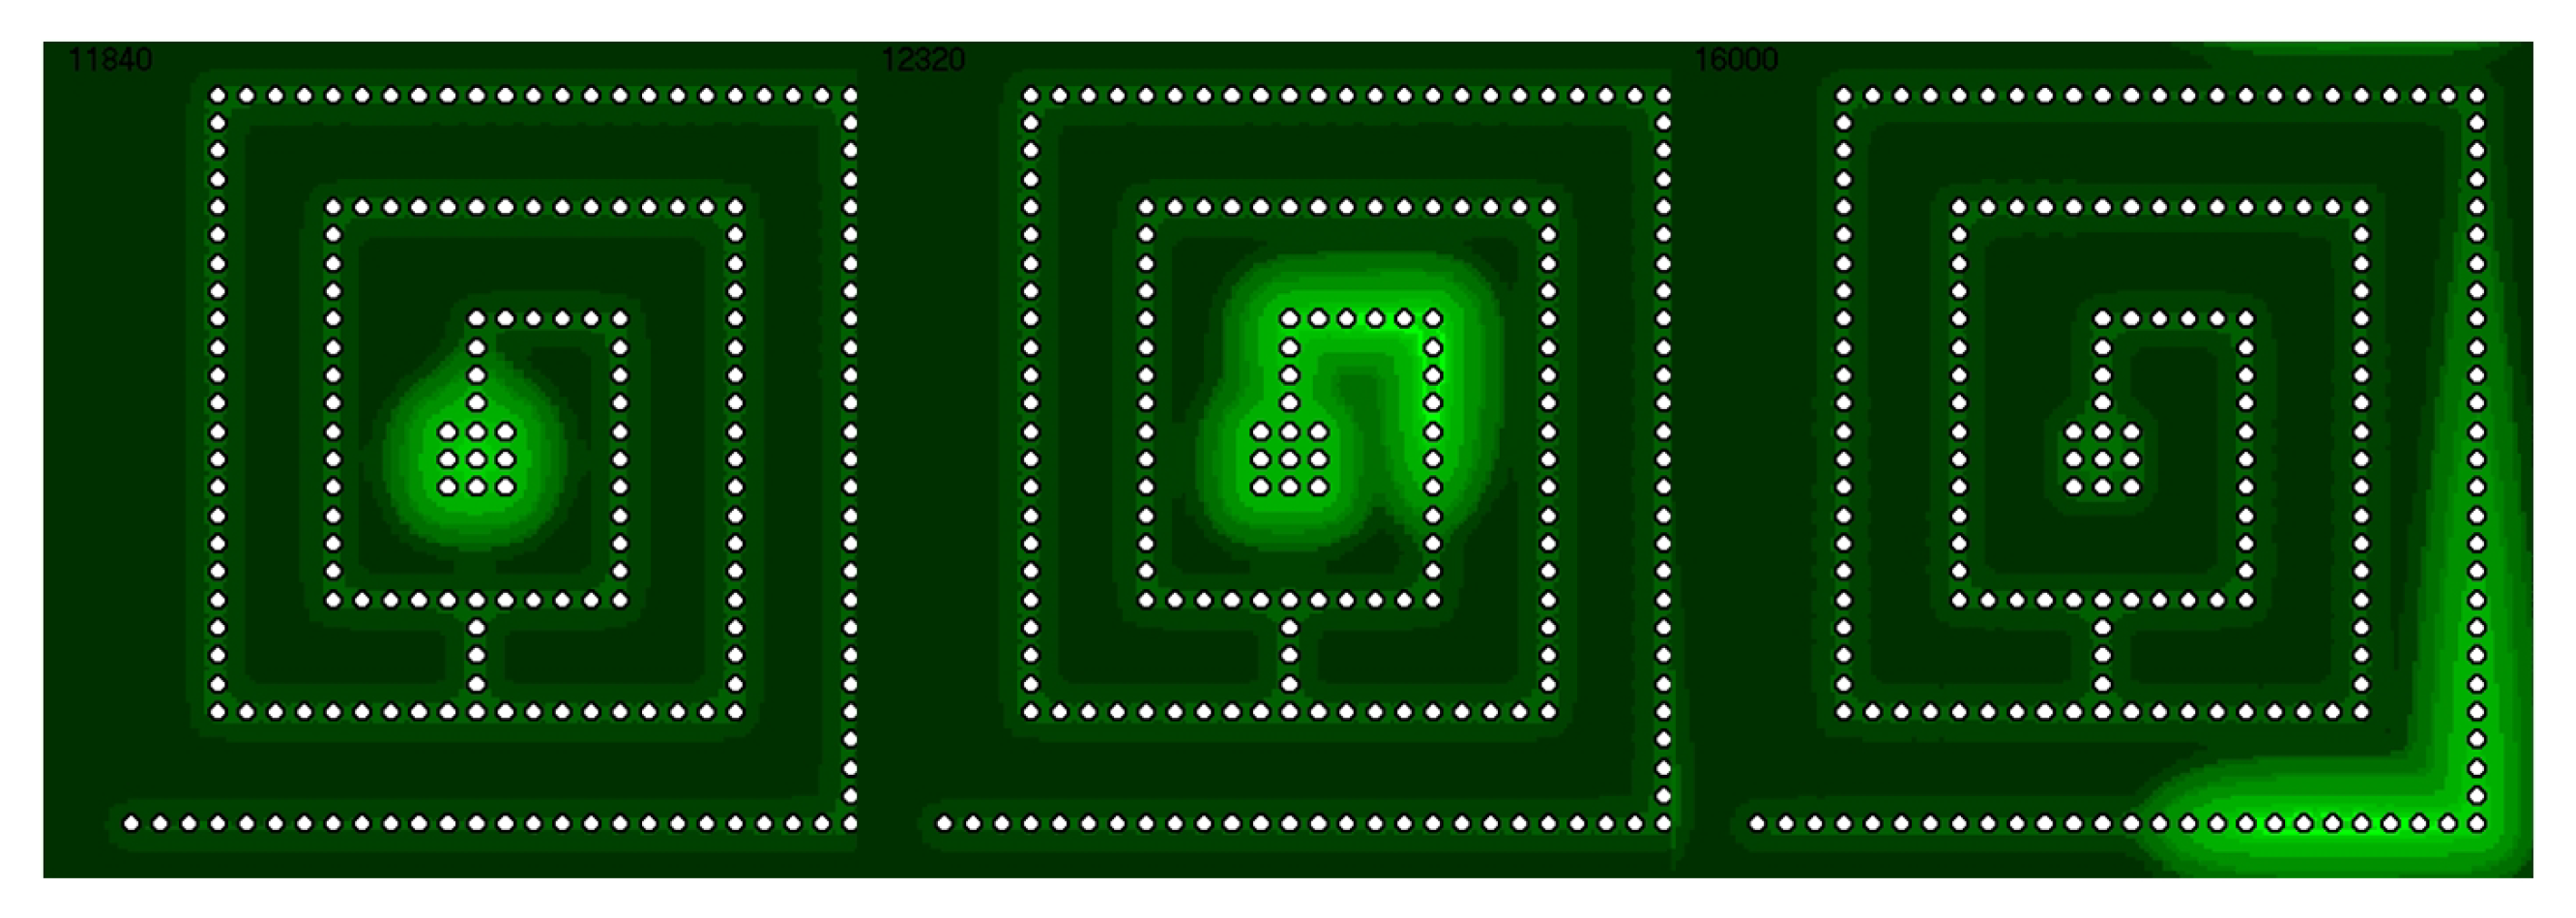
5. Shortest Path Finding
To further investigate the hidden features of Dicty, the cells were arranged as shown in
Figure 14. When the actual diffusion coefficient of cAMP was adopted, they were immediately synchronized. Therefore, the diffusion coefficient of cAMP was set to 1/30 of the actual value and the simulation was performed. As a result, it was possible to generate cAMP wave packets that propagate along the cell array. Not only that, but no matter what cell arrangement was set, only the cAMP wave packets that followed the shortest path ultimately remained[
14].
When two wave packets collide, both disappear, and only the wave packet that travels the shortest path remains. Here, the leak rate of cAMP out of the cells was set so that the threshold number of cells for cAMP wave packet generation was 9.
What we want to emphasize here is that each cell independently tries to lower its intracellular cAMP concentration when it senses high extracellular cAMP concentrations, and conversely tries to increase it when it is too low. However, as long as it is the same cAMP, regardless of where it comes from, the amount of cAMP produced within the cell is adjusted via the cAMP receptor, resulting in the generation of a cAMP wave packet, which allows the shortest route search to be realized. In other words, the shortest route search is successful without any ingenuity. What should be noted here is the fact that the governing laws of Dicty cells are the same in both cell aggregation in
Figure 12 and the shortest path search in
Figure 14.
6. Noise Suppression and Signal Amplification
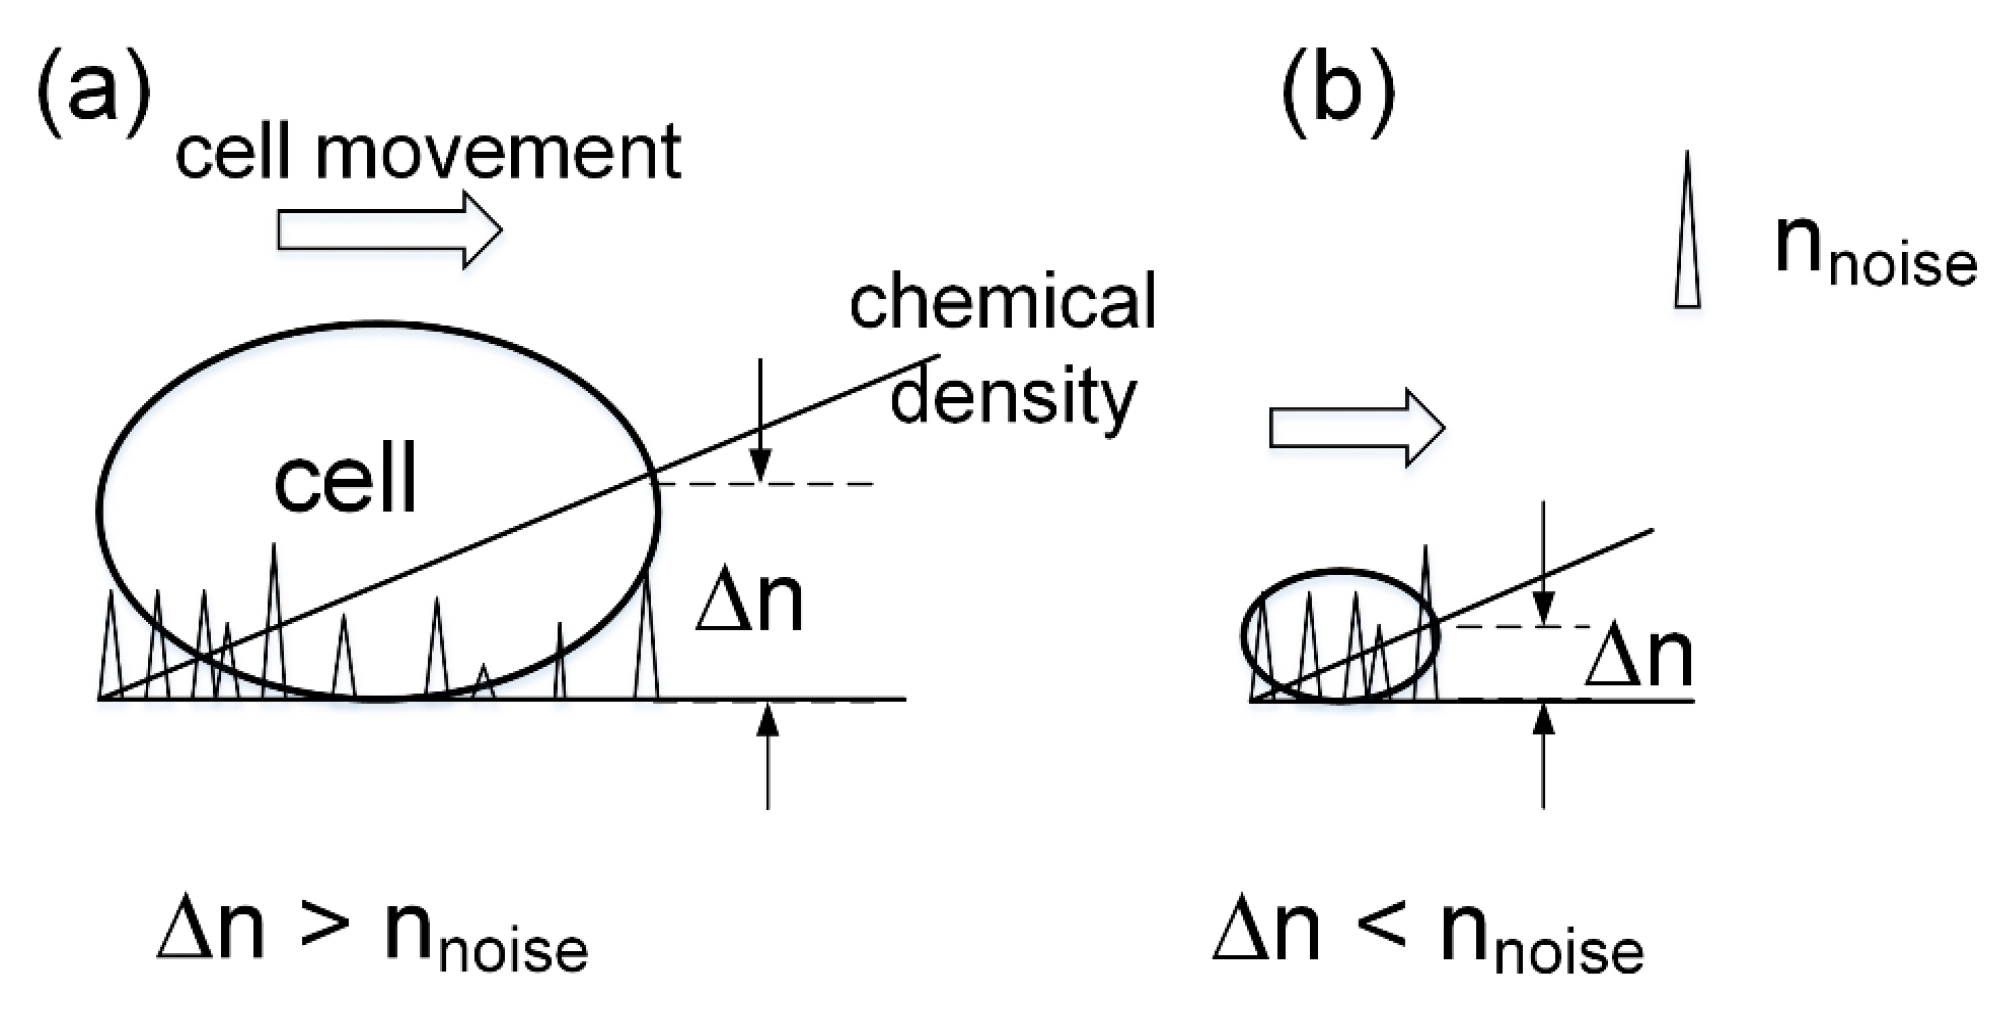
So far, we have adopted a single-receptor model for a single cell, but this is the limitation of our mathematical model. Although there are thousands of identical cAMP receptors in the actual cell membrane, our mathematical model implicitly assumes that all receptors function simultaneously and in exactly the same way. This assumption becomes problematic in the case of chemotaxis in a large noisy environment. In general, as shown in
Figure 15, for a cell to sense a concentration gradient as a concentration gradient, it is essential that there is a concentration difference of the chemotactic factor before and after the cell. Therefore, as the size of the cell decreases, the detectable concentration difference before and after the cell becomes smaller. In the case of Dicty, chemotaxis is correctly realized even though the magnitude of the noise is larger than the detectable concentration difference, which corresponds to the case of
Figure 15(b).
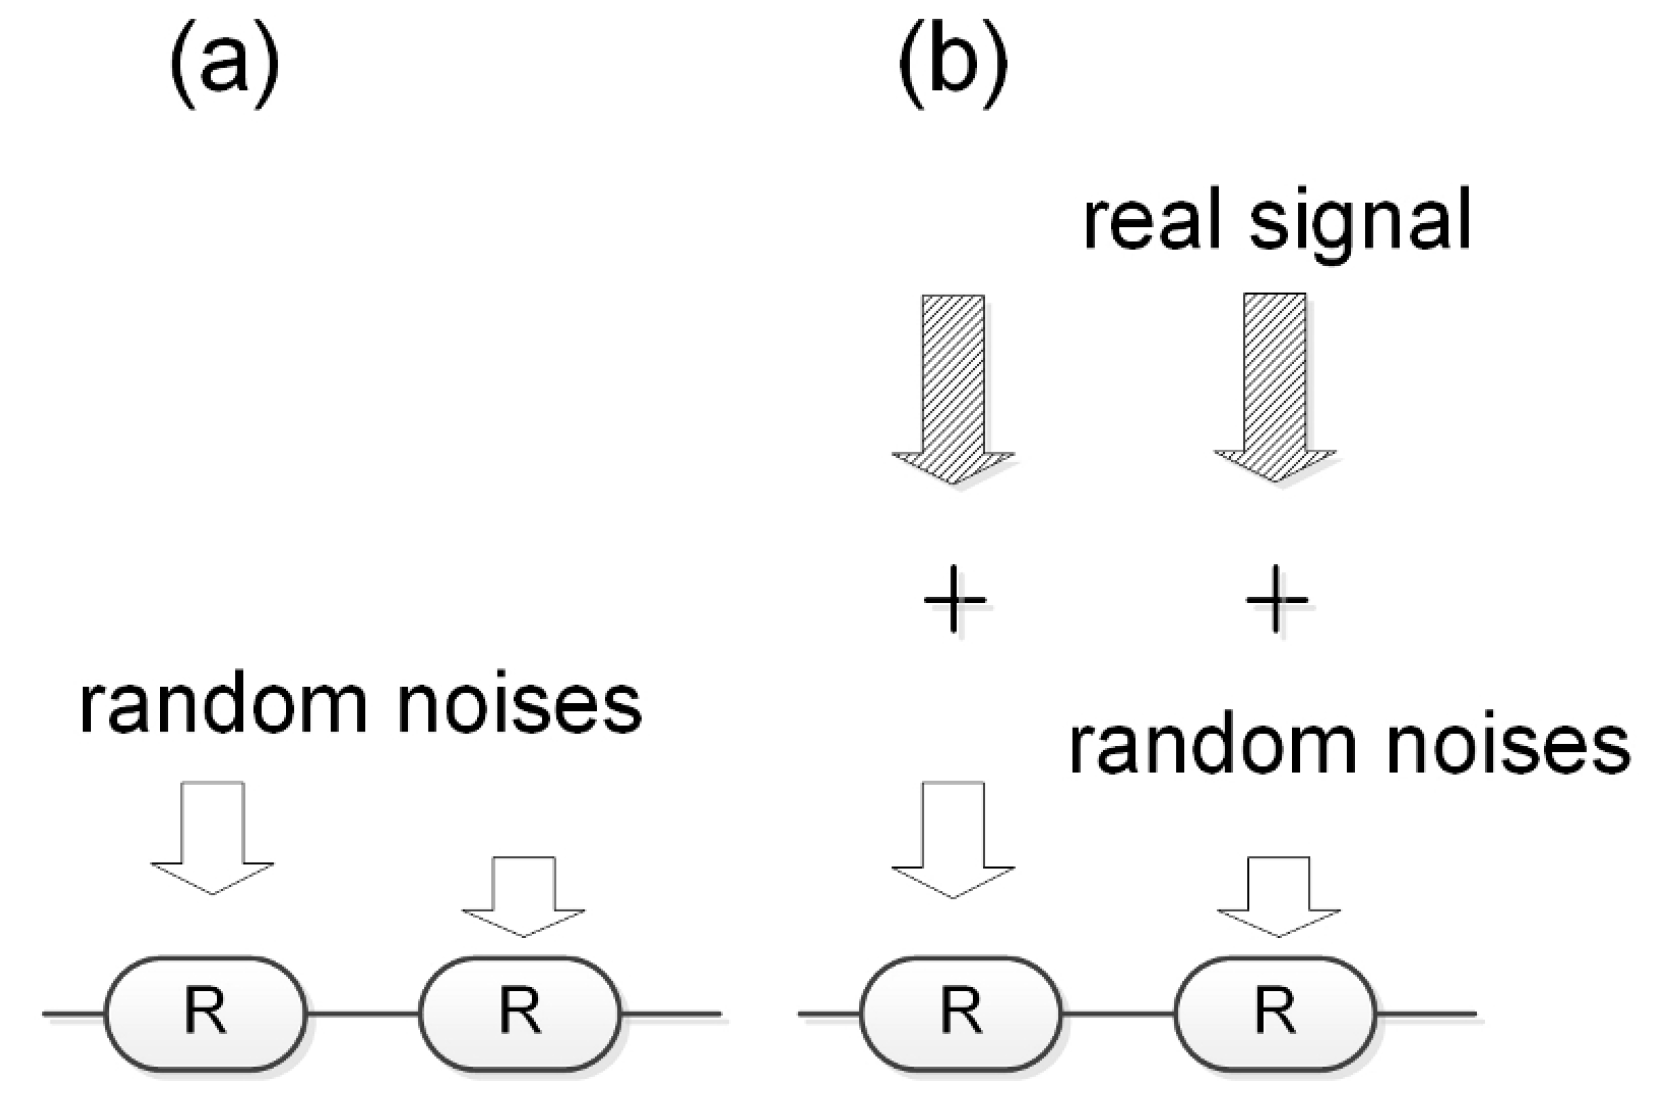
We hypothesized that this phenomenon may be a multi-receptor effect[
27]. As shown in
Figure 16, if it is noise, adjacent receptors will detect different signals randomly. However, if the signal is significant, adjacent receptors will detect the same signal.
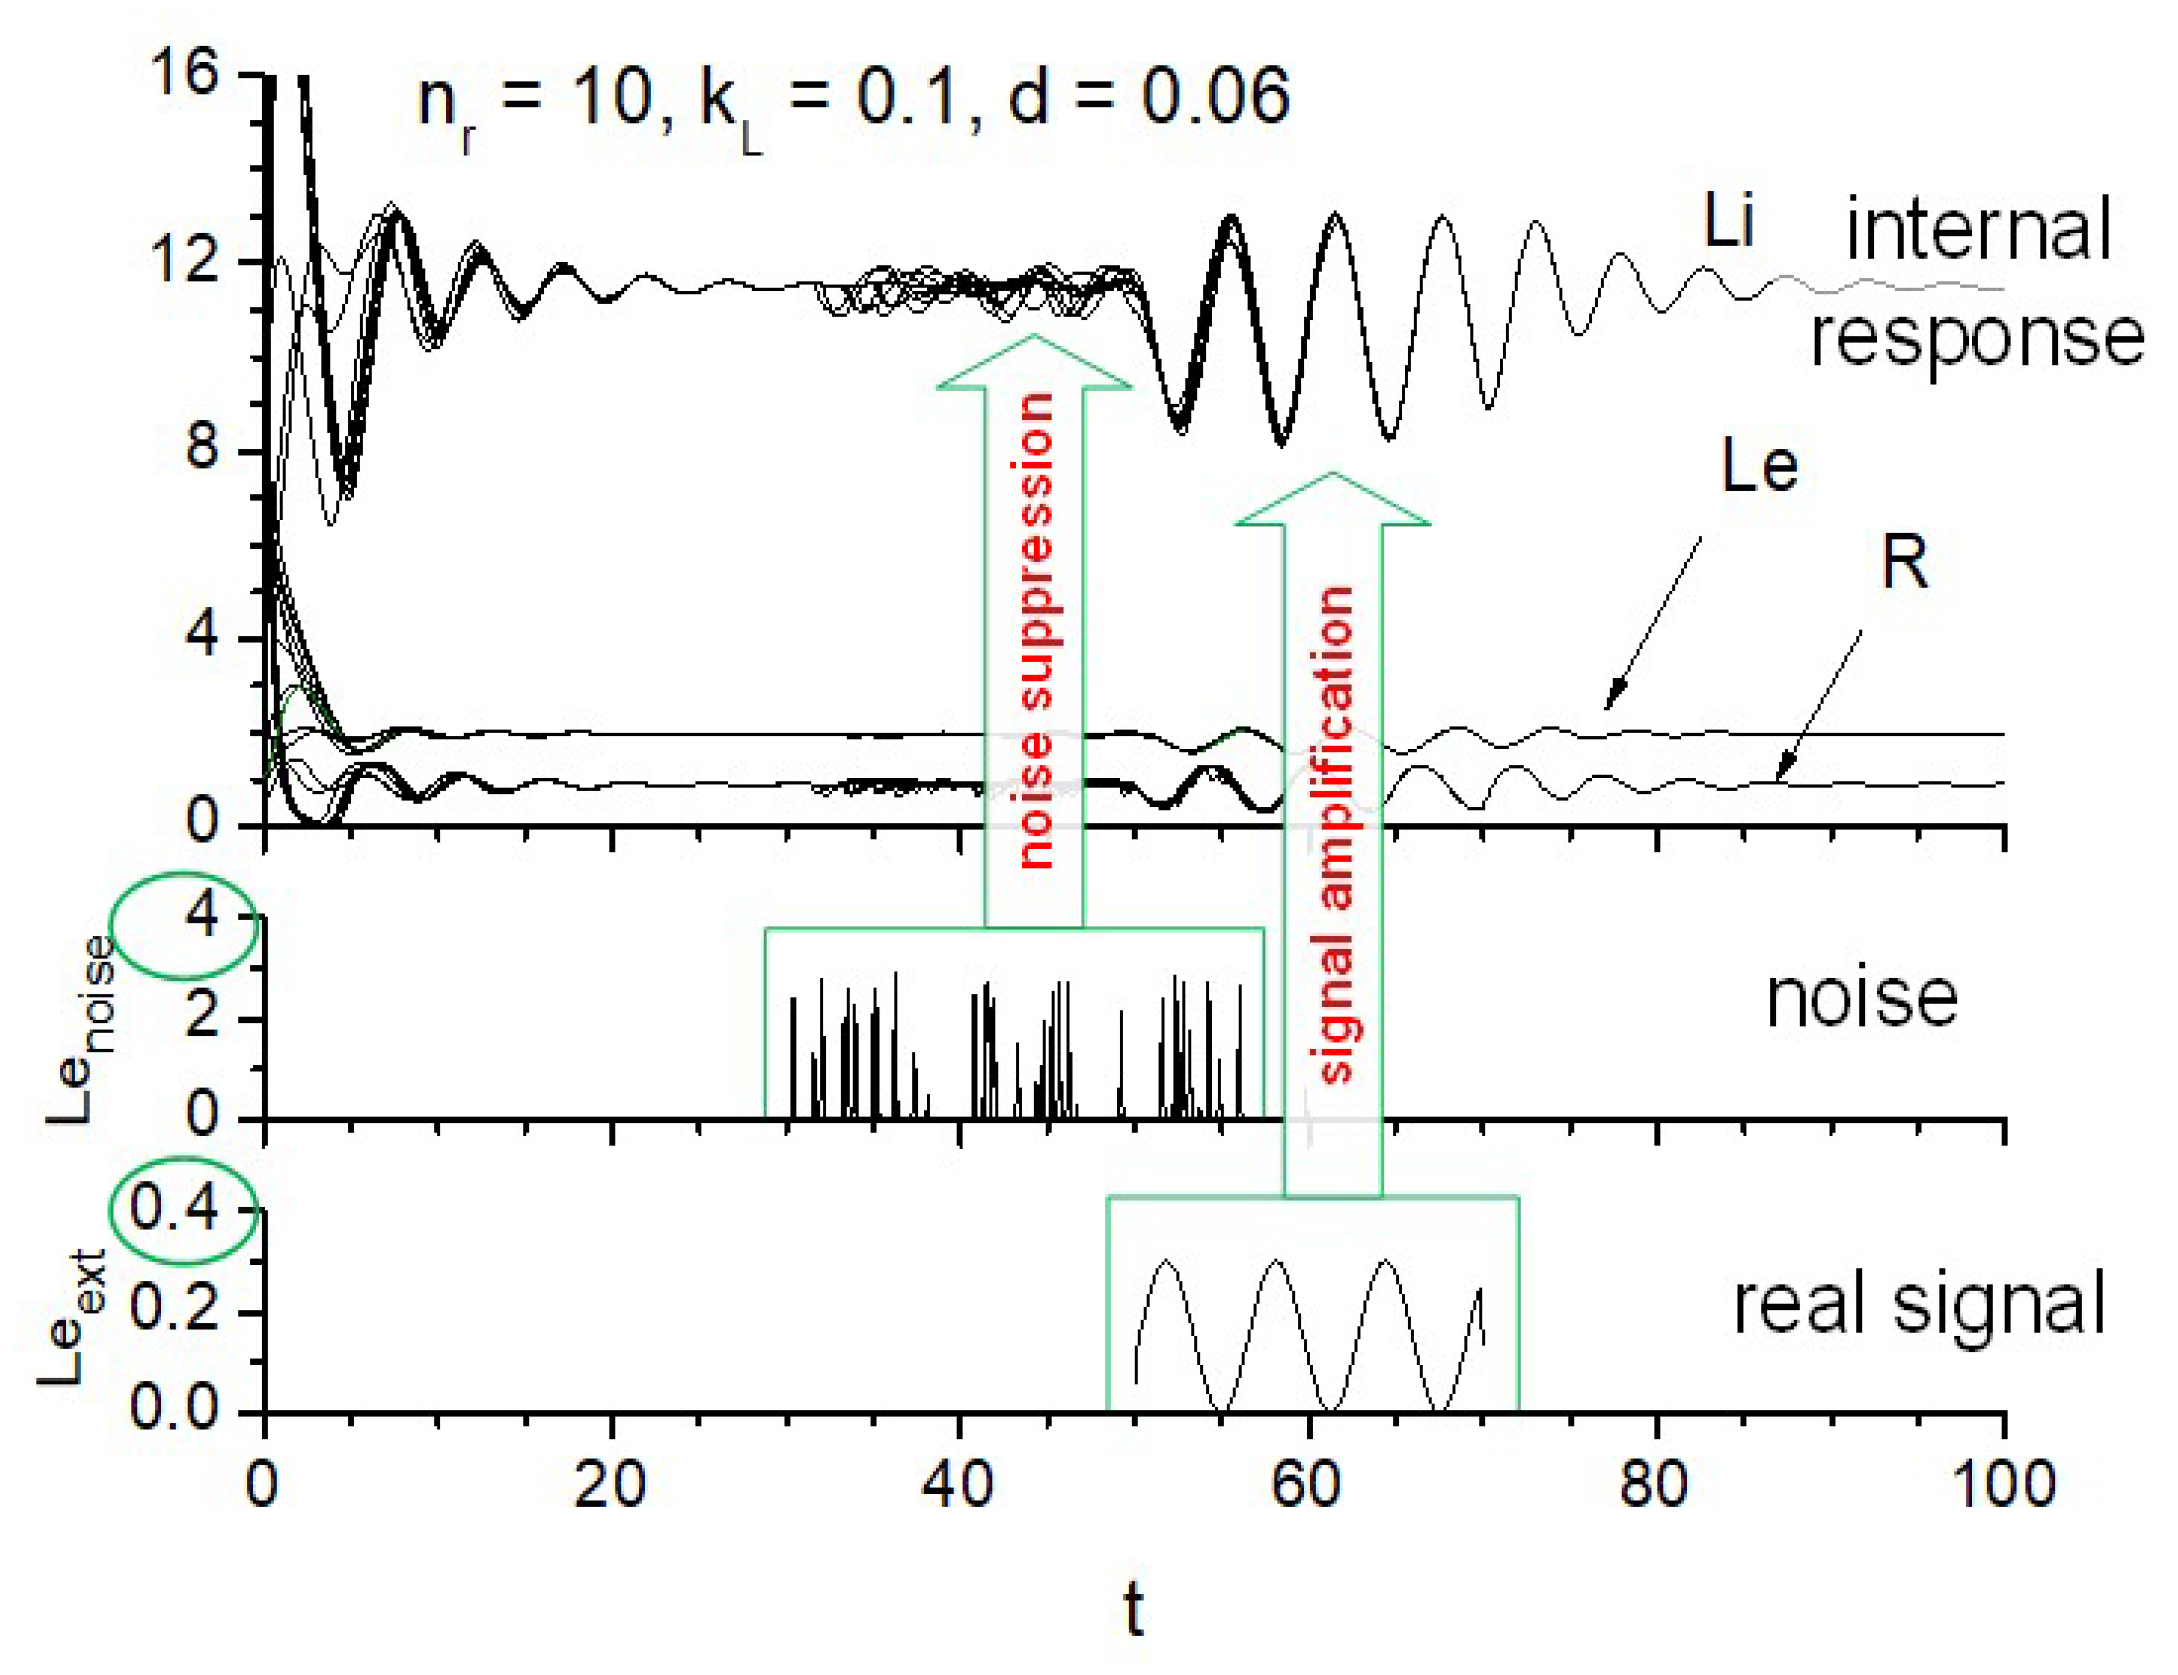
We constructed a system in which individual receptors are not excited unless the input exceeds a specified threshold, but when they are excited, they synchronize with each other. This property is similar to that of the Dicty multicellular system. We then conducted a numerical experiment in which a small-amplitude periodic wave and an external pulse ten times larger than that were sent to each receptor at random times to examine the change in intracellular cAMP concentration.
Figure 17 shows an example of a numerical experiment in a system with 10 receptors. In this case, the start time of the periodic signal and the start time of the random pulse input are slightly shifted to more clearly show the effect of the multi-receptor system.
This study revealed that synchronization enables rapid time coordination between receptors, allowing them to work together and exceed the threshold of excitability. As a result, important input signals are amplified in the cell, even if they are much smaller than the noise, while random noise inputs are suppressed to negligible levels, because the effects of random noise are immediately distributed across the synchronized receptor system, and the entire system cannot exceed the threshold for excitation. This effect becomes more pronounced as the number of receptors increases[
27].
In this review, the discussion of noise[
28,
29] is limited to this section because in CD simulations, the migrating cells themselves are also a source of cAMP noise, and the noise effect is automatically incorporated into cell aggregation, so there is no need to deal with noise separately in CD simulations.
7. From Biology to the Snowflake Formation
The unique aspect of Dicty’s aggregation strategy is that it generates an external cAMP field to realize long-range interactions between amoebas. Such an approach may provide a valuable clue to understanding the mechanism of snowflake formation. The difficult aspect of snowflake formation is that snow crystals are large, far beyond the range of interactions between water molecules, and yet they form huge, highly symmetrical two-dimensional structures in three-dimensional space.
The mechanism by which Dicty creates long-range interactions has something in common with the formation of snowflakes, which are formed by long-range interactions that far exceed the reach of intermolecular forces. Taking Dicty’s strategy into consideration, we can think of it as follows. As shown in
Figure 18, when two boats move, waves are generated on the water surface. As a result, long-range forces are generated between the boats that try to change their direction of travel. However, when the boats stop, such forces disappear. Moreover, as the number of boats increases, the waves generated become superimposed. This is very similar to how Dicty cells secrete cAMP outside the cells, generating long-range interactions. Moreover, they are also similar in that the long-range interactions disappear when cell aggregation ends.
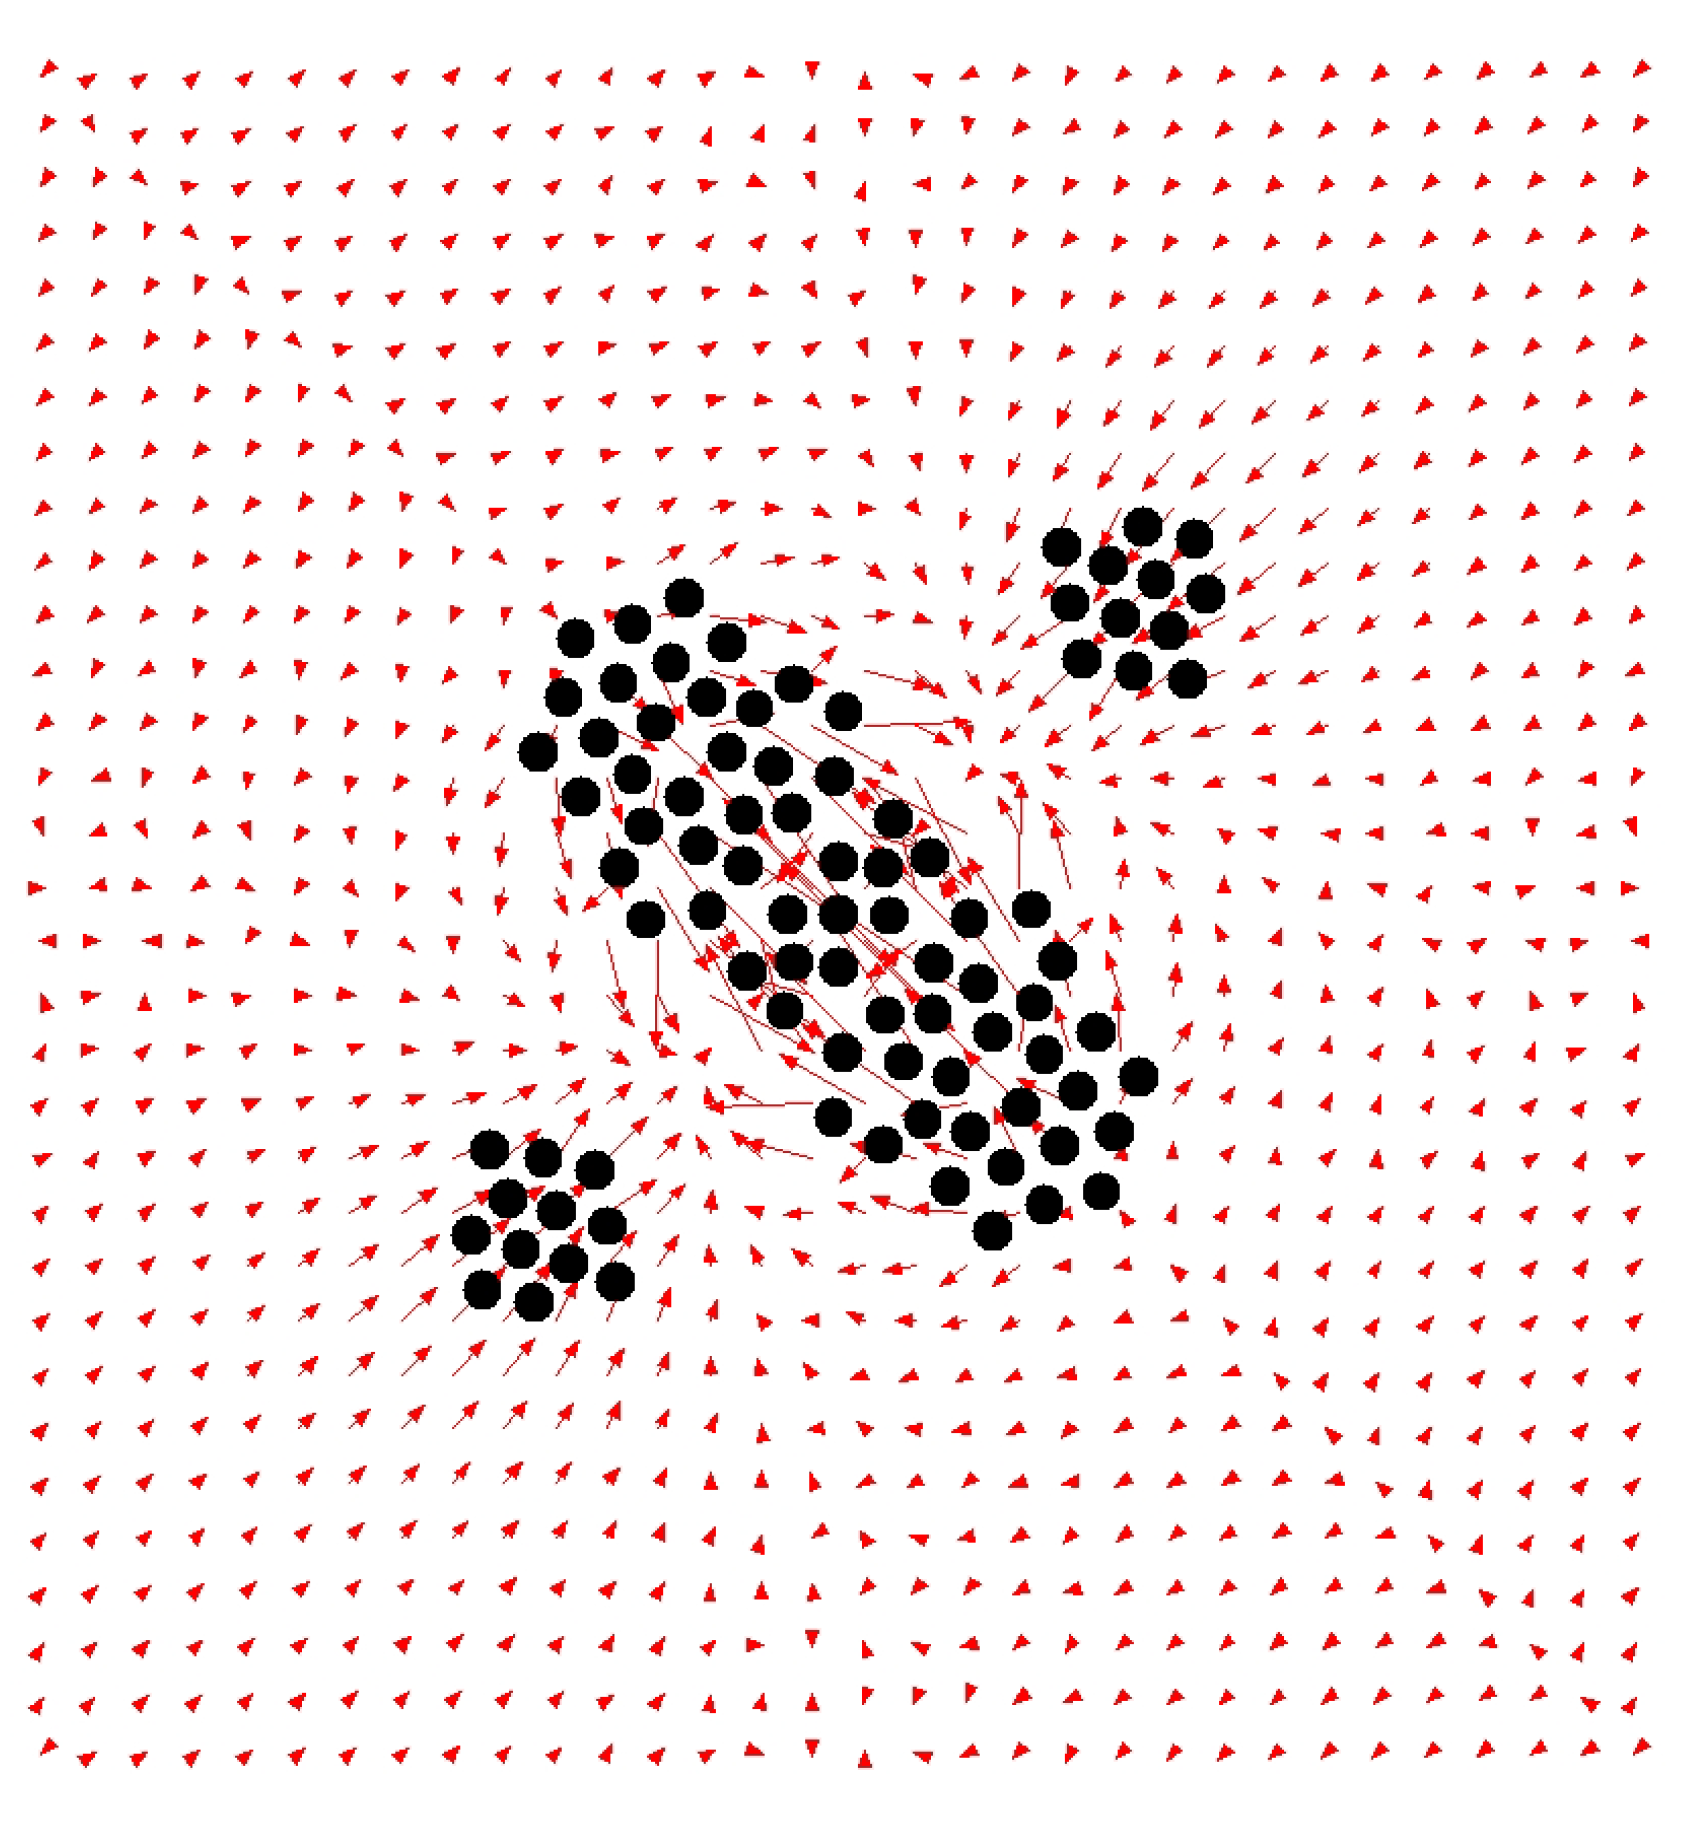
To investigate the interactions between water molecules through the medium of air, it is necessary to numerically solve the equations of fluid dynamics[
30] based on the hypothesis here. However, since it is beyond the scope of this review, the details are omitted and only one example of numerical calculation is shown in
Figure 19.
Normally, we do not think that the surrounding medium can be used to generate long-range forces that go beyond the range of intermolecular forces. For example, rocking a board back and forth in water creates waves, but the effects of the waves are usually ignored because they decay rapidly with distance. However, when other objects come close enough that the waves are not attenuated, the effects of the water waves cannot be ignored. The diffusive effect of cAMP on Dicty cell aggregation corresponds to this case. The exploitation of long-range interactions in Dicty cell aggregation is therefore clever and surprising.
8. Mathematical Generality of the Receptor-Based Synchronization Method
So far, we have discussed synchronization using receptors specific to Dicty. There is a wide variety of receptors in organisms other than Dicty, so there is a problem that research results in Dicty cannot be applied to research in other organisms as they are. Not only that, but as research on Dicty progresses, there is also the possibility that new molecular networks will be added to
Figure 5 in the future. Here, rather than further improving the Dicty model, we simplify it and derive a universal mechanism underlying the synchronization of cAMP production that can be adopted in organisms other than Dicty, and introduce the possibility of its engineering application.
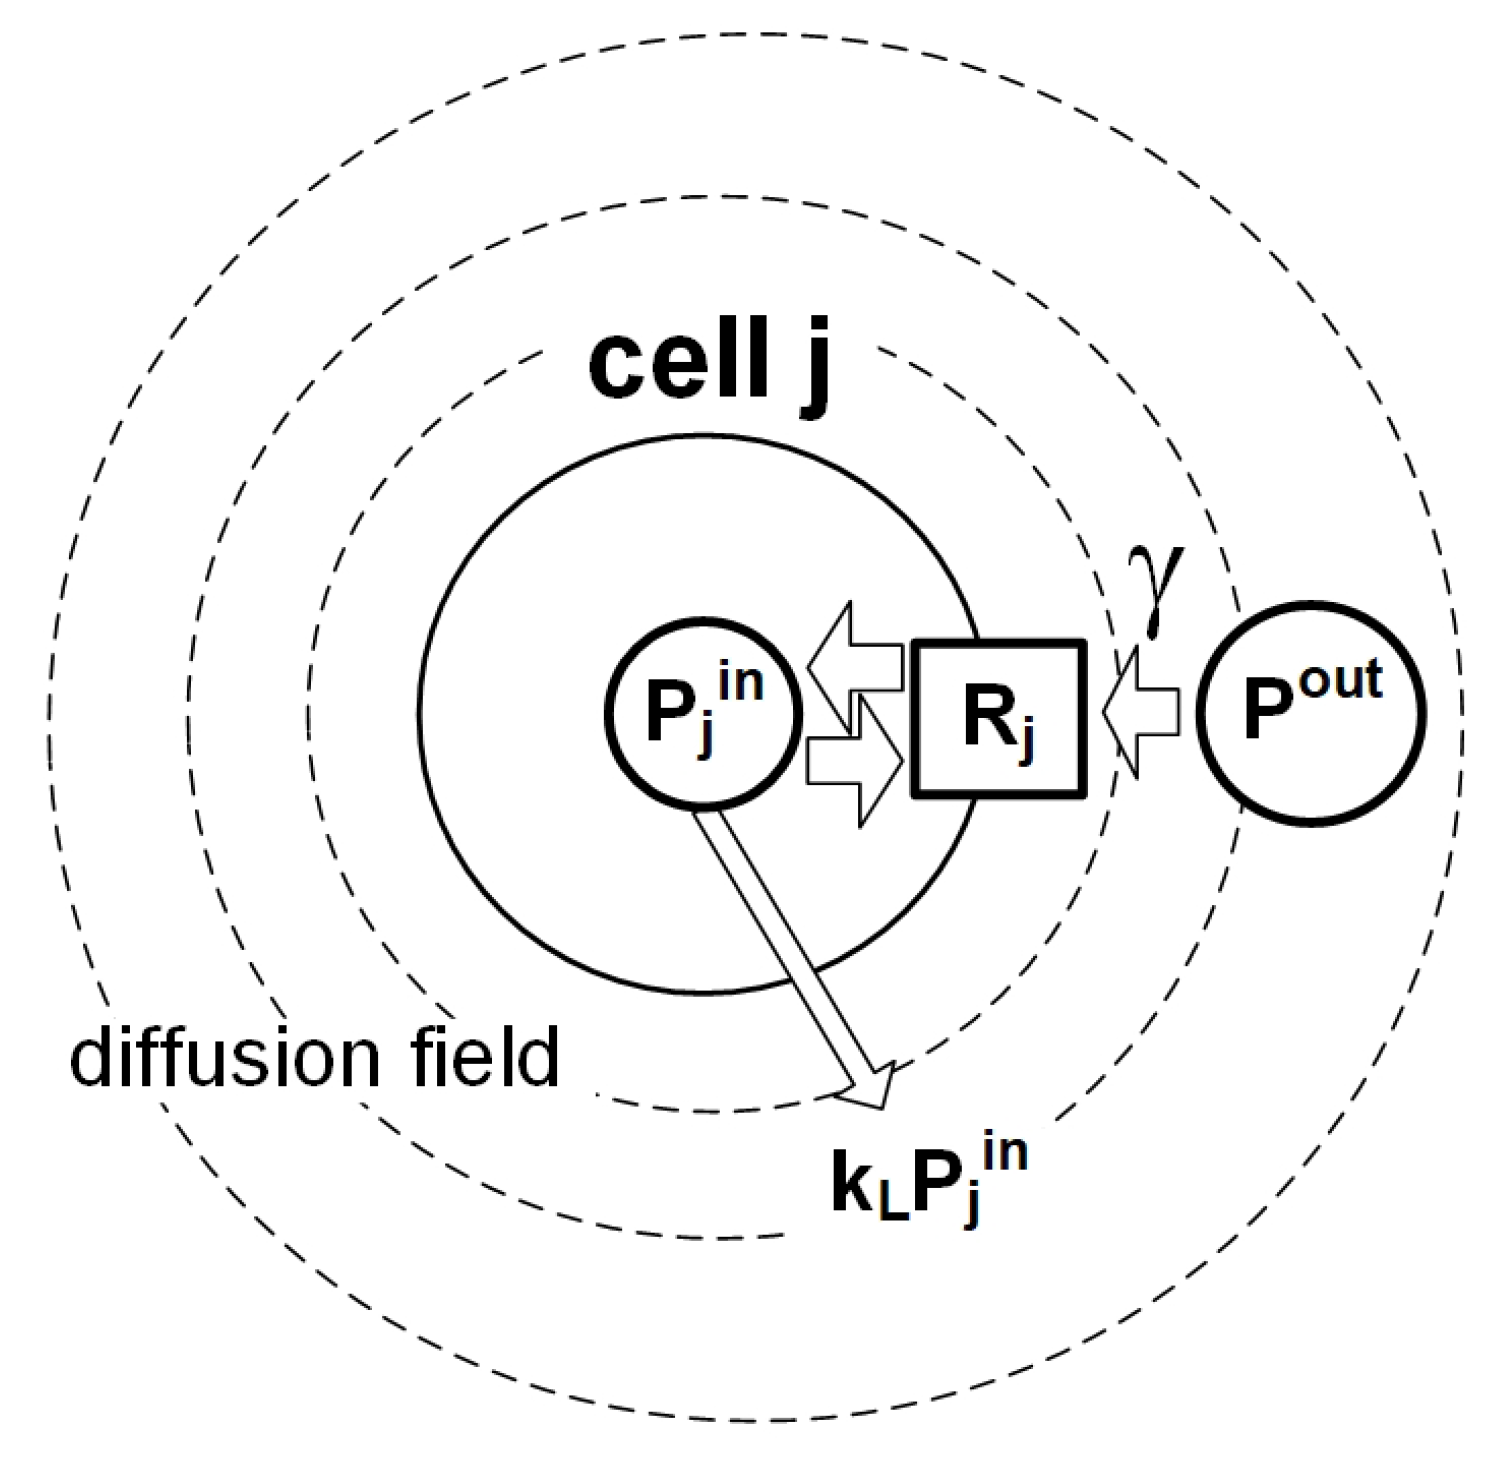
Looking back at the research process so far, the diffusible substance cAMP and its corresponding receptor seem to be the main players in achieving synchronization. Therefore, as shown in
Figure 20, let us assume that instead of cAMP, we use P and its corresponding receptor R, and assume that a part of P is secreted outside the cell with a leakage rate
, forming an extracellular diffusion field of P, which acts on receptor R. As a result, receptor R detects not only intracellular P, but also extracellular P. Here, we denote the sensitivity of receptor R to extracellular P by
.
The CD equation for the model cell shown in
Figure 20 can be derived by the following procedure. First, we assume that the intracellular cAMP density (
) and cAMP receptor cAR1 (
) satisfy the following equation in the absence of extracellular secretion:
Here, we assume that detailed information of intracellular biochemical reactions is contained in functions F and G, and that in corresponds to the intracellular P density detected by receptor . We further assume that and constitute a limit cycle oscillator.
When
is secreted extracellularly with a leak rate of
, Eqs. (1) and (2) can be rewritten as follows:
where
is extracellular P density of cell
j. As a result, the net amount of
P recognized by the receptor in Eq. (2) becomes
from
. Since the extracellular P field is formed by the leaked P from the model cells,
is determined by the following diffusion equation:
where
D is the diffusion coefficient of P,
is the positional vector of the
j-th cell,
is the two-dimensional delta function, and
N is the total number of cells. Although this greatly simplifies the actual CD equations, the nature of synchronization is still unclear, since they contain diffusion equations that require extensive numerical calculations. Without going into details here, the two-dimensional CD equations can be simplified to the one-dimensional form as follows[
31,
32,
33]:
where
Here, has been rewritten as . The meaning of the above equations is as follows. In the case of a single cell, the reaction of receptor is described by , and the input that receives is only . However, in a multicellular state, the sum of the external outputs from all cells is received with sensitivity , and the input that receptor receives is changed from to . This result is clearly and intuitively consistent with the phenomenon observed in Dicty. The question is, can synchronization still be achieved with such a simplified formula?
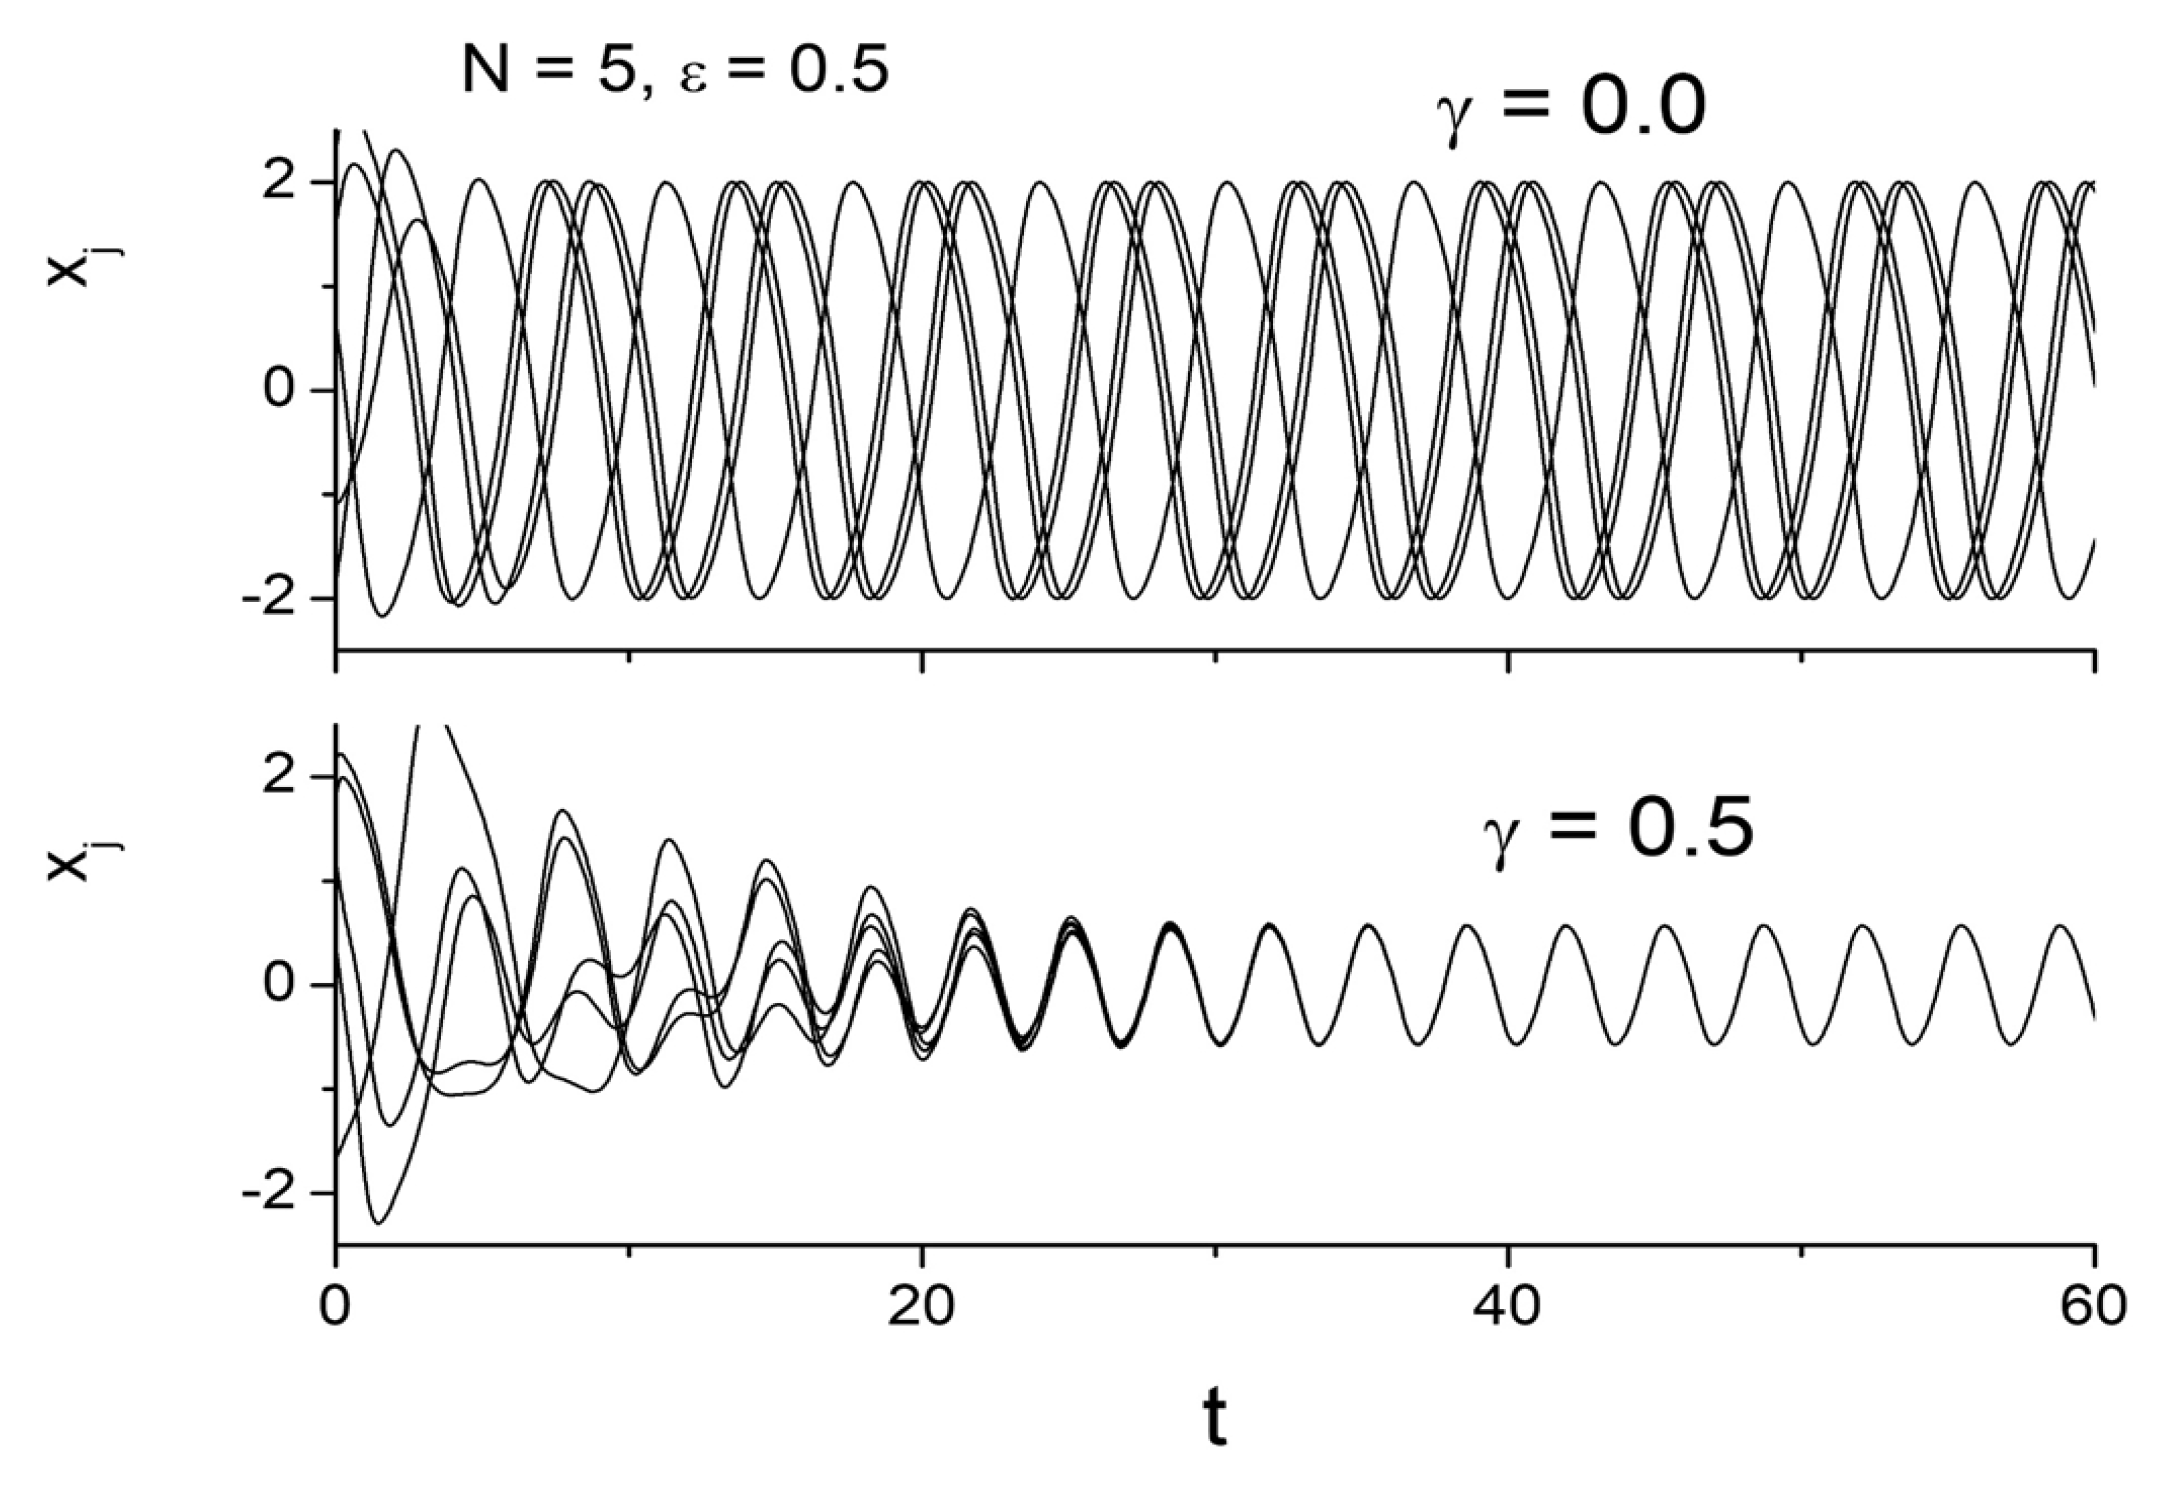
Figure 21 shows that our method can indeed achieve synchronization between van der Pol oscillators[
34], which are well known as limit cycle oscillators. The time relationship between
x and
in the van der Pol equation is similar to the relationship between
and
in
Figure 3. Therefore, we performed the numerical calculations by regarding
as
and
as
. In this case, once the oscillator to be studied, such as the van der Pol oscillator, is decided, the functional forms of F and G are automatically determined. Synchronization using the receptor-based synchronization (RBS) method introduced here has also been confirmed in systems other than van der Pol oscillators[
33]. These results demonstrate that the findings of biological research can also be applied to problems outside of biology.
Figure 21.
Synchronization of five van der Pol oscillators.
Figure 21.
Synchronization of five van der Pol oscillators.
Ion channels in neurons are also considered to be receptors in a broad sense. Recently, RBS theory has been applied to neuronal systems[
35] to confirm its generality.
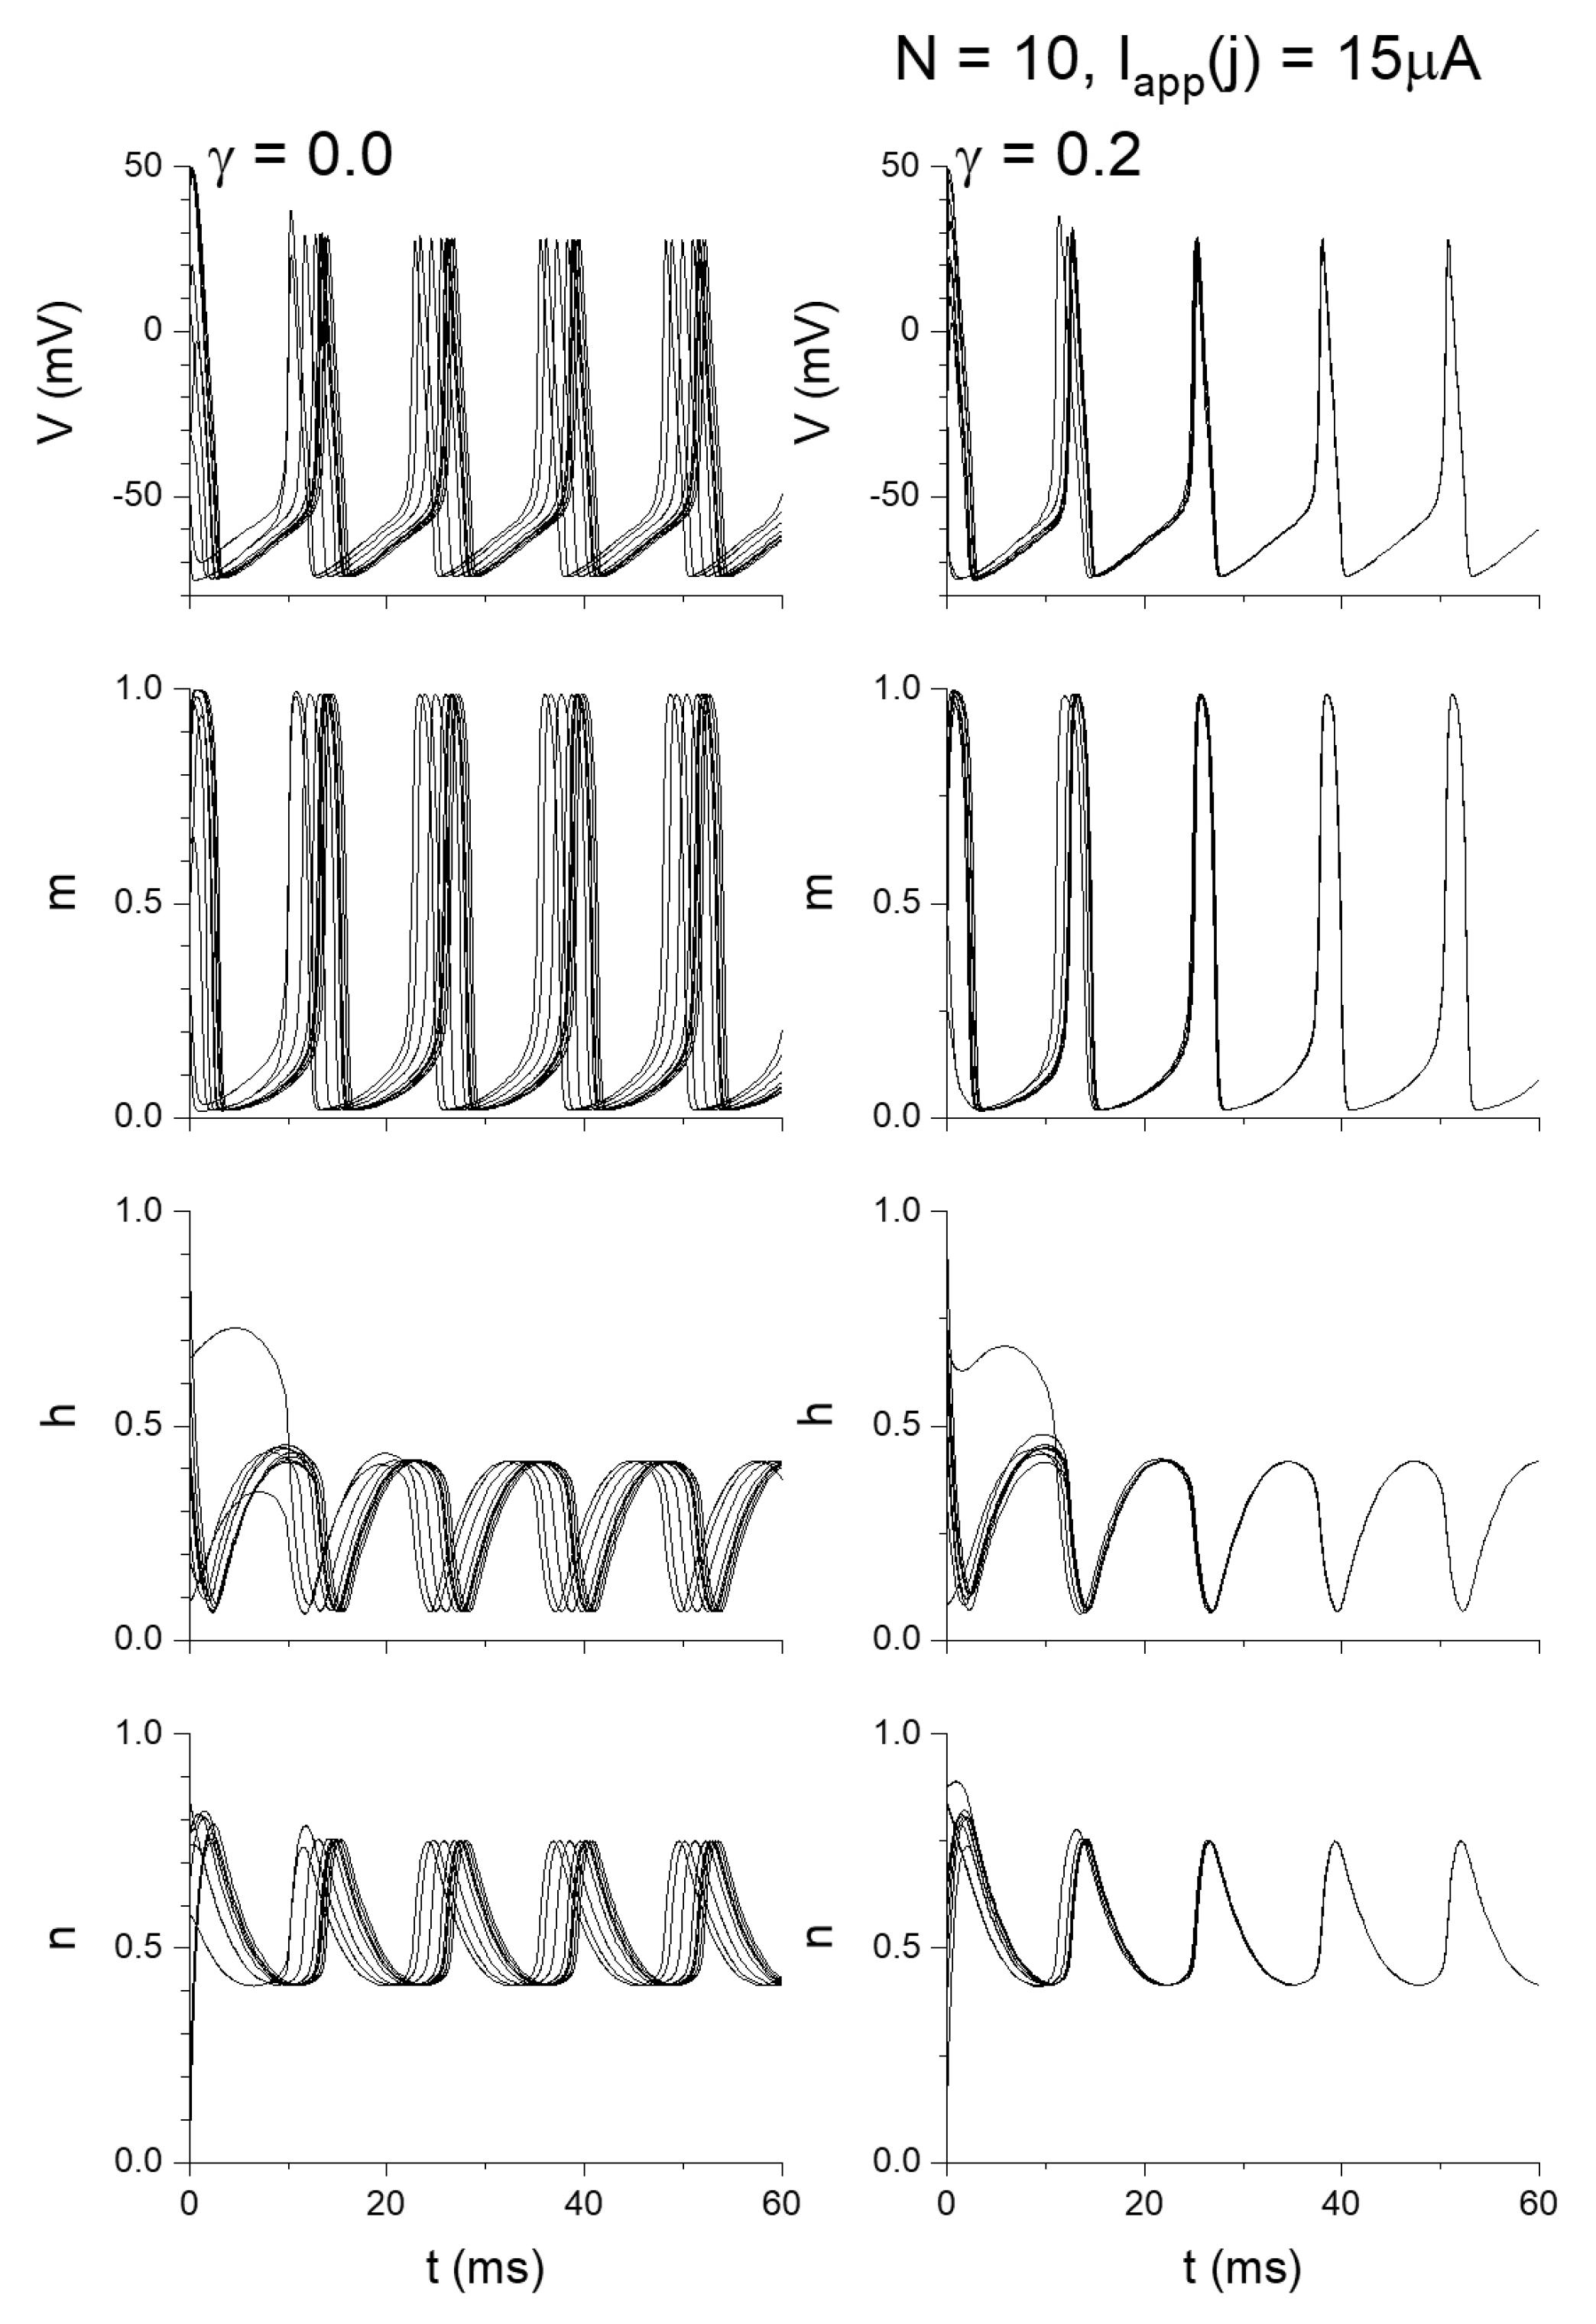
In this case, the following equation
is adopted as the equivalent of Eq. (8), and synchronization between Hodgkin-Huxley neurons[
35] is realized as shown in
Figure 22. Here,
is the membrane voltage of neuron
j. Since no physical agreement has yet been reached regarding Eq. (9), we will limit the discussion here to the mathematical aspects.
So far, we have applied the RBS theory to various nonlinear oscillator systems and achieved synchronization, and we believe that we have confirmed the generality of the theory.
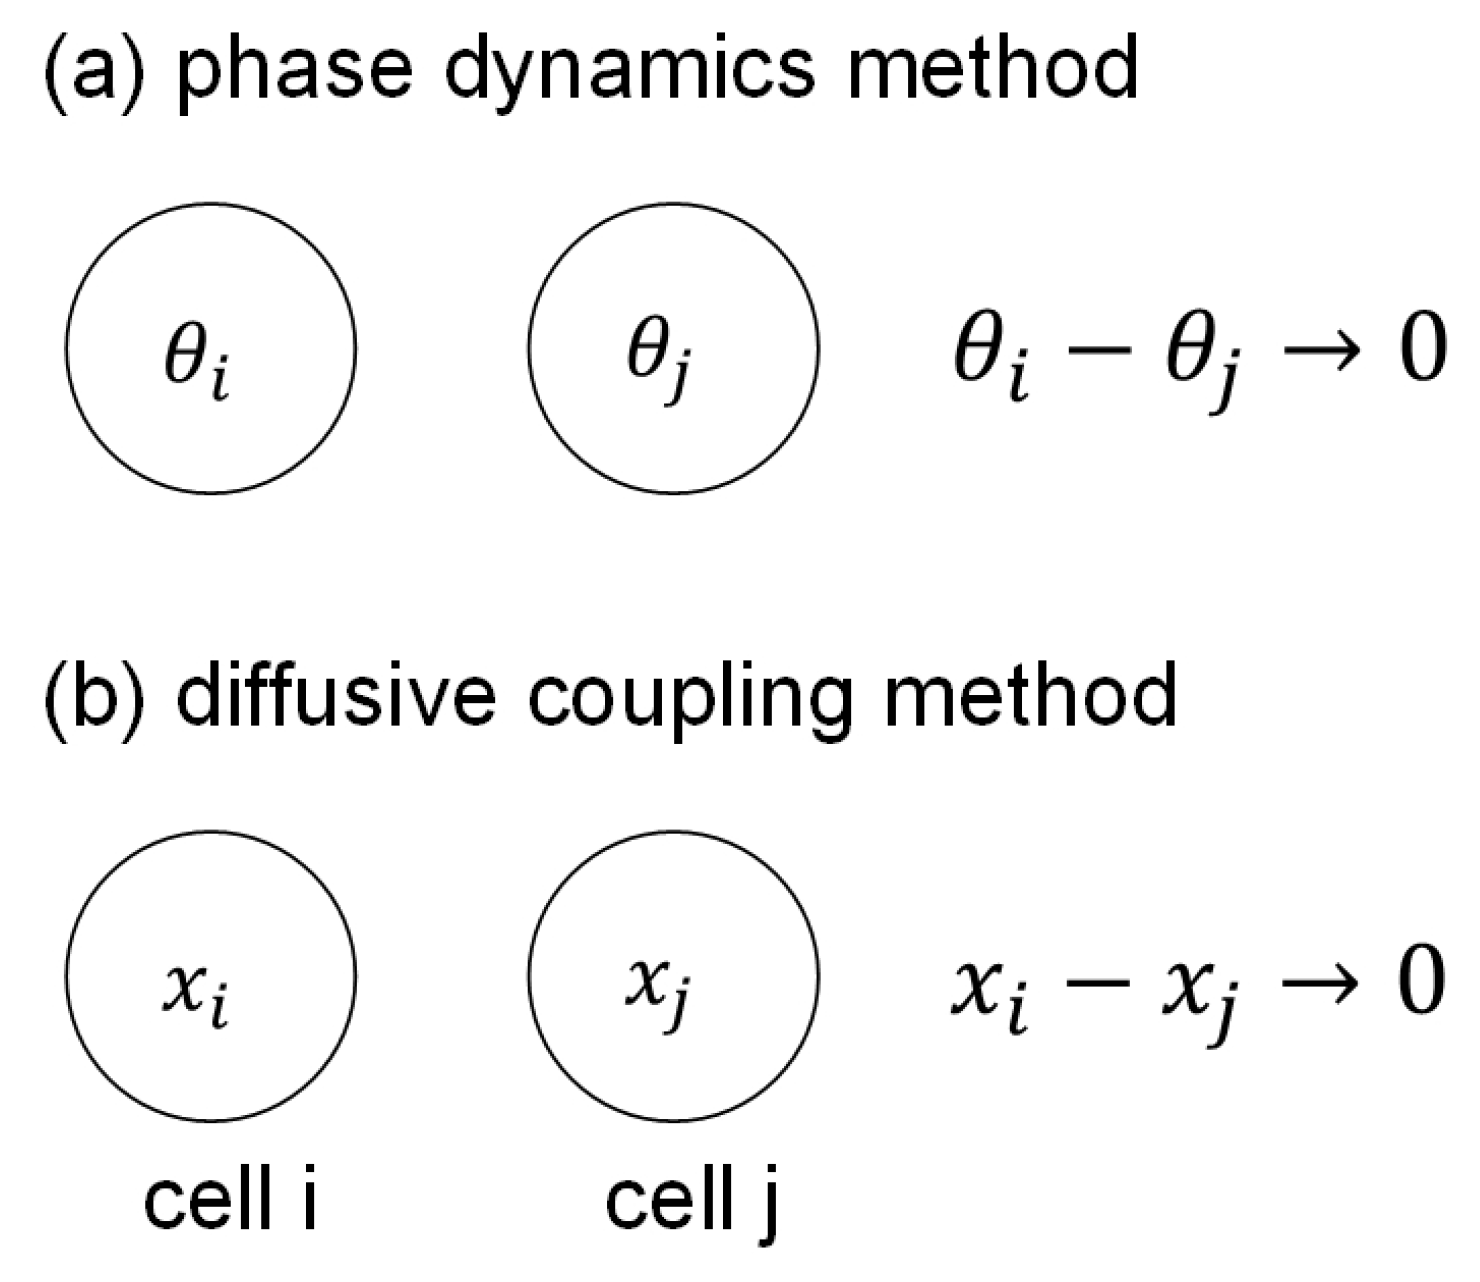
9. Differences from Conventional Synchronization Methods
There are two known methods for synchronizing oscillators. One is (a) the phase dynamics method[
36], which realizes synchronization by eliminating the phase difference between oscillators,
. The other is (b) the diffusive coupling method, which realizes synchronization by eliminating the numerical difference between oscillator variables,
.
Figure 23.
Two traditional synchronization methods: (a) phase dynamics method, (b) diffusive coupling method.
Figure 23.
Two traditional synchronization methods: (a) phase dynamics method, (b) diffusive coupling method.
Both of these methods have the advantage of being mathematically and intuitively easy to understand. However, both methods are biochemically difficult to implement at the cellular level. The problem is the lack of a way to biochemically sense the amounts of various substances in adjacent cells or the phase of their periodic oscillations. Therefore, when applying conventional synchronization methods to cellular systems, discussions at the cellular level have inevitably been avoided and phenomenological studies based on cell density have been developed[
37]. Or, mathematical discussions at the cellular level have been developed ignoring biochemical feasibility.
In contrast, the RBS method achieves synchronization by simply adding up the oscillator variables as shown in Eq. (8). However, a prerequisite for adopting the RBS method is that each oscillator is a limit cycle oscillator. In general, limit cycle oscillators have the property of always trying to return to steady oscillation even if external noise is added and the oscillation behavior is disturbed. In other words, each oscillator described by Eqs. (6) to (8) initially recognizes as noise that disturbs stable oscillation and begins to oscillate chaotically. However, all oscillators simultaneously try to return to their respective stable oscillation modes. This adjustment process continues for all oscillators until the entire system is synchronized. When the entire system is finally synchronized, is no longer recognized as noise. In other words, the RBS method achieves synchronization by making the most of the characteristics of limit cycle oscillators.
10. Remaining Issues with the CD Method
Both the CD1 and CD2 methods introduced in this review assume that Dicty cells have a disk-like shape. Therefore, there is a problem that neither method includes the pseudopodial movement that characterizes amoeboid movement. However, when pseudopodial movement is included, it is also necessary to handle the movement of biological materials within the cells, which makes it much more difficult to develop a multicellular simulation method. In addition, it is known that different adhesive substances are used between the leading and lateral sides of cells in amoeboid movement, so special consideration is also required in handling cell adhesion.
There is a soliton-like shape discovered by Kuwayama and Ishida[
38,
39] in the multicellular state of Dicty, where the above problems cannot be ignored. The Dicty strains treated there are mutants that do not exhibit chemotaxis, and are collective movements that do not utilize long-range interactions. Current CD methods do not involve medium-range interactions that exploit cell shape changes such as pseudopods, making it fundamentally difficult to reproduce soliton-like shapes.
11. Summary
The motivation for starting the Dicty study was to clarify the origin of the periodicity of cAMP production. Our answer to this question is that it is due to the dissociation of G proteins into
and
subunits and their reassociation, as shown in
Figure 4. The cAMP receptor as a GPCR drives this reaction. Similarly, the adaptation of the cAMP receptor is also brought about by the dissociation of G proteins into the two subunits and their quick reassociation.
The synchronization phenomenon between Dicty cells was discovered during the analysis of cell aggregation using CD simulations. The discovery was triggered by the fact that dense, defect-free aggregates were formed even when the number of cells was significantly increased in CD simulations. This was unexpected for researchers of multi-particle systems. As the size of the aggregate increases, the interactions between distant particles become weaker. As a result, the energy difference between a large dense structure and a large structure containing defects becomes smaller. Therefore, it was known that a higher accuracy of numerical calculations is required to form large, dense, defect-free aggregates on a computer. Usually, an engineering technique called annealing is used to create large, defect-free crystals. This is a method in which a material is melted at a high temperature and then the temperature is slowly lowered to grow large, defect-free crystals. It is completely inconceivable that Dicty cells would practice either of these techniques. Therefore, it was suspected that Dicty cells have acquired some unknown technique during the process of evolution.
To elucidate this unknown technique, we first stopped the movement of the two cells and shifted the start of the biochemical reactions in each cell. As a result, we observed the synchronization of the biochemical reactions between the cells. Furthermore, by increasing the number of surrounding cells, the oscillation amplitude of the cAMP concentration in the cells became smaller, and finally the oscillation became undetectable, and the intracellular cAMP concentration was maintained at a constant level. Since it was experimentally known that the initiation of spore formation requires that the intracellular cAMP concentration be kept constant, we were able to confirm that our CD simulation could reproduce the process up to the point of spore formation.
Under starvation conditions, cells want to retain as much ATP as possible, but there is a dilemma: if they do not synthesize cAMP from ATP and secrete it extracellularly, cell aggregation is not possible. However, if the cAMP synthesis process is synchronized, the extracellular cAMP waves are effectively superimposed, which has the effect of suppressing ATP consumption in each cell. Moreover, as the aggregates grow, the production of individual intracellular cAMP is suppressed, and the amplitude of the extracellular cAMP waves also decreases. As a result, the number of cells that aggregate in response to chemotaxis to cAMP decreases, and finally cell aggregation stops. This result is consistent with the observation that there is an upper limit to the number of cells in an aggregate.
If the shaking of cells that compose aggregates due to chemotaxis is considered as another form of thermal motion, then Dicty’s robust cell aggregation mechanism is very similar to the annealing method. In the annealing method, the material is first heated to a high temperature to strengthen the thermal motion of the molecules and dissolve them. Then, the temperature is gradually lowered to gradually reduce the thermal motion of the molecules, so that the intermolecular forces overcome the thermal motion of the molecules, and finally beautiful crystals are formed. On the other hand, in Dicty, the shaking of cells due to chemotaxis is large in small aggregates, and the shaking of cells due to chemotaxis is relatively small in large aggregates. As a result, small aggregates are more easily decomposed, and the whole progresses toward the formation of large aggregates. Although the essence of the two strategies is the same, it can be said that Dicty achieves cell aggregation in a more advanced way than the annealing method. This is because the annealing method can only control the temperature of the entire system, whereas Dicty cells achieve more efficient cell aggregation by changing the strength of the shaking due to chemotaxis for each size of aggregate. The reason why no defects were observed in the final Dicty aggregates is that defects would cause the surrounding cells to be significantly perturbed by chemotaxis, leading to cell relocation.
Related to the above discussion, intentionally disrupting the periodicity of extracellular cAMP secretion significantly reduces the efficiency of cell aggregation in CD simulations, resulting in frequent failure of cell aggregation. In summary, Dicty cells utilize periodic cAMP secretion and synchronization in multiple ways to achieve robust cell aggregation, and the cAMP receptor as a GPCR plays a central role in achieving periodicity.
In starvation, Dicty cells not only secrete cAMP outside the cells, but also secrete cAMP degrading enzyme. This may seem like a contradictory behavior at first glance. When performing a CD simulation of Dicty, the effect of the degrading enzyme is small, but if the diffusion coefficient of cAMP is made smaller than the actual value, cAMP will remain around the cells without degrading enzyme, suppressing the production of intracellular cAMP by the cAMP receptor, preventing the generation of cAMP waves and resulting in the failure of cell aggregation. In other words, the role of the degrading enzyme is a clever tactic to make cell aggregation successful even in an environment that is unfavorable to the diffusion of cAMP.
It is probably difficult to imagine that receptor-ligand interactions can lead to the shortest path search just by observing the aggregation of Dicty cells. What actually happens is that when the diffusion coefficient of cAMP is very small, only nearby cell groups are synchronized, and a local cAMP wave packet is generated from there, and the two cAMP wave packets that make a roundabout path disappear after colliding with each other, and only the cAMP wave packet that follows the shortest path search survives. Finding the shortest path is a mathematically difficult problem, but Dicty shows that it doesn’t necessarily require special talent to solve it.
Why do we need more than 1000 receptors of the same type in a cell membrane? Our numerical experiment using a system in which many receptors exist and interact in the same cell membrane provided one answer to this question. In the case of random noise, even if it is large, each receptor receives the input separately, and the influence is dispersed by synchronization between receptors, excitability in the cell is suppressed, and it is almost ignored as an input. However, even if the oscillatory input is much smaller than the random noise, if it is a true input, nearby receptors simultaneously sense the same oscillatory input, and the input is greatly amplified by synchronization between receptors and transmitted into the cell. Even with simultaneous input of random noise and small oscillatory input, the effect of random noise is almost suppressed, and only the true oscillatory input is amplified in the cell. Such effects become more pronounced as the number of interacting receptors increases. Therefore, this study will provide a mathematical explanation for the existence of many receptors of the same type in a cell membrane.
In this review, we have introduced many hidden roles of receptor-ligand interactions by utilizing CD simulations on Dicty. What they have in common is that when a receptor-based system is an excitable system and the excited state corresponds to a limit cycle state, synchronization between the systems is achieved via the receptor, showing surprising capabilities that cannot be predicted from a single receptor system. Moreover, their mechanisms are extremely simple despite the complexity of the phenomena. This is likely the result of evolution to increase robustness by simplifying mechanisms so that life systems can flexibly respond to any severe environmental changes.
The RBS method discovered in the Dicty research is clearly a powerful synchronization method from an engineering perspective. Although we were not able to cover it in this review, this method also achieves cross-frequency synchronization and synchronization between different types of limit cycle oscillators[
33].
The research on the mathematical model of Dicty shows that, contrary to the common perception of receptor-ligand interactions, indirect receptor-receptor interactions between cells and intracellular receptor-receptor interactions may play more important roles in biological systems than we realize.
This review is not intended to introduce recent research on Dicty in general, but rather to introduce the hidden roles of receptors and their generality that have been revealed so far in Dicty research. Therefore, please note that the studies and citations introduced in this review are limited to those relevant to this purpose.
It took us almost 15 years to develop CD2 from CD1, but the shape of the cells is still disk-like, and we have not been able to incorporate the actual shape changes of the cells into the cellular dynamics method. We hope that CD3, which incorporates spatial information of the cells, will be developed in the future.
Funding
This research received internal research funding from NEC Fundamental Research Laboratories in its early stages and from Ritsumeikan University in its later stages.
Data Availability Statement
Various videos of cellular dynamics simulations are available on my homepage at
https://sysbio-nagano.org. In this review, we have minimized the citation of formulas and inserted them as figures so that the research results can be fully understood even without formulas. If you would like to know more about the theoretical research including formulas omitted in the main text, please visit my homepage.
Acknowledgments
I would like to thank the following members of my laboratory at Ritsumeikan University who have made valuable contributions to our Dicty research: Dr. Shunsuke Sakurai, Nana Ishihara, Ryo Kimura, Shinichiro Naraki, Fumiya Wakasugi, Madoka Kamijo, Yosuke Mizutani, Nobuaki Kanazawa, Saki Kimoto, Daiki Sakamoto, Kohsuke Kina, Rhodai Tanaka, and Dr. Kurato Mohri.
Conflicts of Interest
The authors declare no conflicts of interest.
Appendix A. Application of the RBS Scheme to van der Pol Oscillator Systems
The van der Pol (vdP) equation is defined as follows:
where
is the natural frequency of the vdP oscillator and
is the parameter that controls the degree of nonlinearity. Eq. (A1) can be rewritten as follows:
This rewriting determines the specific function forms of
F and
G. Next, according to the RBS scheme, if
is used as
and
is used instead of
, the synchronization equation becomes as follows.
where
Figure 22 shows the results of the numerical calculation of the above equations for .
References
- Kessin, R. H. , Dictyostelium: Evolution, cell biology, and the development of multicellularity. Cambridge University Press: 2001; Vol. 38.
- Kreppel, L.; Fey, P.; Gaudet, P.; Just, E.; Kibbe, W. A.; Chisholm, R. L.; Kimmel, A. R. , dictyBase: A new Dictyostelium discoideum genome database. Nucleic acids research 2004, 32 (suppl 1), D332–D333. [Google Scholar] [CrossRef] [PubMed]
- Stajdohar, M.; Rosengarten, R. D.; Kokosar, J.; Jeran, L.; Blenkus, D.; Shaulsky, G.; Zupan, B. , dictyExpress: A web-based platform for sequence data management and analytics in Dictyostelium and beyond. BMC bioinformatics 2017, 18, 1–10. [Google Scholar] [CrossRef] [PubMed]
- McMains, V. C.; Liao, X.-H.; Kimmel, A. R. , Oscillatory signaling and network responses during the development of Dictyostelium discoideum. Ageing research reviews 2008, 7(3), 234–248. [Google Scholar] [CrossRef] [PubMed]
- Annesley, S. J.; Fisher, P. R. , Dictyostelium discoideum-a model for many reasons. Molecular and Cellular Biochemistry 2009, 329, 73–91. [Google Scholar] [CrossRef]
- Loomis, W. F. , Cell signaling during development of Dictyostelium. Developmental biology 2014, 391(1), 1–16. [Google Scholar] [CrossRef]
- Aoki, M. M.; Emery, R. N.; Anjard, C.; Brunetti, C. R.; Huber, R. J. , Cytokinins in Dictyostelia-A unique model for studying the functions of signaling agents from species to kingdoms. Frontiers in Cell and Developmental Biology 2020, 8, 511. [Google Scholar] [CrossRef]
- Kin, K.; Schaap, P. , Evolution of multicellular complexity in the dictyostelid social amoebae. Genes 2021, 12(4), 487. [Google Scholar] [CrossRef]
- Kuhn, J.; Lin, Y.; Devreotes, P. N. , Using live-cell imaging and synthetic biology to probe directed migration in Dictyostelium. Frontiers in Cell and Developmental Biology 2021, 9, 740205. [Google Scholar] [CrossRef]
- Storey, C. L.; Williams, R. S. B.; Fisher, P. R.; Annesley, S. J. , Dictyostelium discoideum: A model system for neurological disorders. Cells 2022, 11(3), 463. [Google Scholar] [CrossRef]
- Morimoto, Y. V. , Ion Signaling in Cell Motility and Development in Dictyostelium discoideum. Biomolecules 2024, 14(7), 830. [Google Scholar] [CrossRef]
- Nagano, S. , Diffusion-assisted aggregation and synchronization in Dictyostelium discoideum. Physical Review Letters 1998, 80(21), 4826. [Google Scholar] [CrossRef]
- Nagano, S.; Sakurai, S. , Cell-to-cell coordination for the spontaneous cAMP oscillation in Dictyostelium. Physical Review E: Statistical, Nonlinear, and Soft Matter Physics 2013, 88 (6), 062710.
- Nagano, S. , Modeling the model organism Dictyostelium discoideum. Development, growth & differentiation 2000, 42 (6), 541-550.
- Pechenkin, A. , On the origin of the Belousov-Zhabotinsky reaction. Biological Theory 2009, 4, 196–206. [Google Scholar] [CrossRef]
- Newell, P. , Attraction and adhesion in the slime mold Dictyostelium. Fungal differentiation: A contemporary synthesis 1983, 43-71.
- Mohri, K.; Tanaka, R.; Nagano, S. , Live cell imaging of cell movement and transdifferentiation during regeneration of an amputated multicellular body of the social amoeba Dictyostelium discoideum. Developmental biology 2020, 457(1), 140–149. [Google Scholar] [CrossRef] [PubMed]
- Edelstein-Keshet, L. , Mathematical Models in Biology. SIAM: 2005.
- Martiel, J.-L.; Goldbeter, A. , A model based on receptor desensitization for cyclic AMP signaling in Dictyostelium cells. Biophysical journal 1987, 52(5), 807–828. [Google Scholar] [CrossRef] [PubMed]
- Monk, P. B.; Othmer, H. G. , Cyclic AMP oscillations in suspensions of Dictyostelium discoideum. Philosophical Transactions of the Royal Society of London. B, Biological Sciences 1989, 323 (1215), 185-224.
- Tang, Y.; Othmer, H. G. , A G protein-based model of adaptation in Dictyostelium discoideum. Mathematical biosciences 1994, 120(1), 25–76. [Google Scholar] [CrossRef]
- Janetopoulos, C.; Jin, T.; Devreotes, P. , Receptor-mediated activation of heterotrimeric G-proteins in living cells. Science 2001, 291(5512), 2408–2411. [Google Scholar] [CrossRef]
- Maeda, M.; Lu, S.; Shaulsky, G.; Miyazaki, Y.; Kuwayama, H.; Tanaka, Y.; Kuspa, A.; Loomis, W. F. , Periodic signaling controlled by an oscillatory circuit that includes protein kinases ERK2 and PKA. Science 2004, 304(5672), 875–878. [Google Scholar] [CrossRef]
- Sakurai, S.; Nagano, S. , A molecular network underlying spontaneous cAMP oscillation and synchronization in Dictyostelium. Journal of theoretical biology 2012, 307, 37–41. [Google Scholar] [CrossRef]
- Loomis, W. F. , Cell-cell adhesion in Dictyostelium discoideum. Developmental genetics 1988, 9 (4-5), 549-559.
- Alcantara, F.; Monk, M. , Signal propagation during aggregation in the slime mould Dictyostelium discoideum. Microbiology 1974, 85(2), 321–334. [Google Scholar] [CrossRef]
- Nagano, S. , Noise reduction and signal enhancement by receptor synchronization. Nonlinear Theory and Its Applications, IEICE 2020, 11 (4), 601-609.
- Kim, J.; Heslop-Harrison, P.; Postlethwaite, I.; Bates, D. G. , Stochastic noise and synchronisation during Dictyostelium aggregation make cAMP oscillations robust. PLoS computational biology 2007, 3(11), e218. [Google Scholar] [CrossRef]
- Brimson, C. A.; Baines, R.; Sams-Dodd, E.; Stefanescu, I.; Evans, B.; Kuwana, S.; Hashimura, H.; Sawai, S.; Thompson, C. R. , Collective oscillatory signaling in Dictyostelium discoideum acts as a developmental timer initiated by weak coupling of a noisy pulsatile signal. Developmental Cell 2024. [CrossRef] [PubMed]
- Nagano, S. , Diffusion-assisted aggregation in crystal growth. Journal of Physics: Condensed Matter 1998, 10 (49), 11577–11580.
- Nagano, S. , Receptor-product coupling scheme for synchronization. Progress of Theoretical Physics 2000, 103(2), 229–244. [Google Scholar] [CrossRef]
- Nagano, S. , Biological receptor scheme for the robust synchronization of limit cycle oscillators. Progress of Theoretical Physics 2002, 107(5), 861–877. [Google Scholar] [CrossRef]
- Nagano, S. , Receptors as a master key for synchronization of rhythms. Physical Review. E, Statistical, nonlinear, and soft matter physics 2003, 67 (5 Pt 2), 056215.
- Van der Pol, B. , LXXXVIII. On “relaxation-oscillations”. The London, Edinburgh, and Dublin Philosophical Magazine and Journal of Science 1926, 2 (11), 978-992.
- Nagano, S. , Inductive coupling between neurons for synchronization. unpublished.
- Strogatz, S. H. , From Kuramoto to Crawford: Exploring the onset of synchronization in populations of coupled oscillators. Physica D: Nonlinear Phenomena 2000, 143 (1-4), 1-20.
- Gregor, T.; Fujimoto, K.; Masaki, N.; Sawai, S. , The onset of collective behavior in social amoebae. Science 2010, 328(5981), 1021–1025. [Google Scholar] [CrossRef]
- Kuwayama, H.; Ishida, S. , Biological soliton in multicellular movement. Scientific reports 2013, 3(1), 1–5. [Google Scholar] [CrossRef]
- Hayakawa, M.; Hiraiwa, T.; Wada, Y.; Kuwayama, H.; Shibata, T. , Polar pattern formation induced by contact following locomotion in a multicellular system. Elife 2020, 9, e53609. [Google Scholar] [CrossRef]
Figure 3.
The scheme of the Martiel-Goldbeter model[
19] and its numerical result. Where
is the intracelular cAMP density and
is the activity of the cAMP receptor.
Figure 3.
The scheme of the Martiel-Goldbeter model[
19] and its numerical result. Where
is the intracelular cAMP density and
is the activity of the cAMP receptor.
Figure 4.
Adaptation and hysteresis. The inset shows the hysteresis phenomenon of
observed by Janetopoulos et al.[
22]. Note that
G
and
= G
.
Figure 4.
Adaptation and hysteresis. The inset shows the hysteresis phenomenon of
observed by Janetopoulos et al.[
22]. Note that
G
and
= G
.
Figure 5.
A molecular network for spontaneous cAMP oscillations and adaptation.
Figure 5.
A molecular network for spontaneous cAMP oscillations and adaptation.
Figure 6.
Coupled rate equations corresponding to the molecular network in
Figure 5[
13], where the brackets [ ] stand for concentration.
Figure 6.
Coupled rate equations corresponding to the molecular network in
Figure 5[
13], where the brackets [ ] stand for concentration.
Figure 7.
Numerical analysis for the coupled rate equations shown in
Figure 6[
13].
Figure 7.
Numerical analysis for the coupled rate equations shown in
Figure 6[
13].
Figure 8.
A single Dicty cell on the surface.
Figure 8.
A single Dicty cell on the surface.
Figure 9.
Cell-cell adhesive Lennard-Jones type interaction and chemotaxis to cAMP. Where , , and is the diameter of the cell.
Figure 9.
Cell-cell adhesive Lennard-Jones type interaction and chemotaxis to cAMP. Where , , and is the diameter of the cell.
Figure 10.
Overview of the cellular dynamics method.
Figure 10.
Overview of the cellular dynamics method.
Figure 11.
Time development of 127 amoebas in a area, where is the diameter of an amoeba and a unit time step is min. Closed circles are Dicty cells; brighter color in the contour plots shows the higher extracellular cAMP density.
Figure 11.
Time development of 127 amoebas in a area, where is the diameter of an amoeba and a unit time step is min. Closed circles are Dicty cells; brighter color in the contour plots shows the higher extracellular cAMP density.
Figure 12.
Synchronization of intracellular biochemical reactions between cells. Mutual synchronization is achieved even when biochemical reactions are initiated at different times within each cell.
Figure 12.
Synchronization of intracellular biochemical reactions between cells. Mutual synchronization is achieved even when biochemical reactions are initiated at different times within each cell.
Figure 13.
Effect of changing the number of cells in an aggregate.
Figure 13.
Effect of changing the number of cells in an aggregate.
Figure 14.
Propagation of cAMP wave packets, where white circles represent Dicty cells.
Figure 14.
Propagation of cAMP wave packets, where white circles represent Dicty cells.
Figure 15.
Relationship between cell size and noise level in chemotaxis. When cells become small, as in (b), the noise level can become larger than the detectable chemical density difference before and after the cell.
Figure 15.
Relationship between cell size and noise level in chemotaxis. When cells become small, as in (b), the noise level can become larger than the detectable chemical density difference before and after the cell.
Figure 16.
Hypothesis: In a multi-receptor system, noise is detected randomly by each receptor, and the true periodic signal is detected simultaneously by nearby receptors.
Figure 16.
Hypothesis: In a multi-receptor system, noise is detected randomly by each receptor, and the true periodic signal is detected simultaneously by nearby receptors.
Figure 17.
Noise suppression and true signal amplification by a group of 10 receptors as an excitatory system. Here, the noise is set to 10 times the true signal. The signal transmitted inside the cell is amplified 10 times more than outside the cell, but the noise is almost completely suppressed[
27].
Figure 18.
Interaction between two boats.
Figure 18.
Interaction between two boats.
Figure 19.
Aggregation of 91 particles (black circles, water molecules). The read arrows are the velocity vectors of the surrounding medium (air).
Figure 19.
Aggregation of 91 particles (black circles, water molecules). The read arrows are the velocity vectors of the surrounding medium (air).
Figure 20.
A simplified mathematical model of the Dity cell shown in
Figure 8.
Figure 20.
A simplified mathematical model of the Dity cell shown in
Figure 8.
Figure 22.
Synchronization of 10 Hodgkin-Huxley neurons, where V is the membrane voltage, is the current applied externally to the neurons, m and h are the sodium ion activation and deactivation gate functions, and n is the potassium ion activation gate function.
Figure 22.
Synchronization of 10 Hodgkin-Huxley neurons, where V is the membrane voltage, is the current applied externally to the neurons, m and h are the sodium ion activation and deactivation gate functions, and n is the potassium ion activation gate function.
|
Disclaimer/Publisher’s Note: The statements, opinions and data contained in all publications are solely those of the individual author(s) and contributor(s) and not of MDPI and/or the editor(s). MDPI and/or the editor(s) disclaim responsibility for any injury to people or property resulting from any ideas, methods, instructions or products referred to in the content. |
© 2025 by the authors. Licensee MDPI, Basel, Switzerland. This article is an open access article distributed under the terms and conditions of the Creative Commons Attribution (CC BY) license (http://creativecommons.org/licenses/by/4.0/).