
Submitted:
29 January 2025
Posted:
30 January 2025
You are already at the latest version
Abstract
This paper assesses the thermodynamic stability of clay minerals in the upper organo-mineral horizon of podzolic soil, as well as in the rhizosphere of Norway spruce (Picea abies (L.) H. Karst.) and Norway maple (Acer platanoides L.). Moreover, it determines the impact of soil organic matter on thermodynamic stability of clay minerals. Calculations of ΔGf and the saturation index (SI) for clay minerals in laboratory experiments simulating soil conditions without soil moisture outflow allowed us to find out that the thermodynamic stability of clay minerals decreased in the series: kaolinite > illite > vermiculite > chlorite. The spruce rhizosphere contained kaolinite, vermiculite and illite in the lowest thermodynamic stability, while the soil under maple showed the highest thermodynamic stability of clay minerals due to the differences in the properties of soil organic matter in the rhizospheres of different tree species. Laboratory experiments on the sorption of soil humic acid (HA) on clay minerals demonstrated that sorbed HA decreased the thermodynamic stability of biotite and increased the thermodynamic stability of kaolinite and muscovite. Thermodynamic stability of clay minerals decreased with increased proportion of sorbed thermolabile organic matter.
Keywords:
clay minerals
; organo-mineral interactions
; thermodynamic stability of minerals
; thermal stability of humic acid
; rhizosphere
1. Introduction
The approach to assess the stability of clay minerals in rocks and soils using the principles of equilibrium thermodynamics became widespread in the second half of the 20th century [1,2,3] and is still used today [4,5,6]. The relevance of this approach for soil science is determined by the fact that the main source of K+, Ca2+, Mg2+, especially in low-fertility soils of forest ecosystems, is clay minerals [7,8,9]. In acidic forest soils, the availability of nutrients is a factor that inhibits plant growth [10,11,12]. Weathering of minerals in the soil is considered the main factor in the sustainable development of forests [13]. Knowledge of how individual plant species and their communities affect mineral weathering is crucial to predict ecosystem productivity in the long term and develop ecosystem development strategies [14].
It is well-known that the processes of mineral weathering occur with greater intensity in the rhizosphere than in the bulk soil. This is due to the fact that the rhizosphere continuously receives the main agents of mineral dissolution and transformation, i.e. root exudates and metabolites of microorganisms which contain protons and anions of organic acids with high complexing capacity [15,16,17,18]. This statement is confirmed by numerous experimental studies on different soils. Nevertheless, a number of studies which assess the thermodynamic stability of individual minerals in relation to the solution composition in the rhizosphere of various plant species and in the bulk soil is very limited [7,19]. The study of rhizosphere processes including mineral weathering allows us to expand and clarify our understanding of carbon biogeochemistry, availability of various nutrients, and the toxicity of some pollutants.
The most sensitive indicator of the rhizosphere chemical state is soil organic matter due to the release of exudates, accumulation and transformation of necromass of plants and microorganisms. However, the impact of soil organic matter on the thermodynamic stability of minerals in the soil has not yet been studied.
The aim of this work is to assess the thermodynamic stability of kaolinite, illite, vermiculite, and soil chlorite in the rhizosphere of Norway spruce (Picea abies (L.) H. Karst.) and Norway maple (Acer platanoides L.), as well as in the corresponding bulk podzolic soil. In addition, this paper will study the impact of soil organic matter on their thermodynamic stability.
2. Materials and Methods
The objects of the study are 100-200 g samples of the rhizosphere of Norway spruce (Picea abies L.), Norway maple (Acer platanoides L.), and bulk soil, taken from the organo-mineral horizon of Retisol [20] on the territory of the Central Forest State Natural Biosphere Reserve (the Tver region, Russian Federation). The sampling was carried out in 5-fold repetition.
The clay fraction of the soil was isolated by sedimentation without preliminary chemical treatment. The suspensions were coagulated with a 1 M CaCl2 solution and washed to remove excess chloride ion by dialysis against distilled water. The mineral composition of the clay fraction of the samples was determined by X-ray diffractometry using a MiniFlex 600 diffractometer (Rigaku, Japan) in the following mode: CuKα radiation, voltage and current in the X-ray tube 30 kV and 15 mA, detector – D/teX. The analysis was carried out for oriented samples of clay fractions in the air-dry state saturated with ethylene glycol and calcined at temperatures of 350°C and 550°C. To assess the chemical composition of the mineral phases, X-ray diffractometry was carried out for non-oriented samples.
The total content of Al, Si, Na, K, Ca, Mg, Fe, Mn, Ti in the clay fractions was measured by X-ray fluorescence analysis (S2 Picofox, Bruker, USA). The content of Al, Si, Fe, Mn of non-silicate soil minerals was estimated by the ICP-OES analysis of dithionite-citrate-bicarbonate extract (spectrometer Agilent 5110 ICP-OES, USA).
The equilibrium soil liquid phase was obtained after incubating the soil in laboratory beakers at 10 °C and 70 % (mass) humidity for 72 h with periodic stirring. The optimum soil moisture and incubation time were determined in a preliminary methodological experiment. The liquid phase was isolated by centrifugation in test tubes with a perforated bottom equipped with a liquid phase collector. Centrifugation was performed at 16639g (Eppendorf 5804 centrifuge, FA-45-6-30 rotor, Germany) for 15 min.
In the obtained liquid phase, pH and specific electric conductivity was measured with ion meter Mettler Toledo SevenGo pro, Switzerland. Also, concentration of Al, Si, Na, K, Ca, Mg, Fe, Mn, Ti (spectrometer Agilent 5110 ICP-OES, USA) chloride, sulfate, nitrite ions (capillary electrophoresis system Kapel-105M, Lumex, Russia), C and N (analyzer TOC-L CPH, Shimadzu, Japan). The activity of ions in the liquid phase was calculated in the program Visual MINTEQ using the NICA-Donnan model.
Potassium potential as a measure of K+ availability for plants was calculated using the formula ΔGK = -2.303 RT(pK – 0.5(pCa+pMg)).
Diffuse reflectance infrared Fourier-transform spectroscopy (DRIFTS) was carried out using an FT-801 device with a PRIZ adapter (Simex, Russia) in the range of 550-4000 cm-1. Before the analysis, the soil samples were additionally heated to 105°C for 15 min to remove adsorbed moisture. All spectra were recorded at a resolution of 2 cm-1; each spectrum of the sample was obtained by averaging 36 scans. The obtained spectra were smoothed by moving average method (window size – 15), subjected to multiplicative scatter correction and baseline correction. Peak identification was performed using the second derivatives of the spectra.
Thermal analysis was performed on a TGA/DSC 3+ analyzer (Mettler Toledo, Switzerland) in a synthetic air atmosphere (80% N2, 20% O2) at the heating rate of 10 °C/min. Before analysis, the samples were stored for several days in a desiccator over a saturated calcium nitrate solution to maintain a constant relative humidity of 55%. All measurements were made in duplicate. The experimental curves were processed using STARe Evaluation Software (v. 16.40). The Fityk program (v. 1.3.1) was used to calculate the area of the exothermic peaks; the baseline was drawn using a spline function with extreme points in the ranges of 150-200°C and 550-800°C [21].
Samples of kaolinite, muscovite, and biotite were used for sorption experiments. Humic acid isolated by the IHSS method from the organogenic horizon of peaty-podzolic-gleyic soil (PPG), collected near the sampling site of the beforementioned podzolic soil, was used as a sorbate. Kaolinite, muscovite and biotite were preliminary treated with 10% HCl to remove calcium and magnesium carbonates. After that, the clay fraction was isolated by sedimentation (precipitant – 1 M CaCl2 solution). The resulting clay fraction was washed from excess chloride ion by dialysis against distilled water, dried and ground in an agate mortar. A solution of HA at pH=4.5 (5 mM acetate buffer) was added to the weighed portions of the minerals prepared as described above in a mineral:solution ratio of 1:1000 (0.1 g per 100 ml). The resulting suspension was agitated on a shaker at 150 rpm for 5 h at room temperature. The supernatant was separated from the sediment by centrifugation at 489 g for 15 min. The resulting sediment was quantitatively transferred to evaporation dishes and dried at 40°C. The resulting material ground in an agate mortar, and the above was repeated twice. Distilled water was added to the sediment obtained after 3 sorption cycles in a 1:1000 ratio. The suspension was then shaken on a shaker for 5 hours at 150 rpm at room temperature. It was subsequently centrifugated again, and dried in a drying oven at 40 °C.
The incubation experiment with minerals without and after treatment with a HA solution was carried out for 150 days at a temperature of 25 °C and periodic stirring. Sterile model soil solution based on bidistilled water (pH = 3.5, acidification with chemically pure hydrochloric acid, with the addition of NaN3 to a concentration of 0.05% by weight) in hermetically sealed polypropylene tubes was added (ratio of 1 g per 100 ml) to the mineral samples. After the specified incubation time, the suspensions were centrifuged at 16639g (Eppendorf 5804 centrifuge, FA-45-6-30 rotor) for 15 min and filtered through a cellulose acetate membrane filter with a pore diameter of 0.45 μm. The analysis of the liquid phase composition was carried out by the ICP-OES (Agilent 5110 ICP-OES spectrometer).
Statistical processing and visualization of data were performed using the R programming language. The Spearman test was used for correlation analysis. The Wilcoxon test was used for comparison of means. The significance level in all statistical analyses was set to 5%. In the text, all mentioned differences in means and correlation coefficients are significant, unless otherwise stated.
3. Results
3.1. Qualitative Analysis of the Mineral Composition of Clay Fractions in Soil and Rhizosphere
The X-ray diffraction patterns of the clay fractions of all air-dry samples were visually indistinguishable (Fig. 1, Fig. 2): all of them contained a symmetrical intense peak with a maximum at 12.4 °2θ (d/n 0.72 nm) which did not change upon saturation with ethylene glycol and calcination at 350°C, but disappeared after calcination at 550°C. All of them also contained an asymmetrical peak in the range of 9.0-5.5°2θ (d/n in the region of 1.0-1.6 nm) in the air-dry state which shifted toward larger °2θ after calcination at 350°C and became bimodal after saturation with ethylene glycol. The change in the position of the peaks on the X-ray patterns after the above treatments indicated the presence of minerals with a labile crystal lattice (vermiculite) and vermiculite and/or smectite layers in the mixed-layer illite-vermiculite or illite-smectite. The presence of a low-intensity peak with a maximum at 6.3°2θ (d/n 1.4 nm) on the X-ray patterns of the samples calcined at 550°C (Fig. 1, Fig. 2) indicated an insignificant content of chlorite in the samples.
3.2. Assessment of Chemical Composition of Mineral Phases of Clay Fractions in Soil and Rhizosphere
Elemental analysis of the mineral part of the clay fraction samples (XRF) and the analysis of the citrate-dithionite-bicarbonate extract allowed us to assess the chemical composition of silicates in the clay fraction. Using the Rietveld full-profile modeling of diffraction patterns for mineral phases identified in the clay fractions, such as kaolinite, chlorite, illite and vermiculite, we selected minerals with a crystallochemical formula that best corresponded to the experimental X-ray diffraction pattern of the clay fraction samples. Modeling was not performed for montmorillonite and soil chlorite (HIV/HIS), since independent peaks from smectite group minerals were not observed in the X-ray diffraction patterns, and there is no database with crystallochemical formulas for soil chlorite. Comparing the chemical composition of the clay fraction and crystallochemical characteristics of the candidate phases resulted in the chemical formulas of the phases for kaolinite, chlorite, illite and vermiculite in the clay fraction of the podzolic soil (Table 1). These formulas can be an average estimate of the chemical composition of the corresponding minerals and were used for thermodynamic calculations. Determining exact chemical composition of each present mineral phase was not possible due to the presence of mixed-layer minerals, complex mineral composition of the clay fraction and distortions in the X-ray diffraction patterns associated with organic matter and non-silicate Fe compounds.
For mineral phases with a known chemical composition, the Gibbs free energy of crystallization was calculated in the ClayTherm software based on the ΔG estimation models proposed in the literature considering the chemical composition of minerals [4,6,22]. The equilibrium constants of the reaction of congruent dissolution of minerals at 10 °C (the temperature of the incubation experiment for the extraction of the equilibrium liquid phase of soils) were calculated (Table 1) on the basis of the ΔG of the mineral phases of the clay fraction, as well as the minimum and maximum ΔG values of the corresponding minerals known from literature sources.
3.3. Assessment of Mineral Thermodynamic Stability in the Composition of Clay Fractions in Soil and Rhizosphere
Calculation of the saturation index (SI) for each mineral phase with a known chemical composition showed that the thermodynamic stability of minerals decreased in the series kaolinite > illite > vermiculite > chlorite (Table 2) under conditions of water-saturated podzolic soil. In all experiment variants, the SI value was significantly less than 0, indicating unsaturation of the liquid phase of the podzolic soil relative to the predominant clay minerals. The minerals exhibiting the least stability were found in the rhizosphere of spruce, while the minerals demonstrating the highest stability were present in the soil under maple. The results on the composition analysis of the equilibrium liquid soil phase are given in the Appendix (Table A1).
The saturation index does not take into account the heterogeneity of the chemical composition of individual mineral phases. Therefore, saturation diagrams were constructed with lines corresponding to the minimum and maximum thermodynamic stability of the mineral phase according to literature data. These lines form a stability band that corresponds to a state close to equilibrium and can also be used to assess mineral thermodynamic stability.
The dissolution of kaolinite group minerals in the soil under spruce was a thermodynamically allowed process relative to the phase with experimentally estimated composition (Fig. 3, solid line). In contrast, in the soil under maple, kaolinite fell into the stability band.
The dissolution of vermiculite, chlorite, and minerals of the mica and illite group was a thermodynamically allowed process in all samples (Fig. 4, Table 2).
The liquid phase of the soil was in equilibrium with montmorillonite and soil chlorites (Fig. 5). However, since it was not possible to establish the chemical composition of these mineral phases, the corresponding diagrams do not contain a line corresponding to the chemical composition of montmorillonite and soil chlorites. Instead, only the predicted stability region is given.
3.4. Organic Matter Properties of Clay Fractions in Soil and Rhizosphere
The chemical composition of the soil organic matter (SOM) in the clay fraction assessed by DRIFTS was more affected by rhizosphere processes (Fig. 6) than by the plant species (Fig. 10). At the same time, the clay fraction exhibited less pronounced clustering of samples compared to the soil not separated into fractions. The discrimination between the rhizosphere and non-rhizosphere space was attributed to the bands in the ranges of 1000-1200 cm-1 and 1800-2000 cm-1 associated with carbohydrates and carboxyl groups, respectively [29, 30]. The SOM of the rhizosphere clay fraction showed a relative accumulation of polysaccharides (1000-1200 cm-1), while the clay fraction of the bulk soil, accumulated compounds enriched in carboxyl groups (1800-2000 cm-1) (Fig. 6).
The DSC curves of the clay fractions (Fig. 7) identify three main thermal effects: the endothermic effect of dehydration (50-150 °C), the endothermic effect of kaolinite dehydroxylation (500-550°C), and the exothermic effect of SOM thermal destruction in the range of 250-450 °C. The thermal effect of SOM thermal destruction was satisfactorily described after deconvolution of the experimental curves by 3 conditional components with peaks in the region of 240-260, 280-300, and 330-350°C named Exo1, Exo2, and Exo3, respectively.
To clarify the possible chemical nature of the thermal fractions of SOM, a correlation analysis was conducted between the areas exhibiting thermal effects and the intensities of the DRIFTS spectrum bands. The results of this analysis indicated a high degree of interrelation between various combinations of these parameters (Fig. 8). The areas of thermal effects at 240-260, 280-300 and 330-370°C (Exo1-Exo3) positively correlated with the bands of 1099, 1160, 1185, 1238, 2860 and 2927 cm-1, indicating their predominant connection with carbohydrates (including cellulose), soil lipids and other aliphatic substances.
3.5. Properties of Clay Minerals Before and After Humic Acid Treatment
Kaolinite contained small amounts of mica with d {001} 1.01 nm (Fig. 9). The diffraction pattern of muscovite showed weak peaks from kaolinite (0.72 nm), quartz (0.426 nm) and feldspars (0.322 nm) (Fig. 9).
Treatment of minerals with a humic acid (HA) solution resulted in new absorption bands in the DRIFT spectra of minerals in the 1000-1100 and 1500-1800 cm-1 ranges. These bands were also the most intense absorption bands of the spectrum of the original humic acid (Fig. 10). The absorption bands in these ranges corresponded to the carbohydrate (1000-1100 cm-1), aromatic (1500-1600 cm-1), and carboxyl components (1700-1800 cm-1) of HA [29,30].
Clustering in the coordinates of the principal components of the absorption bands in the region of 1200-1900 cm-1, corresponding to the most intense absorption bands of the original HA (Fig. 11), allowed us to reveal differences in the composition of the obtained organo-mineral complexes. Muscovite and biotite formed independent clusters: muscovite was discriminated by the intensity of the bands at 1212, 1240 (carboxyl, phenolic groups), 1778-1897 cm-1 (carboxyl groups); biotite – by the intensity of the bands at 1535-1594 cm-1 (aromatic compounds). The composition of HA sorbed on kaolinite was characterized by a decreased proportion of carboxyl groups and an increased proportion of aromatic (1666, 1692 cm-1) and aliphatic (1482 cm-1) components if the number of sorption cycles increased.
The DSC curve of the HA showed a weak endothermic effect at 100°C and a broad, intense exothermic effect in the range from 350 to 600°C with its maximum intensity at 450°C (Fig. 12). The DSC curves of organomineral complexes showed an asymmetric exothermic effect (Fig. 12) with peaks at 360 and 380°C after the first and subsequent cycles of HA sorption in the temperature range of 300–400°C.
The most effective sorbent in relation to HA was kaolinite. Biotite and muscovite did not differ significantly in HA sorption efficiency in terms of mass (Table 3). Sorption of HA on minerals led to its fractionation by chemical composition. Sorption on biotite had little or no change in the C/N of humic acid. In contrast, the C/N ratio increased significantly after sorption on kaolinite and muscovite, indicating the depletion of sorbed HA in nitrogen compounds (Table 3). Moreover, fewer nitrogen-containing compounds were sorbed on kaolinite than on muscovite. Similar results were obtained in the sorption experiment with leonardite HA [31].
3.6. Effect of Humic Acid on Saturation Indices of Clay Minerals
The sorption of HA led to a significant change in the saturation index of all minerals. This indicates the influence of not only dissolved but also sorbed organic matter on the thermodynamic stability of soil minerals. According to thermodynamic stability under the model soil solution, the minerals were arranged in the series: kaolinite > muscovite > biotite (Fig. 13).
3.7. Relationship Between Organic Matter Properties in the Clay Fraction and Clay Mineral Saturation Indices
A weak negative correlation was found between mineral saturation indices and the organic matter carbon content in the clay fraction (Fig. 14).
The chemical composition of SOM also had a significant but relatively weak effect on the saturation indices of clay minerals. A positive correlation between the saturation indices and the absorption bands in the DRIFTS spectra was observed for the bands at 692-750 cm-1, a negative one – for the bands at 1505 (C=C of aromatic rings), 1708 (carboxyl bond) cm-1 (Fig. 15).
The mineral saturation indices were negatively correlated with the area of the exothermic effects Exo1 and Exo2 (Fig. 16).
4. Discussion
4.1. Transformation of Clay Minerals in the Rhizosphere According to XRD Data
The diffraction patterns of the clay fraction samples from the maple rhizosphere (replicates 2-5) and the bulk soil under the maple (replicates 2-5), calcined at 350°C, showed diffuse scattering, corresponding to d/n from 1.4 nm to 1.0 nm (sometimes with small maxima in the region of 1.2-1.3 nm). This indicates incomplete compression of the crystal lattices of labile minerals to 1.0 nm (Fig. 17). The described changes in the diffraction patterns of the samples after calcination at 350°C indicate the presence of soil chlorites (HIV/HIS) of higher chloritization (aluminization) in the clay fraction from the soil under the maple.
The X-ray images of the spruce rhizosphere and the bulk soil under the spruce also revealed soil chlorites. However, the degree of chloritization (aluminization) of these minerals was significantly lower than in the soils under the maple. The main factors controlling the degree of chloritization (aluminization) of soil chlorites are the acid-base properties of the soils and the concentration of LMWOAs. It is known that the rhizosphere of coniferous trees is characterized by higher acidity compared to the rhizosphere of broad-leaved trees due to more intensive release of LMWOAs, which makes the polymerization of aluminum aquahydroxocomplexes more difficult, including the interlayer space of labile minerals. Thus, the rhizosphere of maple and the soil under maple create more favorable acid-base conditions for chloritization (aluminization) compared to the soil under the spruce.
Deconvolution of the X-ray diffraction region of ethylene glycol-saturated clay fractions in the range from 5°2θ to 9.5°2θ allowed us to identify 4 regions with peak maxima corresponding approximately to 1.35; 1.24; 1.13 and 1.01 nm (Fig. 18). The peak at 1.35 nm corresponds to the reflection of vermiculite group minerals, 1.01 nm – to the reflection {001} of illite and micas, and the rest – to mixed-layer illite-vermiculites and illite-smectites. Significant differences between the rhizosphere and the bulk soil were found only for spruce and the peak area of approx. 1.35 nm (Fig. 18), which may indicate a deeper degree of transformation of minerals with a labile crystal lattice in the spruce rhizosphere compared to the maple rhizosphere. At the same time, a corresponding increase in the sum of the peak areas of 1.24 and 1.13 nm was not observed, and the position of the peaks did not shift to small °2θ (Fig. 18).
4.2. The Impact of Rhizosphere Processes on the Saturation Index of Clay Minerals
According to the calculated saturation indices (Table 2), rhizosphere processes can lead to a significant decrease (by 0.2-0.5 units) in the thermodynamic stability of clay minerals. The main chemical factors affecting mineral weathering in soils are the pH of the liquid phase and the composition of organic matter. The change in the pH of the equilibrium liquid phase (see Table A1 in the Appendix) generally corresponds to the change in the SI values: the rhizosphere and the bulk soil of spruce are characterized by lower pH values, which is reflected in the decrease in the SI values.
The differences in SI are more pronounced for plant communities (maple and spruce) than for soil loci (rhizosphere and bulk soil), which may indicate the influence of the plant and its litter on mineral transformation at a relatively large distance from the root surface (20-30 mm), as well as the leading role of the environmental response.
According to the calculated ΔG values of vermiculite, illite and chlorite (Table 1), the ΔG of the vermiculitization reaction of chlorite and illite are positive and are approximately 2000 and 1650 kcal/mol, respectively. Thus, the transformation of illite or chlorite into vermiculite in podzolic soil requires a significant amount of energy. The ΔG value for illite transformation into montmorillonite is presumably positive (since there is no precise information on the thermodynamic properties of montmorillonite in the studied podzolic soil), but lower than that of vermiculite (since montmorillonite was in the stability zone, Fig. 5). Therefore, incongruent dissolution of illite can occur with the formation of both illite-vermiculite and illite-smectite mixed-layer structures. The predominance of one or the other product depends on the composition of the soil solution.
As mentioned above, it was not possible to determine the chemical composition of the soil chlorite (HIV/HIS) phase. The stability zone constructed using literature data differs from the others (Fig. 5) by having the largest range along the ordinate axis, which reflects the variability in the composition of this mineral group. All points corresponding to soil samples are within the stability zone, which may indicate an equilibrium between soil chlorites and the liquid phase of the podzolic soil. The origin of soil chlorites is associated with several possible mechanisms: aggradation (synthesis of fragments of an additional octahedral sheet in the interlayer space of vermiculites and smectites) and degradation (destruction of the additional octahedral sheet of chlorites). The calculated ΔG value of the reaction of soil chlorite formation from illite, montmorillonite or vermiculite is negative, which confirms the aggradation theory of their formation under the considered conditions.
Although it was impossible to determine the chemical composition of montmorillonite in the samples, all points on the stability diagram were in the stability zone (Fig. 5). An exact calculation of ΔG for the smectitization reaction of vermiculite and illite is impossible, but a large difference in ΔG for crystallization between montmorillonite and vermiculite/illite suggests the possibility of transformation of vermiculite and illite into montmorillonite. Notably, this process may be particularly active in the rhizosphere. A discrete phase of smectite group minerals was not detected in the XRD patterns of the clay fractions from the rhizosphere (there is no independent peak corresponding to d/n 1.68 nm in the XRD patterns of the samples saturated with ethylene glycol) (Fig. 17). Nevertheless, montmorillonite layers may be part of mixed-layer minerals and their proportion in the mixed-layer structures will be greater in the rhizosphere than in the bulk soil.
Low thermodynamic stability of illite and micas in podzolic soil (Table 2) is associated with insufficient potassium activity in the liquid phase to reach equilibrium (Table A1). In this case, vermiculite illitization under podzolic soil conditions is a spontaneous process with ΔG = -2200 kcal/mol. Thus, potassium activity in the liquid phase of podzolic soil is high enough to transform vermiculite into illite, but the soil solution is unsaturated with respect to illite, which facilitates its further dissolution.
The stability of illite in the rhizosphere was significantly lower than in the bulk soil (Table 2), which is related to the absorption of potassium by plants and microorganisms. The ΔG of congruent dissolution of illite in the spruce rhizosphere is 0.56 kcal/mol, and in the maple rhizosphere is 0.80 kcal/mol. This means that, all other things being equal, more energy should be applied to dissolve 1 mol of illite in the maple rhizosphere than in the spruce rhizosphere. Consequently, more intense weathering of micas and illite should be expected in the spruce rhizosphere.
The ΔG of the illite vermiculitization reaction is 1900 kcal/mol, indicating that this process cannot occur spontaneously. Thus, ensuring optimal potassium supply is a process that requires high energy expenditure by the plant. In this regard, during periods of high potassium supply, the biogenic transformation of micas into labile minerals is likely to be significantly suppressed.
The value of potassium potential in the soil under spruce is significantly higher in the rhizosphere than in the bulk soil (Fig. 19).
4.3. Dependence of Humic Acid Composition on Sorption in Different Minerals
In the case of muscovite and biotite, the sorption cycles of HA mainly affected the intensity of the absorption bands, but the chemical composition of the sorbed HA did not change significantly from the first to the third sorption cycle. This indicates that the sorption of HA on mineral sorption sites is predominant in all sorption cycles, while a change in the composition of sorbed HA could indicate the appearance of new active sorption centers due to multilayer sorption. The chemical composition of HA sorbed on kaolinite varied significantly between sorption cycles (Fig. 11), indicating the possible occurrence of multilayer sorption.
The reasons for the more effective sorption of HA on kaolinite compared to micas are related to the experimental conditions (pH of the sorbate solution is 4.5), where HA was sorbed mainly due to hydrophobic bonds.
The revealed regularities may be associated with selective sorption of relatively thermolabile HA components. According to TG50 and DSC50, the thermal stability of HA sorbed on minerals decreased in the series: muscovite > biotite > kaolinite (Table 3). This phenomenon is associated with the chemical composition of the sorbed OM, and, possibly, its conformation on the mineral surface. Muscovite and biotite sorb on their surface mainly HA components, which are resistant to thermal destruction and enriched in carboxyl and aromatic groups. In addition, kaolinite actively sorbs aliphatic and, presumably, carbohydrate components of HA, which are characterized by lower thermal stability.
4.4. Impact of Sorbed Organic Matter on the Thermodynamic Stability of Clay Minerals
The impact of sorbed organic matter on the thermodynamic stability of clay minerals can involve two mechanisms with opposite action. Sorption of organic matter can lead to partial destruction of the mineral crystal lattice, resulting in the increased rate of mineral dissolution. Additionally, in the absence of solution outflow, the ionic product of the activities by the cation components of the crystal lattice increases, which in turn leads to increased SI. In the case of unsaturated solutions in contact with minerals, an increase in SI signifies an approach to equilibrium, corresponding to a SI value of 0. This pattern was observed in kaolinite and muscovite (Fig. 13): treatment with a HA solution resulted in an increase in SI by 1-3 units. The difference between the initial mineral and the organo-mineral complex is at its maximum at the initial stages of incubation and diminishes with increasing incubation time. Furthermore, the sorption of HA on kaolinite can result in a decrease in the dehydroxylation temperature, suggesting partial destruction of the crystal lattice [31].
The second mechanism consists of partial or complete isolation of the mineral surface from the contacting solution by a layer of sorbed organic matter. This layer hinders the transition of ions from the crystal lattice into the solution. As a result, there is a decrease in the ionic product of activities compared to the untreated HA solution of the mineral. Consequently, there is a decrease in the SI. In this scenario, the mineral following organic matter sorption is further from equilibrium compared to the pure mineral. This variant corresponds to the experiment with biotite (Fig. 13), where the sorption of HA led to a decrease in the SI by approximately 2 units.
The thermodynamic stability of kaolinite and muscovite increased following the sorption of HA, as the treatment with HA solution may have led to the partial dissolution of the least stable crystallites. Thus, enhanced thermodynamic stability of minerals should be expected in both the rhizosphere and the bulk soil following the sorption of humic substances with a weak moisture outflow.
The impact of water-soluble HA in the incubation solution on the saturation indices can be neglected, as the method for obtaining organomineral complexes involved a complete removal of water-extractable HA at a pH = 6.5. Furthermore, the solubility of HA in water at pH = 4.5, corresponding to the incubation experiment conditions, is minimal.
The change in the thermodynamic stability of minerals was not affected by HA fractionation in terms of chemical and thermal properties due to sorption. Thus, the thermodynamic stability of minerals can be mostly affected by the conformation of HA on the mineral surface, as evidenced by the model experiment. Single- and multi-layer sorption of HA (in the case of muscovite and kaolinite, respectively) has a similar effect on the SI of the mineral (it increases after sorption of HA) and does not affect the rate of achieving equilibrium compared to the original mineral. A decrease in the thermodynamic stability of biotite may be associated with the formation of an insulating layer of HA on the surface of the mineral, held by bonds with Fe in the crystal lattice. This layer complicates the transition of biotite dissolution products into the solution, leading to a decrease in the SI compared to the original mineral
4.5. Relationship Between the Organic Matter Properties of Clay Fractions from Soil and Rhizosphere and Saturation Indices of Clay Minerals
The findings of the incubation experiment demonstrated that the sorption of HA increased the thermodynamic stability of kaolinite and muscovite (Fig. 17), thereby contradicting the previously revealed negative correlation between the mineral saturation indices and the carbon content in the clay fraction. The relatively modest correlation coefficient, ρ = -0.49, suggests the presence of other factors influencing the mineral saturation indices beyond the organic carbon content. The increased saturation index with decreased organic carbon content may be associated with an increase in microbial activity, leading not only to an intensification of mineral weathering, but also to the mineralization of organic matter.
The negative correlation between SI and the 1708 cm-1 band is consistent with the results of the incubation experiment which revealed that sorption involving carboxyl groups in the HA composition led to a decrease in SI due to partial destruction of the mineral crystal lattice. However, the intensity of other bands corresponding to vibrations of the carboxyl bond did not correlate with SI. This finding suggests that the 1708 cm-1 band may be specifically linked to carboxyl groups present within the sorbed organic matter. The negative correlation between SI and the 1505 cm-1 band can be related to the thermodynamic stability of minerals indirectly through microbial activity, as more active humification leads to partial dissolution of minerals.
The band at 750 cm-1 is associated with polyaromatic compounds [30]. Positive correlation between SI and this band intensity is consistent with the increase in SI during the sorption of aromatic components of HA on biotite in the incubation experiment (Fig. 17). However, the relationship between the band at 692 cm-1 and the composition of soil organic matter has not yet been established and requires further research.
The thermal properties of the clay fraction SOM are associated with the chemical composition of SOM (Fig. 8), yet they also offer insights into the strength of the SOM bond to the soil mineral matrix. All three thermal effects (Exo1-Exo3) had similar compositions of functional groups (Fig. 8). This suggests a potential correlation between the nature of these effects and the strength of the SOM bond to the soil mineral matrix (Exo1 is the least strongly bound fraction, and Exo3 is the most strongly bound SOM fraction). Consequently, the thermodynamic stability of minerals is reduced by the presence of relatively thermolabile SOM fractions. A similar pattern was observed for the total carbon content, which may be related to the accumulation of thermolabile compounds resulting from increased activity of microorganisms. Furthermore, thermolabile SOM fractions can reduce the thermodynamic stability of minerals by isolating the mineral surface from the soil solution (see Section 3.6).
5. Conclusions
According to the experiment, the thermodynamic stability of clay minerals decreased in the series: kaolinite > illite > vermiculite > chlorite. In the spruce rhizosphere, kaolinite, vermiculite and illite had the lowest thermodynamic stability, while in the soil under maple these minerals had the highest thermodynamic stability. This phenomenon can be explained by the differences in the properties of SOM (according to DRIFTS data) in the rhizospheres of different tree species. The SOM of the clay fraction from the rhizospheres of both species accumulated aliphatic compounds and carbohydrates characterized by lower thermal stability. Sorption of humic acid of soil origin on clay minerals changed the thermodynamic stability of clay minerals: the thermodynamic stability of biotite decreased, while that of kaolinite and muscovite increased compared to minerals not treated with humic acid. Moreover, the thermodynamic stability of clay minerals decreased with an increased presence of thermolabile organic matter, which is presumably related to the transformation products of microbial necromass.
The results obtained in this study support the importance of rhizosphere analysis for understanding plant mineral nutrition and making accurate predictions about it. Further study of the thermodynamic stability of minerals in podzolic soils could lead to the creation of models that predict mineral saturation indices based on climatic factors and soil moisture distribution patterns in pores of different sizes.
Supplementary Materials
The following supporting information can be downloaded at the website of this paper posted on Preprints.org. Table S1: Activities of metal cations, H4SiO4 (µmol/L) and pH of the equilibrium liquid phase.
Author Contributions
Conceptualization, I.D. and I.T.; methodology, I.D., Y.I. and R.A.; validation, I.D. and I.T.; formal analysis, I.D.; investigation, I.D., Y.I. and R.A.; resources, I.T. and Y.I.; data curation, I.D.; writing—original draft preparation, I.D.; writing—review and editing, I.D. and I.T.; visualization, I.D.; supervision, I.T. All authors have read and agreed to the published version of the manuscript.
Funding
This research received no external funding.
Data Availability Statement
Data will be made available from corresponding author upon request.
Acknowledgments
XRD analysis of samples was carried out using the equipment funded by the Development Program of the Lomonosov Moscow State University. The authors would like to thank Philippe Blanc for provided ClayTherm program.
Conflicts of Interest
The authors declare no conflicts of interest.
Abbreviations
The following abbreviations are used in this manuscript:
| XRD | X-ray diffraction |
| DRIFTS | Diffuse reflectance infrared Fourier-transform spectroscopy |
| DSC | Differential scanning calorimetry |
| HA | Humic acid |
| SOM | Soil organic matter |
| SI | Saturation index |
| LMWOA | Low-molecular weight organic acid |
Appendix A

Table A1.
Activities of metal cations, H4SiO4 (µmol/L) and pH of the equilibrium liquid phase (arithmetic mean ± standard deviation, n = 5).
Table A1.
Activities of metal cations, H4SiO4 (µmol/L) and pH of the equilibrium liquid phase (arithmetic mean ± standard deviation, n = 5).
| Sample | pH | Al3+ | Ca2+ | Fe2+ | K+ | Mg2+ | Mn2+ | Na+ | H4SiO4 |
|---|---|---|---|---|---|---|---|---|---|
| Rhizosphere (spruce) | 3.71 ± 0.1 | 0.15 ± 0.02 | 10.36 ± 1.51 | 0.47 ± 0.06 | 284.45 ± 23.75 | 7.26 ± 0.76 | 2.3 ± 0.74 | 167.18 ± 31.12 | 250.53 ± 86.44 |
| Bulk soil (spruce) |
3.86 ± 0.1 | 0.25 ± 0.02 | 13.35 ± 2.03 | 0.09 ± 0.01 | 295.52 ± 99.0 | 9.01 ± 1.14 | 7.91 ± 1.16 | 133.53 ± 24.63 | 276.7 ± 42.63 |
| Rhizosphere (maple) | 3.94 ± 0.1 | 0.24 ± 0.04 | 14.37 ± 2.56 | 0.03 ± 0.01 | 236.09 ± 43.63 | 11.18 ± 1.76 | 3.00 ± 0.29 | 149.06 ± 54.68 | 238.86 ± 65.07 |
| Bulk soil (maple) |
3.92 ± 0.2 | 0.33 ± 0.05 | 15.3 ± 3.32 | 0.58 ± 0.19 | 193.96 ± 49.69 | 10.87 ± 2.4 | 6.46 ± 0.71 | 103.6 ± 26.26 | 239.01 ± 20.93 |
References
- Kittrick, J.A. Soil Minerals in the Al2O3-SiO2-H2O System and a Theory of Their Formation. Clays Clay Miner 1969, 17, 157–167. [Google Scholar] [CrossRef]
- Nriagu, J.O. Thermochemical Approximations for Clay Minerals. Am Mineral 1975, 60, 834–839. [Google Scholar]
- Karathanasis, A.D. Seasonal Variation in Solution Composition and Mineral Stability of Two Kentucky Alfisols. Soil Science Society of America Journal 1991, 55, 881–890. [Google Scholar] [CrossRef]
- Blanc, P.; Vieillard, P.; Gailhanou, H.; Gaboreau, S.; Gaucher, É.; Fialips, C.I.; Madé, B.; Giffaut, E. A Generalized Model for Predicting the Thermodynamic Properties of Clay Minerals. Am J Sci 2015, 315, 734–780. [Google Scholar] [CrossRef]
- Gaboreau, S.; Gailhanou, H.; Blanc, P.; Vieillard, P.; Made, B. Clay Mineral Solubility from Aqueous Equilibrium: Assessment of the Measured Thermodynamic Properties. Applied Geochemistry 2020, 113. [Google Scholar] [CrossRef]
- Gailhanou, H.; Blanc, P.; Rogez, J.; Mikaelian, G.; Kawaji, H.; Olives, J.; Amouric, M.; Denoyel, R.; Bourrelly, S.; Montouillout, V.; et al. Thermodynamic Properties of Illite, Smectite and Beidellite by Calorimetric Methods: Enthalpies of Formation, Heat Capacities, Entropies and Gibbs Free Energies of Formation. Geochim Cosmochim Acta 2012, 89, 279–301. [Google Scholar] [CrossRef]
- Arocena, J.M.; Glowa, K.R. Mineral Weathering in Ectomycorrhizosphere of Subalpine Fir (Abies lasiocarpa (Hook. ) Nutt.) as Revealed by Soil Solution Composition. Forest Ecology and Managment 2000, 133, 61–70. [Google Scholar]
- Bakker, M.R.; George, E.; Turpault, M.-P.; Zhang, J.L.; Zeller, B. Impact of Douglas-Fir and Scots Pine Seedlings on Plagioclase Weathering under Acidic Conditions; 2004; Vol. 266.
- Calvaruso, C.; Mareschal, L.; Turpault, M.-P.; Leclerc, E. Rapid Clay Weathering in the Rhizosphere of Norway Spruce and Oak in an Acid Forest Ecosystem. Soil Science Society of America Journal 2009, 73, 331–338. [Google Scholar] [CrossRef]
- Gobran, G.R.; Clegg, S.; Courchesne, F. Rhizospheric Processes Influencing the Biogeochemistry of Forest Ecosystems. Biogeochemistry 1998, 42, 107–120. [Google Scholar] [CrossRef]
- Calvaruso, C.; Turpault, M.P.; Leclerc, E.; Ranger, J.; Garbaye, J.; Uroz, S.; Frey-Klett, P. Influence of Forest Trees on the Distribution of Mineral Weathering-Associated Bacterial Communities of the Scleroderma Citrinum Mycorrhizosphere. Appl Environ Microbiol 2010, 76, 4780–4787. [Google Scholar] [CrossRef]
- Mouas Bourbia, S.; Barré, P.; Boudiaf Naït Kaci, M.; Derridj, A.; Velde, B. Potassium Status in Bulk and Rhizospheric Soils of Olive Groves in North Algeria. Geoderma 2013, 197–198, 161–168. [CrossRef]
- Uroz, S.; Calvaruso, C.; Turpault, M.P.; Frey-Klett, P. Mineral Weathering by Bacteria: Ecology, Actors and Mechanisms. Trends Microbiol 2009, 17, 378–387. [Google Scholar] [CrossRef]
- Bormann, B.T.; Wang, D.; Herbert Bormann, F.; Benoit, G.; April, R.; Snyder, M.C. Rapid, Plant-Induced Weathering in an Aggrading Experimental Ecosystem; 1998; Vol. 43.
- Kalinowski, B.E.; Schweda, P. Kinetics of Muscovite, Phlogopite, and Biotite Dissolution and Alteration at PH 1-4, Room Temperature; 1996; Vol. 60;
- Raulund-Rasmussen, K.; Borggaard, O.K.; Hansen, H.C.B.; Olsson, M. Effect of Natural Organic Soil Solutes on Weathering Rates of Soil Minerals. Eur J Soil Sci 1998, 49, 397–406. [Google Scholar] [CrossRef]
- Bray, A.W.; Oelkers, E.H.; Bonneville, S.; Wolff-Boenisch, D.; Potts, N.J.; Fones, G.; Benning, L.G. The Effect of PH, Grain Size, and Organic Ligands on Biotite Weathering Rates. Geochim Cosmochim Acta 2015, 164, 127–145. [Google Scholar] [CrossRef]
- Sokolova, T.A. Low-Molecular-Weight Organic Acids in Soils: Sources, Composition, Concentrations, and Functions: A Review. Eurasian Soil Science 2020, 53, 580–594. [Google Scholar] [CrossRef]
- McGahan, D.G.; Southard, R.J.; Zasoski, R.J. Rhizosphere Effects on Soil Solution Composition and Mineral Stability. Geoderma 2014, 226–227, 340–347. [CrossRef]
- IUSS Working Group WRB World Reference Base for Soil Resources 2014, Update 2015: International Soil Classification System for Naming Soils and Creating Legends for Soil Maps; FAO: Rome, 2015.
- Barreto, M.S.C.; Ramlogan, M.; Oliveira, D.M.S.; Verburg, E.E.J.; Elzinga, E.J.; Rouff, A.A.; Jemo, M.; Alleoni, L.R.F. Thermal Stability of Soil Organic Carbon after Long-Term Manure Application across Land Uses and Tillage Systems in an Oxisol. Catena (Amst) 2021, 200. [Google Scholar] [CrossRef]
- Vieillard, P.; Gailhanou, H.; Lassin, A.; Blanc, P.; Bloch, E.; Gaboreau, S.; Fialips, C.I.; Made, B. A Predictive Model of Thermodynamic Entities of Hydration for Smectites: Application to the Formation Properties of Smectites. Applied Geochemistry 2019, 110. [Google Scholar] [CrossRef]
- Kittrick, J.A. Solubility Measurments of Phases in Three Illites. Clays Clay Miner 1984, 32, 115–124. [Google Scholar] [CrossRef]
- Misra, U.K.; Upchurcht, W. 1 Free energy of formation of beidellite from apparent solubility measurments. Clays and Clay Millerals 1976, 24, 327–360. [Google Scholar] [CrossRef]
- Karathanasis, A.D. Compositional and Solubility Relationships Between Aluminum-Hydroxyinterlayered Soil-Smectites and Vermiculites. Soil Science of America Journal 1988, 52, 1500–1508. [Google Scholar] [CrossRef]
- Varadachari, C. Clay Mineral Equilibria: Fuzzy Phase Diagrams. Clay Research 2017, 36, 1–16. [Google Scholar]
- Varadachari, C.; Kudrat, M.; Ghosh, K. Evaluation of standard free energies of formation of clay minerals by an improved regression method. Clays Clay Miner 1994, 42, 298–307. [Google Scholar] [CrossRef]
- Vieillard, P. A new method for the prediction of Gibbs free energies of formation of phyllosilicates (10 A and 14 A) based on the electronegativity scale. Clays Clay Miner 2002, 50, 352–363. [Google Scholar] [CrossRef]
- Volkov, D.S.; Rogova, O.B.; Proskurnin, M.A.; Farkhodov, Y.R.; Markeeva, L.B. Thermal Stability of Organic Matter of Typical Chernozems under Different Land Uses. Soil Tillage Res 2020, 197. [Google Scholar] [CrossRef]
- Margenot, A.J.; Parikh, S.J.; Calderón, F.J. Fourier-Transform Infrared Spectroscopy for Soil Organic Matter Analysis. Soil Science Society of America Journal 2023, 87, 1503–1528. [Google Scholar] [CrossRef]
- Danilin, I.; Tolpeshta, I.; Izosimova, Y.; Pozdnyakov, L.; Stepanov, A.; Salimgareeva, O. Thermal Stability and Resistance to Biodegradation of Humic Acid Adsorbed on Clay Minerals. Minerals 2023, 13. [Google Scholar] [CrossRef]
Figure 1.
X-ray diffraction patterns of the clay fraction in the maple rhizosphere and the bulk soil under the maple. 1–5 – replicates.
Figure 1.
X-ray diffraction patterns of the clay fraction in the maple rhizosphere and the bulk soil under the maple. 1–5 – replicates.
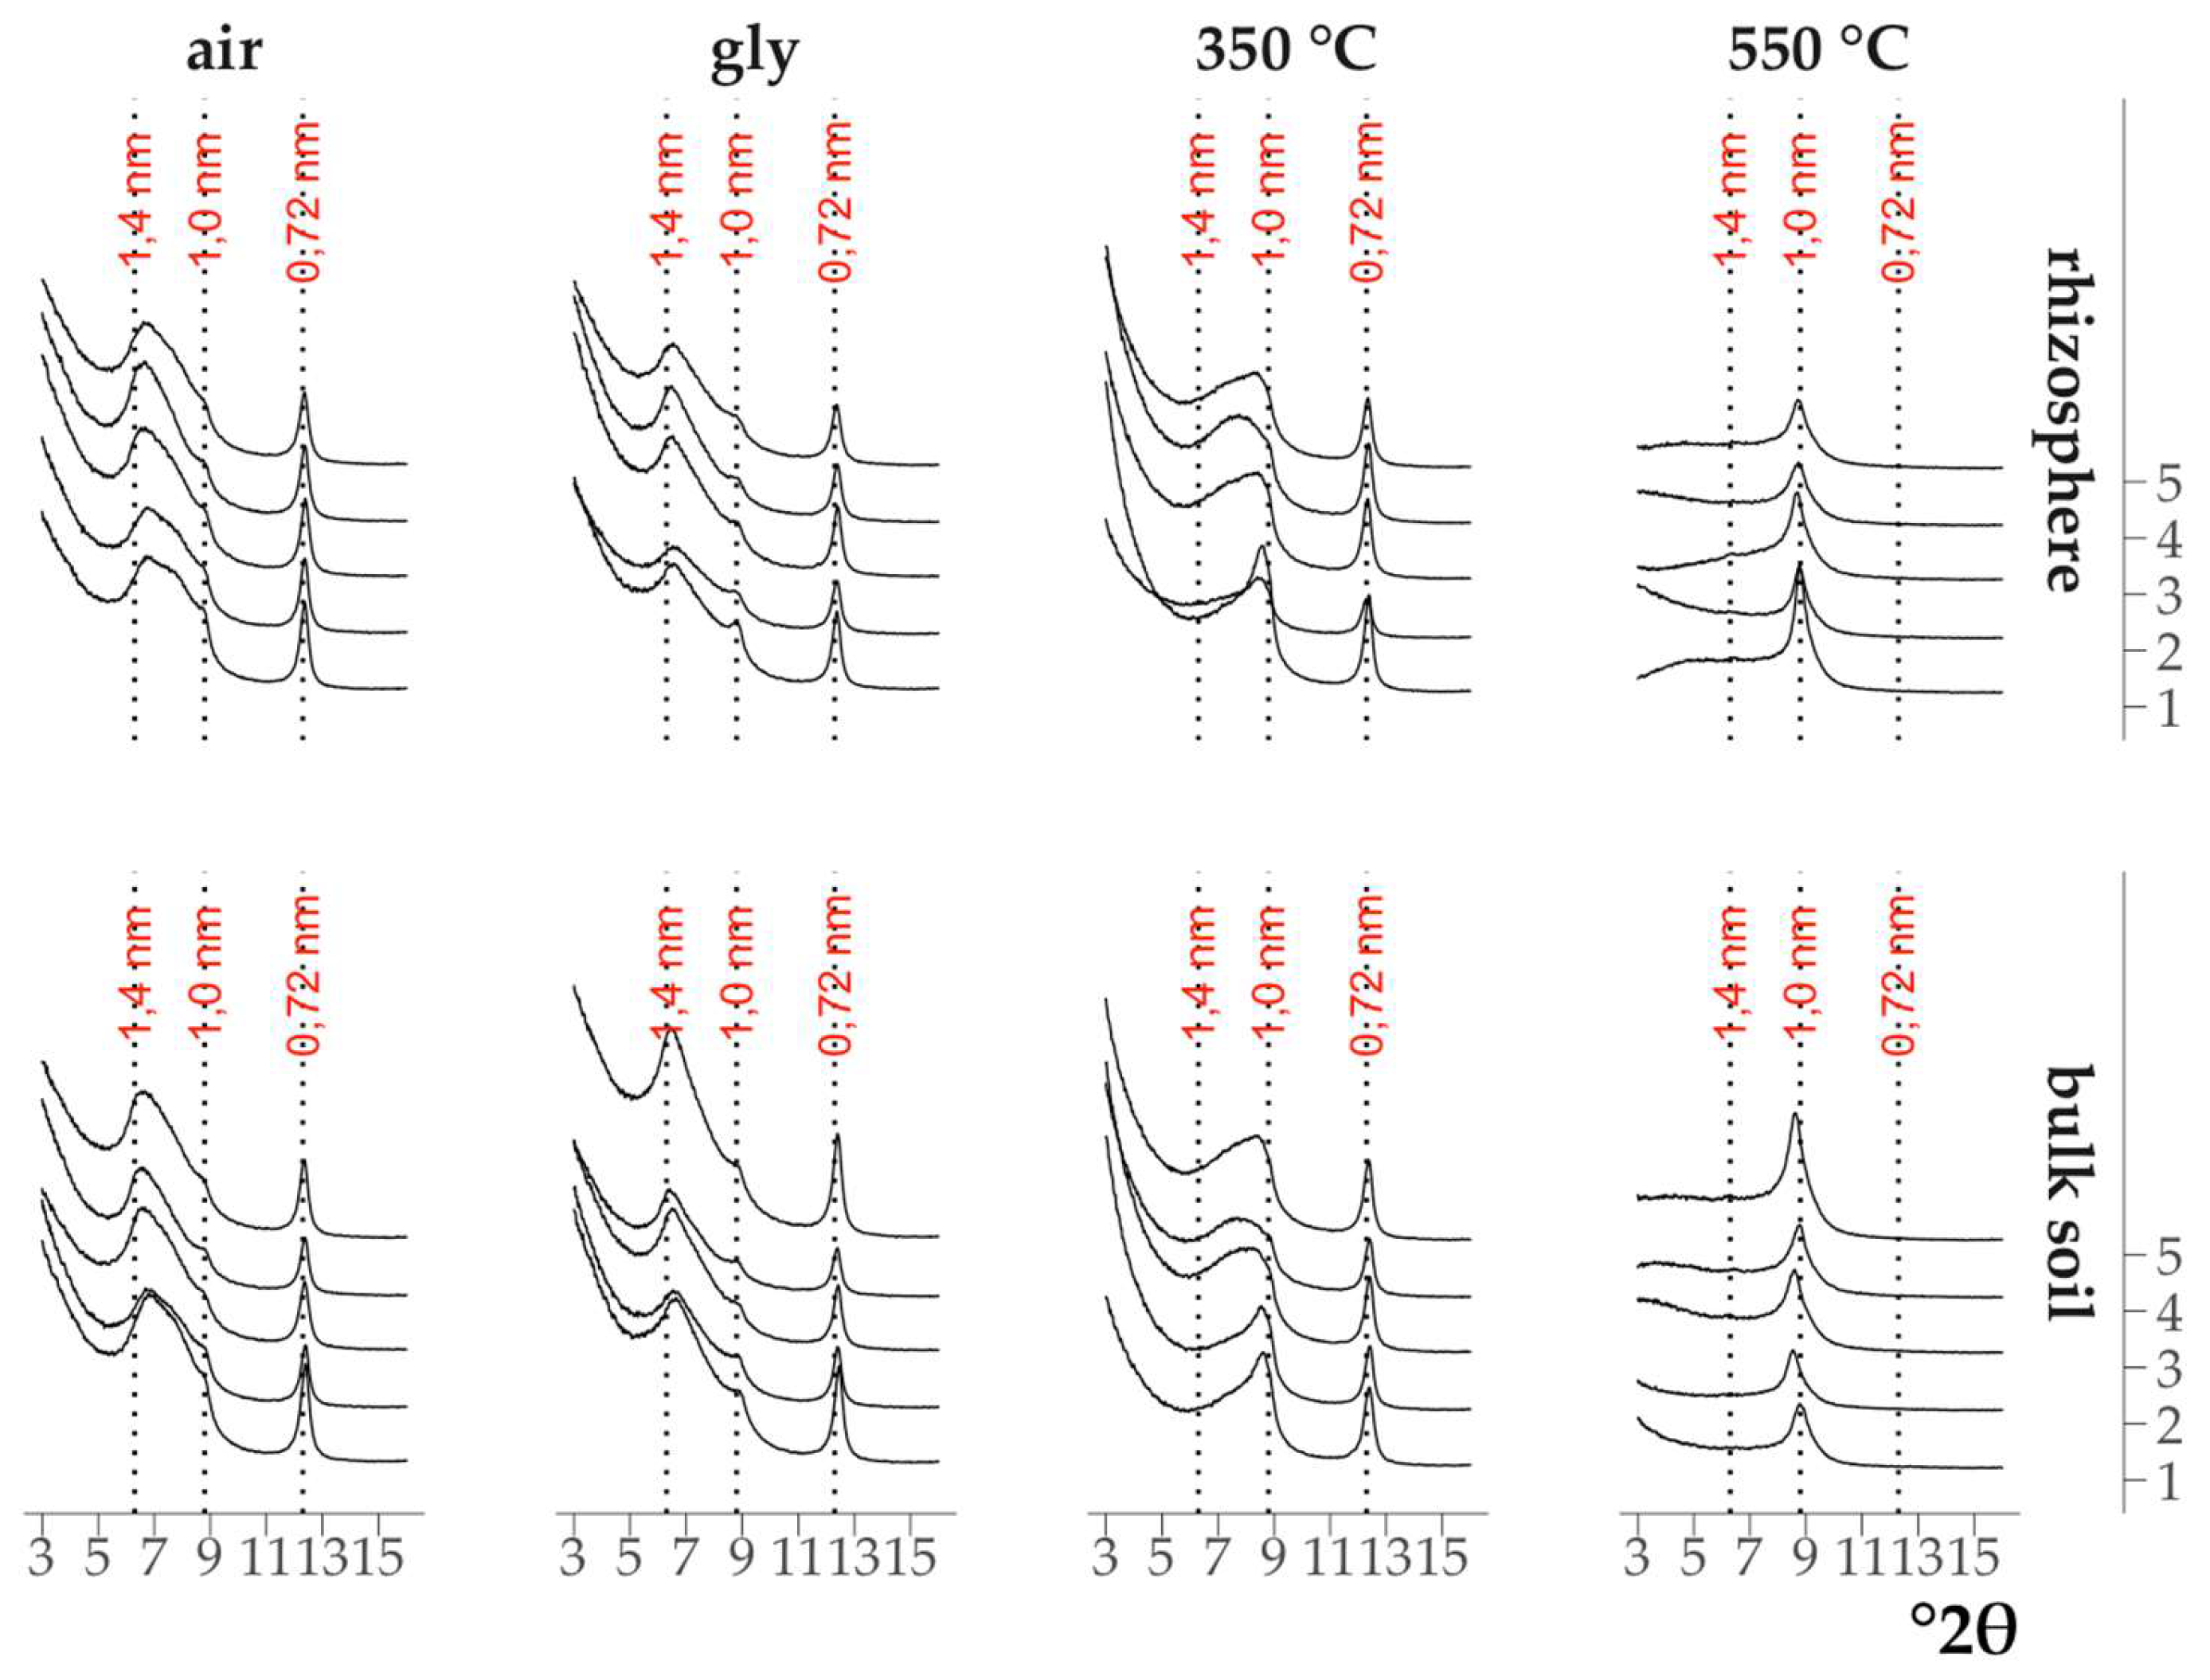
Figure 2.
X-ray diffraction patterns of the clay fraction in the spruce rhizosphere and the bulk soil under the spruce. 1–5 – replicates.
Figure 2.
X-ray diffraction patterns of the clay fraction in the spruce rhizosphere and the bulk soil under the spruce. 1–5 – replicates.
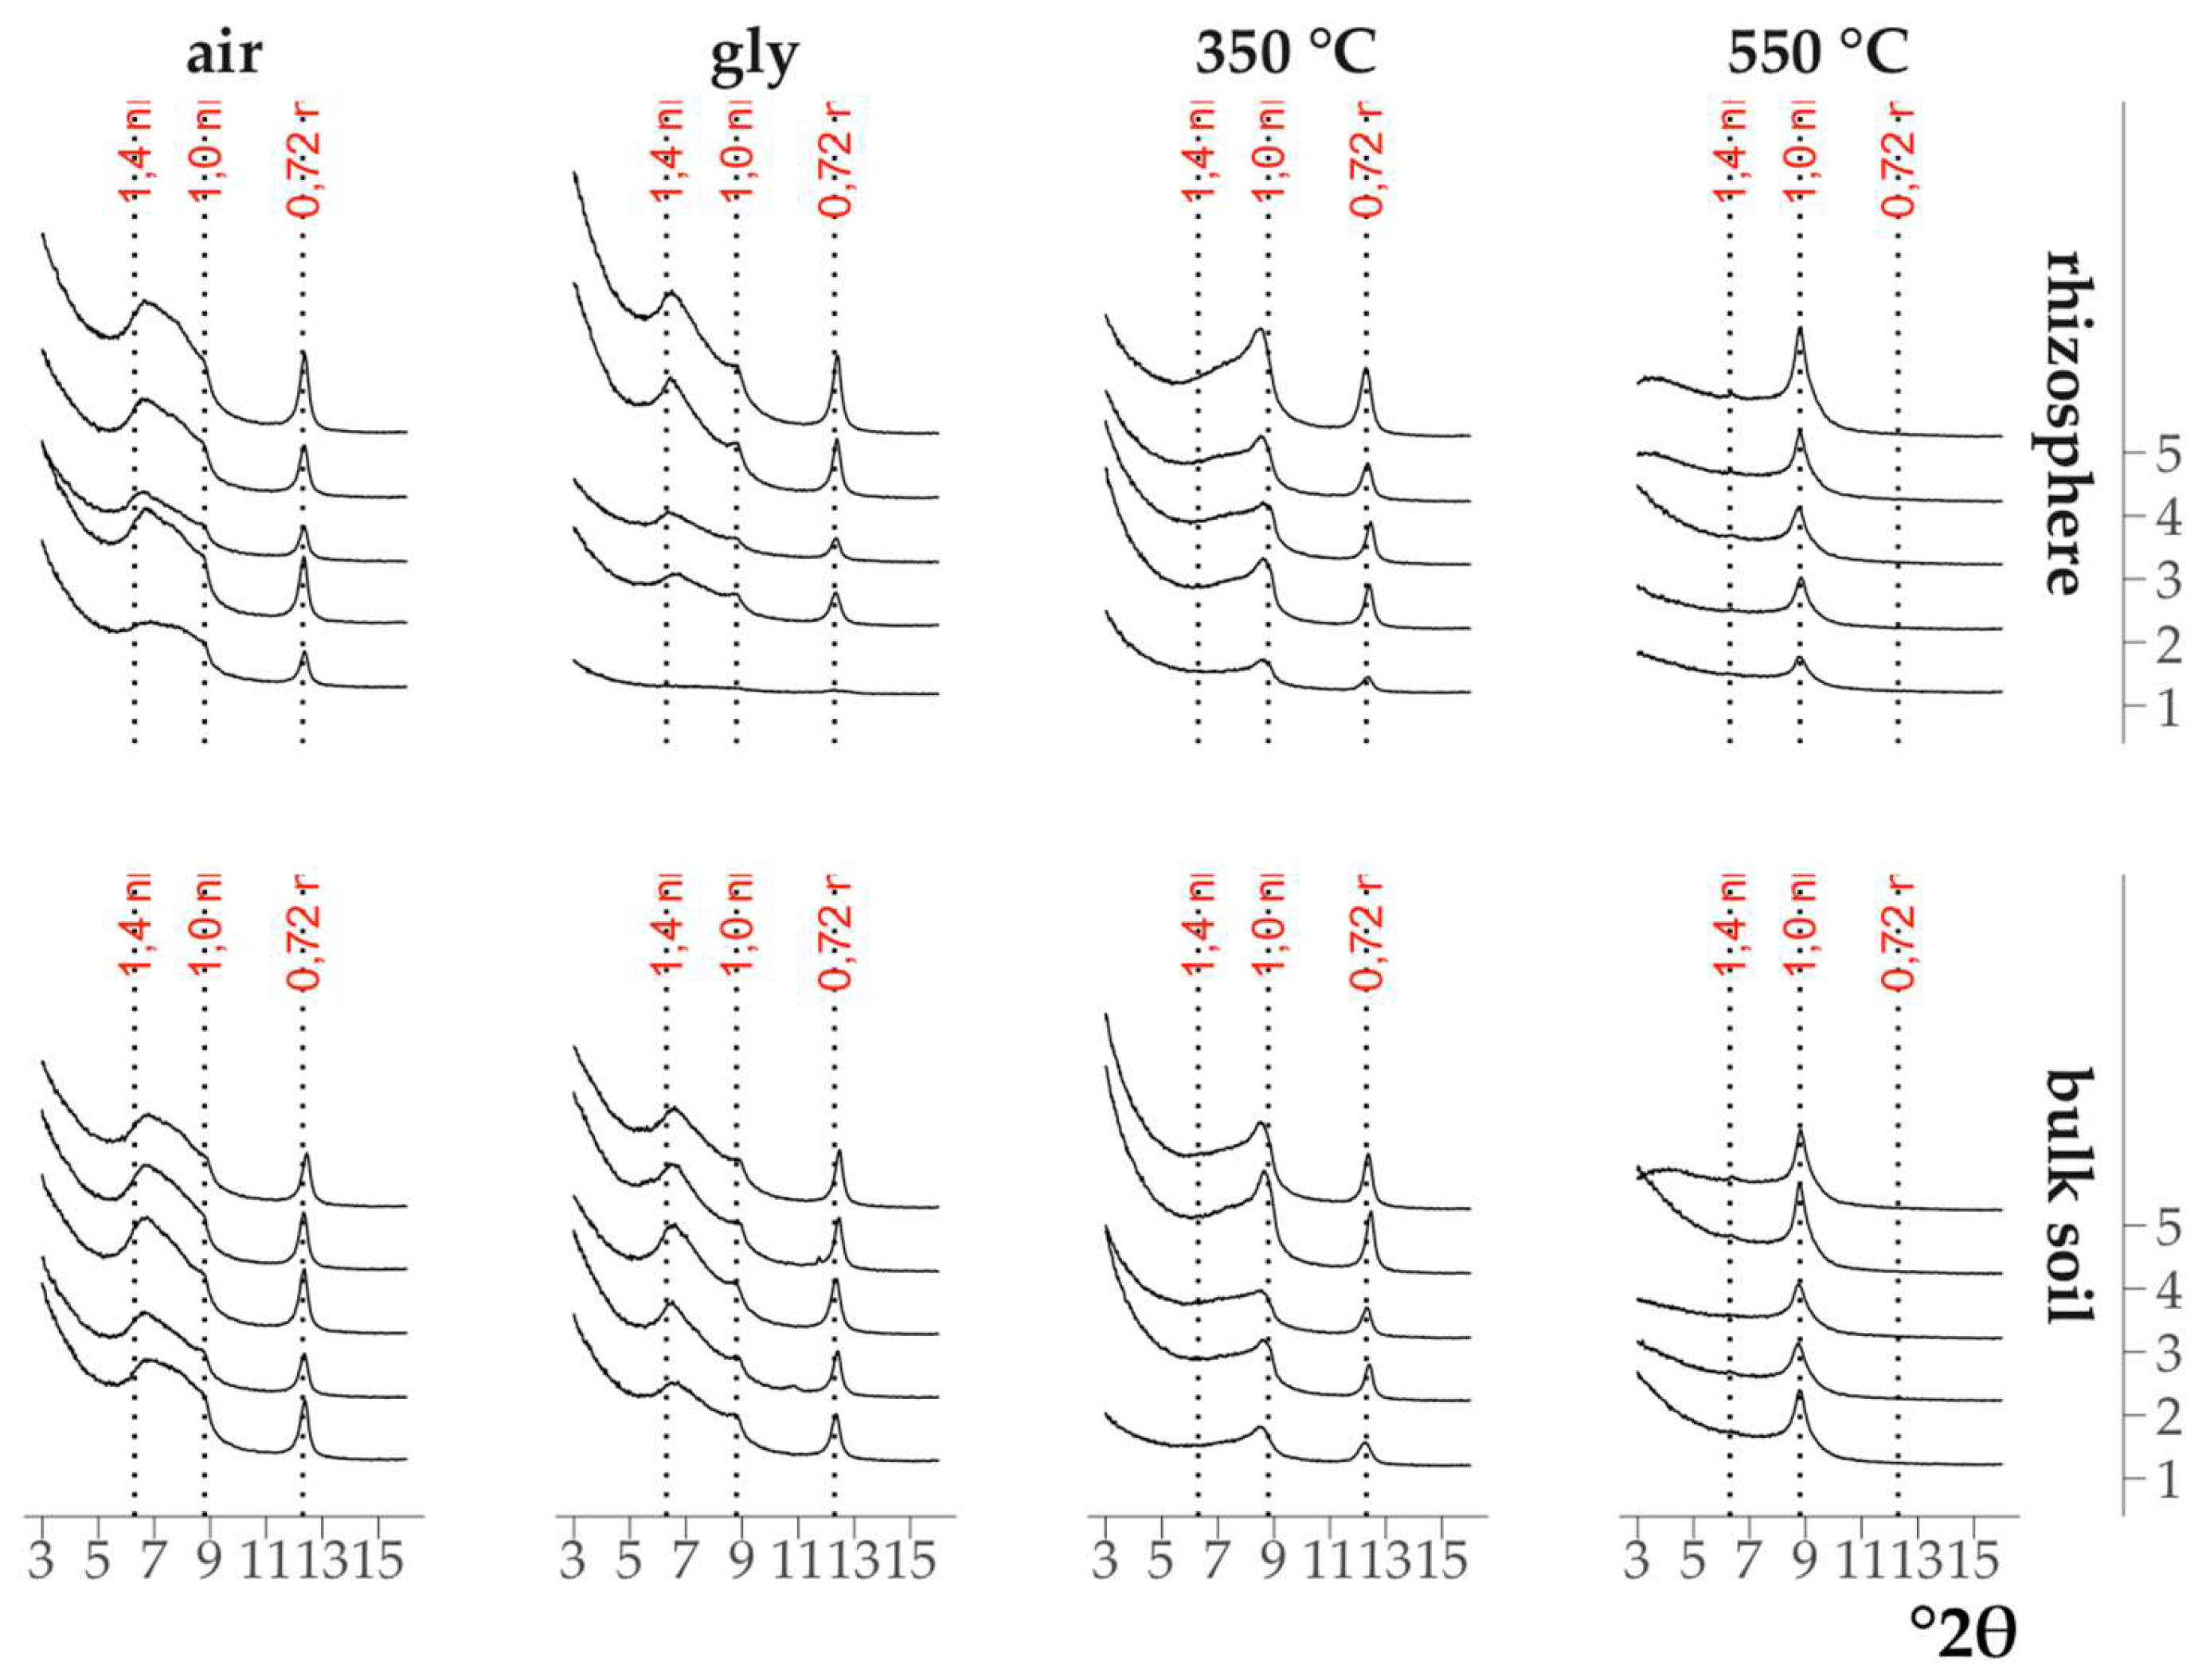
Figure 3.
Kaolinite solubility diagram (solid line is the equilibrium line calculated from experimental data; dotted lines are the thermodynamic stability limits calculated from literature data).
Figure 3.
Kaolinite solubility diagram (solid line is the equilibrium line calculated from experimental data; dotted lines are the thermodynamic stability limits calculated from literature data).
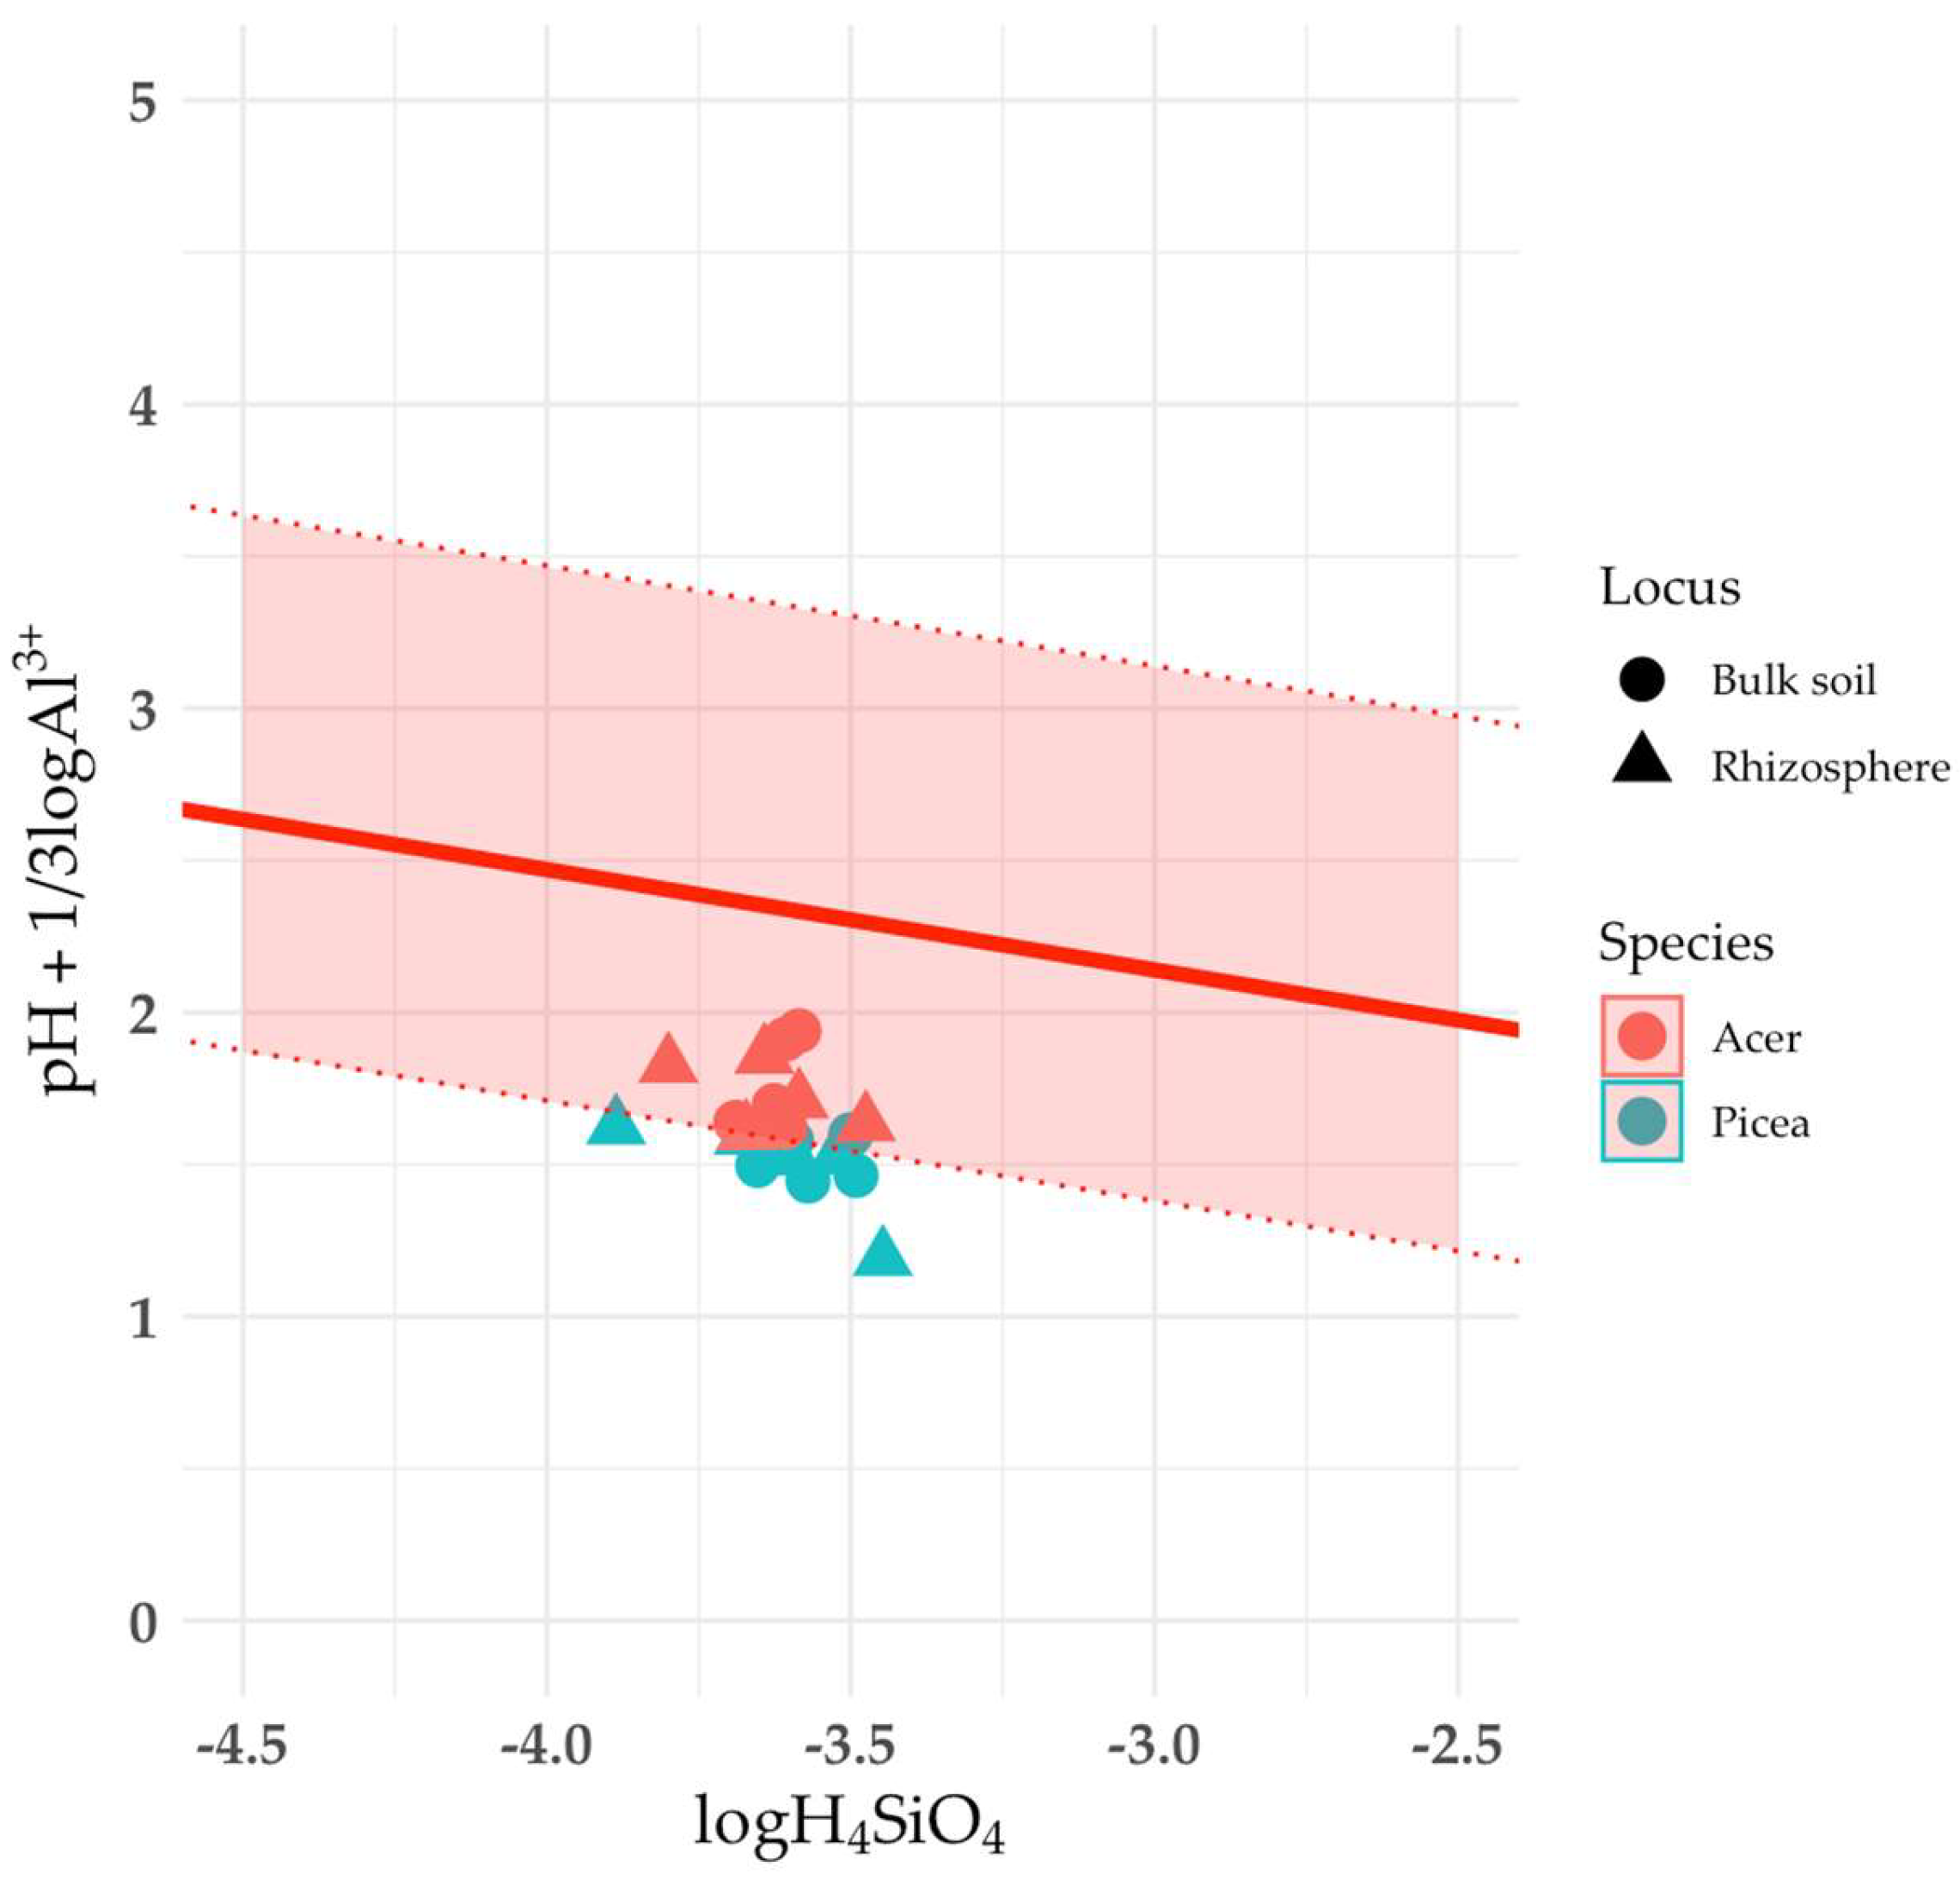
Figure 4.
Solubility diagrams of: (a) vermiculite; (b) chlorite; (c) illite. Solid line is the equilibrium line calculated from experimental data; dotted lines are the thermodynamic stability limits calculated from literature data.
Figure 4.
Solubility diagrams of: (a) vermiculite; (b) chlorite; (c) illite. Solid line is the equilibrium line calculated from experimental data; dotted lines are the thermodynamic stability limits calculated from literature data.
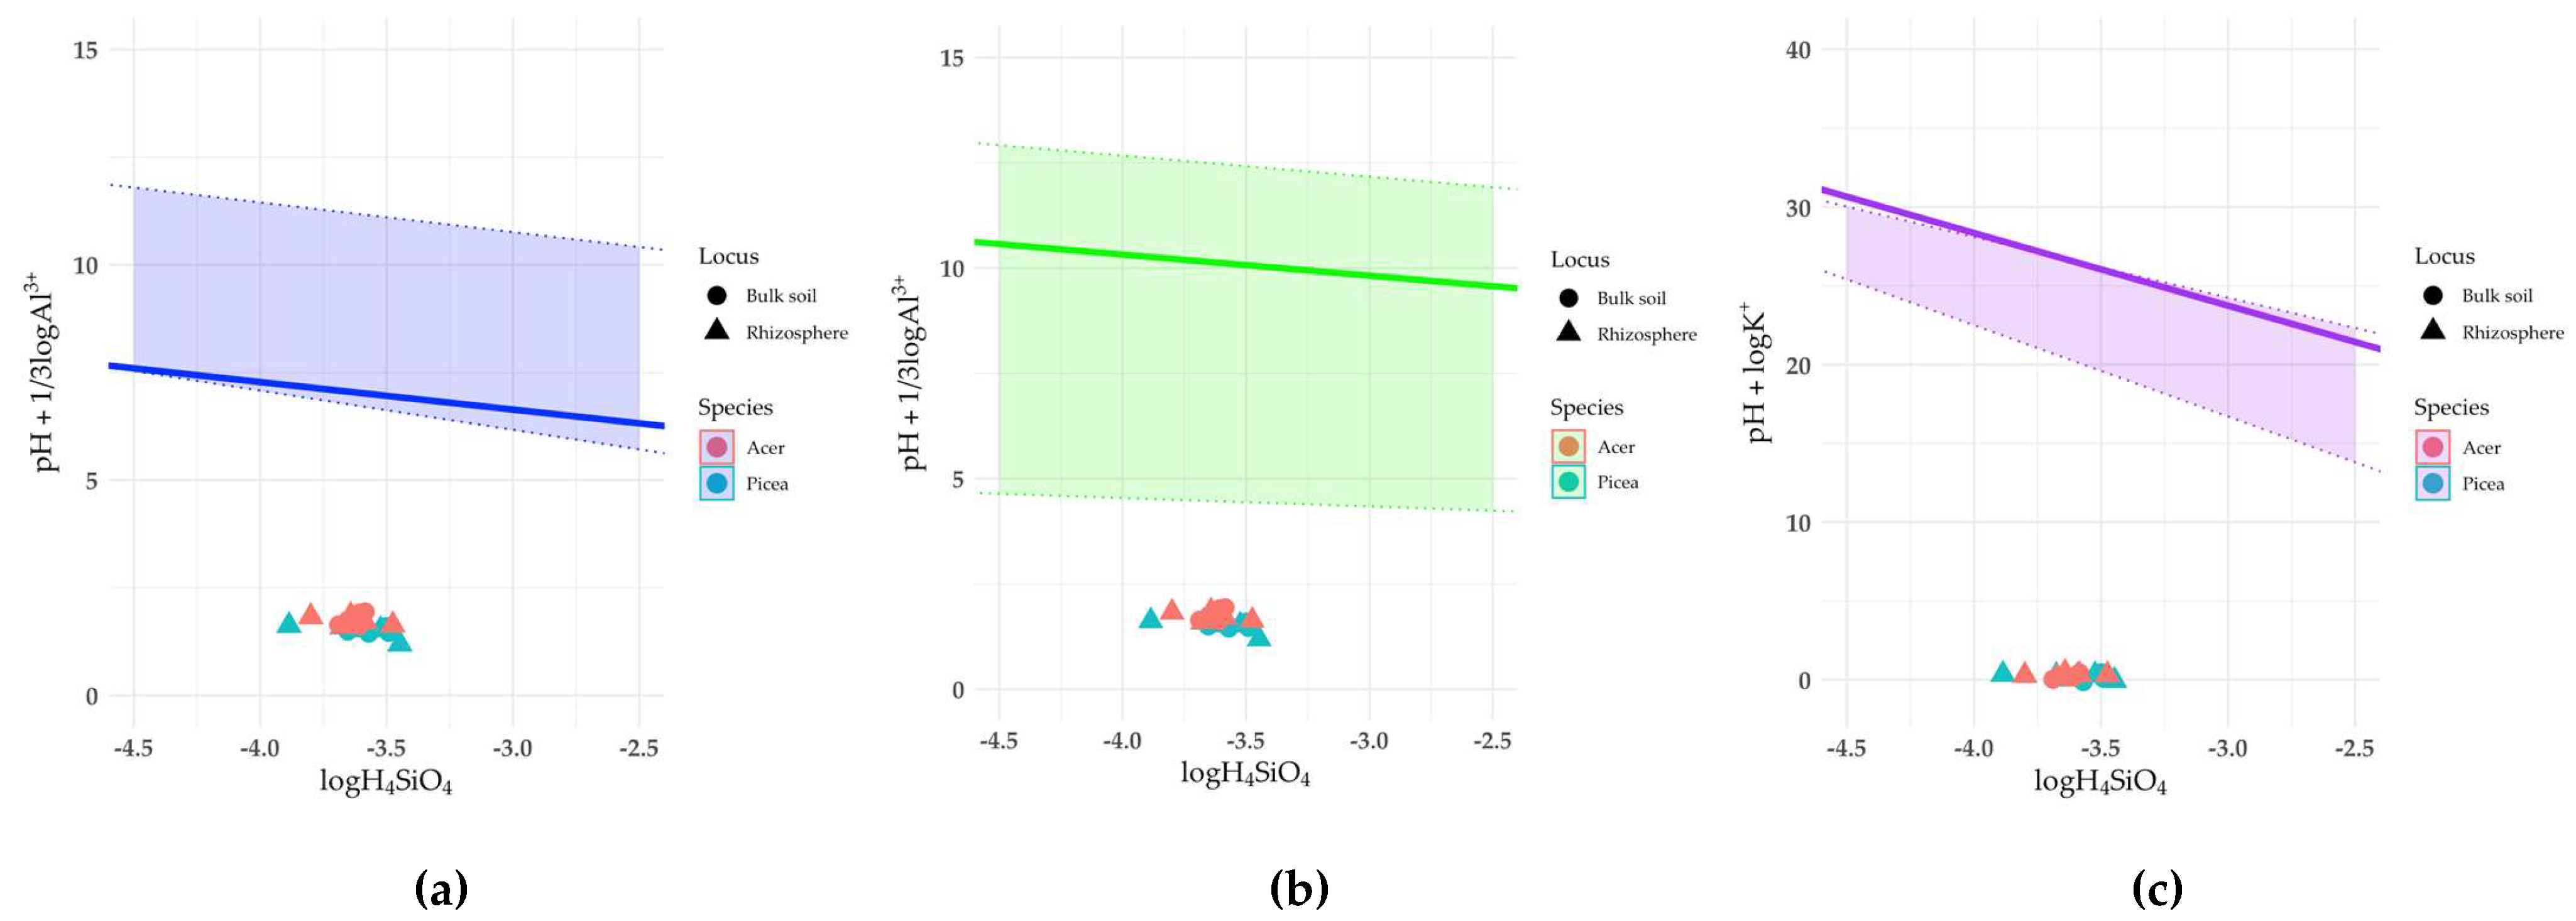
Figure 5.
Solubility diagrams of: (a) montmorillonite; (b) soil chlorite. Solid line is the equilibrium line calculated from experimental data; dotted lines are the thermodynamic stability limits calculated from literature data.
Figure 5.
Solubility diagrams of: (a) montmorillonite; (b) soil chlorite. Solid line is the equilibrium line calculated from experimental data; dotted lines are the thermodynamic stability limits calculated from literature data.
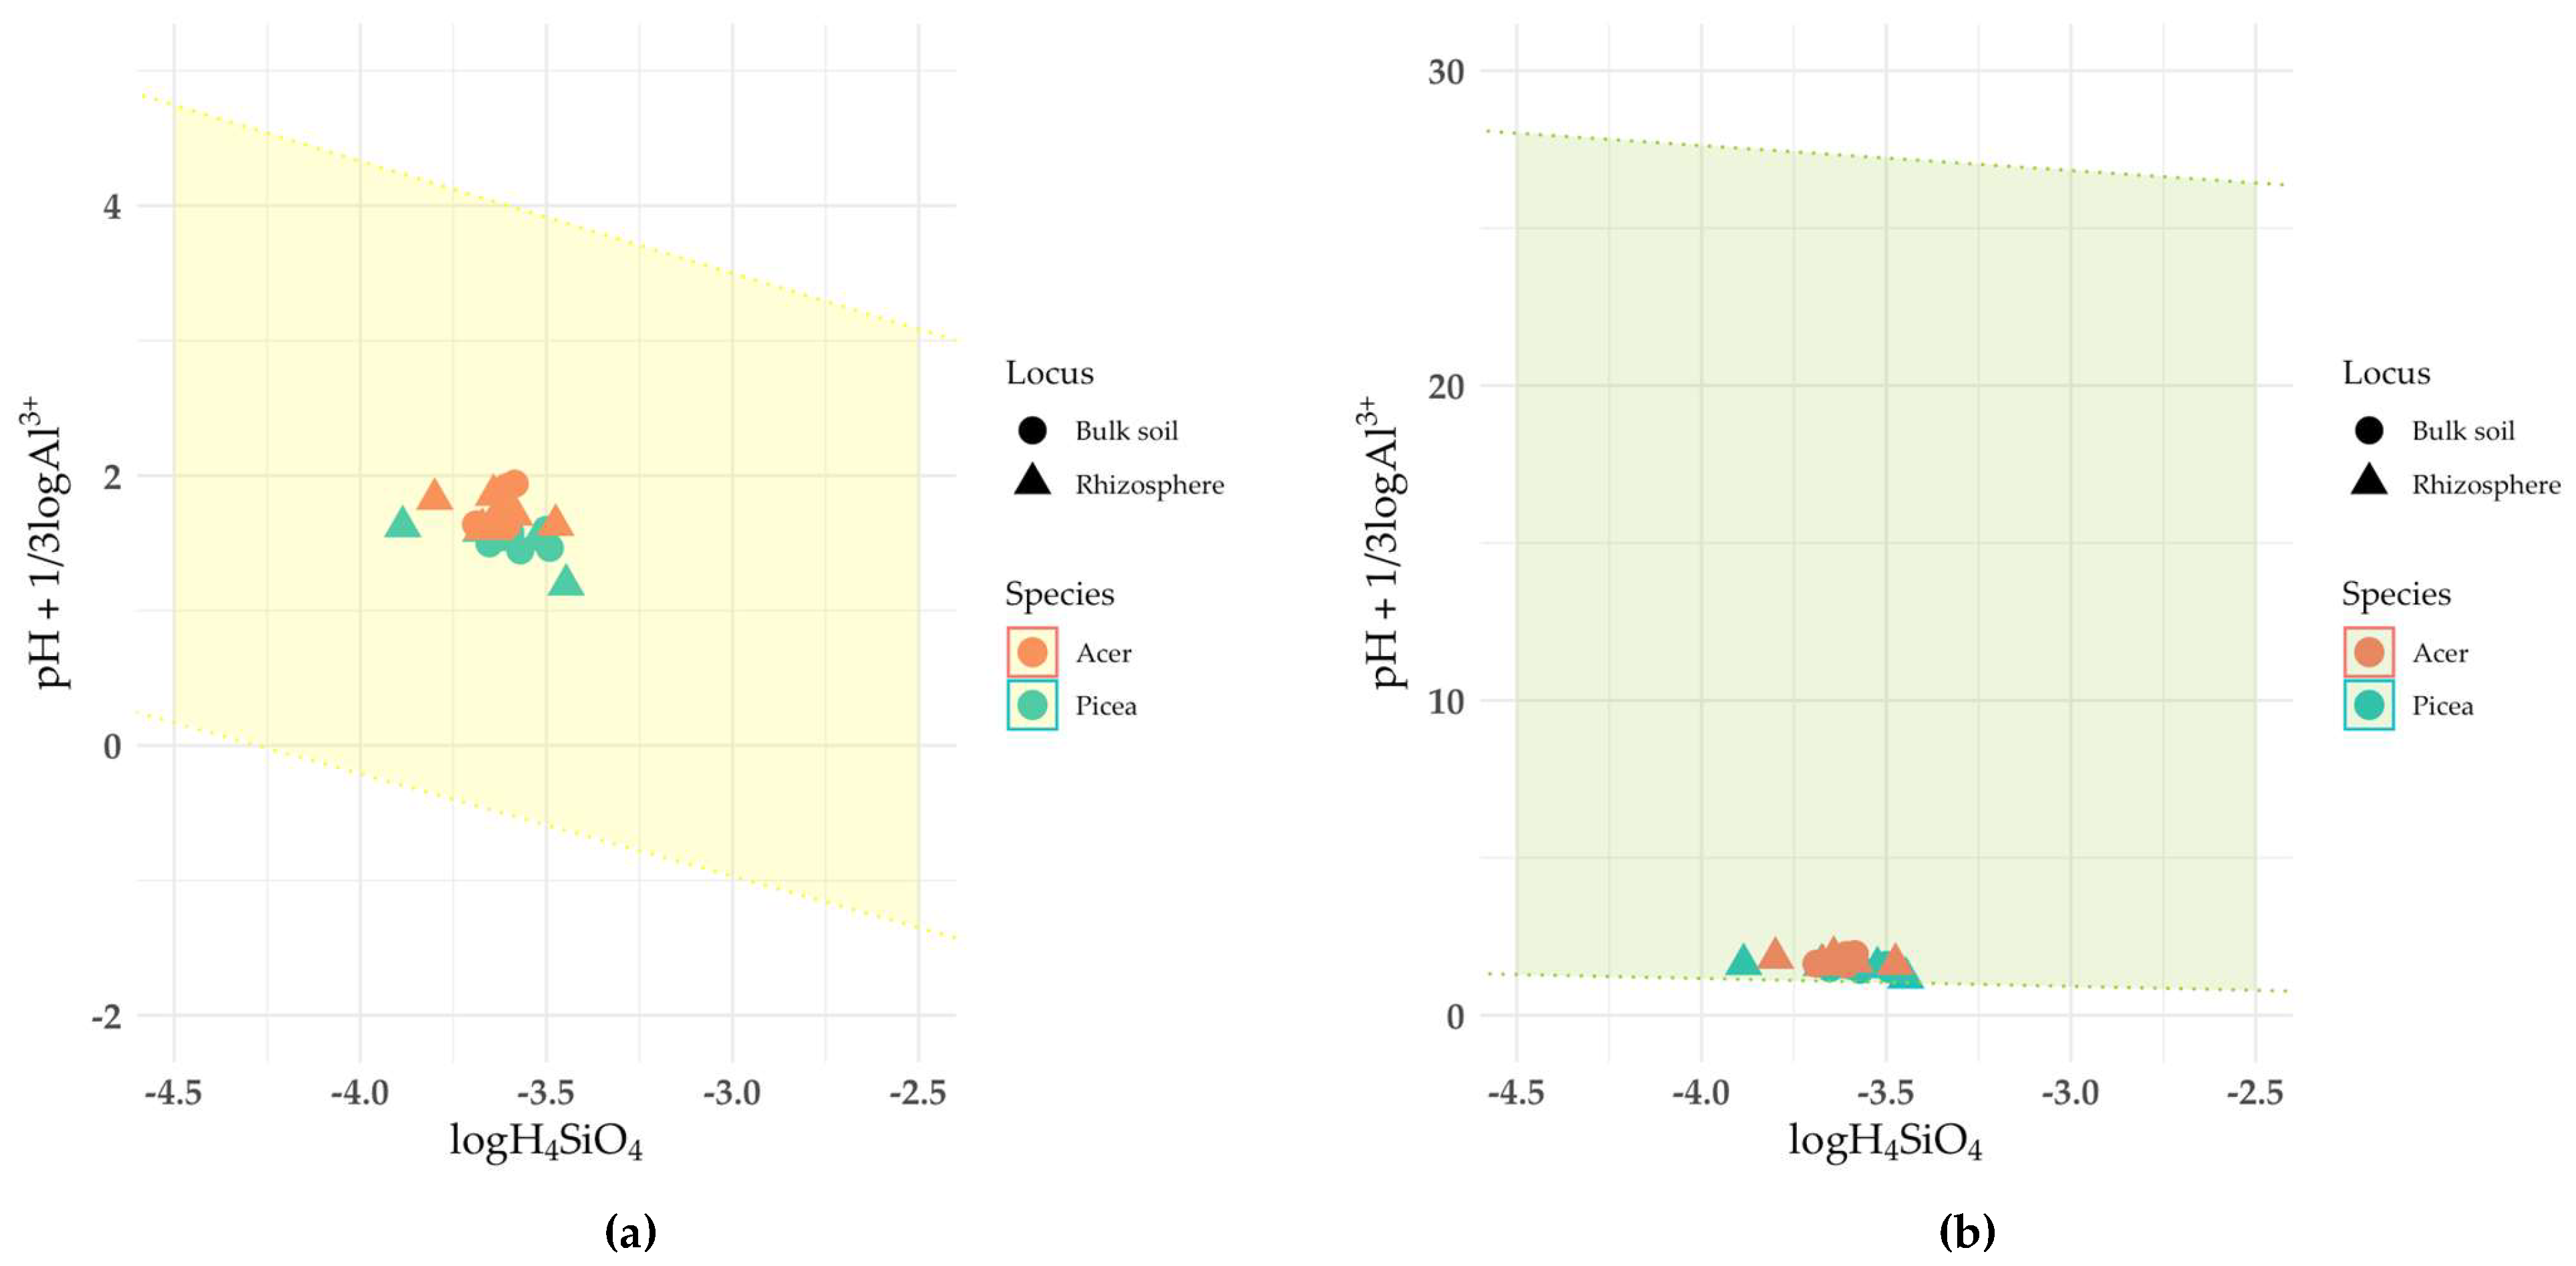
Figure 6.
Clustering of clay fraction samples by relative intensities of absorption bands in DRIFTS spectra: (a) grouping by locus, (b) grouping by plant species.
Figure 6.
Clustering of clay fraction samples by relative intensities of absorption bands in DRIFTS spectra: (a) grouping by locus, (b) grouping by plant species.
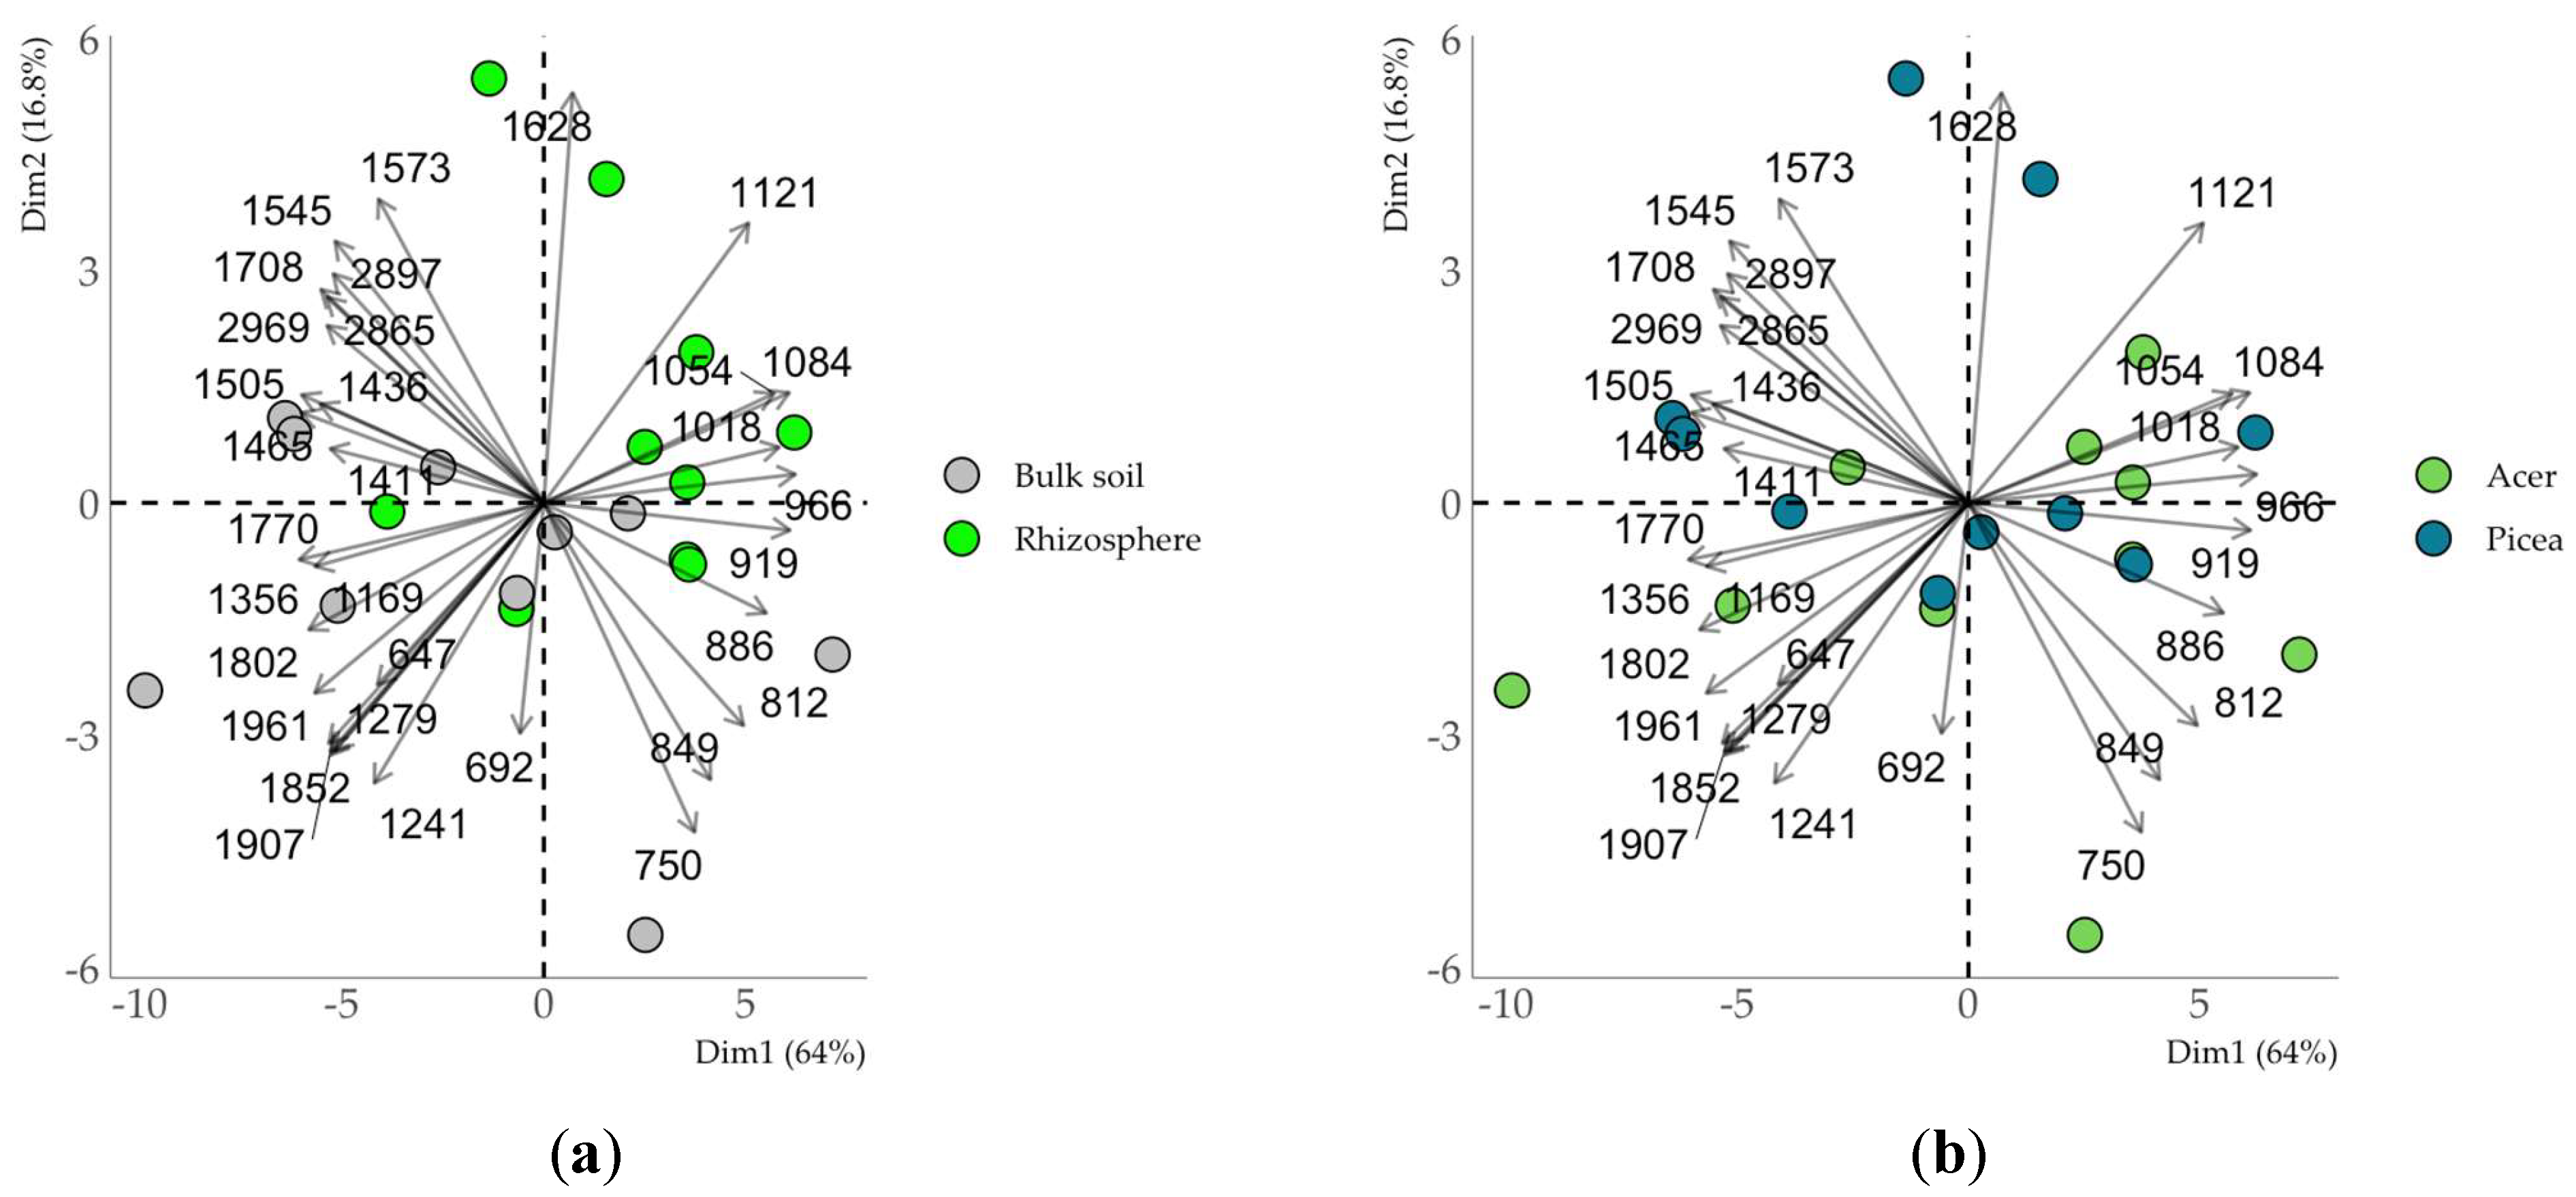
Figure 7.
DSC curves of the clay fraction (experimental replicates are shown in different colors).
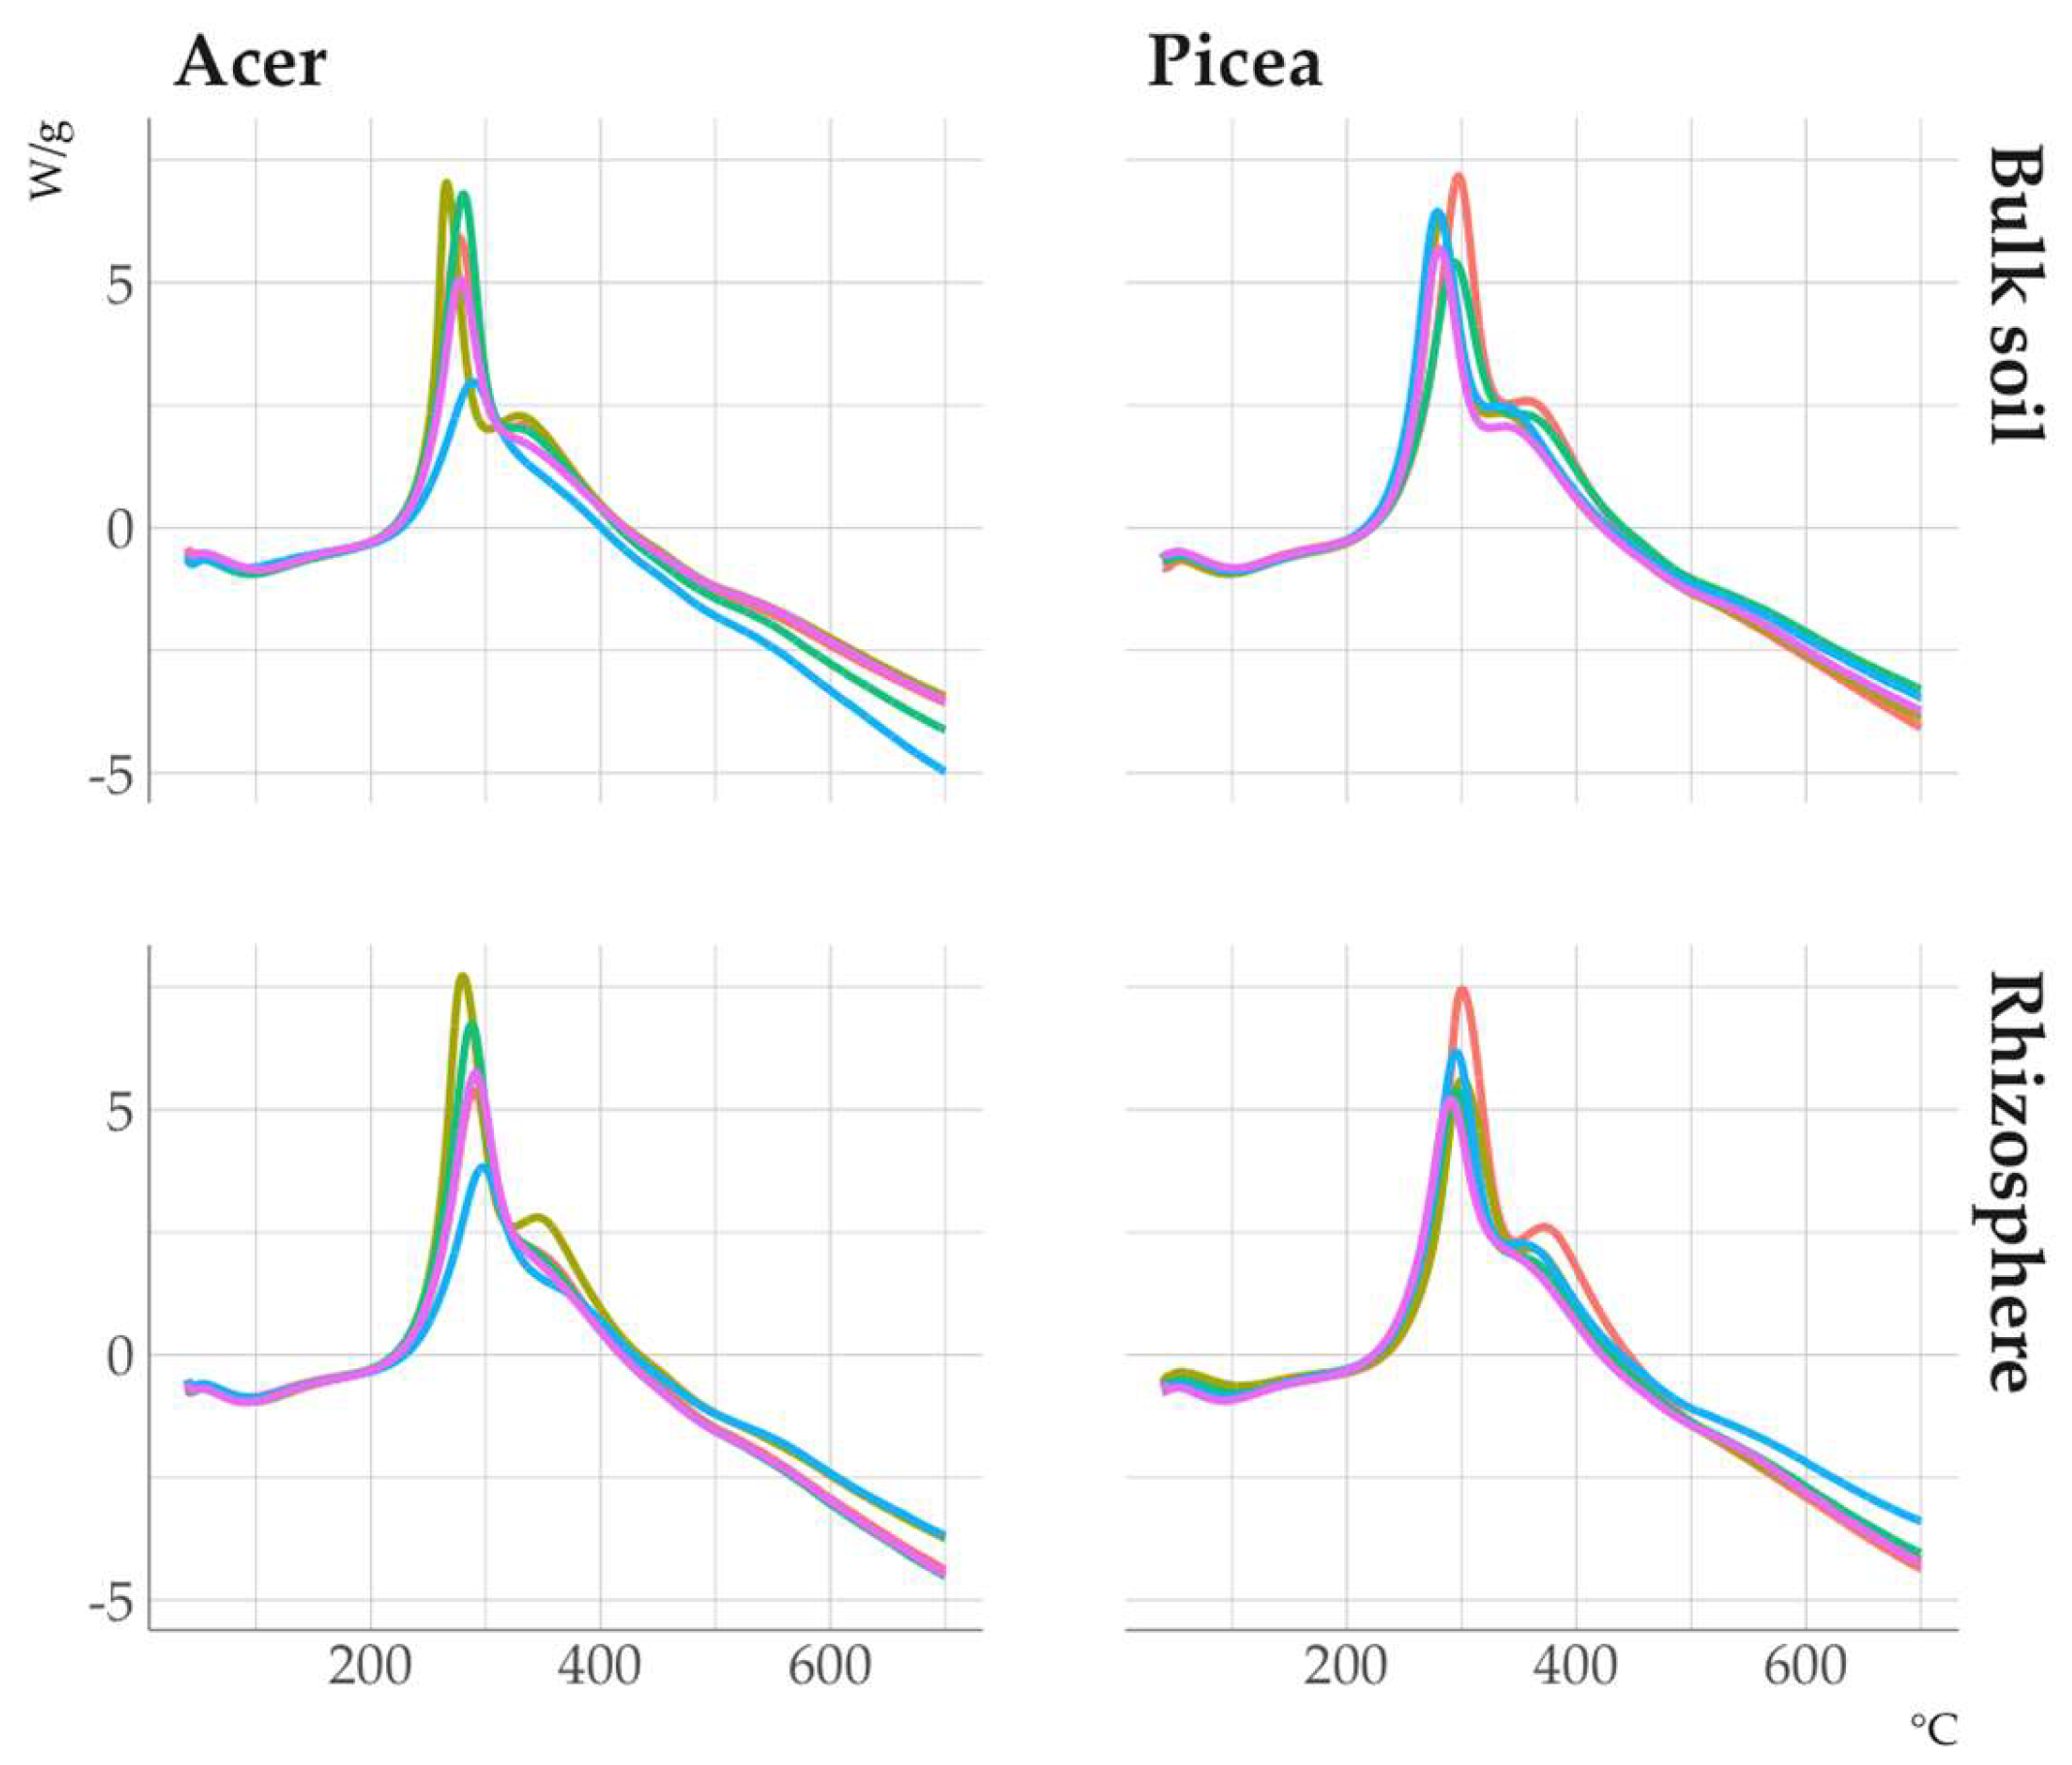
Figure 8.
Correlations between the area of thermal effects and the intensity of bands in the DRIFTS spectra.
Figure 8.
Correlations between the area of thermal effects and the intensity of bands in the DRIFTS spectra.
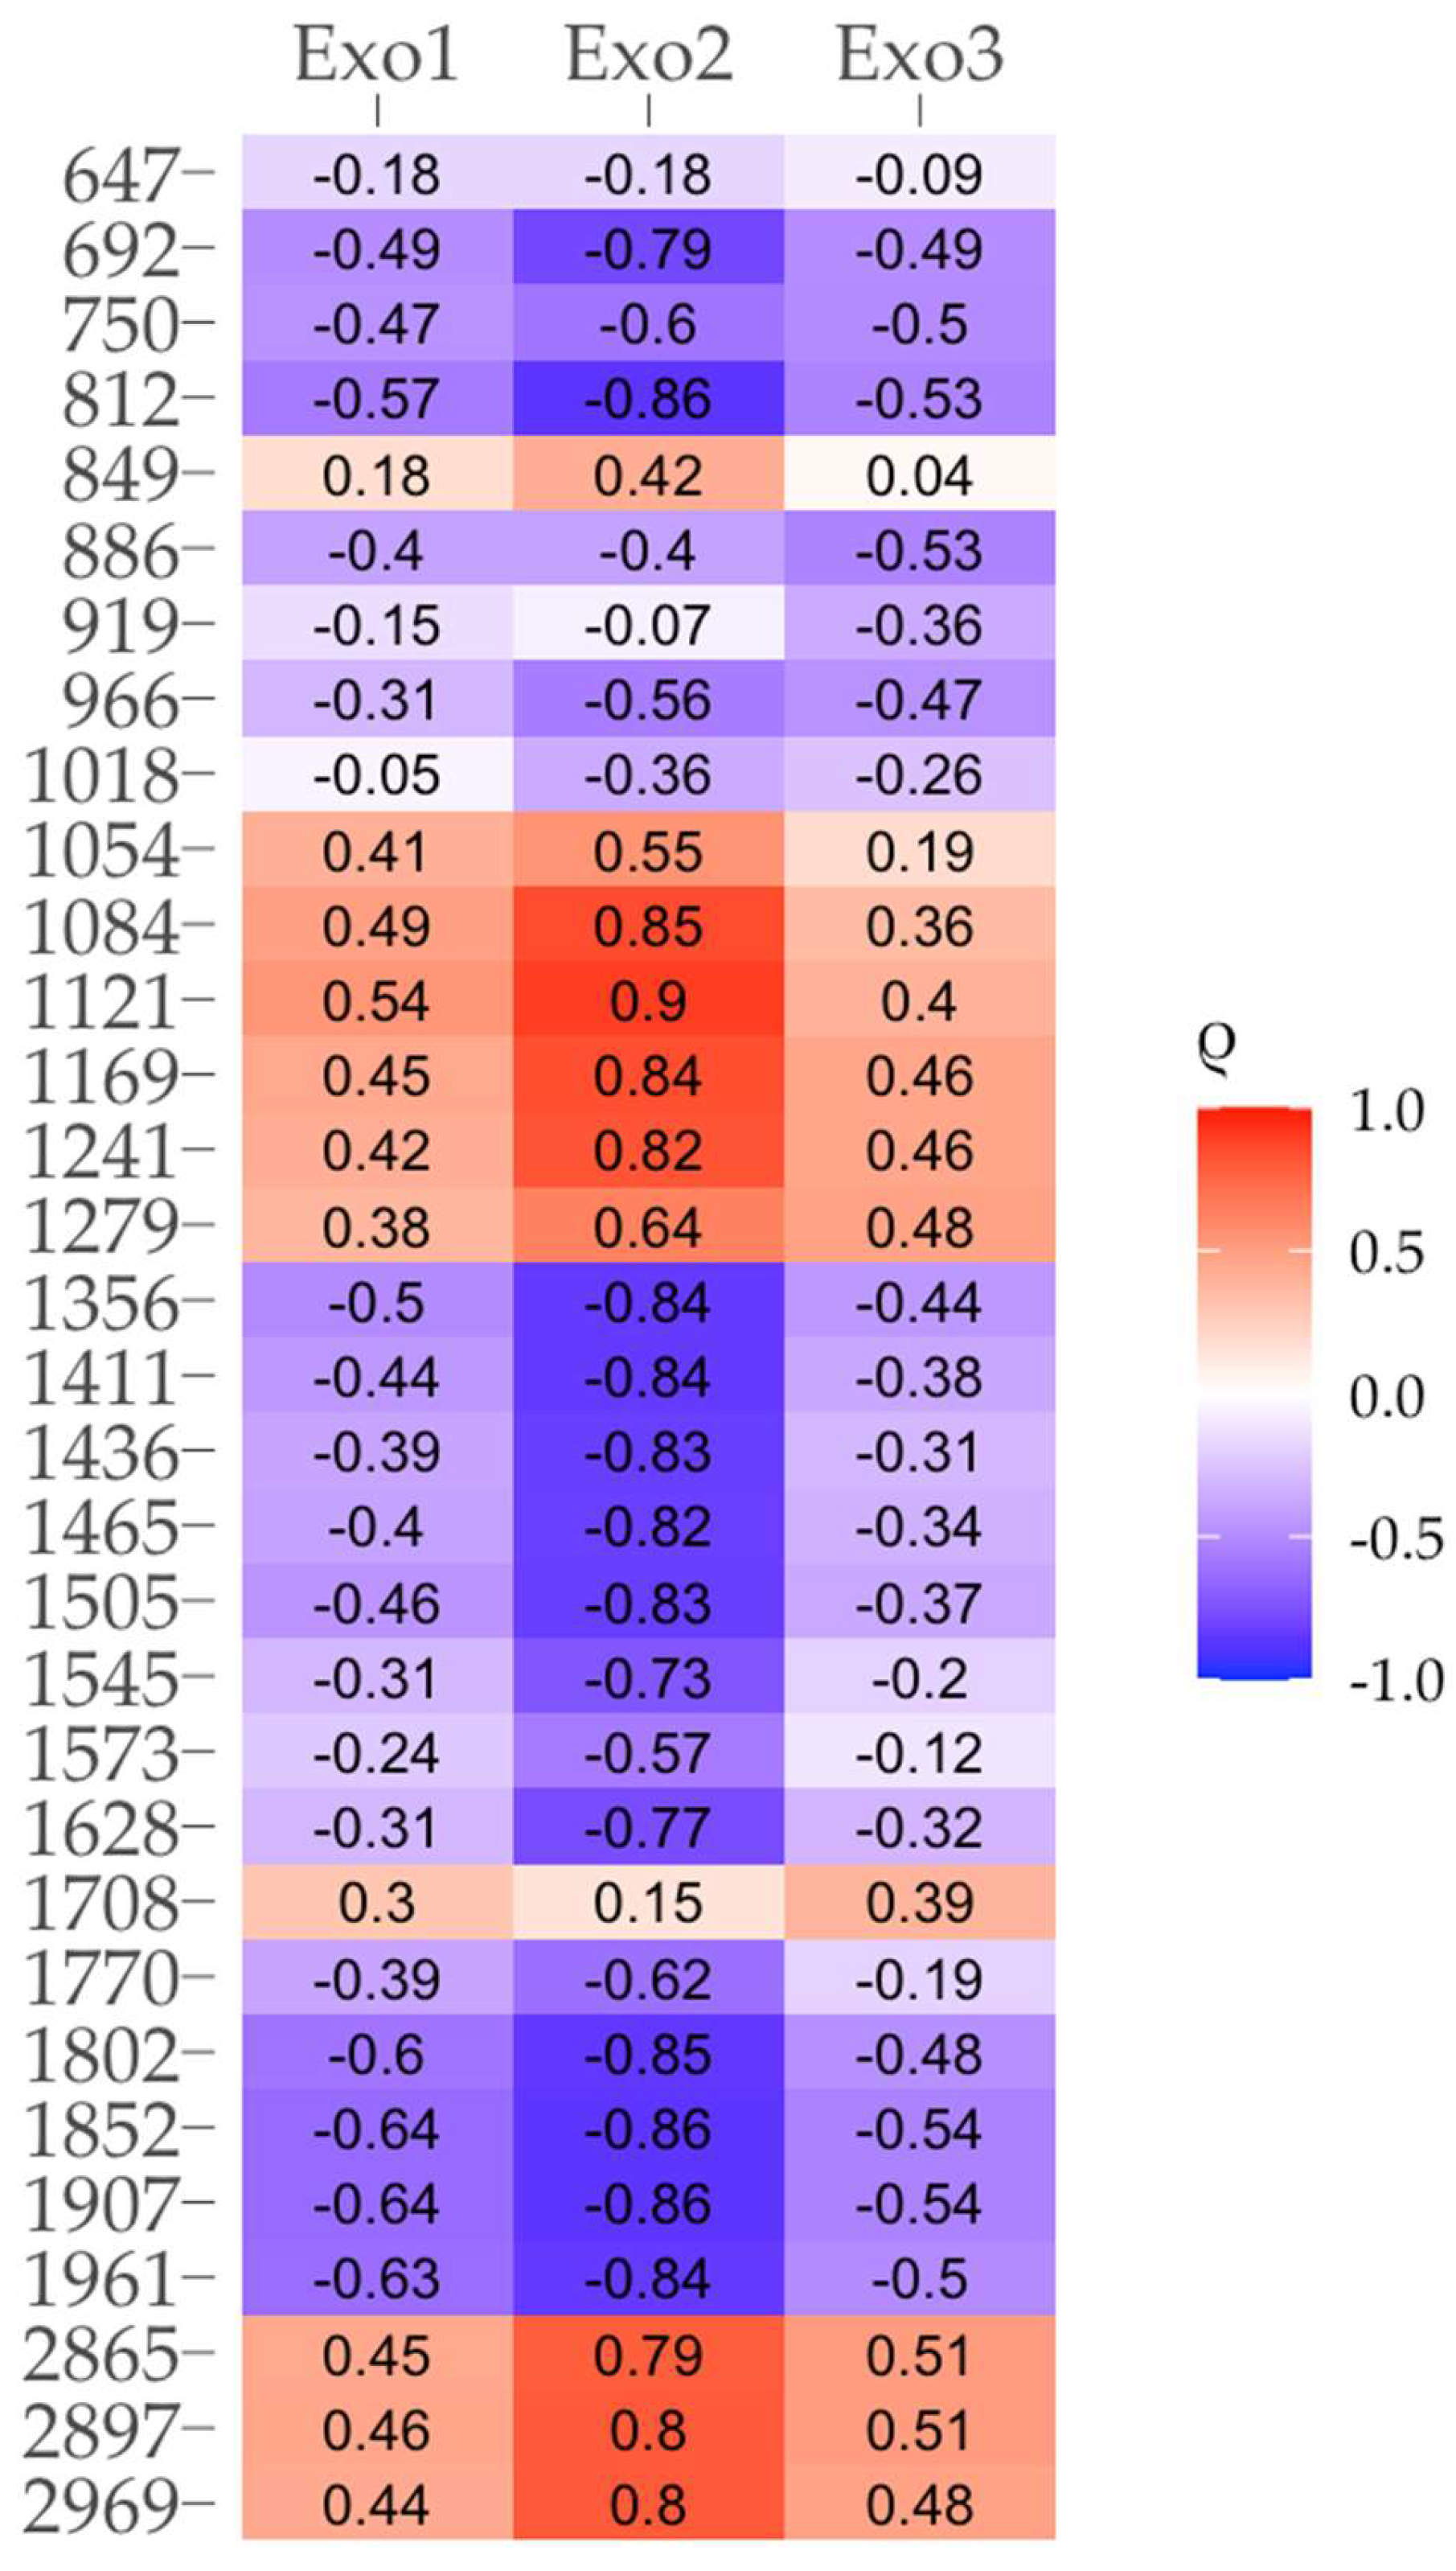
Figure 9.
Diffraction patterns of kaolinite, muscovite, and biotite.
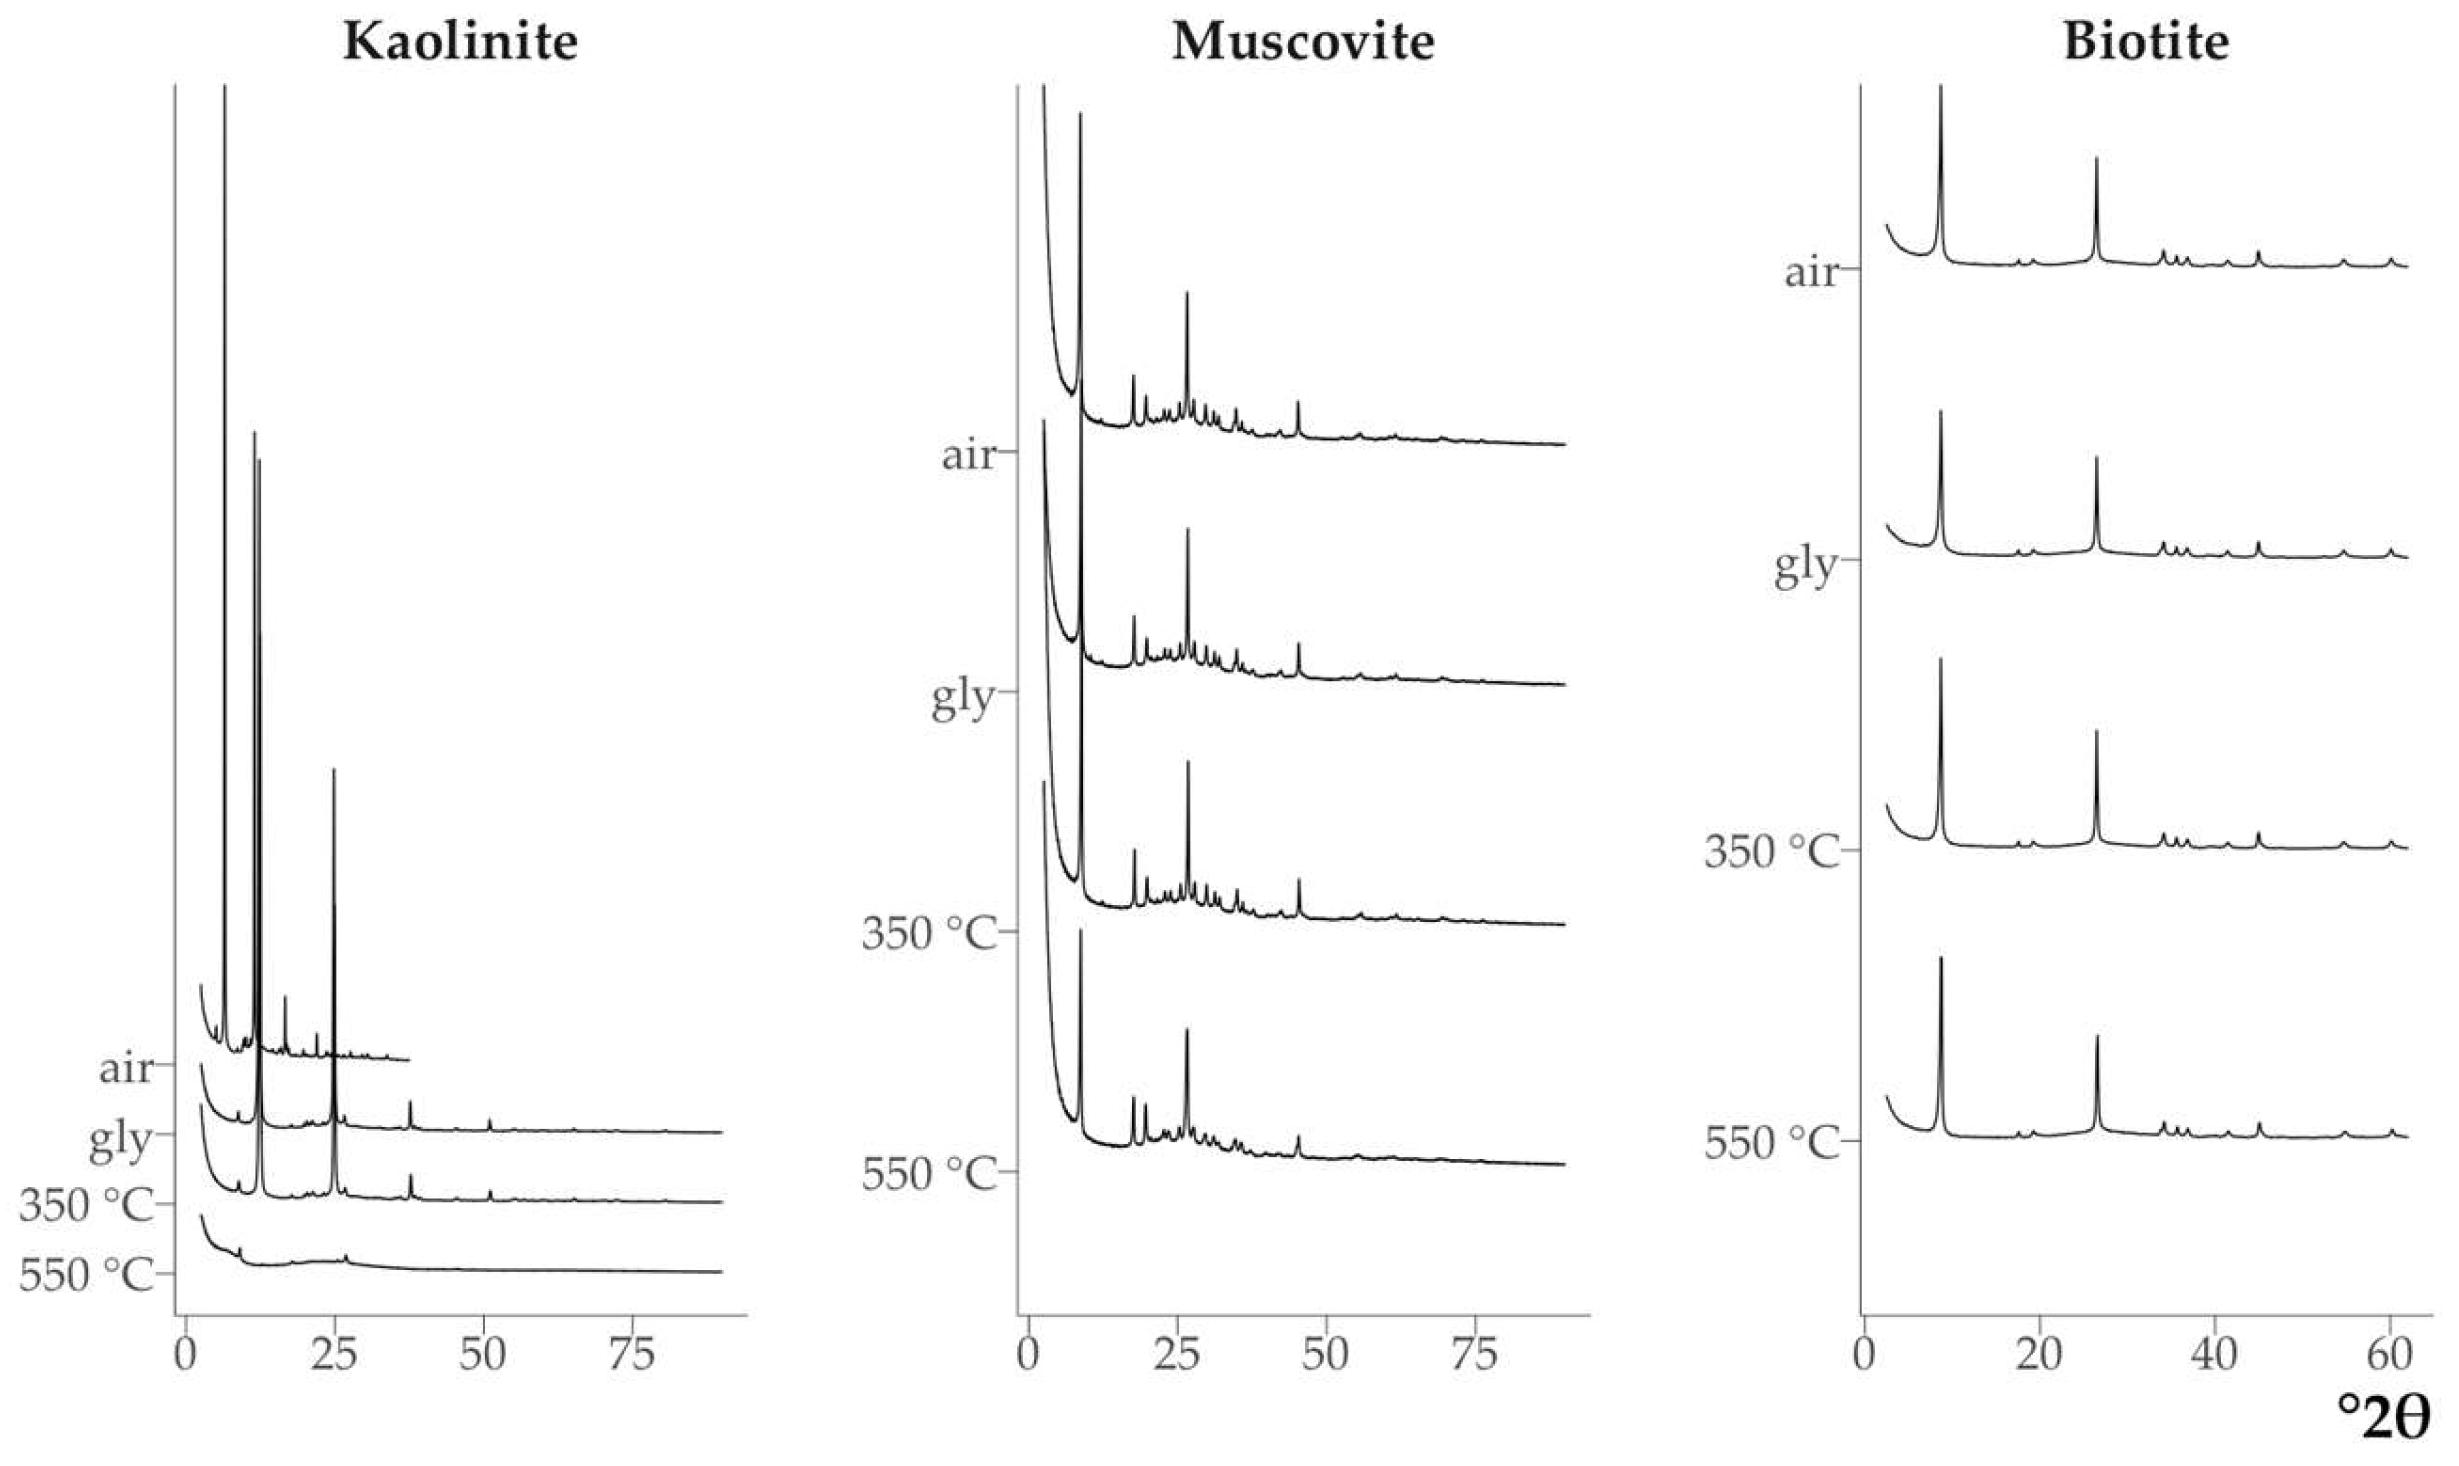
Figure 10.
DRIFTS spectra of clay minerals, organomineral complexes and HA.
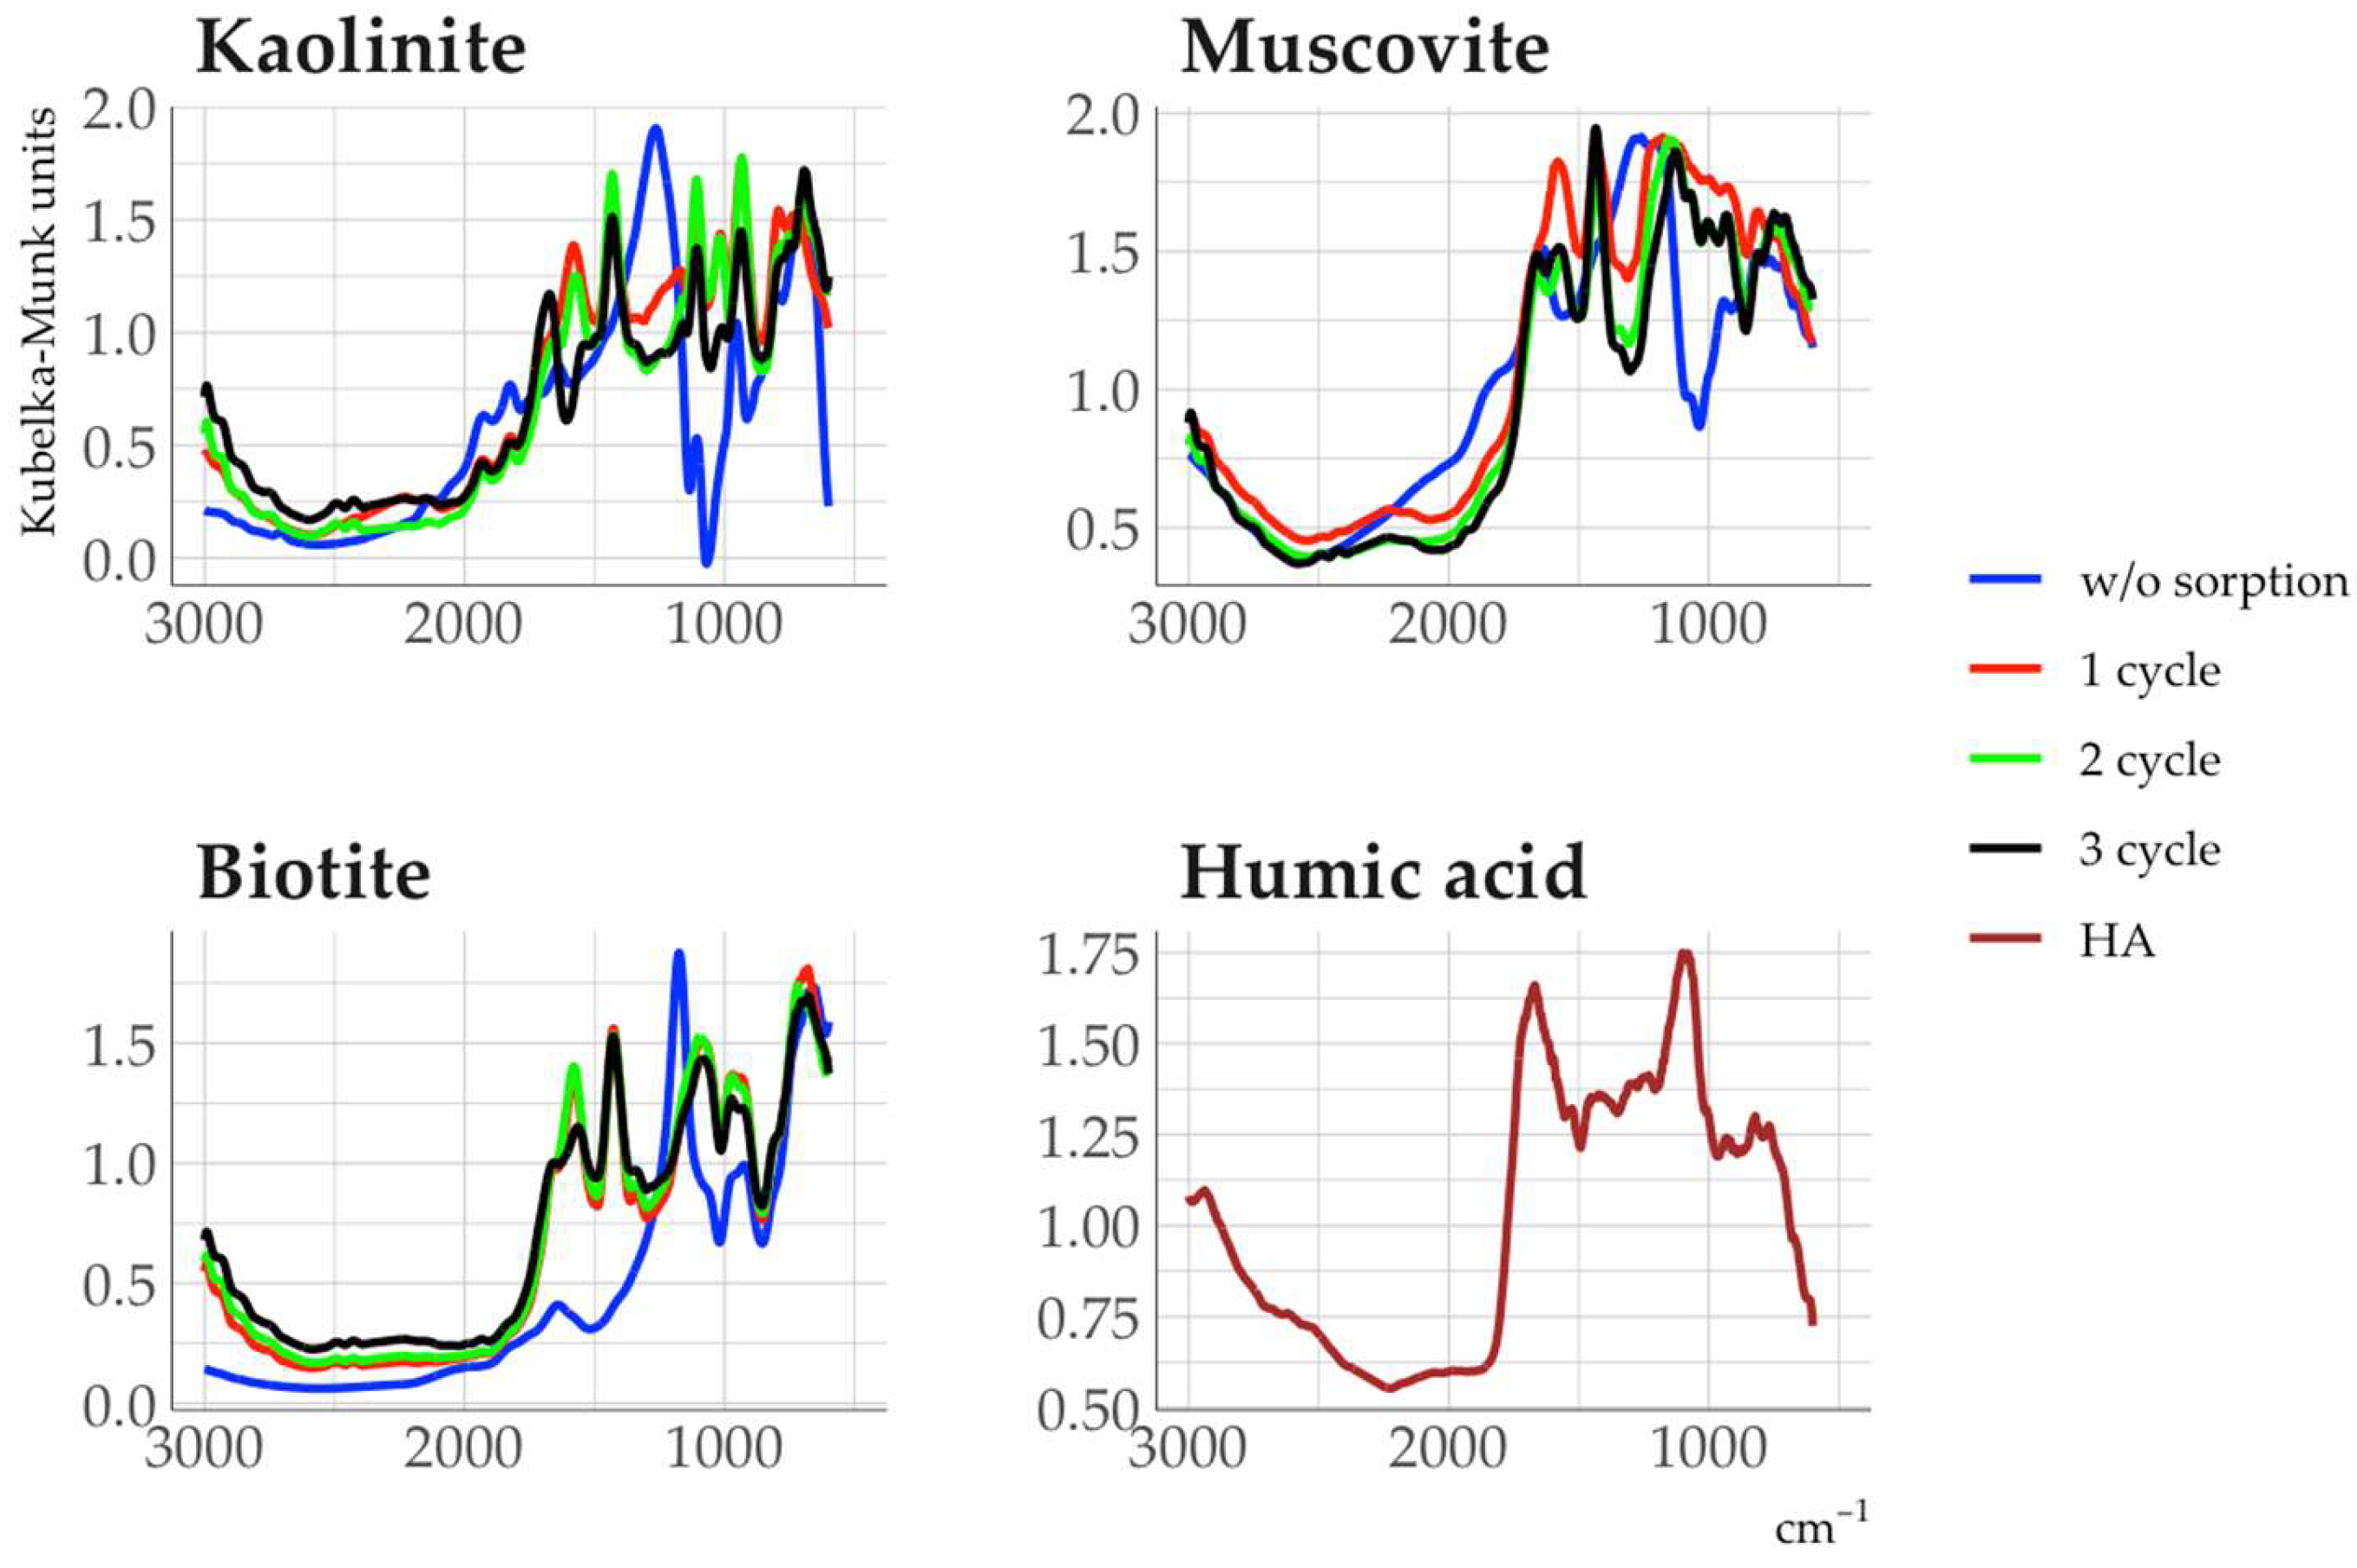
Figure 11.
Clustering of organomineral complexes in the coordinates of the principal components according to the intensities of the absorption bands in the DRIFTS spectra.
Figure 11.
Clustering of organomineral complexes in the coordinates of the principal components according to the intensities of the absorption bands in the DRIFTS spectra.
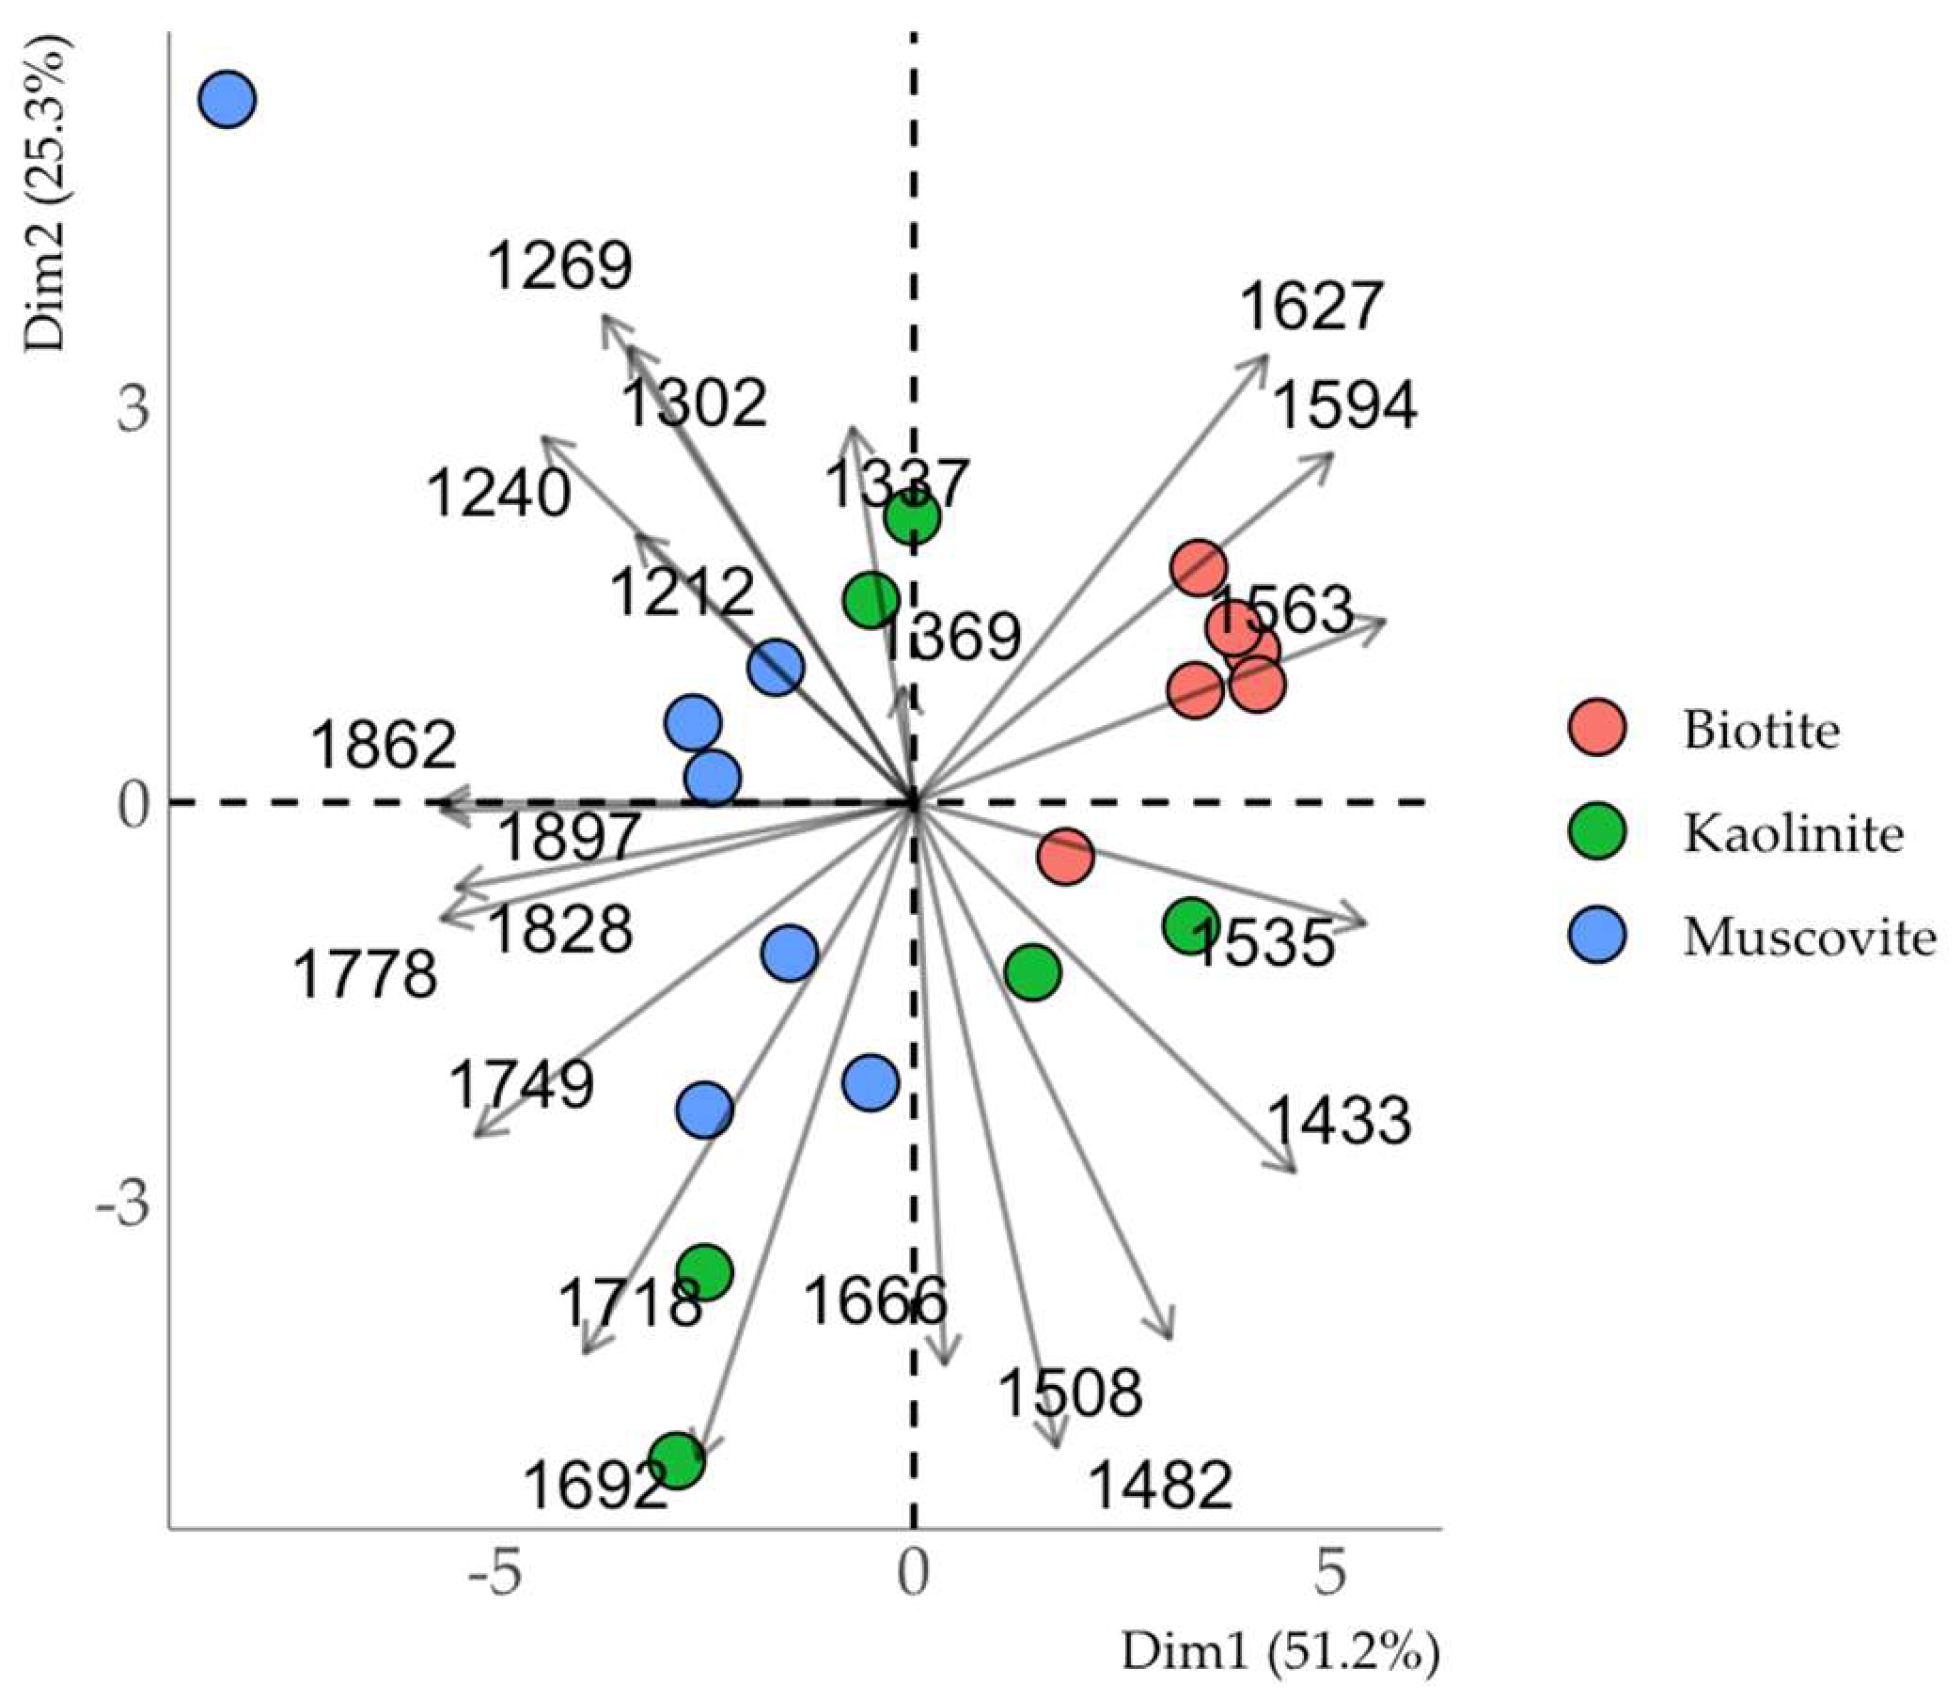
Figure 12.
DSC curves of organomineral complexes and HA.
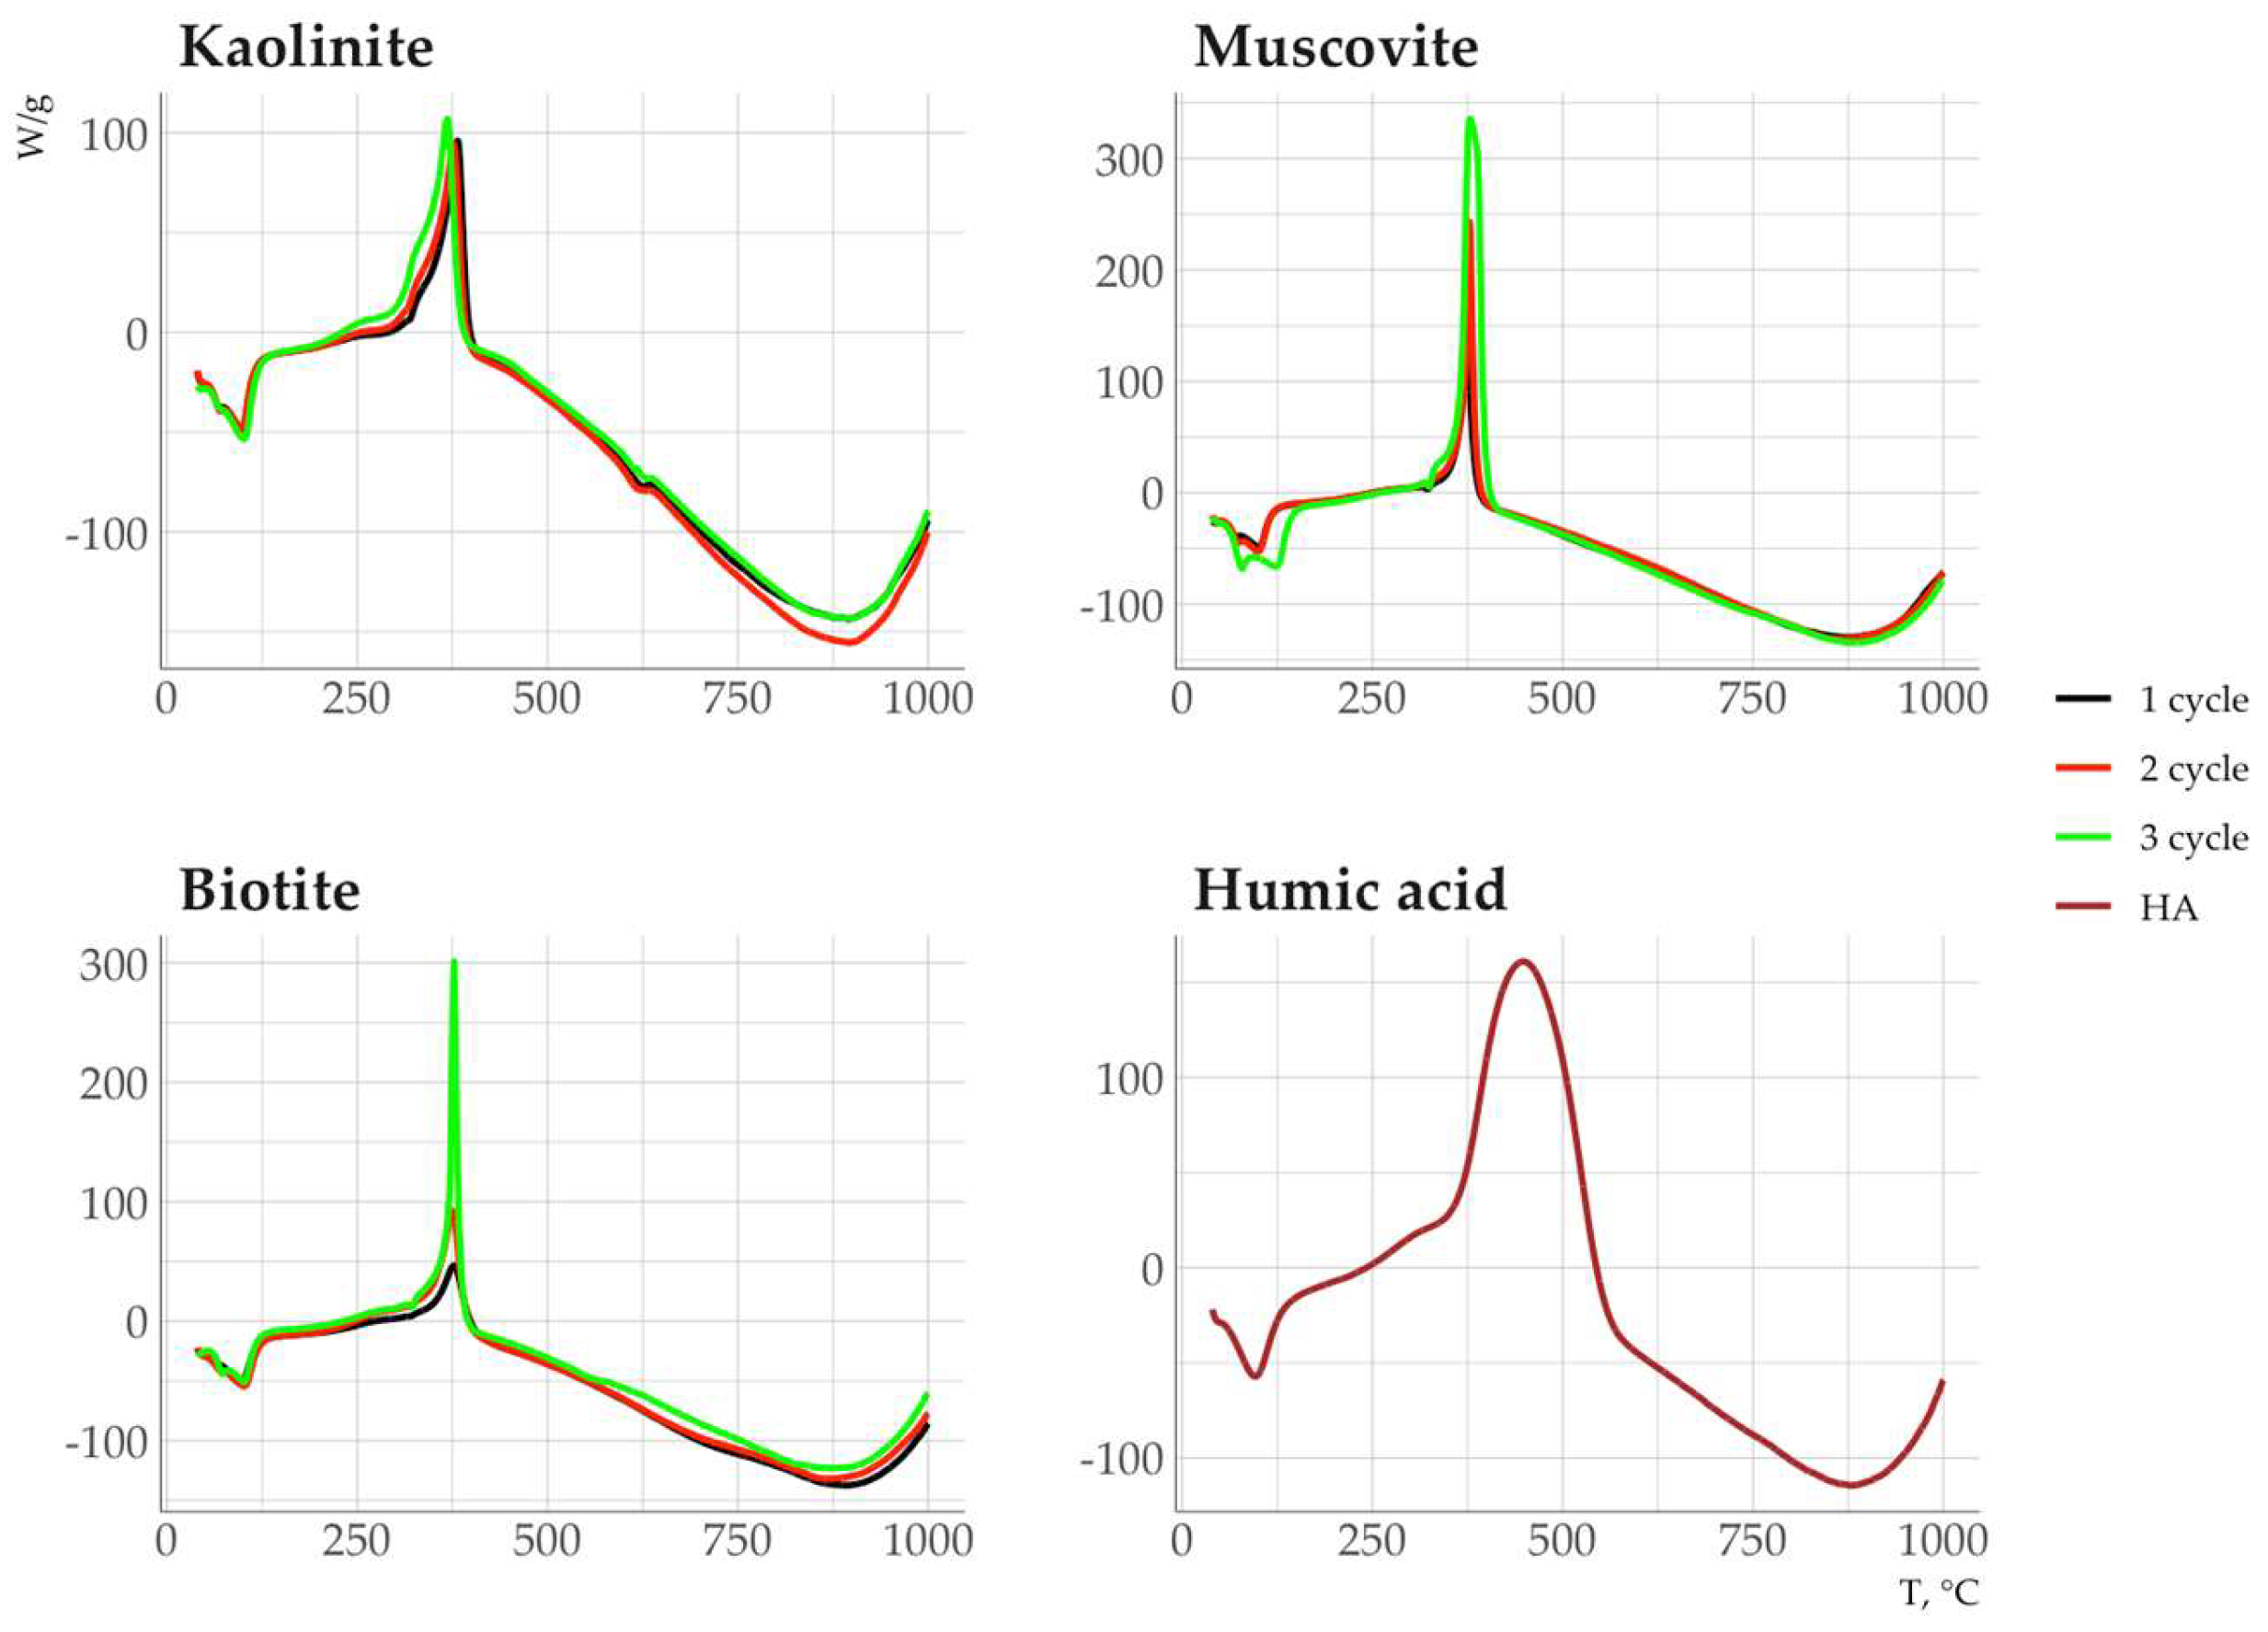
Figure 13.
Dependence of saturation indices of clay minerals and organomineral complexes on incubation time.
Figure 13.
Dependence of saturation indices of clay minerals and organomineral complexes on incubation time.
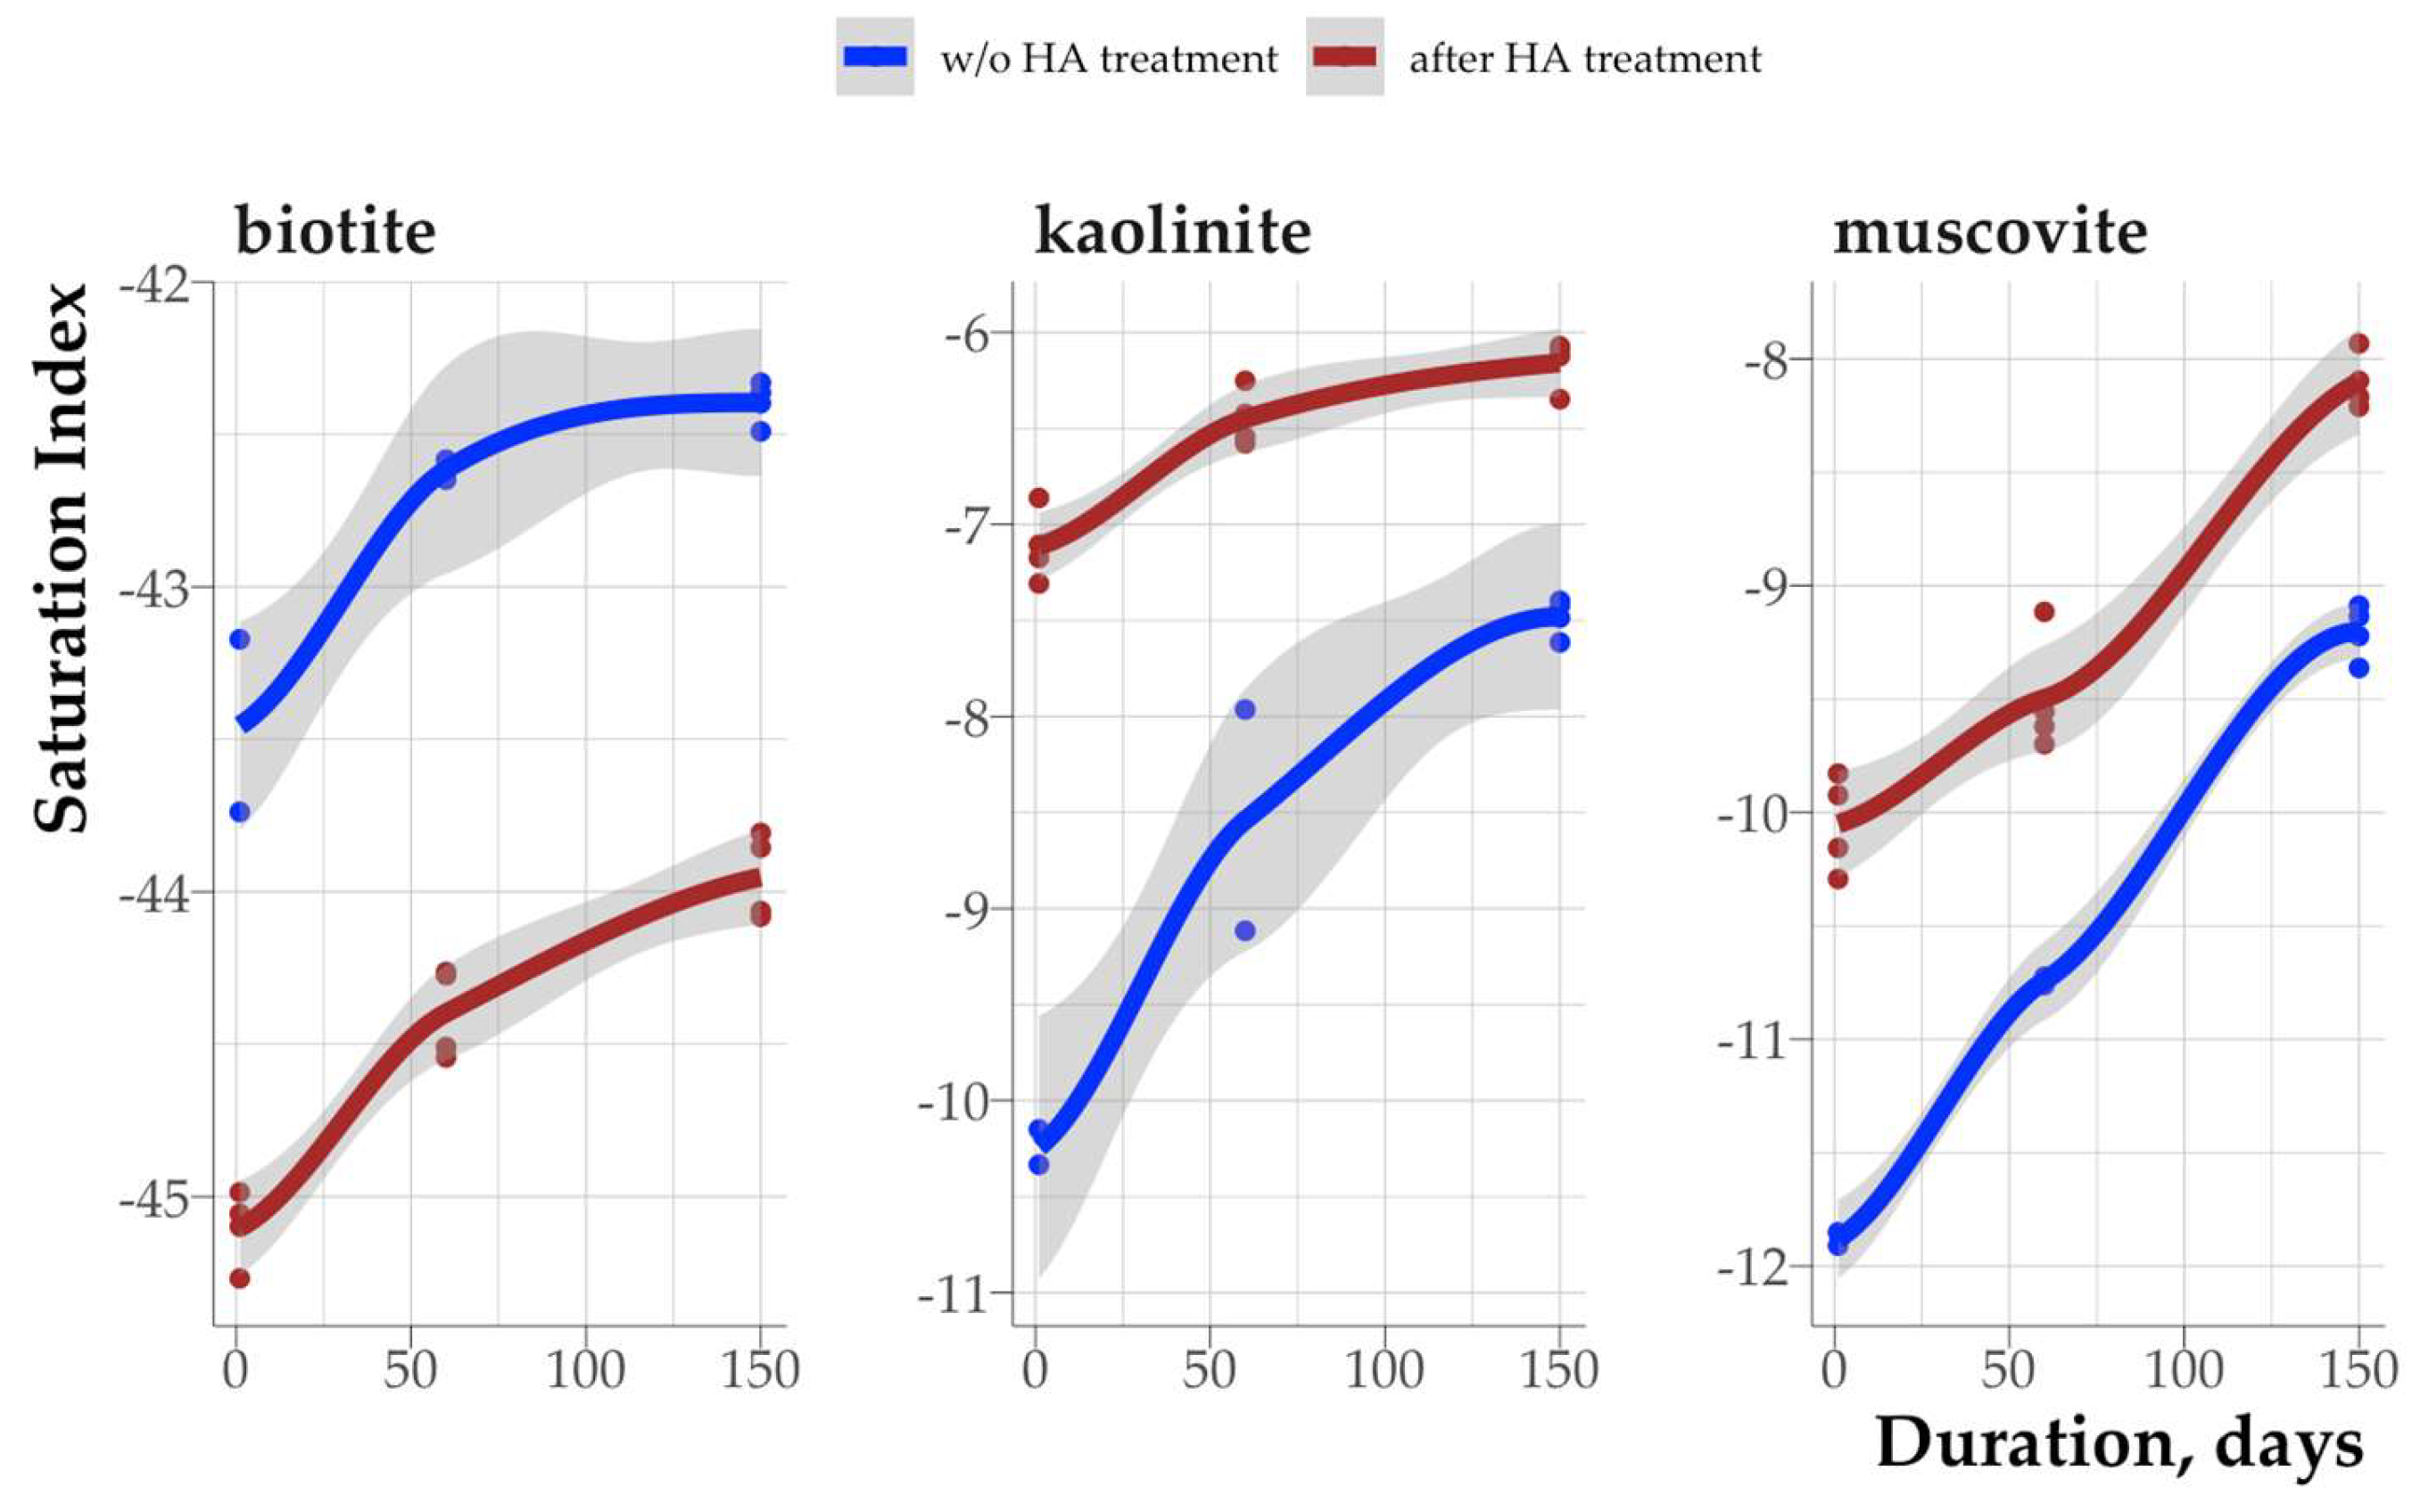
Figure 14.
Relationship between carbon content of organic matter in the clay fraction and saturation index (kaolinite as an example, similar for other minerals).
Figure 14.
Relationship between carbon content of organic matter in the clay fraction and saturation index (kaolinite as an example, similar for other minerals).
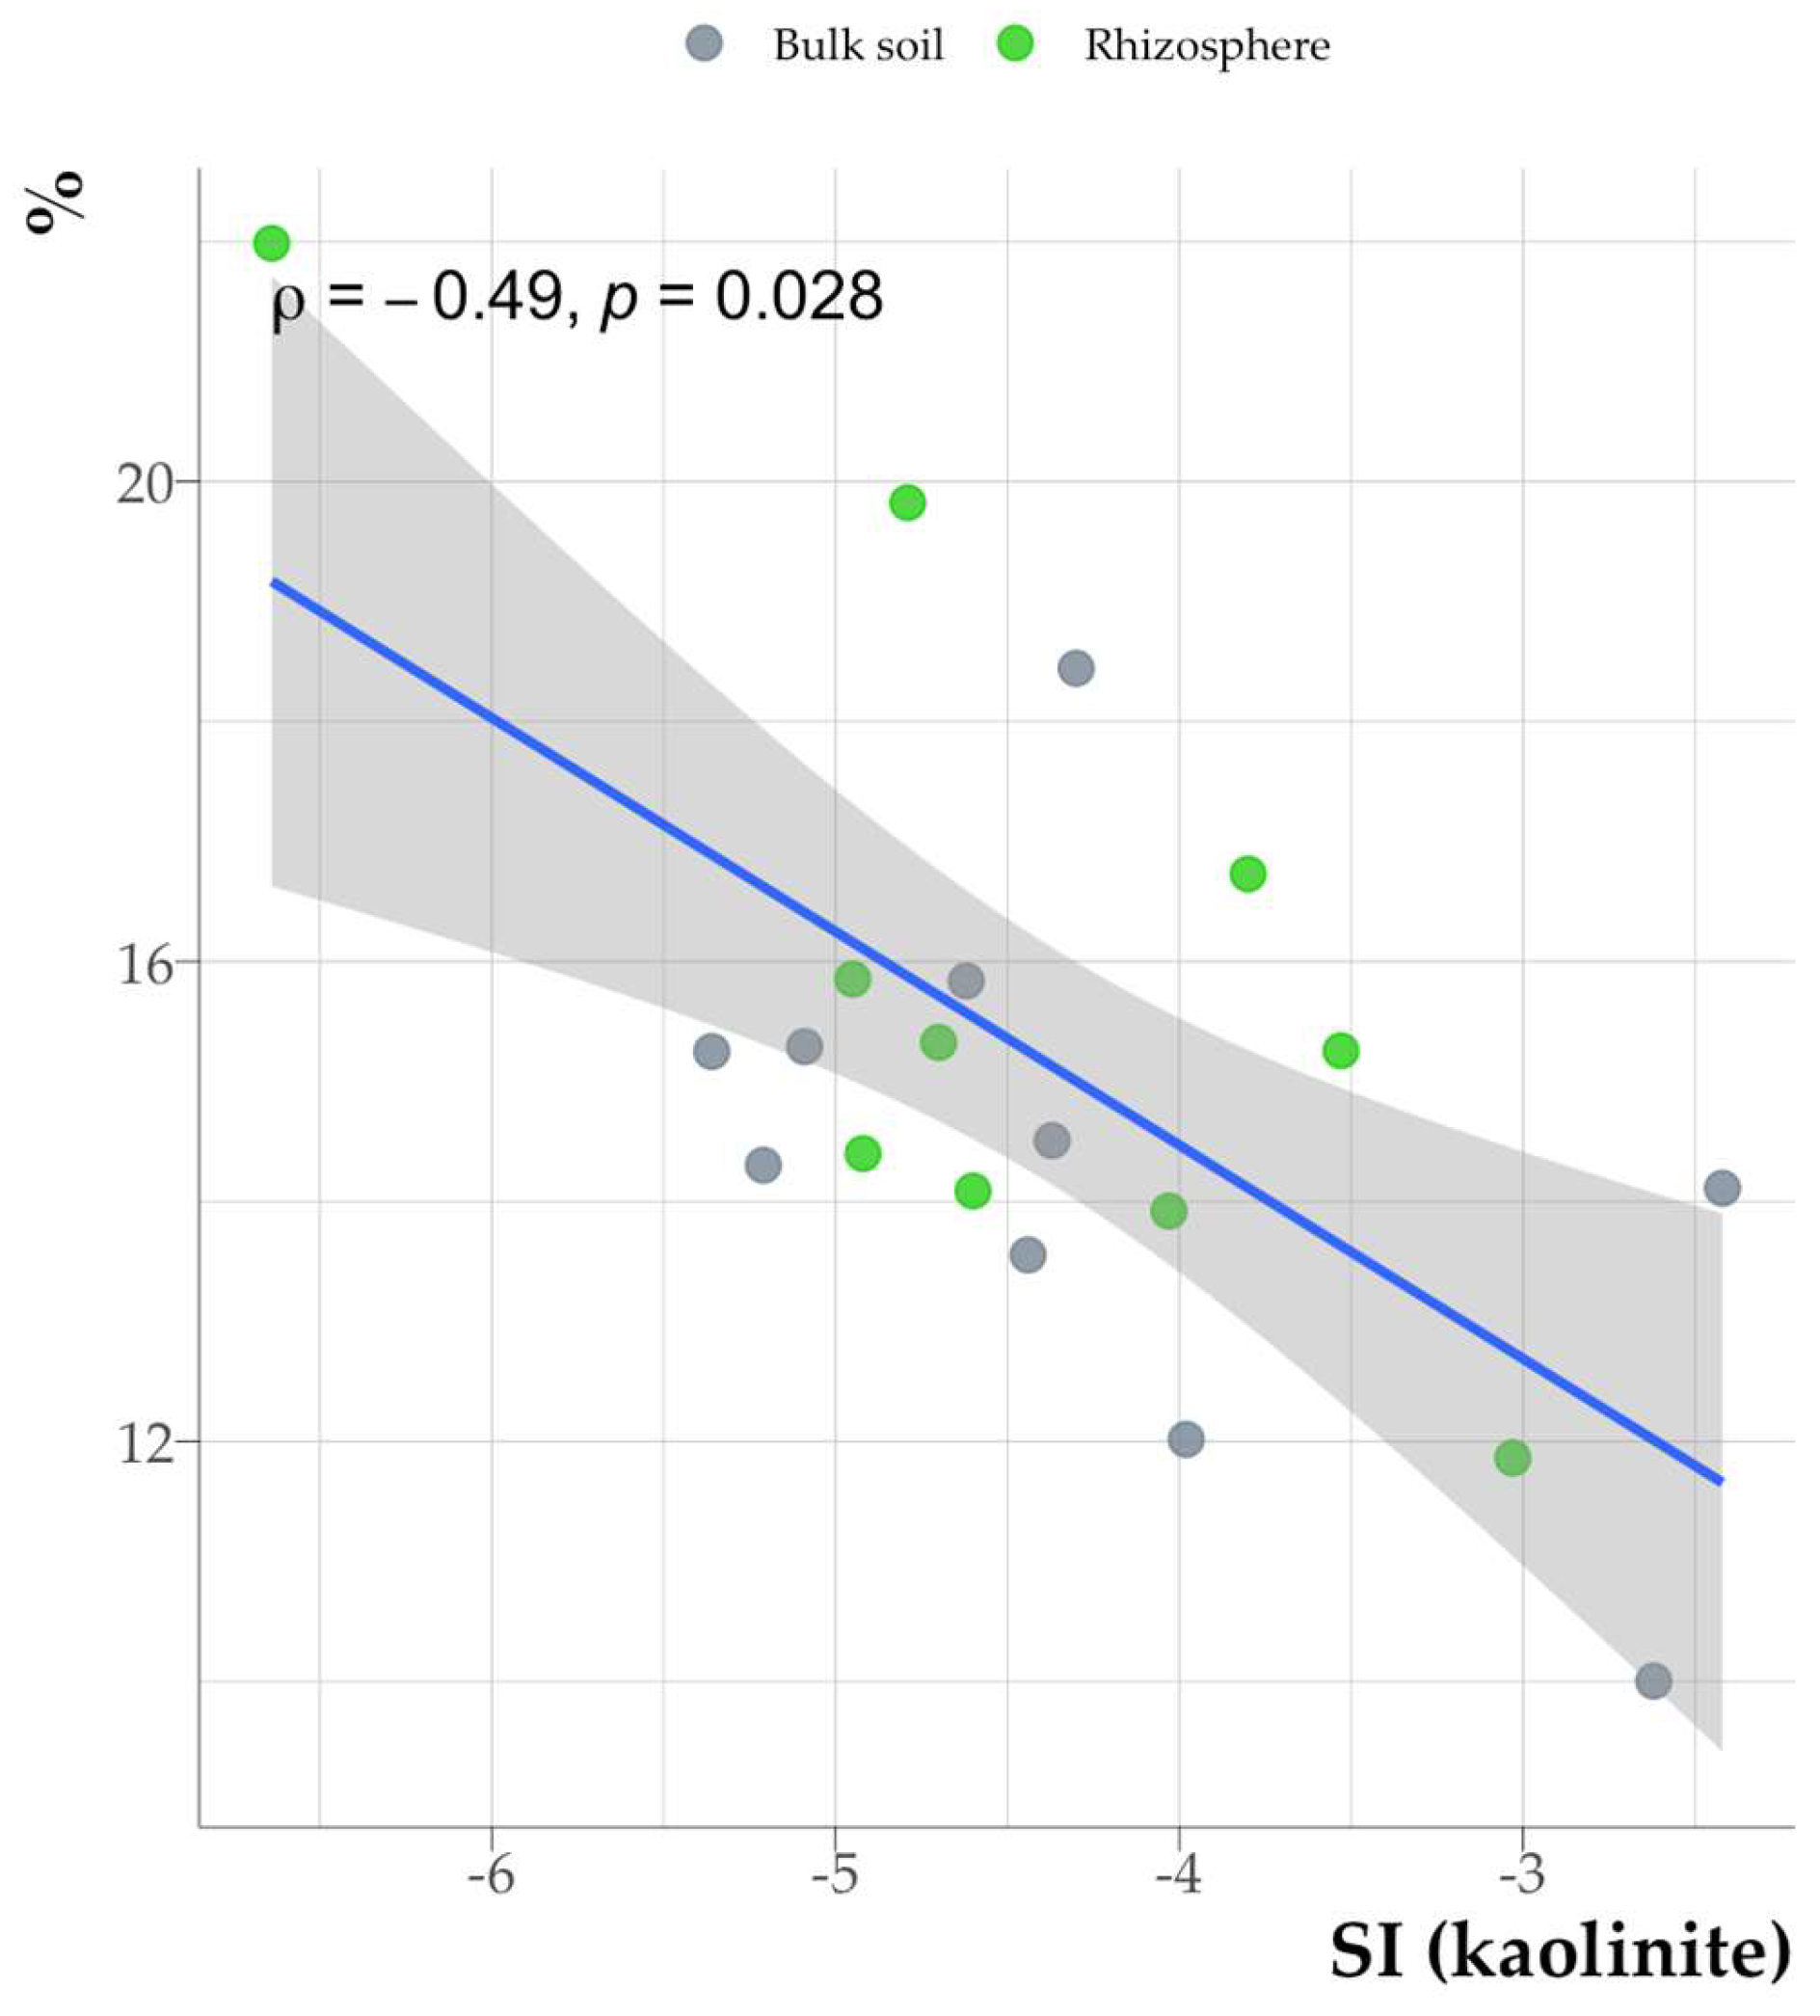
Figure 15.
Relationship between the intensities of the absorption bands 692, 750: 1505, 1708 cm-1 and the saturation index (kaolinite as an example, similar for other minerals).
Figure 15.
Relationship between the intensities of the absorption bands 692, 750: 1505, 1708 cm-1 and the saturation index (kaolinite as an example, similar for other minerals).
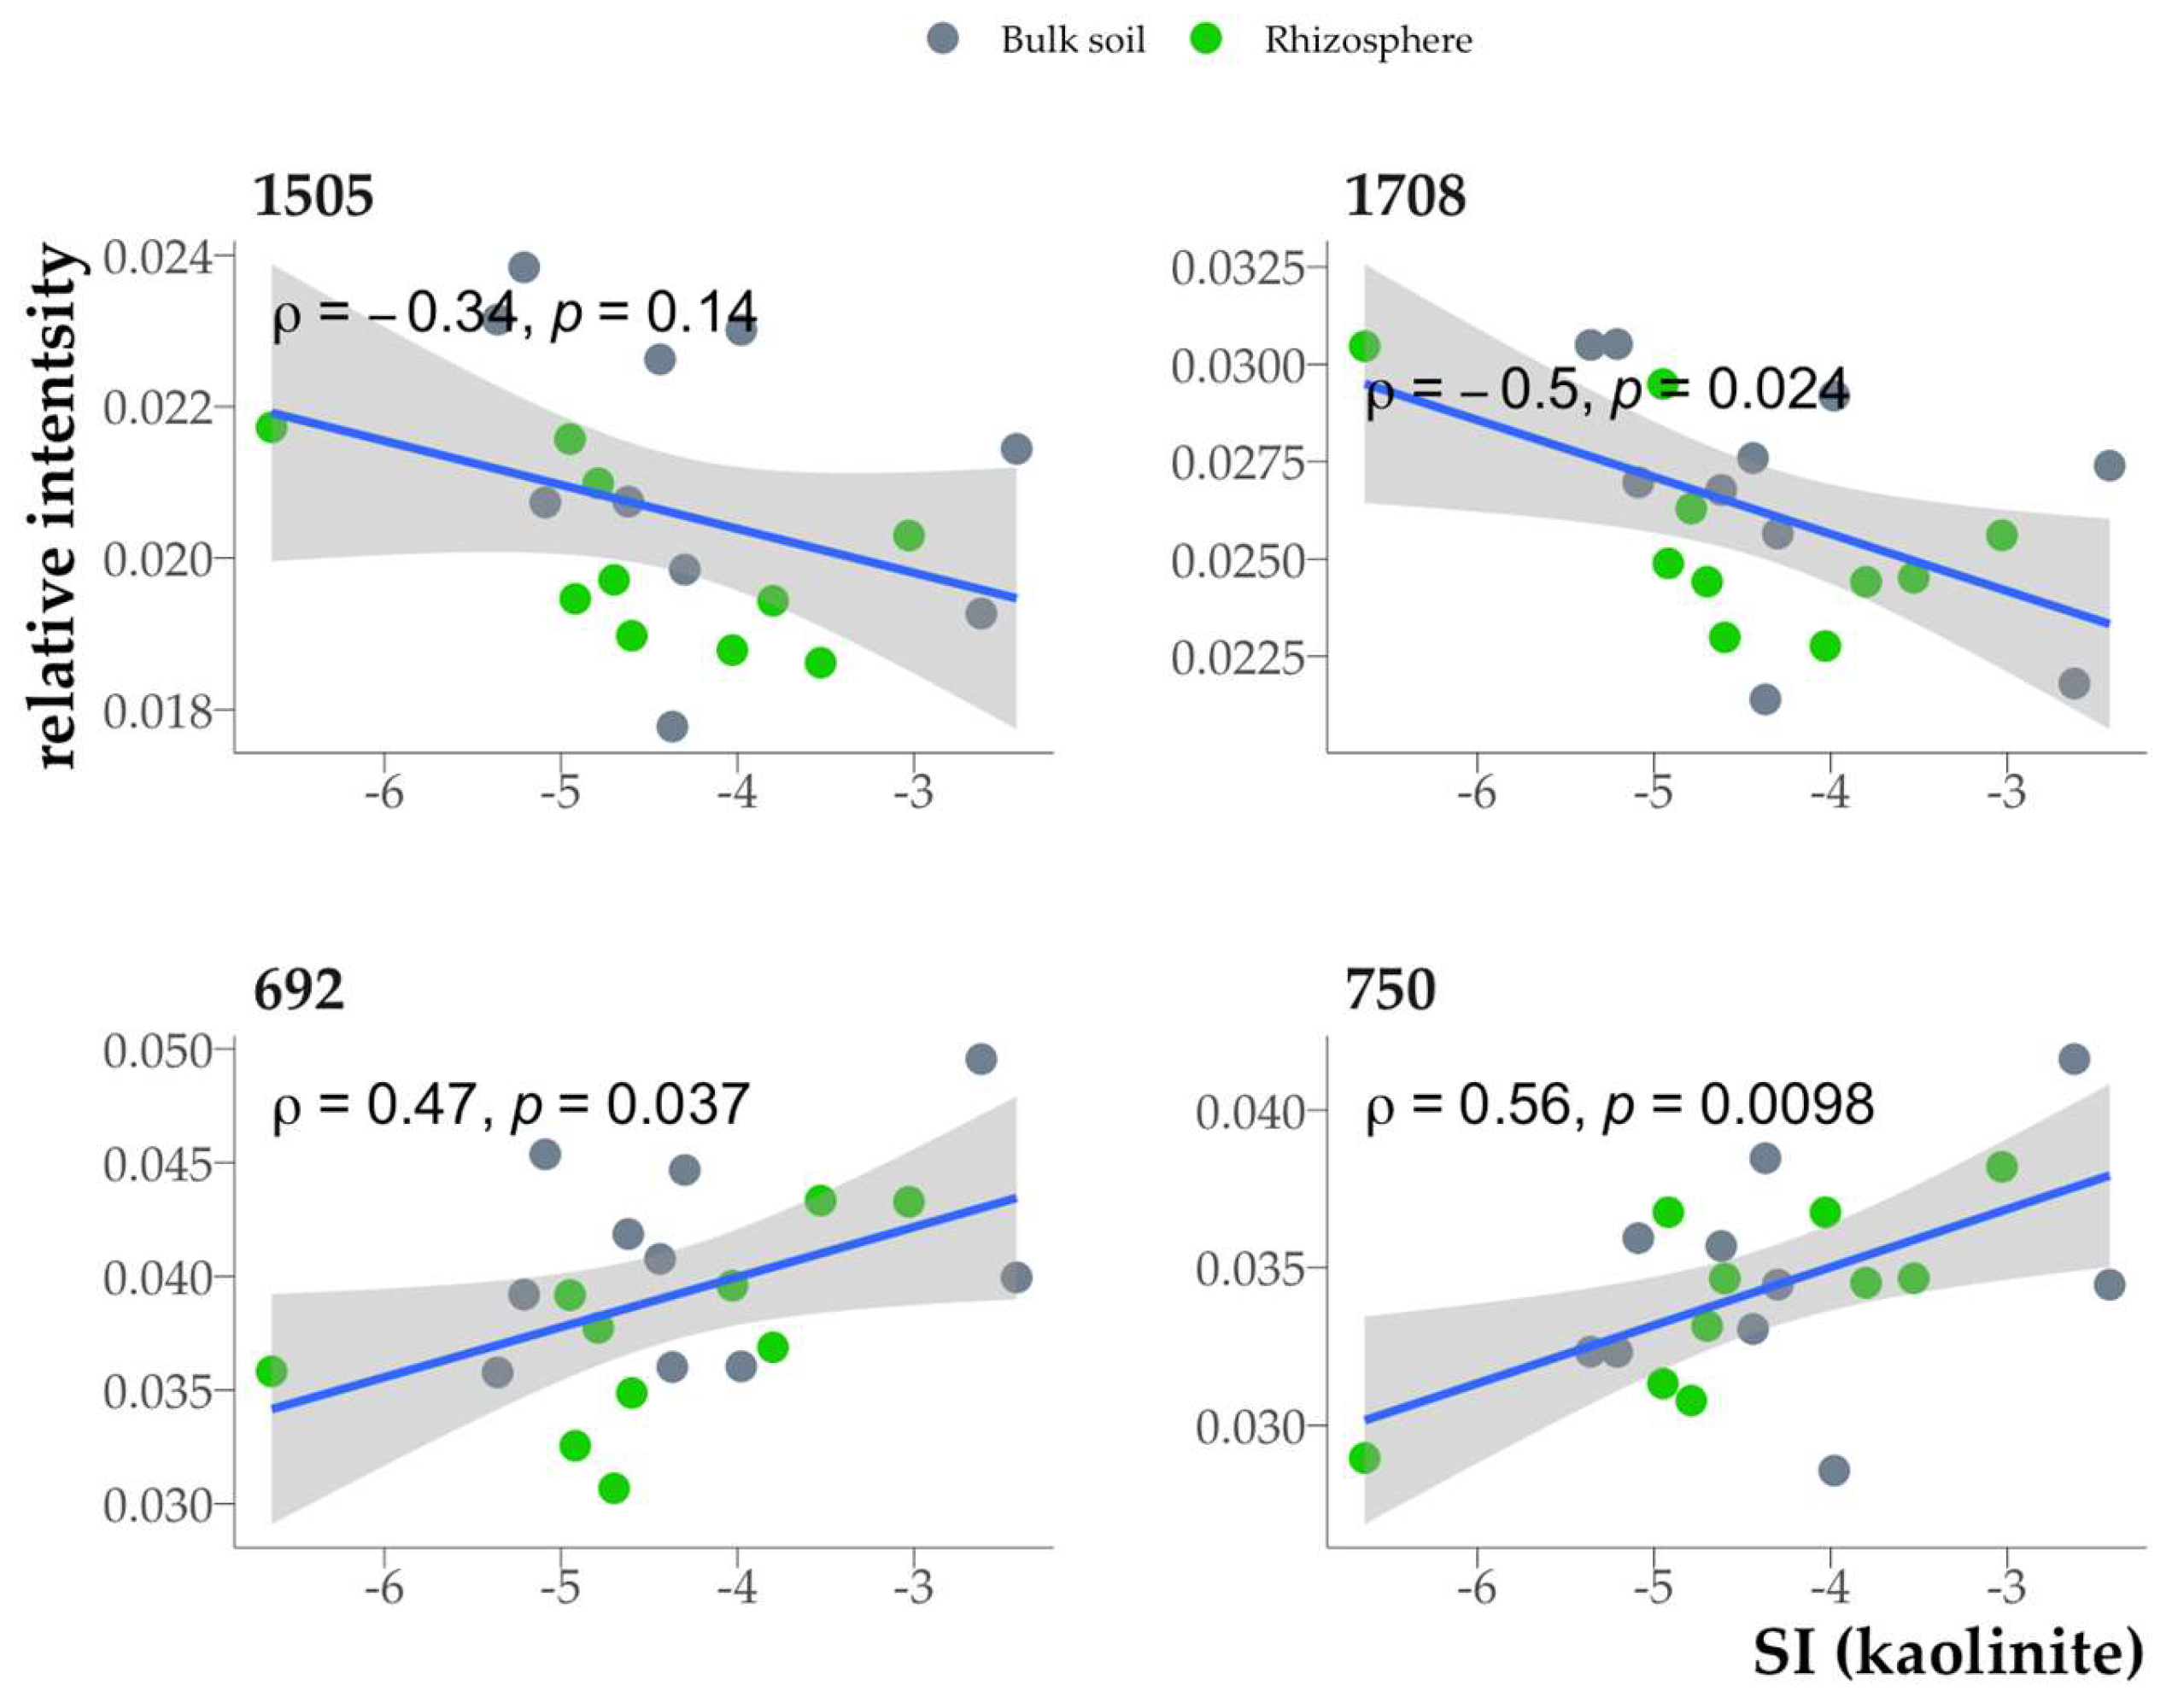
Figure 16.
Relationship between the area of exothermic effects of organic matter combustion in the clay fraction and the saturation index (kaolinite as an example, similar for other minerals).
Figure 16.
Relationship between the area of exothermic effects of organic matter combustion in the clay fraction and the saturation index (kaolinite as an example, similar for other minerals).
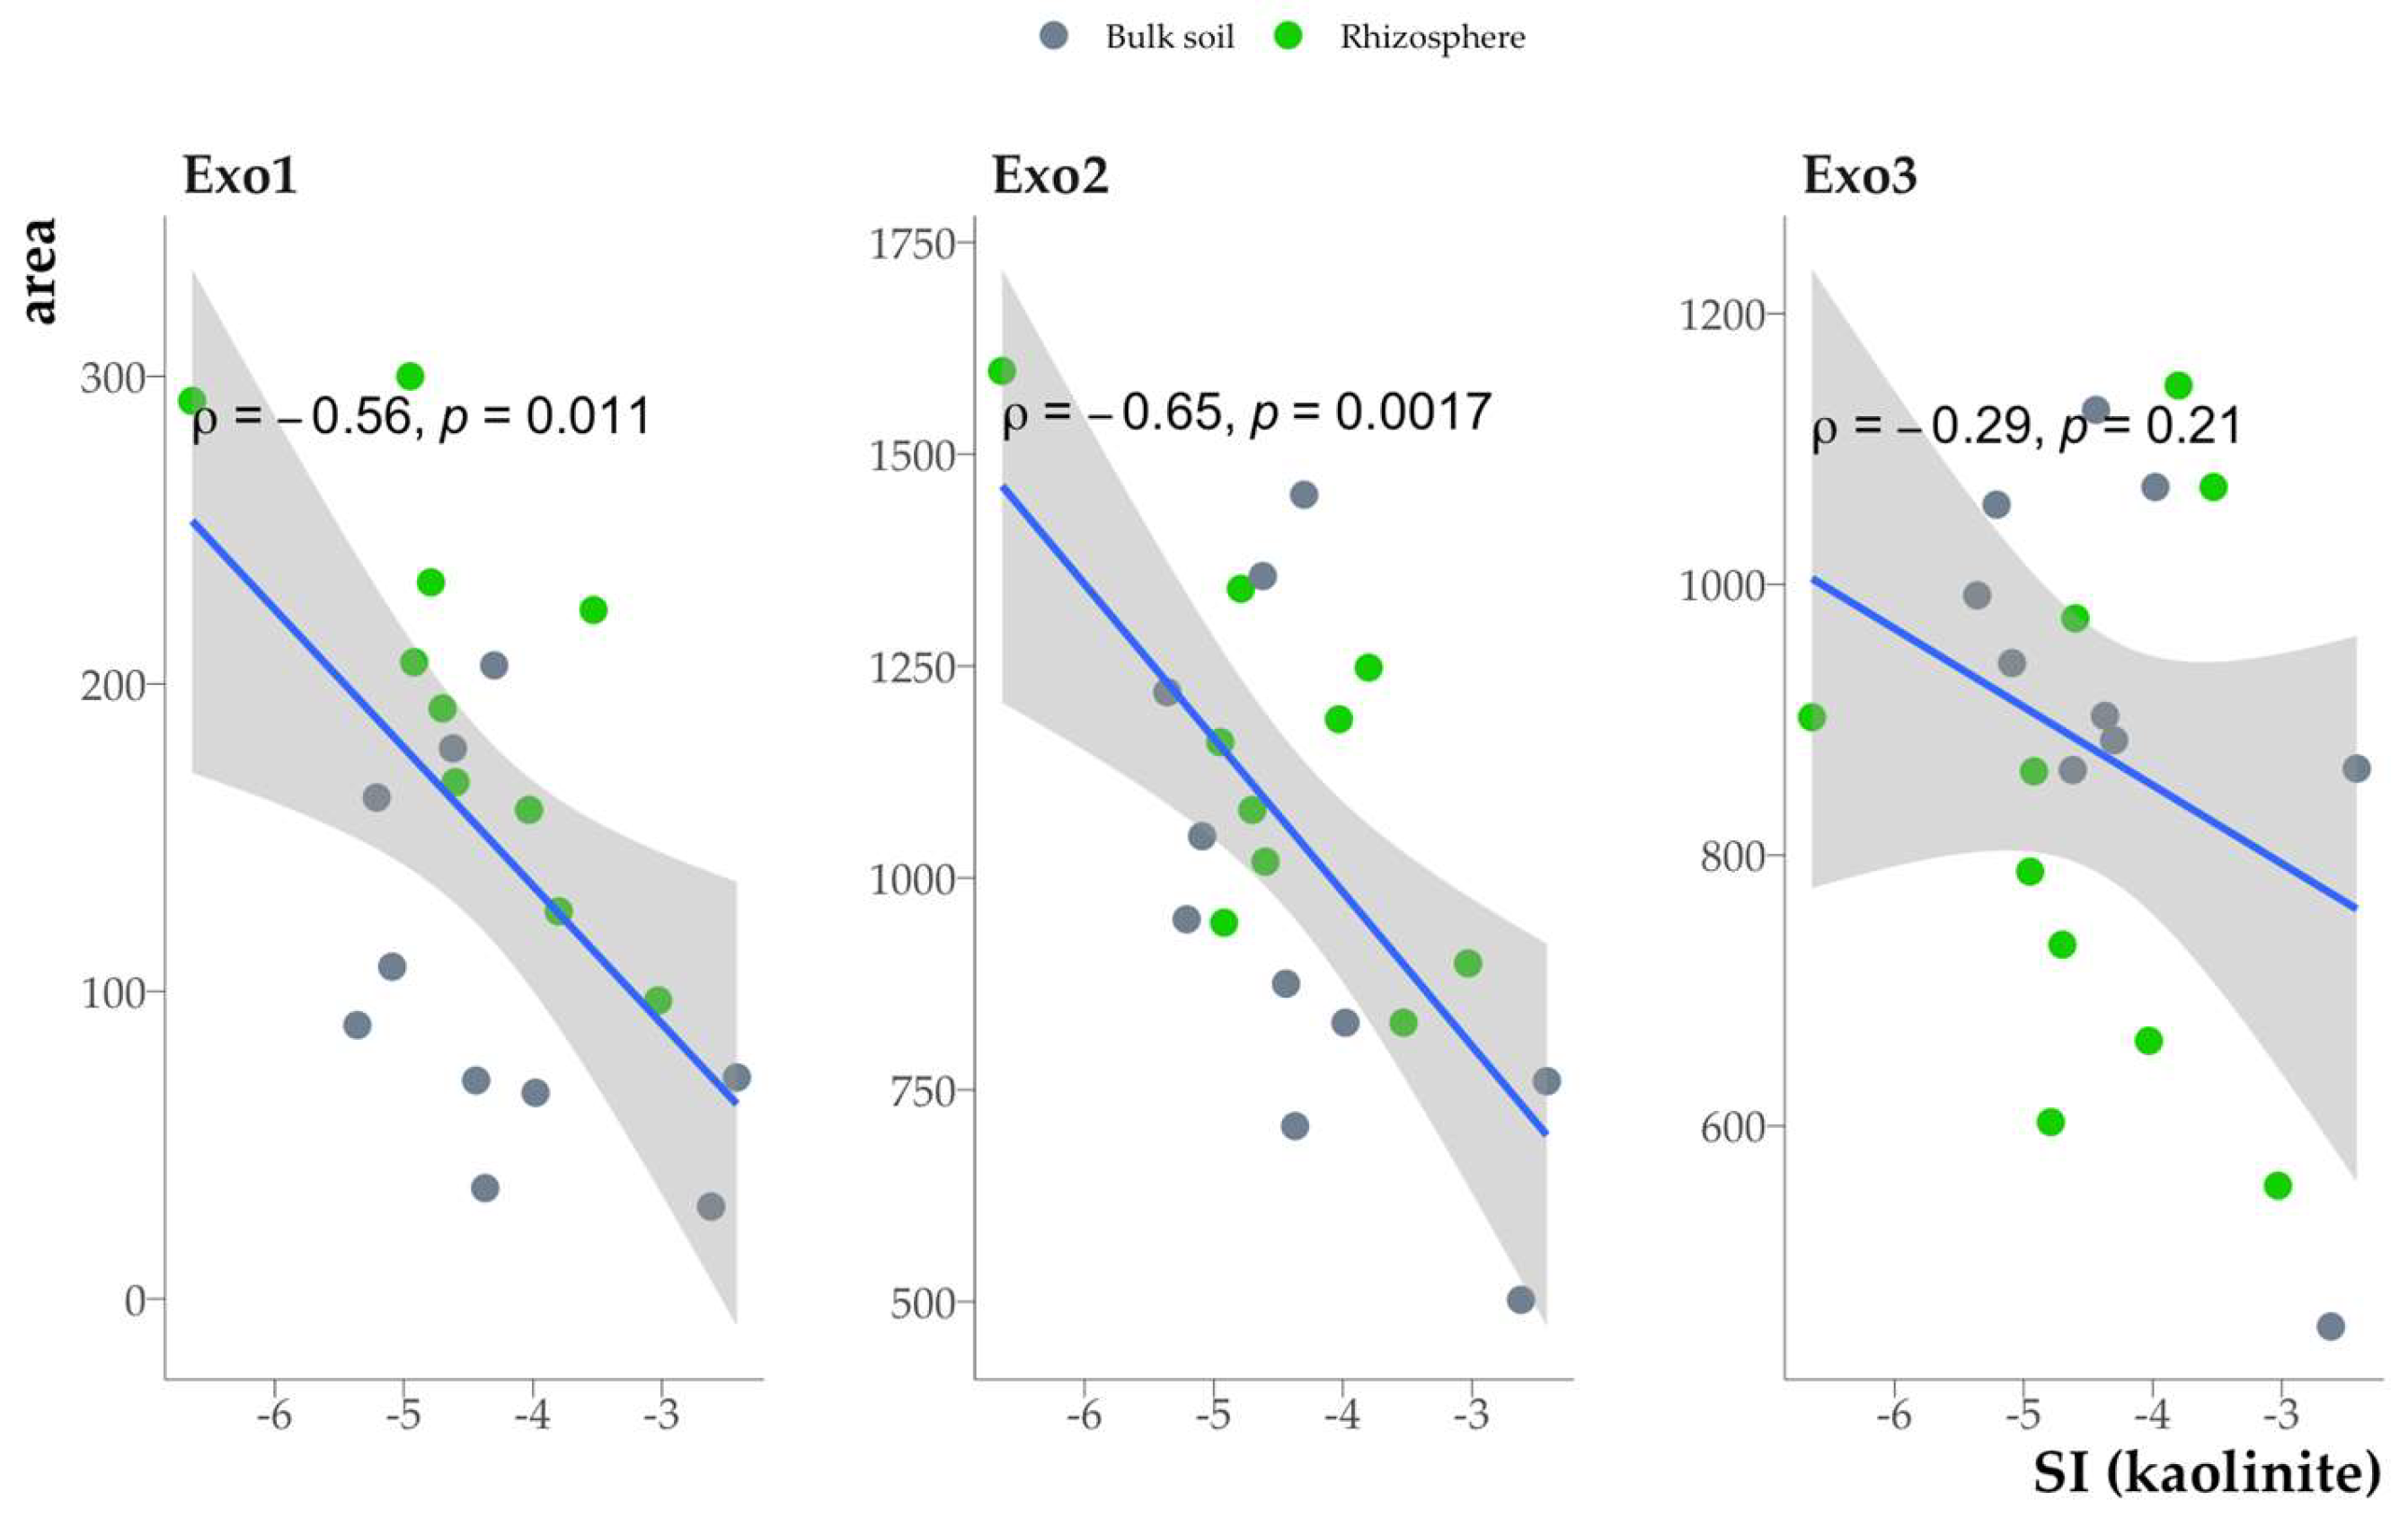
Figure 17.
X-ray diffraction patterns of the clay fraction after saturation: (a) with ethylene glycol; (b) after calcination at 350°C.
Figure 17.
X-ray diffraction patterns of the clay fraction after saturation: (a) with ethylene glycol; (b) after calcination at 350°C.
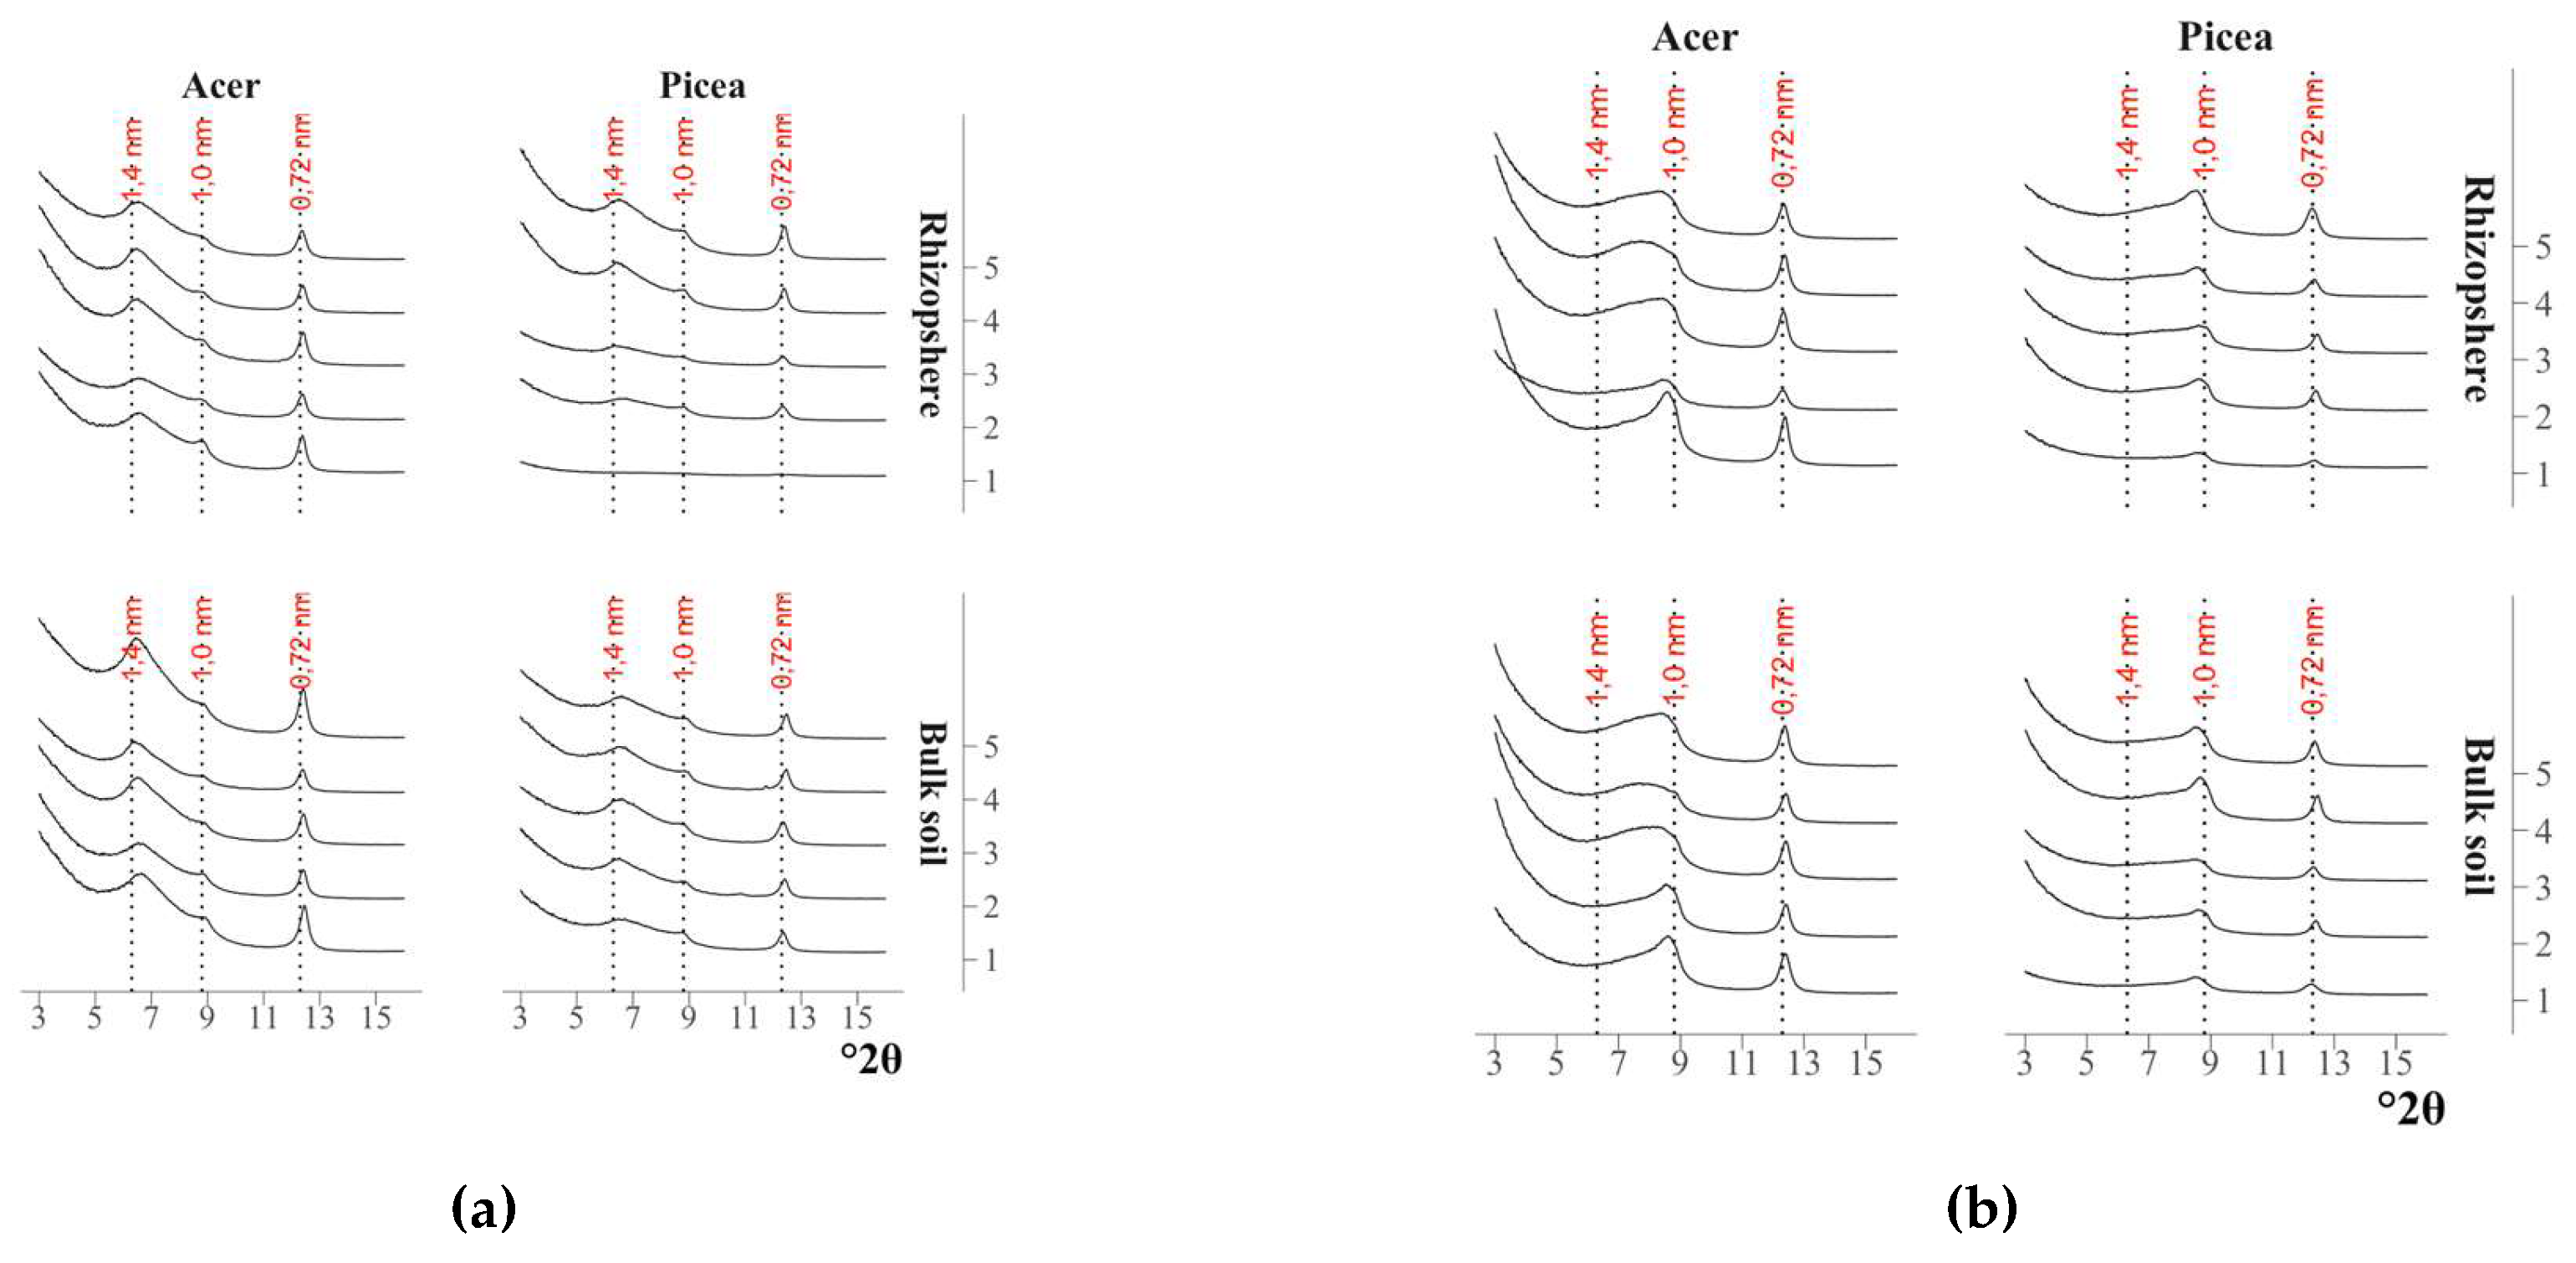
Figure 18.
Results of deconvolution of diffraction patterns of clay fractions from the rhizosphere of maple, spruce and bulk soil: (a) reflection areas in the range of 1.4-1.0 nm; (b) position of peaks.
Figure 18.
Results of deconvolution of diffraction patterns of clay fractions from the rhizosphere of maple, spruce and bulk soil: (a) reflection areas in the range of 1.4-1.0 nm; (b) position of peaks.
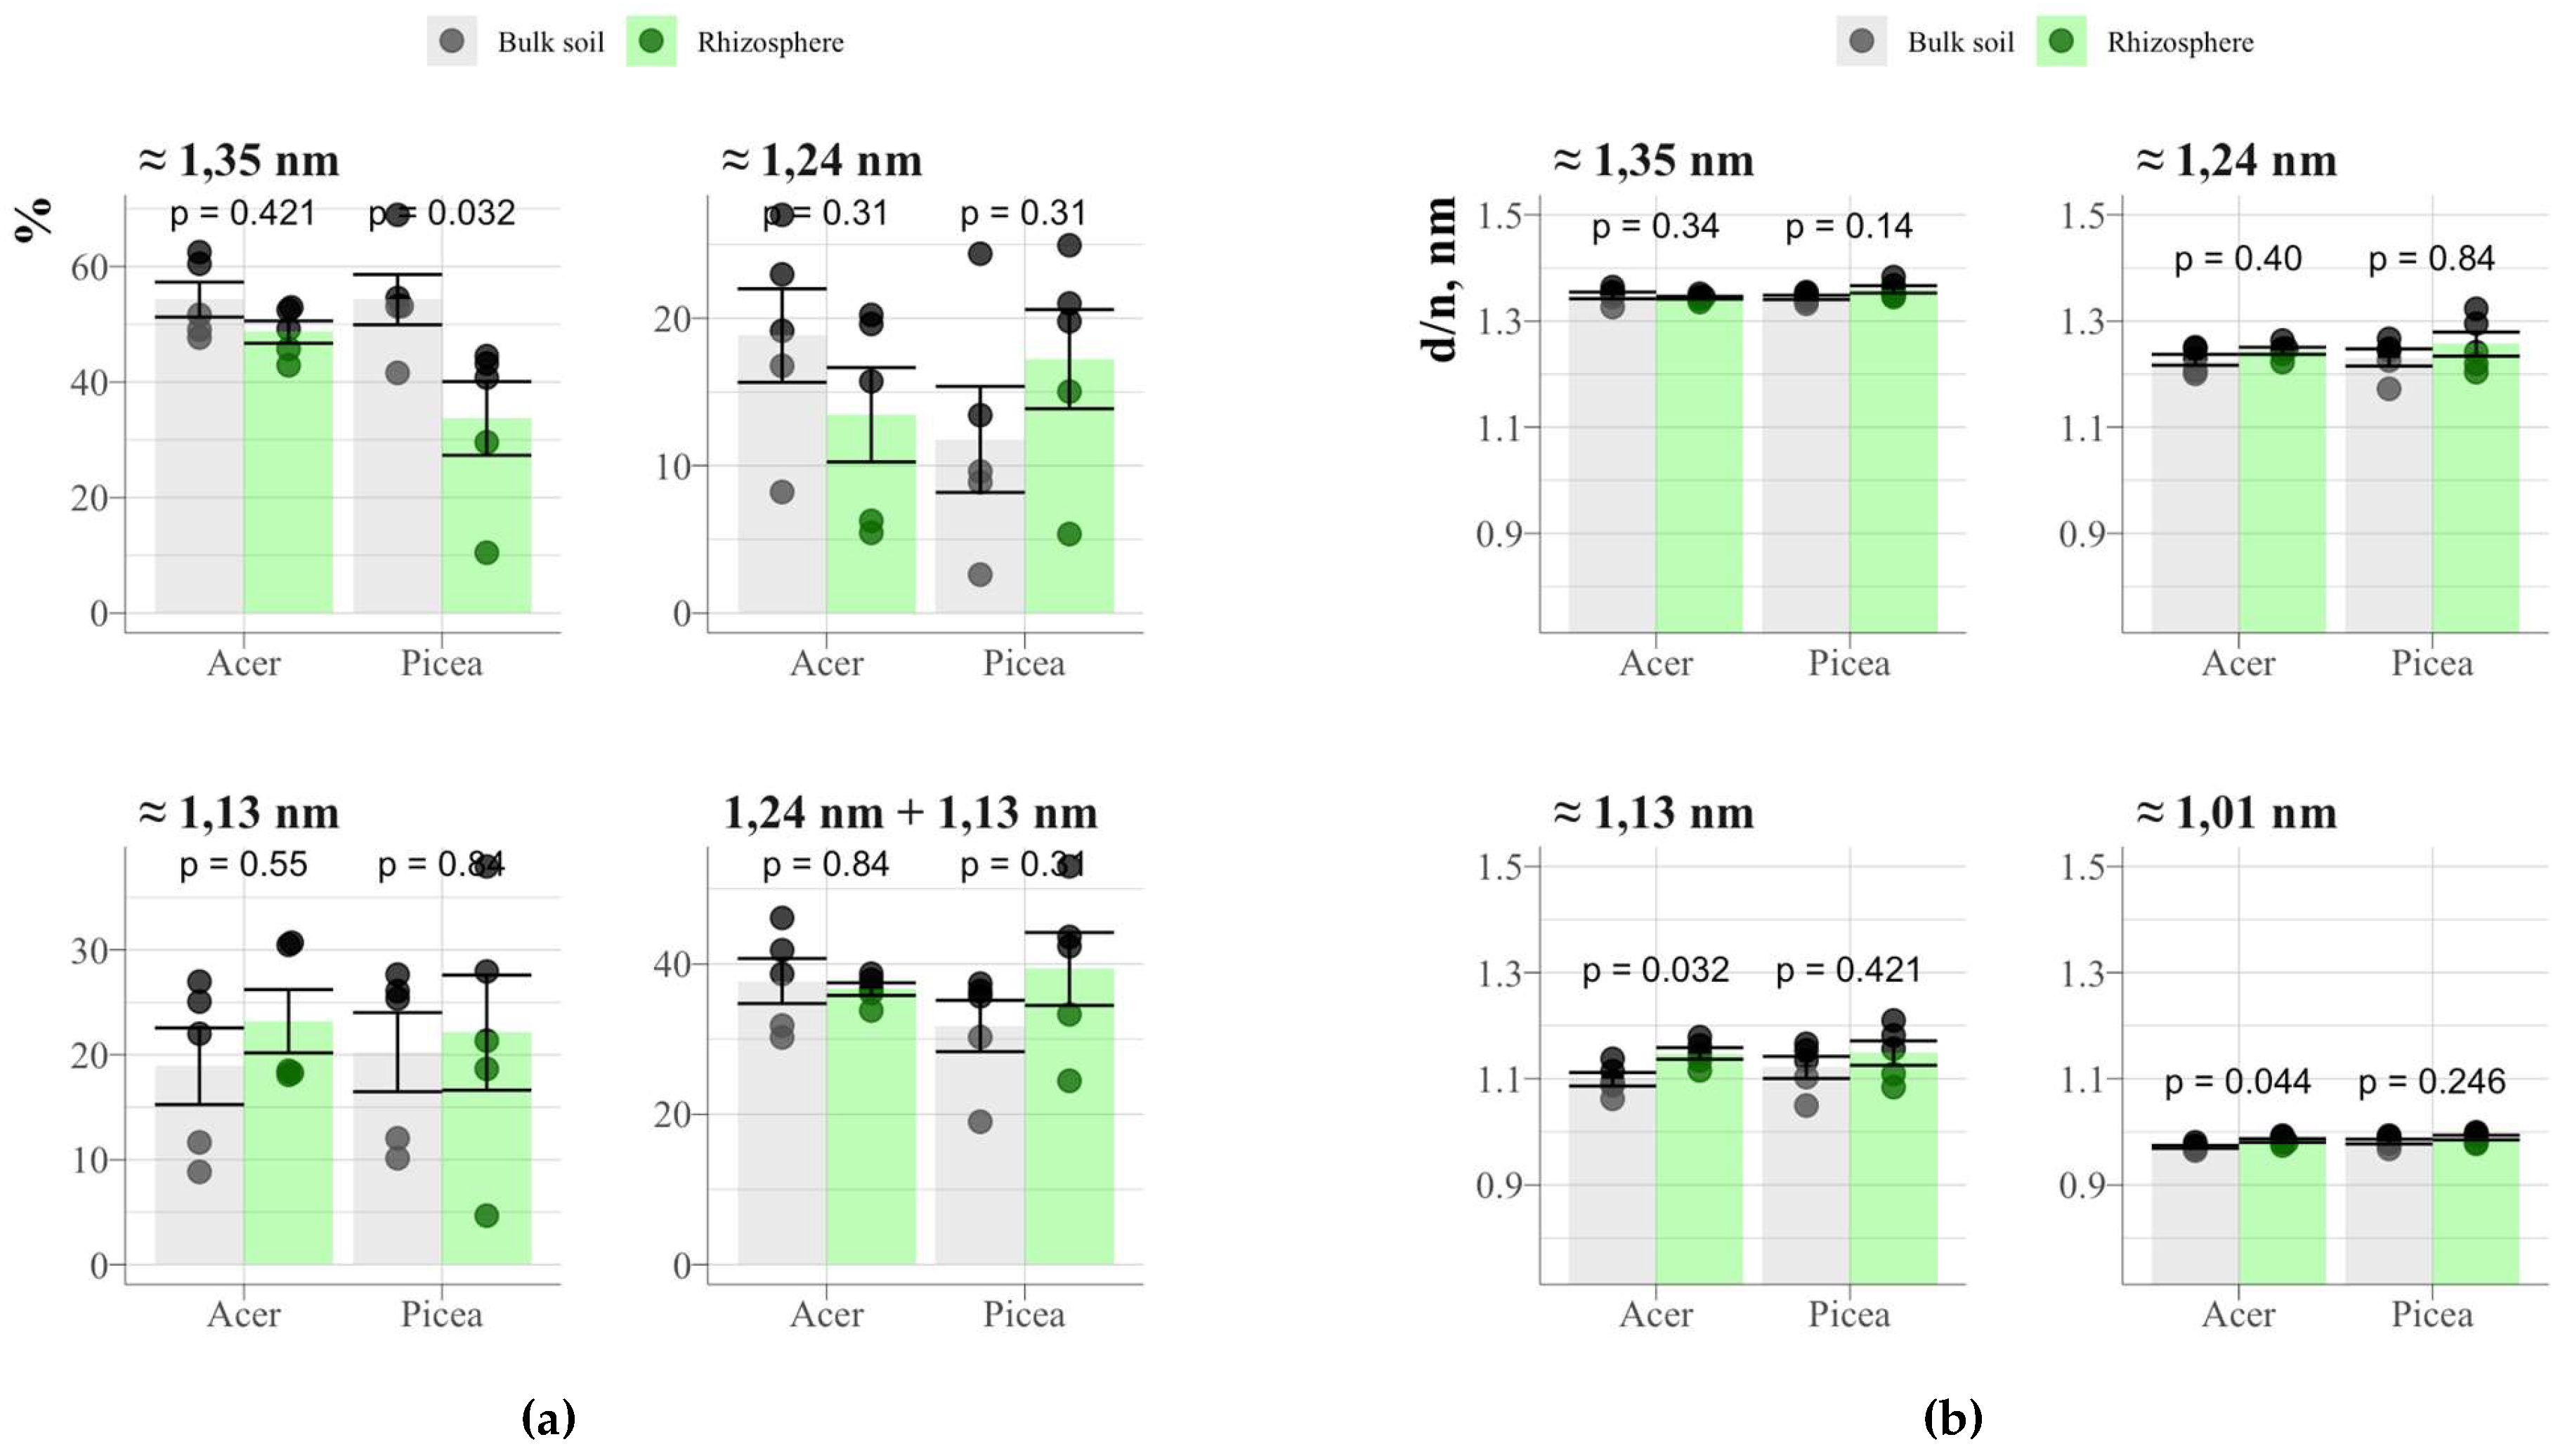
Figure 19.
Potassium potential of the bulk podzolic soil and rhizosphere of spruce and maple.
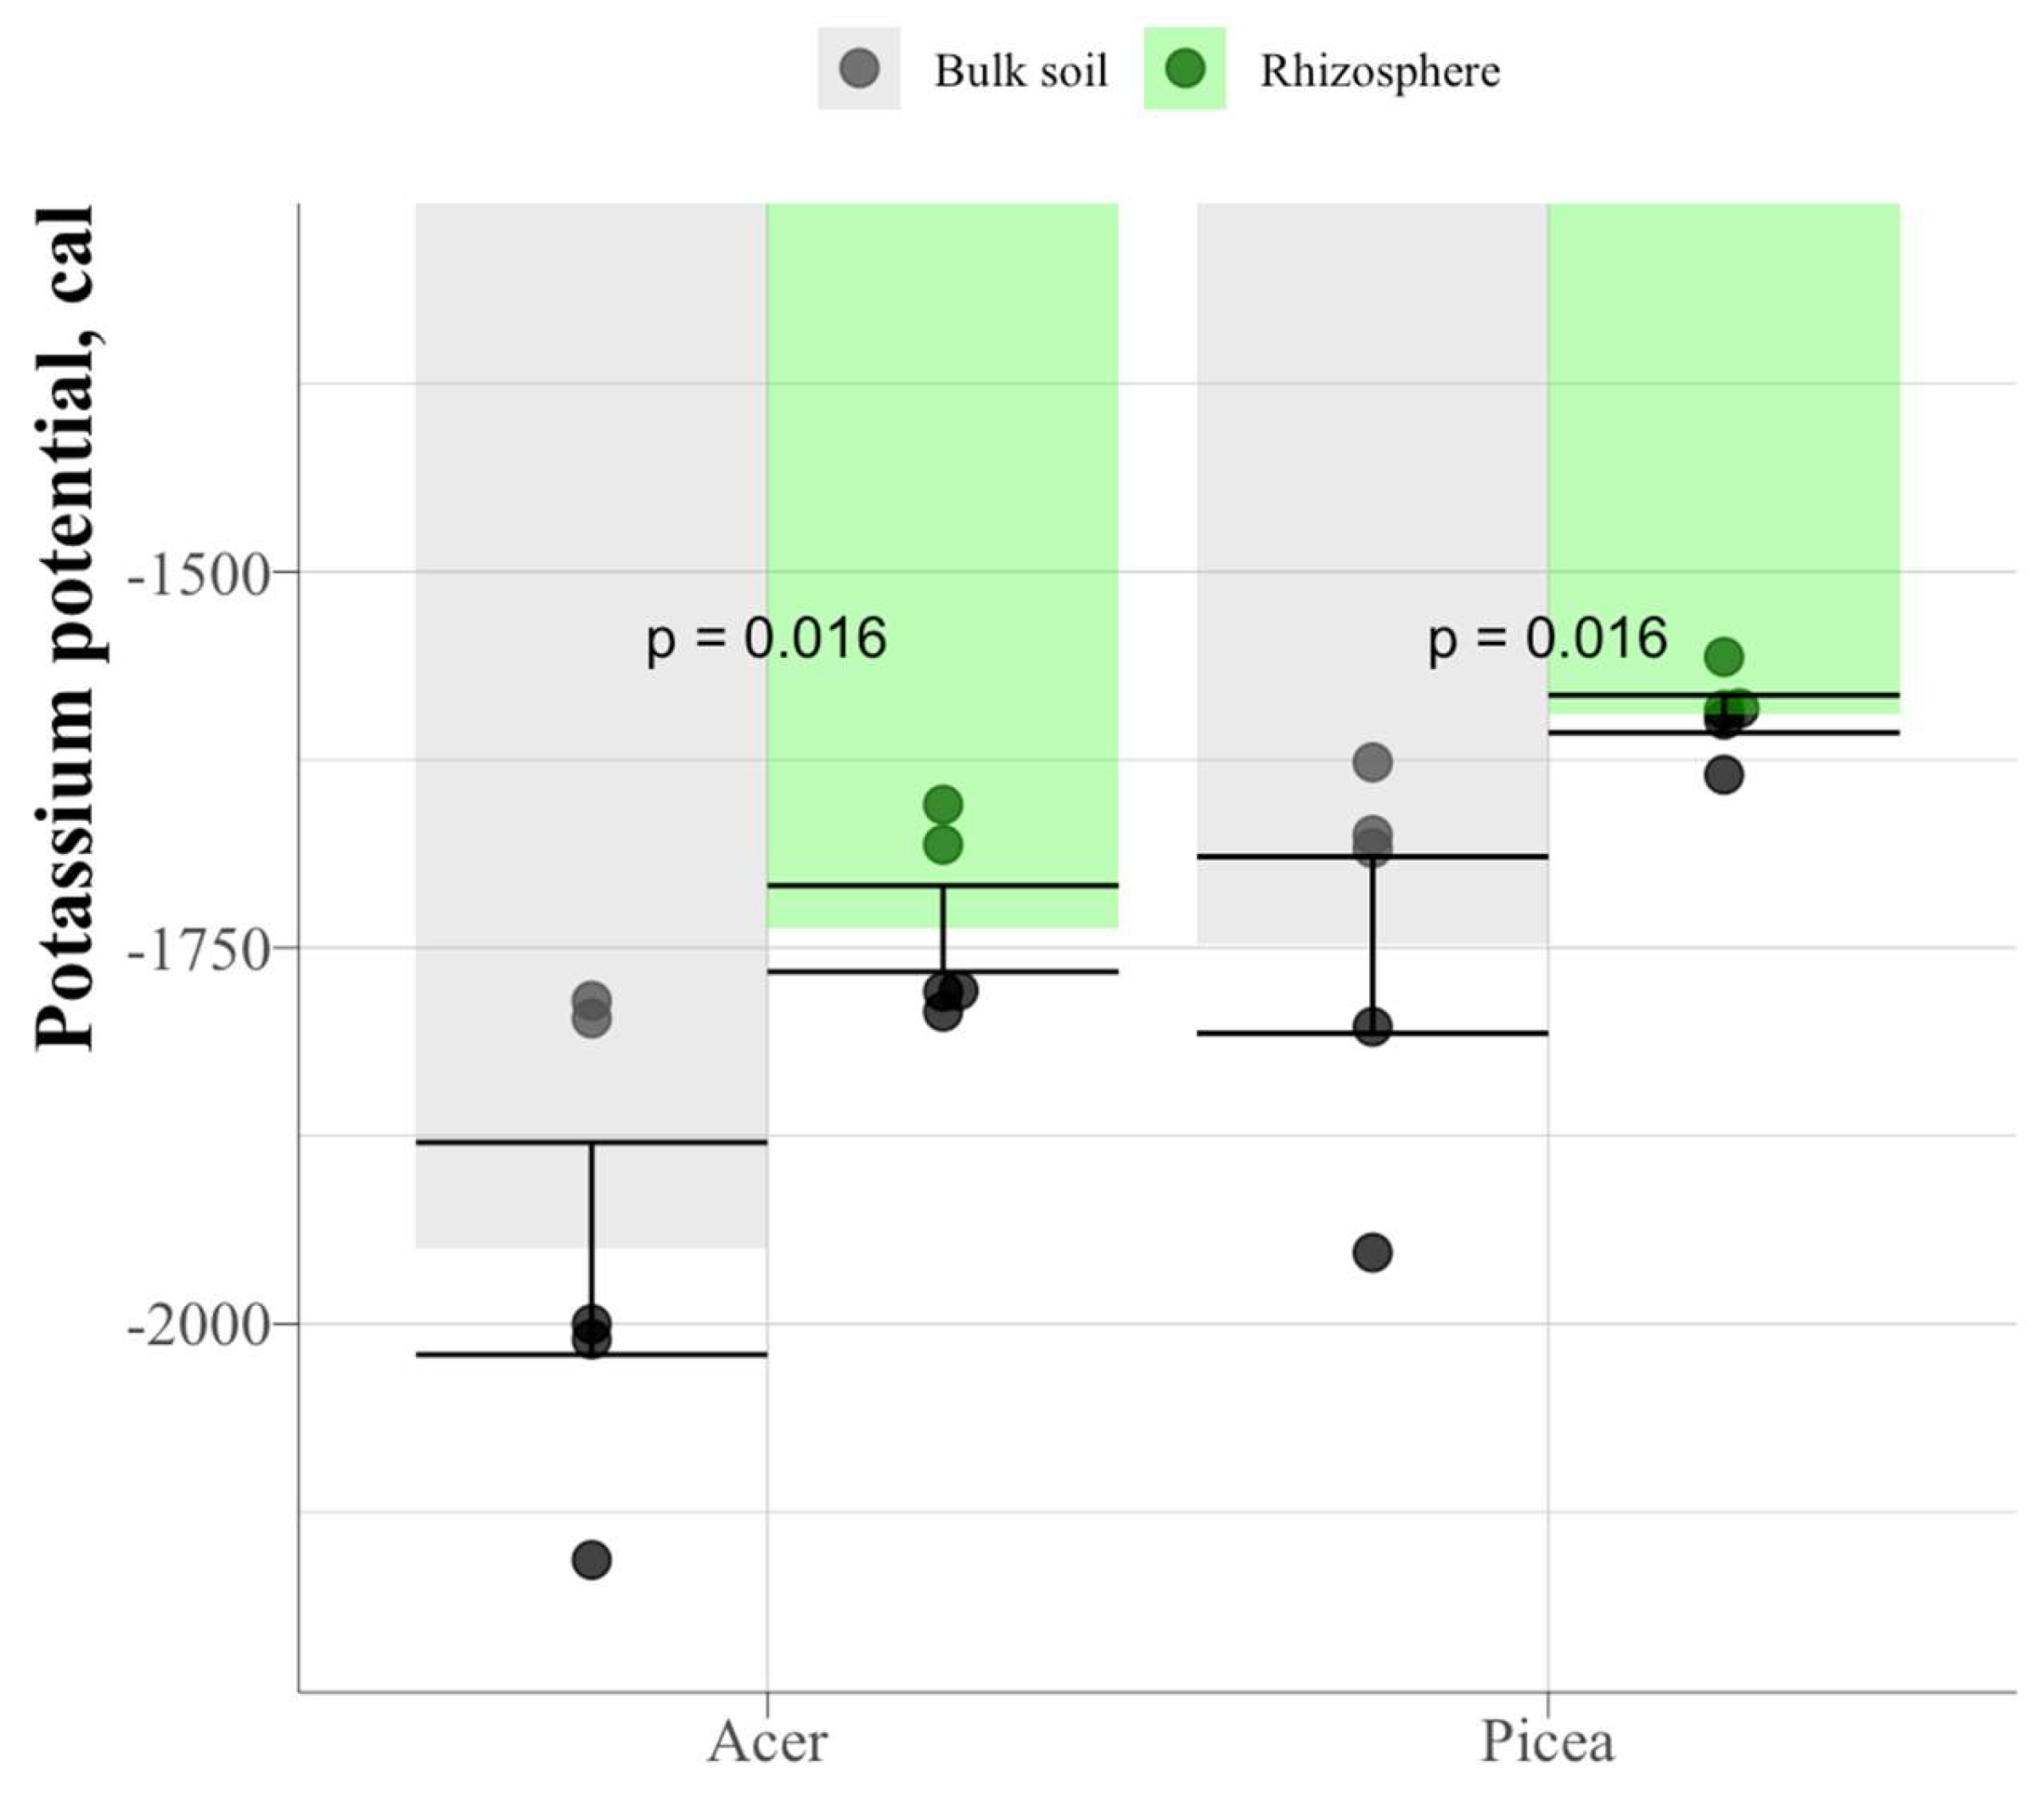
Table 1.
Chemical composition and thermodynamic characteristics of mineral phases in the clay fraction of podzolic soil and comparison with literature data [1,2,3,4,6,23,24,25,26,27,28] (ND – not determined).
| Mineral | Chemical formula | К | ΔG | ΔG theor. min. |
ΔG theor. max. |
К theor. min. | К theor.max. |
|---|---|---|---|---|---|---|---|
| Kaolinite | Al2Si2O5(OH)4 | 6.9 | -906.2 | -912.1 | -898.4 | 2.3 | 12.9 |
| Chlorite | (Mg,Fe)5(Al,Si)5O10(OH)8 | 61.3 | -2112.7 | -1974.0 | -1938.2 | 63.1 | 76.8 |
| Illite | (K0.71Ca0.01Na0.01)(Al1.86Mg0.15Fe0.04)(Si3.27Al0.73)O10(OH)2 | 13.3 | -1312.0 | -1313.6 | -1250.5 | 12.9 | 17.1 |
| Vermiculite | (Mg2.46Al0.3Fe0.22Ti0.021)2 (Mg0.38Ca0.03Na0.02)2 ((Si2.83Al1.17)O10)2 OH4 (H2O)3.4 |
33.8 | -1363.2 | -1298.0 | -1364.8 | 20.2 | 45.2 |
| Montmorillonite | ND | ND | ND | -1564.4 | -1225.2 | 0.3 | 2.5 |
| Soil chlorite | ND | ND | ND | -1842.7 | -1418.0 | 4.6 | 140.9 |
Table 2.
Saturation indices of mineral phases of the clay fraction in the rhizosphere of maple, spruce and the corresponding bulk soil (arithmetic mean ± standard deviation).
Table 2.
Saturation indices of mineral phases of the clay fraction in the rhizosphere of maple, spruce and the corresponding bulk soil (arithmetic mean ± standard deviation).
| Kaolinite | Illite | Vermiculite | Chlorite | |
|---|---|---|---|---|
| Rhizosphere (spruce) | -5.20 ±1.1 | -12.56 ± 1.6 | -25.28 ± 4.4 | -45.09 ± 8.1 |
| Bulk soil (spruce) | -4.92 ± 1.3 | -12.19 ± 1.8 | -25.07 ± 2.3 | -44.51 ± 3.9 |
| Rhizosphere (maple) | -3.80 ± 0.9 | -10.59 ± 1.3 | -22.52 ± 1.7 | -40.52 ± 3.1 |
| Bulk soil (maple) | -3.57 ±1.6 | -10.35 ± 2.2 | -22.4 ±2.5 | -40.03 ± 5.0 |
Table 3.
Carbon and nitrogen content in HA and minerals before and after HA treatment (average of 2 replicates).
Table 3.
Carbon and nitrogen content in HA and minerals before and after HA treatment (average of 2 replicates).
| Sample | С, % | N, % | C/N |
|---|---|---|---|
| Kaolinite | 0.12 | 0.09 | - |
| Muscovite | 0.18 | 0.05 | - |
| Biotite | 0.12 | 0.06 | - |
| Kaolinite+HA | 5.46 | 0.28 | 19.7 |
| Muscovite+HA | 4.56 | 0.32 | 14.3 |
| Biotite+HA | 4.39 | 0.38 | 11.6 |
| HA | 27.63 | 2.30 | 12.0 |
Disclaimer/Publisher’s Note: The statements, opinions and data contained in all publications are solely those of the individual author(s) and contributor(s) and not of MDPI and/or the editor(s). MDPI and/or the editor(s) disclaim responsibility for any injury to people or property resulting from any ideas, methods, instructions or products referred to in the content. |
© 2025 by the authors. Licensee MDPI, Basel, Switzerland. This article is an open access article distributed under the terms and conditions of the Creative Commons Attribution (CC BY) license (http://creativecommons.org/licenses/by/4.0/).
Copyright: This open access article is published under a Creative Commons CC BY 4.0 license, which permit the free download, distribution, and reuse, provided that the author and preprint are cited in any reuse.


