
Submitted:
28 January 2025
Posted:
29 January 2025
You are already at the latest version
Abstract
A tsunami disaster can cause significant economic losses for a tourism area like Batukaras Village, which is located on the southern coast of Java Island. This paper tries to elaborate on the calculation of economic losses in tourism areas due to the damage to buildings, loss of land production and loss of income based on high-resolution geospatial data. The data are derived from UAV photogrammetry surveys and high-resolution tsunami run-up models. The tsunami worst-case scenario run-off model provides an inundation area of 43 ha with 185 buildings and 24.4 ha of productive land. The estimated losses from the tsunami disaster amounted to IDR 208.79 billion, consisting of 49.63 billion from building damage, 6.73 billion from productive land and 152.43 billion from the tourism sector. This result shows that the tsunami disaster will severely affect tourism areas because the tourism sector contributes 73% of the total economic losses. Reduction of the economic loss, in addition to spatial planning near the coastline to reduce the number of impacted buildings and productive land, can be achieved by accelerating the recovery period so that economic activities after the tsunami disaster can be carried out immediately, including in the tourism sector.
Keywords:
run-up model
; economic loss
; Batukaras
; tsunami
; tourism
; recovery period
1. Introduction
The southern coast of Java, Indonesia, is one of the most tsunami-prone regions in the world due to its proximity to the highly active tectonic boundary between the Indo-Australian and Eurasian Plates. This boundary is part of the Pacific Ring of Fire, an area with frequent seismic activity that generates powerful underwater earthquakes capable of producing tsunamis. The main source of tsunami events in Indonesia is generally generated by shallow earthquakes in the subduction zone or plate boundary due to the release of large energy that causes vertical shifts on the seafloor [1]. The latest research conducted by [2,3] showed that there is a surface deformation of the multi-GNSS receiver data that has the potential to cause a megathrust earthquake that can cause a tsunami in the southern region of Java Island. Therefore, the southern region of Java Island is one of the regions in Indonesia that has the potential for earthquake and tsunami disasters.
The 2006 Pangandaran earthquake and tsunami serve as a stark reminder of this region's vulnerability. In that tragic event, the tsunami waves reached heights of up to seven meters, causing widespread devastation, including loss of life, destruction of property, and significant economic impact [4,5,6]. The geography of southern Java, characterized by steep coastal areas and narrow continental shelves, amplifies the impact of tsunamis [7]. The tsunami severely affected the tourism industry in areas like Pangandaran. Visitor numbers dropped drastically from about 900,000 annually to just over 250,000 immediately after the tsunami, furthermore it also caused extensive damage to buildings and infrastructure [8].
In addition to direct damage, tsunamis can have long-lasting economic consequences on local industries [9]. Coastal economies often rely heavily on tourism, fisheries, and agriculture, all of which can be severely affected by such natural disasters. The destruction of fishing boats, equipment, and marine habitats disrupts the livelihood of fishing communities, leading to loss of income and increased poverty. Similarly, the tourism industry may suffer from both the destruction of infrastructure and a decline in visitor numbers due to safety concerns. This was observed after the 2011 Tohoku tsunami in Japan, where the tourism sector faced significant challenges in recovery and the closure of Japanese ports following the 2011 tsunami had global repercussions, affecting industries reliant on Japanese exports such as the automotive and electronics sectors [10].
Tsunami run-up models are essential tools for predicting the extent of coastal flooding and the potential impact on coastal communities. These models simulate how far inland a tsunami wave will travel, known as the "run-up," by considering factors such as wave height, coastal topography, and bathymetry (the underwater depth of ocean floors). Accurate run-up models help in assessing the risk and planning effective mitigation strategies to protect lives and property [11]. The run-up can be simulated on a 3-D topographic model to have detailed information about the potential damage. A 3-D topographic model of the coastal area can be derived from integration of UAV Photogrammetry and Bathymetric Survey data [12]. 3D tsunami inundation mapping provides more spatially accurate information, providing a precise representation of how tsunami waves interact with coastal topography as well as with coastal buildings, so that damage estimates for affected buildings can also be calculated more precisely. In addition, by conducting 3D tsunami inundation mapping, office holders can make better decisions and planning in their areas in order to increase the resilience of infrastructure and the surrounding community to tsunami disasters.
Improving the ability to predict and mitigate tsunami disasters is very important to reduce the impact of future tsunamis. One way to achieve this is to map the potential area of a high-resolution 3-dimensional tsunami submersion. Unlike 2D models, 3D models can provide more accurate and realistic results to overcome the potential dangers of tsunami immersion. With 3D models, the main characteristics of the immersion process can be well described [13]. The 3D tsunami submersion potential map can also be useful in the selection of tsunami evacuation buildings, planning evacuation routes, and in planning mitigation measures to strengthen buildings to minimize potential human and economic losses [14].
In this research, the tsunami economic lost analysis will be applied for one tourism area in Southern Coast of West Java Province. The area known as Batukaras Village. The village is part of Pangandaran Regency, one of the top tourist destinations in West Java. Every year, the village attracts national and international tourists like to Batukaras beach, famous as a surfing destination [15]. According to data from Tourim Office of Pangandaran Regency, in 2023, the village attracted 475,988 national and international tourists, increased from 449,629 in the previous year. The village is located in a closed bay and facing the Indian Ocean, therefore Batukaras beach is popular among surfers. For thoser reason, tourism is the main economic pillar, alongside fisheries and agriculture [15].
2. Materials and Methods
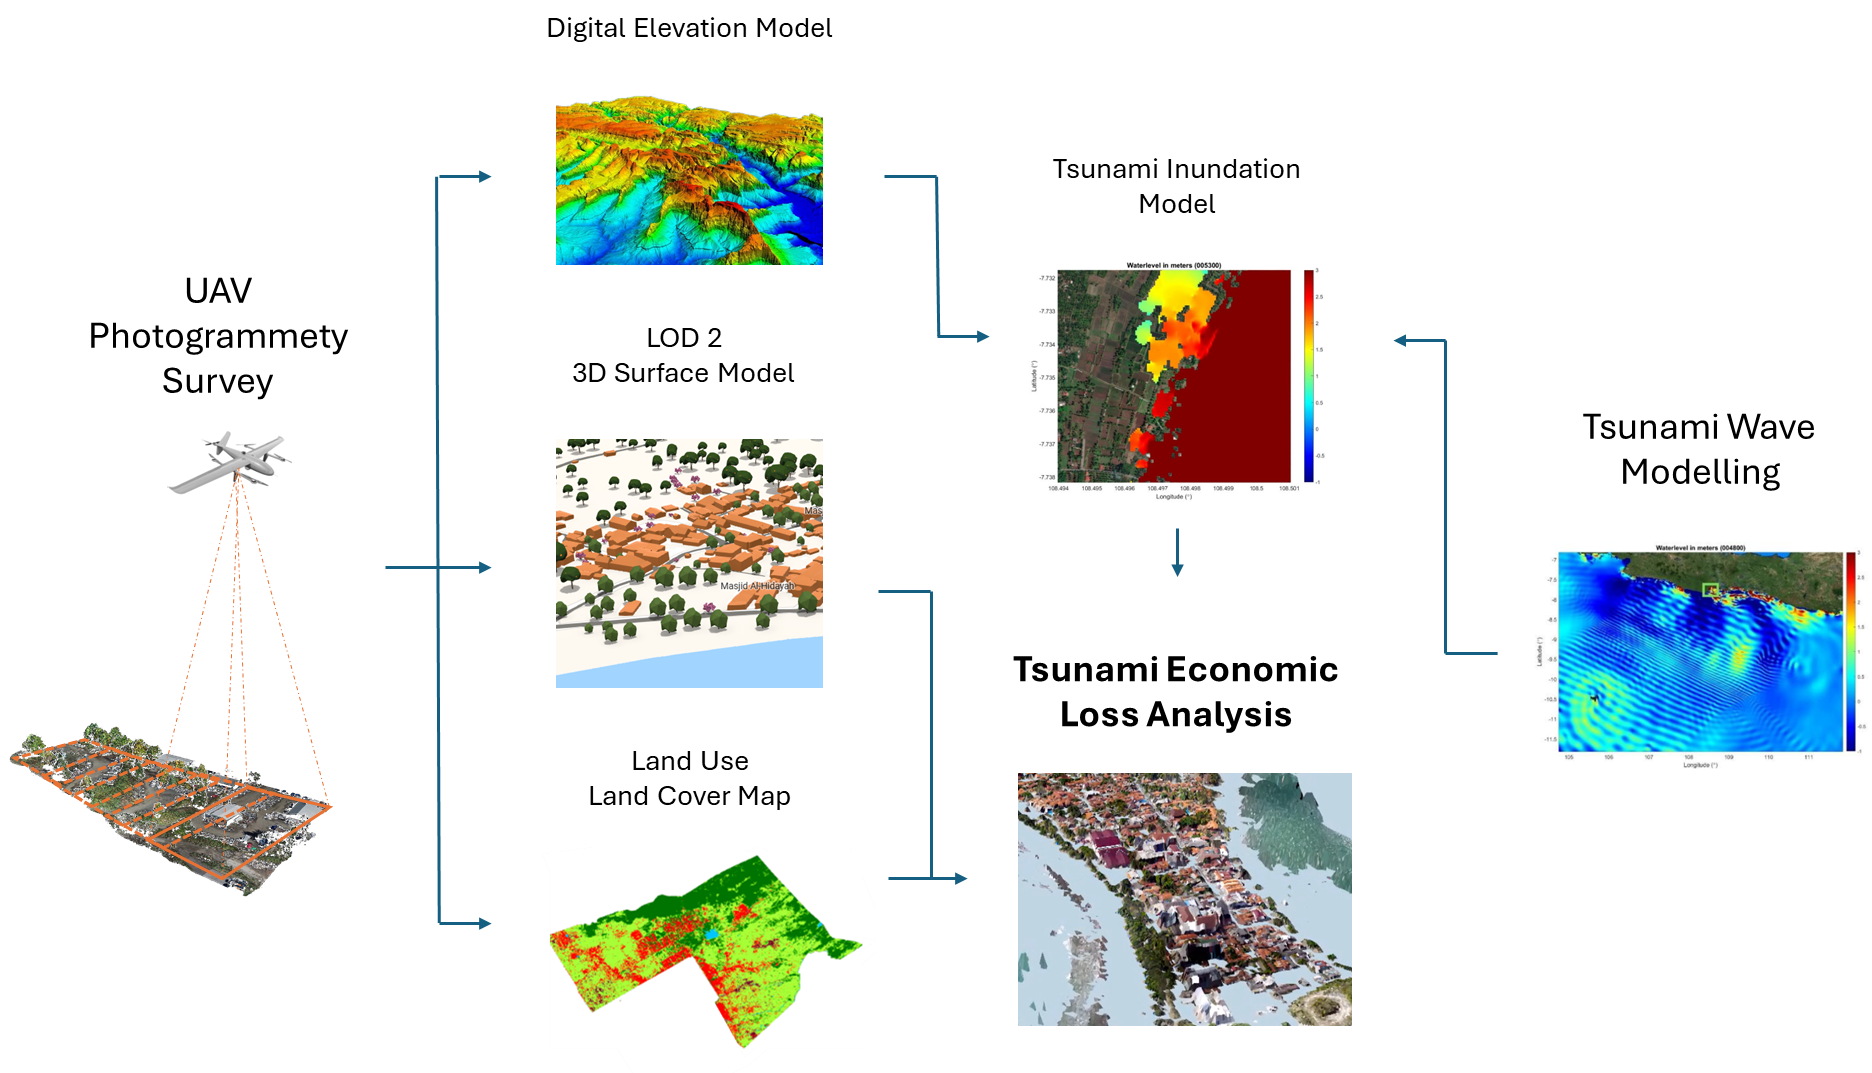
Tsunami economic loss analysis use geospatial data that mainly produced from UAV (Unmanned Aerial Vehicle) Photogrammetric Survey and Tsunami Wave Modelling (Figure 1). UAV Photogrammetric Survey was conducted on May 2023 and was intended to conduct 3-dimensional mapping with the level of detail of objects on the earth's surface up to LOD (Level of Details) 2. The mapping is carried out using UAVs that can take off and land vertically (VTOL – Vertical Take Off and Landing) with GNSS RTK positioning system [16]. Digital Elevation Model (DEM) and LOD-2 model of the Batukaras Village area is derived from aerial photographs produced at an altitude of 300 meters with a data resolution of 10-12 cm or with a point density of 100 ppm (points per m2). To improve the accuracy of the horizontal and vertical position of DEM and LOD-2, the aerial photos are georefenced using 22 Ground Control Points (GCP) and Independent Check Points (ICP).
Identification and mapping of buildings with LOD-2 detail provided from UAV aerial photo data processing and field surveys for sampling the use of the building. These buildings are then classified based on the type of building (referred to [17]) for vulnerability study of the building.
Land cover and land use map is derived from UAV aerial photo data, refer to SNI 7645-1:2014 concerning Land Cover Classification. To complement and assist in the interpretation of land cover from this UAV aerial photo, identification is assisted by existing land cover map from Indonesian Geospatial Agency or any other sources. The results of this land cover mapping will be verified through a field survey for accuracy test analysis.
Potential tsunami hazard related to tsunami wave height, time of arrival and inundation area is simulated using a hydrodynamic model. The simulation starts from the formation of the initial wave according to the worst possible scenario from the megathrust segments in the Indian Ocean, the spread of tsunami waves from their source to the southern coastal area of Java Island, to the run-up of the tsunami waves to the mainland in the Pangandaran coastal tourist area. The scenario of tsunami simulation was based on the worst scenario [18]. Modeling the formation of waves, the propagation of tsunami waves to coastal areas as well as the runoff from the coast to the mainland along with the speed of wave propagation are modeled using Delft3D software [19]. The tsunami wave run-up simulation on the coastal area uses the DEM from UAV Photogrammetry.
The economic loss (in IDR or Indonesian Rupiah) is calculated from three factors (Figure 2):
- Buildings, estimated from the damage ratio and the value of the buildings.
- Landuse/land cover, estimated from the loss of crop products for a period of one year
- Tourism, estimated from the loss of visitors who do the tourism activities (surfing, eating, buying souvenirs), buy the entrance tickets, and stay in hotels for a period of one year
One year is assumed as the recovery period for crop products and tourism activities following the tsunami event.
2.1. Buildings
Analysis of the potential damage to buildings and land cover is conducted in tsunami inundation areas based on the height of the tsunami waves. The calculation of potential economic losses due to building damage is analysed using the type of building and the tsunami hazard (height of the tsunami wave) that inundates the building. The buildings are classified into 3 types of buildings: (1) Type 1 Timber/Traditional Block (1-storey), (2) Type 2 Traditional Brick with RC (1-storey), and (3) Type 3 RC Column with brick infill (2+ storeys) based on [17]. Once the inundation height at each building is identified, the damage ratio of the building is estimated from the vulnerability curve that is modified and extrapolated from [17] (Figure 3). The economic loss of each building is estimated from the damage ratio multiplied by the area of the building and the value per unit area (Equation 1). The value is analysed from interviews with local residents and the government.
Where = economic loss in buildings (in IDR)
= number of inundated buildings type (where is 1, 2 or 3)
= area of the inundated building number (in m2)
= value of building type (IDR per m2)
= damage ratio of building type number (in %)
2.2. Landuse/Land Cover
The potential loss of crop products from certain land use/land cover after a tsunami event is estimated from the crop production per year per hectare. The inundated land use/land cover area (in hectares) is multiplied by the crop production (in kg per year per hectare) and multiplied by the price of the crop production per kg (Equation 2). Five types of landuse/land cover are inundated from the tsunami modelling result: (1) Coconut Plantation, (2) Paddy Field, (3) Fishpond, (4) Shrimp Pond, and (5) Mixed Plantation.
where = economic loss in landuse/land cover (in IDR)
= number of inundated landuse/land cover type (where is 1-5)
= area of the inundated landuse/land cover number (in m2)
= price of crop production of landuse/land cover type (IDR per kg)
= Crop production in landuse/land cover type number (in kg/ha/yr)
2.3. Tourism
The economic loss in tourism is estimated from the loss of visitors who spend their money (on food, activities, and souvenirs), buy entrance tickets, and stay in hotels for a period of one year (Equation 3). The estimated number of visitors is assumed to be equal to the number of visitors in year 2023. Characteristics of domestic and international visitors are identified from the interviews to estimate the average tourist spending and average period of stay for both types of visitors.
where
= economic loss in tourism (in IDR)
= average spend of money for food for visitor type (domestic or international)
= the number of visitor type
= average length of stay for visitor type (days)
= average spend of money for activities for visitor type (IDR)
= ratio of the visitor who spends money for activities for visitor type (%)
= average spend of money for souvenirs for visitor type (IDR)
= average ratio of the visitor who spends money for souvenirs for visitor type (%)
= entrance ticket price (IDR)
= the number of hotels in the inundation area
= the number of rooms in hotel
= average room rate of weekdays in hotel (IDR)
= occupancy rate of weekdays in hotel (%)
= the number of weekday day in a year
= average room rate of weekend in hotel (IDR)
= occupancy rate of weekend in hotel (%)
= the number of weekend day in a year
The total tsunami economic loss (EL) can be calculated as the sum of economic loss in buildings, landuses and tourism sectors (Equation 4)
3. Results
The LOD2 Model resulted from the UAV photogrammetry survey is presented in Figure 4. The model is capable of displaying individual buildings along with the height of the buildings. The buildings from the LOD-2 detail are classified based on [17] and presented in Figure 5. Another derivation product of UAV photogrammetry mapping is the land use/land cover map presented in Figure 6. Figure 7 shows the tsunami inundation area as the result of the tsunami run-up model. The impacted buildings and landuses/land covers are shown in Table 1 and Table 2.
Estimating tsunami economic loss as described in Equation 1-4 requires some data and assumptions. The economic loss in buildings ( in Equation 1) requires the number of inundated buildings, as well as their area (), type, damage ratio () and value (). The number, type, and area of the buildings can be derived from the LoD2 model (Figure 4) as presented in Table 1, while the damage ratio is estimated based on [17] and the inundation height of the buildings. The value of the building per m2 () is analysed from the interviews and it is determined as IDR 3 million/m2 for 1-storey building and IDR 6 million/m2 for 2-storey building. Table 1 presents the estimated economic loss of buildings.
Related to economic loss in productive land ( in Equation 2), five types of land uses were identified, as can be shown in Table 2. The economic value/price of crop product () and the production per hectare () for each landuse was analysed from the interviews with local farmers and government.
The economic loss from the tourism sector is estimated from the loss of visitors that will impact the income from tickets, hotels and other spending (Equation 3). Table 3 presents the number of visitors to Batukaras Village from 2019 to 2023. The loss from ticket income can be calculated directly from the ticket price per person () as IDR 15,000. The number of visitors in 2023 is assumed to be the number of visitors that were lost during the recovery period in this analysis (.
Table 4 presents some assumptions for tourist spending in food (), activity (), and souvenir () as well as the estimated average length of stay (). Using part of Equation 3, the estimation of economic loss from tourist spending is presented in Table 5. In this estimation, the value of the ratio of the visitor who spends money on activities for domestic and international visitors () is 0.5, which means only half of the domestic and international visitors who spend money on activities (rent a bike or a surfing board). Another assumption is for ratio of the visitor who spends money for souvenirs for domestic and international visitor () which is determined as 0.5. Tourists are assumed to spend money on food and activity everyday during their stay in Batukaras Village, but only once for the souvenir.
Table 6 presents the estimation of annual income of all hotels that are located in inundation area based on the number of room (), weekday rate (), weekend rate (). In this estimation, based on interview, the occupation rate during weekday () is determined as 0.5 and occupation rate during weekend () is 1. The number of weekday day () in a year is 260, while the numer of weekend day () in a year is 104.
4. Discussion
In total, 3276 buildings are identified from the LOD-2 model, where most of the buildings (1874) are in Type-2 Class (Traditional Brick with RC Columns 1 Storey) and only 24 buildings classified as Type-3 (RC Columns with Brick Infill 2 Storey or more). The rest (1378) are classified as Timber/Traditional Brick buildings, whereas the landuse/land cover map shows most of the area in the Batukaras Village (90.9%) is covered by vegetation (forest and plantations). Only 2.1% of the area is used for residential purposes, and 5% is used for paddy fields.
The tsunami run-up impacted an area of 43.311 ha, with 165 buildings (Table 1), 23 of which are hotels/guest houses. This inundation area also affected five economically productive land uses, with a total area of 24.46 ha (Table 2).
Timber/traditional brick class of buildings dominate the buildings in inundation area, as it can be seen in Table 1, with about 64% or 105 buildings, which potentially contributes about IDR 26 billion of economic loss. In total the economic loss from buildings is about IDR 49.6 billion.
The impacted/inundated area () is calculated from the overlay of the inundation map and landuse map. It can be seen that most of the run-up covered paddy field area; however, the most economic loss is coming from the mixed plantation land with the value of IDR 5,9 billion, which contributes about 87.7% from the economic loss from productive lands.
Table 3 presents the potential economic loss from entrance ticket to the beach. In 2020 and 2021, the number of visitors dropped, particularly the international ones, due to the Covid-19 pandemic. However, since after, the number of visitors were increased. About IDR 7 billion is estimated to be lost from the entrance tickets income due to the tsunami event. Another potential economic loss may come from the tourist spending during their visits. Table 5 presents the estimation of this loss and it gives a loss of about IDR 132 billion. Using part of Equation 3, the annual total income for hotel’s room can be estimated as IDR 13.27 billion (Table 6) and this is assumed to be the potential economic loss during a year recovery period of tsunami disaster.
The combination of potential economic loss from tourism in tickets, hotels, and other spending gives the total value of IDR 152.43 billion (Table 3 + Table 5 + Table 6), where the tourist spending contributes most with IDR 132.02 billion or about 86.61%. Tourist spending on food is the highest among the others, with a value of IDR 95.97 billion or about 62.96% of economic loss from the tourism sector. It is understandable since all visitors need food every day as long as they stay in the area.
In total, the potential economic loss due to tsunami disaster is IDR 208.79 billion; the detailed summary is presented in Table 7. The table shows that IDR 152.43 billion, or about 73% of the total potential economic loss, comes from tourism factors (Figure 8). Therefore, it is clear that tsunami disasters will severely affect tourism areas.
It stated before that all calculations of estimated economic loss in Equation 1 – Equation 4 are assumed for one year recovery period. When the calculation uses a shorter recovery period, it will reduce the estimated economic loss, particularly in land use and tourism factors. Simulation of different recovery periods is carried out and the result is presented in Figure 9. It compares estimated economic loss using various recovery periods (0.5, 1, 1.5, and 2 years) from all three sectors. From the simulation, a half-year difference in the recovery period will give a difference of IDR 80 billion to the total economic loss. By reducing the recovery period to 6 months, the savings of IDR 80 billion can be used to compensate and rebuild the damage in buildings and productive lands as well as to reactivate the tourism and public facilities and infrastructure.
The other strategy to reduce the economic loss is by applying spatial planning to relocate some buildings and productive lands from the inundation area to the safe area. However, this strategy is more challenging and may produce more problems. To avoid more problems, several factors should be considered when a spatial planning strategy wants to be applied, including a multi-faceted approach, strengthening institutional frameworks, improving data collection and sharing, enhancing community engagement, and securing adequate funding [20].
5. Conclusions
Estimation of potential tsunami disaster economic loss in a tourism area on the southern coast of Java Island has been successfully carried out. The estimation is based on geospatial data derived from a UAV photogrammetry survey and a tsunami run-up model. A LoD2 3D model, Digital Elevation Model, and Landuse/Land Cover Map of Batukaras Village were derived from UAV aerial photos and later used in the tsunami wave run-up model. The economic loss is calculated from three factors: (1) buildings, estimated from the damage ratio and the value of the buildings; (2) landuse/land cover, estimated from the loss of crop products for a period of one year, and (3) tourism, estimated from the loss of visitors who do the tourism activities (surfing, eating, buying souvenirs), buy the entrance tickets, and stay in hotels for a period of one year. One year is assumed as the recovery period for crop products and tourism activities following the tsunami event. The total potential economic loss due to the tsunami disaster is IDR 208.79 billion, where 73 per cent of the loss comes from tourism factors. One of the efforts to reduce this economic loss is to accelerate the recovery period so that economic activities after the tsunami disaster can be carried out immediately, including in the tourism sector. The 6-month recovery period reduction will save about IDR 80 billion in economic loss. Another option to implement a spatial planning strategy is more complex to apply since it should consider a multi-faceted approach, strengthening institutional frameworks, improving data collection and sharing, enhancing community engagement, and securing adequate funding.
Author Contributions
WW: writing – original draft, methodology, investigation, conceptualization, supervision, funding acquisition. AN: writing – review & editing, data curation, formal analysis, visualization. MWAG: writing - review & editing, data curation, supervision, validation. SKP: data curation, formal analysis, visualization. WIR: data curation, formal analysis, visualization. TV: data curation, formal analysis, visualization. KAG: data curation, formal analysis, visualization. MBA: data curation, formal analysis, visualization. IH: writing – review & editing, supervision, validation. DS: writing - review & editing, methodology, supervision. IM: writing - review & editing, supervision. IEM: writing - review & editing, methodology, supervision. AKL: writing - review & editing, validation, visualization. All authors have read and agreed to the published version of the manuscript.
Funding
WW is financially supported by Penelitian Kolaboratif (2024) (Letter Nr. 57B/IT1.C01/SK-TA/2024) managed by the Faculty of Earth Sciences and Technology, Institut Teknologi Bandung (ITB).
Data Availability Statement
The bathymetry data was obtained from BATNAS (National Bathymetry) provided by the Indonesian Geospatial Information Agency (BIG) at https://sibatnas.big.go.id/. The earthquake generation parameter data were obtained from the National Centre for Earthquake Studies (PuSGEN) in 2017 from http://puskim.pu.go.id/wp-content/uploads/2018/02/BUKU-PETA-GEMPA-2017.pdf and the United States Geological Survey (USGS) https://earthquake.usgs.gov/earthquakes/search/.
Acknowledgments
We acknowledge the support of the Faculty of Earth Sciences and Technology, Insitut Teknologi Bandung, in the financial and administrative aspects of the research. We also would like to acknowledge the local government of Batukaras Village, Pangandaran Regency, Indonesia, for their support during the data acquisition.
Conflicts of Interest
The authors declare that they have no known competing financial interests or personal relationships that could have appeared to influence the work reported in this paper.
References
- Latief, H., Puspito, N. T., and Imamura, F., Tsunami Catalog and Zones in Indonesia, Journal of Natural Disaster Science, 2000, Vol. 22 (1), 25-43. [CrossRef]
- Widiyantoro, S., Gunawan, E., Muhari, A., & Rawlinson, N., Implications for megathrust earthquakes and tsunamis from seismic gaps south of Java Indonesia. Nature, 2020, 10(15274). https://www.nature.com/articles/s41598-020-72142-z.
- Hanifa, N. R., Sagiya, T., Kimata, F., Efendi, J., Abidin, H. Z., & Meilano, I., Interplate coupling model off the southwestern coast of Java, Indonesia, based on continuous GPS data in 2008-2010. Earth and Planetary Science Letters, 2014, 401, 159–171. [CrossRef]
- Lavigne, F., Gomez, C., Giffo, M., Wassmer, P., Hoebreck, C., Mardiatno, D., Prioyono, J., & Paris, R., Field observations of the 17 July 2006 Tsunami in Java. Natural Hazards and Earth System Sciences, 2007, Vol. 7, Issue 1, 177-183. [CrossRef]
- Mori, J., Mooney, W. D., Afnimar, Kurniawan, S., Anaya, A. I., & Widiyantoro, S., The 17 July 2006 Tsunami Earthquake in West Java, Indonesia, Seismological Research Letters, 2007, 78 (2): 201–207. [CrossRef]
- Fritz, H. M., Kongko, W., Moore, A., McAdoo, B., Goff, J., Harbitz, C., Uslu, B., Kalligeris, N., Suteja, D., Kalsum, K., Titov, V., & Gusman, A., Extreme runup from the 17 July 2006 Java tsunami, Geophysical Research Letters, 2007, Vol. 34, Issue 12, http://dx.doi.org/10.1029/2007GL029404.
- Reid, J. A., & Mooney, W. D., Tsunami Occurrence 1900-2020: A Global Review, with Examples from Indonesia, Pure and Applied Geophysics, 2023, 180, 1549–1571. [CrossRef]
- Nijman, V., Tourism Developments Increase Tsunami Disaster Risk in Pangandaran, West Java, Indonesia. Int J Disaster Risk Sci, 2021, 12, 764–769. [CrossRef]
- Heger, M. P., & Neumayer, E., The impact of the Indian Ocean tsunami on Aceh’s long-term economic growth, Journal of Development Economics, 2019, Vol. 141. [CrossRef]
- Fuji, K., Suppasri, A., Kwanchai, P., Lahcene, E., & Imamura, F., Assessing future tsunami hazards from Japan trench coupling with sea level rise impact on economic risks using an input-output table, International Journal of Disaster Risk Reduction, 2024, Vol. 104. [CrossRef]
- Aniel-Quiroga, I, Quetzalcoatl, O., Gonzalez, M., & Guillou, L., Tsunami run-up estimation based on a hybrid numerical flume and a parameterization of real topobathymetric profiles, Natural Hazards and Earth System Sciences, 2018, Vol. 18 (5). [CrossRef]
- Windupranata, W., Aziz, A. A., Suwardhi, D., & Nusantara, C. A. D. S., The Integration of Bathymetric and UAV Photogrammetry for Pangandaran Digital Elevation Model. 2019 IEEE Asia-Pacific Conference on Geoscience, Electronics and Remote Sensing Technology (AGERS), 2019, 72–78. [CrossRef]
- Rong, Y., Zhang, T., Zheng, Y., Hu, C., Peng, L., & Feng, P. Three-dimensional urban flood inundation simulation based on digital aerial photogrammetry. Journal of Hydrology, 2020, 584, 124308. [CrossRef]
- Baba, T., Takahashi, N., Kaneda, Y., Inazawa, Y., & Kikkojin, M., Tsunami inundation modeling of the 2011 Tohoku earthquake using three-dimensional building data for Sendai, Miyagi prefecture, Japan. Advances in Natural and Technological Hazards Research, 2014, 35, 89–98. [CrossRef]
- Hafizh, F. R., Marsekal, B.N., Nusantara, C.A.D.S, & Windupranata, W., Mapping of Tsunami Evacuation Routes and Shelters in Batukaras Village, Pangandaran Regency, Indonesia, IOP Conference Series Earth and Environmental Science, 2023, 1245(1):012044. http://dx.doi.org/10.1088/1755-1315/1245/1/012044.
- Tal, D., & Altschuld, J., Drone Technology in Architecture, Engineering and Construction: A Strategic Guide to Unmanned Aerial Vehicle Operation and Implementation, Wiley, 2021, pp. 117-146, ISBN: 978-1-119-54588-0.
- Reese, S., Cousins, W. J., Power, W. L., Palmer, N. G., Tejakusuma, I. G., & Nugrahadi, S.: Tsunami vulnerability of buildings and people in South Java – field observations after the July 2006 Java tsunami, Nat. Hazards Earth Syst. Sci., 2007, 7, 573–589. [CrossRef]
- Windupranata, W., Hanifa, N. R., Nusantara, C. A. D. S., Aristawati, G., & Arifianto, M. R., Analysis of tsunami hazard in the Southern Coast of West Java Province – Indonesia, IOP Conference Series: Earth and Environmental Science, 2020, 618(1), 0–15. [CrossRef]
- Deltares, Delft3D Flow User Manual, Version 4.05 Revision 79891, Deltares, 2024, 747p, https://content.oss.deltares.nl/delft3d4/Delft3D-FLOW_User_Manual.pdf.
- Wijaya, N., Bisri, M.B.F., Aritenang, A.F., & Mariany, A., Spatial Planning, Disaster Risk Reduction, and Climate Change Adaptation Integration in Indonesia: Progress, Challenges, and Approach. In Disaster Risk Reduction in Indonesia, Djalante, R., Garschagen, M., Thomalla, F., Shaw, R. Eds.; Springer, 2017, pp 235–252. [CrossRef]
Figure 1.
Methodology Flowchart.

Figure 2.
Tsunami economic loss estimation methodology flow charts.
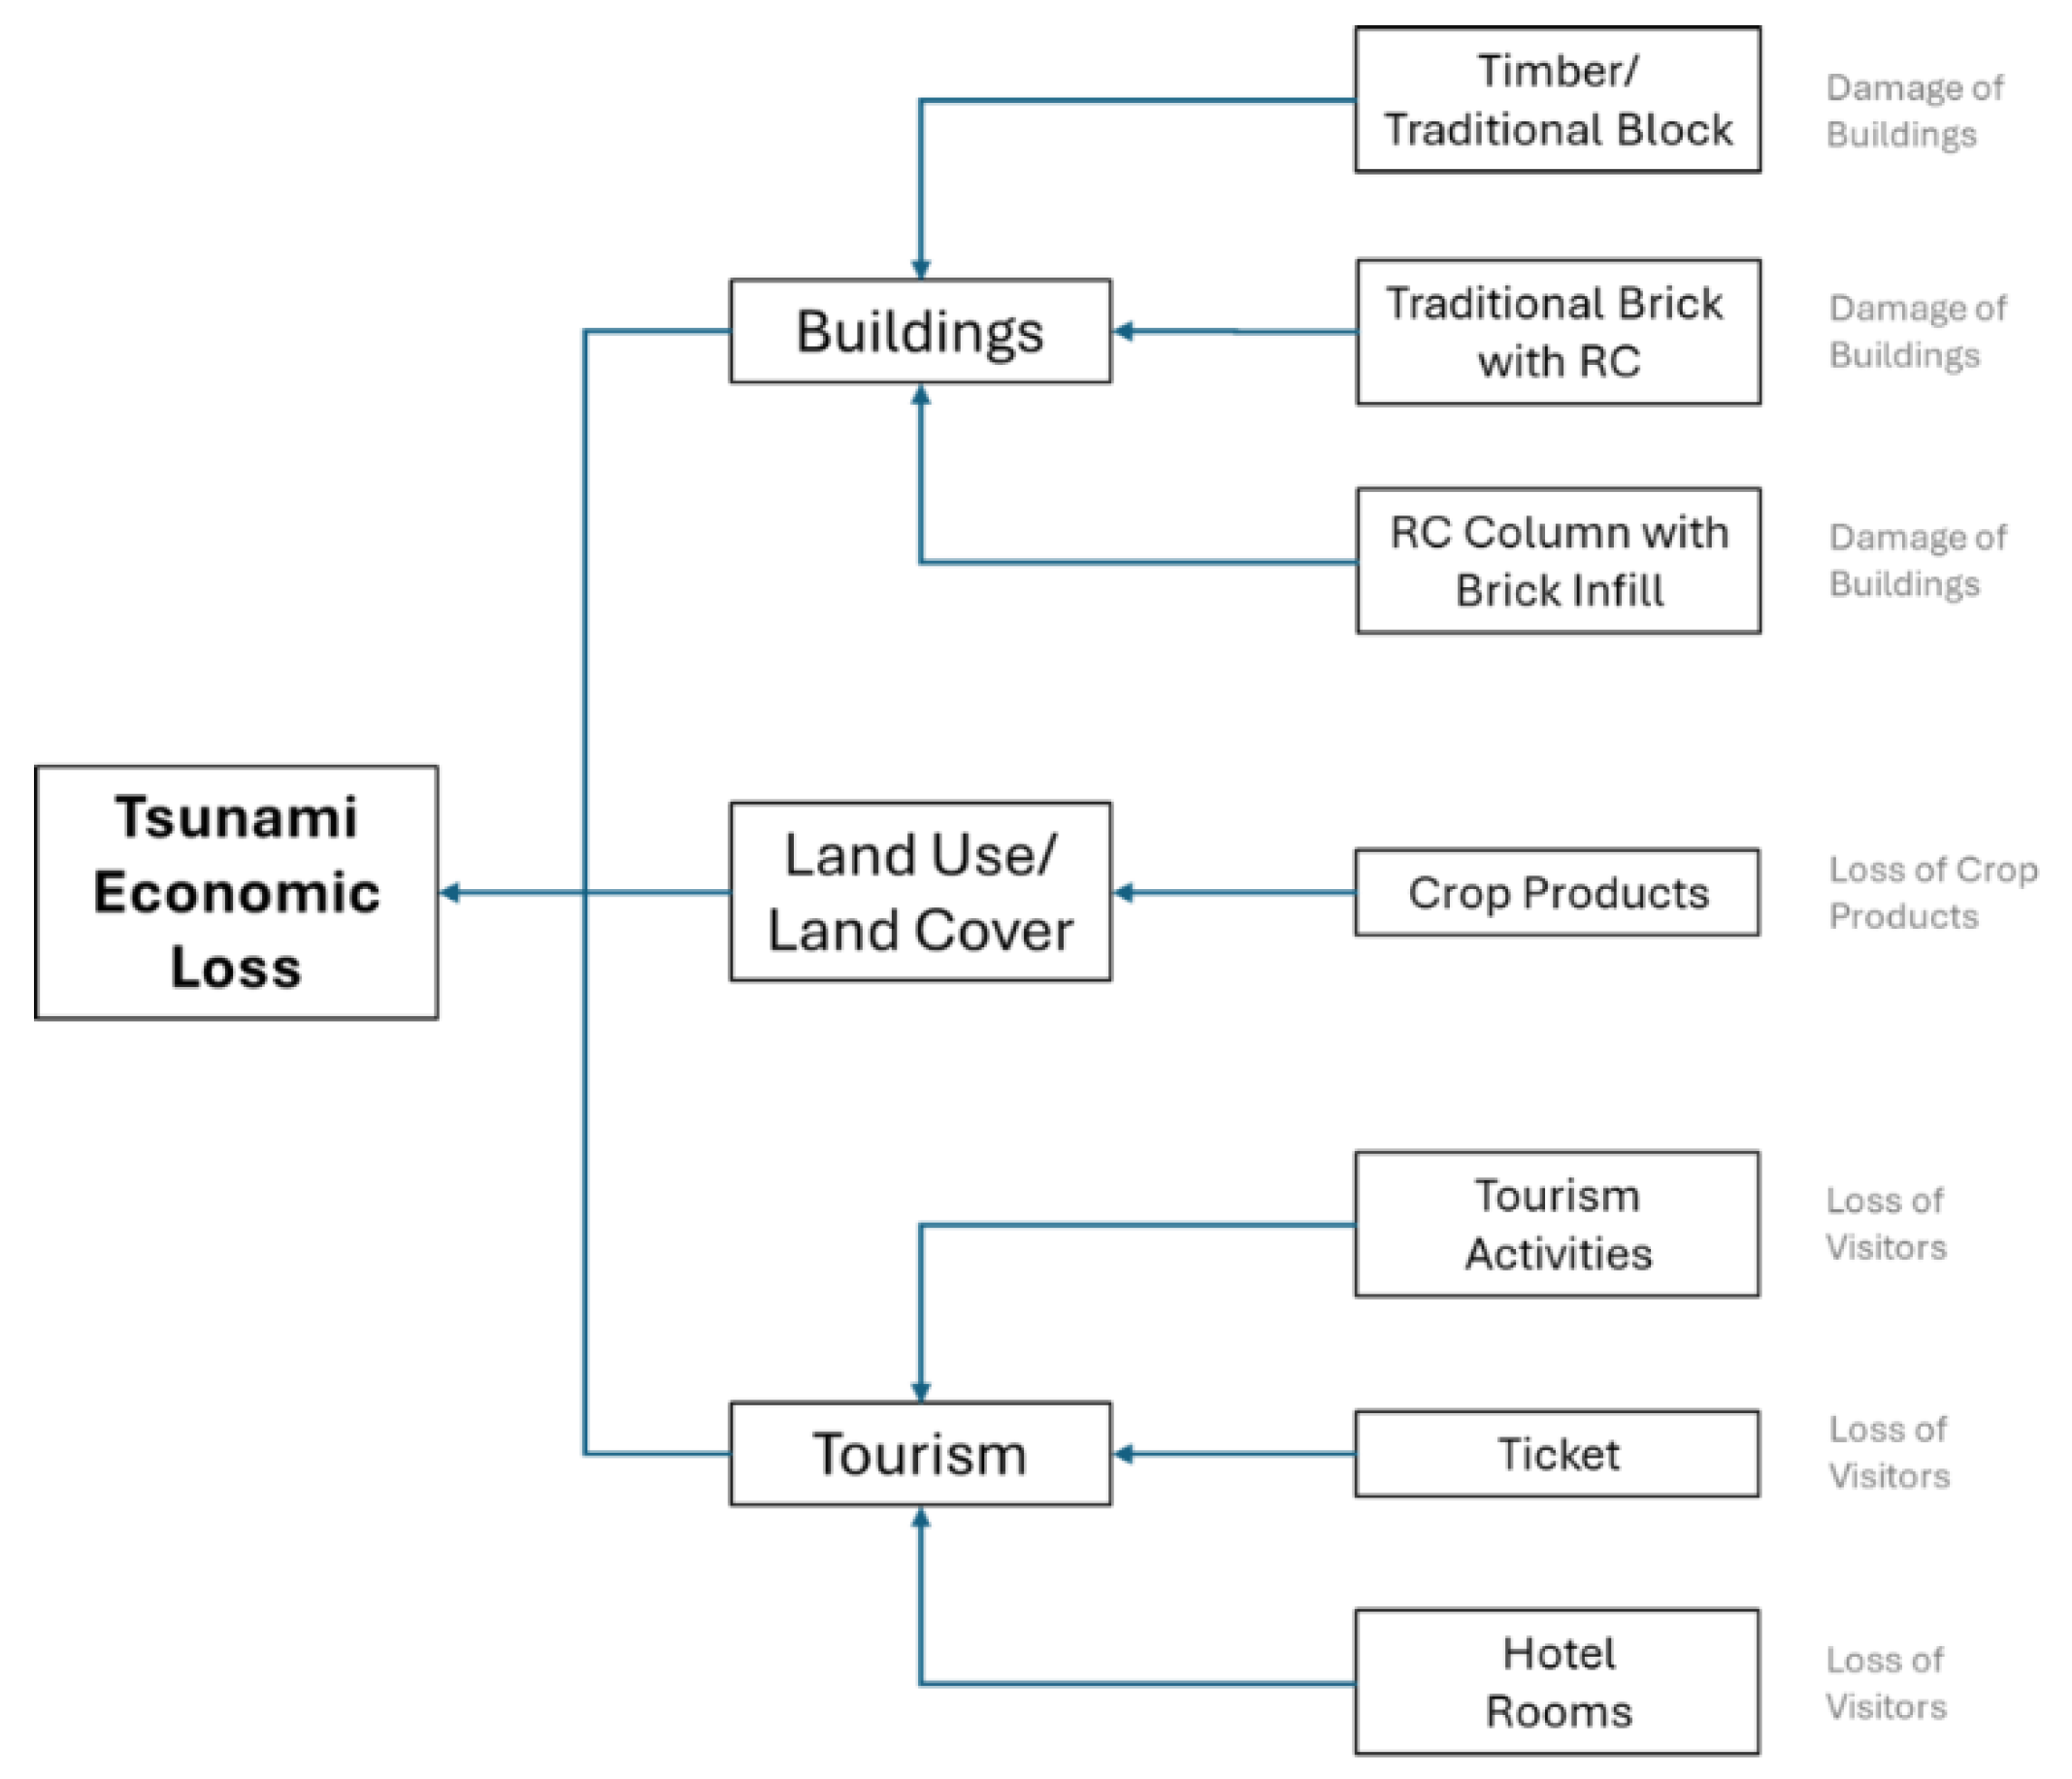
Figure 3.
Building vulnerability curve (modified from [17]).
Figure 3.
Building vulnerability curve (modified from [17]).
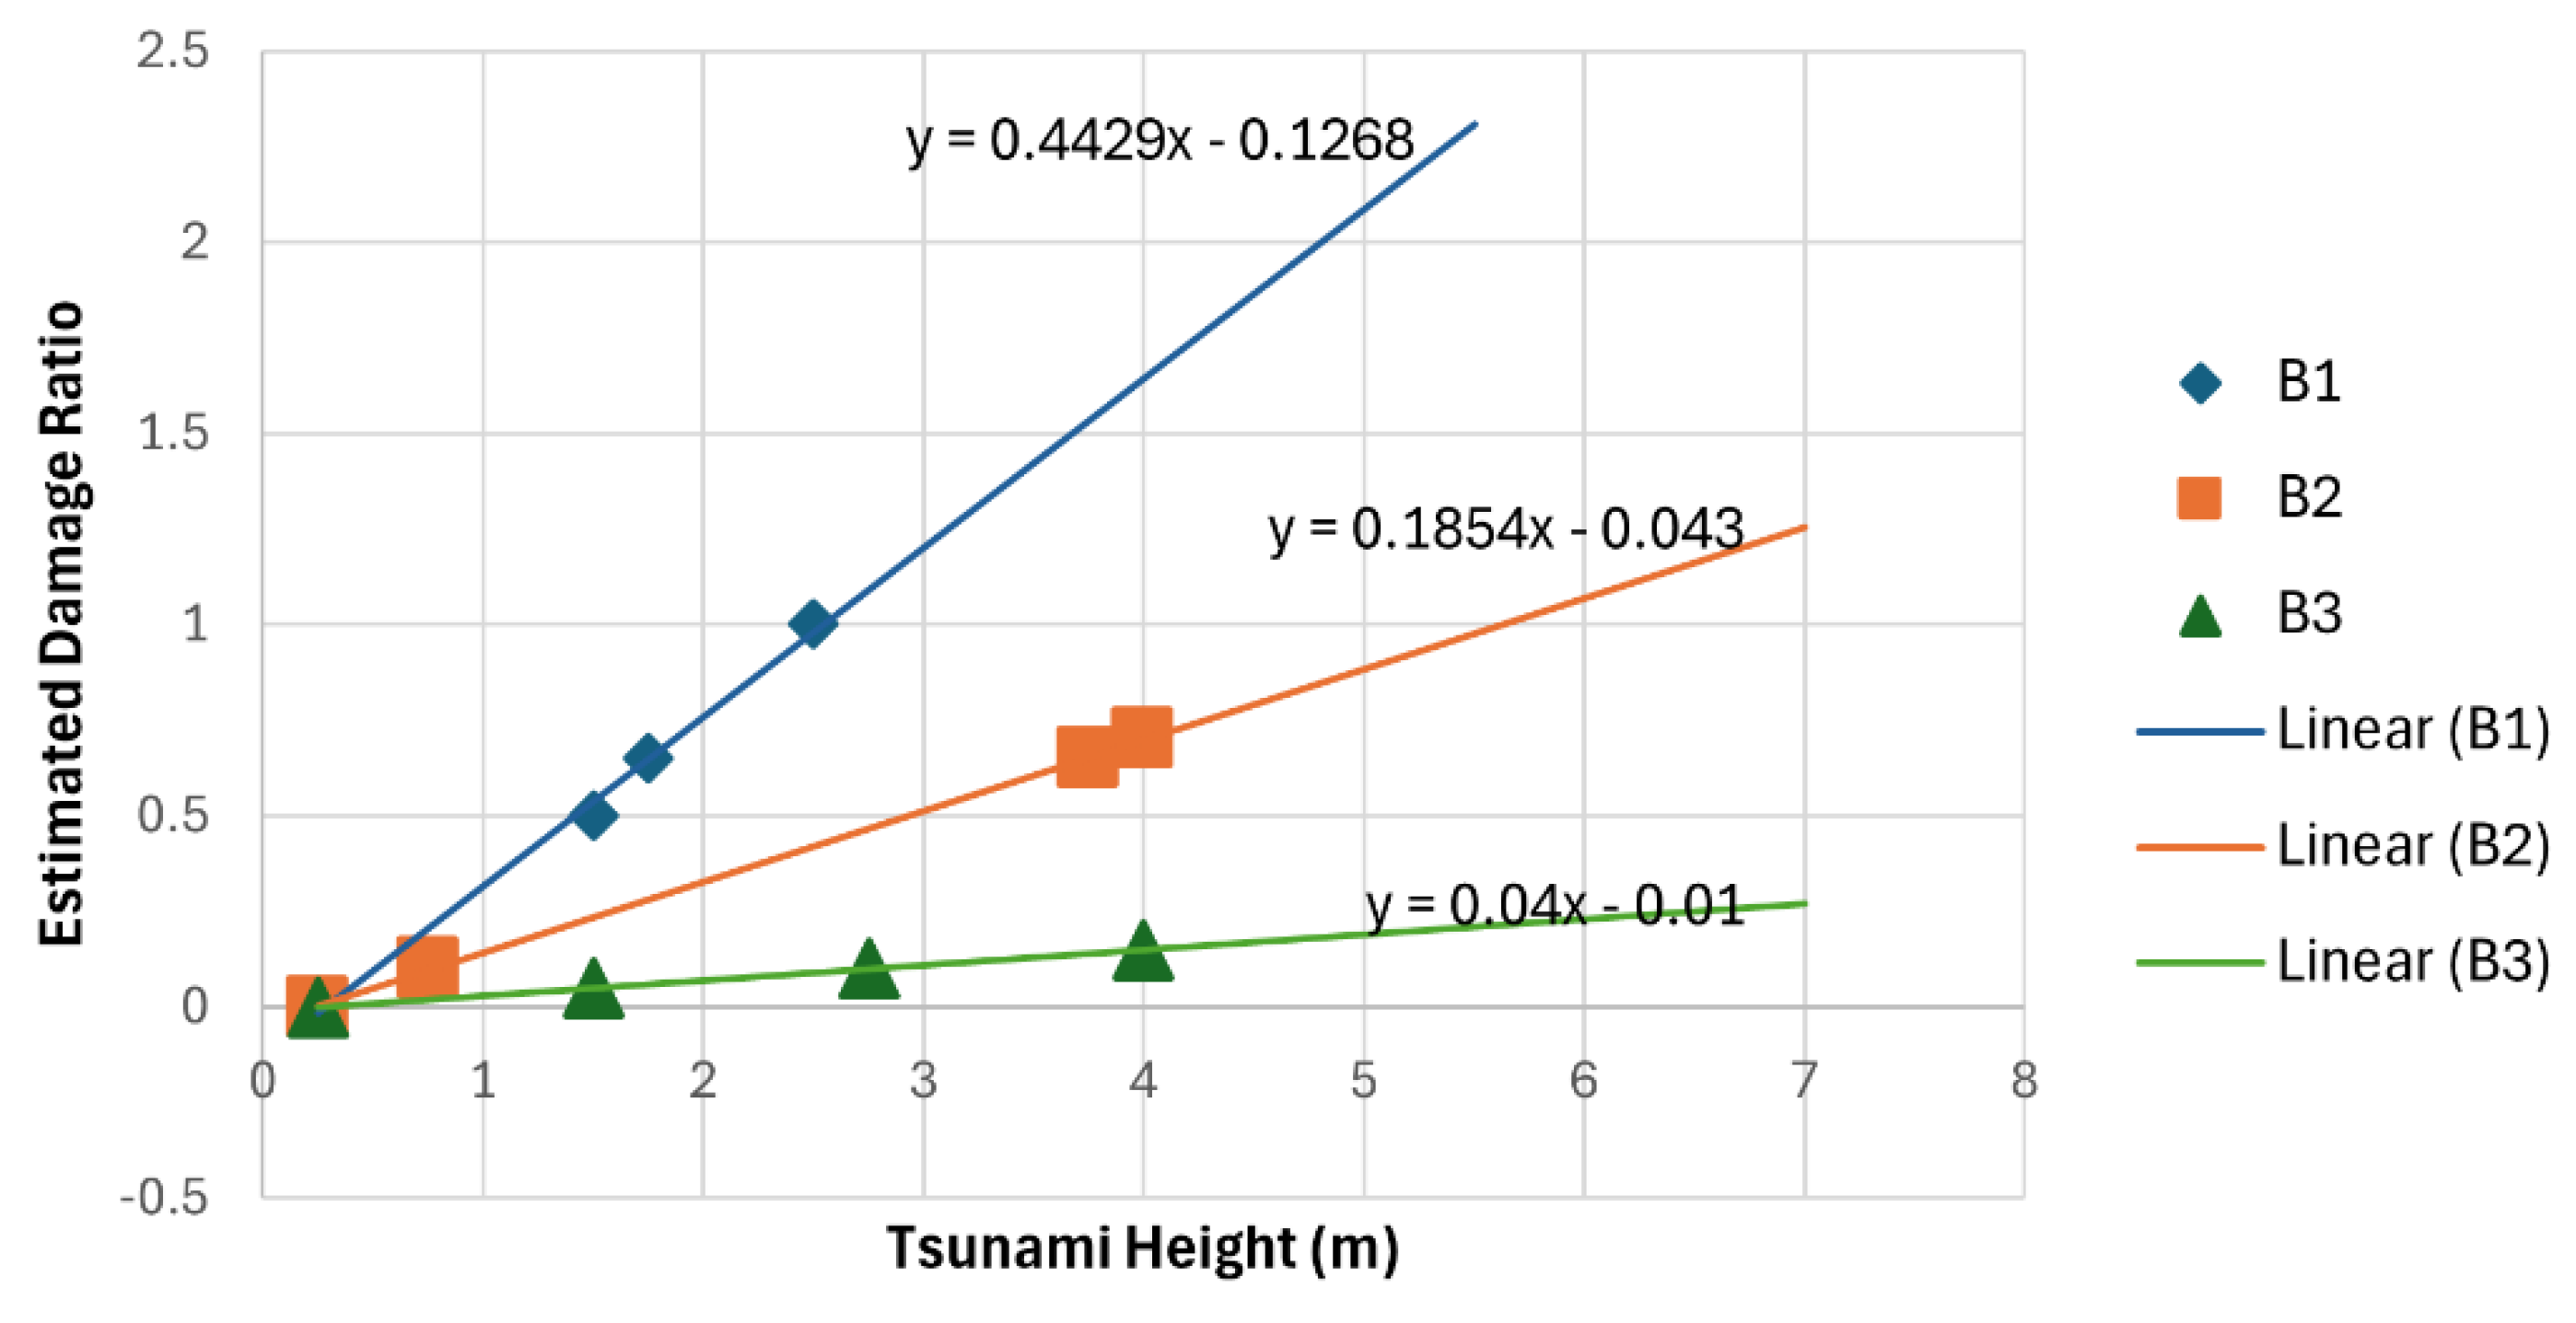
Figure 4.
LOD2 3D Model screenshot example.
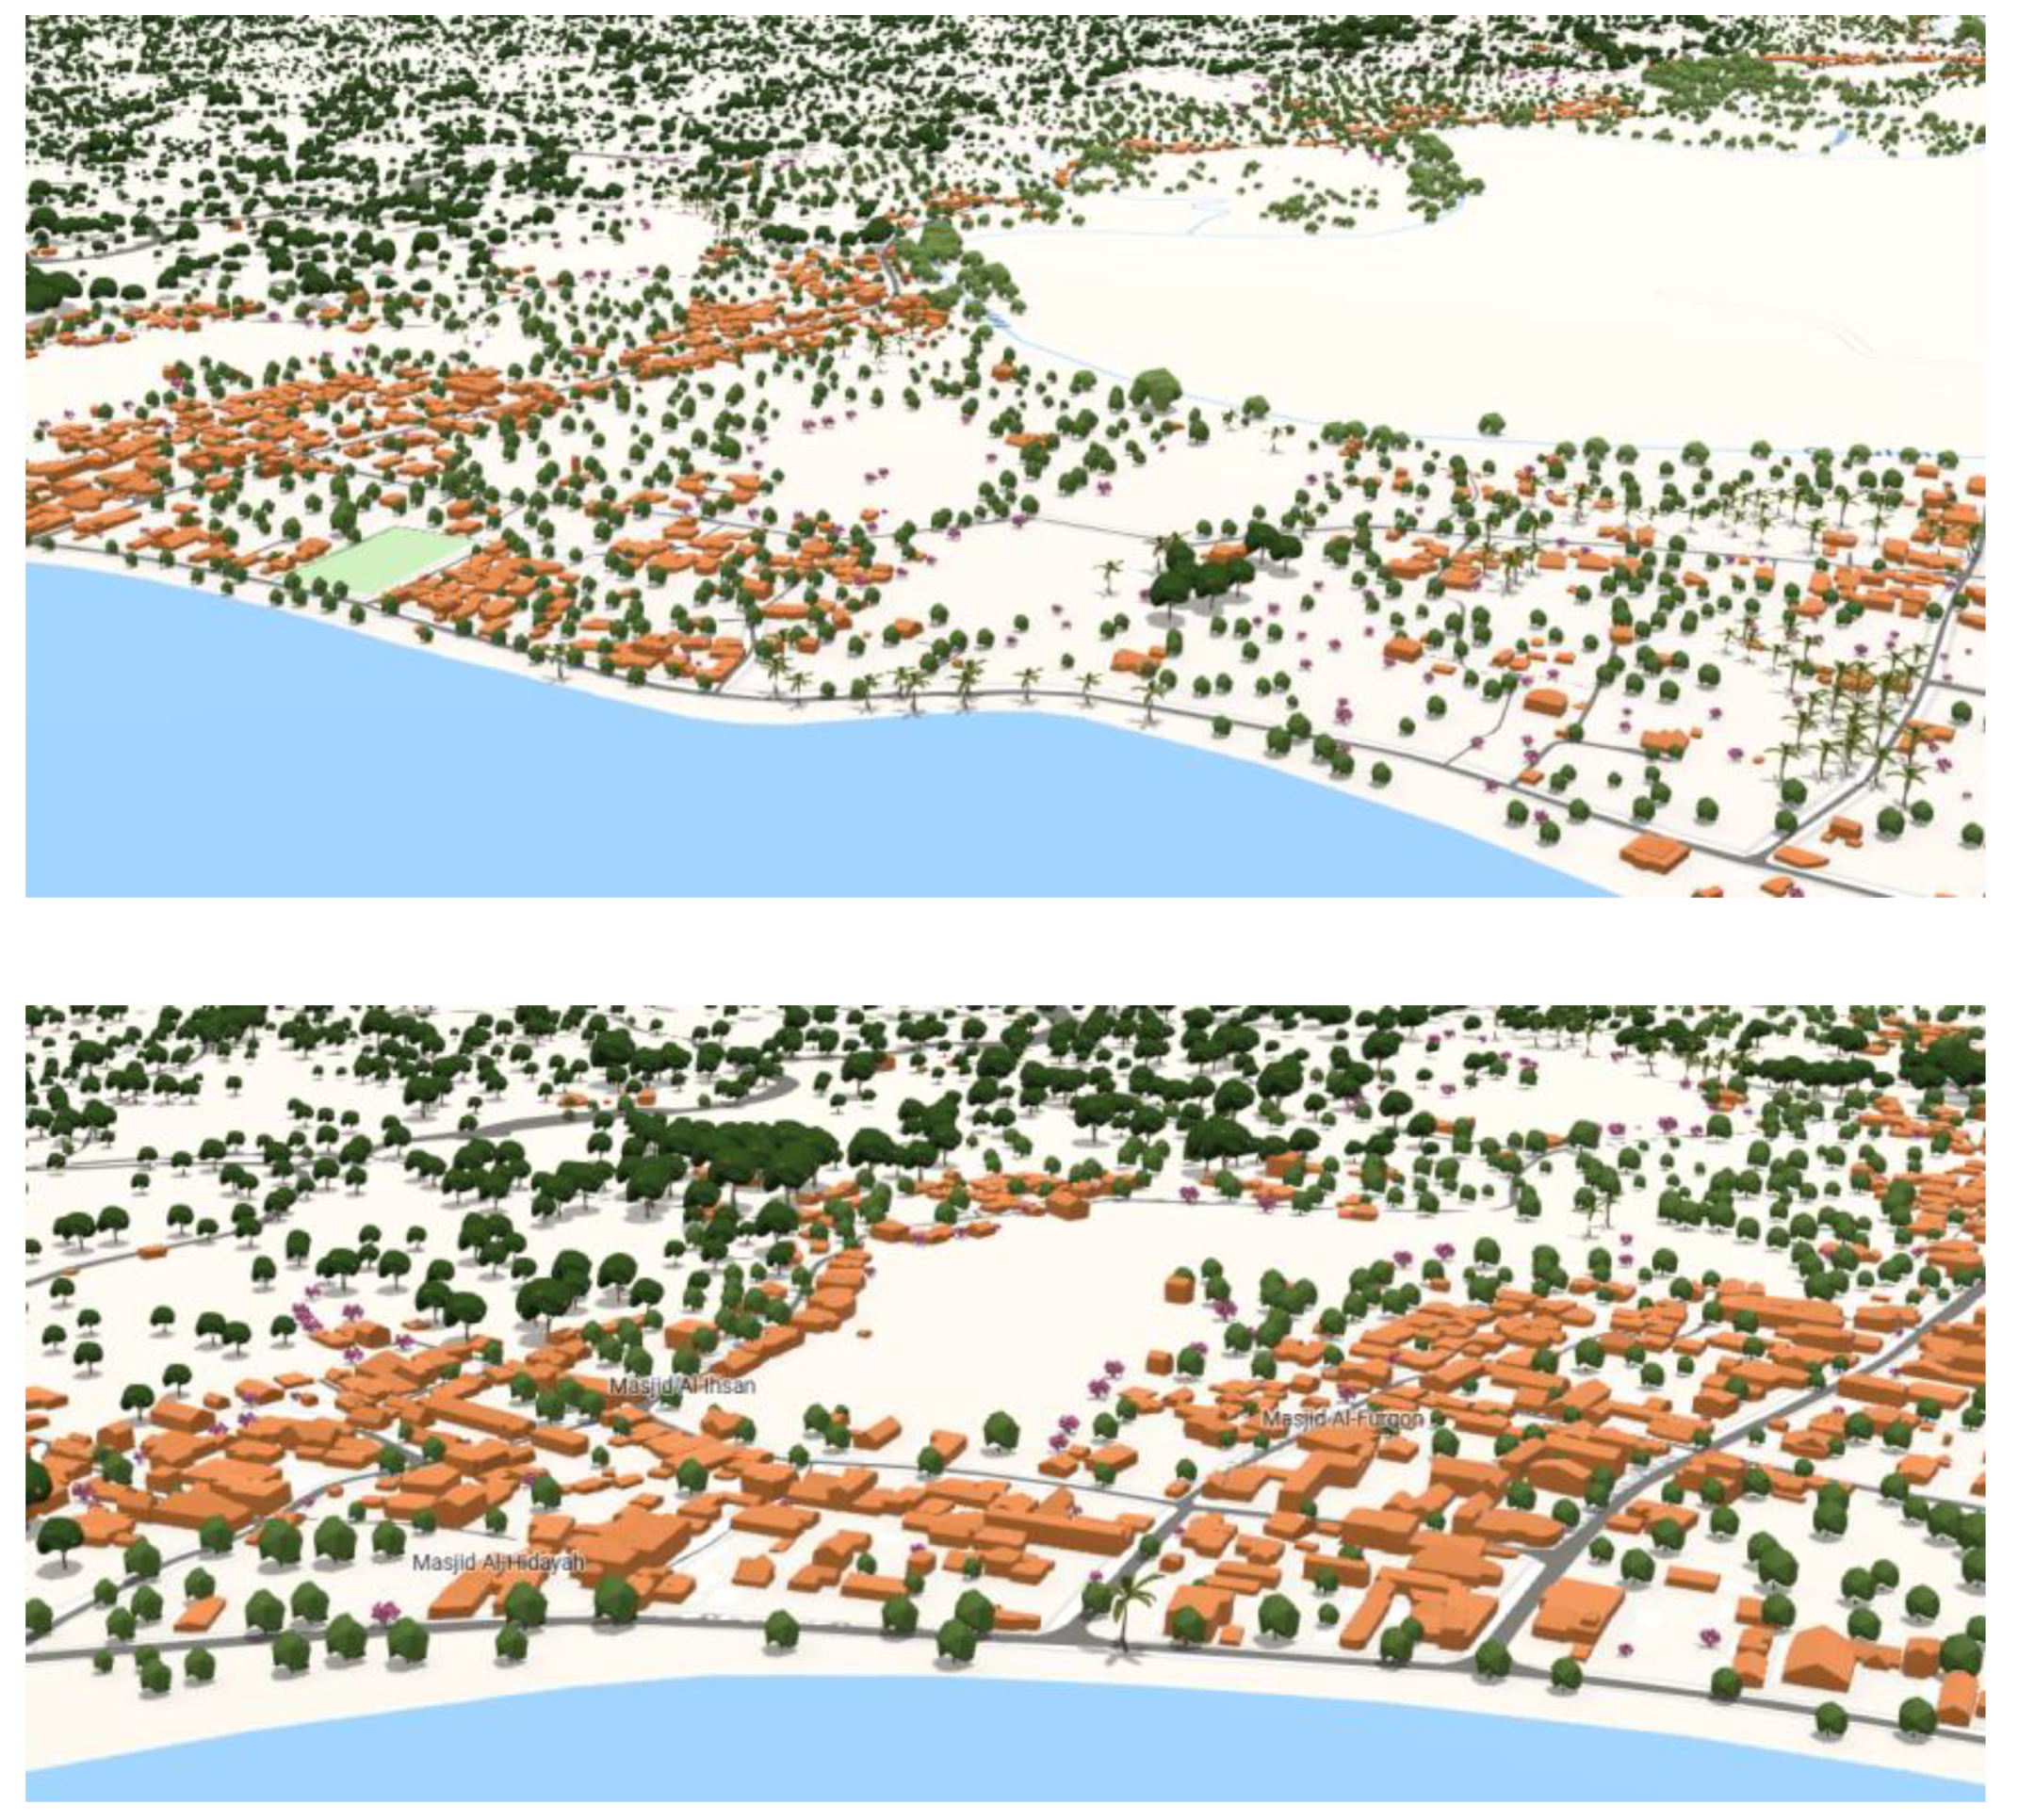
Figure 5.
Building Classification Map.
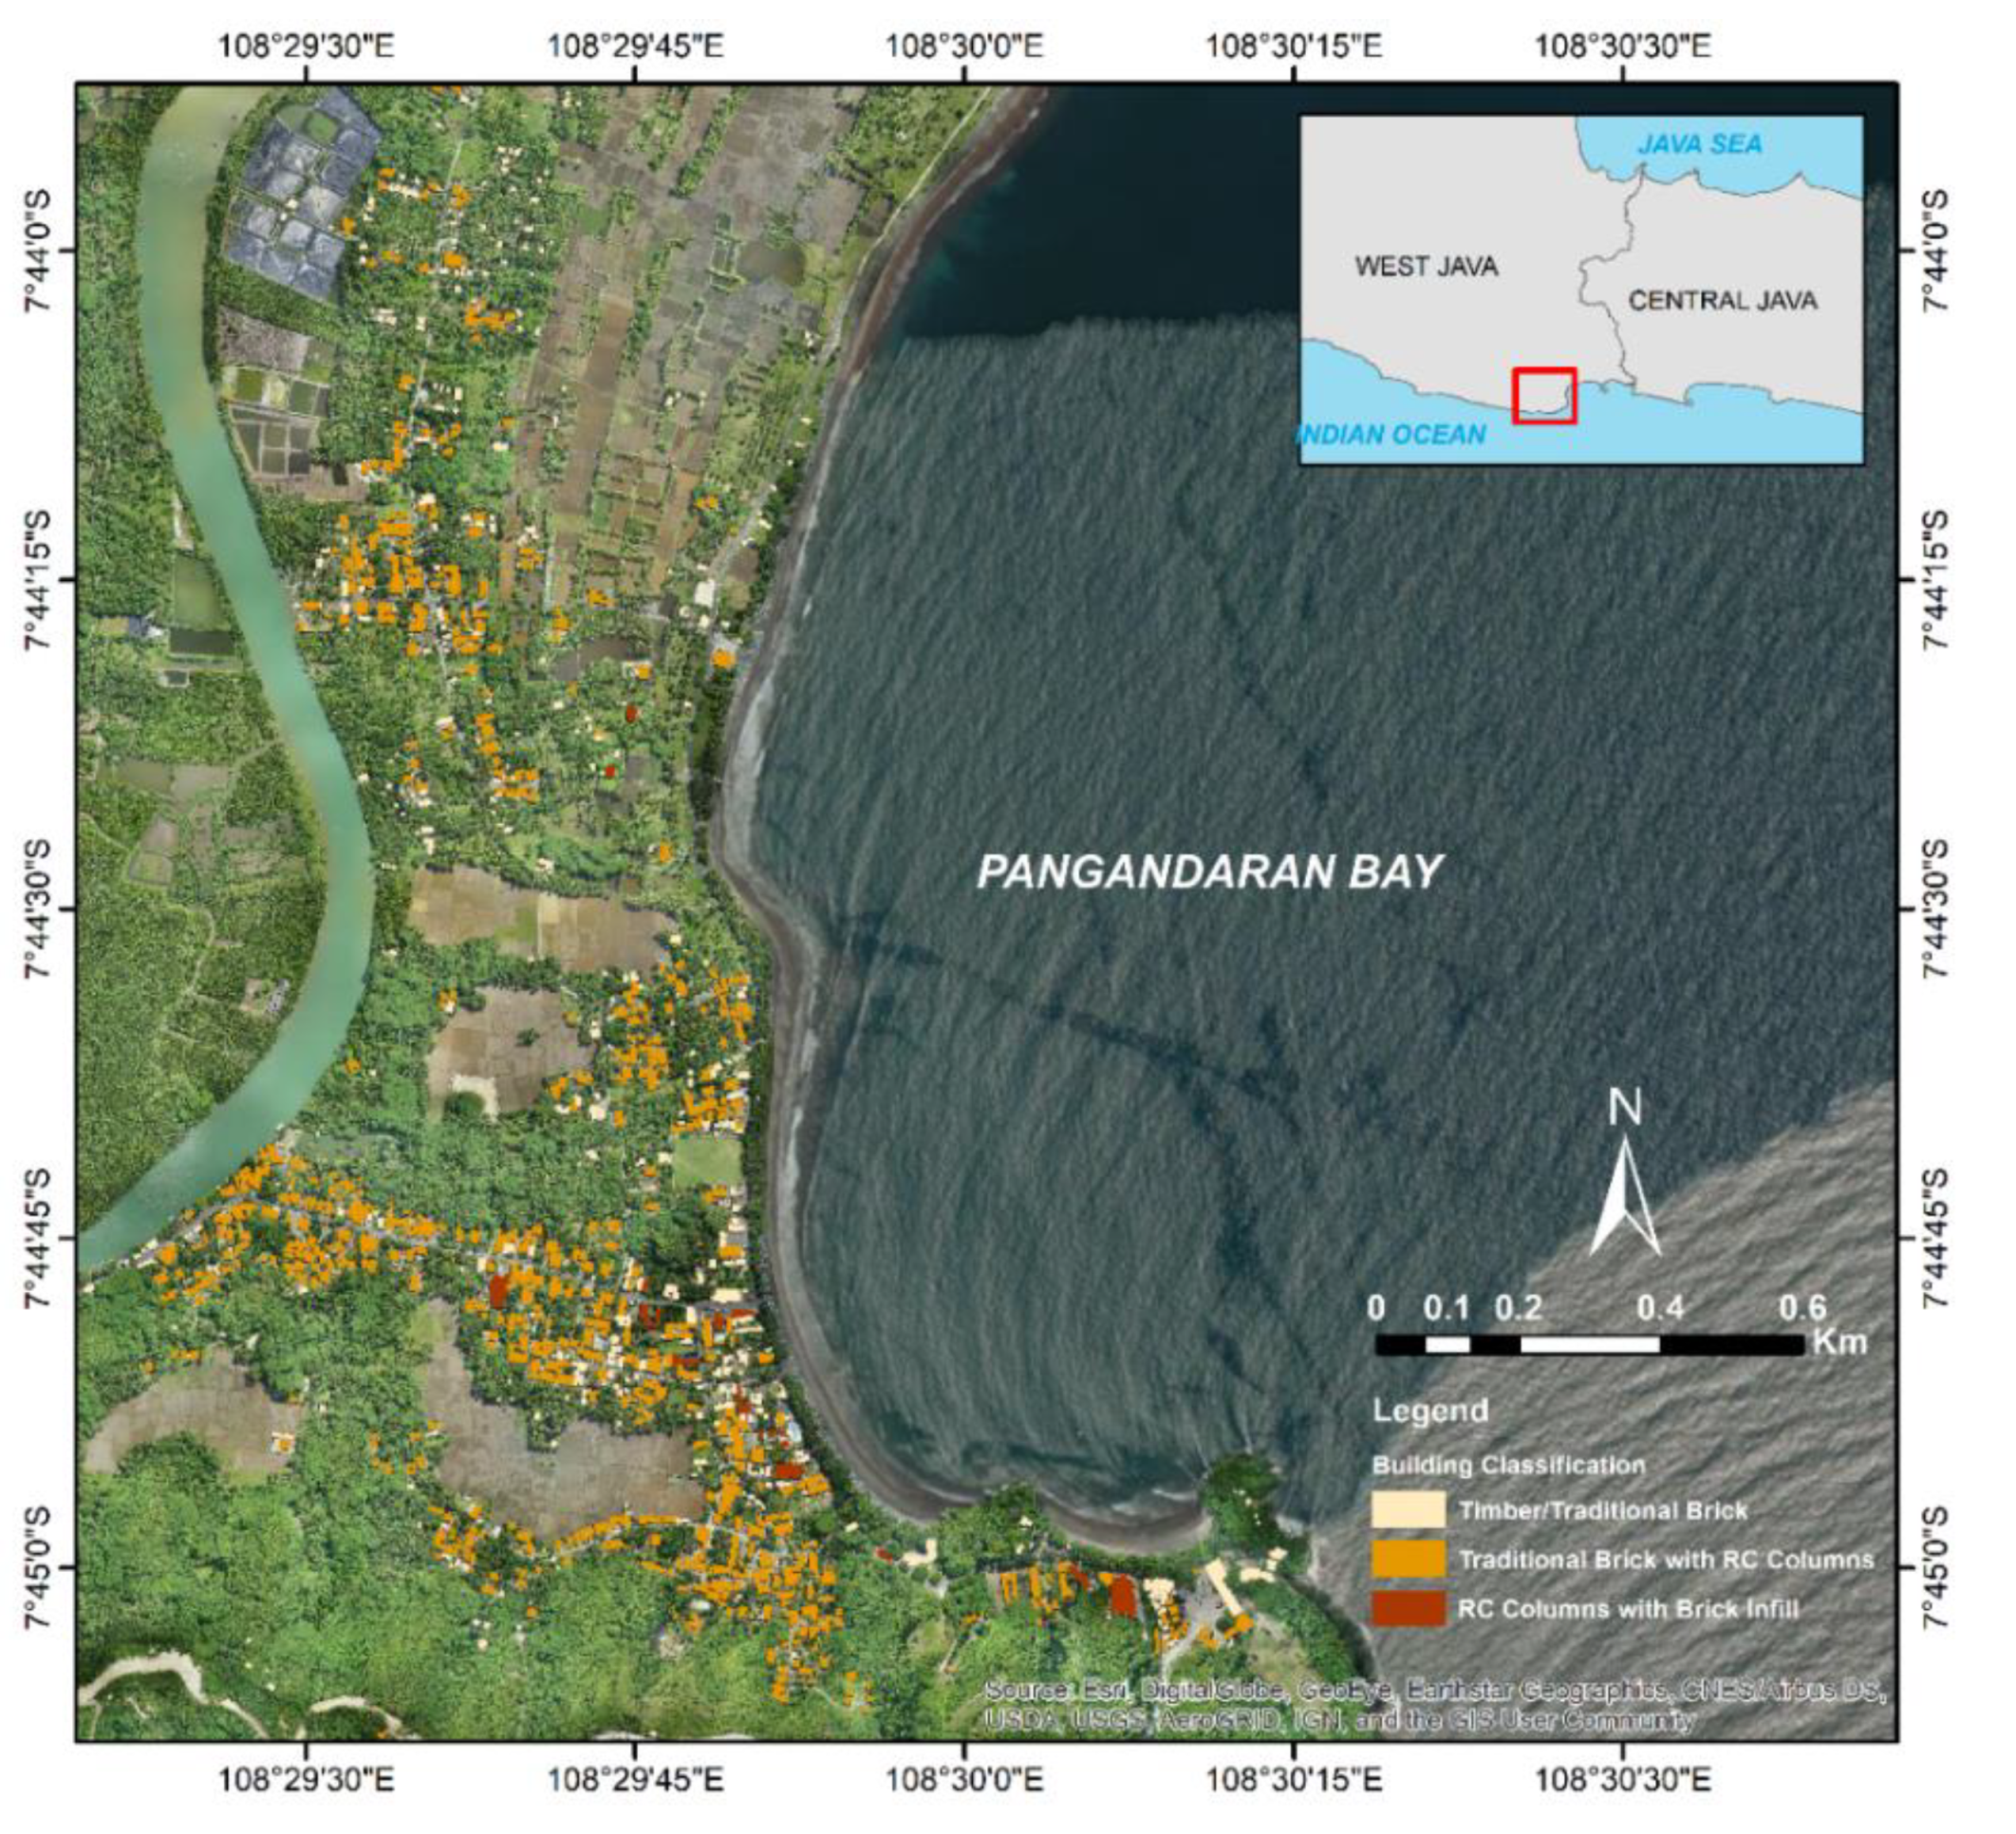
Figure 6.
Landuse/Land Cover Map for the whole village of Batukaras.
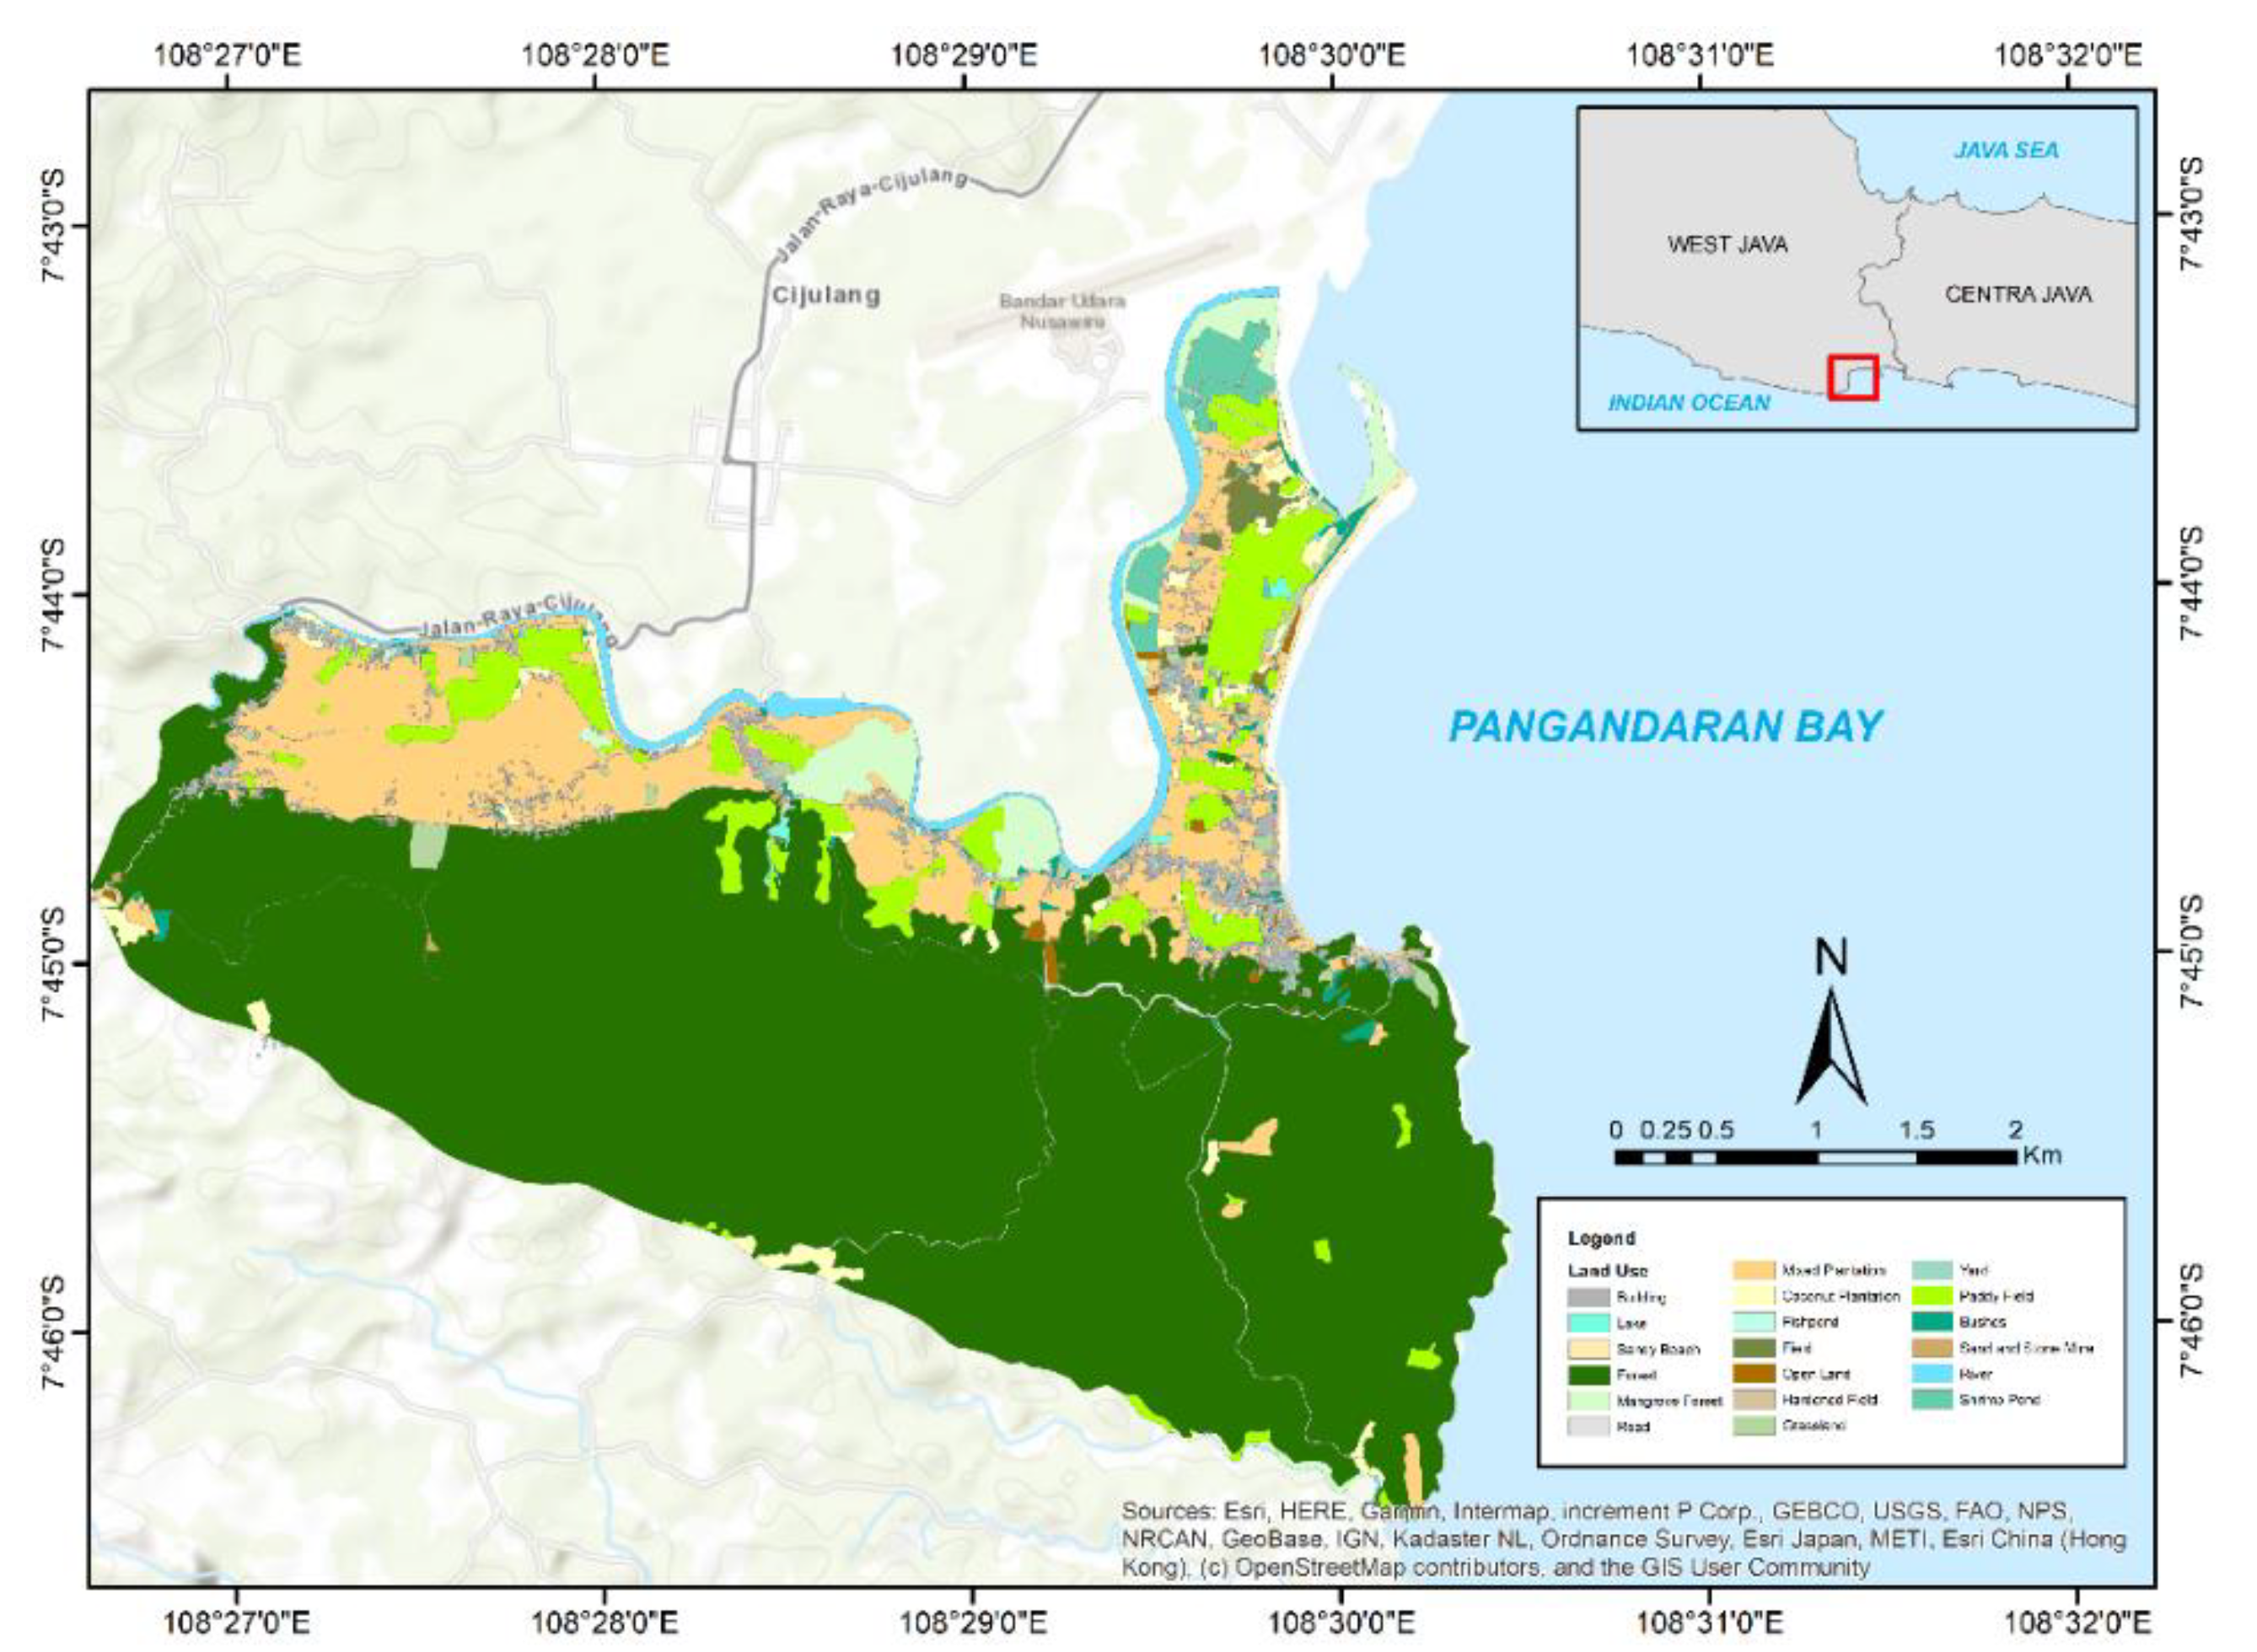
Figure 7.
Tsunami Run-up Model Result.
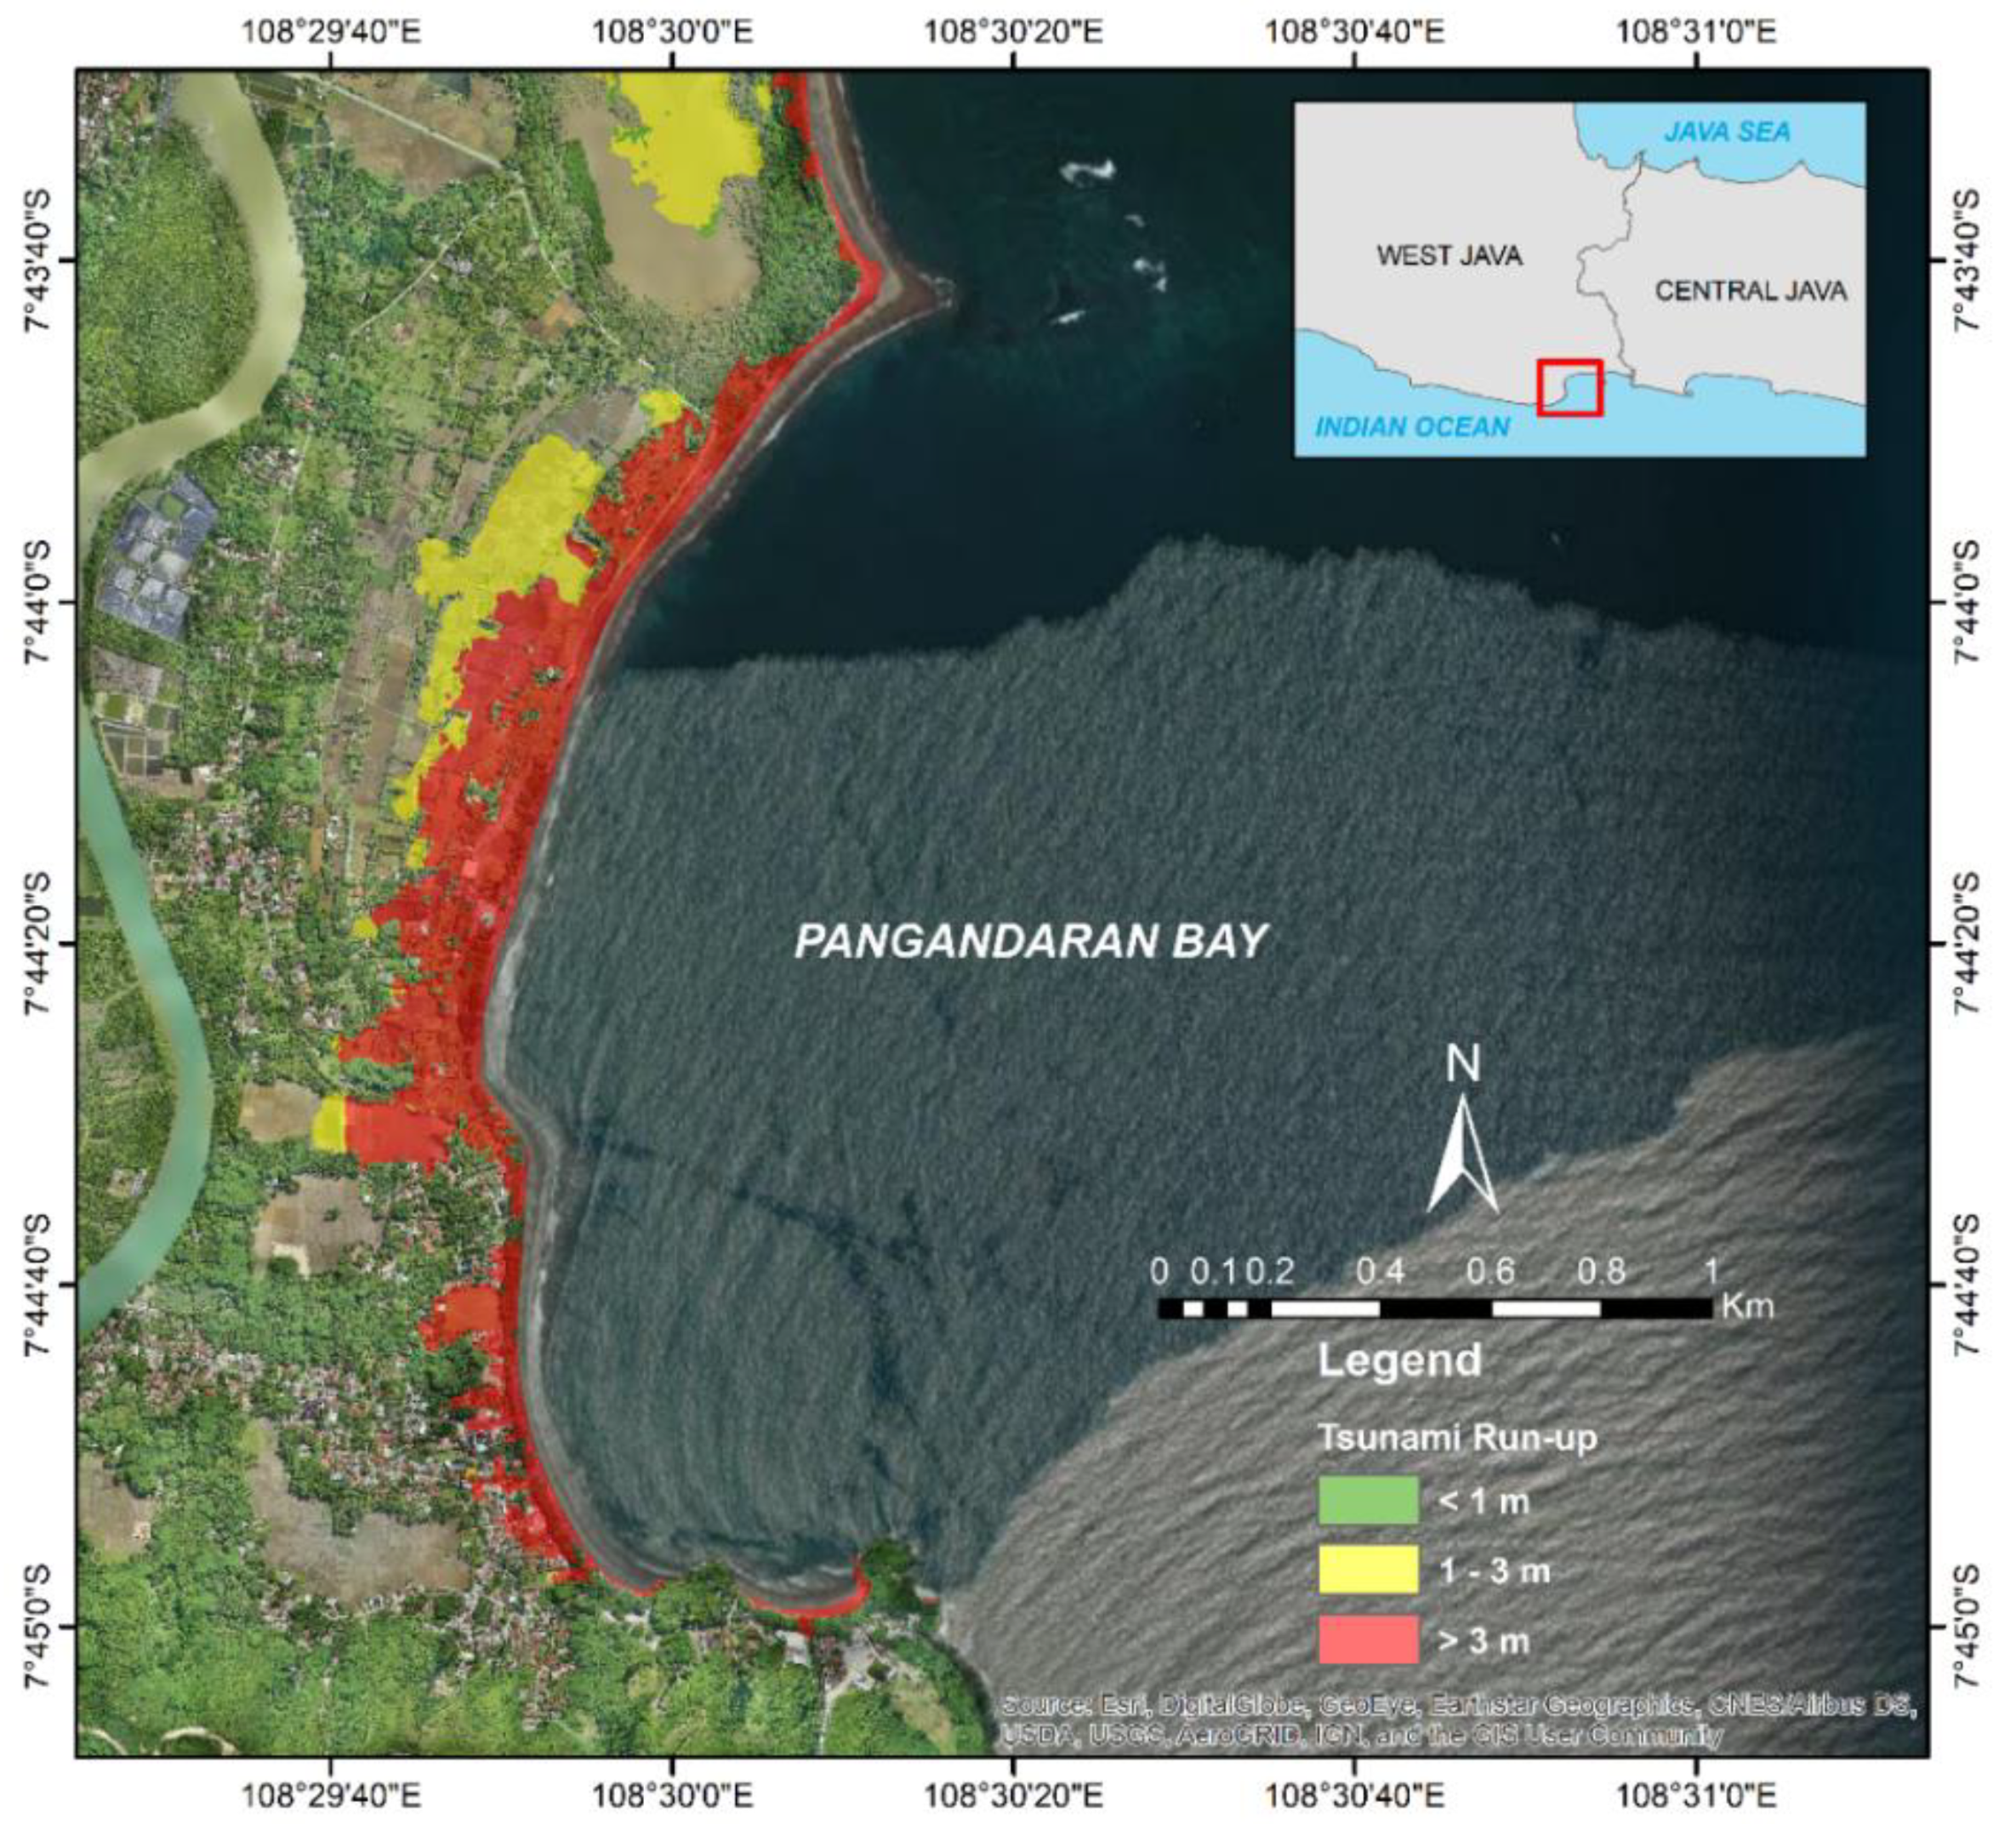
Figure 8.
Percentage of the contribution of building, landuse, and tourism factor to total potential economic loss in Batukaras Village.
Figure 8.
Percentage of the contribution of building, landuse, and tourism factor to total potential economic loss in Batukaras Village.
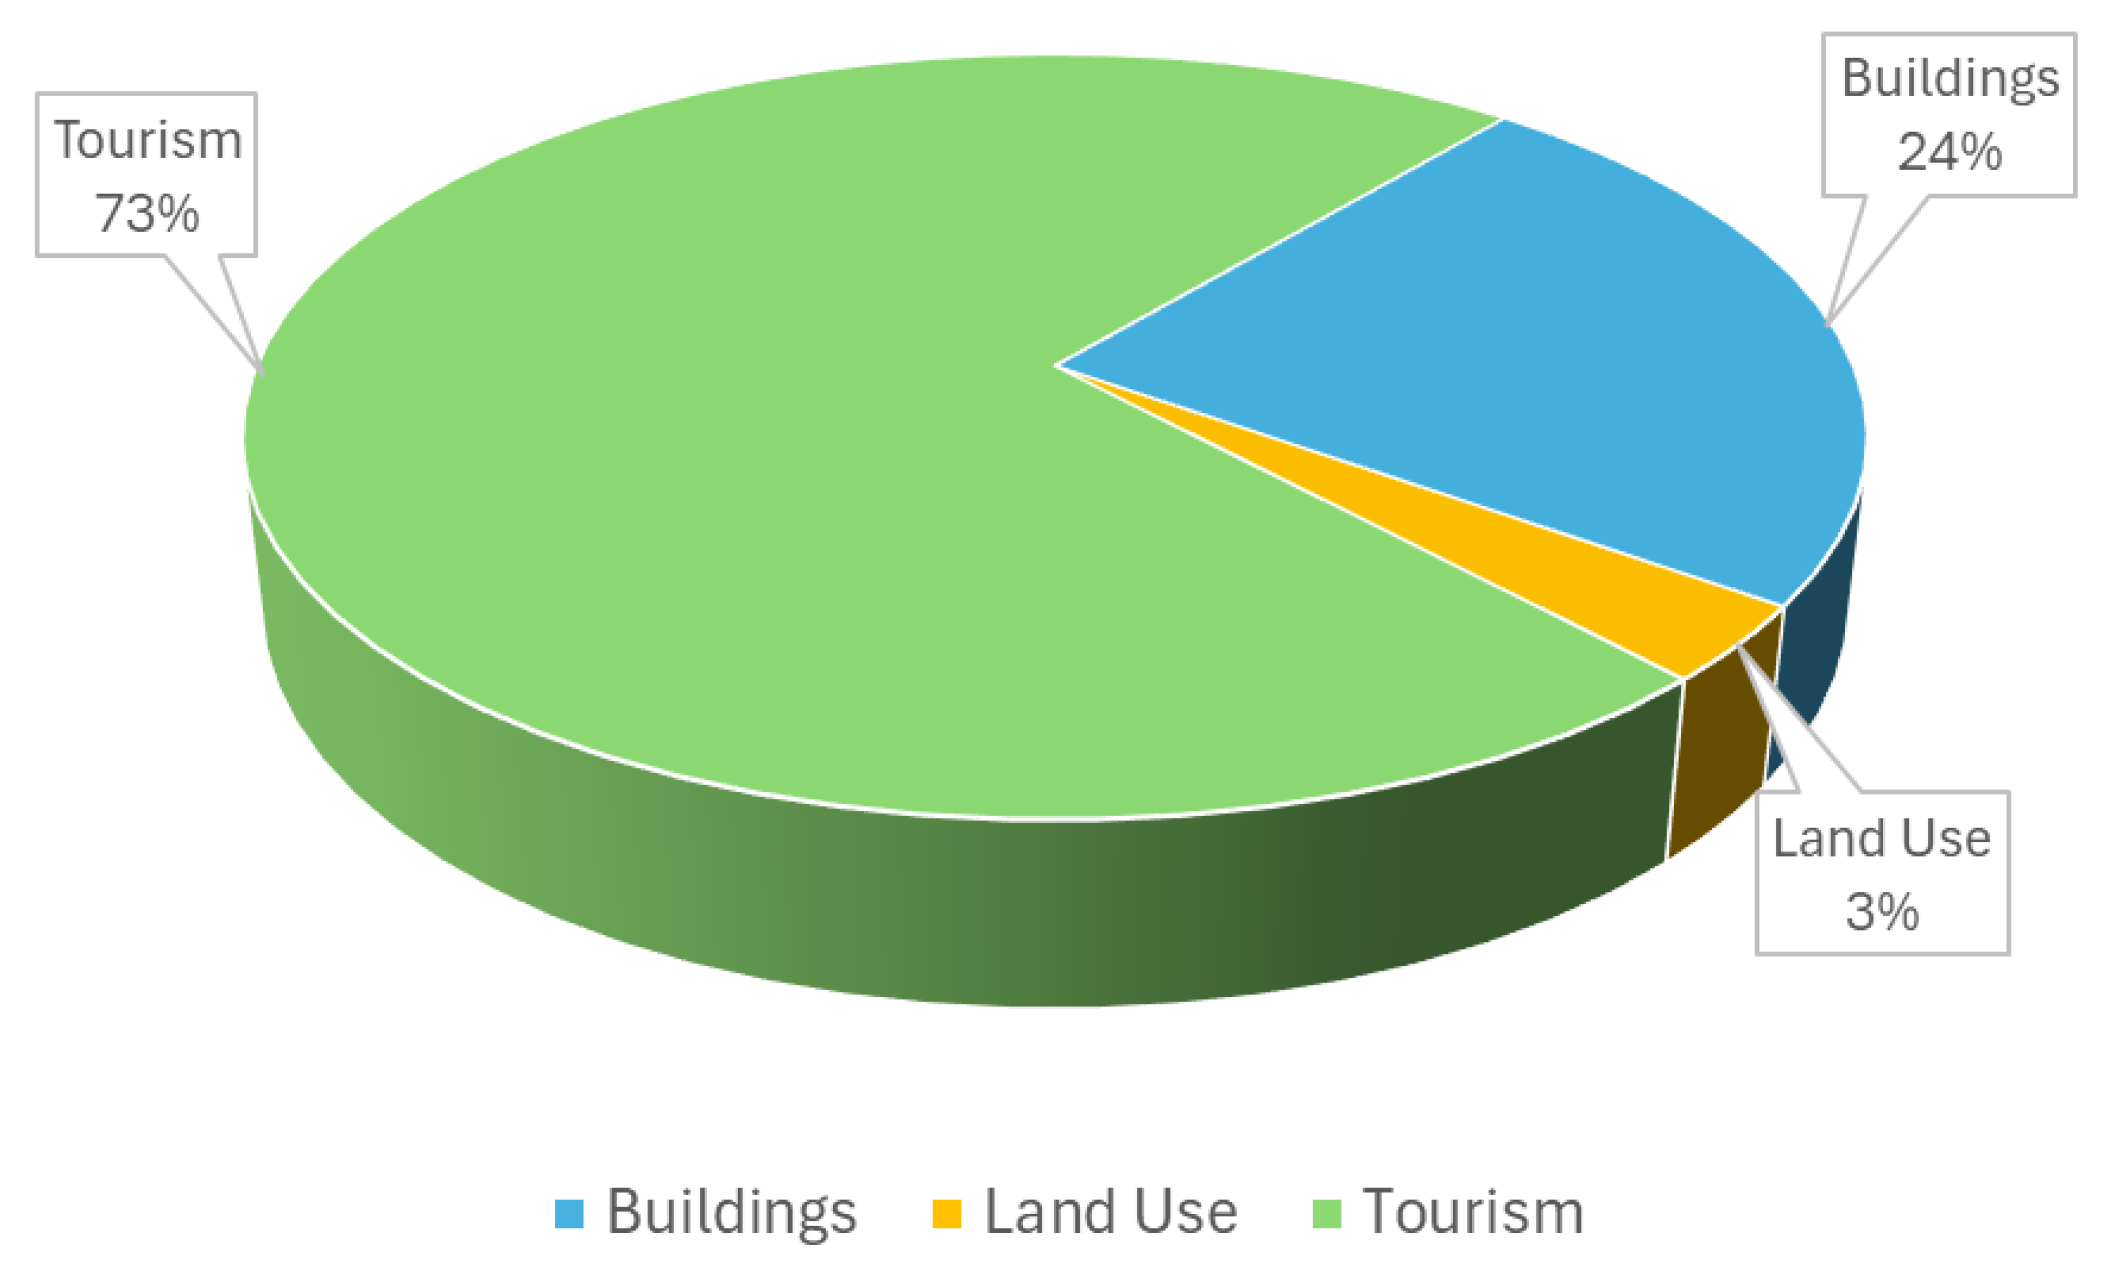
Figure 9.
Comparison of total economic loss with various recovery period.
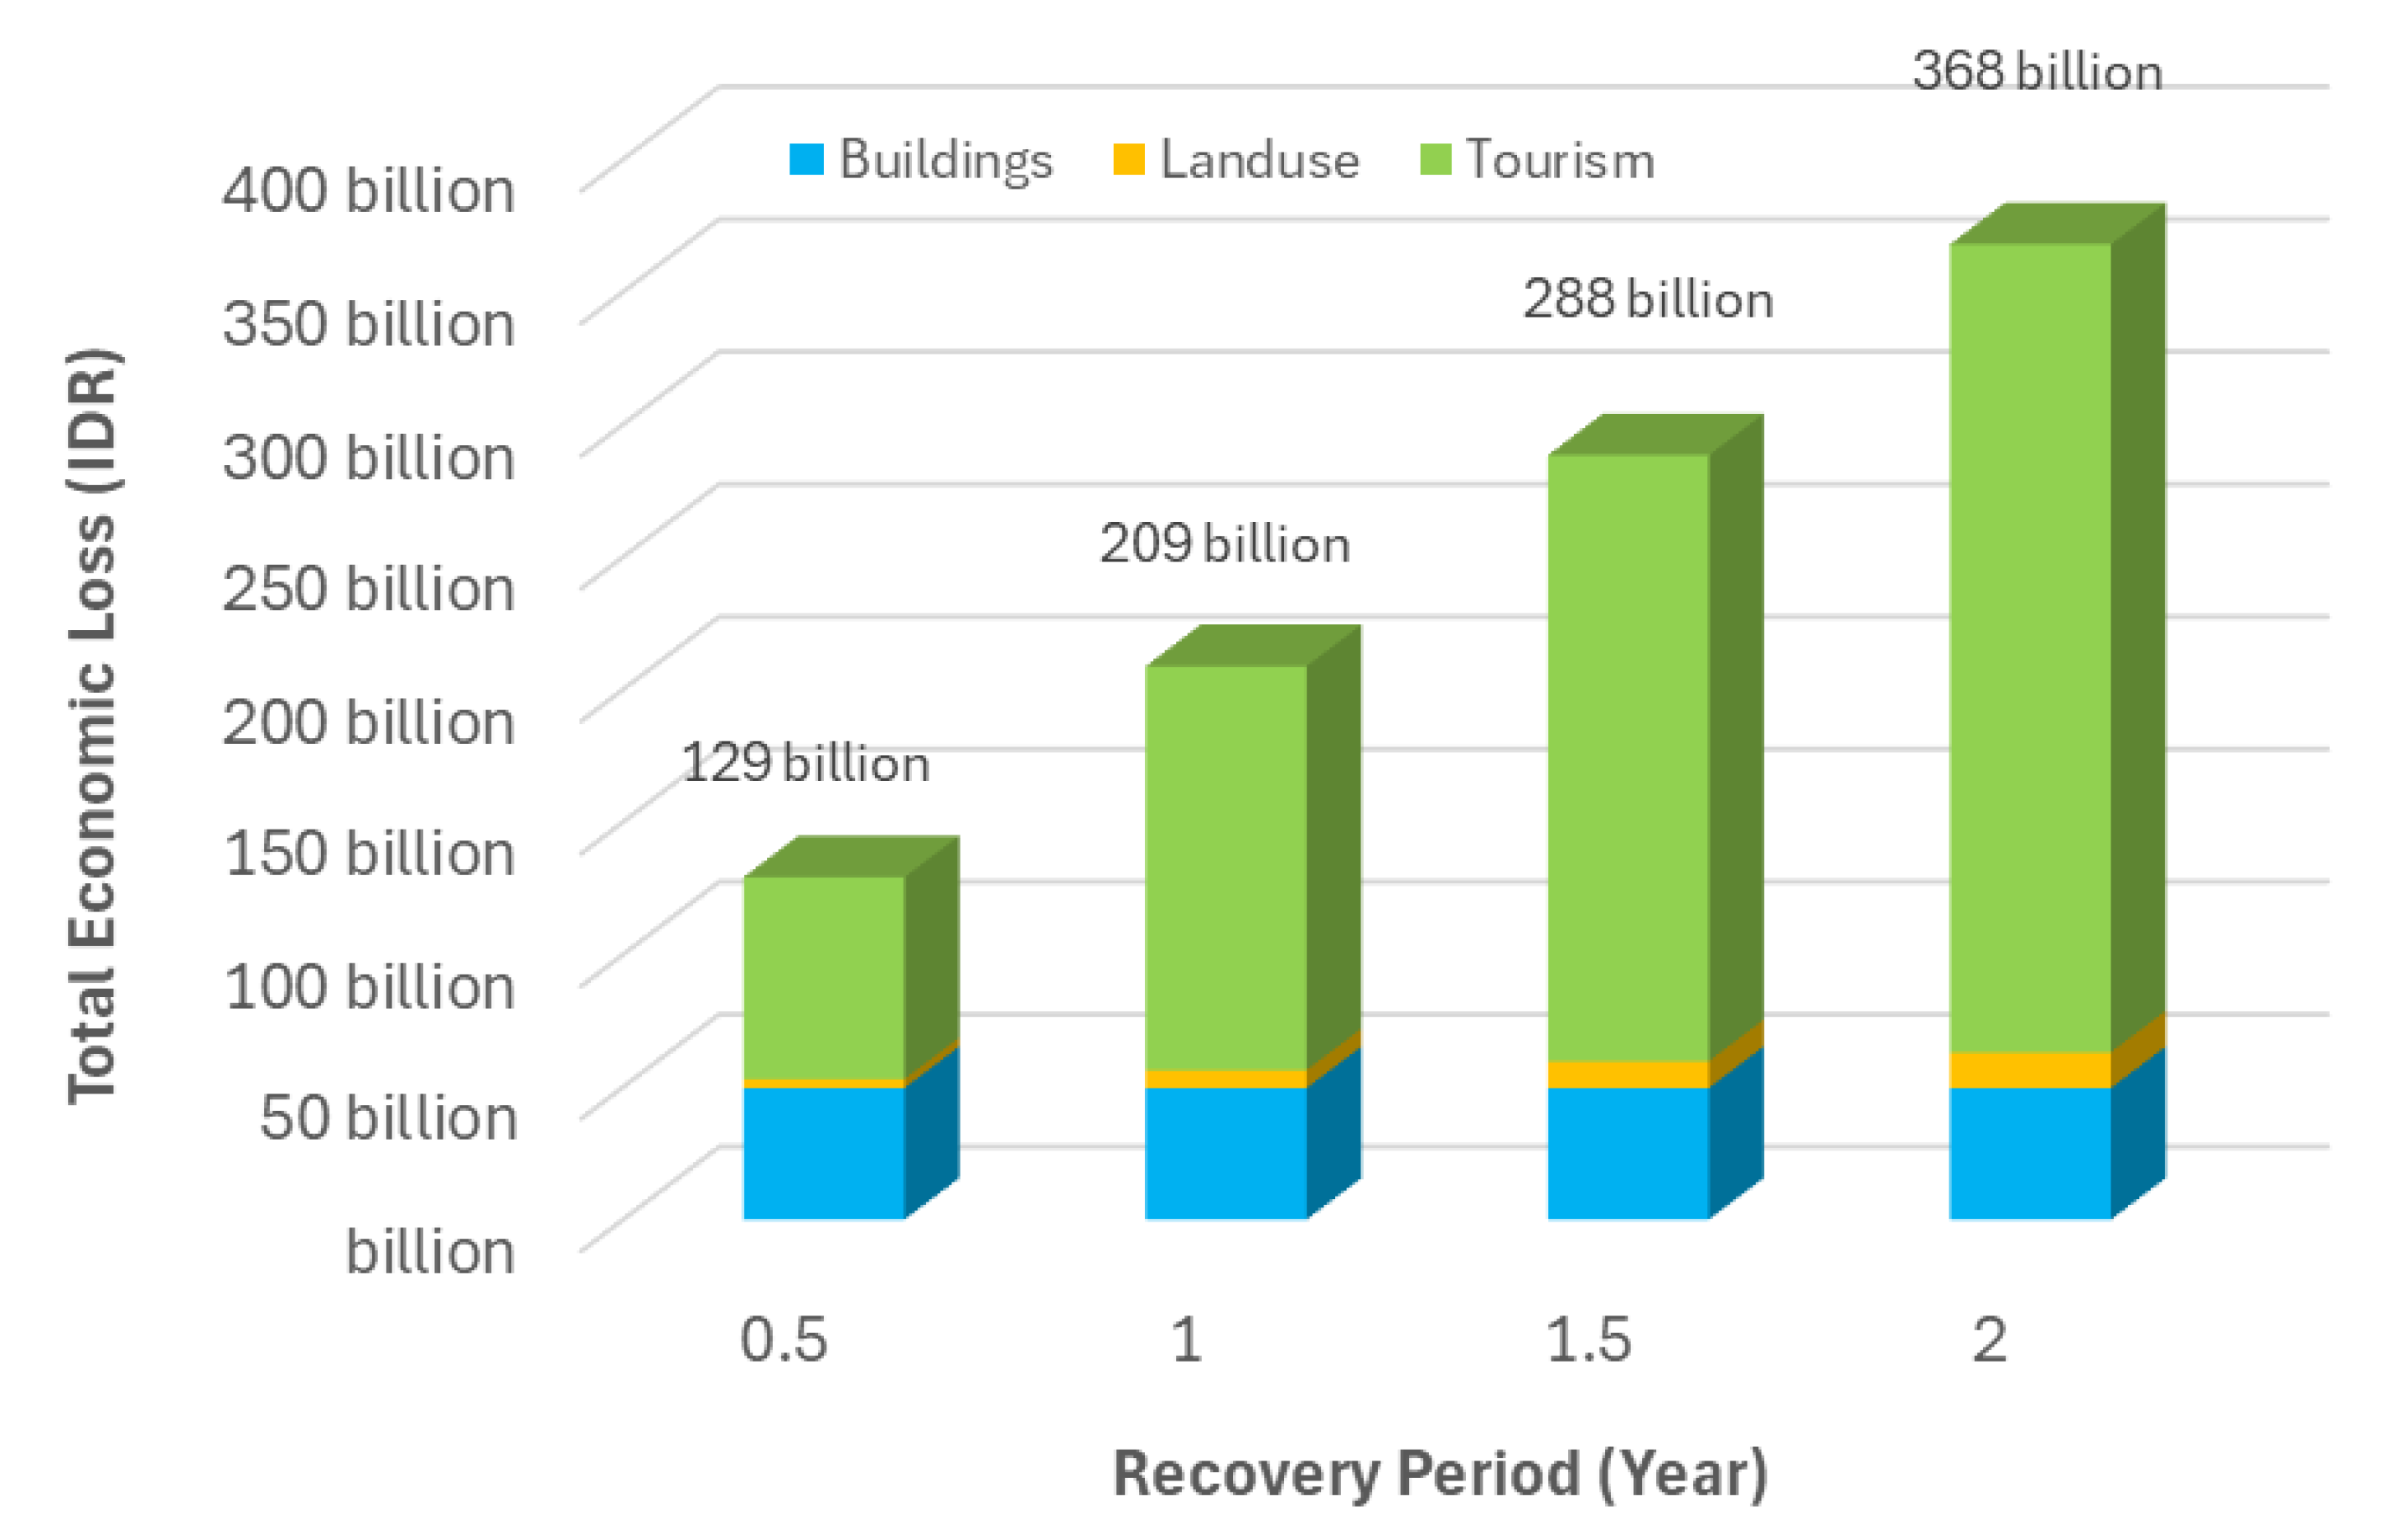

Table 1.
Affected Buildings and Estimation of Economic Loss.
| No | Building Classification | Number of Building | Economic Loss (IDR) |
| 1 | Timber/Traditional Brick | 105 | 26,519,735,811 |
| 2 | Traditional Brick with RC Columns (1 storey) | 46 | 18,207,773,702 |
| 3 | RC Columns with Brick Infill (2 storeys) | 14 | 4,905,853,654 |
| Total Loss of Building (IDR) | 165 | 49,622,363,168 |
Table 2.
Affected Landuse/Land Cover and Estimation of Economic Losses.
| Land cover | Value of Crop Production per Hectare (IDR) | Area (Ha) | Economic Loss (IDR) |
| Coconut Plantation | 57,846,500 | 2.6991 | 156,133,488 |
| Paddy Field | 21,000,000 | 16.2133 | 340,479,300 |
| Fishpond | 525,000,000 | 0.1882 | 98,805,000 |
| Shrimp Pond | 960,000,000 | 0.2419 | 232,224,000 |
| Mixed Plantation | 1,153,923,250 | 5.1166 | 5,904,163,701 |
| Total Loss of Landuse (IDR) | 6,731,805,489 | ||
Table 3.
Number of Visitors (2019-2023) and the income from tickets in 2023.
| Visitor | 2019 | 2020 | 2021 | 2022 | 2023 |
| International | 1,456 | 237 | 0 | 123 | 276 |
| Domestic | 519,468 | 349,041 | 380,577 | 449,506 | 475,988 |
| TOTAL | 520,924 | 349,278 | 380,577 | 449,629 | 476,264 |
| Ticket (IDR) | 7,143,960,000 |
Table 4.
Assumption of tourist’s length of stay and spending.
| Visitors | Tourist Spending (IDR) | Length of Stay (days) | ||
| Food | Activity | Souvenir | ||
| Domestic | 100,000 | 50,000 | 50,000 | 2 |
| International | 300,000 | 250,000 | 200,000 | 10 |
Table 5.
Estimation of economic loss from tourist spending factors.
| Visitors | Estimated Economic Loss (IDR) | Economic Loss (IDR) | ||||
| Food | Activity | Souvenir | ||||
| Domestic | 95,142,400,000 | 23,785,600,000 | 11,892,800,000 | 130,820,800,000 | ||
| International | 828,000,000 | 345,000,00 | 27,600,000 | 1,200,600,000 | ||
| Total Loss (IDR) | 132,021,400,000 | |||||
Table 6.
Estimation of annual income of hotels that are located in the inundation area.
| Nr. | Type of Hotel | Name | Type of Building | Number of Room | Weekday Rate (IDR) | Weekend Rate (IDR) | Weekday Income (IDR) | Weekend Income (IDR) | Total Income (IDR) |
| 1 | Homestay | Pondok Maranti | 1 | 5 | 140,000 | 200,000 | 91,000,000 | 104,000,000 | 195,000,000 |
| 2 | Homestay | Laut Biru | 1 | 6 | 210,000 | 300,000 | 163,800,000 | 187,200,000 | 351,000,000 |
| 3 | Homestay | Agus Homestay | 1 | 1 | 630,000 | 900,000 | 81,900,000 | 93,600,000 | 175,500,000 |
| 4 | Hotel | The SO Hotel | 2 | 4 | 420,000 | 600,000 | 218,400,000 | 249,600,000 | 468,000,000 |
| 5 | Hotel | The SO Hotel | 2 | 5 | 420,000 | 600,000 | 273,000,000 | 312,000,000 | 585,000,000 |
| 6 | Villa | The Beach House | 2 | 1 | 3,150,000 | 4,500,000 | 409,500,000 | 468,000,000 | 877,500,000 |
| 7 | Hotel | Sunrise | 2 | 2 | 350,000 | 500,000 | 91,000,000 | 104,000,000 | 195,000,000 |
| 8 | Hotel | Sunrise | 2 | 5 | 350,000 | 500,000 | 227,500,000 | 260,000,000 | 487,500,000 |
| 9 | Hotel | Sunrise | 2 | 5 | 350,000 | 500,000 | 227,500,000 | 260,000,000 | 487,500,000 |
| 10 | Villa | D'Jarwo | 2 | 1 | 196,000 | 280,000 | 25,480,000 | 29,120,000 | 54,600,000 |
| 11 | Hotel | Balekarang | 2 | 6 | 455,000 | 650,000 | 354,900,000 | 405,600,000 | 760,500,000 |
| 12 | Hotel | Balekarang | 2 | 2 | 455,000 | 650,000 | 118,300,000 | 135,200,000 | 253,500,000 |
| 13 | Homestay | 8 Wolu Homestay | 2 | 3 | 315,000 | 450,000 | 122,850,000 | 140,400,000 | 263,250,000 |
| 14 | Homestay | Buana Homestay | 2 | 2 | 140,000 | 200,000 | 36,400,000 | 41,600,000 | 78,000,000 |
| 15 | Homestay | Buana Homestay | 2 | 2 | 140,000 | 200,000 | 36,400,000 | 41,600,000 | 78,000,000 |
| 16 | Hotel | Wirton Batukaras | 3 | 26 | 420,000 | 600,000 | 1,419,600,000 | 1,622,400,000 | 3,042,000,000 |
| 17 | Hotel | Sunrise | 3 | 5 | 350,000 | 500,000 | 227,500,000 | 260,000,000 | 487,500,000 |
| 18 | Homestay | Pondok Putri | 3 | 14 | 336,000 | 480,000 | 611,520,000 | 698,880,000 | 1,310,400,000 |
| 19 | Hotel | Le Pari | 3 | 2 | 2,100,000 | 3,000,000 | 546,000,000 | 624,000,000 | 1,170,000,000 |
| 20 | Hotel | Le Pari | 3 | 1 | 2,100,000 | 3,000,000 | 273,000,000 | 312,000,000 | 585,000,000 |
| 21 | Hotel | Le Pari | 3 | 1 | 2,100,000 | 3,000,000 | 273,000,000 | 312,000,000 | 585,000,000 |
| 22 | Hotel | Le Pari | 3 | 1 | 2,100,000 | 3,000,000 | 273,000,000 | 312,000,000 | 585,000,000 |
| 23 | Homestay | Bintang Labuan | 3 | 5 | 140,000 | 200,000 | 91,000,000 | 104,000,000 | 195,000,000 |
| Total Economic Loss (IDR) | 13,269,750,000 | ||||||||
Table 7.
Summary of tsunami economic loss estimation in the tourism area of Batukaras Village.
| Sector | Estimated Economic Loss (IDR) | Percentage (%) |
| Buildings | 49,633,363,168 | 23.8 |
| Land Use | 6,731,805,489 | 3.2 |
| Tourism | 152,430,970,000 | 73.0 |
| Total (IDR) | 208,796,138,657 | 100 |
Disclaimer/Publisher’s Note: The statements, opinions and data contained in all publications are solely those of the individual author(s) and contributor(s) and not of MDPI and/or the editor(s). MDPI and/or the editor(s) disclaim responsibility for any injury to people or property resulting from any ideas, methods, instructions or products referred to in the content. |
© 2025 by the authors. Licensee MDPI, Basel, Switzerland. This article is an open access article distributed under the terms and conditions of the Creative Commons Attribution (CC BY) license (http://creativecommons.org/licenses/by/4.0/).
Copyright: This open access article is published under a Creative Commons CC BY 4.0 license, which permit the free download, distribution, and reuse, provided that the author and preprint are cited in any reuse.


