
Submitted:
28 January 2025
Posted:
28 January 2025
You are already at the latest version
Abstract
Carbohydrate consumption during pregnancy represents an important source of energy for the mother-child duo; its consumption, however, can cause gestational diabetes mellitus (GDM), body weight gain, inflammation, increases glucose transport to the fetus, adiposity and the risk of macrosomia. The objective was to research the impact of sucrose consumption during pregnancy on the metabolic, immune and Redox profile in females with GDM. 24 female CD1 mice were used, they were divided into two groups: Control and DMG. Each group was subdivided into 2 subgroups: a) Without Sucrose and b) With Sucrose. The following were determined: Body Mass Index (BMI), Glycaemia, hormones (insulin, adiponectin and leptin), CD3+ T lymphocytes, cytokines (IL-1β, IL-6, IFN-γ and TNF-α), IgA and IgG antibodies, as well as Redox systems. The Sucrose consumption increases HOMA-IR and the secretion of insulin, adiponectin and leptin, it also increased the secretion of proinflammatory cytokines and the production of IgA and IgG antibodies, decreased the activity of the Glutathione Reductase enzyme and increased the production of TBARS and AGE. High sucrose consumption increases the inflammatory response mediated mainly by CD8+ lymphocytes and the production of proinflammatory cytokines, it can trigger a compensatory humoral response and alter Redox mechanisms causing a state of Oxidant Stress.
Keywords:
Gestational Diabetes Mellitus
; Sucrose
; Immune response
; Redox mechanisms
1. Introduction
Diabetes Mellitus (DM) is the most prevalent non-communicable metabolic disease, affecting more than 425 million people worldwide and responsible for 4.8 million deaths per year [1]. It is estimated that nearly 28 million women of reproductive age have Type 2 DM (T2DM), mainly in low- and middle-income countries [2,3,4]. However, the prevalence of DM in pregnancy (Type 1, Type 2 and gestational diabetes) ranges between 5% and 20%, with gestational DM (GDM) accounting for 1% to 14% [3,5]. GDM can arise during pregnancy in women with or without a personal or family history [6], causing insulin resistance and consequently sustained hyperglycemia, lipolysis, and hyperketonemia [7]. The factors that influence the appearance of insulin resistance are the elevation of free fatty acids because of lipolysis and insufficient coupling between the activation of the insulin receptor (IR) and the translocation of GLUT4 receptors to the cell surface [8].
On the other hand, high consumption of simple carbohydrates (SCHs) or sugars during pregnancy also represents a risk factor for the pregnant mother [9]. Carbohydrates are an important source of energy for both the pregnant mother and the product [10]. Special attention is required in the quality and quantity of this energy source, particularly during GDM, since the consumption of simple sugars rapidly increases plasma blood glucose concentrations [11]. There is evidence in animal models that suggests the negative effects of sucrose consumption in the product of mothers with GDM: it increases glucose transport to the fetus, adiposity in the product and the risk of macrosomia [12]. Furthermore, during GDM, the Th1 and Th2 immune response is activated, causing a pro-inflammatory response that is partly responsible for the low-grade systemic inflammatory state [13,14,15]. The secretion of pro-inflammatory Th1 cytokines such as Interferon-γ (IFN-γ), Interleukin 2 (IL-2) and Tumor Necrosis Factor-α (TNF-α) increases, reducing the Th2 response, mainly at the time of implantation and childbirth [16]. There is evidence that pro-inflammatory cytokines alter insulin signaling and inhibit its release by the beta cells of the pancreas [15], causing insulin resistance due to a decrease in the activity of the tyrosine kinase of the IR, which increases serine phosphorylation of Insulin Receptor Substrate 1 (IRS-1) [17].
On the other hand, the hyperglycemic and hyper lipemic environment that surrounds the embryo reduces the antioxidant capacity and generates oxidizing substances such as reactive oxygen species (ROS) that damage the structure of bioactive molecules, altering their functionality [18]. In patients with GDM, oxidant stress (OxS) has implications for the mother, placental function, and fetal well-being [19]; these complications are associated with the formation of advanced glycation end products (AGEs) [20] because ROS inhibit glucose uptake by phosphorylation of ISR-1, which prevents the expression of GLUT4 receptors in the cell membrane, favoring a hyperglycemic state in the body [21]. The objective of this study was to determine the impact of sucrose consumption during pregnancy on the metabolic, immune, and redox profile in females with GDM.
2. Materials and Methods
Study Design
The experimental model consisted of 24 CD1 female mice (10 weeks old, pathogen-free). The females were kept and manipulated in the Faculty of Medicine Bioterium of the Universidad Autónoma del Estado de México (UAEMéx) under the guidelines established by the Official Mexican Standard 062 [NOM-062-ZOO-199 Technical specifications for the production, care and use of laboratory animals] [22] and what is established in the ARRIVE (Animal Research: Reporting of In Vivo Experiments) standards for studies in animals [23]. The protocol was also approved by the Faculty’s Research Ethics Committee (CONBIOETICA-15-CEI-002-20210531). Females were fed a standard diet (Rodent Laboratory Chow 5001 from Purina [3.02 Kcal/g]), and water was administered ad libitum. Two females were housed per cage under controlled conditions at 19–21oC with 12-h light/dark cycles.
At the end of gestation (between days 23 and 26), once the females had given birth to the pups, they were sacrificed by the overdose of an inhaled anesthetic method using an ether chamber in an extraction hood, as established in the NOM- 062-ZOO-199 section 9.4.1.2.1. The procedure was carried out during the first 6 h after the birth of the pups. Once sacrificed, a whole blood sample was collected intracardially with a heparinized syringe. The total volume obtained per female was 2 mL. Of the whole blood, 1 mL was used to obtain peripheral lymphocytes [24] for the identification of cellular phenotypes and intracellular cytokines using the method previously described by Gutiérrez-Pliego et al. [25] with some modifications. The rest of the samples were centrifuged for 10 min at 2500 rpm to separate the two phases of the blood. Using a Pasteur pipette, the serum was collected and transferred to microcentrifuge tubes for subsequent processing to determine hormonal, metabolic and humoral parameters and redox capacity [24].
Study Groups
Ten-week-old females were selected at random and distributed into four groups: 1) Control group without sucrose supplementation (CL (-) sucrose); 2) Control group with sucrose supplementation (CL (+) sucrose); 3) GDM group without sucrose supplementation (GDM (-) sucrose); and 4) GDM group with sucrose supplementation (GDM (+) sucrose).
Gestational Diabetes Mellitus Induction
Before generating the GDM, the females were mated; one male was placed for every two females. On the fifth day of mating and once pregnancy was confirmed with the presence of the vaginal plug, DM was induced at 8 am (Figure 1). To induce DM, ChemCruz® (Cat. No. 18883-66-4. Dallas, Texas. USA) brand Streptozotocin (U-9889) was administered in 0.5 M Citrate Buffer solution with 4.5 pH (VWR, Cat. No. J60024-AP. Ward Hill, Massachusetts. USA) subcutaneously with a previously standardized dose of 230 mg/Kg of weight. The diagnosis of DM was confirmed by applying the criteria established by the American Diabetes Association 2018 (ADA): sustained glucose concentration ≥ 200 mg/dL and the presence of polyphagia, polydipsia, and change in body weight [26].
Sucrose Supplementation
For the groups with sucrose supplementation, a solution of ultrapure water and sucrose was prepared at a concentration of 41.66 mg/mL considering the recommendations established in the Official Mexican Standard NOM-218-SSA1-2011 products and services [Non-alcoholic flavored beverages, their frozen products, concentrated products to prepare them and drinks added with caffeine. Specifications and sanitary provisions] [27]. A volume of 500 µL of the solution was administered to each female by oral deposition daily at 8:00 am from the confirmation of gestational diabetes until the end of pregnancy.
Calculation and Determination of Metabolic Parameters
Weight and BMI quantification: Weight was quantified with an Ohaus™ Triple Beam 700/800 Series mouse weighing scale (Cat. No. 2,729,439. Morris, New Jersey, USA) weekly from the beginning of sucrose supplementation until the end of gestation. To calculate the body mass index (BMI), the following formula was used:
Glycaemia Quantification: Blood glucose was quantified weekly with the One Touch® Brand Select Plus Flex Glucometer (Cat. No. AW06984804A. Zug, Switzerland) by capillary puncture in the tail vein at the beginning of sucrose supplementation and until the end of pregnancy.
Hormone and HOMA-IR Index: The concentrations of adiponectin, leptin, and insulin were quantified by Enzyme-Linked Immunosorbent Assay (ELISA) with commercial kits. For leptin and insulin, ENZO brand kits were used (leptin: Cat. No. ADI-900-119A; insulin: Cat. No. EZN-KIT141-000, Farmingdale, New York, USA) and for adiponectin, a commercial kit from Invitrogen (Cat. No. KMP0041, Vienna, Austria), following the supplier’s recommendations.
With the data obtained on insulin and glycemia, the HOMA Index (Homeostasis Model Assessment-Insulin Resistance Index) was calculated to determine the degree of insulin resistance using the following formula [28]:
Immunity Components Quantification
Percentage of immune cells and cytokine secretion: To count cell populations and secretion of cytokines in peripheral blood, monoclonal antibodies directly conjugated with fluorochromes from the Becton Dickinson brands were used: CD3 (PE, Cat. No. 553063 Franklin Lake, New Jersey, USA) and CD8 (APC, Cat. No. 553035, Franklin Lake, New Jersey, USA); from BioLegend: CD4 (PerCP, Cat. No. 100538, San Diego, California, USA), IL-1β (FITC, Cat. No. 506907, San Diego, California, USA), IL-6 (APC, Cat. No. 504504, San Diego, California, USA), IFG-γ (FITC, Cat. No. 505806, San Diego, California, USA), and TNF-α (PE, Cat. No. 506306, San Diego, California, USA). The reading was performed on a Becton Dickinson FACS Aria Flow Cytometer, counting 100,000 events per tube; the data were processed with Summit software.
Immunoglobulin concentration in serum: The humoral activity was determined by quantification of specific antibodies using the ELISA method previously described by Carrizales et al. [29], using the following antibodies: Goat Anti Mouse IgA HRP of the brand US Biological (Cat. No. I1890-21, Salem, Massachusetts, USA) and Peroxidate Conjugated Goat IgG fraction to Mouse (Cat. No. 55553, Solon, Ohio, USA).
Redox Capacity Quantification
In the case of the reduction systems, they were quantified with commercial kits from the QuantiChrom™ brand: total antioxidant capacity (Cat. No. DTAC-100, Hayward, California, USA) and reduced glutathione (Cat. No. DIGT-250, Hayward, California, USA); of brand EnzyChrom™ were used catalase kits (Cat. No. ECAT-100, Hayward, California, USA) and Superoxide Dismutase (Cat. No. ESOD-100, Hayward, California, USA) following the manufacturer’s recommendations.
In the case of oxidation systems, the production of reactive species of thiobarbituric acid was quantified with a commercial kit from the QuantiChrom™ brand (Cat. No. DTBA-100, Hayward, California, USA) to quantify advanced glycation end products, the Carbonylated Proteins method was used [30].
Statistical Analysis
The data were expressed as measures of central tendency. Data normality was assessed using the Shapiro-Wilk test. To compare the differences between groups, the homogeneous results were analyzed by means of one-way analysis of variance (ANOVA) with Tukey’s HSD post hoc test for independent samples. For non-homogeneous variables, the Kruskal Wallis statistic with the Games-Howell post hoc test was used to identify differences between groups. The analyses were performed with the statistical software Statistical Package for the Social Sciences (SPSS, version 19.0; SPSS Inc., Chicago, IL, USA). A value of P < 0.05 was considered statistically significant.
3. Results
Morphometric Values and Glycemia
At the beginning of the 10th week of the life of the females, with confirmation of the diagnosis of GDM, and the start of sucrose supplementation, weight and BMI were determined: CL (-) sucrose (Weight: 30.72 ± 1.91 g, BMI: 0.307 ± 0.02 g/cm2), CL (+) sucrose (Weight: 28.3 ± 0.11 g, BMI: 0.272 ± 0.01 g/cm2), GDM (-) sucrose (Weight: 24.28 ± 2.55 g, BMI: 0.221 ± 0.03 g/cm2), GDM (+) sucrose (Weight: 28.5 ± 1.34 g, BMI: 0.265 ± 0.01 g/cm2). At the end of gestation, the GDM (-) sucrose group showed the lowest weight and BMI (P ˂ 0.001 and P < 0.001 respectively), followed by the GDM (+) sucrose group, and the CL (+) sucrose, compared to the CL (-) sucrose group (P < 0.001) (Table 1).
Table 2 and Glycaemia (mg/dL) at the end of pregnancy (between day 23 or 26 age of female). For homogeneous data, one-way ANOVA was performed and for glycaemia (non-homogeneous data), the non-parametric Kruskal Wallis test was performed to compare the differences between groups. In both cases, the differences were considered statistically significant with a P value < 0.05*. Control without Sucrose supplementation (CL –Sucrose), CL with Sucrose supplementation (CL +Sucrose), Gestational Diabetes Mellitus without Sucrose supplementation (GDM –Sucrose), Gestational Diabetes Mellitus with Sucrose supplementation (GDM +Sucrose). The samples were obtained on days between 23 and 26 age of the females, end of supplementation and birth of the pups.
The median blood glucose concentration in all groups prior to the induction of GDM was 140 mg/dL. Once sucrose supplementation began (10-week-old females) and pregnancy was confirmed, significant differences were found between the groups (P < 0.001), with a median glycemia of: CL (-) sucrose 155 mg/ dL, CL (+) sucrose 146.5 mg/dL, GDM (-) sucrose 533 mg/dL, and GDM (+) sucrose 600 mg/dL. At the end of pregnancy, significant differences were found between the groups (P < 0.001); the highest glycemia values were found in the GDM (+) sucrose group, followed by the GDM (-) sucrose group; the CL (+) sucrose group showed significantly elevated glycemia (P < 0.001) compared to the CL (-) sucrose group, although not as high as the groups with GDM (Table 1).
Metabolic Parameters
Insulin, Adiponectin, Leptin and HOMA-IR Index
The concentrations of insulin (P = 0.994) and adiponectin (P = 0.175) did not show significant differences, either at the beginning nor at the end of supplementation and gestation (Table 2). The HOMA-IR at the beginning also shows no differences (P = 0.062); however, at the end of gestation, the GDM (-) sucrose and GDM (+) sucrose groups increased significantly (post hoc Tukey, P < 0.001), compared to the CL (-) sucrose and CL (+) sucrose groups (Table 2). Leptin, on the other hand, did show differences between the groups at the beginning (P < 0.001) and at the end of pregnancy and supplementation (P < 0.003). At the beginning of the experiment, the CL (+) sucrose group showed the highest concentration of leptin, followed by the group with GDM (+) sucrose. At the end of the experiment, the CL (+) sucrose group continued with high concentrations of leptin, in contrast to the GDM (-) sucrose group, which showed the lowest values of this hormone (Table 2).
Immune Parameters
Percentage of T lymphocytes: T lymphocyte populations were quantified. TCD3+ lymphocytes increased (P < 0.004) in the groups that were supplemented with sucrose (CL (+) sucrose and GDM (+) sucrose), with no changes in the GDM (-) sucrose group, compared to the CL (-) sucrose. In the TCD3+/CD4+ lymphocyte population, a significant decrease (P < 0.001) was observed in the CL (+) sucrose and GDM (+) sucrose groups, compared to the CL (-) sucrose and GDM (-) sucrose groups (Table 3). In contrast, TCD3+CD8+ lymphocytes increased significantly (P < 0.001) only in the CL (+) sucrose group, compared to the CL –sucrose groups and both GDM groups with and without sucrose consumption (Table 3).
Regarding the expression of interleukins, Interleukin 1β (IL-1β) increased exponentially in the CL (+) sucrose, GDM (-) sucrose, and GDM (+) sucrose groups, compared to the CL (-) sucrose group (P < 0.001) (Table 3). In the case of Interleukin 6 (IL-6), the values of the groups that consumed sucrose (CL (+) sucrose and GDM (+) sucrose) were high (P < 0.001) in contrast to the CL (-) sucrose group (Table 3). The behavior of the cytokines INF-γ and TNF-α were found to be significantly elevated (P < 0.001 and P < 0.001, respectively) in the GDM (+) sucrose group (Table 3).
Serum immunoglobulins: Immunoglobulins A (IgA) and G (IgG) were quantified. Absorbance determinations were carried out at a wavelength of 492 nm with a protein concentration of 25 µg/mL for each sample. For IgA, the highest concentration was quantified in the GDM (-) sucrose group (P < 0.002), followed by the GDM (+) sucrose group compared to the CL (+) sucrose and CL (-) sucrose groups. In contrast, IgG increased significantly (P < 0.017) in the GDM (-) sucrose group, followed by the CL (+) sucrose and GDM (+) sucrose groups, compared to the CL (-) sucrose group (Table 3).
Redox Activity
Antioxidants Parameters: The antioxidant systems were altered, except for catalase, which did not show differences (P < 0.138) between the groups. Total Antioxidant Capacity was elevated in the GDM (+) sucrose groups, followed by the CL (+) sucrose and CL (-) sucrose group, compared to the CL (-) sucrose group (P <0.025). The Superoxide Dismutase enzyme was elevated in the GDM (+) sucrose and GDM (-) sucrose groups, decreasing in the CL (+) sucrose group (P < 0.019). Finally, the activity of the enzyme Glutathione Reductase decreased in all groups (P < 0.049) (Table 4).
Oxidants Parameters
Contrary to the antioxidant capacity, the oxidant systems were modified with sucrose supplementation. An increase in advanced glycation end products (AGE) was observed in the GDM (+) sucrose and CL (+) sucrose groups, with a decrease in these in the CL (-) sucrose group (P < 0.001). On the other hand, the production of Thiobarbituric Acid Reactive Species (TBARS) increased in the GDM (-) sucrose group but was reduced in the CL (+) sucrose and CL (-) sucrose groups (P < 0.006), as shown in Table 4.
4. Discussion
Pregnancy is a transitory state characterized by adaptive and compensatory changes that respond to the specific needs of each trimester of gestation [31]. In this process, there is an increase in adipose tissue mediated by the release of placental hormones, which progressively decreases insulin sensitivity as the pregnancy progresses, up to approximately 60% in the second trimester of pregnancy [32]. Glucose metabolism also undergoes modifications as gestation progresses and the energy needs of the fetus progress [33]; at the beginning, fasting glucose concentrations may decrease due to the increase in maternal volume, a situation that is reversed when maternal adipose tissue reserves increase, increasing the risk of GDM [34]. This metabolic condition brings with it an increase in comorbidities in both the mother and the fetus [35]; in the case of the mother, it increases the risk of hypertension, preeclampsia, the incidence of cesarean sections and premature birth [36]; in the fetus, the risk of dystocia, respiratory distress syndrome, jaundice, and neonatal hyperglycemia increases [37].
Changes in Weight and BMI Related to GDM
Weight gain during pregnancy is determined by the trimester of gestation and the mother’s food intake; carbohydrates represent the main source of energy for the pregnant mother [38]. Particularly simple carbohydrates are related to an accelerated increase in blood glucose after ingestion, consequently causing marked postprandial hyperglycemia [39].
There is no conclusive data regarding the intake of simple carbohydrates and weight gain during pregnancy. On the contrary, it has been reported in patients with gestational diabetes that weight gain is lower compared to patients without diabetes, which may be related to the birth weight of the product [40]. The findings of this study show a similar behavior; both the groups with GDM and the control group supplemented with sucrose showed less weight gain than the control group without supplementation. The BMI was also lower in the sucrose-supplemented groups exposed to high glucose loads, which generated hyperglycemic states (Table 1).
Insulin Resistance and GDM
Insulin resistance is determined by several factors, including age, race, BMI, and (for women) the number of births [41]. During pregnancy, it has been reported that an increase of 5 kg of weight can generate an increase in HOMA-IR, which suggests that the higher the BMI, the greater the insulin resistance during pregnancy [42,43].
In GDM, insulin resistance is closely related to deficient insulin secretion by the pancreatic beta cells and adipose tissue of the pregnant woman [44]. Insulin secretion associated with postprandial glucose has been compared in patients with GDM, normal weight and obesity with patients without GDM and healthy pregnancy; the results show that patients with GDM and obesity had an increase in insulin levels and resistance to it, while thin patients or patients with normal weight even with GDM showed low insulin concentrations, even with lower values than the group with healthy pregnancy [45,46]. The findings of this study correspond to these reports; the results show greater insulin resistance in the groups with GDM independent of weight or BMI. Even with sucrose supplementation, the impact was not significant on insulin secretion; the non-GDM group supplemented with sucrose showed the lowest insulin concentration at the end of the study. These results may support the adaptive changes that occur during pregnancy in response to insulin resistance, where the size of the pancreas increases due to the change in the mass and functionality of pancreatic beta cells [47], with the aim of coping with the insulin resistance and trying to maintain plasma glucose under normal conditions, revealing a marked neogenesis of beta cells in the islets of Langerhans [48].
Inoue et al. [49] compared insulin secretion and insulin resistance in thin women with GDM and thin women without GDM; their findings reaffirm the theory of adaptive changes in pancreatic beta cells. They found that women with GDM had lower insulin sensitivity. However, the group without GDM did not show significant changes [49].
Metabolic Changes During GDM
Insulin resistance and sensitivity are not the only metabolic changes related to GDM. Pregnancy triggers metabolic stress characterized by the modification of adipose tissue, responsible for producing adiponectin and leptin, hormones responsible for the process of hunger and satiety, essential for regulating energy reserve needs [50]. Adiponectin participates in energy regulation and plays an important role in regulating the immune response. Some studies report that macrophages can express adiponectin, which can modulate both the metabolism in distal tissues and the inflammatory response [51,52]. In clinical studies with animal models of GDM, an inverse correlation of adiponectin has been observed, with a decrease in the hormone, but an increase in TNF-α and Interleukin 6 [53]; In addition, a lower concentration of adiponectin can enhance insulin resistance [54,55].
On the other hand, leptin is released by healthy adipose tissue to control the satiety stimulus at the hypothalamic level [56]. During pregnancy, the placenta takes on a leading role in the production of leptin to promote the passage of amino acids to the fetus [57]. At the beginning of pregnancy, leptin levels rise to regulate gonadotropin-releasing hormone and promote embryo implantation. growth, development, and organ formation of the fetus [58]. It has been observed that leptin concentrations are high in the presence of gestational diabetes mellitus but decrease as pregnancy progresses; it has been reported that patients with gestational diabetes have higher leptin concentrations than patients without GDM [59]. The metabolic changes found in this study showed a decrease in both hormones in the groups with GDM, mainly leptin, where there was a marked reduction in secretion. By relating these results to insulin resistance, it is understood why the groups with GDM, despite having a low BMI, had a higher HOMA-IR index than the control groups.
Immune Response in GDM
The immune system undergoes modifications from the early phase of pregnancy until the moment of delivery since there must be a balance between the different components to avoid rejection of the product [60]. It is known that hyperglycemia in the presence or absence of pregnancy causes dysfunction of the immune system since it negatively affects neutrophil chemotaxis, amplifies the inflammatory response of macrophages, and decreases phagocytic function. This situation worsens when there is a combination of pregnancy and GDM, increasing the risk of infection and comorbidities in these patients [61,62].
There is evidence of infiltration of CD8+ and CD4+ T cells in visceral adipose tissue, which produces inflammation and activates M1 macrophages, causing the secretion of pro-inflammatory cytokines TNF-α and IL-6, increasing insulin resistance in GDM [63]. Other reports report an increase in the expression of the Th1 transcription factor and the production of cytokines IL-2 and INF-γ in women with obesity and GDM, confirming that the inflammatory state in this metabolic condition is caused by an imbalance in the Th1/Th2/ Treg ratio [64,65]. Based on these reports, it is confirmed that the pro-inflammatory response derived from the hyperglycemic state during GDM can be exacerbated by the ingestion of simple sugars such as sucrose. In this study, we found that the percentage of CD3+/CD8+ lymphocytes and the production of pro-inflammatory cytokines were higher in the groups with sucrose consumption (CL (+) sucrose) and gestational diabetes mellitus (+) sucrose, which may indicate an effect of sucrose on the immune system immune, although not directly related to GDM.
Changes in Humoral Response During GDM
B lymphocytes are responsible for the production of antibodies, provide specific protection against antigens, and participate in the genesis of autoimmune inflammatory diseases [66]. It has been shown that obesity and hyperglycemia directly affect the production of antibodies and promote insulin resistance [67]. In obese mice, the production of Immunoglobulin G (IgG) is greater than in lean mice, which suggests that it is involved in the regulation of insulin resistance through the function of macrophages infiltrated in visceral adipose tissue [68,69].
In another study, the antibody parameters of 124 pregnancies with GDM and 168 pregnancies without diabetes were analyzed by flow cytometry. The authors reported a significantly higher percentage of B lymphocytes in pregnancies with GDM and high production of IgA compared to pregnancies without GDM [70].
On the other hand, elevated IgA levels have also been related to adipose tissue inflammation and glucose homeostasis, participating in insulin resistance related to obesity and overweight [71]. Available data have focused primarily on circulating B lymphocyte (BL) populations during GDM, with little emphasis on T lymphocyte populations. In this sense, a marked increase in BL has been found to be positively associated with insulin resistance and elevated IgA production [72].
The findings of this study are similar to previous reports regarding antibody production during gestational diabetes. However, it was found that more than hyperglycemia, sucrose consumption in females with GDM and the CL (+) sucrose group was responsible for the increase in IgA and IgG antibody secretion. Particularly in the CL (+) sucrose and DMG (+) sucrose groups, IgG increased very significantly. However, there is still little information regarding changes in the humoral or cellular immune status in patients with GDM and their relationship with the consumption of simple carbohydrates prior to pregnancy and during pregnancy, as well as their influence on the diagnosis and its complications.
Modifications of Redox Mechanisms During GDM
Hyperglycemic states can trigger many metabolic disorders related to oxidative stress [73]. For example, they alter the balance of redox systems by activation of the enzyme NADPH oxidase, production of advanced glycation of proteins and lipids, activation of Protein Kinase C or by the genesis of glycosaminoglycans [74]. The effect of oxidative stress is important in the structural changes of proteins, lipids, and even nucleic acids [75]. ROS can oxidize low-density lipoproteins (LDL) and cause endothelial damage through the action of the adhesion molecules ICAM-1 and VCAM-1 [76]. This ROS production is further intensified when there is a high intake of sucrose. It has been reported that in animal models fed with diets high in sucrose, the production of ROS increases due to accelerated oxidation in hepatocytes and antioxidant processes in the blood are decreased [77,78,79]. Another study reported that diets rich in sucrose produced an initial antioxidant response mediated by an increase in the activity of enzymes: superoxide dismutase (SOD), catalase and glutathione peroxidase (GPx); however, with chronic consumption of sucrose, after 8 weeks, an opposite effect was observed, the enzymes SOD and catalase reduced the antioxidant response, with a lighter effect on GPx [80].
The consumption of a diet rich in sucrose for 2 weeks causes an increase in the production of TBARS as an indicator of lipid peroxidation, with a reduction in SOD without changes in the action of GPx; these results indicate that high sucrose intake causes imbalance in redox systems even in the short term, which translates into the generation of oxidant stress [81]. In this study, it was observed that the presence of hyperglycemia, as well as sucrose ingestion, increased the total antioxidant capacity and the activity of SOD, with minimal changes in the activity of catalase and a decrease in the activity of Glutathione Reductase. The data are consistent with these oxidation mechanisms coupled with prolonged sucrose consumption that increases the production of TBARS and AGEs regardless of the presence of GDM; even the generation of AGEs was lower in the group with diabetes without supplementation than in the rest of our study groups.
5. Conclusions
GDM is closely related to a low-grade inflammatory process. Pregnancy per se entails a series of adaptive changes; when these changes are exceeded, metabolic, immunological and redox state modifications are triggered. High sucrose consumption is a determining factor in the exacerbation and maintenance of these adverse effects. If consumption is added to the presence of GDM, the damage to the pregnant patient and the product is magnified. In this sense, the alteration in the secretion of adiponectin and leptin was confirmed with an increase in the inflammatory response mediated mainly by TCD8+ lymphocytes with the consequent production of pro-inflammatory cytokines.
Furthermore, a compensatory humoral response is seen through the production of IgA and IgG antibodies, with alteration of the Redox mechanisms, therefore generating a state of oxidative stress with the consequent production of AGEs and TBARS. Together, this condition increases comorbidities during pregnancy and directly affects the growth and development of the child. It is necessary, however, to determine if these changes are maintained after delivery in both the mother and the child and if the humoral response generates specific antibodies against hyperglycemia.
Author Contributions
Conceptualization, B.E.M.C. and C.A.R.G.; methodology, B.E.M.C. and C.A.R.G.; formal analysis, A.A.R.A. and I.M.A.M.; investigation, C.A.R.G. and E.A.R.; writing—original draft preparation, B.E.M.C. and C.A.R.G.; writing—review and editing, B.E.M.C., C.A.R.G., A.L.G.L., A.A.R.A. and I.M.A.M. All authors have read and agreed to the published version of the manuscript.
Funding
This research received no external funding. The research was carried out as part of the authors’ employment at the Universidad Autónoma del Estado de México, UAEMéx.
Institutional Review Board Statement
The females were kept and manipulated in the Faculty of Medicine Bioterium of the Universidad Autónoma del Estado de México (UAEMéx) under the guidelines established by the Official Mexican Standard 062 [NOM-062-ZOO-199 Technical specifications for the production, care and use of laboratory animals] [22] and what is established in the ARRIVE (Animal Research: Reporting of In Vivo Experiments) standards for studies in animals [23]. The protocol was also approved by the Faculty’s Research Ethics Committee (CONBIOETICA-15-CEI-002-20210531).
Data Availability Statement
The data is available, if necessary, send a request via email to the corresponding author.
Acknowledgments
To the National Council of Humanities, Science and Technology (CONAHCYT), for the scholarship awarded to the doctoral student to carry out the project.
Conflicts of Interest
The authors declare no conflicts of interest.
References
- Kanguru L, Bezawada N, Hussein J, Bell J. The burden of diabetes mellitus during pregnancy in low- and middle-income countries: a systematic review. Glob Health Action. 2014; 7: 23987. [CrossRef]
- Silva-Zolezzi I, Samuel TM, Spieldenner J. Maternal nutrition: opportunities in the prevention of gestational diabetes. Nutr Rev. 2017; 75(1): 32-50. [CrossRef]
- International Diabetes Federation. IDF Diabetes Atlas, 8th edition. Brussels, Belgium: International Diabetes Federation, 2017 [Consultado 2020 Jul 20] Available in: http://www.diabetesatlas.org.
- Moon JH, Kwak SH, Jang HC. Prevention of type 2 diabetes mellitus in women with previous gestational diabetes mellitus. Korean J Intern Med. 2017; 32(1): 26-41. [CrossRef]
- American Diabetes Association Professional Practice Committee. 2. Classification and Diagnosis of Diabetes: Standards of Medical Care in Diabetes-2022. Diabetes Care. 2022; 45(Suppl 1): S17-S38. [CrossRef]
- Ye W, Luo C, Huang J, Li C, Liu Z, Liu F. Gestational diabetes mellitus and adverse pregnancy outcomes: systematic review and meta-analysis. BMJ. 2022; 377: e067946. [CrossRef]
- Greco E, Calanducci M, Nicolaides KH, Barry EVH, Huda MSB, Iliodromiti S. Gestational diabetes mellitus and adverse maternal and perinatal outcomes in twin and singleton pregnancies: a systematic review and meta-analysis. Am J Obstet Gynecol. 2024; 230(2): 213-225. [CrossRef]
- Ornoy A, Becker M, Weinstein-Fudim L, Ergaz Z. Diabetes during Pregnancy: A Maternal Disease Complicating the Course of Pregnancy with Long-Term Deleterious Effects on the Offspring. A Clinical Review. Int J Mol Sci. 2021; 22(6):2965. [CrossRef]
- Trumbo P, Schlicker S, Yates AA, Poos M. Food and Nutrition Board of the Institute of Medicine, The National Academies. Dietary reference intakes for energy, carbohydrate, fiber, fat, fatty acids, cholesterol, protein and amino acids. J Am Diet Assoc. 2002; 102(11): 1621-30. [CrossRef]
- Petersohn I, Hellinga AH, van Lee L, Keukens N, Bont L, Hettinga KA, et al. Maternal diet and human milk composition: an updated systematic review. Front Nutr. 2024; 10: 1320560. [CrossRef]
- Lovegrove A, Edwards CH, De Noni I, Patel H, El SN, Grassby T, et al. Role of polysaccharides in food, digestion, and health. Crit. Rev. Food Sci Nutr. 2017; 57(2): 237-253. [CrossRef]
- Mustad VA, Huynh DT, López-Pedrosa JM, Campoy C, Rueda R. The role of dietary carbohydrates in Gestational Diabetes. Nutrients. 2020; 12(2): 385. [CrossRef]
- Lekva T, Norwitz ER, Aukrust P, Ueland T. Impact of systemic inflammation on the progression of gestational diabetes mellitus. Curr Diab Rep. 2016; 16(4): 26. [CrossRef]
- Richardson AC, Carpenter MW. Inflammatory mediators in gestational diabetes mellitus. Obstet Gynecol Clin North Am. 2007; 34(2): 213-224. [CrossRef]
- Saito S, Nakashima A, Shima T, Ito M: Th1/Th2/Th17 and regulatory T-Cell paradigm in pregnancy. Am J Reprod Immunol. 2010; 63(6): 601-10. [CrossRef]
- Mor G. Introduction to the immunology of pregnancy. Immunol Rev. 2022; 308(1): 5 - 8. [CrossRef]
- Barbour LA, McCurdy CE, Hernandez TL, Kirwan JP, Catalano PM, Friedman JE. Cellular mechanisms for insulin resistance in normal pregnancy and gestational diabetes. Diabetes Care 2007; 30 (2): S112-9. [CrossRef]
- Kim JH, Bachmann RA, Chen J. Interleukin-6 and insulin resistance. Vitam. Horm. 2009; 80: 613-33. [CrossRef]
- Kirwan JP, Hauguel-De Mouzon S, Lepercq J, Challier JC, Huston-Presley L, Friedman JE, et al. TNF-alpha is a predictor of insulin resistance in human pregnancy. Diabetes 2002; 51: 2207-2213. [CrossRef]
- Khalid M, Petroianu G, Adem A. Advanced Glycation End Products and Diabetes Mellitus: Mechanisms and Perspectives. Biomolecules. 2022; 12(4): 542. [CrossRef]
- Harsem NK, Braekke K, Torjussen T, Hanssen K, Staff AC. Advanced glycation end products in pregnancies complicated with diabetes mellitus or preeclampsia. Hypertense Pregnancy. 2008; 24(8): 374-86. [CrossRef]
- [NOM-062-ZOO-1999]. Diario Oficial de la Federación, México. 15. Organización Mundial de Sanidad Animal. Available in: https://www.gob.mx/cms/uploads/attachment/file/203498/NOM-062-ZOO-1999_220801.pdf.
- Percie du Sert N, Hurst V, Ahluwalia A, Alam S, Avey MT, Baker M, et al. The ARRIVE guidelines 2.0: Updated guidelines for reporting animal research. Br J Pharmacol. 2020; 177(16): 3617-3624. [CrossRef]
- Martínez-Carrillo BE, Rosales-Gómez CA, Ramírez-Durán N, Reséndiz-Albor AA, Escoto-Herrera JA, Mondragón-Velásquez T, et al. Effect of Chronic Consumption of Sweeteners on Microbiota and Immunity in the Small Intestine of Young Mice. Int J Food Sci. 2019: 9619020. [CrossRef]
- Gutiérrez-Pliego LE, Martínez-Carrillo BE, Reséndiz-Albor AA, Arciniega-Martínez IM, Escoto-Herrera JA, Rosales-Gómez CA, et al. Effect of Supplementation with n-3 Fatty Acids Extracted from Microalgae on Inflammation Biomarkers from Two Different Strains of Mice. J Lipids. 2018:4765358. [CrossRef]
- ElSayed NA, Aleppo G, Aroda VR, Bannuru RR, Brown FM, Bruemmer D, et al. on behalf of the American Diabetes Association. 2. Classification and Diagnosis of Diabetes: Standards of Care in Diabetes-2023. Diabetes Care. 2023; 46(Suppl 1): S19-S40. [CrossRef]
- Rosales-Gómez CA, Martínez-Carrillo BE, Reséndiz-Albor AA, Ramírez-Durán N, Valdés-Ramos R, Mondragón-Velásquez T, et al. Chronic Consumption of Sweeteners and Its Effect on Glycaemia, Cytokines, Hormones, and Lymphocytes of GALT in CD1 Mice. Biomed Res Int. 2018. 1345282. [CrossRef]
- Vilela BS, Vasques AC, Cassani RS, Forti AC, Pareja JC, Tambascia MA, et al. The HOMA-Adiponectin (HOMA-AD) Closely Mirrors the HOMA-IR Index in the Screening of Insulin Resistance in the Brazilian Metabolic Syndrome Study (BRAMS). PLoS One. 2016; 11(8): e0158751. [CrossRef]
- Carrizales-Luna JE, Reséndiz-Albor AA, Arciniega-Martínez IM, Gómez-López M, Campos-Rodríguez R, Pacheco-Yépez J, et al. Outcomes of nicotinic modulation on markers of intestinal IgA antibody response. Biomed Rep. 2022. 18(2): 13. [CrossRef]
- García-Iniesta L, Martínez-Carrillo BE, Valdés-Ramos R, Jarillo-Luna RA, Escoto-Herrera JA, Reséndiz-Albor AA. Relationship between Prolonged Sweetener Consumption and Chronic Stress in the Production of Carbonylated Proteins in Blood Lymphocytes. EJNFS. 2017. 7(4): 220-232. [CrossRef]
- Soma-Pillay P, Nelson-Piercy C, Tolppanen H, Mebazaa A. Physiological changes in pregnancy. Cardiovasc J Afr. 2016; 27(2): 89-94. [CrossRef]
- Baz B, Riveline JP., Gautier JF. Endocrinology of Pregnancy: Gestational diabetes mellitus: Definition, aetiological and clinical aspects. Eur. J. Endocrinol. 2016; 174: R43-R51. [CrossRef]
- Chandra M, Paray AA. Natural Physiological Changes During Pregnancy. Yale J Biol Med. 2024; 97(1): 85-92. [CrossRef]
- Plows JF, Stanley JL, Baker PN, Clare MR, Vickers MH. The Pathophysiology of Gestational Diabetes Mellitus. Int. J. Mol. Sci. 2018; 19: 3342. [CrossRef]
- Ryckman KK, Borowski KS, Parikh NI, Saftlas AF. Pregnancy Complications and the Risk of Metabolic Syndrome for the Offspring. Curr Cardiovasc Risk Rep. 2013; 7(3): 217-223. [CrossRef]
- Xiang AH, Li BH, Black MH, Sacks DA, Buchanan TA, Jacobsen SJ, et al. Racial and ethnic disparities in diabetes risk after gestational diabetes mellitus. Diabetologia. 2011; 54: 3016-3021. [CrossRef]
- Pintaudi B, Fresa R, Dalfra M, Dodesini AR, Vitacolonna E, Tumminia A, et al. The risk stratification of adverse neonatal outcomes in women with gestational diabetes (STRONG) study. Acta Diabetol. 2018; 55: 1261-1273. [CrossRef]
- Mousa A, Naqash A, Lim S. Macronutrient and Micronutrient Intake during Pregnancy: An Overview of Recent Evidence. Nutrients. 2019; 11: 443. [CrossRef]
- Jovanovic-Peterson L, Peterson CM., Reed GF, Metzger BE, Mills JL, Knopp RH, et al. The National Institute of Child Health and Human Development—Diabetes in Early Pregnancy Study Maternal postprandial glucose levels and infant birth weight: The Diabetes in Early Pregnancy Study. Am. J. Obstet. Gynecol. 1991; 164:103-111. [CrossRef]
- Gou BH, Guan HM, Bi YX, Ding BJ. Gestational diabetes: weight gain during pregnancy and its relationship to pregnancy outcomes. Chin Med J (Engl). 2019; 132(2): 154-160. [CrossRef]
- Rayanagoudar G, Hashi AA, Zamora J, Khan KS, Hitman GA, Thangaratinam S. Quantification of the type 2 diabetes risk in women with gestational diabetes: A systematic review and meta-analysis of 95,750 women. Diabetologia. 2016; 59: 1403-1411. [CrossRef]
- Mat SHC, Yaacob NM, Hussain S. Rate of weight gain and its association with homeostatic model assessment-insulin resistance (HOMA-IR) among obese children attending Paediatric Endocrine Clinic, Hospital Universiti Sains Malaysia. J. ASEAN Fed. Endocr. Soc. 2021; 36: 149-155. [CrossRef]
- Duo Y, Song S, Zhang Y, Qiao X, Xu J, Zhang J, et al. Predictability of HOMA-IR for Gestational Diabetes Mellitus in Early Pregnancy Based on Different First Trimester BMI Values. J Pers Med. 2022; 13(1): 60. [CrossRef]
- Powe CE, Allard C, Battista MC, Doyon M, Bouchard L, Ecker JL, et al. Heterogeneous contribution of insulin sensitivity and secretion defects to gestational Diabetes Mellitus. Diabetes Care. 2016; 39(6): 1052-5. [CrossRef]
- Cheney C, Shragg P, Hollingsworth D. Demonstration of heterogeneity in gestational Diabetes by a 400-kcal breakfast meal tolerance test. Obstet Gynecol. 1985; 65(1): 17-23. https://pubmed.ncbi.nlm.nih.gov/3880878/.
- Hashemipour S, Zohal M, Modarresnia L, Kolaji S, Panahi H, Badri M, et al. The yield of early-pregnancy homeostasis of model assessment -insulin resistance (HOMA-IR) for predicting gestational diabetes mellitus in different body mass index and age groups. BMC Pregnancy Childbirth. 2023; 23(1): 822. [CrossRef]
- Rieck S, Kaestner KH. Expansion of beta-cell mass in response to pregnancy. Trends Endocrinol. Metab. 2010; 21: 151-158. [CrossRef]
- Usman TO, Chhetri G, Yeh H, Dong HH. Beta-cell compensation and gestational diabetes. J Biol Chem. 2023; 299(12): 105405. [CrossRef]
- Inoue S, Kozuma Y, Miyahara M, Yoshizato T, Tajiri Y, Hori D, et al. Pathophysiology of gestational Diabetes Mellitus in lean Japanese pregnant women in relation to insulin secretion or insulin resistance. Diabetol Int. 2020; 11: 269-73. [CrossRef]
- Štambuk T, Kifer D, Smirčić-Duvnjak L, Vučić Lovrenčić M, Gornik O. Associations between plasma protein, IgG and IgA N-glycosylation and metabolic health markers in pregnancy and gestational diabetes. PLoS One. 2023; 18(4): e0284838. [CrossRef]
- Luo N, Liu J, Chung BH, Yang Q, Klein RL, Garvey WT, et al. Macrophage Adiponectin Expression Improves Insulin Sensitivity and Protects Against Inflammation and Atherosclerosis. Diabetes. 2010; 59: 791-799. [CrossRef]
- McElwain CJ, McCarthy FP, McCarthy CM. Gestational Diabetes Mellitus and Maternal Immune Dysregulation: What We Know So Far. Int J Mol Sci. 2021; 22(8): 4261. [CrossRef]
- Atègbo JM, Grissa O, Yessoufou A, Hichami A, Dramane KL, Moutairou K, et al. Modulation of Adipokines and Cytokines in Gestational Diabetes and Macrosomia. J. Clin. Endocrinol. Metab. 2006; 91: 4137-4143. [CrossRef]
- Christian LM, Porter K. Longitudinal changes in serum proinflammatory markers across pregnancy and postpartum: Effects of maternal body mass index. Cytokine. 2014; 70: 134-140. [CrossRef]
- Moyce Gruber BL, Dolinsky VW. The Role of Adiponectin during Pregnancy and Gestational Diabetes. Life (Basel). 2023; 13(2): 301. [CrossRef]
- Pérez-Pérez A., Vilariño-García T., Guadix P., Dueñas J.L., Sánchez-Margalet V. Leptin and nutrition in gestational diabetes. Nutrients. 2020; 12: 1970. [CrossRef]
- De Gennaro G, Palla G, Battini L, Simoncini T, Del Prato S, Bertolotto A, et al. The role of adipokines in the pathogenesis of gestational diabetes mellitus. Gynecol. Endocrinol. 2019; 35: 737-751. [CrossRef]
- Bao W, Baecker A, Song Y, Kiely M, Liu S, Zhang C. Adipokine levels during the first or early second trimester of pregnancy and subsequent risk of gestational diabetes mellitus: A systematic review. Metabolism. 2015; 64: 756-764. [CrossRef]
- Xu J, Zhao YH, Chen YP, Yuan XL, Wang J, Zhu H, et al. Maternal circulating concentrations of tumor necrosis factor-alpha, leptin, and adiponectin in gestational diabetes mellitus: A systematic review and meta-analysis. Sci. World J. 2014; 2014: 926932. [CrossRef]
- Mor G, Cardenas I, Abrahams V, Guller S. Inflammation and pregnancy: The role of the immune system at the implantation site. Ann. N. Y. Acad. Sci. 2011; 1221: 80-87. [CrossRef]
- Berbudi A, Rahmadika N, Tjahjadi AI, Ruslami R. Type 2 diabetes and its impact on the immune system. Curr. Diabetes Rev. 2020; 16: 442-449. [CrossRef]
- Sheu A, Chan Y, Ferguson A, Bakhtyari MB, Hawke W, White C, et al. A proinflammatory CD4(+) T cell phenotype in gestational diabetes mellitus. Diabetologia. 2018; 61: 1633-1643. [CrossRef]
- Abell SK, De Courten B, Boyle JA, Teede HJ. Inflammatory and Other Biomarkers: Role in Pathophysiology and Prediction of Gestational Diabetes Mellitus. Int J Mol Sci. 2015; 16(6): 13442-73. [CrossRef]
- Sifnaios E, Mastorakos G, Psarra K, Panagopoulos ND, Panoulis K, Vitoratos N, et al. Gestational Diabetes and T-cell (Th1/Th2/Th17/Treg) immune profile. In Vivo. 2019; 33: 31-40. [CrossRef]
- Seck A, Hichami A, Doucouré S, Diallo Agne F, Bassène H, Ba A, et al. Th1/Th2 Dichotomy in Obese Women with Gestational Diabetes and Their Macrosomic Babies. J Diabetes Res. 2018; 2018: 8474617. [CrossRef]
- Winer DA, Winer S, Chng MH, Shen L, Engleman EG. B Lymphocytes in obesity-related adipose tissue inflammation and insulin resistance. Cell. Mol. Life Sci. 2014; 71: 1033-1043. [CrossRef]
- Nikolajczyk BS, Jagannathan-Bogdan M, Shin H, Gyurko R. State of the union between metabolism and the immune system in type 2 diabetes. Genes Immun. 2011; 12: 239-250. [CrossRef]
- Palming J, Gabrielsson BG, Jennische E, Smith U, Carlsson B, Carlsson LM, et al. Plasma cells and Fc receptors in human adipose tissue--lipogenic and anti-inflammatory effects of immunoglobulins on adipocytes. Biochem. Biophys. Res. Commun. 2006; 343: 43-48. [CrossRef]
- Liang W, Qi Y, Yi H, Mao C, Meng Q, Wang H, et al. The Roles of Adipose Tissue Macrophages in Human Disease. Front Immunol. 2022; 13: 908749. [CrossRef]
- Zhuang Y, Zhang J, Li Y, Gu H, Zhao J, Sun Y, et al. B Lymphocytes Are Predictors of Insulin Resistance in Women with Gestational Diabetes Mellitus. Endocr Metab Immune Disord Drug Targets. 2019; 19(3): 358-366. [CrossRef]
- Luck H, Khan S, Kim JH, Copeland JK, Revelo XS, Tsai S, et al. Gut-associated IgA+ immune cells regulate obesity-related insulin resistance. Nat Commun. 2019; 10(1): 3650. [CrossRef]
- Štambuk T, Kifer D, Smirčić-Duvnjak L, Vučić Lovrenčić M, Gornik O. Associations between plasma protein, IgG and IgA N-glycosylation and metabolic health markers in pregnancy and gestational diabetes. PLoS One. 2023; 18(4): e0284838. [CrossRef]
- Nishikawa T, Edelstein D, Du XL, Yamagishi S, Matsumura T, Kaneda Y, et al. Normalizing mitochondrial superoxide production blocks three pathways of hyperglycaemic damage. Nature. 2000; 404: 787-790. [CrossRef]
- Sadowska J, Dudzińska W, Dziaduch I. Effects of different models of sucrose intake on the oxidative status of the uterus and ovary of rats. PLoS One. 2021; 16(5): e0251789. [CrossRef]
- Saucedo R, Ortega-Camarillo C, Ferreira-Hermosillo A, Díaz-Velázquez MF, Meixueiro-Calderón C, Valencia-Ortega J. Role of Oxidative Stress and Inflammation in Gestational Diabetes Mellitus. Antioxidants (Basel). 2023; 12(10): 1812. [CrossRef]
- Batty M, Bennett MR, Yu E. The Role of Oxidative Stress in Atherosclerosis. Cells. 2022; 11(23): 3843. [CrossRef]
- Maciejczyk M, Matczuk J, Żendzian-Piotrowska M, Niklińska W, Fejfer K, Szarmach I, et al. Eight-Week Consumption of High-Sucrose Diet Has a Pro-Oxidant Effect and Alters the Function of the Salivary Glands of Rats. Nutrients. 2018; 10: 1530. [CrossRef]
- Sadowska J, Dudzińska W, Skotnicka E, Sielatycka K, Daniel I. The impact of a diet containing sucrose and systematically repeated starvation on the oxidative status of the uterus and ovary of rats. Nutrients. 2019; 11: 1544. [CrossRef]
- Gasparini PVF, Matias AM, Torezani-Sales S, Kobi JBBS, Siqueira JS, Corrêa CR, et al. High-Fat and Combined High-Fat and Sucrose Diets Promote Cardiac Oxidative Stress Independent of Nox2 Redox Regulation and Obesity in Rats. Cell Physiol Biochem. 2021; 55(5): 618-634. PMID: 34705355. [CrossRef]
- Jarukamjorn K, Jearapong N, Pimson C, Chatuphonprasert W. A High-Fat, High-Fructose Diet Induces Antioxidant Imbalance and Increases the Risk and Progression of Nonalcoholic Fatty Liver Disease in Mice. Scientifica. 2016; 2016: 5029414. [CrossRef]
- Busserolles J, Rock E, Gueux E, Mazur A, Grolier P, Rayssiguier Y. Short-term consumption of a high-sucrose diet has a pro-oxidant effect in rats. Br J Nutr. 2002; 87: 337-342. [CrossRef]
Figure 1.
Experimental design for induction and follow-up of Gestational Diabetes Mellitus (GDM). It is shown from the beginning to the end of pregnancy. Once GDM was induced, glycaemia, weight, food intake and daily water consumption were monitored to establish clinical signs of *GDM and corroborate the diagnosis.
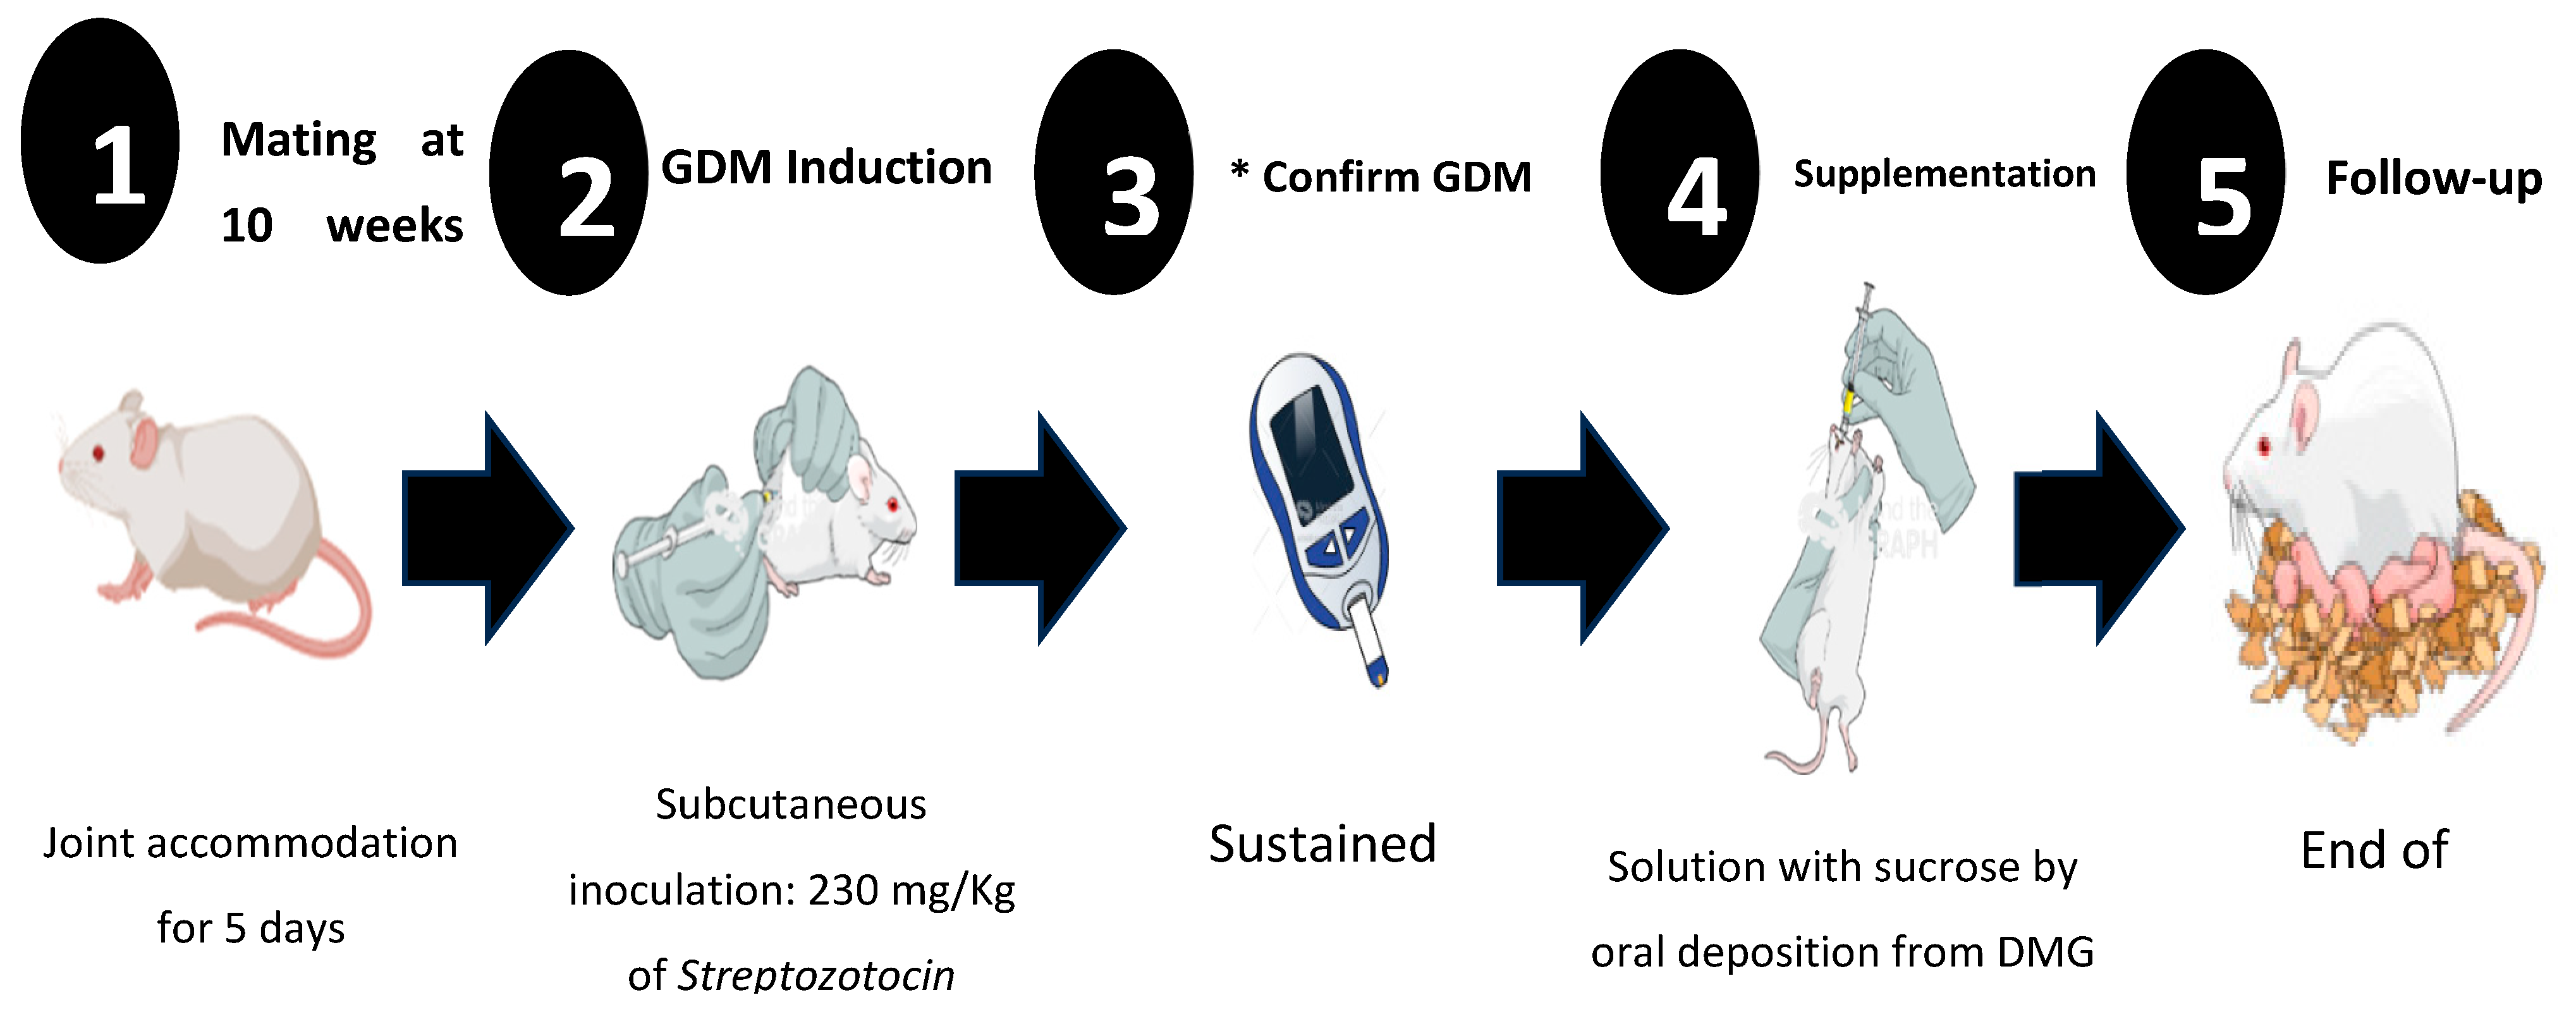

Table 1.
Morphometric and glycemic data in CD1 females with and without sucrose supplementation at the end of pregnancy.
Table 1.
Morphometric and glycemic data in CD1 females with and without sucrose supplementation at the end of pregnancy.
| CL (–) Sucrose | CL (+) Sucrose | DMG (–) Sucrose | DMG (+) Sucrose | ||
| Mean ± SD (n = 6) |
Mean ± SD (n = 6) |
Mean ± SD (n = 6) |
Mean ± SD (n = 6) |
P* Value | |
| Weight (g) | 31.52 ± 2.67 | 27.65 ± 0.60 | 22.60 ± 1.68 | 25.38 ± 2.19 | 0.001* |
| BMI (g/cm2) | 0.315 ± 0.03 | 0.263 ± 0.01 | 0.220 ± 0.02 | 0.233 ± 0.02 | 0.001* |
| Median | Median | Median | Median | ||
| Glycaemia (mg/dL) | 207 | 219 | 577 | 586 | 0.001* |
Table 2.
Metabolic parameters of CD1 females with and without sucrose supplementation at the beginning and end of gestation.
Table 2.
Metabolic parameters of CD1 females with and without sucrose supplementation at the beginning and end of gestation.
| CL (–) Sucrose | CL (+) Sucrose | DMG (–) Sucrose | DMG (+) Sucrose | ||
| Mean ± SD (n = 6) |
Mean ± SD (n = 6) |
Mean ± SD (n = 6) |
Mean ± SD (n = 6) |
P Value* | |
| *10th day, beginning of Supplementation | |||||
| Insulin (pg/mL) | 0.743 ± 0.012 | 0.743 ± 0.012 | 0.743 ± 0.008 | 0.743 ± 0.008 | 0.994 |
| HOMA-IR Index | 0.239 ± 0.257 | 0.2557 ± 0.257 | 0.209 ± 0.031 | 0.226 ± 0.029 | 0.062 |
| Adiponectin (pg/mL) | 8.5178 ± 1.031 | 8.76 ± 0.883 | 9.29 ± 2.4 | 10.53 ± 0.751 | 0.102 |
| Leptin (pg/mL) | 0.058 ± 0.031 | 0.074 ± 0.009 | 0.028 ± 0.012 | 0.038 ± 0.009 | 0.001* |
| &23rd day, end of gestation and Supplementation | |||||
| Insulin (pg/mL) | 0.438 ± 0.018 | 0.436 ± 0.014 | 0.443 ± 0.024 | 0.445 ± 0.005 | 0.792 |
| HOMA-IR Index | 0.394 ± 0.1564 | 0.397 ± 0.1050 | 1.026 ± 0.0718 | 1.027 ± 0.0886 | 0.001* |
| Adiponectin (pg/mL) | 9.574 ± 0.778 | 7.792 ± 2.154 | 6.622 ± 3.139 | 7.631 ± 2.162 | 0.175 |
| Leptin (pg/mL) | 0.077 ± 0.029 | 0.101 ± 0.051 | 0.027 ± 0.018 | 0.043 ± 0.018 | 0.003* |
The values represent the Mean ± Standard Deviation (SD) of Insulin, Adiponectin and Leptin in and Insulin Resistance Index HOMA-IR (Homeostasis Model Assessment-Insulin resistance index). The One-Way ANOVA statistic was performed to compare the differences between the groups. The differences were considered statistically significant with a P value < 0.05*. Picograms per milliliter (pg / mL), Control without Sucrose supplementation (CL –Sucrose), CL with Sucrose supplementation (CL +Sucrose), Gestational Diabetes Mellitus without Sucrose supplementation (GDM –Sucrose), Gestational Diabetes Mellitus with Sucrose supplementation (GDM +Sucrose). The samples were obtained: *Day 10th, Confirmation of GDM, start sucrose supplementation. &Days between 23 and 26 age of the females, end of supplementation and birth of the pups.
Table 3.
Immune parameters of CD1 female mice at the end of pregnancy.
| CL (-) Sucrose | CL (+) Sucrose | DMG (–) Sucrose | DMG (+) Sucrose | ||
| Mean ± SD (n = 6) |
Mean ± SD (n = 6) |
Mean ± SD (n = 6) |
Mean ± SD (n = 6) |
P Value* | |
| Cell Immunity | |||||
| CD3+ (%) | 26.41 ± 0.85 | 27.59 ± 0.71 | 26.05 ± 0.42 | 27.46 ± 0.95 | 0.004* |
| CD3+/CD4+ (%) | 44.45 ± 0.77 | 42.80 ± 0.43 | 44.15 ± 0.91 | 41.78 ± 0.41 | 0.001* |
| CD3+/CD8+ (%) | 26.37 ± 0.79 | 30.40 ± 0.85 | 27.05 ± 0.30 | 26.92 ± 0.78 | 0.001* |
| IL-1β (pg/mL) | 0.46 ± 0.20 | 8.28 ± 0.35 | 10.63 ± 0.56 | 12.50 ± 0.20 | 0.001* |
| IL-6 (pg/mL) | 1.08 ± 0.16 | 10.89 ± 0.80 | 7.39 ± 0.11 | 10.72 ± 0.19 | 0.001* |
| INF-γ (pg/mL) | 0.20 ± 0.09 | 5.04 ± 0.46 | 6.36 ± 0.24 | 10.76 ± 0.51 | 0.001* |
| TNF-α (pg/mL) | 0.33 ± 0.14 | 4.31 ± 0.08 | 5.49 ± 0.18 | 8.32 ± 0.31 | 0.001* |
| Humoral Immunity | |||||
| IgA (OD) | 0.298 ± 0.037 | 0.537 ± 0.078 | 1.061 ± 0.627 | 0.939 ± 0.176 | 0.002* |
| IgG (OD) | 0.247 ± 0.093 | 0.421 ± 0.080 | 0.545 ± 0.249 | 0.422 ± 0.083 | 0.017* |
The values represent the Mean ± Standard Deviation (SD) of the percentage of lymphocyte populations, concentration of cytokines and absorbance’s in Optical Densities (OD) of Immunoglobulins A and G. The one-way ANOVA statistic was performed to compare the differences between the groups. The differences were considered statistically significant with a P value < 0.05*. Interleukin-1 βeta (IL-1β), Interleukin-6 (IL-6), Tumor necrosis factor- alpha (TNF-α), Interferon-gamma (INF-γ), picograms per milliliter (pg / mL), Control without Sucrose supplementation (CL –Sucrose), CL with Sucrose supplementation (CL +Sucrose), Gestational Diabetes Mellitus without Sucrose supplementation (GDM –Sucrose), Gestational Diabetes Mellitus with Sucrose supplementation (GDM +Sucrose). The samples were obtained on days between 23 and 26 age of the females, end of supplementation and birth of the pups.
Table 4.
Redox activity of female CD1 mice at the end of gestation.
| CL (-) Sucrose | CL (+) Sucrose | DMG (–) Sucrose | DMG (+) Sucrose | ||
| Median (n = 6) |
Median (n = 6) |
Median (n = 6) |
Median (n = 6) |
P* Value | |
| Antioxidants Parameters | |||||
| TAC (µM) | 0.133 | 0.167 | 0.159 | 0.179 | 0.025* |
| Catalase (U/L) | 0.182 | 0.168 | 0.193 | 0.172 | 0.138 |
| SOD (U/mL) | 1.274 | 0.925 | 1.823 | 2.047 | 0.019* |
| GR (µM) | 98.86 | 92.06 | 87.53 | 83 | 0.049* |
| Oxidants Parameters | |||||
| TBARS (µM) | 0.0218 | 0.0075 | 0.0625 | 0.1430 | 0.006* |
| AGE (pM/dL) | 1218 | 1791 | 725 | 3034 | 0.001* |
The values represent the Median of antioxidant enzymes and oxidants of CD1 pregnant female mice. Total Antioxidant Capacity (TAC µM), Catalase (U/L), Superoxide Dismutase (SOD U/mL), Glutathione Reductase (GR µM), U/mL), Thiobarbituric Acid Reagent Species (TBARS µM) and Products Advanced Glycation Ends (AGE pM/dL). The Kruskal Wallis statistic was performed to compare the differences between the groups. The differences were considered statistically significant with a P value < 0.05*. Control without Sucrose supplementation (CL –Sucrose), CL with Sucrose supplementation (CL +Sucrose), Gestational Diabetes Mellitus without Sucrose supplementation (GDM –Sucrose), Gestational Diabetes Mellitus with Sucrose supplementation (GDM +Sucrose). The samples were obtained on days between 23 and 26 age of the females, end of supplementation and birth of the pups.
Disclaimer/Publisher’s Note: The statements, opinions and data contained in all publications are solely those of the individual author(s) and contributor(s) and not of MDPI and/or the editor(s). MDPI and/or the editor(s) disclaim responsibility for any injury to people or property resulting from any ideas, methods, instructions or products referred to in the content. |
© 2025 by the authors. Licensee MDPI, Basel, Switzerland. This article is an open access article distributed under the terms and conditions of the Creative Commons Attribution (CC BY) license (http://creativecommons.org/licenses/by/4.0/).
Copyright: This open access article is published under a Creative Commons CC BY 4.0 license, which permit the free download, distribution, and reuse, provided that the author and preprint are cited in any reuse.


