
Submitted:
26 January 2025
Posted:
29 January 2025
You are already at the latest version
Abstract
STap2Go is the first pure digital strategy-based training of executive functions. This study aims to assess the effectiveness of this intervention in typically developing children and those at psychosocial risk, which refers to socio-educational vulnerability. Additionally, we determine whether the training’s impact differs between these groups. One hundred and twenty-four children aged 9–12 participated in this study. They were divided into typically developing children or those at psychosocial risk and randomly assigned to either the experimental or active control group. Each group received a 12- week intervention. Both experimental groups improved significantly in EF, processing speed, IQ, academic performance, and emotional regulation compared to the control groups. The experimental group of children at psychosocial risk also improved in metacognition and behavioral regulation compared to controls. Overall, no significant differences were found between the experimental groups. Notably, participants in the psychosocial risk control group exhibited a certain deterioration over time.
Keywords:
Executive functions
; Cognitive training
; Metacognition
; Strategy-based training
; Children
; Children at psychosocial risk
1. Introduction
1.1. Conceptualization of Executive Functions
Executive functions (EF) are responsible for regulating cognition and behavior (Diamond, 2013; Zelazo & Carlson, 2012; Frick et al., 2017). EF are applied in both neutral and emotionally salient situations (Bailey & Jones, 2019). These processes can be understood as self-regulatory behaviors (Doebel et al., 2018; Miyake & Friedman, 2012), which overlap with the concept of “effortful control,” or the ability to appropriately direct attention and mental resources to pursue a plan (Schmidt et al., 2022).
One of the most recognized models of EF is the three-dimensional model proposed by Miyake et al. (2000), which has been influential in recent decades (Miyake & Friedman, 2012). This model identifies three independent core factors of EF: inhibition, working memory (WM), and cognitive flexibility. Inhibition refers to the ability to refrain from or interrupt actions, thoughts and emotions that do not contribute to the task at hand (Diamond, 2013; Tamm & Nakonezny, 2015). It also involves the capacity to postpone immediate gratification (Gagne et al., 2021). WM allows manipulating information in short-term memory, while cognitive flexibility enables shifts in attention, tasks, or strategies to achieve goals (Miyake & Friedman, 2012). Despite the acceptance of the three-dimensional model of EF, some criticisms suggest a broader dynamic model of EF. Jones et al. (2016) integrate elements of Miyake et al. (2000) into a broader framework of self-regulation. Doebel (2020) and Perone et al. (2021) understood EF as goal-directed behavior that encompasses multiple cognitive and emotional elements, including personal experience, knowledge, and feelings.
EF primarily reside in the prefrontal cortex (PFC) (Miller & Cummings, 2017; Semrud-Clikeman & Bledsoe, 2011; Stuss, 2011), a region particularly developed in humans and responsible for complex functions (Goldberg, 2001). The PFC is one of the last brain regions to mature during development (Fuster, 2002). EF development begins at an early age, with one of the first indicators being the achievement of object permanence (Casandra & Reynolds, 2005; Isquith et al., 2004). Around the age of two, EF continue to develop through language and symbol acquisition, which help children guide their behavior (Zelazo et al., 2004; Marcovitch & Zelazo, 2009). This development undergoes critical periods from early childhood to adolescence (Cassandra & Reynolds, 2005; Marcovitch & Zelazo, 2009). Basic EF such as inhibitory control, peak between the ages of 12 and 14, while others, such as cognitive flexibility, problem-solving, and WM, continue to develop until approximately 15 to 19 years of age (Cassandra & Reynolds, 2005; Davidson et al., 2006), and even into young adulthood (Larsen & Luna, 2018). The development of EF depends on PFC maturation (Diamond, 2013), which is influenced by genetics (Friedman et al., 2008) as well as psychosocial elements such as inner speech (Best et al., 2009; Manfra et al., 2014) and metacognition (Roebers & Feurer, 2016). In our study, we test a novel digital EF strategy-based intervention, “STap2Go” which incorporates metacognitive strategies. Due to developmental factors, we focused on children aged 9–12 years, as this period is crucial for successfully facing basic EF demands (Brocki & Bohlin, 2004; De Luca et al., 2003; Davidson et al., 2006). This timing is essential for intervening in EF while respecting developmental milestones.
EF are required in social, academic, and labour situations. They correlate with intelligence (Ardilla et al., 2000; de Abreu et al., 2010; Friedman et al., 2006; Rossignoli-Palomeque et al., 2019; Wang et al., 2021) and academic performance in reading (Johann et al., 2019a; Johann & Karbach, 2019b) and mathematics (Best et al., 2011; Cheung & Chan, 2022; Peng et al., 2015). Furthermore, the relationship between EF with emotional domains is robust. Children with higher levels of EF perform better in the theory of mind (Cole & Mitchell, 2000; Joseph & Tager-Flusberg, 2004; Sabbagh et al., 2006), which is crucial for socio-emotional regulation (Jahromi & Stifter, 2008). EF are essential to emotional and behavioral regulation (Andrés et al., 2016; Diamond, 2013; Hofmann et al., 2012; Morgan & Lilienfeld, 2000; Riccio et al., 2011; Schoemaker et al., 2013; Séguin, 2009; Séguin et al., 1999). This may be because emotions are embedded in most daily life challenges (Zelazo, Qu, & Kesek, 2010). EF are critically required in social situations to adapt one’s behavior (Crick & Dodge, 1994). Given the relationship between EF and those dimensions, researchers and practitioners may assume that EF interventions hold strong potential. Consequently, several cognitive training programs have emerged in recent decades (Strobach & Karbach, 2021). In our study, we include these constructs in the analysis to test the effects of the STap2Go intervention.
1.2. Executive Function Alterations: Children at Psychosocial Risk
The contemporary view of psychosocial risk involves a multi-dimensional, dynamic approach to both risk and protective factors (Martins et al., 2023; Jiménez et al., 2019). Families are considered at psychosocial risk when they are unable to meet their children’s needs, thereby deteriorating their development and well-being (Rodrigo et al., 2012). Children at psychosocial risk may experience situations such as poverty (e.g., malnutrition, healthcare needs), negative or coercive parenting styles (e.g., exposure to violence or stress), traumatic experiences, or absence of education (Shore, 1997). Prior studies have examined the effects of material and psychosocial deprivation on children’s health, social competence, academic success, and overall life outcomes (Crawford, Macmillan & Vignoles, 2017; Yoshikawa, Aber, & Beardslee, 2012; Engle & Black, 2008).
Psychosocial adversity is associated with deficits in EF. Research has found poorer EF in children exposed to early deprivation (Shin & Brunton, 2024), those in low-income environments (Waber et al., 2006), and children in institutional settings (Lewis et al., 2024; Camuñas et al., 2022). Generally, such children exhibit slower development of cognitive control (Hackman et al., 2010; Ison et al., 2015; Lipina et al., 2011) and difficulties in behavioral and emotional regulation (Lozano & Ostrosky, 2011; Moraine, 2014). They are more likely to experience deficits in mental, motor, and socio-emotional behavior. They tend to present difficulties in peer cooperation and a higher prevalence of ADHD (Sroufe, 2000).
In our study, we compare a group of typically developing children with a group of children considered to be at psychosocial risk. Our aim is not only to test the effects of STap2Go but also to study the principle of “compensation accounts,” which posits that those with greater needs benefit more from training (Diamond, 2013; Diamond & Ling, 2019; Karbach et al., 2015; Smid et al., 2020). In Canarias (Spain), where our study is conducted, the territorial government has established that children at psychosocial risk include those under the following circumstances: those with basic healthcare needs (e.g., food, housing), school-related needs (e.g., digital shortage, lack of education or school materials), socio-educational needs (e.g., lack of extracurricular activities, lack of stimulation), special educational needs, learning disabilities, and late incorporation into the educational system. Interventions targeting EF are particularly relevant for this population.
1.3. Executive Function Interventions: The Novel Scope of EF Training + Metacognition
Takacs and Kassai (2019) described various digital EF interventions that exhibited “near transfer” (effects in the same domains as those trained, e.g., WM, inhibition, or cognitive flexibility) and/or “far transfer” (effects in other domains not directly trained, such as socio-emotional regulation). The objective of EF interventions should be to achieve both near and far transfer. Given the relationship between EF and other complex domains such as intelligence, academic skills, and socio-emotional regulation, our study includes these as far-transfer variables. Review studies of process-based EF training highlight their lack of far-transfer effects and long-term benefits (Melby-Lervåg et al., 2016; Rossignoli-Palomeque et al., 2018; Sala & Gobet, 2019; Simons, 2016; Takacs & Kassai, 2019). This may be due to the reliance of these interventions on repetitive exercises, which exclude strategies for learning (Rossignoli-Palomeque et al., 2018).
In response to the limitations of process-based EF training regarding far-transfer effects, a new direction in EF training is emerging, which combines EF training + metacognition or so-called “strategy-based training”. This approach is particularly effective when metacognitive strategies are employed to best engage EF training (Strobach & Karbach, 2021). Metacognition plays a substantial role in EF engagement (Marulis et al., 2020; Chevalier & Blaye, 2016) and EF development (Best et al., 2011; Roebers, 2017). Furthermore, metacognitive strategies are especially beneficial for individuals with lower EF (Rossignoli-Palomeque et al., 2020). Metacognitive regulation refers to the processes that coordinate cognition (Nelson & Narens, 1994; Reder & Schunn, 2014; Shimamura, 2000), implying self-monitoring processes (Nelson & Narens, 1990). This type of metacognition shares similarities with EF development (Roebers & Feurer, 2016) and facilitates self-regulated learning (Efklides, 2009). Metacognition is even a predictor of intelligence and academic performance (Ohtani & Hisasaka, 2018).
Utilizing digital interventions that incorporate metacognitive strategies represents a new significant scope in education. Precursors of this approach include non-digital “strategy-based training,” in which, in addition to repetitive cognitive tasks, a human instructor provides strategies to the user while performing tasks (Morrison & Chein, 2011; Jolles & Crone, 2012). This form of learning support is known as “scaffolding” (Wood et al., 1976).
To our knowledge, only five studies have pursued strategy-based training of EF, or a combination of digital EF training with metacognition, through randomized controlled studies (Kubota et al., 2023; Partanen et al., 2015), including an active control group (Graziano & Hart, 2016; Jones et al., 2019; Pozuelos et al., 2018). Three of these studies utilized WM training (Cogmed) (Graziano & Hart, 2016; Jones et al., 2019; Partanen et al., 2015), finding greater benefits from WM training combined with metacognitive strategies than from simple WM training alone. In Graziano and Hart (2016), preschool children with behavioral problems on strategy-based training experienced greater gains in academic performance, emotional knowledge, and regulation compared to those who received non-strategy-based training. These benefits were maintained at a 6-month follow-up. In the study of Partanen et al. (2015) on children with special needs, the improvement in EF lasted more for the WM training (6-month follow-up) than for mere WM training. Finally, in typically developing children, gains in WM and mathematical reasoning were greater for the WM training combined with metacognition (maintained at a 3-month follow-up; Jones et al., 2019).
The other two studies involved all three EF components (Kubota et al., 2023; Pozuelos et al., 2018). In Kubota et al. (2023), children from disadvantaged backgrounds who received EF training combined with metacognition demonstrated greater gains than the active control group in proactive control engagement and EF. Finally, Pozuelos et al. (2018) tested the combined effect of EF training and metacognition in typically developing preschool children. Children in the metacognitive group showed greater gains in intelligence and significant increases in an electrophysiological index associated with conflict processing. These results suggest that metacognitive scaffolding enhances the influence of process-based training on cognitive efficiency and brain plasticity related to executive attention.
The downside of strategy-based interventions is that they require instructors to undergo specific training in scaffolding (Bosanquet & Radford, 2019), which can be time-consuming and costly. Moreover, the success of the scaffolding relies on scaffold quality and instructor experience. All training applied in these five studies was not entirely digital, as they required a human instructor to provide or supervise the metacognitive strategies (Graziano & Hart, 2016; Kubota et al., 2023; Partanen et al., 2015; Pozuelos et al., 2018), or used metacognitive workbooks in addition to a computer-based program (Jones et al., 2019; Kubota et al., 2023). Regarding the training used in our study, Rossignoli-Palomeque et al. (2020) conducted a randomized active-controlled pilot study with typically developing children. The experimental group significantly reduced attentional and EF problems at follow-up compared to the control group. In this pilot version, the strategies were delivered by an instructor.
STap2Go is the first EF digital strategy-based training that does not require a human instructor. The scaffolding is automated by the system, thanks to a pre-designed decision three. STap2Go’s metacognitive strategies are directed at planning, monitoring, and evaluating self-performance. This is why we hypothesize that the STap2Go intervention may impact not only EF and cognition but also academic success and behavioral and emotional regulation. Finally, it seems reasonable to expect stronger EF intervention benefits for children at psychosocial risk compared to typically developing children (Titz & Karbach, 2014).
1.4. Objectives
This study primarily aims to assess the effects of the digital strategy-based training of EF, “STap2Go,” in typically developing children (O1) and children at psychosocial risk (O2). Specifically, we will evaluate Stap2Go impact on their EF, intelligence, processing speed, academic performance, and emotional regulation. Secondly, we aim to evaluate whether the training impact differs between typically developing children and those at psychosocial risk (O3).
We expect that STap2Go will benefit EF, academic scores, IQ, processing speed, and emotional regulation after training for both typically developing children and children at psychosocial risk. We also anticipate greater training gains for children at psychosocial risk.
2. Materials and Methods
Following the Declaration of Helsinki, written informed parental consent was obtained from each participant. This study was approved by the ethics committee of Nebrija University (UNNE-2021-012).
2.1. Participants
One hundred and twenty-four children aged 9–12 participated in this study (M = 11.1, SD = 0.82), with 50.8% being boys and 49.2% girls. The sample size was estimated using G-Power (available since January 2007 in v. 3.1.9.7). The experimenter contacted various schools of Canarias Island (Spain) and ultimately one of them consented to participate in the study. Children were enrolled in a regular school. Initially, participants were divided into two main groups based on their condition: typically developing children or children at psychosocial risk. Secondly, participants in each condition were randomly allocated to two training groups: the experimental group (STap2Go training) or the active control group. Children classified as “at psychosocial risk” were diagnosed by the educational psychology services of the school following neuropsychological assessments. All study participants were informed of the purpose of their participation, and parental consent was obtained from all participants.
Table 1 shows the sociodemographic characteristics of the participants.
The inclusion criteria for the typically developing group were as follows: (1) aged 9–12, (2) no psychological or psychiatric diagnosis, (3) no special educational needs, (4) no course repetition, (5) an intelligence quotient (IQ) between 85 and 115, (6) and no clinical scores on the Behavioral Assessment of Executive Function (BRIEF-2) behavioral and emotional regulation indices at T1 (Gioia et al., 2015). The inclusion criteria for the psychosocial risk group were as follows: (1) aged 9–12, (2) diagnosed with psychosocial risk by the educational psychology services of the school, and (3) an IQ between 85 and < 115.
Figure 1 shows the sample sizes and dropouts as a function of a group.
The independent variables include the interventions—STap2Go (GeneticAI, 2022) and Kawaii (Piu Apps, 2020). The dependent variables of the study are (1) EF (e.g., inhibition, WM, cognitive flexibility) and metacognition, (2) cognitive skills (e.g., intelligence, processing speed), (3) behavioral and emotional regulation, and (4) academic performance.
Figure 2 clarifies the study design.
2.2. Assessments
Children were assessed before the training (T1), immediately after (T2), and two months after (T3). The evaluation was by a doctoral student and other qualified collaborating examiners in individual sessions. Families completed a questionnaire created ad hoc, as well as the BRIEF-2 questionnaire at T1, T2, and T3. Finally, the students’ tutors provided the participants’ academic scores (mathematics and language) at T1, T2, and T3.
- Questionnaire for parents created ad hoc: The questionnaire was used to collect participant data related to the inclusion criteria, filled out by the child’s legal guardian.
- Five Digit Test (FDT) (Sedó, 2007): This test provides measures of inhibition and flexibility. In the inhibition subscale, participants must count the numbers in a box instead of reading them. In the flexibility subscale, participants must change their strategy (from counting the numbers in a box to reading the numbers in it). The boxes in which the strategy is changed are marked by a blue frame. The Spearman-Brown coefficient for this test ranges from .92 to .95.
- WM sub-index of the Wechsler Intelligence Scale (WISC-V): We used the Spanish adaptation of the WISC-V for children (2014), focusing on the WM index subtests: (1) Digits, which involves repeating digits in direct, reverse, and ascending order; (2) Drawing Span, requiring participants to recall and order drawings after brief exposure; and (3) Letters and Numbers, in which participants repeat numbers in ascending order and letters alphabetically after hearing a mixed series. The Spanish adaptation for children WISC-V (2014) was applied.
- Reynold’s Brief Intelligence Test (RIST): RIST (Reynolds and Kamphaus, 2013) is a screening intelligence test that contains two subscales: Riddles, to assess verbal intelligence, and Categories, to assess non-verbal intelligence. The sum of both subscales determines an intelligence index (M = 100; SD = 15). The reliability for this test, based on Cronbach’s alpha, is .91.
- Behavior Rating Inventory of Executive Function (BRIEF-2) (Gioia et al., 2015): This standardized test for youth aged 5 to 18 focuses on assessing EF with two versions, for teachers and parents. It is a Likert-type assessment in which the parent/guardian responds regarding frequency to a series of questions. Three main indices comprise the different clinical scales: Behavioral regulation index, Emotional regulation index, and Cognitive regulation index. The Global index of executive function is made up of all three. It provides various scores related to EF, such as inhibition, flexibility, self-control, WM, and cognitive regulation. Higher scores indicate problems or difficulties (T, typical scale M = 50, SD = 10). This study used the Spanish adaptation (Gioia et al., 2017). This test has high reliability (based on Cronbach’s alpha M = .86).
- School performance: The numerical evaluations provided by the participant’s tutor in mathematics and language were used. Student’s academic performance ranges from 0 to 10.
2.3. Interventions
Both groups received training sessions in groups of 10, conducted in the computer room during school hours and supervised by the researcher. The experimental group underwent training sessions lasting 12 weeks, following the STap2Go protocol. Students completed activities three times weekly in 30-minute sessions on alternate days. The program included Go/no-go, stop-signal tasks, N-back tasks, and switching tasks, combined with metacognitive strategies provided before, during, and after the task (following a pre-designed decision tree). The stimulus presentation time was 1000–1500 ms, with a 500 ms window to respond. The average duration of each task was 2 minutes. Participants received feedback in each trial, with the screen edge turning green for correct responses and red for mistakes. As participants progressed through the protocol, the difficulty level increased by combining different parameters (e.g., number of distractors, n-back elements, number of set shifts). Each session combined different task types in a balanced proportion. All the instructions were specific for each task, resulting in around 100 different exercises (e.g., (1) tap when you see something edible, (2) tap when you see a duck if the previous image was also a duck, (3) tap when you see a flower (...) now tap when you see a vegetable). The metacognitive strategies were inspired by Efklides (2009) and designed by the creators of STap2Go. These strategies were validated in previous research (Rossignoli-Palomeque et al., 2019). Strategies focused on instruction comprehension, self-instructions, self-regulation, and performance supervision. Understanding instructions requires additional clarifications. For example, in the “tap when you see something red” exercise, before starting, the avatar asks: (1) “When should we tap?” prompting the user to tap when they see red, and (2) “What if something orange or pink appears?” to clarify that they should not tap. These instructions help identify task demands. Self-instructions then guide the user during the task, with the avatar saying, “Focus on the center of the screen to improve attention. What steps should we follow? First, wait, then observe, and finally, decide.” This helps direct attention and reduce impulsivity. As the user completes the exercises, the avatar offers targeted strategies based on specific errors (e.g., if the user taps impulsively, the avatar reminds them, “Remember, first wait, then observe, then decide”), using a decision tree. After completing the tasks, the system reports the number and types of errors. The avatar then prompts the user to reflect on mistakes (e.g., “I tapped when I shouldn’t have” or “I missed a required tap”) and suggests strategies for improvement. To motivate participants, they earn ‘energy’ points based on performance, which can be used for features such as avatar customization.
All sessions were recorded through the application to ensure protocol fulfilment. Figure 3 shows an example of an EF task. Figure 4 exemplifies the metacognitive strategies applied.
The active control or placebo group received the same amount of intervention time as the experimental group but used another computer application (the Kawaii application). The same conditions were provided for the experimental group. The Kawaii application allows users to draw and create their compositions/designs. The researcher registered the training time and captured images of each participant.
2.4. Data Analysis
The sample size was estimated using G-Power 3.1.9.7 (Faul et al., 2007), based on the assumption that enrolling 140 participants would provide the trial with 95% power to detect an effect size of .35. First, we analyzed at T1 across all groups (normality test, one-factor ANOVA, mean, and variance homogeneity) to ensure no significant differences at the pretest among the groups.
To assess the intervention effects, a repeated-measures mixed ANCOVA 3×2 controlling for age was conducted separately for typically developing children and those at psychosocial risk, with two factors included: time (three measurements: T1, T2, and T3) and group (two groups: experimental and active control). The main effects and inter-group effects were analyzed through Tukey post-hoc tests. Effect size estimates were calculated using partial eta squared (ηp2), where ηp2 ≥ 0.01 is regarded as a small effect, ηp2 ≥ 0.06 as medium, and ηp2 ≥ 0.14 as large. If the one-way ANOVA indicated significant differences between groups at the pretest, we controlled for this variable in the ANCOVA. The p-value ranges from 0 to 1, with higher values indicating a lower probability of committing a type II error. The level of significance was set at p < .05. When parametric statistics could not be applied, we used the U Mann-Whitney test to assess differences between experimental and control groups, as well as Friedman analysis to test intragroup differences across assessment moments. Hedges’ g was chosen as the effect size measure, as it is more appropriate than Cohen’s d when dealing with small samples (Hedges & Olkin, 1985). The interpretation of g is as follows: < 0.2 small effect, ≥ 0.5 medium, and ≥ 0.8 large (Cohen, 1988).
Finally, to test the differences between the experimental groups, we applied the T-student test or U Mann-Whitney when parametric statistics were not possible. The analyses used JAMOVI 2.3.24 (The Jamovi Project, 2020).
3. Results
3.1. Variables Considered Near Transfer Assessed Individually
Table 2 shows the mean and standard deviation of the variables considered near transfer (pretest, post-test, and follow-up), the main effects for each dependent variable, and the results of the ANOVA at T1.
Figure 5 represents the significant near-transfer results after the pretest.

Table 2a.
Mean and standard deviation of the Variables Considered Near Transfer (pretest, postest and follow-up) the main effects for each dependent variable, and the results of the ANOVA at T1 for typically-developing children.
Table 2a.
Mean and standard deviation of the Variables Considered Near Transfer (pretest, postest and follow-up) the main effects for each dependent variable, and the results of the ANOVA at T1 for typically-developing children.
| Experimental group | Control group | ANOVA t1p-value |
Main effect (Time in each group) |
Main effect (Group/time/time*group) |
||
| WISC-V Working Memory Index | Pretest | 89.2 (4.69) | 88.1 (3.45) | .31 | Experimental: (χ2 = 52.7, p = <.001) Control: (χ2 = 5.02, p =.08) |
|
| Postest | 101.2(8.10) | 87.4 (2.34) | ||||
| Follow-up | 104.2 (7.53) | 88.8 (2.77) | ||||
| WISC-V Auditory Working Memory Index | Pretest | 95.0 (4.17) | 96.4 (5.36) | .27 | (F (1,58) = 60.75, p = <.001, η²p =.50) (F (1,58) = 4.46, p = <.014, η²p =.07) (F (1,58) = 85.55, p = <.001, η²p =.59) |
|
| Postest | 110.5 (7.39) | 96.4 (4.75) | ||||
| Follow-up | 114 (6.56) | 100 (4.45) | ||||
| FDT Inhibition | Pretest | 26.2 (8.43) | 26.3 (9.53) | .95 | (F (1,60) = 13.16, p = <.001, η²p =.18) (F (1,60) = .22, p = .81, η²p =.004) (F (1,60) = 14.96, p = <.001, η²p =.2) |
|
| Postest | 22.8 (5.96) | 31.2 (5.52) | ||||
| Follow-up | 22.9 (5.80) | 30.3 (4.49) | ||||
| Pretest | 35.0 (9.90) | 35.8 (9.44) | .75 | (F (1,60) = 11.14, p = .001, η²p =.16) (F (1,60) = .31, p = .73, η²p =.005) (F (1,60) = 9.56, p = <.001, η²p =.14) |
||
| FDT Flexibility | Postest | 30.3 (6.47) | 37.0 (6.14) | |||
| Follow-up | 29.4 (5.74) | 37.8 (6.07) | ||||
| Pretest | 33.8 (6.55) | 34.6 (5.29) | .62 | (F (1,58) = 5.80, p = .019, η²p =.08) (F(1,58) = 1.19, p = .31, η²p =.02) (F(1,58) = 5.59, p = .005, η²p =.08) |
||
| FDT Counting Time | Postest | 32.2 (4.91) | 35.0 (2.88) | |||
| Follow-up | 33.2 (5.20) | 37.8 (4.89) | ||||
| FDT Reading Time | Pretest | 28.0 (4.64) | 30.6 (5.32) | .04 | (F (1,60) = 13.22, p = <.001, η²p =.18) (F (1,60) = 1.45, p = .23, η²p =.02) (F (1,60) = 5.89, p = .018, η²p =.09) |
|
| Postest | 25.5 (3.78) | 28.3 (3.23) | ||||
| Follow-up | 25.2 (3.17) | 29.3 (3.43) | ||||
1 Table 2a legend: post hoc: Differences Typically-developing experimental group - Typically-developing control group. Significance: p≤.05 (*). FDT: Five Digit Test WISC-V: Wechsler Intelligence Scale for Children Fifth Edition.
Table 2b.
Mean and standard deviation of the Variables Considered Near Transfer (pretest, postest and follow-up) the main effects for each dependent variable, and the results of the ANOVA at T1 for children at psychosocial risk.
Table 2b.
Mean and standard deviation of the Variables Considered Near Transfer (pretest, postest and follow-up) the main effects for each dependent variable, and the results of the ANOVA at T1 for children at psychosocial risk.
| Experimental group | Control group |
ANOVA t1p-value |
Main effect (Time in each group) |
Main effect (Group/time/time*group) |
|||
| WISC-V Working Memory Index | Pretest | 88.4 (2.92) | 87.3 (3.61) | .20 | Experimental: (χ2 = 55.9, p = <.001) Control: (χ2 = 12.7, p = .002) |
||
| Postest | 99.3 (4.28) | 89.2 (3.26) | |||||
| Follow-up | 102.7 (4.23) | 89.8 (4.15) | |||||
| WISC-V Auditory Working Memory Index | Pretest | 94.3 (5.07) | 95.2 (5.45) | .49 | (F (1,59) = 79.55, p = <.001, η²p =.58) (F (1,59) = 3.41, p = .036, η²p =.06) (F (1,59) = 80.16, p = <.001, η²p =.58) |
||
| Postest | 110.3 (4.88) | 97.6 (3.72) | |||||
| Follow-up | 114 (4.02) | 101 (4.66) | |||||
| FDT Inhibition | Pretest | 26.9 (8.37) | 25.4 (7.94) | .47 | (F (1,59) = 8.35, p = .005, η²p =.13) (F (1,59) = .77, p = 46, η²p =.01) (F (1,59) = 18.25, p = <.001, η²p =.24) |
||
| Postest | 22.9 (4.06) | 30.2 (6.20) | |||||
| Follow-up | 23.7 (5.04) | 30.1 (5.55) | |||||
| FDT Flexibility | Pretest | 37.5 (9.55) | 36.7 (10.7) | .76 | (F (1,59) = 14.42, p = <.001, η²p =.19) (F (1,59) = .41, p = .662, η²p =.007) (F (1,59) = 9.6, p = <.001, η²p =.14) |
||
| Postest | 29.7 (5.90) | 38.4 (5.28) | |||||
| Follow-up | 30.3 (5.80) | 38.4 (5.82) | |||||
| FDT Counting Time | Pretest | 35.3 (6.19) | 36.0 (8.29) | .72 | (F (1,59) = 1.74, p = .192, η²p =.03) (F (1,59) = 1.31, p = .27, η²p =.02) (F (1,59) = 6.94, p = .001, η²p =.11) |
||
| Postest | 33.7 (5.47) | 36.0 (8.26) | |||||
| Follow-up | 33.5 (5.16) | 38.1 (6.49) | |||||
| FDT Reading Time | Pretest | 30.2 (6.75) | 32.0 (6.68) | .3 | Experimental: (χ2 =25.5, p = <.001) Control: (χ2 = 11.3, p = .004) |
||
| Postest | 25.3 (3.11) | 28.8 (6.38) | |||||
| Follow-up | 23.8 (2.67) | 30.1 (5.82) | |||||
1 Table 2b legend: post hoc: Differences Psychosocial risk experimental group - Psychosocial risk control group. Significance: p≤.05 (*). FDT: Five Digit Test WISC-V: Wechsler Intelligence Scale for Children Fifth Edition.
Figure 5.
Mean Chart of the variables considered as near-transfer assessed through individual assessments.
Figure 5.
Mean Chart of the variables considered as near-transfer assessed through individual assessments.
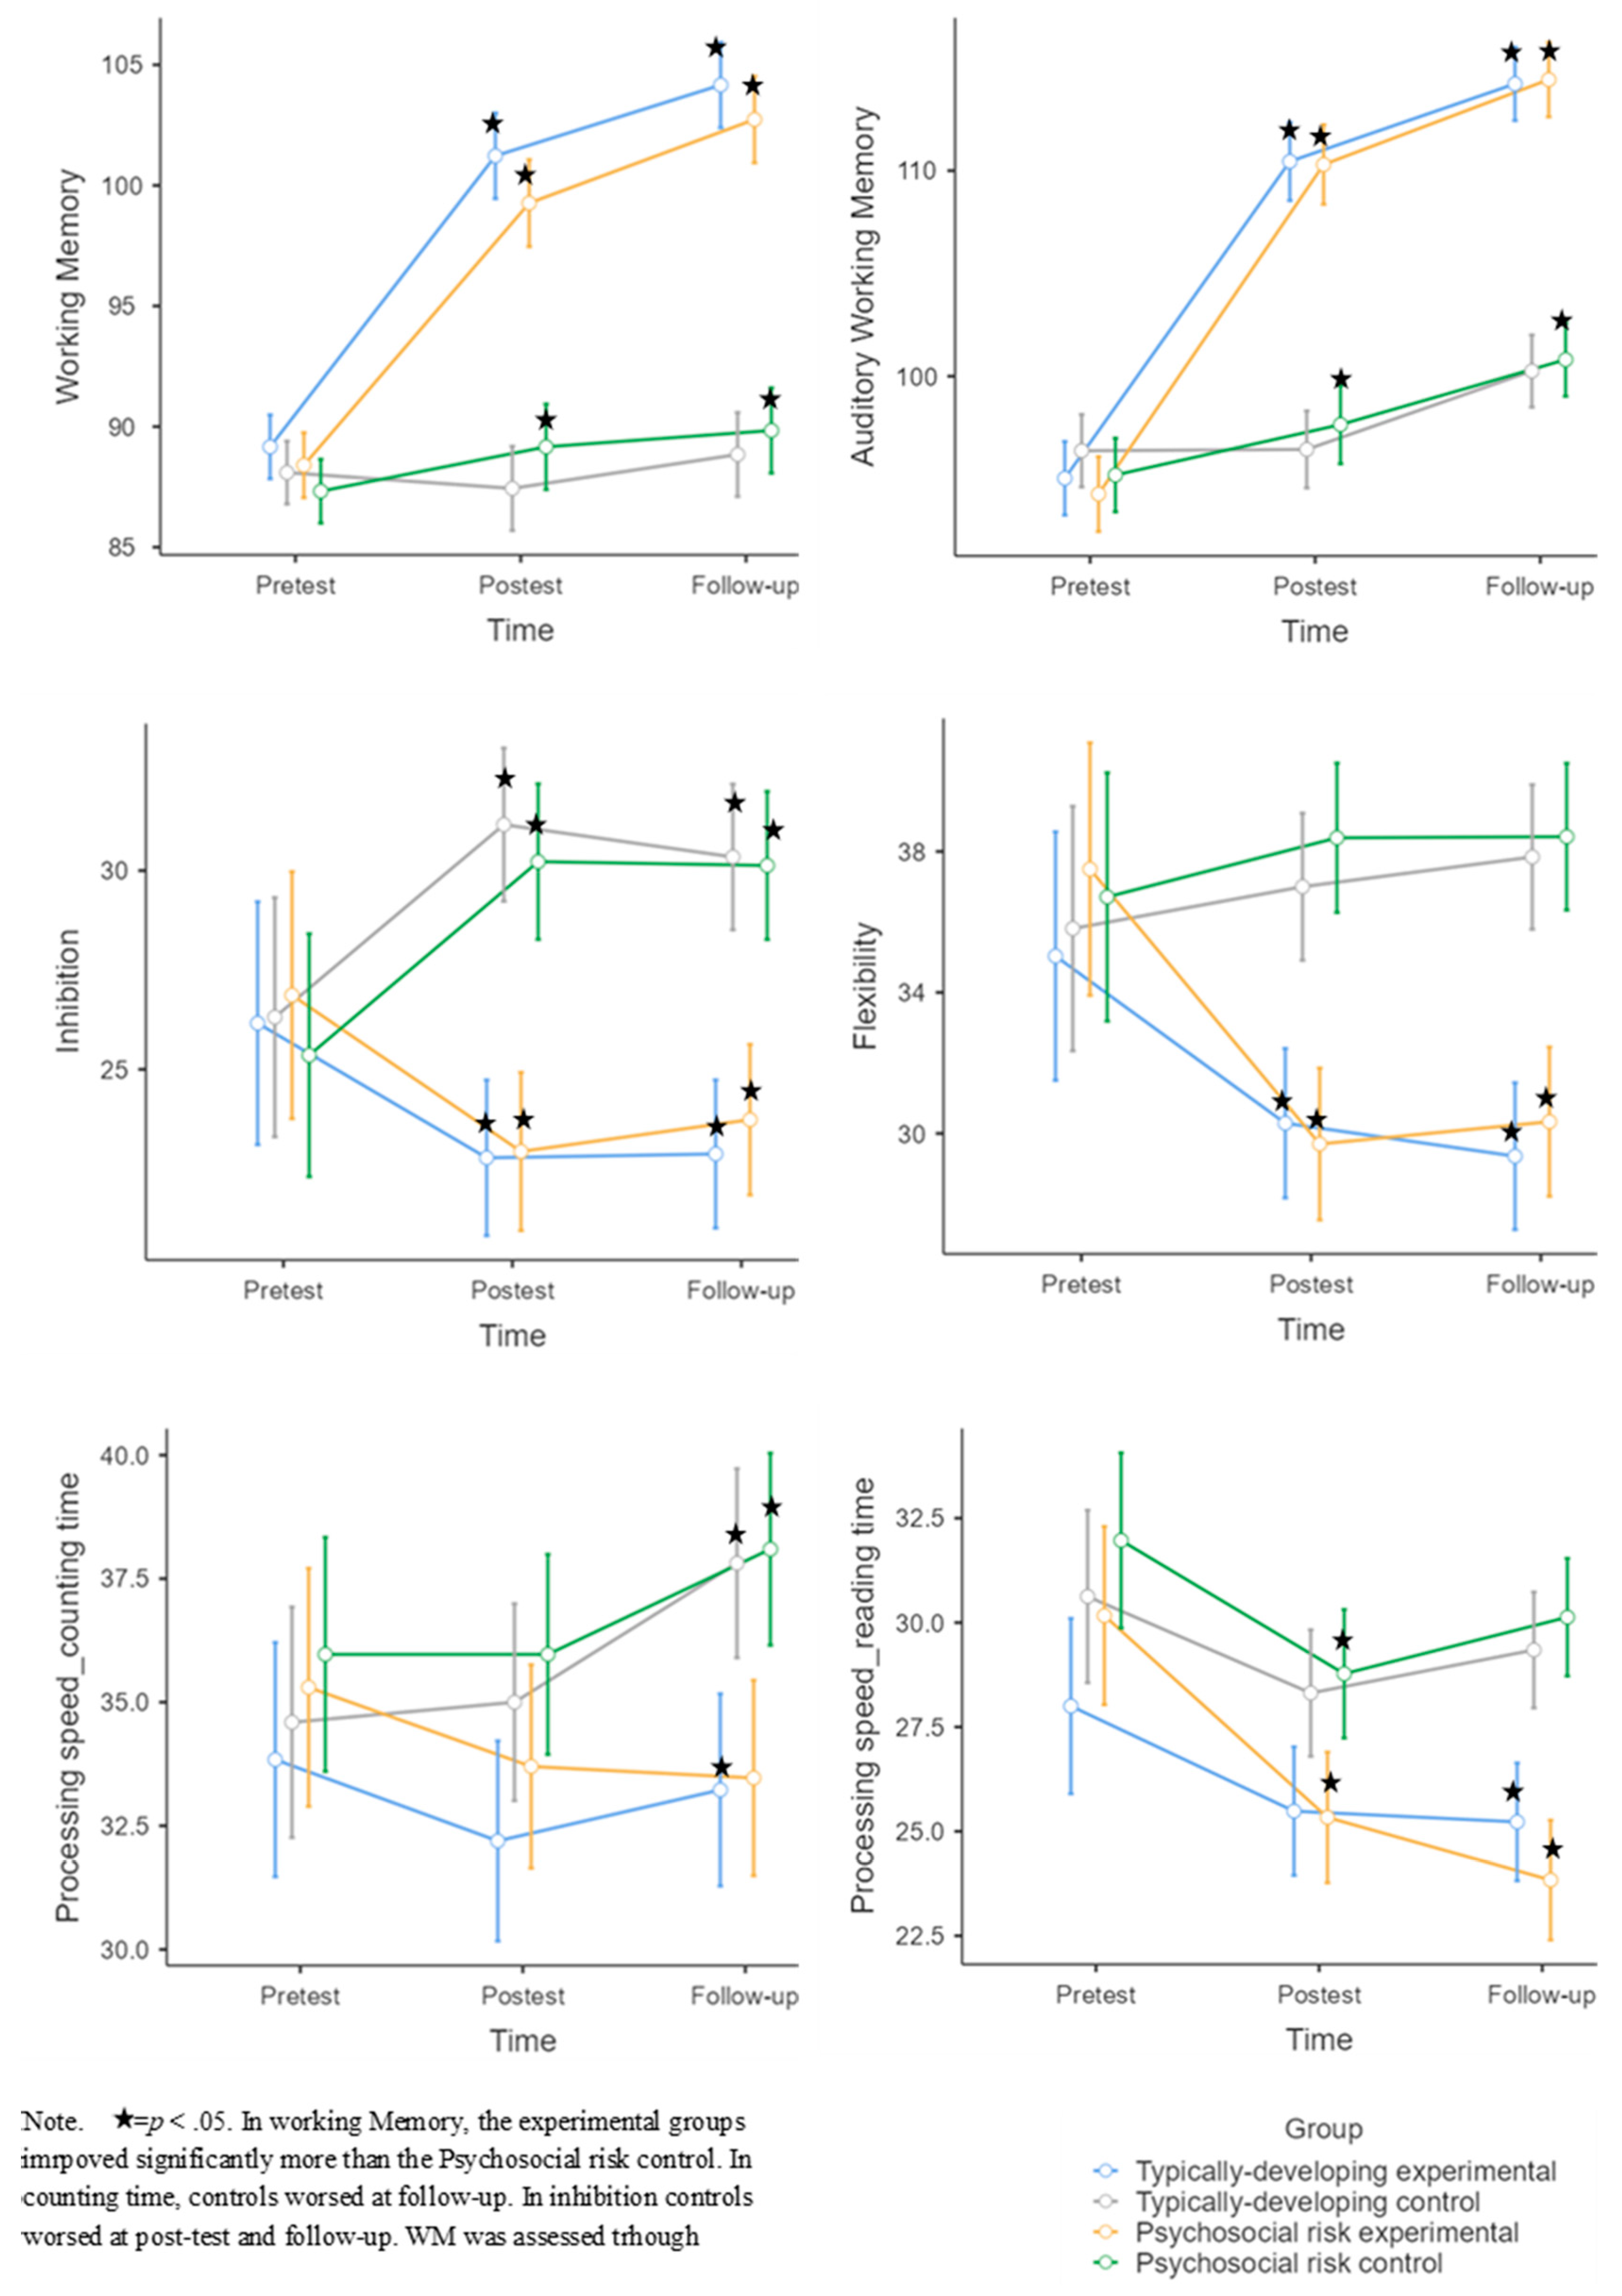
- WISC-V Working Memory Index
Typically developing children (TDC): Significant differences were found at post-test (U = 47, p < .001, g = 2.3) and follow-up (U = 12.5, p < .001, g = 2.7) in favor of the experimental group. The Friedman test also showed significant differences between the three assessment moments (χ2 = 52.7, p < .001) for the experimental group. They significantly improved at post-test (p < .001, g = 1.7) and at follow-up (p < .001, g = 2.21) compared to the pretest (p < .001, g = 2.21), and at follow-up compared to post-test (p < .001, g = .44).
Children at psychosocial risk (CPR): Significant differences were found at post-test (U = 27.5, p < .001, g = 2.63) and follow-up (U = 20.0, p < .001, g = 3.0) in favor of the experimental group. The Friedman test also showed significant differences between the three assessment moments (χ2 = 55.9, p < .001) for the experimental group. The experimental group significantly improved at post-test (p < .001, g = 2.93) and follow-up (p < .001, g = .31) compared to the pretest, and at follow-up (p < .001, g = .80) compared to post-test. There were also significant differences between the three assessment moments (χ2 = 12.7, p = .002) for the control group. They improved their results at post-test (p = .003, g = .53) and follow-up (p < .001, g = .64) compared to the pretest.
No significant differences were found between the experimental groups at any of the three assessments—pretest (U = 454, p = .87), post-test (U = 392, p = .28), and follow-up (U = 439, p = .70).
- WISC-V Auditory Working Memory Index
TDC: Significant differences were found at post-test (p < .001, g = 2.23) and follow-up (p < .001, g = 2.47) in favor of the experimental group. The experimental group significantly improved at post-test (p < .001, g = 2.54) and follow-up (p = .003, g = 3.45) compared to the pretest, and at follow-up (p < .001, g = .53) compared to post-test. The control group improved at follow-up compared to post-test (p < .001, g = .82).
CPR: Significant differences were found compared to controls at post-test (p < .001, g = 2.89) and follow-up (p < .001, g = 3.08) in favor of the experimental group. The experimental group significantly improved at post-test (p < .001, g = 3.18) and follow-up (p < .001, g = 4.35) compared to the pretest, and at follow-up (p < .001, g = .91) compared to post-test. The control group improved at follow-up compared to post-test (p < .001, g = .74) and pretest (p < .001, g = 1.09).
The difference between the experimental groups was not significant at post-test (t(59) = -.94, p = .92) or follow-up (t(59) = -0.15, p = .88).
- FDT Inhibition
TDC: There were significant differences between the experimental and control groups at post-test (p < .001, g = 1.44) and follow-up (p < .001, g = 1.43) in favor of the experimental group. The control group worsened at post-test (p = .009, g = .68) and follow-up (p = .04, g = .69) compared to the pretest.
CPR: There were significant differences between the experimental and control groups at post-test (p < .001, g = 1.37) and follow-up (p < .001, g = 1.19) in favor of the experimental group. The experimental group improved at post-test (p = .028, g = .6) compared to the pretest. The control group worsened at post-test (p = .003, g = .68) and at follow-up (p = .014, g = .69) compared to the pretest.
The difference between the experimental groups was not significant either at post-test (t(59) = -.12, p = .90) or at follow-up (t(59) = -.61, p = .53).
- FDT Flexibility
TDC: Significant differences were found at post-test (p = .001, g = 1.05) and follow-up (p < .001, g = 1.42) in favor of the experimental group. The experimental group significantly improved at post-test (p = .02, g = .56) and follow-up (p = .003, g = .69) compared to the pretest, and at follow-up (p = .009, g = .15) compared to post-test.
CPR: Significant differences were found at post-test (p < .001, g = 1.53) and follow-up (p < .001, g = 1.37) in favor of the experimental group. The experimental group significantly improved at post-test (p = .003, g = .97) and follow-up (p = .014, g = .90) compared to the pretest. The difference between the experimental groups was not significant at either post-test (t(59) = .37, p = .71) or follow-up (t(59) = -.66, p = .51).
- FDT Counting Time (Processing Speed)
TDC: A significant difference was found at follow-up (p = .010, g = 1.23) in favor of the experimental group. The control group significantly worsened at follow-up compared to post-test (p < .001, g = .69).
CPR: There were significant differences at follow-up (p = .038, g = .78), favoring the experimental group. The control group significantly worsened at follow-up compared to post-test (p < .001, g = .28).
The difference between the experimental groups was not significant at either post-test (t(59) = -1.13, p = .26) or follow-up (t(59) = -.18, p = .86).
- FDT Reading Time (Processing Speed)
TDC: There were significant differences between the groups at follow-up (p < .001, g = 1.23) in favor of the experimental group. The experimental group experienced a marginally significant improvement at follow-up (p = .050, g = .07) compared to post-test.
CPR: There were significant differences at post-test (U = 281, p = .008, g = .67) and at follow-up (U = 128, p < .001, g = 1.37) in favor of the experimental group. The Friedman test also showed significant differences between the three assessment moments for the experimental group (χ2 = 25.5, p = <.001). They significantly improved at post-test (p < .001, g = .62) and at follow-up (p > .001, g = .43) compared to the pretest, as well as at follow-up compared to post-test (p = .023, g = .51). The result for the controls was significant (χ2 = 11.3, p = .004), as they improved at post-test compared to pretest (p = .001, g = .74) and at follow-up compared to post-test (p = .005, g = .89).
The differences between the experimental groups were not significant at any of the three assessments—pretest (U = 382, p = .23), post-test (U = 455, p = .88), or follow-up (U = 349, p = .086).
3.2. Variables Considered Transfer in Participants’ Daily Lives Were Assessed Through Parent Questionnaires
Table 3 shows the average and standard deviation of the variables considered transfer in participants’ daily lives (pretest, post-test, and follow-up) and the main effect for each dependent variable, as well as the results of the T1 ANOVA.
Figure 6 shows the significant results after the pretest in the participants’ daily lives.
Table 3a.
Average and standard deviation of the variables considered transfer in participants’ daily lives (pretest, post-test, and follow-up) and the main effect for each dependent variable, as well as the results of the T1 ANOVA for typically-developing children.
Table 3a.
Average and standard deviation of the variables considered transfer in participants’ daily lives (pretest, post-test, and follow-up) and the main effect for each dependent variable, as well as the results of the T1 ANOVA for typically-developing children.
| Experimental group | Control group | ANOVA t1p-value |
Main effect (Time in each group) |
Main effect (Group/time/time*group) |
||
| BRIEF-2 Inhibition | Pretest | 13.3 (2.57) | 15.2 (3.25) | .03 | (F (1,43) = 2.64, p = .11, η²p =.59) (F (1,43) = .01, p = .92, η²p =.00) (F (1,43) =.02, p = .87, η²p =.001) |
|
| Postest | 12.5 (1.81) | 13.9 (3.03) | ||||
| Follow-up | 13.3 (1.70) | 15.0(2.68) | ||||
| BRIEF-2 Flexibility | Pretest | 11.2 (2.35) | 12.4 (2.50) | .11 | Experimental: χ2 = 1.25, p =.53 Control: χ2 = .438, p = .80 |
|
| Postest | 10.1 (2.05) | 12.8 (2.80) | ||||
| Follow-up | 10.3 (1.81) | 13.0 (3.05) | ||||
| BRIEF-2 Working Memory | Pretest | 14.2 (2.71) | 15.5 (2.22) | .32 | (F (1,43) = 8.84, p = .005, η²p =.17) (F (1,43) = .021, p = .98, η²p =.001) (F (1,43) = 1.43, p = .25, η²p =.033) |
|
| Postest | 13.7 (2.40) | 14.8 (3.84) | ||||
| Follow-up | 12.4 (1.34) | 15.0 (2.71) | ||||
| BRIEF-2 Metacognition Index | Pretest | 62.5 (10.09) | 67.6 (9.62) | .09 | (F (1,43) = 7.50, p = .009, η²p =1.52) (F (1,43) = .37, p = .7, η²p =.009) (F (1,43) = 1.55, p = .22, η²p =.04) |
|
| Postest | 61.8 (11.7) | 66.9 (14.5) | ||||
| Follow-up | 57.1 (6.86) | 67.6 (11.20) | ||||
| BRIEF-2 Global Index of Executive Function | Pretest | 101 (15.9) | 107 (25.6) | .36 | Experimental: (χ2 =11.9, p =.003) Control: (χ2 =.67, p =.72) |
|
| Postest | 97.2 (14.2) | 109.0 (20.9) | ||||
| Follow-up | 93.4 (9.55) | 111.0 (17.70) |
1 Table 3a legend: post hoc: Differences Typically-developing experimental group - Typically-developing control group. Significance: p≤.05 (*). BRIEF: Behavior rating inventory of executive functions.
Table 3b.
Average and standard deviation of the variables considered transfer in participants’ daily lives (pretest, post-test, and follow-up) and the main effect for each dependent variable, as well as the results of the T1 ANOVA for children at psychosocial risk.
Table 3b.
Average and standard deviation of the variables considered transfer in participants’ daily lives (pretest, post-test, and follow-up) and the main effect for each dependent variable, as well as the results of the T1 ANOVA for children at psychosocial risk.
| Psychosocial risk experimental group (PRE) | Psychosocial risk control group (PRC) | ANOVA t1p-value |
Main effect (Time in each group) |
Main effect (Group/time/time*group) |
||
| BRIEF-2 Inhibition | Pretest | 15.1 (6.23) | 14.3 (3.50) | .59 | Experimental: (χ2 = 4.10, p =.13) Control: (χ2 = 6.74, p = .03) |
|
| Postest | 13.3 (3.22) | 15.5 (3.68) | ||||
| Follow-up | 13.5 (2.73) | 16.5 (3.64) | ||||
| BRIEF-2 Flexibility | Pretest | 13.5 (6.54) | 11.9 (3.17) | .28 | Experimental: (χ2 = 4.88, p = .08) Control: (χ2 = 10.2, p = .006) |
|
| Postest | 11.0 (2.96) | 13.4 (3.15) | ||||
| Follow-up | 10.7 (2.54) | 13.8 (2.85) | ||||
| BRIEF-2 Working Memory | Pretest | 16.5 (7.15) | 15.4 (2.63) | .45 | Experimental: (χ2 = 18.0, p = <.001) Control: (χ2 = 2.04, p = .36) |
|
| Postest | 14.5 (3.54) | 17.0 (3.55) | ||||
| Follow-up | 12.8 (2.94) | 16.0 (3.81) | ||||
| BRIEF-2 Metacognition Index | Pretest | 63.1 (10.86) | 64.8 (11.16) | .58 | (F (1,46) = 9.78, p = .003, η²p = .17) (F (1,46) = 1.63, p = .202, η²p = .033) (F (1,46) = 9.52, p = <.001, η²p = .17) |
|
| Postest | 61.3 (11.9) | 73.0 (13.9) | ||||
| Follow-up | 57.5 (9.70) | 71.6 (14.12) | ||||
| BRIEF-2 Global Index of ExecutiveFunction | Pretest | 102 (19.4) | 106 (19.3) | .53 | (F (1,46) = 9.93, p = .003, η²p = .17) (F (1,46) =1.28, p = .282, η²p = .026) (F (1,46) = 9.34, p = <.001, η²p = .16) |
|
| Postest | 99.1 (19.1) | 118.6 (22.2) | ||||
| Follow-up | 94.7 (15.93) | 118.0 (22.62) |
1 Table 3b legend: post hoc: Differences Psychosocial risk experimental group - Psychosocial risk control group. Significance: p≤.05 (*). BRIEF: Behavior rating inventory of executive functions.
- BRIEF-2 Inhibition
TDC: No significant effects.
CPR: Significant differences were found at follow-up favoring the experimental group (U = 194, p = .013, g = .94). The Friedman test revealed a significant effect of time for the control group (χ2 = 6.74, p = .034). They significantly worsened at follow-up compared to pretest (p = .012, g = .61) and at follow-up compared to post-test (p = .048, g = .27).
No significant differences were found between the experimental groups at any of the three assessments—pretest (U = 241, p = .24), post-test (U = 278, p = .66), and follow-up (U = 292, p = .88).
- BRIEF-2 Flexibility
TDC: Significant differences were found at post-test (U = 129, p < .002, g = 1.06) and follow-up (U = 129, p < .002, g = 1.06) in favor of the experimental group.
CPR: Significant differences were found at post-test (U = 182, p = .007, g = .79) and follow-up (U = 139, p < .001, g = 1.12) in favor of the experimental group. The Friedman test revealed a significant effect of time for the control group (χ2 = 10.2, p = .006). They significantly worsened at the post-test (p = .011, g = -.46) and at follow-up (p = .002, g = -.60) compared to the pretest.
No significant differences were found between the experimental groups at any of the three assessments—pretest (U = 229, p = .15), post-test (U = 266, p = .50), and follow-up (U = 292, p = .88).
- BRIEF-2 Working Memory
TDC: Only the main effect of the group was significant.
CPR: Significant differences were found at post-test (U = 189, p = .010, g = .68) and follow-up (U = 154, p = .001, g = .92) in favor of the experimental group. The Friedman test revealed a significant effect of time for the experimental group (χ2 = 18.0, p < .001). They significantly improved at post-test (p = .036, g = .36) and follow-up compared to the pretest (p < .001, g = .68), as well as at follow-up compared to the post-test (p = .005, g = .52).
The differences between the two experimental groups were not significant at any of the three assessment moments—pretest (U = 226, p = .14), post-test (U = 266, p = .50), or follow-up (U = 278, p = .67).
- BRIEF-2 Metacognition Index
TDC: Only the main effect of the group was significant.
CPR: The differences between the groups were significant at post-test (p = .026, g = .90) and at follow-up (p = .002, g = 1.15) in favor of the experimental group. The control group significantly worsened at post-test compared to pretest (p = .008, g = .64).
The differences between the experimental groups were not significant at any of the three assessment moments—pretest (U = 281, p = .718), post-test (U = 294, p = .920), or follow-up (U = 296, p = .952).
- BRIEF-2 Global Index of Executive Function
TDC: Significant differences were found at follow-up (p < .001, g = 1.21) in favor of the experimental group. The experimental group experienced significant changes across the assessments (χ2 = 11.9, p = .003). They significantly improved at the post-test (p = .008, g = .25) and at follow-up (p < .001, g = .57) compared to the pretest.
CPR: The differences between the experimental and control groups were significant at post-test (p = .021, g = .93) and follow-up (p = .001, g = 1.18) in favor of the experimental group. The control group significantly worsened at post-test (p = .029, g = .61) and follow-up (p = .037, g = .58) compared to the pretest.
No significant differences were found between them at any of the three assessments—pretest (U = 271, p = .58), post-test (U = 287, p = .82), or follow-up (U = 290, p = .86).
3.3. Variables Considered Far Transfer (Not Directly Trained)
Table 4 shows the average and standard deviation of the variables considered far transfer (pretest, post-test, and follow-up) and the main effects for each dependent variable, as well as the results of the T1 ANOVA.
Figure 7 illustrates the significant far-transfer results after the pretest.
Table 4a.
Average and standard deviation of the variables considered far transfer (pretest, post-test, and follow-up) and the main effects for each dependent variable, as well as the results of the T1 ANOVA for typically-developing children.
Table 4a.
Average and standard deviation of the variables considered far transfer (pretest, post-test, and follow-up) and the main effects for each dependent variable, as well as the results of the T1 ANOVA for typically-developing children.
| Experimental group | Control group | ANOVA t1p-value |
Main effect (Time in each group) |
Main effect (Group/time/time*group) |
||
| RIST Intelligence Index | Pretest | 91.1 (4.76) | 90.7 (3.70) | .66 | Experimental: (χ2 = 32.1, p = <.001) Control: (χ2 = 1.1, p = <.57) |
|
| Postest | 94.3 (5.06) | 90.8 (3.17) | ||||
| Follow-up | 96.2 (5.36) | 90.0 (2.62) | ||||
| Spanish Language academic performance | Pretest Postest Follow-up |
6.58 (1.52) 7.45 (1.39) 7.29 (1.49) |
6.74 (2.18) 6.31 (1.53) 7.19 (1.71) |
.74 | (F (1,60) = 1.66, p = .020, η²p = .03) (F (1,60) = 2.41, p = .094, η²p = .04) (F (1,60) = 17.08, p = <.001, η²p = .22) |
|
| Mathematics academic performance | Pretest | 6.16 (1.55) | 6.26 (2.16) | .84 | (F (1,60) = 1.2, p = .28, η²p = .02) (F (1,60) = .78, p = .46, η²p = .013) (F (1,60) = 9.57, p = <.001, η²p = .14) |
|
| Postest | 7.00 (1.13) | 6.06 (1.58) | ||||
| Follow-up | 7.03 (1.60) | 6.84 (1.89) | ||||
| BRIEF-2 Emotional Control | Pretest | 14.1 (2.97) | 14.7 (2.66) | .51 | (F (1,43) = 10.47, p = .002, η²p= .20) (F (1,43) = .18, p = .83, η²p= .004) (F (1,43) = 3.97, p = <.023, η²p= .09) |
|
| Postest | 12.7 (1.39) | 15.4 (2.84) | ||||
| Follow-up | 12.7 (1.60) | 15.5 (2.92) | ||||
| BRIEF-2 Behavioral Regulation Index | Pretest | 38.6 (6.60) | 43.0 (6.47) | .03 | (F (1,43) = 10.34, p = .003, η²p =.20) (F (1,43) = 1.12, p = .29, η²p =.03) (F (1,43) = .01, p = .93, η²p =.00) |
|
| Postest | 35.4 (3.38) | 42.1 (7.47) | ||||
| Follow-up | 36.3 (3.51) | 43.5 (7.29) |
1 Table 4a legend: post hoc: Differences Typically-developing experimental group - Typically-developing control group. Significance: p≤.05 (*). RIST: Intelligence Index Curricular subjects: Spanish Language academic performance and Mathematics academic performance. BRIEF: Behavior rating inventory of executive functions.
Table 4b.
Average and standard deviation of the variables considered far transfer (pretest, post-test, and follow-up) and the main effects for each dependent variable, as well as the results of the T1 ANOVA for children at psychosocial risk.
Table 4b.
Average and standard deviation of the variables considered far transfer (pretest, post-test, and follow-up) and the main effects for each dependent variable, as well as the results of the T1 ANOVA for children at psychosocial risk.
| Experimental group | Control group | ANOVA t1p-value |
Main effect (Time in each group) |
Main effect (Group/time/time*group) |
||
| RIST Intelligence Index | Pretest | 89.8 (3.22) | 90.0 (3.53) | .23 | (F (1,59) = 20.53, p = <.001, η²p =.26) (F (1,59) = .44, p = .64, η²p =.01) (F (1,59) = 47.47, p = <.001, η²p =.45) |
|
| Postest | 94.2 (4.04) | 90.2 (2.68) | ||||
| Follow-up | 96.8 (3.54) | 90.5 (3.00) | ||||
| Spanish Language academic performance | Pretest | 5.50 (1.61) | 6.46 (1.14) | .01 | (F (1,59) = 74.22, p = <.001, η²p = .58) (F (1,59) = .26, p = .61, η²p = .005) (F (1,59) = 37.86, p = <.001, η²p = .41) |
|
| Postest | 7.20 (1.24) | 5.61 (1.28) | ||||
| Follow-up | 6.67 (1.60) | 6.39 (1.56) | ||||
| Mathematics academic performance | Pretest Postest Follow-up |
5.23 (1.65) 6.63 (1.35) 6.47 (1.74) |
5.89 (1.34) 5.32 (1.30) 5.90 (1.85) |
.10 | (F (1,59) = 1.65, p = .20, η²p = .03) (F (1,59) = 1.41, p = .25, η²p = .02) (F (1,59) = 24.12, p = <.001, η²p = .31) |
|
| BRIEF-2 Emotional Control | Pretest Postest Follow-up |
15.4 (5.55) 13.3 (3.07) 13.0 (2.68) |
14.6 (3.21) 16.6 (4.53) 16.3 (4.16) |
.54 | Experimental: (χ2 = 40.5, p=<.001) Control: (χ2 = 2.05, p = .36) |
|
| BRIEF-2 Behavioral Regulation Index | Pretest Postest Follow-up |
40.8 (5.61) 37.8 (8.14) 37.2 (6.97) |
41.0 (8.76) 45.6 (9.56) 46.4 (9.12) |
.12 | (F (1,46) = 8.12, p = .006, η²p = .15) (F (1,46) = 2.03, p = .14, η²p = .041) (F (1,46) = 9.97, p = <.001, η²p = .17) |
1 Table 4b legend: post hoc: Differences Psychosocial risk experimental group - Psychosocial risk control group. Significance: p≤.05 (*). RIST: Intelligence Index Curricular subjects: Spanish Language academic performance and Mathematics academic performance. BRIEF: Behavior rating inventory of executive functions.
Figure 7.
Mean Chart of the variables considered as far-transfer (variables not directly trained.
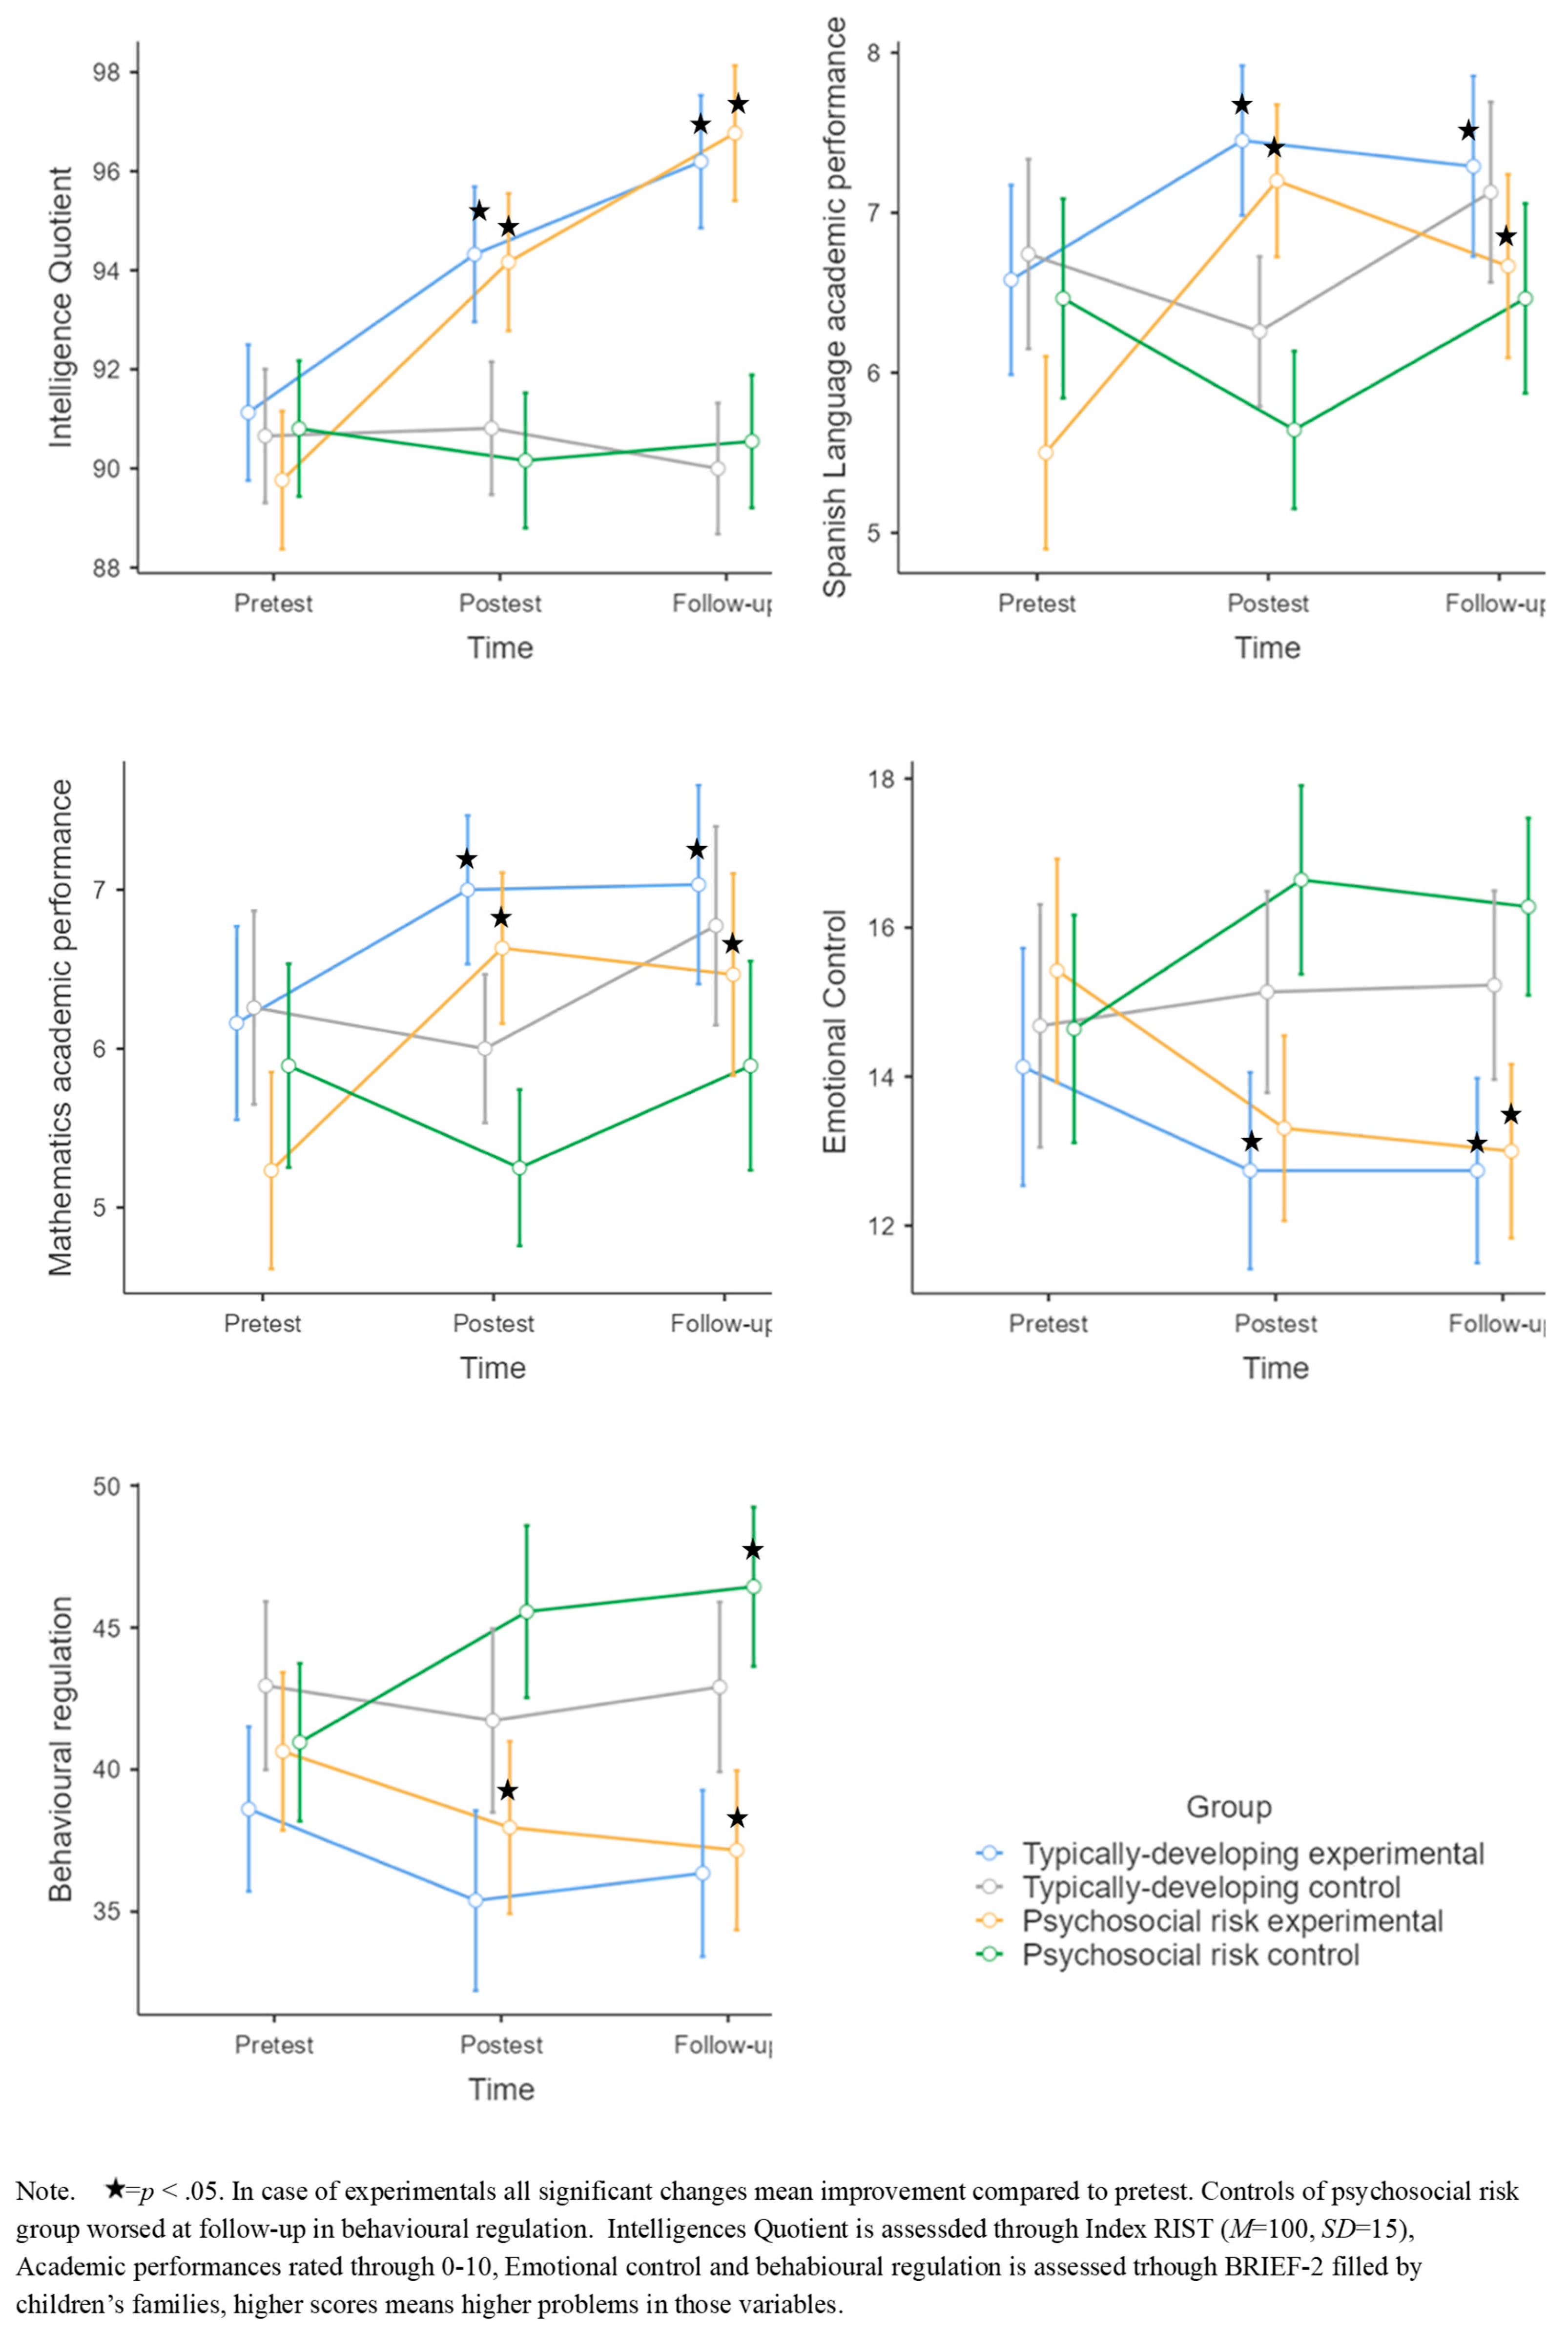
- RIST Intelligence Index
TPC: Significant differences were found at post-test (U = 298, p = .002, g = .82) and follow-up (U = 120, p = <.001, g = 1.46) in favor of the experimental group. The experimental group experienced significant changes across the assessments (χ2 = 32.1, p = <.001). They significantly improved at the post-test (p = <.001, g = .64) and at follow-up (p = <.001, g = .99) compared to the pretest, and at follow-up compared to post-test (p = .006, g = .31).
CPR: The experimental group significantly improved at post-test (p = <.001, g = 1.16) and follow-up (p = <.001, g = 1.87) compared to controls. The experimental group improved at post-test (p = <.001, g = 1.19) and follow-up (p = <.001, g = 2.04) compared to pretest, and at follow-up (p = <.001, g = .68) compared to post-test.
The differences between the groups were not significant in any of the three assessments—pretest (U = 388, p = .26), post-test (U = 447, p = .79), or follow-up (U = 391, p = .29).
- Spanish Language Academic Performance
TDC: The differences at post-test were significant (p = .009, g = .77) in favor of the experimental group. The experimental group significantly improved at post-test (p = <.001, g = .59) and follow-up (p = .017, g = .47) compared to pretest.
CPR: Significant differences were observed between the experimental and control group at post-test (p = <.001, g = .77) and follow-up (p = <.001, g = .06) in favor of the experimental group. The experimental group significantly improved at follow-up (p = >.006, g = .36) compared to post-test.
The difference between the groups was significant in the pretest (U = 281, p = .007), but not in the post-test (U = 422, p = .53) or follow-up (U = 359, p = .12).
- Mathematics Academic Performance
TDC: The differences were significant at post-test (p = .043, g = .67) in favor of the experimental group. The experimental group significantly improved at post-test (p = <.001, g = .61) and follow-up (p = <.001, g = .55) compared to pretest. There was a significant difference at follow-up compared to post-test for the control group (p = <.001, g = .44).
CPR: The differences between the groups were significant at post-test (p =>.001, g = .98) in favor of the experimental group. The experimental group significantly improved at post-test (p = <.001, g = .91) and follow-up (p = <.001, g = .87) compared to pretest.
Regarding the experimental groups, the differences between them were only at the pretest (U = 323, p = .038), but not at the post-test (U = 386, p = .24) or follow-up (U = 379, p = .21).
- BRIEF-2 Emotional Control
TDC: The differences between the experimental and control groups were significant at post-test (p = .007, g = 1.17) and follow-up (p = .006, g = 1.15) in favor of the experimental group.
CPR: Significant differences were found at post-test (U = 156, p = .001, g = .85) and follow-up (U = 165, p = .002, g = .93) in favor of the experimental group. The Friedman test revealed a significant effect of time for the experimental group (χ2 = 40.5, p = <.001). They significantly improved at post-test compared to pretest (p = <.001, g = .46) and at follow-up compared to pretest (p = <.001, g = .55).
No significant differences were found between the two experimental groups at any of the three assessments—pretest (U = 260, p = .44), post-test (U = 298, p = .98), or follow-up (U = 292, p = .92).
- BRIEF-2 Behavioral Regulation Index
TDC: Only the main effect of the group was significant.
CPR: The difference between the experimental and control groups was marginally significant at post-test (p = .05, g = .86) and significantly different at follow-up (p = .003, g = 1.13) in favor of the experimental group. The control group significantly worsened at follow-up (p = .012, g = .60) compared to the pretest.
Although both experimental groups improved, no significant differences were found between them at any of the pretest (U = 227, p = .15), post-test (U = 285, p = .79), or follow-up (U = 287, p = 1.00).
4. Discussion
This study primarily aimed to assess the effects of a novel digital strategy-based training of EF, “STap2Go,” in TDC (O1) and CPR (O2). Secondly, it aimed to examine whether the training impact differed between TDC and CPR, as might be expected according to the “compensation accounts” principle. It must be considered that Stap2Go is the first pure digital strategy-based intervention for EF; thus, testing its effects is relevant. Our results support the idea presented by Niebaum and Munakata (2022), which claims that interventions designed to encourage children’s engagement with EF may produce better outcomes than those simply aimed at improving EF capability.
In relation to O1, our results showed that experimental TDC improved EF after the training, maintaining or even enhancing their results at follow-up. The improvements in EF were observed in WM auditory working memory, inhibition, cognitive flexibility, and processing speed (counting time and reading time). Unlike other process-based interventions in which children only improved in EF (Diamond et al., 2007; Liu et al., 2015; Zhao et al., 2018), our results also indicated transfer in variables that affect children’s daily lives (flexibility, global index of EF). Moreover, there was also a far transfer in IQ, mathematics, Spanish language academic performance, and emotional control. To our knowledge, only two other studies have used digital EF strategy-based intervention on TDC (Jones et al., 2019; Pozuelos et al., 2018), finding stronger benefits in mathematics academic performance and IQ gains for those children who received the EF+metacognitive training. Our results support the transfer effects of EF strategy-based interventions. In contrast to the lack of transfer effects observed in this domain through process-based interventions (Melby-Lervåg et al., 2016; Rossignoli-Palomeque et al., 2018; Sala & Gobet, 2019; Simons, 2016; Takacs & Kassai, 2019), Stap2Go produces transfer effects on the emotional control of children. We believe this is due to training directed toward self-regulation, which is strongly related to emotional regulation (Diamond, 2013; Hofmann et al., 2012; Morgan & Lilienfeld, 2000; Riccio et al., 2011; Schoemaker et al., 2013; Séguin, 2009; Séguin et al., 1999).
This study included not only TDC but also CPR. O2 shows that experimental CPR improved in several domains after training and maintained or even enhanced their results at follow-up. They improved in individual assessments of EF (WM, inhibition, auditory WM, and cognitive flexibility) and processing speed (counting time). Moreover, there was transfer in the children’s daily lives, as observed in the family environment (inhibition, EF and metacognition). Additionally, far transfer was found in IQ, behavioral and emotional regulation, mathematics, and Spanish language academic performance. Previous studies with children in disadvantaged situations, such as those with special needs (Patarnen et al., 2015) or children from disadvantaged backgrounds (Kubota et al., 2023), only found near-transfer effects. According to Zuber et al. (2022), WM training produces the largest performance improvements compared to other core elements of EF. Our study, in contrast to those (Patarnen et al., 2015; Kubota et al., 2023), not only trained WM but also the main EF components, and this method seems to produce more benefits than simple WM alone. In the case of children with behavioral problems, Graziano and colleagues (2016) found stronger benefits for those children who received additional strategies over EF, academic performance, emotional knowledge, and regulation. To our knowledge, this is the only study to find transfer in those domains similar to our study. Nevertheless, we must consider that the strategies were provided by trained parents. This variable could extend beyond the results of this study, as parents’ techniques and styles impact children’s behavior (Grolnick & Ryan, 1989; Sarwar, 2016). Our study is the only pure digital EF strategy-based intervention to produce such transfer effects without the influence of a human instructor.
We must also discuss some positive effects found in all groups. Regarding TDC, controls also improved at follow-up in auditory WM. This could be attributed to a general improvement in this capability over time due to developmental factors rather than a “practice effect” as indicated by the test-retest index of .86. Additionally, the effect size is stronger for the experimental group (g = 2.47) compared to the control group (g = .82). For CPR, the only positive effect in the controls was in individual assessments of WM and auditory WM. Nevertheless, the effect sizes were smaller for controls compared to the experimental group at post-test (g = 2.93 vs. g = .53) for the WM, and for the auditory WM (experimental follow-up g = 4.35 vs. control g = 1.09). We interpret the results of this variable cautiously, as all groups improved. Finally, regarding processing speed (reading time), both groups improved after training, which may be due to a developmental factor rather than the intervention (the effect sizes are not larger for the experimental group).
Regarding study design, contrary to others (Graziano & Hart; Patarnen, 2015), our study includes an active control group. This approach reduces the likelihood of committing a Type I error and strengthens the validity of the results (Field, 2013). Furthermore, our study includes a 2-month follow-up, during which most of the effects were maintained. Although other strategy-based intervention studies include follow-up (Graziano & Hart, 2016; Kubota et al., 2023; Jones et al., 2019), the maintained effects were only near transfer (except for Graziano and colleagues’ study (2016) already discussed).
While considering O3, it is important to highlight that significant improvements occurred in both experimental groups, with no significant differences between them. Overall, the Stap2Go intervention seems effective in both conditions. Nevertheless, the time*group interaction was significant in three variables for CPR but not for TDC (inhibition, metacognition, and behavioral regulation of the BRIEF-2). The experimental CPR improved in those variables after training compared to controls. Still, we must consider that there were some negative effects for the TDC (they worsened their scores in FDT inhibition at post-test and follow-up, and for FDT counting time at follow-up). In contrast, at-risk students in the control group experienced a wider deterioration in several areas (i.e., FDT inhibition and BRIEF inhibition, FDT counting time, BRIEF (flexibility, metacognition, global index of EF, and behavioral regulation), indicating a certain vulnerability of this group. This deterioration seems to occur without receiving a specific intervention in EF. These results highlight the relevance of this intervention for a particularly vulnerable group. CPR deteriorate if not adequately intervened. Our results support the notion that children from disadvantaged socio-educational conditions benefit the most from this type of intervention (Diamond, 2013; Diamond & Ling, 2019).
The transfer effects of Stap2Go align with the demonstrated relationship between EF and intelligence (Ardilla et al., 2000; de Abreu et al., 2010; Friedman et al., 2006; Rossignoli-Palomeque et al., 2018; Wang et al., 2021) and academic performance (Best et al., 2011; Cheung & Chan, 2022; Peng et al., 2015). Finally, the connection between EF and emotional and behavioral regulation has also been established in several studies (Diamond, 2013; Hofmann et al., 2012; Morgan & Lilienfeld, 2000; Riccio et al., 2011; Schoemaker et al., 2013; Séguin, 2009; Séguin et al., 1999).
Our study results exceed the findings from the pilot study of Rossignoli-Palomeque et al. (2020), in which the strategies were facilitated by an instructor, and interventions were only assessed in TDC. In the present study, however, the latest version of the program was used, in which an avatar facilitates the strategies according to the user’s performance. This novel approach may promote the emergence of other digital strategy-based interventions, considering that process-based interventions primarily produced near transfer (Melby-Lervåg et al., 2016; Rossignoli-Palomeque et al., 2018; Sala & Gobet, 2019; Simons, 2016; Takacs & Kassai, 2019). Furthermore, the Stap2Go intervention may prevent the detriment suffered by children in conditions of psychosocial vulnerability, as the experimental group improves in most of the domains assessed, while the control group deteriorates over time.
Finally, this study faced the limitation of sample loss, as not all families provided the questionnaires at different evaluation moments. Additionally, the consideration of psychosocial risk is very broad, making it a heterogeneous group. In future studies, we would like a more detailed analysis according to specific risk conditions. As a future direction, we would extend the study to other developmental stages to determine whether there are greater or lesser benefits depending on participants’ ages. Finally, we intend to compare the Stap2Go intervention with another group receiving the Stap2Go intervention without metacognitive strategies to assess the impact of the strategies on the results. Additionally, a latent-change score study will help us better understand the influence of metacognition on training effects.
5. Conclusions
Experimental groups significantly improved in individual assessments of basic EF, IQ, processing speed (counting time), and EF according to family assessments compared to controls. Furthermore, the experimental groups improved in emotional regulation and academic performance (i.e., language and mathematics) after the intervention. These results were maintained at follow-up.
Generally, the control groups did not improve, and there was even some deterioration in individual assessments of EF for both control groups (inhibition and counting time). More negative effects were observed for the control group of CPR according to their family environment (i.e., in inhibition, flexibility, global index of EF, metacognition and behavioral regulation) at post-test and/or follow-up. This suggests that this group appears to be more vulnerable than the TDC group.
Although the intervention benefits both TDC and CPR, some positive effects were found only for the children at psychosocial risk (inhibition, metacognition, and behavioral regulation according to their families).
Author Contributions
Conceptualization, TRP. and MVR.; methodology TRP and MVR.; software, TRP.; formal analysis, DCG and TRP.; investigation, DCG.; resources, TRP.; data curation, TRP and DCG.; writing—original draft preparation, DCG and TRP.; writing—review and editing, TRP and MVR.; supervision TRP and MVR.; project administration, DCG. All authors have read and agreed to the published version of the manuscript.”
Funding
This research received no external funding.
Institutional Review Board Statement
The study was conducted in accordance with the Declaration of Helsinki, and approved by the Institutional Review Board (or Ethics Committee) of Nebrija University (UNNE-2021-012) in 10/11/2021 date of approval.
Informed Consent Statement
Informed consent was obtained from all subjects involved in the study.
Data Availability Statement
Authors will provide data under request to any interested researcher.
Acknowledgments
We thank CEIP Adeje Casco School for participating in this study, as well as the participants and families enrolled in the study.
Conflicts of Interest
TRP declare conflict of interest as is the designer of Stap2gointervention. The other authors (DCG and MVR) have no current or potential conflicts of interest.
Abbreviations
The following abbreviations are used in this manuscript:
| EF | Executive Functions |
| WM | Working Memory |
References
- Andrés, M. L., Richaud de Minzi, M. C., Castañeiras, C., Canet-Juric, L. & Rodríguez-Carvajal, R. (2016). Neuroticism and depression in children: The role of cognitive emotion regulation strategies. The Journal of Genetic Psychology, 177(2), 55–71. [CrossRef]
- Ardila, A., Pineda, D., & Rosselli, M. (2000). Correlation between intelligence test scores and executive function measures. Archives of clinical neuropsychology, 15(1), 31-36. [CrossRef]
- Bailey, R., & Jones, S. M. (2019). An integrated model of regulation for applied settings. Clinical Child and Family Psychology Review, 22(1), 2–23. [CrossRef]
- Barreyro, J. P., Injoque-Ricle, I., Formoso, J. & Burin, D. I. (2017). The role of working memory and sustained attention in the generation of explanatory inferences. Liberabit, 23(2), 235–247. [CrossRef]
- Best, J. R., Miller, P. H., & Naglieri, J. A. (2011). Relations between executive function and academic achievement from ages 5 to 17 in a large, representative national sample. Learning and Individual Differences, 21, 327–336. [CrossRef]
- Bosanquet, P. & Radford, J. (2019). Teaching assistant and pupil interactions: The role of repair and topic management in scaffolding learning. British Journal of Educational Psychology, 89(1), 177–190. [CrossRef]
- Brocki, K. C., & Bohlin, G. (2004). Executive functions in children aged 6 to 13: A dimensional and developmental study. Developmental neuropsychology, 26(2), 571-593. [CrossRef]
- Camuñas, N., Mavrou, I., Vaíllo, M. & Martínez, R. M. (2022). An executive function training programme to promote behavioural and emotional control of children and adolescents in foster care in Spain. Trends in neuroscience and education, 27, 100175. [CrossRef]
- Carlson, S. M., & Moses, L. J. (2001). Individual differences in inhibitory control and children's theory of mind. Child development, 72(4), 1032-1053. [CrossRef]
- Cassandra, B. & Reynolds, C. (2005). A Model of the Development of Frontal Lobe Functioning: Findings From a Meta-Analysis. Applied Neuropsychology, 12 (4), 190–201. [CrossRef]
- Cohen, J. (1988). Statistical Power Analysis for the Behavioral Sciences (2nd ed.). Hillsdale, NJ: Lawrence Erlbaum Associates.
- Cole, K., & Mitchell, P. (2000). Siblings in the development of executive control and a theory of mind. British Journal of Developmental Psychology, 18(2), 279-295. [CrossRef]
- Cheung, S. K., & Chan, W. W. L. (2022). The roles of different executive functioning skills in young children’s mental computation and applied mathematical problem-solving. British Journal of Developmental Psychology, 40(1), 151-169. [CrossRef]
- Chevalier, N., & Blaye, A. (2016). Metacognitive monitoring of executive control engagement during childhood. Child Development, 87 (4), 1264–1276. [CrossRef]
- Crawford C., Macmillan L. & Vignoles A. (2017). When and why do initially high-achieving poor children fall behind? Oxford Review of Education, 43 (1), pp. 88 –108. [CrossRef]
- Crick, N. R., & Dodge, K. A. (1994). A review and reformulation of social information-processing mechanisms in children's social adjustment. Psychological bulletin, 115(1), 74. [CrossRef]
- Dajani, D. R., & Uddin, L. Q. (2015). Demystifying cognitive flexibility: Implications for clinical and developmental neuroscience. Trends In Neurosciences, 38(9), 571–578. [CrossRef]
- Davidson, M. C., Amso, D., Anderson, L. C. & Diamond, A. (2006). Development of cognitive control and executive functions from 4 to 13 years: Evidence from manipulations of memory, inhibition, and task switching. Neuropsychologia, 44(11), 2037–2078. [CrossRef]
- De Luca, C. R., Wood, S. J., Anderson, V., Buchanan, J., Proffitt, T. M., Mahony, K., y Pantelis, C. (2003). Normative data from the CANTAB. I: Development of executive function over the lifespan. Journal of Clinical and Experimental Neuropsychology, 25(2), 242-254. [CrossRef]
- Diamond, A. (2013). Executive functions. Annual Review of Psychology, 64(1), 135–168. [CrossRef]
- Diamond, A. & Ling, D. S. (2019). Review of the evidence on, and fundamental questions about, efforts to improve executive functions, including working memory. In J. M. Novick, M. F. Bunting, M. R. Dougherty, & R. W. Engle (Eds.), Cognitive and working memory training: perspectives from psychology, neuroscience, and human development (pp. 143–431). Oxford University Press. [CrossRef]
- Diamond, A., Barnett, W. S., Thomas, J. & Munro, S. (2007). Preschool program improves cognitive control. Science, 318(5855), 1387–1388. [CrossRef]
- Doebel, S. (2020). Rethinking executive function and its development. Perspectives on Psychological Science, 15(4), 942–956. [CrossRef]
- Doebel, S., Dickerson, J. P., Hoover, J. D., & Munakata, Y. (2018). Using language to get ready: Familiar labels help children engage proactive control. Journal of Experimental Child Psychology, 166, 147–159. [CrossRef]
- Duncan, G. J., Magnuson, K. & Votruba-Drzal, E. (2015). Children and socioeconomic status. In M. H. Bornstein, T. Leventhal, & R. M. Lerner (Eds.), Handbook of child psychology and developmental science: ecological environments and processes (7th ed., pp. 534–573). John Wiley & Sons, Inc. [CrossRef]
- Engle, P. L., & Black, M. M. (2008). The effect of poverty on child development and educational outcomes. Annals of the New York Academy of Sciences, 1136, 243–256. [CrossRef]
- Efklides, A. (2009). The role of metacognitive experiences in the learning process. Psicothema, 21(1), 76–82. https://reunido.uniovi.es/index.php/PST/article/view/8799.
- Ferguson, H. J., Brunsdon, V. E., & Bradford, E. E. (2021). The developmental trajectories of executive function from adolescence to old age. Scientific reports, 11(1), 1382. [CrossRef]
- Field, A. (2013). Discovering statistics using IBM SPSS statistics (4th ed.). Sage Publications.
- Frick, M. A., Forslund, T., Fransson, M., Johansson, M., Bohlin, G. & Brocki, K. C. (2017). The role of sustained attention, maternal sensitivity, and infant temperament in the development of early self-regulation. British Journal Of Psychology, 109(2), 277–298. [CrossRef]
- Friedman, N. P., & Miyake, A. (2017). Unity and diversity of executive functions: Individual differences as a window on cognitive structure. Cortex, 86, 186–204. [CrossRef]
- Friedman N. P., Miyake, A., Corley, R. P., Young, S. E., DeFries, J. C., & Hewitt, J. K. (2006). Not All Executive Functions Are Related to Intelligence. Psychological Science, 17(2), 172–179. [CrossRef]
- Friedman, N. P., Miyake, A., Young, S. E., DeFries, J. C., Corley, R. P., & Hewitt, J. K. (2008). Individual differences in executive functions are almost entirely genetic in origin. Journal of experimental psychology: General, 137(2), 201–225. [CrossRef]
- Fuster, J. M. (2001). The prefrontal cortex--an update: time is of the essence. Neuron, 30(2), 319–333. [CrossRef]
- Gagne, J. R., Liew, J., & Nwadinobi, O. K. (2021). How does the broader construct of self-regulation relate to emotion regulation in young children?. Developmental Review, 60, Article 100965. [CrossRef]
- Stap2Go S.L. (2022). Stap2Go (1.3.0) [App]. https://play.google.com/store/apps/details?id=com.GeneticAI.STap2Go&hl=es_419&gl=US).
- Gioia, G. A., Isquith, P. K., Guy, S. C. & Kenworthy, L. (2015). Behavior Rating Inventory of Executive Function, Second Edition (BRIEF-2). Psychological Assessment Resources. [CrossRef]
- Goldberg, E. (2001). The executive brain: Frontal lobes and the civilized mind. Oxford University Press, USA.
- Grolnick, W. S., & Ryan, R. M. (1989). Parent styles associated with children's self-regulation and competence in school. Journal of educational psychology, 81(2), 143–154. [CrossRef]
- Hackman, D. A., Farah, M. J. & Meaney, M. J. (2010). Socioeconomic status and the brain: mechanistic insights from human and animal research. Nature reviews. Neuroscience, 11(9), 651–659. [CrossRef]
- Hedges, L. V., & Olkin, I. (1985). Statistical Methods for Meta-Analysis. Academic Press.
- Hofmann, W., Schmeichel, B. J. & Baddeley, A. (2012). Executive functions and self-regulation. Trends in Cognitive Sciences, 16(3), 174–180. [CrossRef]
- Isquith, P. Κ., Gioia, G. A. & Espy, K. A. (2004). Executive Function in Preschool Children: Examination Through Everyday Behavior. Developmental Neuropsychology, 26(1), 403–422. [CrossRef]
- Jahromi, L. B., & Stifter, C. A. (2008). Individual differences in preschoolers' self-regulation and theory of mind. Merrill-Palmer Quarterly, 54(1), 125–150. [CrossRef]
- Jiménez, L., Astiz, D., Hidalgo, V., & Contín, M. (2019). Ensuring respect for at-risk children’s rights. Lessons learned from home-and group-based family education programs. In L. Moran & J. Canavan (Eds.), Realising children’s rights through supporting parents (pp. 43–60). UNESCO Child and Family Research Centre. https://cdn.flipsnack.com/widget/v2/widget.html?hash=ftkarl897.
- Johann, V. E., & Karbach, J. (2020). Effects of game-based and standard executive control training on cognitive and academic abilities in elementary school children. Developmental science, 23(4), e12866. [CrossRef]
- Johann, V., Könen, T., & Karbach, J. (2019). The unique contribution of working memory, inhibition, cognitive flexibility, and intelligence to reading comprehension and reading speed. Child Neuropsychology, 26(3), 324–344. [CrossRef]
- Jolles, D. D., & Crone, E. A. (2012). Training the developing brain: a neurocognitive perspective. Frontiers in human neuroscience, 6, 76. [CrossRef]
- Jones, S. M., Bailey, R., Barnes, S. P., & Partee, A. (2016). Executive Function Mapping Project: Untangling the terms and skills related to executive function and self-regulation in early childhood. (Issue October). Office of Planning, Research and Evaluation, Administration for Children and Families, U.S. Department of Health and Human Services. https://www.acf.hhs.gov/sites/default/files/documents/opre/efmapping_report_101416_final_508.pdf.
- Jones, J. S., Milton, F., Mostazir, M., & Adlam, A. R. (2020). The academic outcomes of working memory and metacognitive strategy training in children: A double-blind randomized controlled trial. Developmental science, 23(4), e12870. [CrossRef]
- Joseph, R. M., & Tager–Flusberg, H. (2004). The relationship of theory of mind and executive functions to symptom type and severity in children with autism. Development and psychopathology, 16(1), 137-155. [CrossRef]
- Karbach, J. & Unger, K. (2014).Executive Control training from middle childhood to adolescence. Frontiers in Psychology, 5. [CrossRef]
- Larsen, B., & Luna, B. (2018). Adolescence as a neurobiological critical period for the development of higher-order cognition. Neuroscience and biobehavioral reviews, 94, 179–195. [CrossRef]
- Lewis, L. R., Lopez, R. A., Hunt, R. H., Hodel, A. S., Gunnar, M. R., & Thomas, K. M. (2024). Impacts of early deprivation on behavioral and neural measures of executive function in early adolescence. Brain and cognition, 179, 106183. [CrossRef]
- Lipina, S. J., Hermida, M. J., Segretin, M. S., Prats, L., Fracchia, C. & Colombo, J. A. (2011). Childhood poverty and cognitive development: a review from developmental neuroscience. Argentine Journal of Public Health, 2(6), 25–37.
- Liu, Q., Zhu, X., Ziegler, A. & Shi, J. (2015). The effects of inhibitory control training for preschoolers on reasoning ability and neural activity. Scientific reports, 5, 14200. [CrossRef]
- Lozano Gutiérrez, A. & Ostrosky F. (2011). Development of Executive Functions and the Prefrontal Cortex. Neuropsychology, Neuropsychiatry and Neurosciences Journal, 11(1), 159–172.
- Manfra, L., Davis, K. D., Ducenne, L., & Winsler, A. (2014). Preschoolers’ motor and verbal self-control strategies during a resistance-to-temptation task. The Journal of Genetic Psychology, 175(4), 332–345. [CrossRef]
- Marcovitch, S. & Zelazo, P. D. (2009). A hierarchical competing systems model of the emergence and early development of executive function. Developmental science, 12(1), 1–18. [CrossRef]
- Martins, M., Pinto, R., Živković, M. & Jiménez, L. (2024). Parenting Competences Among Migrant Families Living at Psychosocial Risk in Spain. Journal of International Migration and Integration, 25(2), 737–758. [CrossRef]
- Marulis, L. M., Baker, S. T., & Whitebread, D. (2020). Integrating metacognition and executive function to enhance young children’s perception of and agency in their learning. Early Childhood Research Quarterly, 50, 46–54. [CrossRef]
- Melby-Lervåg M, Redick TS, & Hulme C (2016). Working memory training does not improve performance on measures of intelligence or other measures of “far transfer”: Evidence from a meta-analytic review. Perspectives on Psychological Science, 11(4), 512–534. [CrossRef]
- Miller, B. L., & Cummings, J. L. (Eds.). (2017). The human frontal lobes: Functions and disorders. Guilford Publications.
- Miyake, A., Friedman, N. P., Emerson, M. J., Witzki, A., Howerter, A. & Wager, T. D. (2000). The unity and diversity of executive functions and their contributions to complex “Frontal lobe” tasks: a latent variable analysis. Cognitive Psychology, 41(1), 49–100. [CrossRef]
- Miyake, A., & Friedman, N. P. (2012). The nature and organization of individual differences in executive functions: Four general conclusions. Current Directions in Psychological Science, 21(1), 8–14. [CrossRef]
- Moraine, P. (2014). The student's executive functions. Improving attention, memory, organisation and other functions to facilitate learning. Narcea.
- Morgan, A. B. & Lilienfeld, S. O. (2000). A meta-analytic review of the relation between antisocial behavior and neuropsychological measures of executive function. Clinical Psychology Review, 20(1), 113–136. [CrossRef]
- Morrison, A. B. & Chein, J. (2011). Does working memory training work? The promise and challenges of enhancing cognition by training working memory. Psychonomic Bulletin & Review, 18(1), 46–60. [CrossRef]
- Nelson, T. O. (1990). Metamemory: A theoretical framework and new findings. Psychology of learning and motivation, 26, 125–173). [CrossRef]
- Nelson, T. O., & Narens, L. (1994). Metacognition: Knowing about knowing. In J. Metcalfe & A. P. Shimamura (Eds.), Metacognition: Knowing about knowing (pp. 1–25). The MIT Press. [CrossRef]
- Niebaum, J.C., & Munakata, Y. (2022). Why Doesn't Executive Function Training Improve Academic Achievement? Rethinking Individual Differences, Relevance, and Engagement from a Contextual Framework. Journal of Cognition and Development, 24(2), 241–259. [CrossRef]
- Oberste, M., Javelle, F., Sharma, S., Joisten, N., Walzik, D., Bloch, W. & Zimmer, P. (2019). Effects and Moderators of Acute Aerobic Exercise on Subsequent Interference Control: A Systematic Review and Meta-Analysis. Frontiers in Psychology, 10, 2616. [CrossRef]
- Obonsawin, M. C., Crawford, J. R., Page, J. M., Chalmers, P., Cochrane, R. H. B. & Low, G. (2002). Performance on tests of frontal lobe function reflect general intellectual ability. Neuropsychologia, 40(7), 970–977. [CrossRef]
- Ohtani, K., & Hisasaka, T. (2018). Beyond intelligence: A meta-analytic review of the relationship among metacognition, intelligence, and academic performance. Metacognition and Learning, 13(2), 179–212. [CrossRef]
- Peng, P., Namkung, J., Barnes, M., & Sun, C. Y. (2015). A meta-analysis of mathematics and working memory: Moderating effects of working memory domain, type of mathematics skill, and sample characteristics. Journal of Educational Psychology, 108, 455e473. [CrossRef]
- Pennington, B. F. & Ozonoff, S. J. (1996). Executive functions and developmental psychopathology. Journal of Child Psychology and Psychiatry, 37(1), 51–87. [CrossRef]
- Perone, S., Simmering, V. R., & Buss, A. T. (2021). A dynamical reconceptualization of executive-function development. Perspectives on Psychological Science, 16(6), 1198–1208. [CrossRef]
- Piu Piu Apps (2023). Kawaii Paint Gradient (1.4.2 Version) [App].https://play.google.com/store/apps/details?id=com.piupiuapps.coloringgradientkawaii&hl=es_CR.
- Rodrigo, M.J., Byrne, S., & Álvarez, M. (2011). Preventing child maltreatment through parenting programmes implemented at the local social services level. European Journal of Developmental Psychology, 9(1), 89–103. [CrossRef]
- Pozuelos, J. P., Cómbita, L. M., Abundis, A., Paz-Alonso, P. M., Conejero, Á., Guerra, S. & Rueda, M. R. (2018). Metacognitive scaffolding boosts cognitive and neural benefits following executive attention training in children. Developmental Science, 22(2), e12756. [CrossRef]
- Reder, L. M., & Schunn, C. D. (2014). Metacognition does not imply awareness: Strategy choice is governed by implicit learning and memory. In Implicit memory and metacognition (pp. 45–77). Psychology Press.
- Reynolds, C. R. & Kamphaus, R. W. (2013). RIAS and RIST Manual. Spanish adaptation. TEA Editions.
- Riccio, C. A., Hewitt, L. L. & Blake, J. J. (2011). Relationship of measures of executive function with aggressive behavior in children. Applied Neuropsychology, 18 (1), 1–10. [CrossRef]
- Richland, L. E., & Burchinal, M. R. (2013). Early Executive Function Predicts Reasoning Development. Psychological Science, 24(1), 87–92. [CrossRef]
- Roebers, C. M. (2017). Executive function and metacognition: Towards a unifying framework of cognitive self-regulation. Developmental Review, 45, 31–51. [CrossRef]
- Roebers, C. M., & Feurer, E. (2016). Linking executive functions and procedural metacognition. Child Development Perspectives, 10(1), 39–44. [CrossRef]
- Rosselli, M., Matute, E. & Jurado, M.B. (2008). Executive functions throughout life. Neuropsychology, Neuropsychiatry and Neurosciences Journal, 8, 23–46.
- Rossignoli-Palomeque, T., Pérez-Hernandez, E. & González-Marqués, J. (2020). Training effects of attention and EF strategy-based training “Nexxo” in school-age students. Acta Psychologica, 210, 103174. [CrossRef]
- Rossignoli-Palomeque, T., Pérez-Hernández, E. & González-Marqués, J. (2018). Brain training in children and adolescents: Is it scientifically valid? Frontiers in Psychology, 9, 565. [CrossRef]
- Rossignoli-Palomeque, T., Quirós-Godoy, M., Perez-Hernandez, E., & González-Marqués, J. (2019). Schoolchildren's compensatory strategies and skills in relation to attention and executive function app training. Frontiers in Psychology, 10, 2332. [CrossRef]
- Rueda, M. R., Posner, M. I. & Rothbart, M. K. (2005). The development of executive attention: Contributions to the emergence of self-regulation. Developmental Neuropsychology, 28(2), 573–594. [CrossRef]
- Sabbagh, M. A., Xu, F., Carlson, S. M., Moses, L. J., & Lee, K. (2006). The Development of Executive Functioning and Theory of Mind: A Comparison of Chinese and U.S. Preschoolers. Psychological Science, 17(1), 74–81. [CrossRef]
- Sala, G., & Gobet, F. (2019). Cognitive training does not enhance general cognition. Trends in cognitive sciences, 23(1), 9–20. [CrossRef]
- Sarwar, S. (2016). Influence of parenting style on children's behaviour. Journal of Education and Educational Development, 3(2). [CrossRef]
- Schmidt, H., Daseking, M., Gawrilow, C., Karbach, J. & Kerner Auch Koerner J. (2022). Self-regulation in preschool: Are executive function and effortful control overlapping constructs? Dev Sci., 25(6):e13272. [CrossRef]
- Schoemaker, K., Mulder, H., Deković, M. & Matthys, W. (2012). Executive Functions in Preschool Children with Externalizing Behavior Problems: A Meta-Analysis. Journal Of Abnormal Child Psychology, 41(3), 457–471. [CrossRef]
- Schoemaker, P. H., Krupp, S. & Howland, S. (2013). Strategic leadership: The essential skills. Harvard business review, 91(1-2). 131–4, 147.
- Sedó, M. (2007). Five Digit Test. TEA Ediciones.
- Séguin, J. R. (2009). The frontal lobe and aggression. European Journal Of Developmental Psychology, 6(1), 100–119. [CrossRef]
- Séguin, J. R., Boulerice, B., Harden, P. W., Tremblay, R. E. & Pihl, R. O. (1999). Executive functions and physical aggression after controlling for attention deficit hyperactivity disorder, general memory, and IQ. Journal of Child Psychology and Psychiatry, 40(8), 1197–1208. [CrossRef]
- Semrud-Clikeman, M. & Bledsoe, J. (2011). Updates on Attention-Deficit/Hyperactivity Disorder and Learning Disorders. Curr Psychiatry Rep, 13(5), 364–373. [CrossRef]
- Shimamura AP. (2000). Toward a cognitive neuroscience of metacognition. Conscious Cogn., 9(2), 313–323. [CrossRef]
- Shin, M., & Brunton, R. (2024). Early life stress and mental health—Attentional bias, executive function and resilience as moderating and mediating factors. Personality and Individual Differences, 221, 1–9. [CrossRef]
- Shore, R. (1997). Rethinking the Brain: New Insights Into Early Development. Families and Work Institute.
- Simons, D. J., Boot, W. R., Charness, N., Gathercole, S. E., Chabris, C. F., Hambrick, D. Z., & Stine-Morrow, E. A. (2016). Do “brain-training” programs work?. Psychological science in the public interest, 17(3), 103–186. [CrossRef]
- Smid, C. R., Karbach, J., & Steinbeis, N. (2020). Toward a science of effective cognitive training. Current Directions in Psychological Science, 29(6), 531–537. [CrossRef]
- Sroufe, L. A. (2000). Emotional development: the organization of emotional life in the early years. Cambridge University Press.
- Strobach, T. & Karbach, J. (2021). Cognitive Training. An Overview of Features and Applications (second edition). Springer. [CrossRef]
- Stuss D. T. (2011). Functions of the frontal lobes: relation to executive functions. Journal of the International Neuropsychological. Society: JINS, 17(5), 759–765. [CrossRef]
- Tamm, L., & Nakonezny, P. A. (2015). Metacognitive executive function training for young children with ADHD: a proof-of-concept study. Attention deficit and hyperactivity disorders, 7(3), 183–190. [CrossRef]
- Takacs, Z. K. & Kassai, R. (2019). The efficacy of different interventions to foster children’s executive function skills: a series of meta-analyses. Psychological Bulletin, 145(7), 653–697. [CrossRef]
- The Jamovi Project. (2022). Jamovi (Version 2.3.24) [Software]. https://www.jamovi.org.
- Titz, C. & Karbach, J. (2014). Working memory and executive functions: Effects of training on academic achievement. Psychological Research, 78(6), 852–868. [CrossRef]
- Waber, D. P., Gerber, E., Turcios, V. Y., Wagner, E. R. & Forbes, P. (2006). Executive Functions and performance on High-Stakes testing in children from urban schools. Developmental Neuropsychology, 29(3), 459–477. [CrossRef]
- Wang, T., Li, C., Ren, X., & Schweizer, K. (2021). How executive processes explain the overlap between working memory capacity and fluid intelligence: A test of process overlap theory. Journal of Intelligence, 9(2), 2 . [CrossRef]
- Wechsler, D. (2015). WISC-V. Wechsler Intelligence Scale for Children-V. Pearson.
- Wood, D., Bruner, J. S. & Ross, G. (1976). The role of tutoring in problem solving. Journal of Child Psychology and Psychiatry, 17(2), 89–100. [CrossRef]
- Yoshikawa, H., Aber, J. L., & Beardslee, W. R. (2012). The effects of poverty on the mental, emotional, and behavioral health of children and youth: implications for prevention. The American psychologist, 67(4), 272–284. [CrossRef]
- Zelazo, P. D. & Carlson, S. M. (2012). Hot and Cool Executive Function in Childhood and Adolescence: Development and Plasticity. Child Development Perspectives, 6(4), 354–360. [CrossRef]
- Zelazo, P. D., Craik, F. I. M. & Booth, L. (2004). Executive function across the life span. Acta Psychologica, 115(2-3), 167–183. [CrossRef]
- Zelazo, P. D., Qu, L., & Kesek, A. C. (2010). Hot executive function: Emotion and the development of cognitive control. In S. D. Calkins & M. A. Bell (Eds.), Child development at the intersection of emotion and cognition (pp. 97–111). American Psychological Association. [CrossRef]
- Zelazo, P. D., Qu, L., & Müller, U. (2005). Hot and cool aspects of executive function: Relations in early development. In W. Schneider, R. Schumann-Hengsteler, & B. Sodian (Eds.), Young children's cognitive development: Interrelationships among executive functioning, working memory, verbal ability, and theory of mind (pp. 71–93). Lawrence Erlbaum Associates Publishers.
- Zhao, X., Chen, L. & Maes, J. H. R. (2018). Training and transfer effects of response inhibition training in children and adults. Developmental Science, 95(T), eTWsTT. [CrossRef]
- Zuber, S., Joly-Burra, E., Mahy, C.E.V., Loaiza, V., & Kliegel, M. (2022). Are facet-specific task trainings efficient in improving children's executive functions, and why (they might not be)? A multi-facet latent change score approach. Journal of Experimental Child Psychology, 227, 105602. [CrossRef]
Figure 1.
Participant’s Flow diagram.
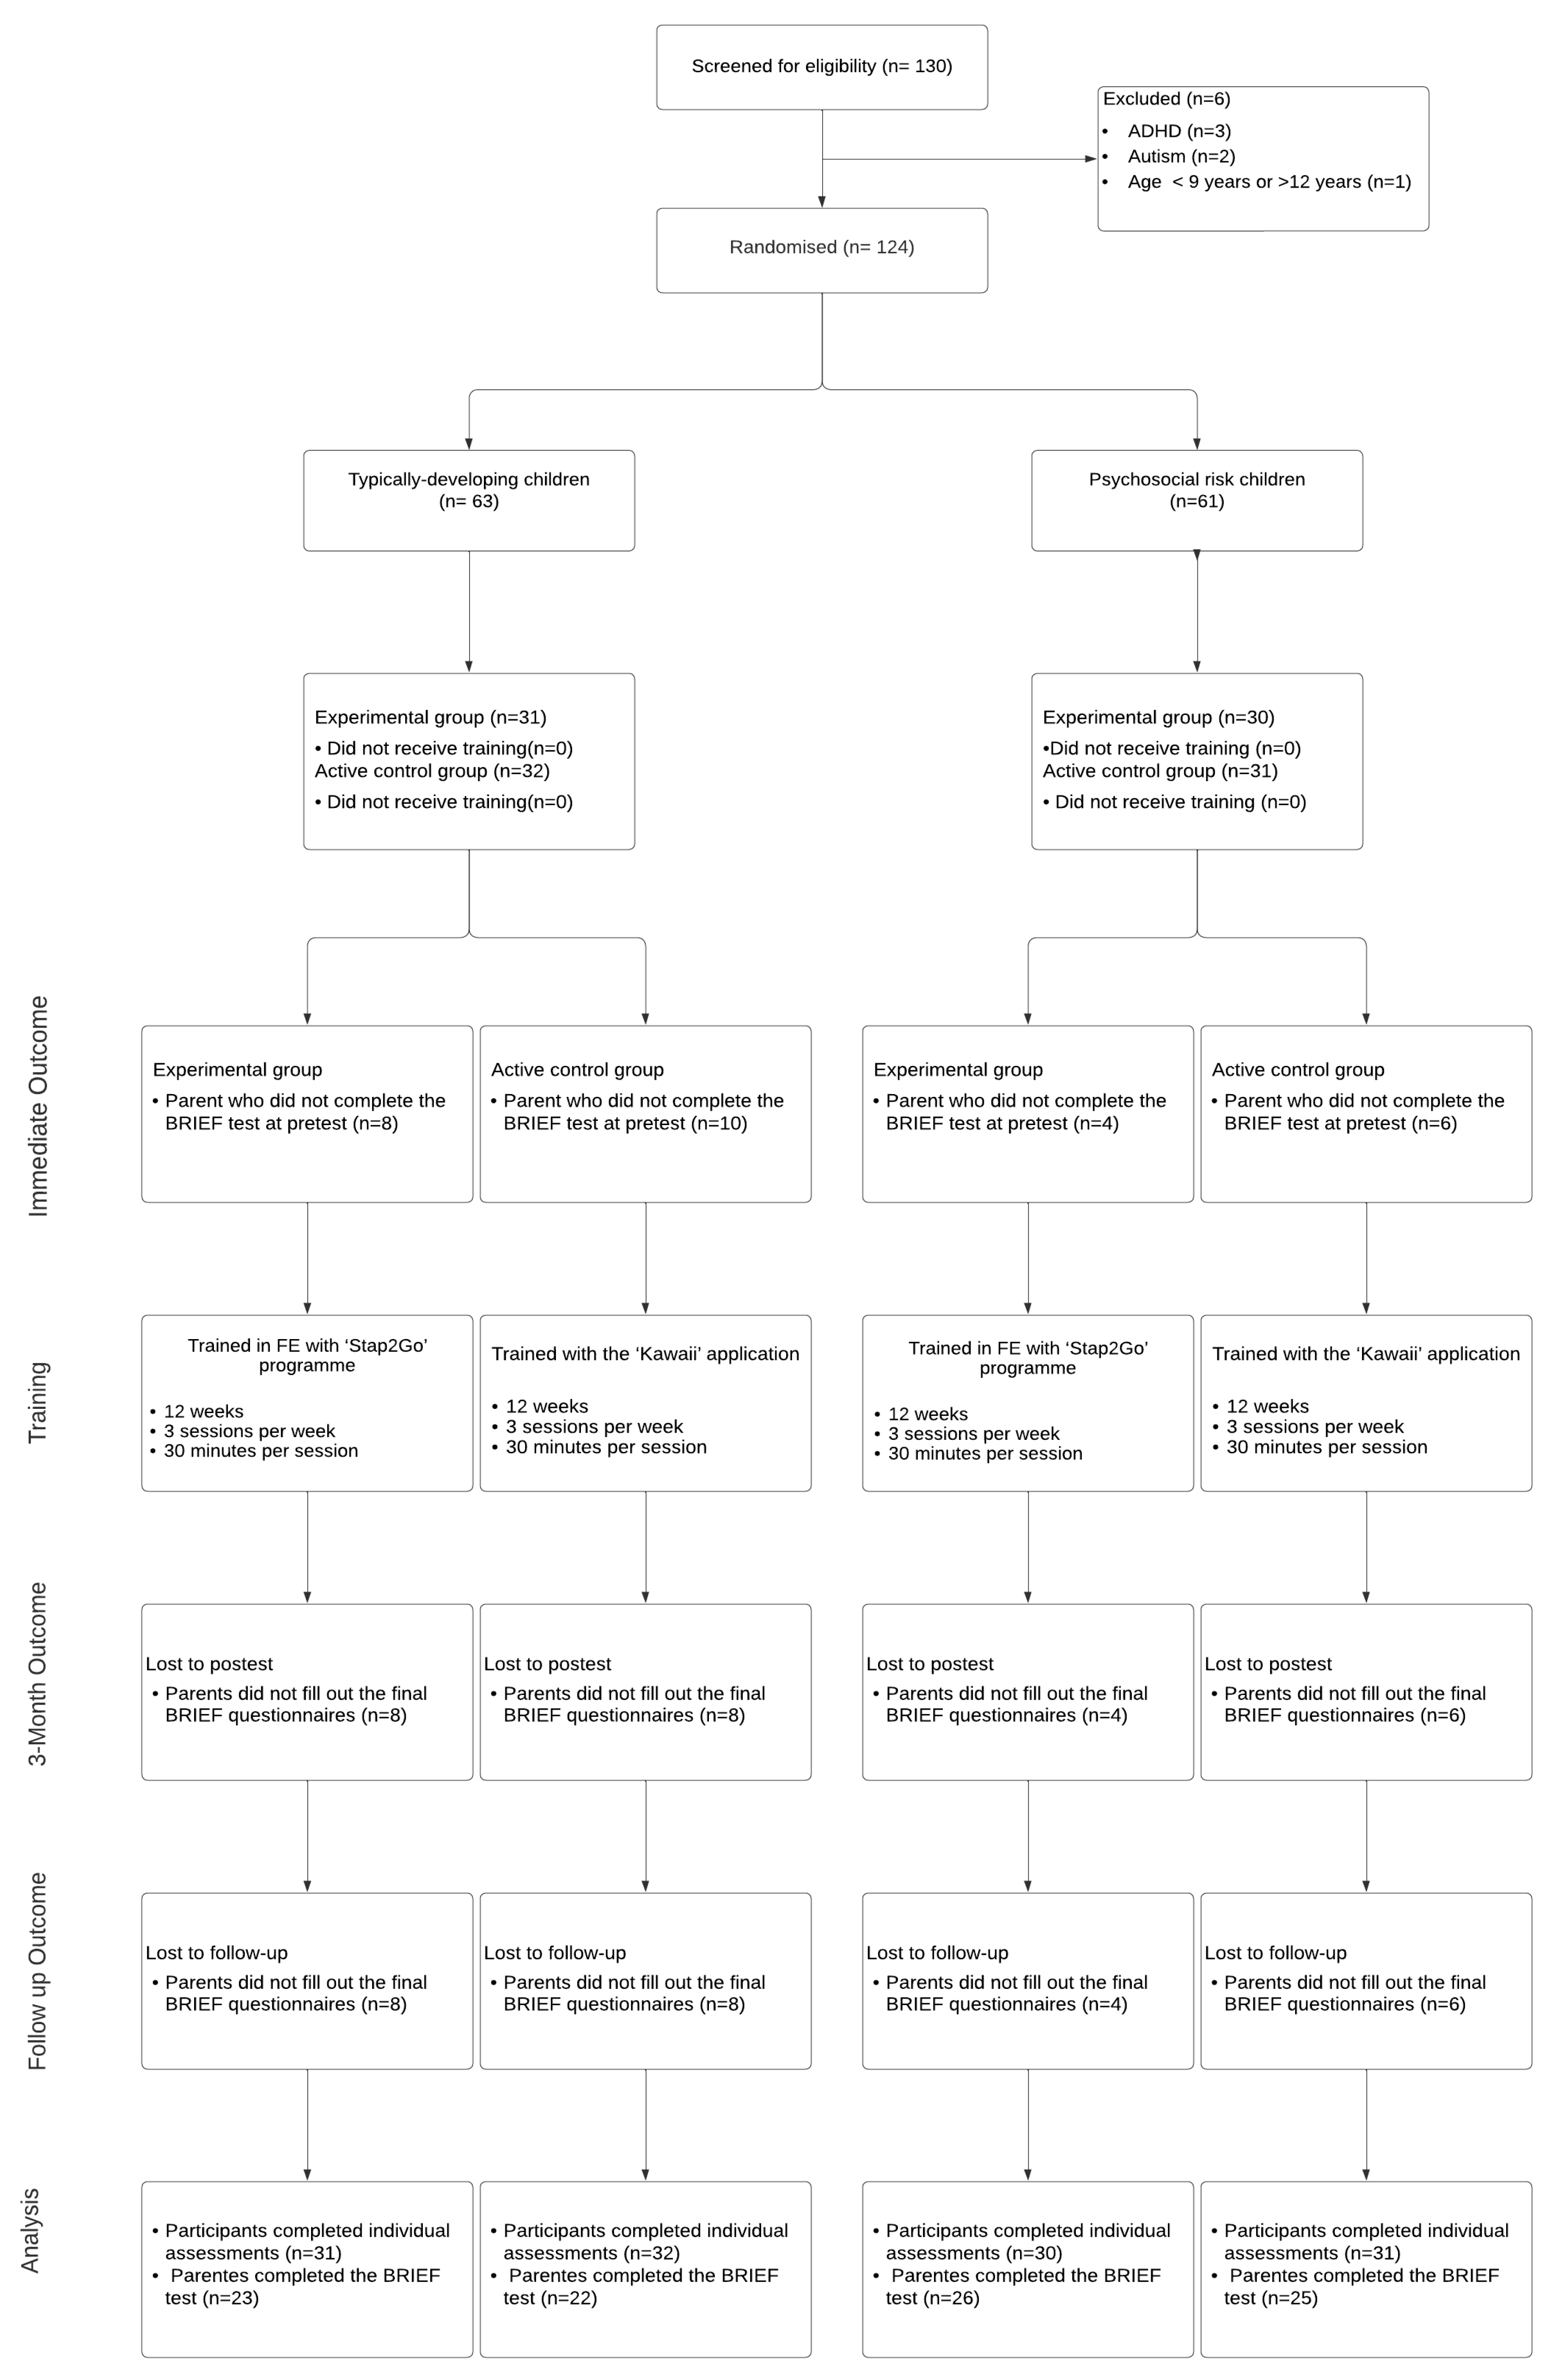
Figure 2.
Illustration of the study design.
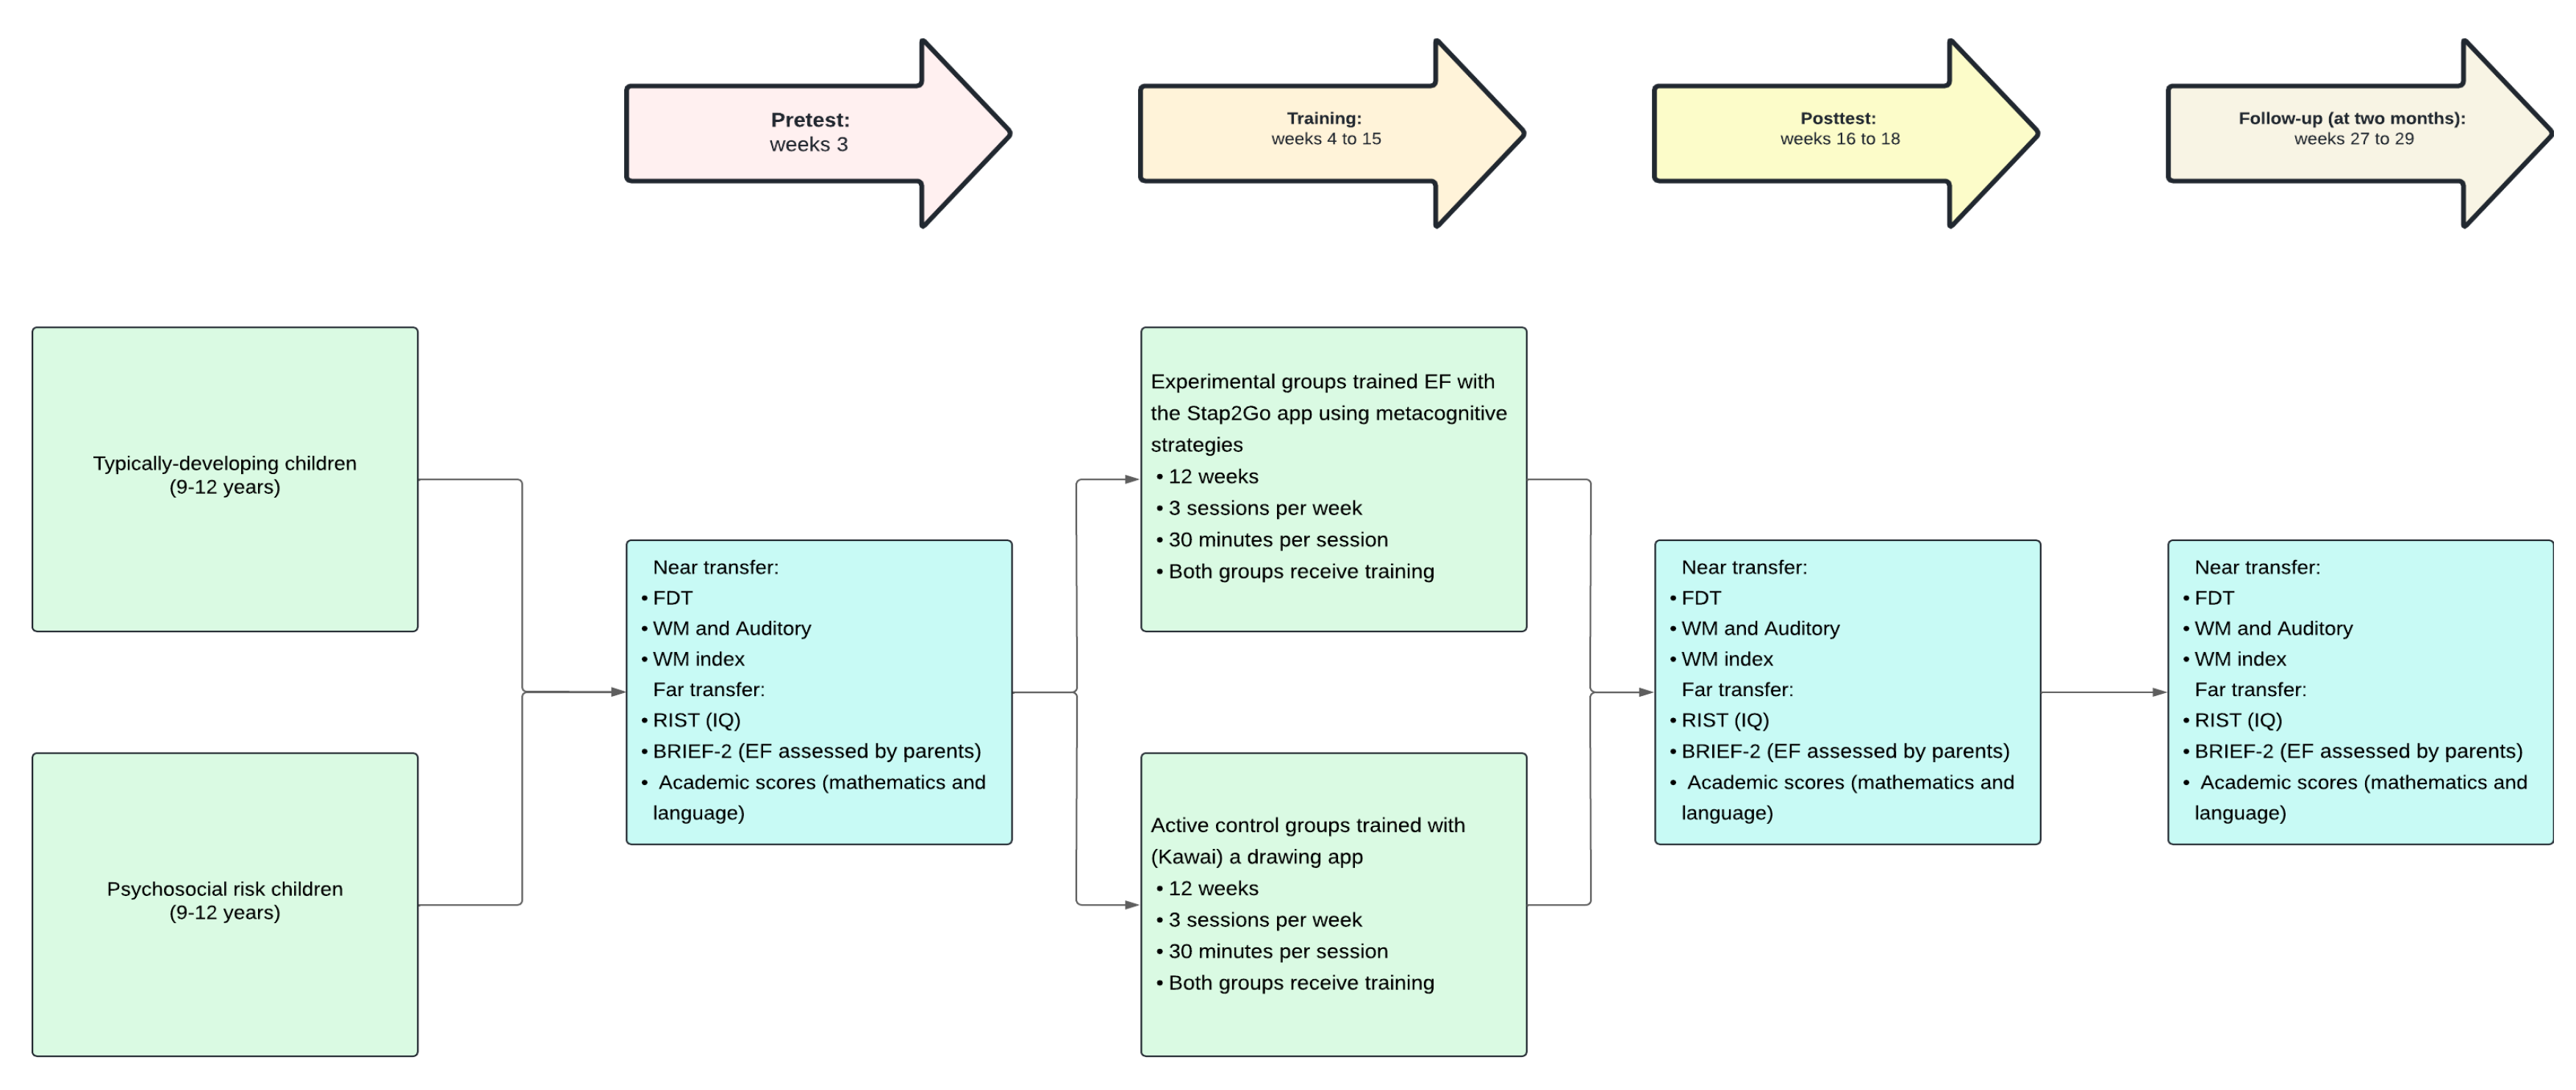
Figure 3.
Stap2Go exercise example. 1 Figure 3 legend: Stap2Go exercise example. Instruction: “Tap when you see something red”. In this case, user has to tap in the third screen. Stap2Go (2022). Reproduced with permission.
Figure 3.
Stap2Go exercise example. 1 Figure 3 legend: Stap2Go exercise example. Instruction: “Tap when you see something red”. In this case, user has to tap in the third screen. Stap2Go (2022). Reproduced with permission.
Figure 4.
Stap2Go strategy applied by the avatar example. 1 Figure 4 legend: Self-control strategy in Stap2Go exercise applied when user tap impulsively: 1 “Wait” “Do you remember how we should act? 2 “See” “Do you remember how we should act? 3 “Decide” “Do you remember how we should act? Stap2Go (2022). Reproduced with permission.
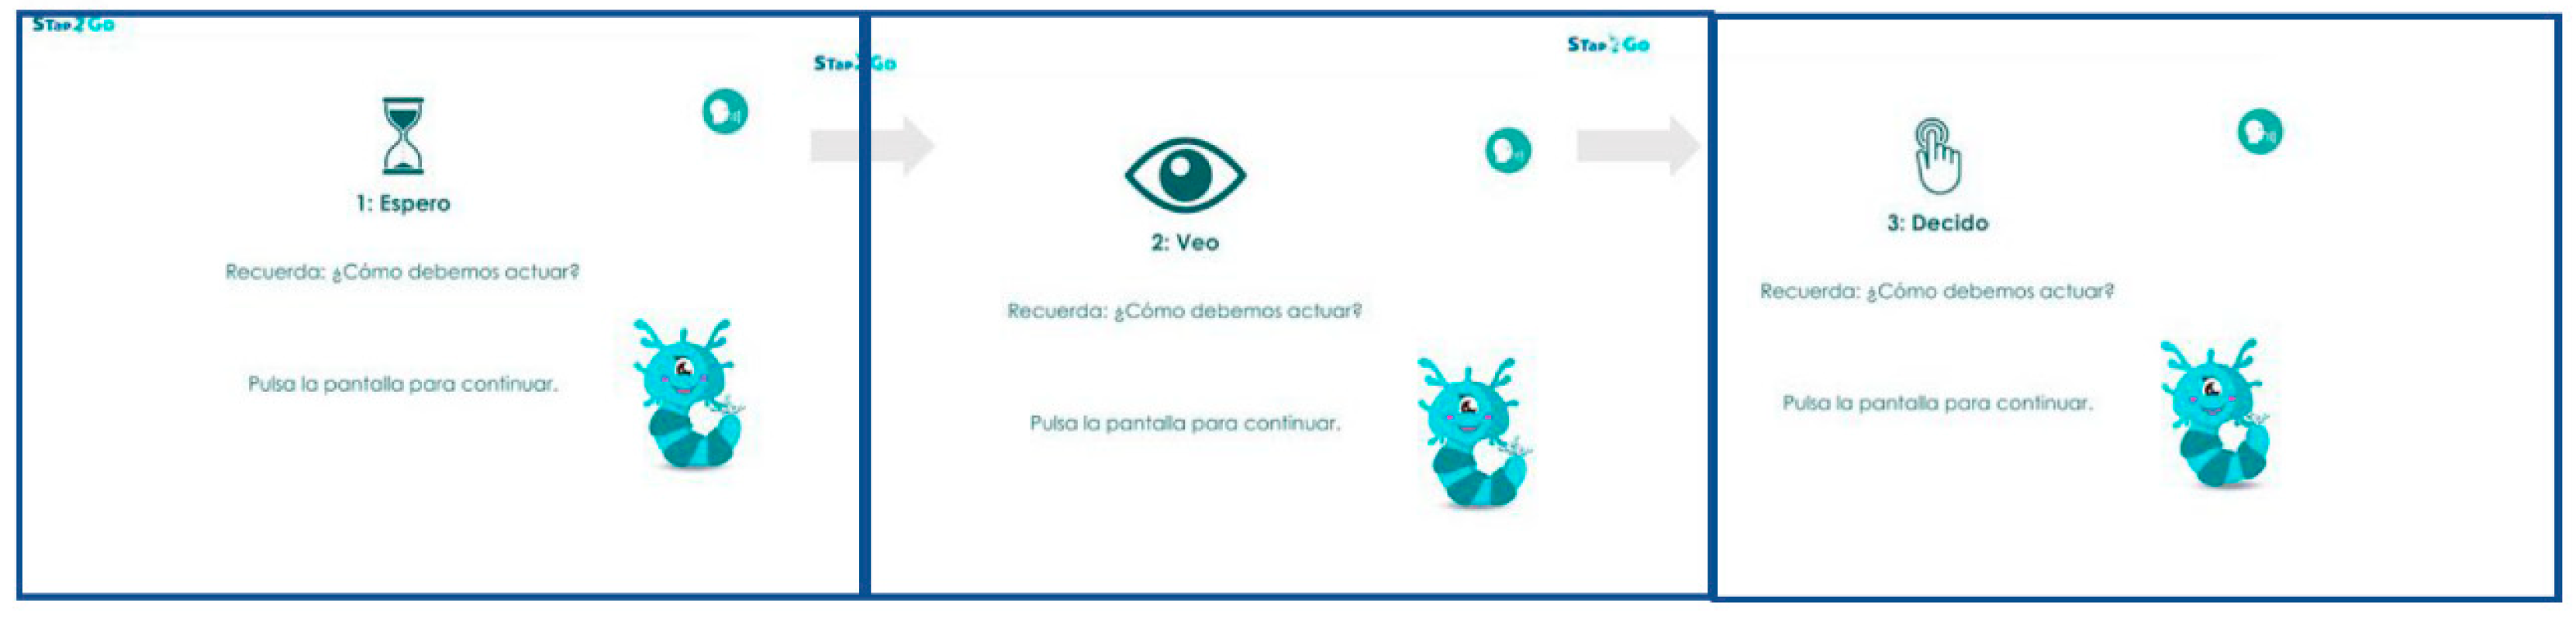
Figure 6.
Mean Chart of the Variables Considered as Transfer in Participants’ Daily Lives as Variables Were Assessed Through Parent Questionnaires.
Figure 6.
Mean Chart of the Variables Considered as Transfer in Participants’ Daily Lives as Variables Were Assessed Through Parent Questionnaires.
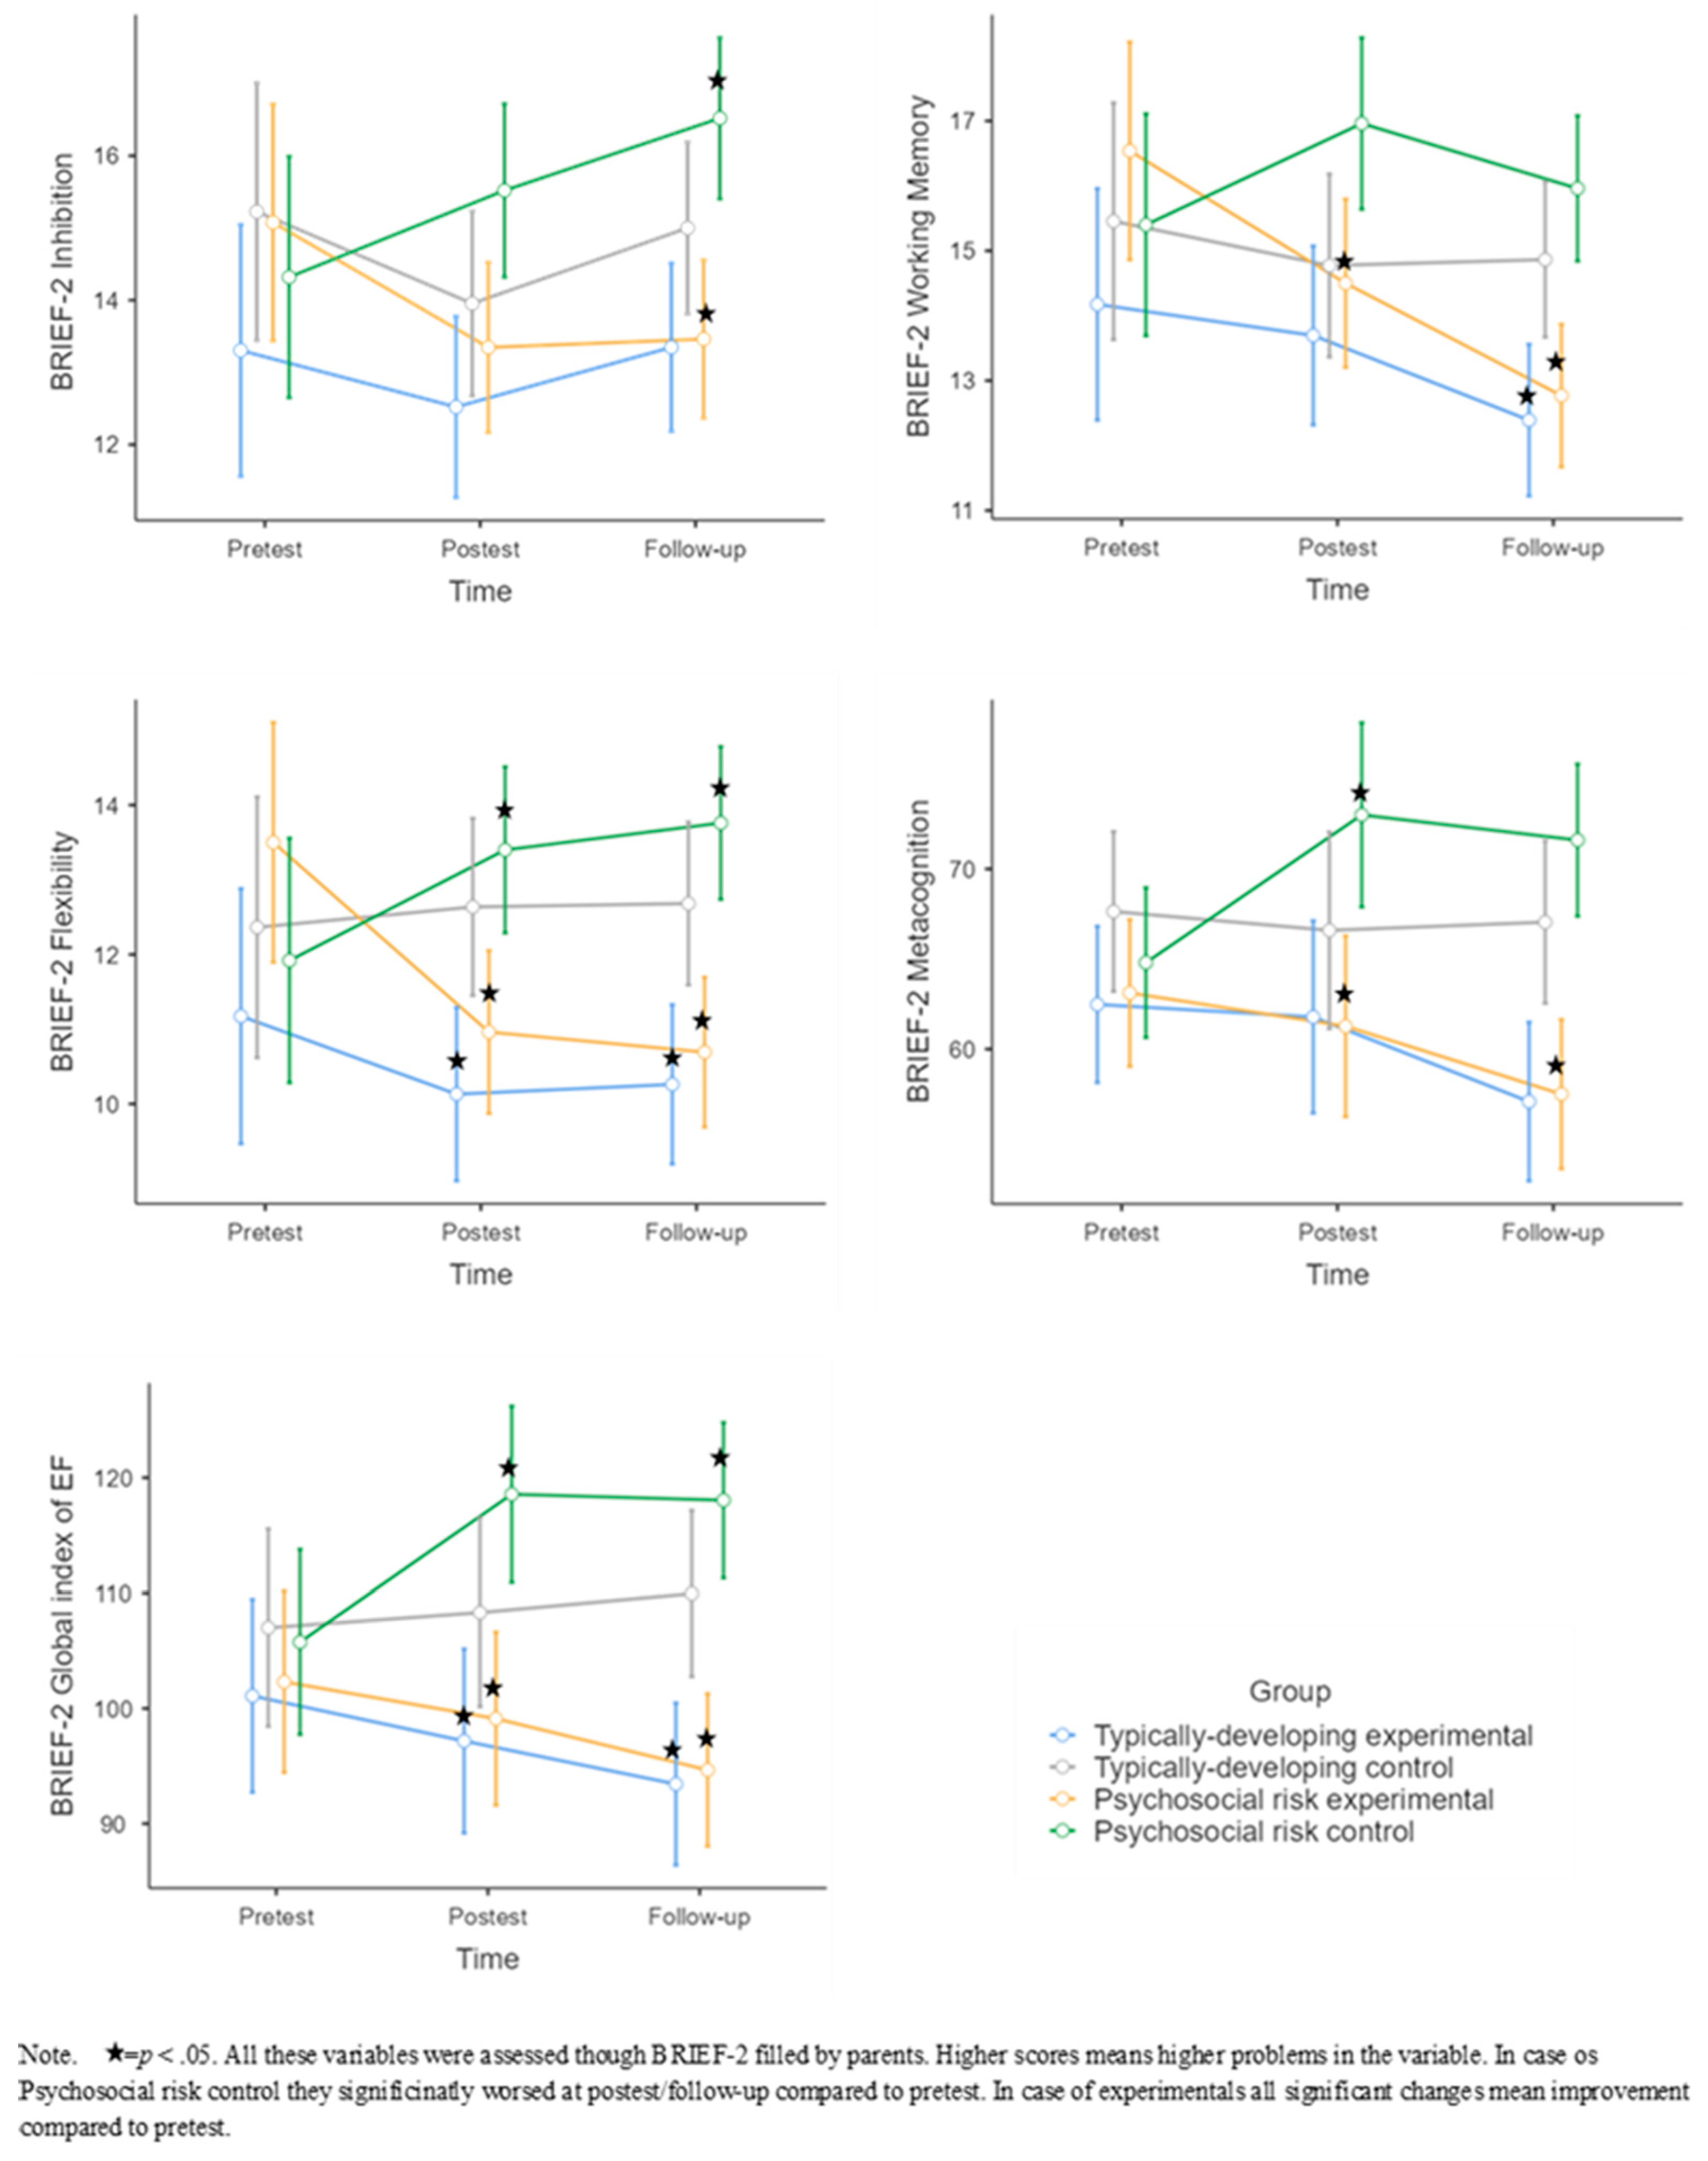
Table 1.
Sociodemographic characteristics of the participants.
| RIST | Gender F/M | Age | ||
| Pretest | Typically-developing experimental group | 91.1 (4.76) | 14/17 | 133 (12.9) |
| Typically-developing control group | 90.7 (3.70) | 12/20 | 131 (6.96) | |
| Psychosocial risk experimental group | 89.8 (3.22) | 14/16 | 135 (8.76) | |
| Psychosocial risk control group | 90.8 (3.53) | 21/10 | 133 (10.3) | |
| F(3.120) | 0.69 (p = .057) |
1.13 (p = .34) |
||
| Postest | Typically-developing experimental group | 94.3 (5.06) | 14/17 | 136 (12.9) |
| Typically-developing control group | 90.8 (3.17) | 12/20 | 135 (6.96) | |
| Psychosocial risk experimental group | 94.2 (4.04) | 14/16 | 138 (8.75) | |
| F(3.120) | 10.1 (p = < .001) |
1.14 | ||
| Follow-up | Typically-developing experimental group | 96.2 (5.36) | 14/17 | 140 (12.9) |
| Typically-developing control group | 90.0 (2.62) | 12/20 | 138 (6.94) | |
| Psychosocial risk experimental group | 96.8 (3.54) | 14/16 | 142 (8.76) | |
| Psychosocial risk control group | 90.5 (3.00) | 21/10 | 90.5 (3.00) | |
| F(14.5) | 32.4 (p = < .001) |
1.13 | ||
1 Table 1 legend: F= female; M= male. RIST: Reynolds Intellectual Screening Test. Age= participants’ age in terms of month.
Disclaimer/Publisher’s Note: The statements, opinions and data contained in all publications are solely those of the individual author(s) and contributor(s) and not of MDPI and/or the editor(s). MDPI and/or the editor(s) disclaim responsibility for any injury to people or property resulting from any ideas, methods, instructions or products referred to in the content. |
© 2025 by the authors. Licensee MDPI, Basel, Switzerland. This article is an open access article distributed under the terms and conditions of the Creative Commons Attribution (CC BY) license (http://creativecommons.org/licenses/by/4.0/).
Copyright: This open access article is published under a Creative Commons CC BY 4.0 license, which permit the free download, distribution, and reuse, provided that the author and preprint are cited in any reuse.


