Submitted:
26 January 2025
Posted:
28 January 2025
You are already at the latest version
Abstract
This work aims to study the technical and economical feasibility of a new hydrogen transport network by 2035 in France. The goal is to furnish the charging stations for fuel cell electrical vehicles with a hydrogen produced by electrolysis of water using low carbon energy. Contrary to previous research work on hydrogen transport for road transport, we assume a more realistic assumption of demand side: we assume that only drivers driving more than 20,000 km per year will switch to fuel cell electrical vehicles. This corresponds to a total demand of 100TWh of electricity for the production of hydrogen by electrolysis. To meet this demand, we primarily use surplus electricity production from wind power. This surplus will satisfy approximately 10% of demand. We assume that the rest of the demand will be produced using the surplus from nuclear power plants disseminated in the regions. We assume also a decentralized production, namely that 100 MW electrolyzers will be placed near the electricity production plants. Using an optimization model, we define the hydrogen transport network by considering decentralized production. Then we compare it to more centralized production. Our main conclusion is that decentralized production makes it possible to significantly reduce distribution costs, particularly due to significantly shorter transport distances.
Keywords:
hydrogen transport
; fuel cell electrical vehicles
1. Introduction
Currently, climate change and the depletion of fuel reserves Fossils are issues at the heart of global concerns. Particularly in the transport sector, which alone represents 31% of emissions in France. Therefore, with the aim of drastically reducing this emissions in the coming years, new resources, methods and strategies are needed in order to respond to this problem.
Today, fossil fuels dominate the production sector electricity in many countries. As a result, significant research is taking place to develop sustainable energy systems [1,2]. One solution is the electrification of vehicles for road transport, provided that the electricity is produced from low-carbon energy sources. However, a weak point of these vehicles is the battery recharge time, making their use very difficult or even impossible in certain sectors [3]. Therefore, the use of hydrogen for road transport appears to be a concrete solution to this problem, provided that it is produced from energies with a low carbon footprint, such as wind turbines or nuclear power plants.
In the future, it is estimated that hydrogen will become the second largest energy vector behind electricity [4]. It is reasonable to think that these are mainly the car users who drive long distances (more than 20,000 km/year) who will adopt fuel cell electrical vehicles. However, the development of a network of production and transport of hydrogen will require the implementation of numerous infrastructure in the coming years.
The problem was studied for France by André et al. [5] considering the problem of the optimal design of an hydrogen transmission network. The application to the case of development of future hydrogen pipeline networks in France has been conducted at national level. They consider an unique production point for hydrogen in France and an high level of use of hydrogen for particular cars. André et al. [6] consider that pipelines networks compete with other hydrogen carriers: compressed gas trucks and liquid cryogenic trucks. In this paper, they deal with the determination of the temporal deployment of a new hydrogen transportation infrastructure. They showed that for the mid term perspective and low market share, the trucks are the most economical options. The problem was also studied for Germany by Reuß et al. [7]. They consider a central production in the North of the country near big wind farms. For a review of hydrogen production and supply chain modeling and optimization, see Jefferson et al. [8].
The novelties of this work compared to existing studies concern three aspects. First, we consider a hydrogen market share significantly more reasonable than the large market share of previous studies. Second, we consider production delocalized in the regions rather than national production. Finally, thirdly, we only use water electrolysis to produce hydrogen from low-carbon electricity.
But in the current state of knowledge, the creation of a hydrogen transport network produced from low-balance energy carbon to meet part of the demand from the transport sector appears to be a realistic solution. Especially since predictions of energy production by wind turbines as well as nuclear power plants in the coming years should be able to satisfy this request.
Therefore, the general problem of this work is to study the feasibility of a hydrogen transport and distribution network for cars in France in 2035 using decentralized production by electrolysis of water from low-carbon electricity.
In order to answer this problem, we will answer the following research questions:
- What will be the total demand for hydrogen in France in 2035 for the road transport sector considering that only car users who drive long distances (more than 20,000 km/year) will switch to fuel cell electrical vehicles?
- What will be the energy supply of wind origin available for the production of green hydrogen for road transport?
- What will be the energy supply of nuclear power plants available for production hydrogen with low carbon emission?
- What is the cost of the considered hydrogen transport network?
- Is centralized or decentralized hydrogen production better economically?
Regarding demand for hydrogen, let us remember that, unlike existing work, we are adopting a much more realistic approach. As indicated in De Wolf and Smeers [3], it is more reasonable to think that only heavy car users may be interested in the advantages of hydrogen (recharging time of 3 minutes and greater autonomy than battery cars). We therefore consider here for each region of France, users doing more than 20,000 km per year.
The rest of the article is organized as follows. In Section 2, we calculate the hydrogen demand for the transport sector in 2035 as well as the surplus electricity production from wind turbines and nuclear power plants to meet this demand. Section 3 presents a mathematical model that makes it possible to define the hydrogen transport network. Section 4 presents the calculation of the complete cost of the hydrogen transport network for France in 2035 and compares the cases of a centralized production (German case) and that of a decentralized production (French case). Finally, we conclude in Section 5 and give some ideas for future research on the subject of evaluating the costs of transport and distribution of hydrogen for cars.
2. Demand and Supply
2.1. Demand of Hydrogen
To compute the future demand of hydrogen for road transport for France in 2035, we make the following assumptions:
- The proportions of drivers driving more than 20,000 km per year are currently well known by region of France. It is assumed that these proportions will remain the same in 2035 (See Table 1).
- It is assumed that it is necessary to have 1kg of hydrogen to travel 100 km for a fuel cell electrical vehicle (See Maruta [9]).
-
It is necessary to have 60.9kWh of electricity, which includes (See Pierre [10]):
- 56kWh of electricity per kg of for electrolysis of water,
- 4.9 kWh of electricity per kg of to compress at 900 bars (necessary because it need 700 bars in the car).
The Table 1 presents hydrogen demand by region in 2035 and the necessary quantity of electricity to produce and compress this hydrogen.
If we sum theses quantities over all France, we conclude that the total electricity demand per year to produce hydrogen for the transport sector is 100.37 TWh per year.
2.2. Wind Electricity Surplus for Hydrogen
To compute the surplus of wind turbines available in 2035 to produce green hydrogen, we make the following assumptions:
- Tlili et al [13] determined that 7.9 TWH/year was produced in surplus by renewable energies in France during 2017. In 2017, France produced 84.26 TWh of electrical energy thanks to these renewable sources. So a good estimate of the percentage of renewable energy allocable to hydrogen production is 9.38%. We assume that this factor will therefore be used and applied only to wind energy in our case.
Table 2 presents the excess production of wind turbines computed by region for France for 2035.
If we sum theses quantities over all France, we conclude that the total energy from wind turbines which can be used to produce green hydrogen is 10.1 TWh. This is approximatively 10% of the demand of electricity to produce the hydrogen total demand of road sector in 2035.
This naturally leads to the third question. Will the surplus production of nuclear power plants in France in 2035 be sufficient to meet the remaining 90%?
2.3. Surplus Nuclear Electricity for Hydrogen
In France, there are 56 reactors on 18 sites, for an energy capacity of 61.4 GW in 2024. But by 2035, it is estimated that the total energy capacity produced by nuclear power will be 46.4 GW, due among other things to the age of the power plants. Estimated values of the reduction in the capacity of nuclear power plants by 2035 in each region of France, are calculated by Tliti et al [13]. These values are deduced from the actual capacity of existing nuclear plants.
To compute the excess of production of nuclear plants in France in 2035 available to produce hydrogen, we make the following assumptions:
- The efficiency of nuclear plants, namely the average production divided by the nominal power is 85%.
-
The annual production of nuclear plants in France in 2017 is 379.1 TWh (See Ministère du Développement Durable [14]). We know that the nominal capacity of the parks is 61.4 GW corresponding to a theoretical maximum annual production of 553.02 TWh. The actual excess production of nuclear plants France is thus:We suppose that the same proportion will remain available in 2035.
Table 3 presents the excess production of nuclear plants for France for 2035.
However, it must also be taken into account that nuclear power plants do not not work at 100%, but on average at 85%. This percentage takes into account the maintenance and refueling periods. Finally, the power available will be:
It is clear that this amont is sufficient to fill the gap of electricity produced by wind turbines to satisfy the demand for hydrogen (90.36 TWh).
As we make the hypothesis that we first use the excess of production from wind turbines, and then, for the missing part, the excess of production of nuclear power plants, we conclude that the supply used from nuclear electricity will be 90.36 TWh, the part of the total demand not furnished by wind turbines surplus.
It should be noted that to reach this level of production surplus, electricity production by nuclear power plants will have to be increased by 32.44% by 2035 to meet the demand for hydrogen from the road transport.
Figure 1 presents, for each region of France, the surplus electricity from wind turbines (WT), the surplus electricity from nuclear power plants (N) mobilized to produce hydrogen and the region’s electricity demand (D) to produce the region’s demand for hydrogen. Remember that we have chosen to locate production locations close to low-carbon electricity sources in France, that is to say near large offshore wind farms and near nuclear electricity production centers.
We see that electricity supply is not at all balanced with demand region by region. We will see in section 3 how to define optimal transfers between surplus regions and demand regions. But before that we say a word about the location chosen in our model for the electrolysers as well as how to calculate the number of electrolyzers per production point.
2.4. Location and Number of Electrolyzers
We make the following assumptions concerning the location of the electrolyzers:
- For electrolyzers using nuclear electricity, we assume a location close to the source, namely close to the nuclear plants (See Figure 2).
- For electrolyzers using onshore wind electricity, since the onshore wind turbines are disseminated all over France, we assume a location close to nuclear plants and we use the grid to transport electricity from the supply point (the wind turbine) to the production point (the electrolyser).
- For electrolyzers using offshore wind electricity, we assume a location close to the important wind farm of St-Nazaire (See Figure 2).
To compute, the number of electrolysers for each production point, we assumed that this number is proportional to the source’s power and we suppose that we use electrolysers of a nominal power of 100 MW.
Figure 2 presents the number of of electrolyzers (E) and the total hydrogen production () for each location of a production point.
3. Network Design
The objective of the mathematical model is to assign demand of the region to the nearest supply points.
We make the following assumptions to define the mathematical program:
- Demand of each region is assumed to be located in the largest city of the region. Thus in one point for each region.
- Hydrogen is transported by truck with hydrogen in gazeous form for distances lower than 130 km and in liquid form for higher distances (See Reuß et al. [7]).
- The transportation cost is assumed to be proportional to the traveled distance and to the quantities of hydrogen transported.
The variables of the problem are the following: is the quantity of hydrogen transported from electrolizer e to the region r [kT].
Recall that several electrolysers can be located near the same electricity source (power plant or wind turbine farm).
The objective function is the minimization of the total distance traveled by the trucks times the quantity of hydrogen transported:
where is the distance between e and r [km].
The constraints of the problem are the following:
- For each supply point, the total quantity of hydrogen to all demand region can not exceed the total supply of hydrogen:where is the total supply of hydrogen of e.
- For each demand point, the total quantity of hydrogen coming from all sources must satisfy the demand of the region:where is the total demand of hydrogen of region r.
- They are, of course, also the non negativity contraints on all variables:
The model is a purely linear program and can be solved by GAMS1 [15]. The optimal solution of software GAMS/CPLEX is given at Table 4.
The rows in the table represent the different production locations (nuclear power plants or offshore wind farms). The columns of the table represent the main cities of each region considered in our model.
The quantities shown in Table 4 therefore indicate the total quantity (in KT) of hydrogen produced by the electrolyzer location e transferred to the demand region r. For example, 89.78 KT of hydrogen produced in Flamanville are sent to the Rennes region.
4. Network Cost
Now that our optimization model has determined what quantities to transport by truck, the final step is to calculate an approximate cost of the transport network. It is important to note that only transport network costs are considered. The costs of building electrolysers, producing hydrogen, storage and stations is not analyzed in this work.
- for a distance less than 130 km, it is more advantageous in terms of costs to transport hydrogen in gaseous form,
- while for a distance greater than 130 km, the liquid form is preferred.
For each transport line , the cost is therefore calculated according to the distance of the line, and the parameters presented in Table 5 are considered. Note that for comparison with the German case studied by Reuß et al [7], most of the amounts are taken from this study except the price of diesel taken from INSEE [16].
The first step is therefore to calculate , the number of trucks necessary for the transport of quantities of hydrogen determined on the chosen lines . The following formula is therefore applied to each line :
where is the hydrogen total quantity transported by year on line and is the distance in km from e to r. The Trailer capacity for gazeous and for liquid are given in Table 5. The Average distance traveled per year by a truck is also given in Table 5.
Then, 5 components are taken into account in order to estimate the cost for each line :
- The initial investment for the tractor and trailer,
- The salary of drivers during the year,
- The fuel consumption of trucks,
- The cost of operating and maintaining equipment,
- The cost of French highways for trucks (class 4 vehicle).
We will now be able to compare the French cases with a more decentralized production and the German case with a more centralized production in the North of the country in order to answer the following fundamental question: “Is it more economical to have centralized or decentralized hydrogen production?”
4.1. The German Case
The German case was already studied by Reuß et al [7]. They make the following assumptions in their model:
- They consider 15 sources of hydrogen production by water electrolysis, all located in North of Germany.
- They consider 96,083 hydrogen recharging stations scattered throughout the country.
- The transport of hydrogen is done by trucks with in gazeous form for a distance of less than 130 km and by trucks in liquid form for a greater distance.
The method of assigning each demand point (blue points in Figure 3) to a production source (green points in Figure 3) is the shortest path method (Dijktra method). Figure 3 presents the results of the study of Reuß et al [7].
The two main results of the model are as follows:
- On the one hand, a total transport price of 0.73 €C per kilo of hydrogen transported is computed by dividing the total cost of the network by the total transported per year.
- On the other hand, the average distance traveled between the supply points and the chargings station is 430 km.
4.2. The Case of France
For the French case, we make the following assumptions:
- We consider 19 sources of hydrogen production by electrolysis (located near wind turbines farm or near nuclear power plants) distributed across the different regions of France (See Figure ).
- We consider 13 demand points, one per region situated in the biggest city of the region.
- The hydrogen is transported by trucks with in gaseous form for distances less than 130 km and in liquid form for greater distances.
The method of assigning each demand point to a production source is to minimize the total distance traveled by trucks. Figure 1 presents the results of our model applied to the French case.
The two main results of the model are as follows:
- On the one hand, we computed a total transport price of 0.31 €Cper kilo of hydrogen transported.
- On the other hand, we computed an average distance traveled between the supply points and the centers of the regions of 160 km.
5. Conclusions
The main objective of this paper is to evaluate the feasibility of setting up a hydrogen transport network to answer to the future demand of hydrogen for road transport in France in 2035, the hydrogen being produced from surplus of wind turbines and nuclear plants in France.
Our first conclusion is that by taking into account the onshore and offshore wind turbines excess of production in 2035, only 10% of the future demand of hydrogen from road transport in France will be satisfied.
Our second conclusion is that the remaining 90% of the demand of hydrogen from road transport in France in 2035 can be produced by excess of production of nuclear plants in France in 2035.
Our third conclusion is that the estimated total cost of setting up such a transport network would amount to 0.31€C/kg and that the average distance between a local source of hydrogen and the center of the demand region is 160 km.
Our fourth conclusion is that the comparison with more centralized production in Germany gives a reduction of a factor of 2.35 for our distribution cost with a decentralized production, especially due to shortest distances: the average distance between a source and a demand region is divided by 2.7 in our decentralized model. We can now answer to the last question: it is more economical, from the point of view of the total costs of the transport network to be set up, to have decentralized production of hydrogen.
Finally, let us emphasize the possible improvements of the model. First of all, we made a lot of assumptions about the future: proportion of car users who switch to fuel cell electrical vehicles, public investment in wind turbines, share of production that can be used for the production of green hydrogen... All this will probably be strongly influenced by the political decisions that will be taken in terms of transport and energy over the next ten years. In addition, the hypothesis of only considering the surplus of different energy sources with a low carbon footprint seems quite simplistic with a view to setting up such a green hydrogen transport network.
Then, the network studied is simpler than a distribution network that can reach every citizen relatively easily on French territory. To hope for mass adoption of hydrogen vehicles, greater availability at demand points will be necessary. This will necessarily increase the average cost of transport.
But the most important point for the future is that it will be essential to carry out a study of the entire hydrogen supply chain in order to determine the feasibility of such a network. Indeed, this work only focuses on the transport part and a little on production. Therefore, a necessary perspective would be to carry out the same type of analysis on the stages of production, storage and connection to hydrogen stations.
Another future development of the model concern the sensibility analysis. In fact, hydrogen transport is affected by many factors, wages for drivers, delivery technology (storage, vehicle, capacity), CAPEX and OPEX of the vehicle, etc. It should be meaningfull to study the influence of these factors.
Author Contributions
Conceptualization, D. De Wolf; writing, review and editing, D. De Wolf; software: C.Magidson and J. Sigot validation, D. De Wolf. All authors have read and agreed to the published version of the manuscript.
Funding
This research received no external funding. This research was carried out during Daniel De Wolf’s stay at the Center for Operations Research and Econometrics of UClouvain in Louvain-la-Neuve, Belgium.
Acknowledgments
The authors warmly thank the two anonymous referees for the constructive suggestions which made it possible to give more substance to the paper.
Conflicts of Interest
The authors declare no conflict of interest.
References
- M. Kim and J. Kim, An integrated decision support model for design and operation of a wind-based hydrogen supply system, Int. J. Hydrog. Energy, vol. 42, no. 7, pp. 3899-3915, Feb. 2017. [CrossRef]
- L. Al-Ghussain, A. D. Ahmad, A. M. Abubaker, and M. A. Hassan, Exploring the feasibility of green hydrogen production using excess energy from a country-scale 100% solar-wind renewable energy system, Int. J. Hydrog. Energy, vol. 47, no. 51, pp. 21613-21633, Jun. 2022. [CrossRef]
- De Wolf, D., Smeers, Y., Comparison of battery electric vehicles and fuel cell vehicles, World Electric Vehicles Journal, 2023, 14, 262, pp 1-13.
- T. Galimova, M. Fasihi, D. Bogdanov, and C. Breyer, Impact of international transportation chains on cost of green e-hydrogen: Global cost of hydrogen and consequences for Germany and Finland, Appl. Energy, vol. 347, p. 121369, Oct. 2023. [CrossRef]
- J. André, S. Auray, J. Brac, D. De Wolf, G. Maisonnier, M. Ould-Sidi, A. Simonnet, Design and dimensioning of hydrogen transmission pipeline networks, European Journal of Operational Research, Volume 229, Issue 1, 16 August 2013, pp 239-251. [CrossRef]
- J. André, S. Auray, D. De Wolf, M. Ould-Sidi, A. Simonnet, Time development of new hydrogen transmission, International Journal of Hydrogen Energy, Vol 39, 2014, pp 10323-10337. [CrossRef]
- M. Reuß , P. Dimos, A. Léon, T. Grube, M. Robinius, and D. Stolten, Hydrogen Road Transport Analysis in the Energy System: A Case Study for Germany through 2050, Energies, vol. 14, no. 11, p. 3166, May 2021.
- Jefferson A. Rieraa, Ricardo M. Lima b, Omar M. Knio b, A review of hydrogen production and supply chain modeling and optimization, International Journal of Hydrogen Energy 48, 2023, pp 1373 -13755. [CrossRef]
- A. Maruta, Economics of Hydrogen for Transportation, in Hydrogen Science and Engineering : Materials, Processes, Systems and Technology, John Wiley & Sons, Ltd, 2016, pp. 831-848.
- S. Pierre, Rendement de la chaîne hydrogène. Accessed: May 10, 2024. Available online:https:// www.connaissancedesenergies.org/sites/connaissancedesenergies.org/file s/pdf-pt-vue/rendement-chaine-h2_fiche-technique-02-2020.pdf.
- Alterna Energie, Energie, Décryptage du rendement d’une éolienne. Accessed: Mar. 24, 2024. Available online: https://www.alterna-energie.fr/blog-article/a-la-conquete-du-vent- decryptage-du-rendement-eolien-pour-une-energie-verte-maximale.
- Le Figaro, Eoliennes en mer : bataille de chiffres sur la production du parc au large de Saint- Nazaire. Accessed: Mar. 24, 2024. Available online : https://www.lefigaro.fr/nantes/eoliennes-en-mer-bataille-de-chiffres-sur-la-production-du- parc-au-large-de-saint-nazaire-20230317.
- O. Tlili et al., Role of electricity interconnections and impact of the geographical scale on the French potential of producing hydrogen via electricity surplus by 2035, Energy, vol. 172, pp. 977-990, Apr. 2019. [CrossRef]
- Ministère du développement durable, Bilan énergétique de la France pour 2017, Données et études statistiques. Accessed: May 30, 2024. Available online: https://www.statistiques.developpement- durable.gouv.fr/bilan-energetique-de-la-france-pour-2017.
- GAMS Development Corporation. General Algebraic Modeling System (GAMS) Release 47.1.0, Fairfax, VA, USA, 2024. Available for download at https://www.gams.com/download/.
- Institut national de la statistique et des études économiques, Prix moyens mensuels de vente au détail en métropole - Gazole (1 litre). Accessed: May 08, 2024. [Online]. Available: https://www.insee.fr/fr/statistiques/serie/000442588.
| 1 | General Algebraic Modeling System |
Figure 1.
Production and demand in 2035.
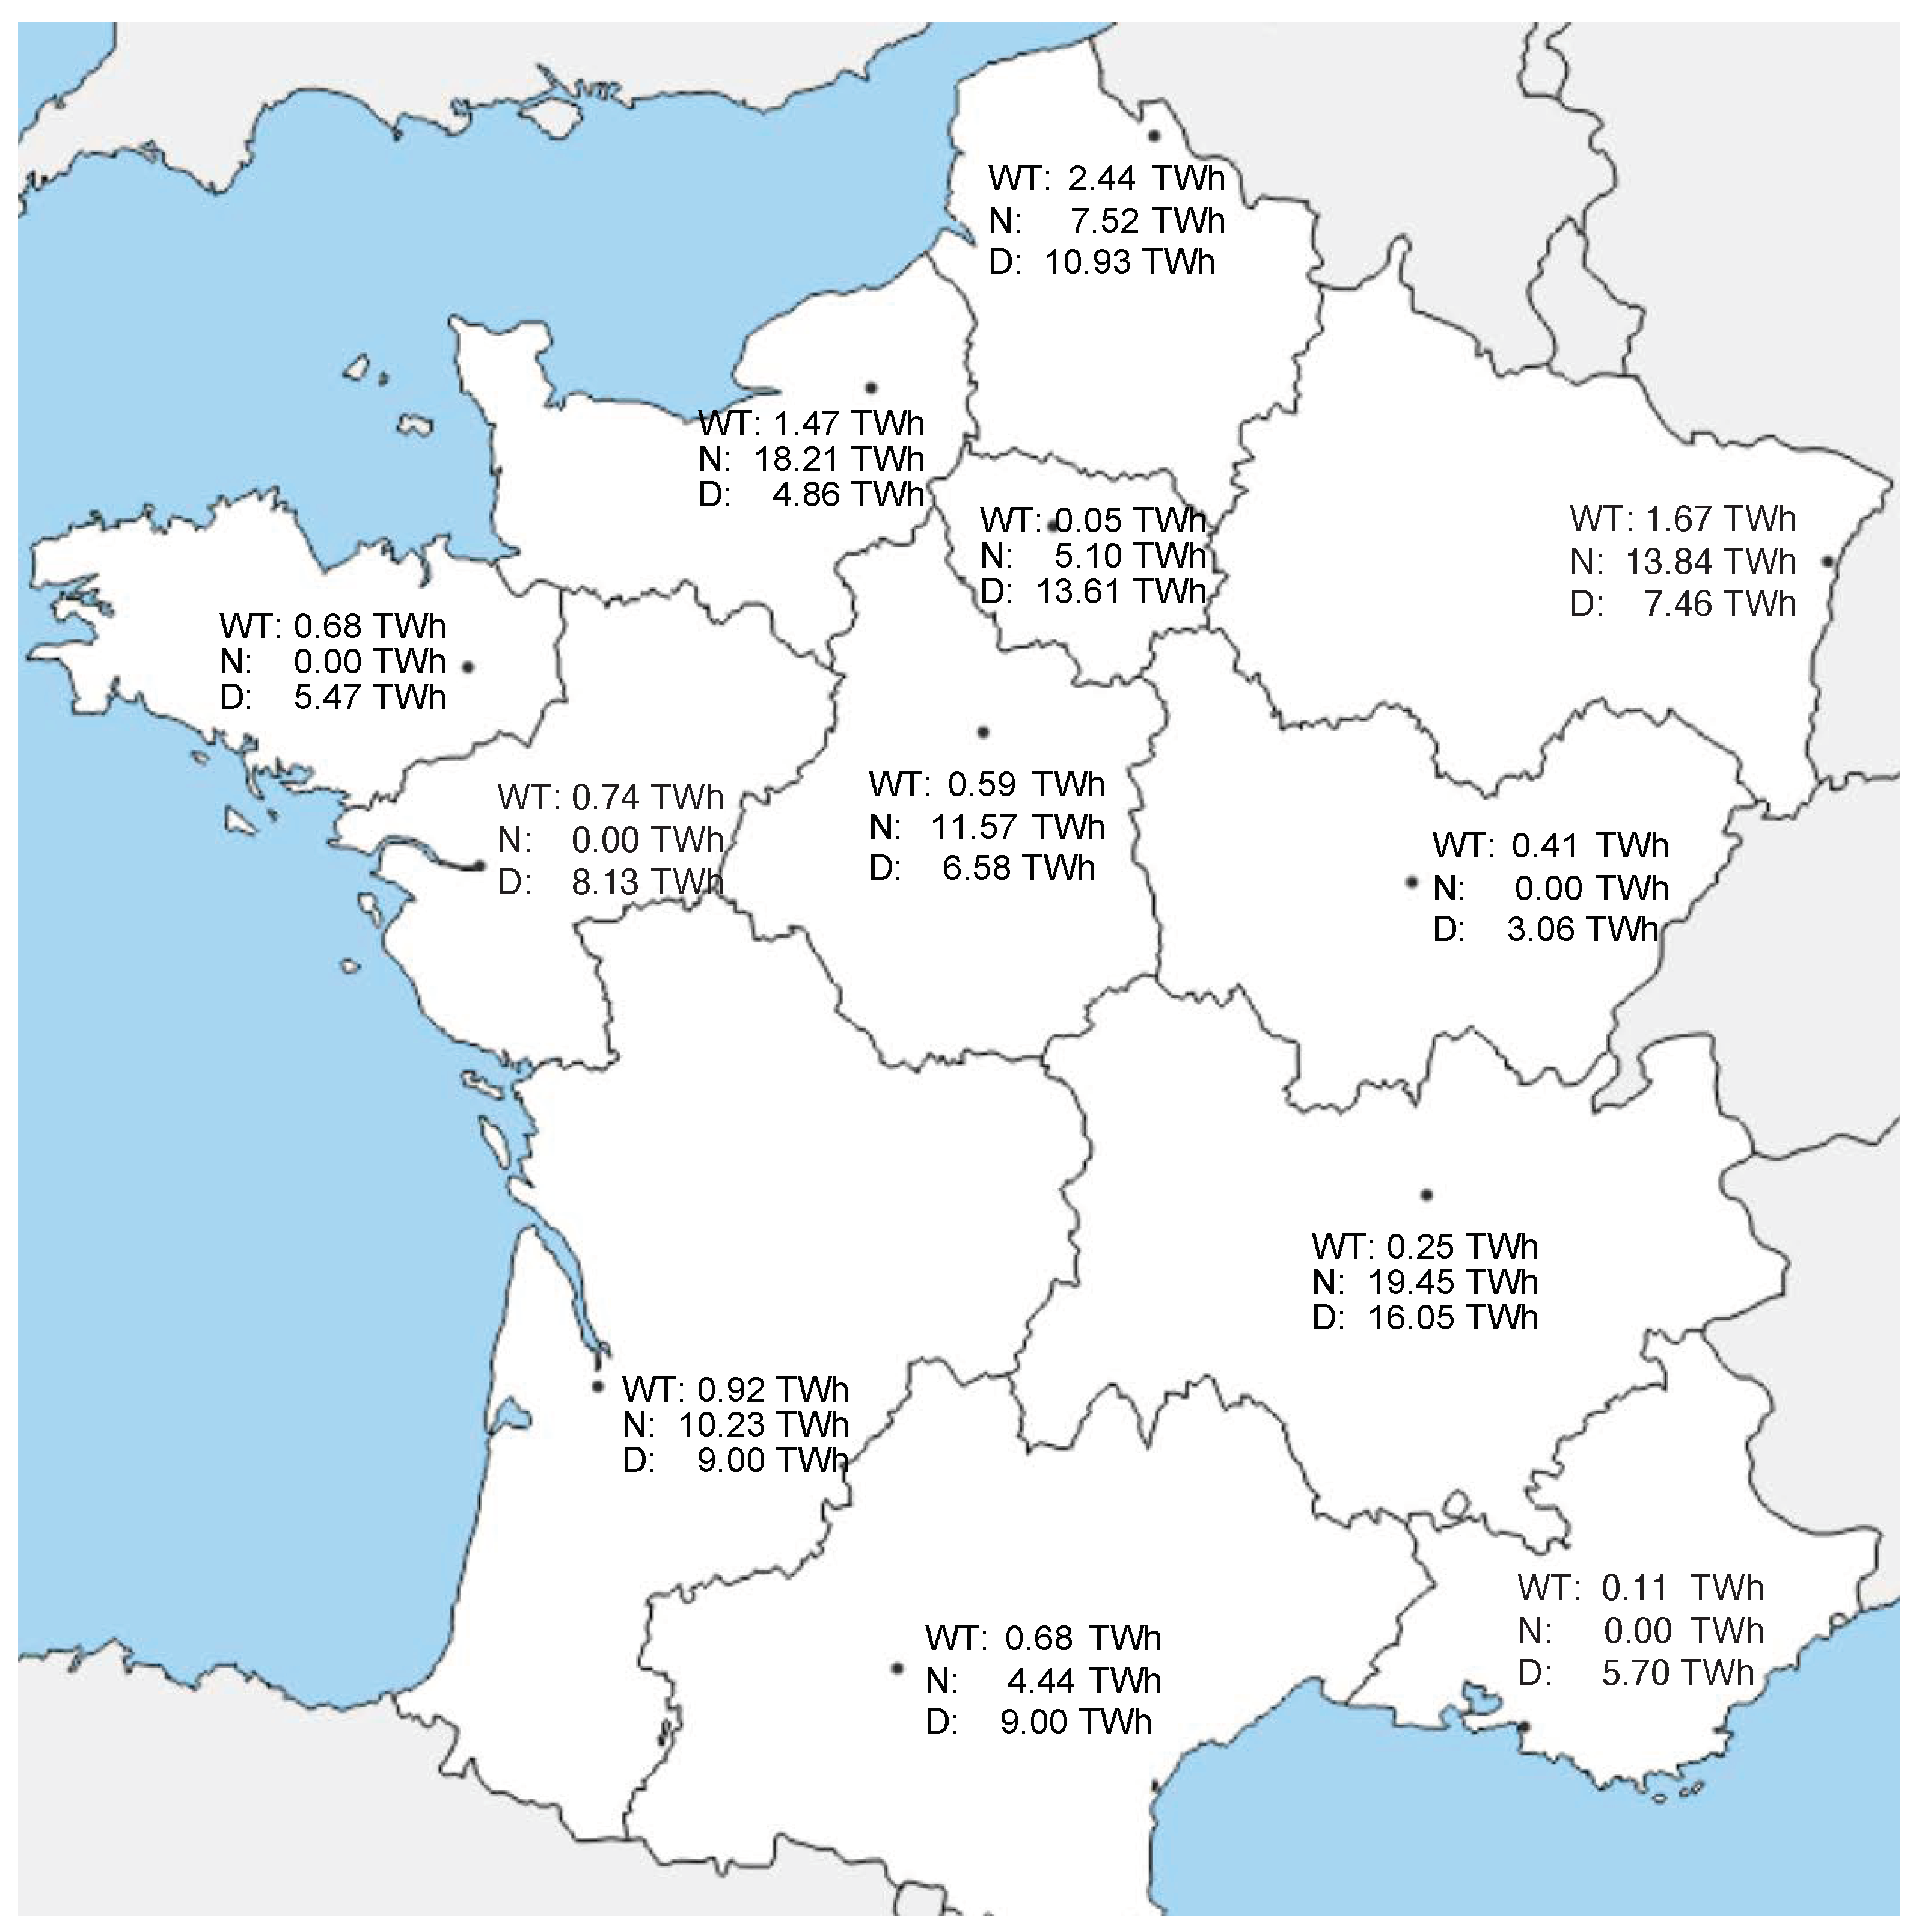
Figure 2.
Location and number of electrolysers.
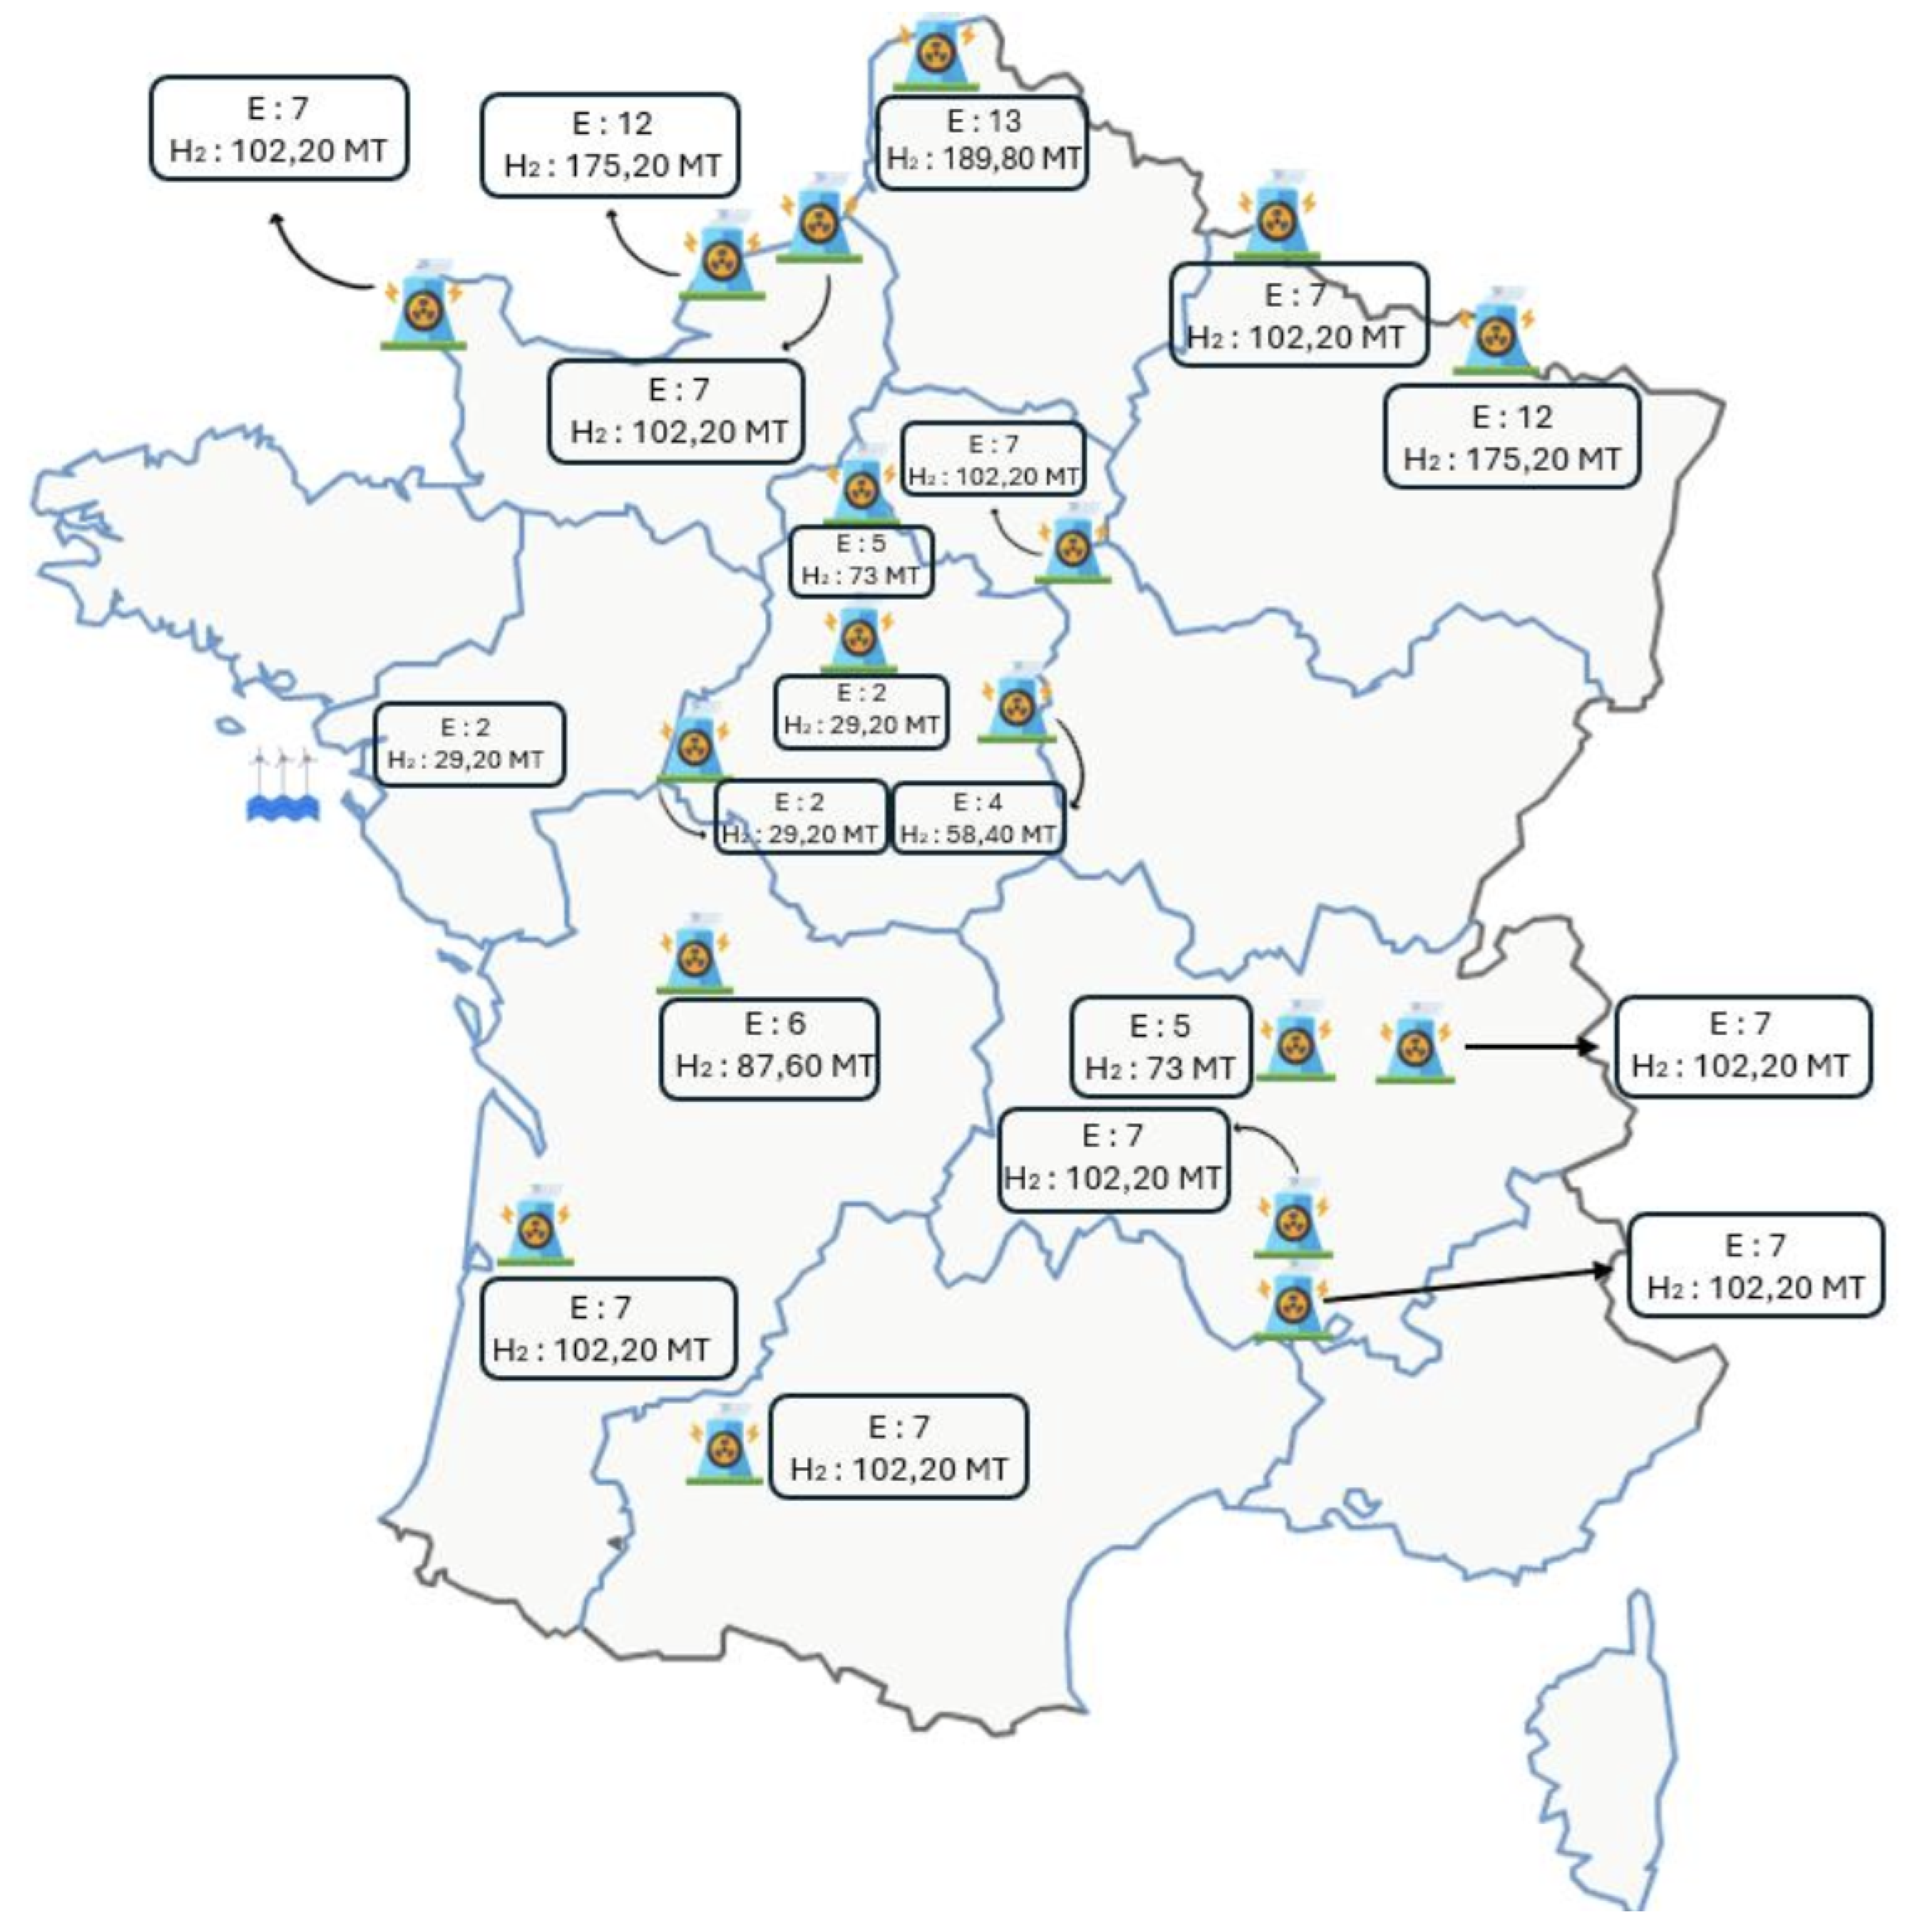
Figure 3.
The German case. Source: Reuß et al [7]
Figure 3.
The German case. Source: Reuß et al [7]
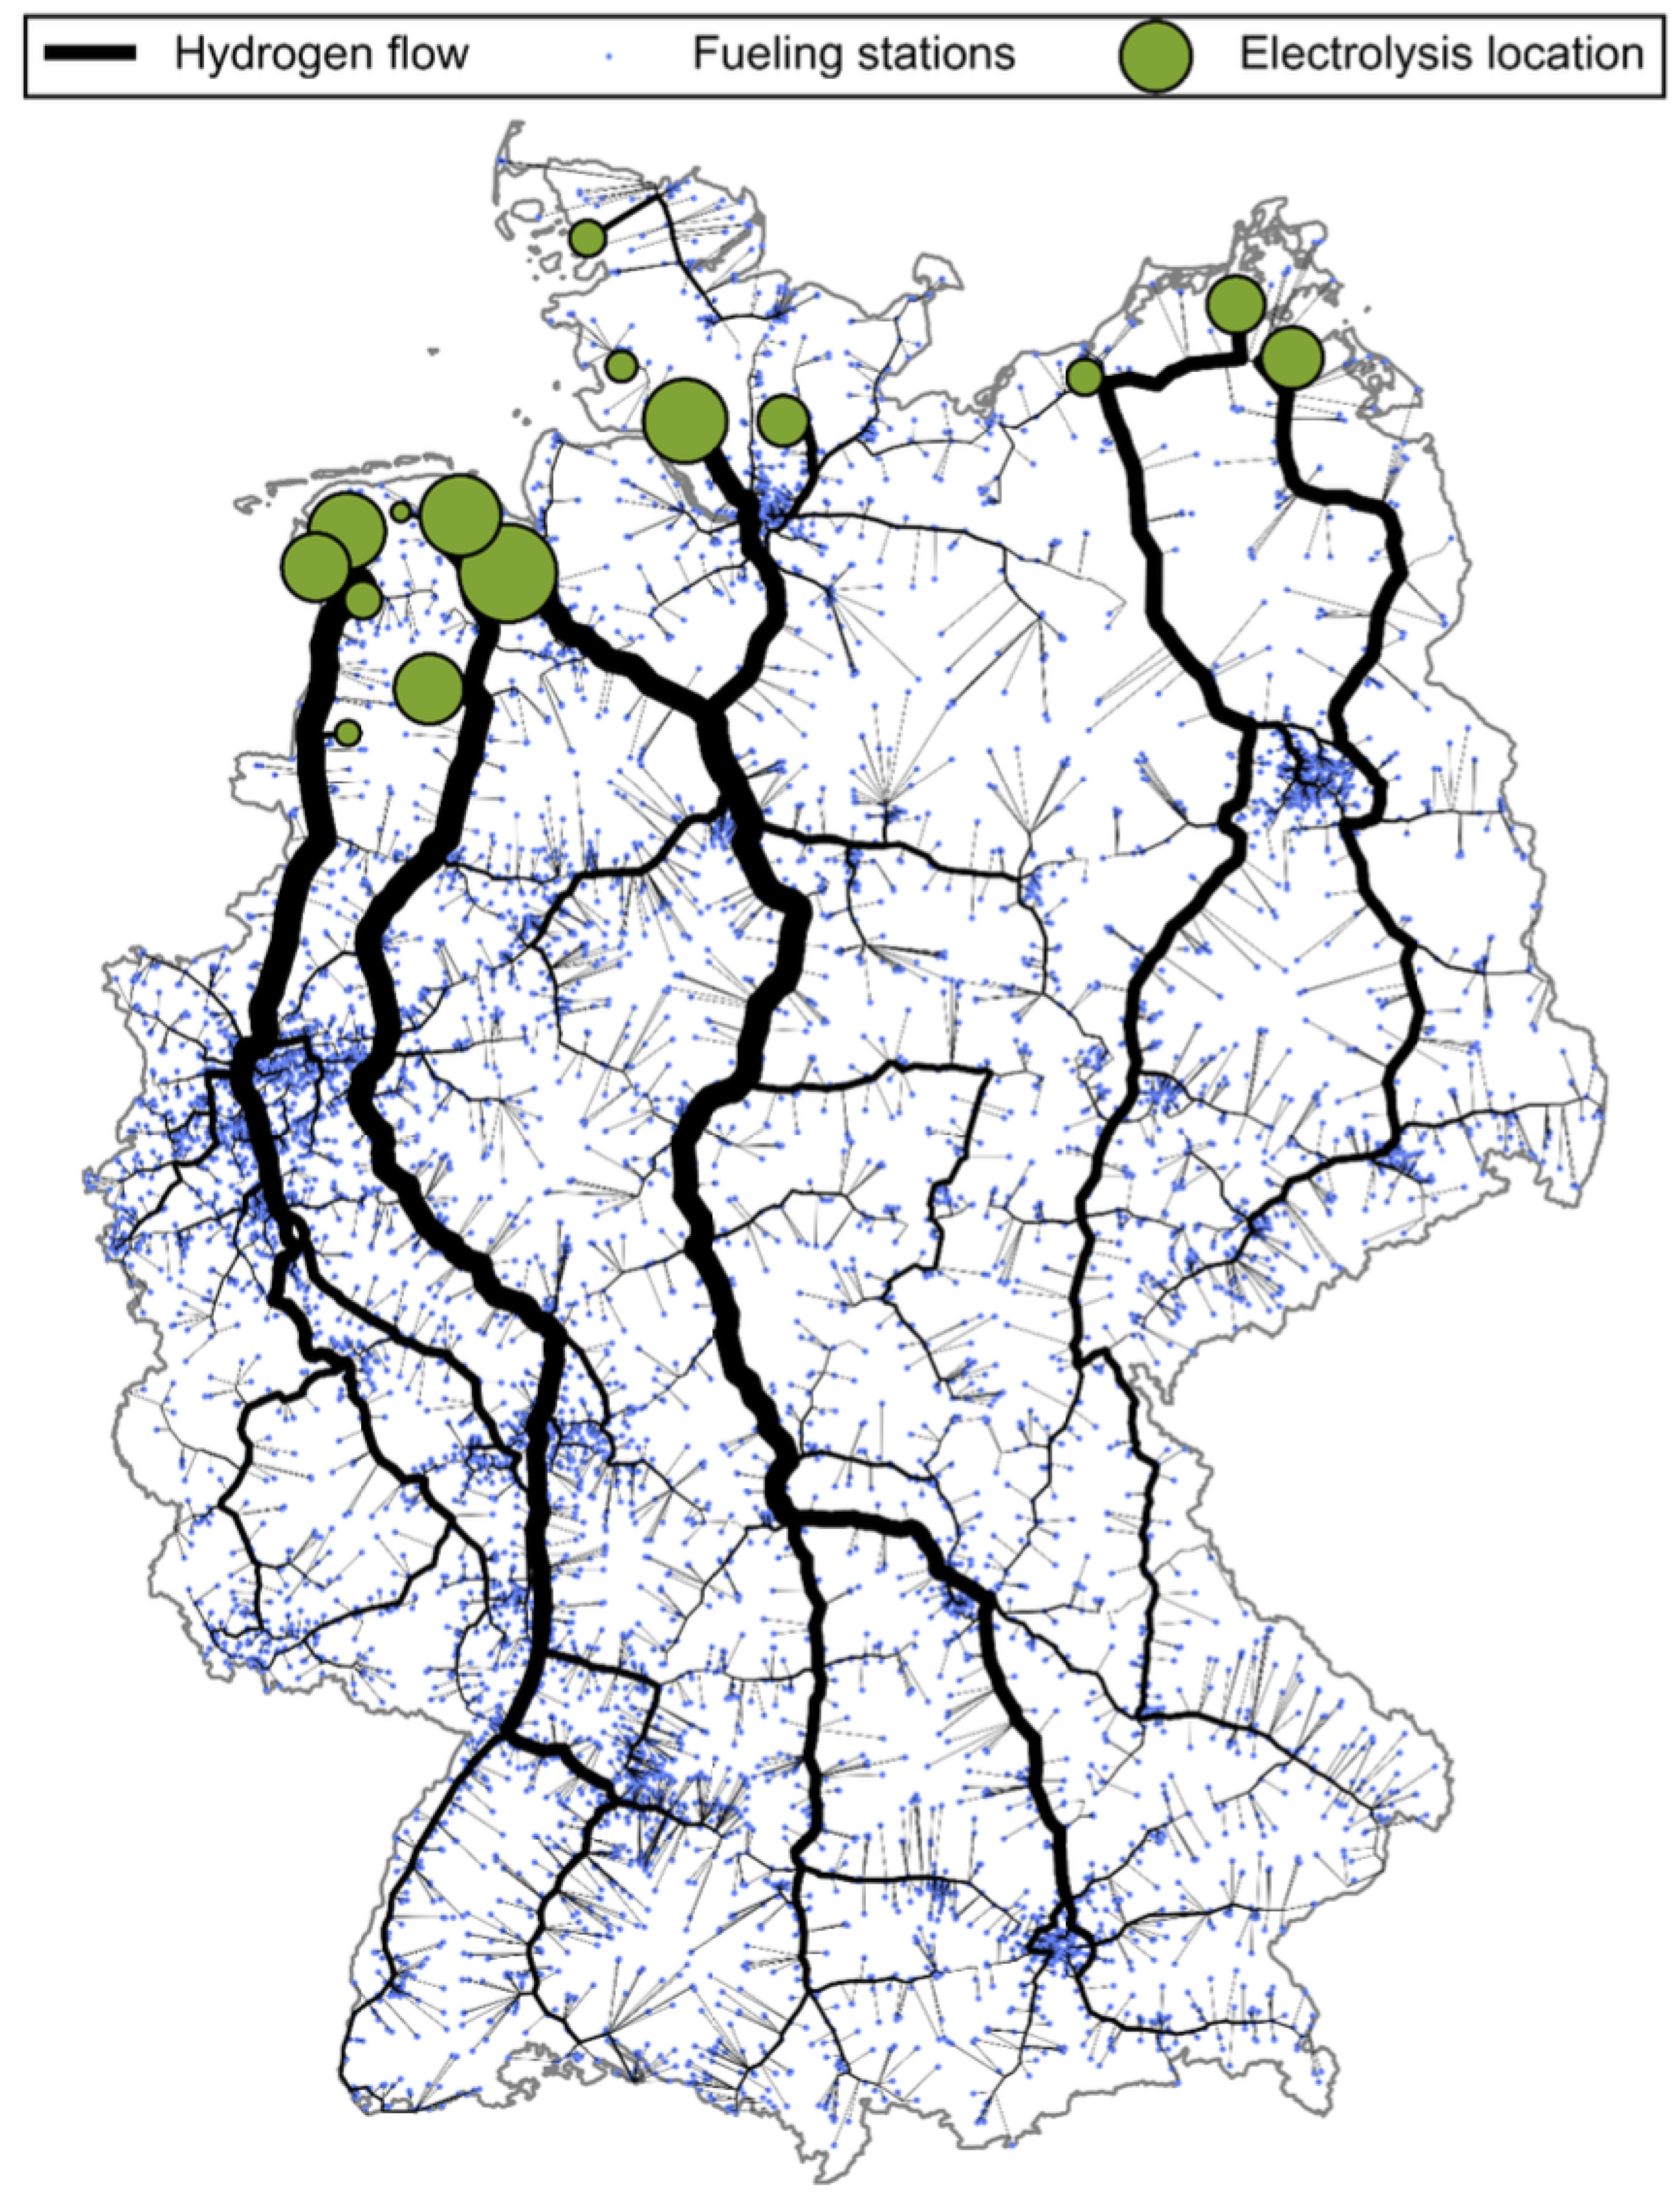
Figure 4.
The French case
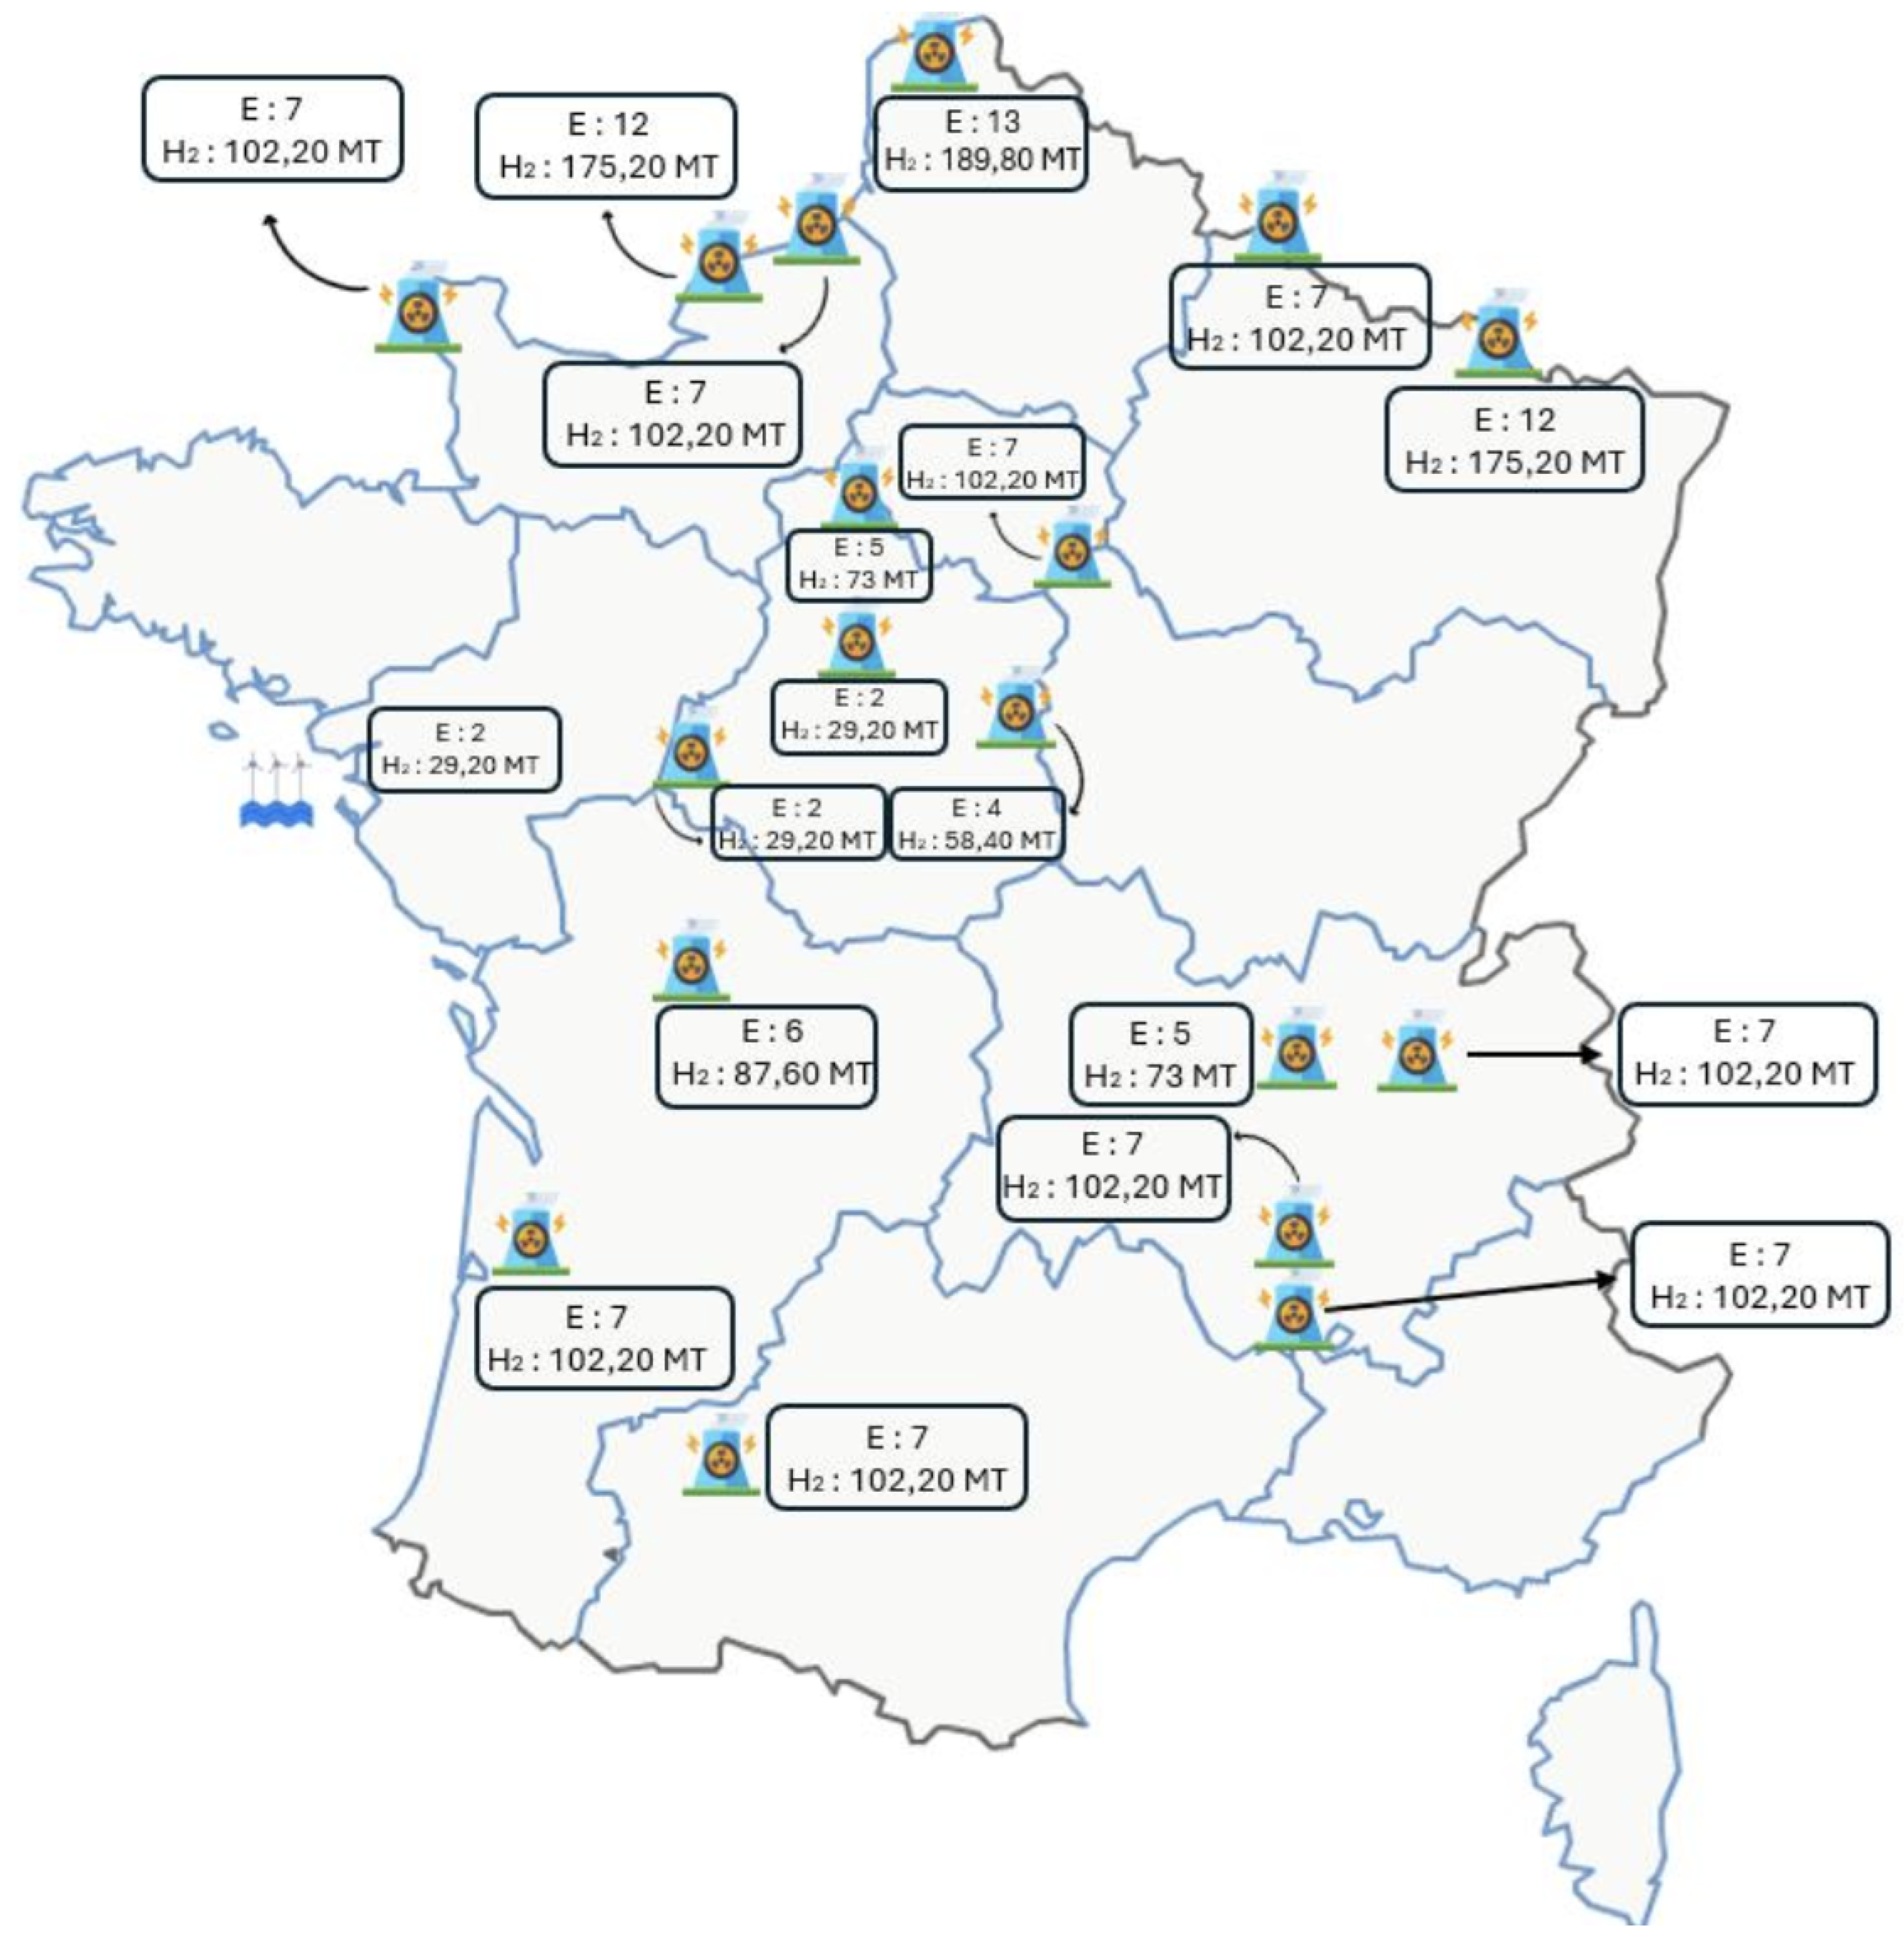

Table 1.
Hydrogen demand by region in 2035.
| Region | Population | Proportion | 106 Km | Electricity | |
|---|---|---|---|---|---|
| [residents] | >20.000 km | [103T] | [TWh] | ||
| Corse | 355 528 | 12% | 853 | 9 | 0.520 |
| Bourgogne-Franche-Comté | 2 791 719 | 9% | 5 025 | 50 | 3.060 |
| Normandie | 3 327 077 | 12% | 7 985 | 80 | 4.863 |
| Bretagne | 3 453 023 | 13% | 8 978 | 90 | 5.468 |
| Provence-Alpes-Côte d’Azur | 5 198 011 | 9% | 9 356 | 94 | 5.698 |
| Centre -Val de Loire | 2 573 295 | 21% | 10 808 | 108 | 6.582 |
| Grand Est | 5 568 711 | 11% | 12 251 | 123 | 7.461 |
| Pays de la Loire | 3 926 389 | 17% | 13 350 | 133 | 8.130 |
| Occitanie | 6 154 729 | 12% | 14 771 | 148 | 8 996 |
| Nouvelle Aquitaine | 6 154 772 | 12% | 14 771 | 148 | 8.996 |
| Hauts-de-France | 5 983 823 | 15% | 17 951 | 180 | 10.932 |
| Ile-de-France | 12 419 961 | 9% | 22 356 | 224 | 13.615 |
| Auvergne-Rhône-Alpes | 8 235 923 | 16% | 26 355 | 264 | 16.050 |
| France métropolitaine | 66 142 961 | 12% | 164 812 | 1 648 | 100.37 |
Table 2.
Excess production of wind turbines in 2035.
| Region | Onshore [TWh] | Offshore [TWh] | Total [TWh] |
|---|---|---|---|
| Hauts de France | 2.27 | 0.17 | 2.44 |
| Grand-Est | 1.67 | 1.67 | |
| Occitanie | 0.59 | 0.09 | 0.68 |
| Bretagne | 0.47 | 0.21 | 0.68 |
| Pays de la Loire | 0.47 | 0.27 | 0.74 |
| Nouvelle Aquitaine | 0.64 | 0.28 | 0.92 |
| PACA | 0.03 | 0.08 | 0.11 |
| Auvergne Rhône Alpes | 0.25 | 0.25 | |
| Bourgogne Franche Compté | 0.41 | 0.41 | |
| Normandie | 0.37 | 1.10 | 1.47 |
| Corse | 0.01 | 0.01 | |
| Centre Val-de-Loire | 0.59 | 0.59 | |
| Ile de France | 0.05 | 0.05 | |
| France | 7.82 | 2.19 | 10.1 |
Table 3.
Excess production of nuclear plants in 2035.
| Region | Surplus 2035 [TWh] | Used 2035[TWh] |
|---|---|---|
| Hauts de France | 10.63 | 7.52 |
| Grand-Est | 19.57 | 13.84 |
| Occitanie | 6.28 | 4.44 |
| Bretagne | 0.00 | 0.00 |
| Pays de la Loire | 0.00 | 0.00 |
| Nouvelle Aquitaine | 14.46 | 10.23 |
| PACA | 0.00 | 0.00 |
| Auvergne Rhône Alpes | 27.50 | 19.45 |
| Bourgogne Franche Compté | 0.00 | 0.00 |
| Normandie | 25.75 | 18.21 |
| Corse | 0.00 | 0.00 |
| Centre Val-de-Loire | 16.36 | 11.57 |
| Ile de France | 7.22 | 5.10 |
| France | 127.77 | 90.36 |
Table 4.
Optimal solution of solver GAMS.
| (kT) | Rouen | Lille | Strasb. | Paris | Orléans | Bord. | Lyon | Montp. | Nantes | Rennes | Mars. | Dijon |
|---|---|---|---|---|---|---|---|---|---|---|---|---|
| Flamanville | 0 | 0 | 0 | 0 | 0 | 0 | 0 | 0 | 89.78 | 0 | 0 | |
| Paluel | 79.85 | 0 | 0 | 95.35 | 0 | 0 | 0 | 0 | 0 | 0 | 0 | 0 |
| Penly | 0 | 0 | 0 | 26.01 | 0 | 0 | 0 | 0 | 0 | 0 | 0 | 0 |
| Gravelines | 0 | 179.52 | 0 | 0 | 0 | 0 | 0 | 0 | 0 | 0 | 0 | 0 |
| Chooz | 0 | 0 | 0 | 0 | 0 | 0 | 0 | 0 | 0 | 0 | 0 | 0 |
| Cattenom | 0 | 0 | 122.51 | 0 | 0 | 0 | 0 | 0 | 0 | 0 | 0 | 20.75 |
| Nogent | 0 | 0 | 0 | 102.2 | 0 | 0 | 0 | 0 | 0 | 0 | 0 | 0 |
| St-Laurent | 0 | 0 | 0 | 0 | 29.2 | 0 | 0 | 0 | 0 | 0 | 0 | 0 |
| Dampierre | 0 | 0 | 0 | 0 | 73 | 0 | 0 | 0 | 0 | 0 | 0 | 0 |
| Belleville | 0 | 0 | 0 | 0 | 5.88 | 0 | 23.02 | 0 | 0 | 0 | 0 | 29.5 |
| Chinon | 0 | 0 | 0 | 0 | 0 | 0 | 0 | 0 | 73 | 0 | 0 | 0 |
| Civaux | 0 | 0 | 0 | 0 | 0 | 45.52 | 0 | 0 | 31.3 | 0 | 0 | 0 |
| Le Blayais | 0 | 0 | 0 | 0 | 0 | 102.2 | 0 | 0 | 0 | 0 | 0 | 0 |
| Bugey | 0 | 0 | 0 | 0 | 0 | 0 | 102.2 | 0 | 0 | 0 | 0 | 0 |
| St-Alban | 0 | 0 | 0 | 0 | 0 | 0 | 73 | 0 | 0 | 0 | 0 | 0 |
| Cruas | 0 | 0 | 0 | 0 | 0 | 0 | 65.33 | 0 | 0 | 0 | 36.87 | 0 |
| Tricastin | 0 | 0 | 0 | 0 | 0 | 0 | 0 | 45.51 | 0 | 0 | 56.69 | 0 |
| Golfech | 0 | 0 | 0 | 0 | 0 | 0 | 0 | 102.2 | 0 | 0 | 0 | 0 |
| St Nazaire | 0 | 0 | 0 | 0 | 0 | 0 | 0 | 0 | 29.2 | 0 | 0 | 0 |
Table 5.
Network cost
| Parameter | unit | unitary cost | |
|---|---|---|---|
| Tractor investment | €C | 120,000 | |
| H2 gas trailer investment | [€C] | 1,000,000 | |
| Liquid H2 trailer investment | [€C] | 860,000 | |
| Average usage time | [h/year] | 2000 | |
| Driver’s salary | [€C/h] | 35 | |
| Operation and maintenance | [€C/year*truck] | 14,400 | |
| Consumption | [l/100km] | 35.5 | |
| Price of diesel | [€C] | 1.75 | |
| Average speed Truck | [km/h] | 60 | |
| Average distance | [km/truck*year] | 120,000 | |
| Average price per km of motorway | [€C/km] | 0.37 | |
| Trailer capacity for gazeous | [kg] | 1000 | |
| Trailer capacity for liquid | [kg] | 4300 |
Disclaimer/Publisher’s Note: The statements, opinions and data contained in all publications are solely those of the individual author(s) and contributor(s) and not of MDPI and/or the editor(s). MDPI and/or the editor(s) disclaim responsibility for any injury to people or property resulting from any ideas, methods, instructions or products referred to in the content. |
© 2025 by the authors. Licensee MDPI, Basel, Switzerland. This article is an open access article distributed under the terms and conditions of the Creative Commons Attribution (CC BY) license (http://creativecommons.org/licenses/by/4.0/).
Copyright: This open access article is published under a Creative Commons CC BY 4.0 license, which permit the free download, distribution, and reuse, provided that the author and preprint are cited in any reuse.


