
Submitted:
28 January 2025
Posted:
28 January 2025
You are already at the latest version
Abstract
This project explores the development of a 1D version of the U-net convolutional neural network (CNN) for automated segmentation of heart sounds from phonocardiogram (PCG) signals. The approach begins with a feature extraction process designed to identify the onset and offset of each heart sound (HS) as binary markers. This process is similar to the image segmentation techniques used in biomedical image analysis, where 80 PCG signals, each 30 seconds long and annotated with heart sound positions, were used to train the CNN. The model receives PCG signals as input and returns the exact onset and offset for each heart sound. By combining classical feature extraction with advanced image-based segmentation techniques, this method offers a more robust and scalable solution for automated heart sound analysis. The results show that the trained model outperforms traditional segmentation methods, demonstrating the potential for deep learning architectures to be adapted for 1D biomedical signal analysis.
Keywords:
heart sounds
; segmentation
; neural networks
1. Introduction
Cardiovascular and circulatory diseases account for 30 % of global deaths, amounting to approximately 20 million fatalities in 2021, equivalent to an average of 55,000 deaths per day or one every 1.5 seconds. These conditions remain the leading cause of mortality worldwide [1]. Although the development of diagnostic tools and medical advancements has led to a global reduction in age-adjusted mortality rates, these improvements are not equitably distributed. Over 80% of CVD-related deaths occur in low- and middle-income countries, highlighting significant disparities in access to prevention, diagnosis, and treatment [2]. Heart sounds, generated by various periodic events associated with the cardiac cycle, are a key tool in diagnosing cardiovascular pathologies. Due to their origin in different phases of the cycle, these sounds vary in morphology, duration, and frequency content, and are classified into four main types. The first heart sound, S1, is associated with the closure of the atrioventricular valves (mitral and tricuspid) at the beginning of ventricular systole, exhibiting greater intensity and frequency than the other sounds [3]. The second heart sound, S2, is produced by the closure of the semilunar valves (aortic and pulmonary) at the end of systole and is typically shorter and sharper, marking the onset of diastole [4]. The third heart sound, S3, a low-frequency sound occurring during the rapid ventricular filling phase, is common in young hearts or athletes, but its presence in older adults may indicate conditions such as heart failure [5]. Finally, the fourth heart sound, S4, is generated by atrial contraction at the end of diastole; this low-frequency sound is not always audible and, when detected, is often associated with conditions such as hypertrophy or ischemia due to reduced ventricular compliance [6]. An example of a healthy PCG signal is shown below at Figure 1.
The identification and analysis of these sounds enables the evaluation of heart function and the detection of structural or functional abnormalities, underscoring their importance in clinical diagnosis [7]. For this purpose, different tools and advancements have been developed by engineers, improving the way auscultation is performed and its further medical analysis and applications [8]. Various heart sound segmentation methods have been developed, including ECG based methods [9,10,11], support vector machines (SVM) based methods, [12,13,14], hidden Markov models based methods [15,16,17], envelope based methods [18,19,20], etc. However, all these methods are feature based algortihms, meaning that in order to be able to classify or segment PCG signals and heart sounds accurately they need to find time domain or frequency domain (even both) features. Nevertheless, since the resurgence of machine learning as a prominent field in 2012 [21], heart sounds segmentation and classification have been one of the interest areas [21,22,23,24], aiming to enhance diagnostic accuracy and automate the detection of cardiovascular abnormalities [25]. In this project, an approach was developed to combine classical feature extraction methods with state-of-the-art techniques for image segmentation and classification. Specifically, an algorithm was implemented to automatically generate the heart sound tag signal, marking the onset and offset of each heart sound. These generated tags were then used to train a convolutional neural network (CNN), relying exclusively on true masks. This methodology mirrors practices in biomedical imaging applications, where segmentation and classification tasks often bypass traditional feature extraction processes [26,27,28]. To achieve this, a 1D version of the U-net CNN architecture proposed by Ronneberger et al. [29] was modified and scaled to work with 1D signals, such as PCG. The network leverages its encoder-decoder structure and skip connections to effectively capture both global and local features, enabling precise segmentation of the heart sounds. Subsequently, manual segmentation of heart sounds is proposed to further refine the training process, ensuring greater precision in the model’s performance. This hybrid methodology not only improves segmentation accuracy but also demonstrates the potential of adapting image-based deep learning architectures for biomedical signal analysis. Despite using an algorithm to find every heart sound, the trained model outperformed this first segmentation, offering a robust and scalable solution for automated heart sound analysis. To 2016, the PhysioNet/Computing in Cardiology (CinC) Challenge convened the development of algorithms to classify heart sounds from both healthy and pathological volunteers, as normal, pathological and unsure (or too noisy to know) [30]. This database contains 3,126 heart sound recordings, ranging from 5 to 120 seconds, including control cases and pathologically diagnosed cases. Finally, this work can lead to further applications to previous research conducted by this paper authors [31,32,33,34]
2. Materials and Methods
This section outlines the materials and methods employed to design and train a one-dimensional (1D) U-net convolutional neural network (CNN) for automated heart sound segmentation. The workflow is structured into two main stages: (1) feature extraction from phonocardiogram (PCG) signals and (2) the convolutional neural network designing, training and segmentation processes. Each subsection provides a concise explanation of the key steps involved in these stages.
2.1. Feature Extraction
The feature extraction process was implemented using MATLAB to preprocess the phonocardiogram (PCG) signals and prepare them for segmentation. The methodology consists of three main steps: signal preprocessing, computation of Shannon energy, and segmentation using zero-crossing detection. These steps were taken to obtain a binary pulse train signal, later used to train the proposed CNN. Ideally, a manual segmentation would be used to train this CNN, but that remains as future work. Figure 2 shows the algorithm stages used to obtain the binary train pulses.
2.1.1. Signal Preprocessing
To enhance signal quality, a fourth-order Butterworth bandpass filter with cutoff frequencies of 20 Hz and 100 Hz was applied to the raw PCG signals. This step attenuated noise and irrelevant components while preserving the spectral content related to heart sounds. Subsequently, the filtered signals were decomposed using a discrete wavelet transform (DWT) with the ‘db4’ wavelet function. Two levels of decomposition were performed, and the second level approximation coefficients (0–250 Hz) were selected for further analysis, as this range contains most of the energy associated with cardiac sounds. At this point, only a quarter of the original samples remained, as the bandwidth of the PCG signal was limited to a maximum of 250 Hz (resulting in a 500 Hz sample rate), in contrast to the 2000 Hz sampling rate used previously.
2.1.2. Shannon Energy Calculation
Shannon Entropy is a measure of randomness and uncertainty in a series of outcomes, commonly used to detect the envelope of a signal [35,36]. However, this measure tends to give more weight to low-intensity instead of high-intensity components. Being HS a medium to high-intensity section of the PCG signal, Shannon Energy seems like a better option to find the PCG envelogram signal, as this measure tends to favor signals with medium-intensity [37], reducing low-intensity parts of the PCG and keeping the medium and high-intensity parts of it. This method effectively highlights clinically significant patterns while suppressing the impact of extremely low or high-intensity noise, resulting on a good HS detection without even needing to consider physiological thresholds, just like a researcher would identify any HS on a PCG signal. The mathematical expression of this measure can be seen below:
where represents the Shannon energy calculated and is the PCG value at index i. Then, the mean Shannon energy of the selected coefficients was calculated over overlapping segments of 20 ms (or 10 samples), with a 10 ms (or 5 samples) overlap, using the following formula:
where is the mean Shannon energy, N is the segment size, and represents the signal value at index i. Finally, the mean Shannon Energy, , was normalized using the formula:
where is the normalized average Shannon Energy, is the average Shannon Energy calculated using the windows previously mentioned, is its mean value, and represents the maximum absolute value of . This normalization ensures consistent scaling across segments, with a maximum value of 1 across the PCG envelope signal.
2.1.3. Segmentation Using Zero-Crossing Detection
The normalized Shannon energy signal was then analyzed to detect zero-crossings, which represent changes in energy distribution associated with the onset and offset of cardiac sounds. To determine the zero-crossing indices from the normalized average Shannon Energy, the signal was first resampled to a 2000 Hz sampling frequency to ensure it matches the number of samples in the PCG signal. This way, every zero crossing index is going to fit in both the envelop signal and the PCG signal. Secondly, the MATLAB command sign was used to obtain a binary vector of the envelope signal with values 1 when the envelope signal is greater than 0, and 0 when it is lower than 0. Finally, a difference sequence of the sign vector was obtained using the diff command, which located every sign changes, corresponding to the HS onset and offset positions.
Using these onset and offset positions, the next step involves determining whether each interval between consecutive zero-crossings corresponds to a HS or a silent interval (systole or diastole). To achieve this, a distance metric was calculated between the i-th zero-crossing point and its two nearest neighbors. In the algorithm, the indices of the zero-crossings are iterated over, and the distance between the current crossing and the next (), as well as between the current crossing and the previous one (), is computed. If the distance to the next crossing is greater than the distance to the previous crossing, the interval between the previous crossing and the current crossing is marked as a heart sound interval. On the other hand, if the distance to the previous crossing is greater, the interval between the current crossing and the next one is marked as a heart sound interval. This process helps to identify and classify the intervals of the signal corresponding to heart sounds or periods of silence in the cardiac cycle without needing physiological parameters.
2.2. Convolutional Neural Network
To perform automated segmentation of heart sounds, a U-net-based convolutional neural network was designed and adapted specifically for 1D PCG (phonocardiogram) signal segmentation. The U-net architecture is widely used for tasks involving segmentation due to its ability to combine global context with fine-grained details through the use of encoder-decoder pathways and skip connections. This makes it particularly suitable for the task of heart sound segmentation, where both temporal and structural information from the signal are essential. Below a graphic diagram of the proposed U-net is shown at Figure 3.
The proposed architecture consists of three primary components: an encoder, a bottleneck, and a decoder, connected via skip connections that allow the network to combine low-level details from the encoder with high-level abstractions from the bottleneck. These components work together to capture the temporal dependencies and subtle transitions inherent in heart sounds. A total of 80 PCG signals, each 30 seconds in length and sampled at a frequency of 2000 Hz, were used to train this convolutional neural network. These signals were preprocessed and normalized to enhance the quality and reliability of the input data, ensuring consistency during training.
2.2.1. Encoder
The encoder serves as the feature extraction component of the U-net architecture. It is designed to progressively downsample the input signal while simultaneously learning increasingly complex representations of its features. In this implementation, the encoder is composed of four sequential blocks, each containing two convolutional layers followed by a max-pooling operation.
- Convolutional Layers: The convolutional layers are configured with a kernel size of 9 and a padding value of 4 to ensure that the temporal resolution of the input signal is preserved throughout the encoding process. This configuration helps capture local patterns within the signal, such as rapid transitions or subtle variations in heart sounds.
- Number of Filters: The number of filters begins at 64 in the first block and doubles with each subsequent block, reaching a maximum of 1024 filters at the bottleneck. This progressive increase allows the network to capture features at multiple levels of abstraction, from basic waveforms to more complex signal characteristics.
- Max-Pooling: Max-pooling operations are used to downsample the signal, reducing its resolution and allowing the network to focus on the most salient features. This operation also reduces computational complexity, making the model more efficient.
Overall, the encoder extracts hierarchical features that are essential for understanding both the global and local characteristics of the heart sound signals.
2.2.2. Bottleneck
The bottleneck acts as the bridge between the encoder and decoder, capturing the most abstract and high-level features of the input signal. It consists of two convolutional layers with 1024 filters, each followed by ReLU activations. This component is responsible for learning representations that are invariant to noise and other variations in the PCG signals, which is particularly important given the variability of heart sounds due to factors such as age, health conditions, and recording environments.
The bottleneck can be seen as the core of the U-net architecture, as it consolidates information from the encoder while preparing it for reconstruction in the decoder. By isolating the most relevant features, it ensures that the decoder has a robust foundation for rebuilding the signal with high precision.
2.2.3. Decoder
The decoder is responsible for reconstructing the signal to its original resolution. It mirrors the structure of the encoder but operates in reverse, progressively upsampling the feature maps and combining them with corresponding features from the encoder via skip connections. This design ensures that the fine-grained details captured in the encoder are preserved and incorporated into the final segmentation output.
- Transposed Convolutions: Upsampling is performed using transposed convolutions, which increase the resolution of the feature maps while learning how to optimally reconstruct the signal.
- Skip Connections: At each stage, the decoder concatenates the upsampled features with the features from the corresponding encoder block. This mechanism allows the network to leverage both high-level and low-level information, improving the accuracy of the segmentation.
- Decreasing Filters: The number of filters decreases progressively, starting from 1024 in the bottleneck and halving with each subsequent block until it reaches 64 in the final decoder layer. This ensures that the reconstructed signal matches the original input dimensions.
- Final Layer: The final layer consists of a single convolutional layer that reduces the output to a single channel, followed by a sigmoid activation function. This produces a binary segmentation map, where each point represents the likelihood of a heart sound event.
The decoder’s ability to integrate global context from the bottleneck with local details from the encoder is key to achieving high segmentation accuracy, especially in signals with subtle transitions or noise.
2.2.4. Forward Propagation
Forward propagation within the U-net model follows a structured pathway, beginning with feature extraction in the encoder, passing through the bottleneck for high-level abstraction, and finally reconstructing the signal in the decoder.
- Encoder Phase: The input PCG signal is processed through the encoder, where features at various levels of abstraction are extracted. The use of downsampling ensures that the network captures both the local and global context of the signal.
- Bottleneck Phase: The processed signal is passed through the bottleneck, where the most salient features are learned. This phase acts as the "compression" stage, reducing noise and focusing on the core information necessary for segmentation.
- Decoder Phase: The signal is then reconstructed in the decoder, where skip connections ensure that fine-grained details are incorporated. At this point, a sigmoid activation signal is used to finally generate a binary PCG segmentation map that highlights the locations of heart sounds within the PCG signal.
2.2.5. Advantages of the U-Net Architecture for Heart Sound Segmentation
The U-net architecture offers several advantages for heart sound segmentation. Its ability to combine global and local features through skip connections is particularly useful for capturing the subtle and complex patterns found in PCG signals. Additionally, its symmetrical design and efficient use of computational resources make it well-suited for real-time applications, such as automated diagnosis or monitoring of heart conditions.
2.3. CNN Training Parameters
The training of the U-net-based convolutional neural network was carried out using carefully selected parameters to optimize performance for the segmentation of heart sounds. The following configurations were used:
- Loss Function: The binary cross-entropy loss function was employed, as it is well-suited for binary classification tasks such as this, where the goal is to segment heart sound events from the PCG signal.
- Learning Rate: A learning rate of 0.0001 was chosen to ensure stable convergence during training. This small learning rate helps avoid large updates to the model weights, reducing the risk of overshooting the optimal solution and ensuring smooth optimization.
- Optimizer: The Adam optimizer was used for training. Adam combines the benefits of adaptive learning rates and momentum, making it effective for handling noisy gradients and sparse updates, both of which are common in segmentation tasks involving physiological signals.
- Epochs and Batch Size: The model was trained for 100 epochs with a batch size of 4. The small batch size was chosen to accommodate the high dimensionality of the PCG signals and the computational constraints, while the 100 epochs allowed the model to learn and generalize effectively without overfitting.
These parameters were fine-tuned through iterative experimentation to ensure that the model achieved the best balance between accuracy and computational efficiency. The combination of the binary cross-entropy loss function, a low learning rate, and the Adam optimizer was particularly effective in capturing the temporal and structural patterns of heart sounds for precise segmentation.
3. Results
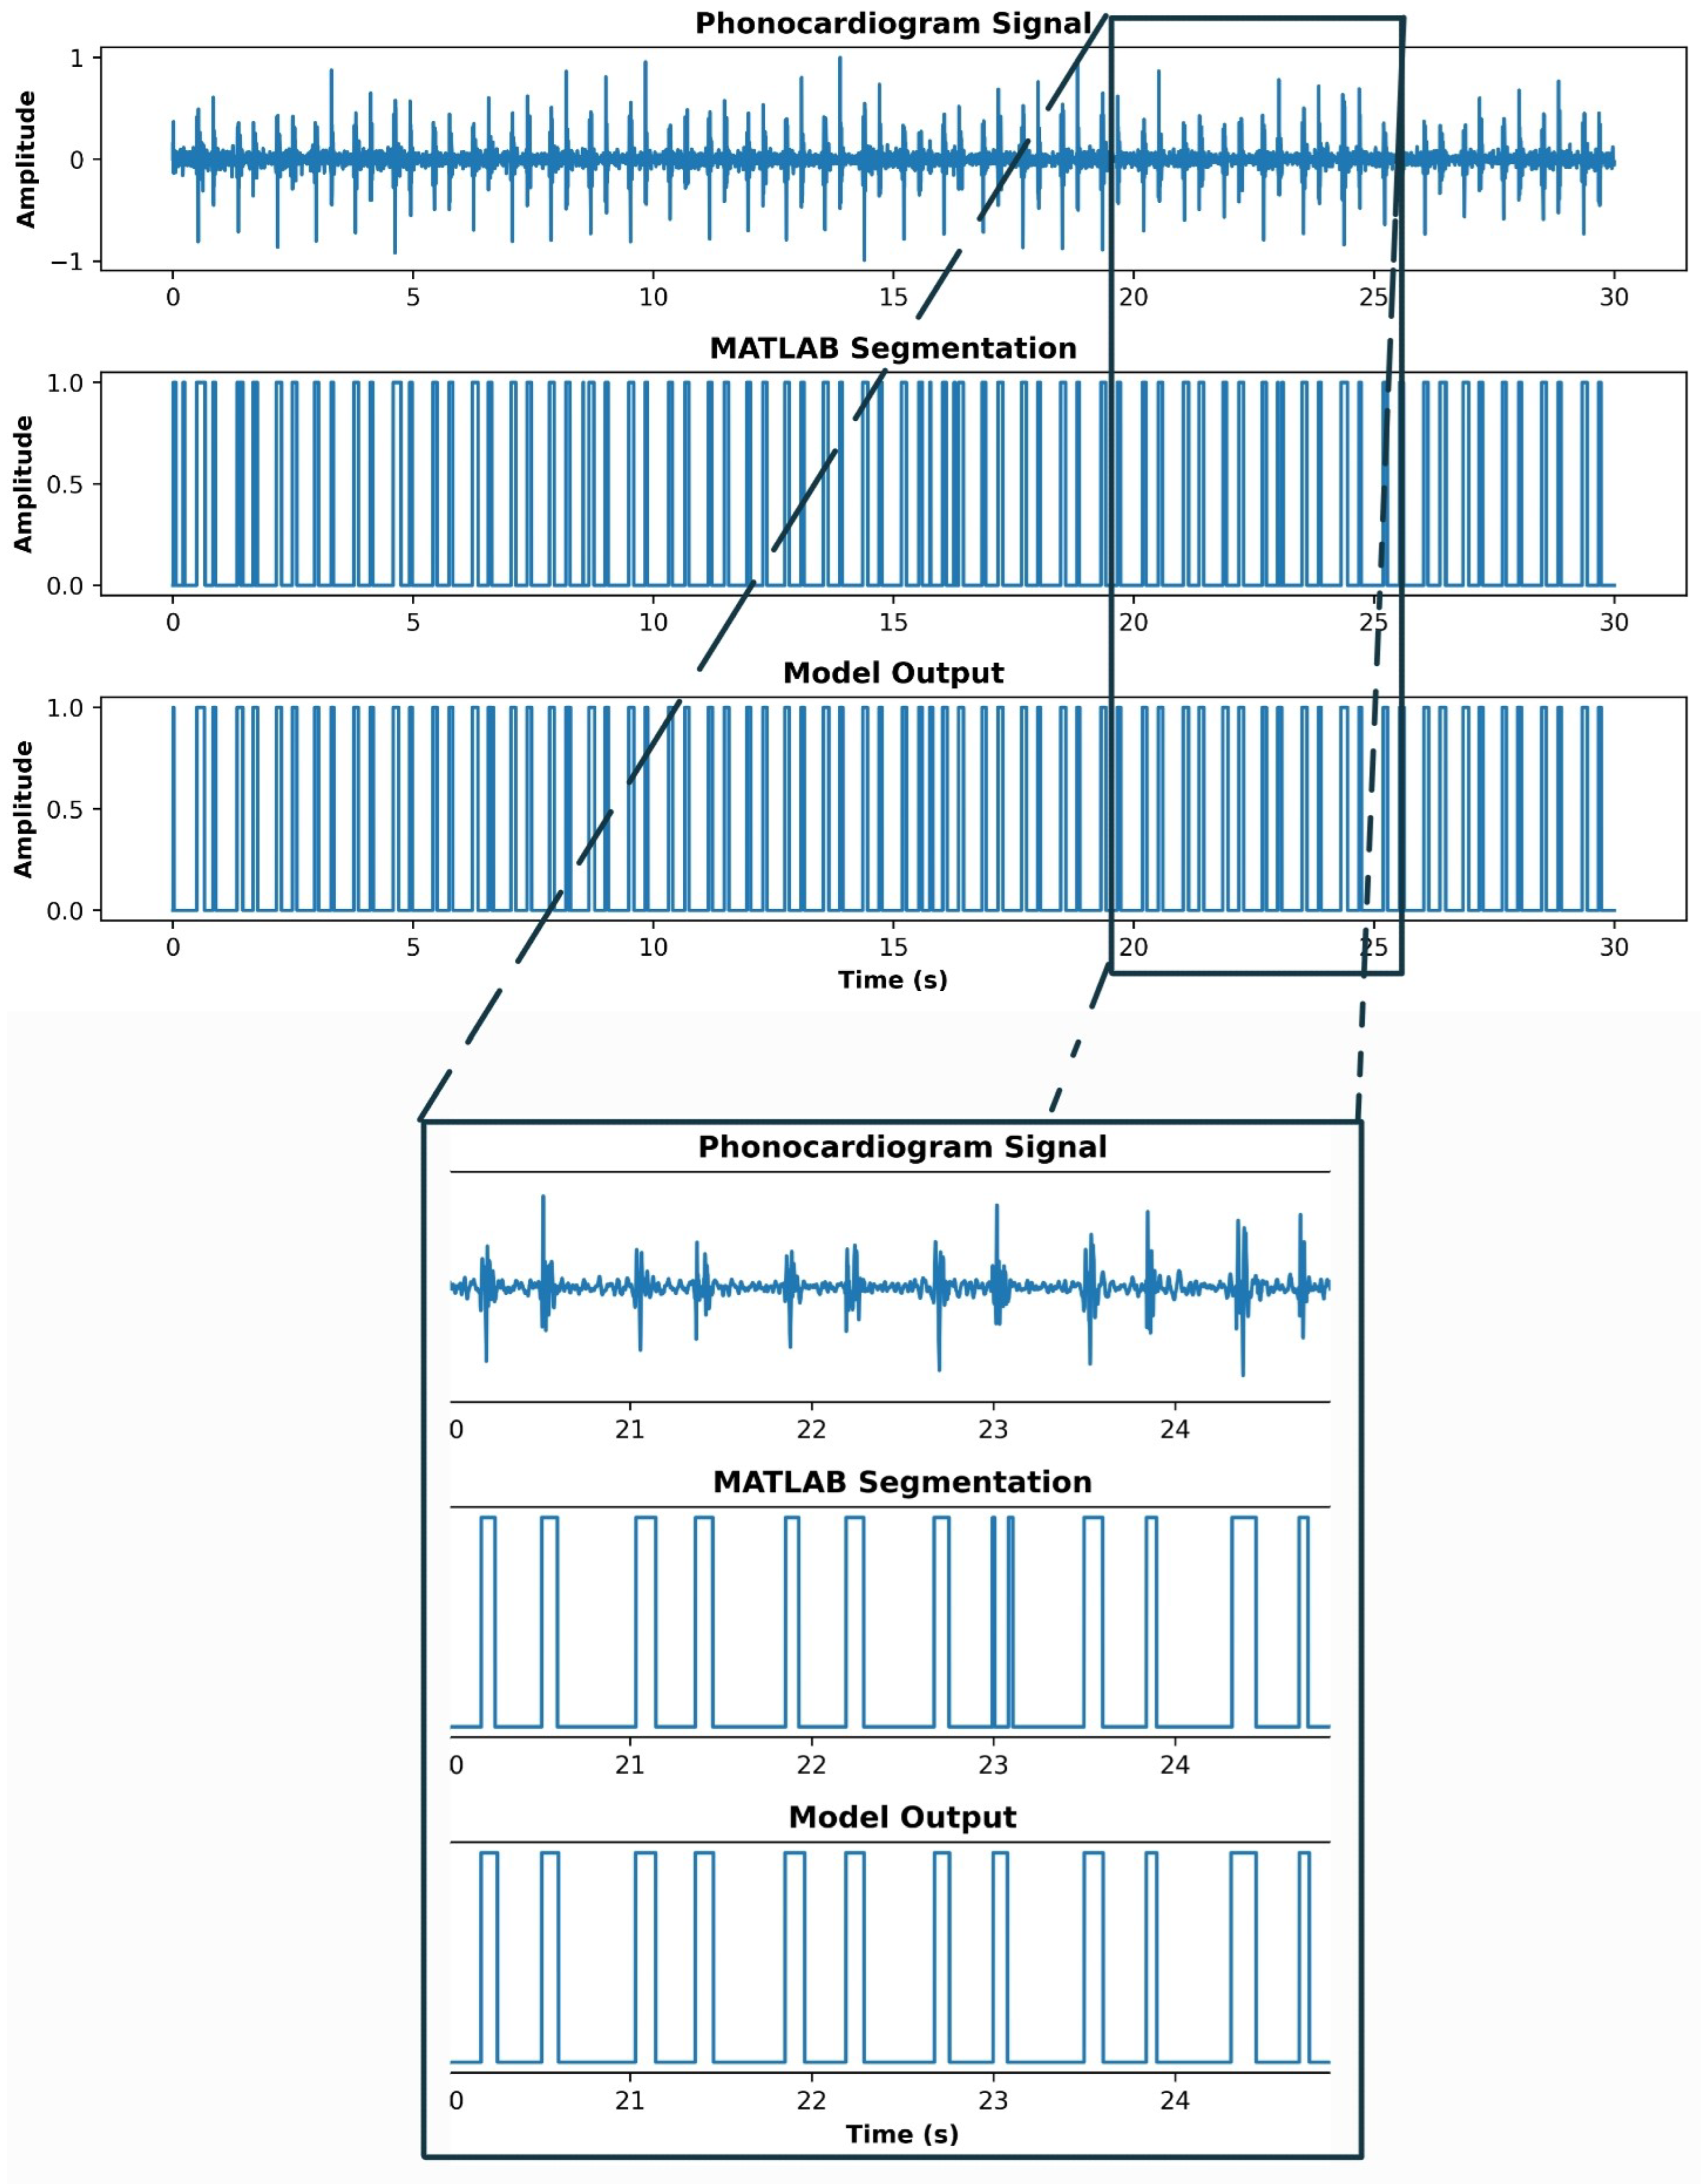
One of the most remarkable outcomes of this project was the U-net’s ability to correct errors present in the initial annotations generated using the Shannon energy algorithm (shown at Figure 4). While the algorithm provided a robust foundation for segmenting heart sounds, certain inaccuracies in the onset and offset detection of heart sounds were observed, particularly in signals with low signal-to-noise ratios or irregular patterns. The U-net, through its encoder-decoder structure and skip connections, demonstrated the capability to refine these annotations, resulting in more accurate segmentation maps. The model’s performance was quantitatively evaluated, yielding an impressive accuracy of 0.95, a precision of 0.82, a recall of 0.96, and an F1-score of 0.89.
The results were visually inspected and compared against the original annotations. The qualitative analysis revealed that the U-net consistently aligned its predictions with the expected morphology of heart sounds, correcting misalignments and reducing segmentation noise. Figure 3 illustrates this comparison, where the U-net output visibly outperforms the initial annotations by providing cleaner boundaries and better alignment with the PCG signal. While a quantitative assessment remains an area for future research, these visual comparisons highlight the potential of the model to enhance the accuracy of automated heart sound segmentation. Finally, Figure 5 shows an example of a PCG signal segmentation using Shannon Energy envelope and the proposed U-net.
4. Discussion
The results indicate that the proposed approach, which adapts the principles of 2D biomedical image segmentation, has the potential to surpass traditional heart sound (HS) segmentation techniques. By leveraging the convolutional neural network (CNN), this method offers a more automated and potentially more accurate way to identify and segment heart sounds from complex audio data. Moreover, it was noticed that certain variations in the heart sound recordings—such as background noise, microphone quality, and patient conditions—pose challenges for the current model. Further work is needed to enhance the model’s robustness, perhaps by incorporating noise reduction techniques or by improving the diversity of the training data. The potential for integrating additional context, such as patient demographics or health status, could also improve the system’s diagnostic capability.
In order to improve this method, a fully manual segmentation should be used to train this U-net model. This way, even if the PCG signal is contaminated with ambient noise, spikes, movement artifacts or pathological noises, the model can identify every HS a person could.
5. Conclusions
A U-net 1D convolutional neural network for automated phonocardiogram signal segmentation was carried out in this research work. As this represents an initial foray into the application of machine learning for heart sound segmentation, there are numerous areas that warrant further exploration and refinement. Two primary avenues for improvement stand out. Firstly, a manual segmentation is essential to improve the model’s ability to accurately delineate heart sounds across a broader range of patient conditions and environments. This manual annotation process will also help in creating a more comprehensive ground truth, essential for evaluating the model’s performance more accurately. This paper proposed a binary approach to HS segmentation, basically mimicking the process used in biomedical images segmentation and potentially eliminating the tedious feature extraction stage in the PCG signal. In summary, while the proposed method shows great promise, its development is still in the early stages. The next steps involve expanding the dataset, and refining the CNN architecture to improve both segmentation accuracy and robustness. The ultimate goal is to create a reliable, automated tool for heart sound analysis that can aid in the early detection and monitoring of cardiovascular conditions, potentially transforming the way heart diseases are diagnosed and managed in clinical practice.
Abbreviations
The following abbreviations are used in this manuscript:
| PCG | Phonocardiogram |
| HS | Heart Sounds |
| CNN | Convolutional Neural Network |
References
- British Heart Foundation. Global Heart & Circulatory Diseases Factsheet. British Heart Foundation, London, UK, 2024. Published September 2024. Accessed January 3, 2025.
- World Heart Federation. World Heart Report 2023: Driving change for cardiovascular health. World Heart Federation, Geneva, Switzerland, 2023. Accessed 21/11/24.
- Chakrabarti, T.; Saha, S.; Roy, S.; Chel, I. Phonocardiogram Signal Analysis – Practices, Trends and Challenges: A Critical Review. In Proceedings of the Proceedings of the International Conference on Signal Processing, Informatics, Communication and Energy Systems (SPICES), Kolkata, India, 2015; pp. 1–6. [CrossRef]
- Phua, K.; Chen, J.; Dat, T.H.; Shue, L. Heart Sound as a Biometric. Pattern Recognition 2008, 41, 906–919. [Google Scholar] [CrossRef]
- Folland, E.D.; Kriegel, B.J.; Henderson, W.G.; Hammermeister, K.E.; Sethi, G.K.; null null. Implications of Third Heart Sounds in Patients with Valvular Heart Disease. New England Journal of Medicine 1992, 327, 458–462. [Google Scholar] [CrossRef]
- Tseng, Y.L.; Ko, P.Y.; Jaw, F.S. Detection of the Third and Fourth Heart Sounds Using Hilbert-Huang Transform. BioMed Engineering OnLine 2012, 11, 1–15. [Google Scholar] [CrossRef]
- Yuenyong, S.; Nishihara, A.; Kongprawechnon, W.; Tungpimolrut, K. A framework for automatic heart sound analysis without segmentation. Biomedical Engineering Online 2011, 10, 13, Published February 9, 2011. [Google Scholar] [CrossRef]
- Rajkomar, A.; Dean, J.; Kohane, I. Machine Learning in Medicine. New England Journal of Medicine 2019, 380, 1347–1358. [Google Scholar] [CrossRef] [PubMed]
- Singh, S.A.; Singh, S.A.; Devi, N.D.; Majumder, S. Heart Abnormality Classification Using PCG and ECG Recordings. Computación y Sistemas 2021, 25, 381–391, Epub 11-Oct-2021. [Google Scholar] [CrossRef]
- Sepehri, A.A.; Gharehbaghi, A.; Dutoit, T.; Kocharian, A.; Kiani, A. A novel method for pediatric heart sound segmentation without using the ECG. Computer Methods and Programs in Biomedicine 2010, 99, 43–48. [Google Scholar] [CrossRef] [PubMed]
- Silva, A.; Teixeira, R.; Fontes-Carvalho, R.; Coimbra, M.; Renna, F. On the Impact of Synchronous Electrocardiogram Signals for Heart Sounds Segmentation. Annual International Conference of the IEEE Engineering in Medicine & Biology Society (EMBC) 2023, 2023, 1–5. [Google Scholar] [CrossRef]
- Maglogiannis, I.; Loukis, E.; Zafiropoulos, E.; Stasis, A. Support vectors machine-based identification of heart valve diseases using heart sounds. Computer methods and programs in biomedicine 2009, 95, 47–61. [Google Scholar] [CrossRef]
- Oliveira, J.; Nogueira, D.; Ferreira, C.; Jorge, A.M.; Coimbra, M. The robustness of random forest and support vector machine algorithms to a faulty heart sound segmentation. In Proceedings of the 2022 44th Annual International Conference of the IEEE Engineering in Medicine & Biology Society (EMBC). IEEE, 2022, pp. 1989–1992.
- Li, J.; Ke, L.; Du, Q. Classification of Heart Sounds Based on the Wavelet Fractal and Twin Support Vector Machine. Entropy 2019, 21. [Google Scholar] [CrossRef]
- Martins, M.L.; Coimbra, M.T.; Renna, F. Markov-Based Neural Networks for Heart Sound Segmentation: Using Domain Knowledge in a Principled Way. IEEE Journal of Biomedical and Health Informatics 2023, 27, 5357–5368. [Google Scholar] [CrossRef] [PubMed]
- Yin, Y.; Ma, K.; Liu, M. Temporal convolutional network connected with an anti-arrhythmia hidden semi-Markov model for heart sound segmentation. Applied Sciences 2020, 10, 7049. [Google Scholar] [CrossRef]
- Martins, M.L.; Coimbra, M.T.; Renna, F. Markov-based Neural Networks for Heart Sound Segmentation: Using domain knowledge in a principled way. IEEE Journal of Biomedical and Health Informatics 2023. [Google Scholar] [CrossRef] [PubMed]
- Sharma, L. Multiscale analysis of heart sound for segmentation using multiscale Hilbert envelope. In Proceedings of the 2015 13th International Conference on ICT and Knowledge Engineering (ICT & Knowledge Engineering 2015). IEEE, 2015, pp. 33–37.
- Moukadem, A.; Dieterlen, A.; Hueber, N.; Brandt, C. A robust heart sounds segmentation module based on S-transform. Biomedical Signal Processing and Control 2013, 8, 273–281. [Google Scholar] [CrossRef]
- Liu, Q.; Wu, X.; Ma, X. An automatic segmentation method for heart sounds. Biomedical engineering online 2018, 17, 1–22. [Google Scholar] [CrossRef]
- Kui, H.; Pan, J.; Zong, R.; Yang, H.; Wang, W. Heart sound classification based on log Mel-frequency spectral coefficients features and convolutional neural networks. Biomedical Signal Processing and Control 2021, 69, 102893. [Google Scholar] [CrossRef]
- Ren, Z.; Qian, K.; Dong, F.; Dai, Z.; Nejdl, W.; Yamamoto, Y.; Schuller, B.W. Deep attention-based neural networks for explainable heart sound classification. Machine Learning with Applications 2022, 9, 100322. [Google Scholar] [CrossRef]
- Zeng, W.; Yuan, J.; Yuan, C.; Wang, Q.; Liu, F.; Wang, Y. A new approach for the detection of abnormal heart sound signals using TQWT, VMD and neural networks. Artificial Intelligence Review 2021, 54, 1613–1647. [Google Scholar] [CrossRef]
- Ghosh, S.K.; Ponnalagu, R.; Tripathy, R.K.; Panda, G.; Pachori, R.B. Automated heart sound activity detection from PCG signal using time–frequency-domain deep neural network. IEEE Transactions on Instrumentation and Measurement 2022, 71, 1–10. [Google Scholar] [CrossRef]
- He, Y.; Li, W.; Zhang, W.; Zhang, S.; Pi, X.; Liu, H. Research on Segmentation and Classification of Heart Sound Signals Based on Deep Learning. Applied Sciences 2021, 11. [Google Scholar] [CrossRef]
- Hernández-Herrera, P.; Abonza, V.; Sánchez-Contreras, J.; Darszon, A.; Guerrero, A. Deep Learning-Based Classification and Segmentation of Sperm Head and Flagellum for Image-Based Flow Cytometry. Computación y Sistemas 2023, 27, 1133–1145, Epub 17 de mayo de 2024. [Google Scholar] [CrossRef]
- Hernandez-Herrera, P.; Montoya, F.; Rendón-Mancha, J.M.; Darszon, A.; Corkidi, G. 3-D +{t} Human Sperm Flagellum Tracing in Low SNR Fluorescence Images. IEEE transactions on medical imaging 2018, 37, 2236–2247. [Google Scholar] [CrossRef]
- Zhuang, B.; Shen, C.; Tan, M.; Liu, L.; Reid, I. Structured binary neural networks for accurate image classification and semantic segmentation. In Proceedings of the Proceedings of the IEEE/CVF conference on computer vision and pattern recognition, 2019, pp. 413–422.
- Ronneberger, O.; Fischer, P.; Brox, T. U-Net: Convolutional Networks for Biomedical Image Segmentation. Medical Image Computing and Computer-Assisted Intervention 2015, pp. 234–241.
- Liu, C.; Springer, D.; Li, Q.; Moody, B.; Juan, R.A.; Chorro, F.J.; Castells, F.; Roig, J.M.; Silva, I.; Johnson, A.E.W.; et al. An open access database for the evaluation of heart sound algorithms. Physiological Measurement 2016, 37, 2181–2213. [Google Scholar] [CrossRef] [PubMed]
- Shoushan, M.M.; Reyes, B.A.; Rodriguez, A.M.; Chong, J.W. Non-contact HR monitoring via smartphone and webcam during different respiratory maneuvers and body movements. IEEE Journal of Biomedical and Health Informatics 2020, 25, 602–612. [Google Scholar] [CrossRef] [PubMed]
- Shoushan, M.M.; Reyes, B.A.; Rodriguez, A.M.; Chong, J.W. Contactless heart rate variability (HRV) estimation using a smartphone during respiratory maneuvers and body movement. In Proceedings of the 2021 43rd Annual International Conference of the IEEE Engineering in Medicine & Biology Society (EMBC). IEEE, 2021, pp. 84–87.
- Camacho-Juárez, J.S.; Alexander-Reyes, B.; Morante-Lezama, A.; Méndez-García, M.; González-Aguilar, H.; Rodríguez-Leyva, I.; Nuñez-Olvera, O.F.; Polanco-González, C.; Gorordo-Delsol, L.A.; Castañón-González, J.A. A novel disposable sensor for measure intra-abdominal pressure. Cirugía y cirujanos 2020, 88, 7–14. [Google Scholar] [CrossRef]
- Olvera-Montes, N.; Reyes, B.; Charleston-Villalobos, S.; González-Camarena, R.; MejíaÁvila, M.; Dorantes-Méndez, G.; Reulecke, S.; Aljama-Corrales, T.A. Detection of Respiratory Crackle Sounds via an Android Smartphone-based System. In Proceedings of the 2018 40th Annual International Conference of the IEEE Engineering in Medicine and Biology Society (EMBC); 2018; pp. 1620–1623. [Google Scholar] [CrossRef]
- XU, W.; DU, F. A ROBUST QRS COMPLEX DETECTION METHOD BASED ON SHANNON ENERGY ENVELOPE AND HILBERT TRANSFORM. Journal of Mechanics in Medicine and Biology 2022, 22, 2240013. [Google Scholar] [CrossRef]
- Kafando, A.; Fournier, E.; Serhir, B.; Martineau, C.; Doualla-Bell, F.; Sangaré, M.N.; Sylla, M.; Chamberland, A.; El-Far, M.; Charest, H.; et al. HIV-1 envelope sequence-based diversity measures for identifying recent infections. PLOS ONE 2017, 12, 1–24. [Google Scholar] [CrossRef] [PubMed]
- Chowdhury, T.H.; Poudel, K.N.; Hu, Y. Time-Frequency Analysis, Denoising, Compression, Segmentation, and Classification of PCG Signals. IEEE Access 2020, 8, 160882–160890. [Google Scholar] [CrossRef]
Figure 1.
Normal phonocardiogram signal, where S1 and S2 occur preiodically. Every start and end position can be found using machine learning, processing algorithms, and so on. In blue, the PCG signal waveform. In a dotted line, the heart sound detection.
Figure 1.
Normal phonocardiogram signal, where S1 and S2 occur preiodically. Every start and end position can be found using machine learning, processing algorithms, and so on. In blue, the PCG signal waveform. In a dotted line, the heart sound detection.
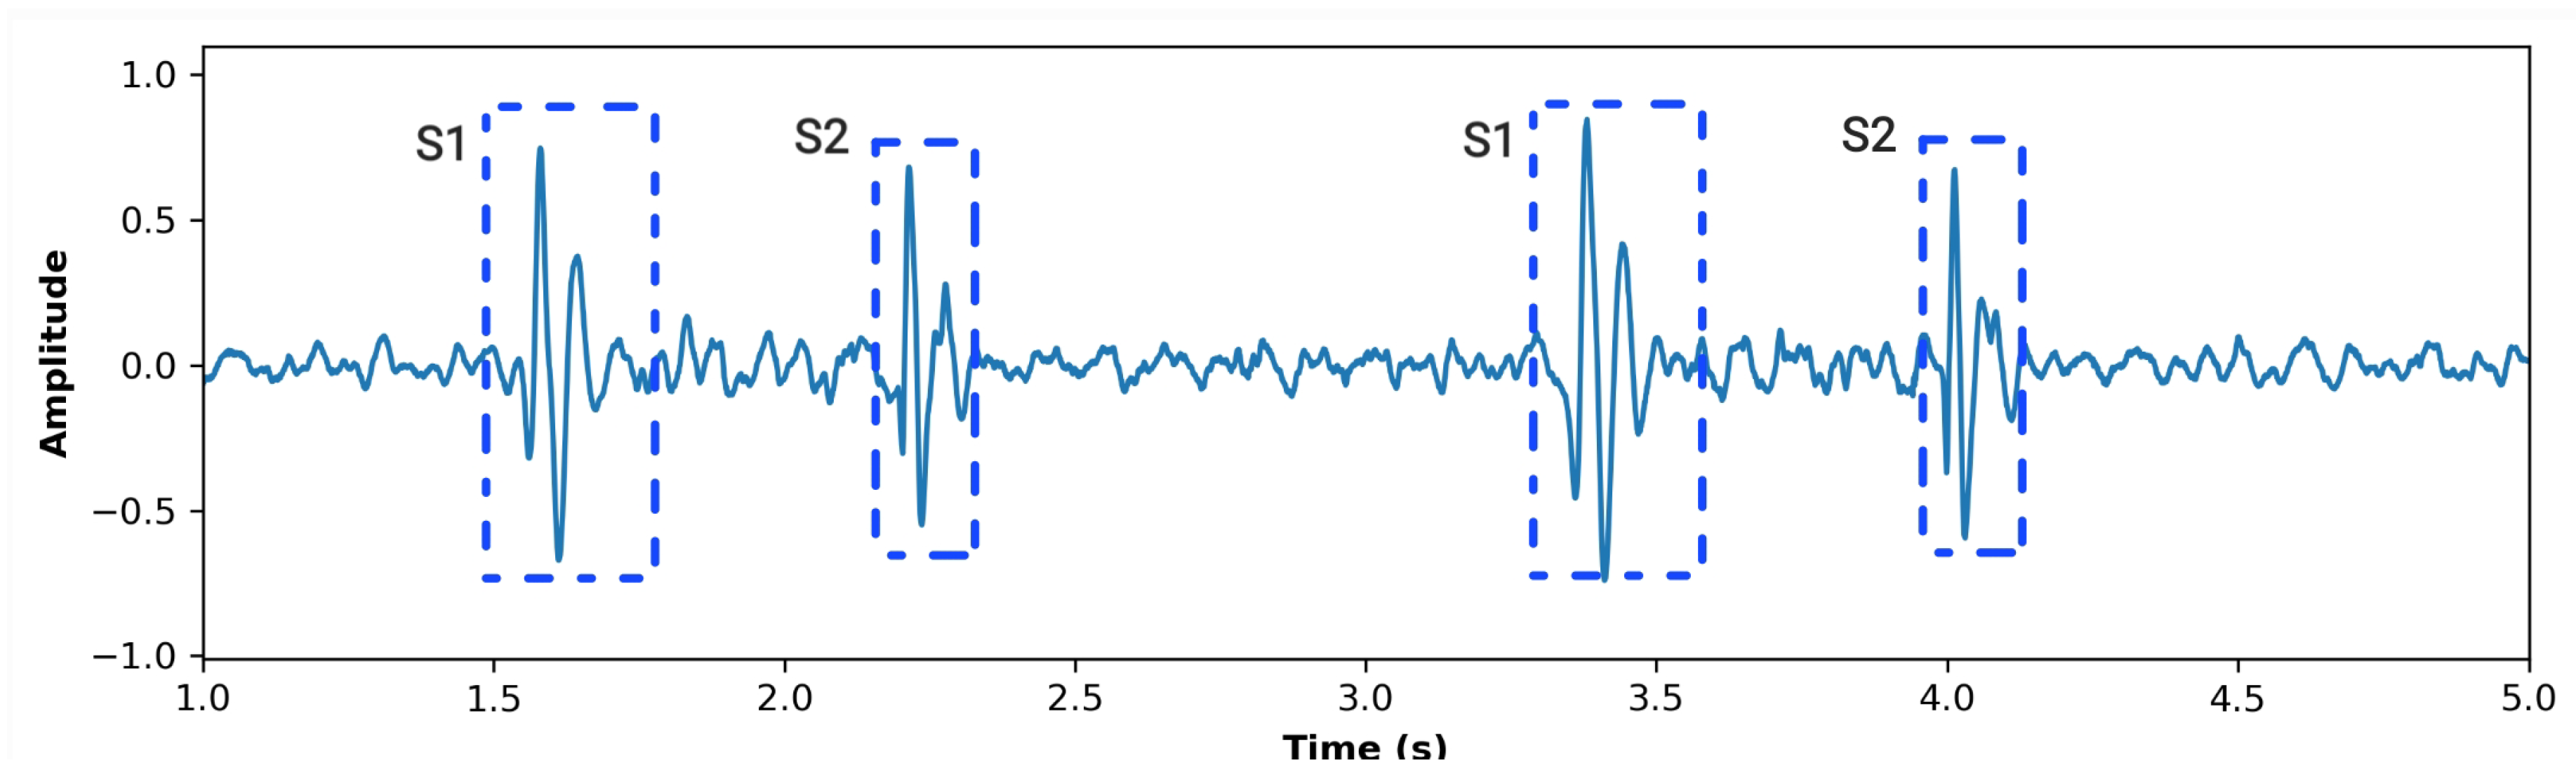
Figure 2.
Block diagram of the pulse train generation stage. As an input, the PCG signal is received, and the algorithm returns a pulse train with value 1 when a heart sound occurs and 0 otherwise.
Figure 2.
Block diagram of the pulse train generation stage. As an input, the PCG signal is received, and the algorithm returns a pulse train with value 1 when a heart sound occurs and 0 otherwise.
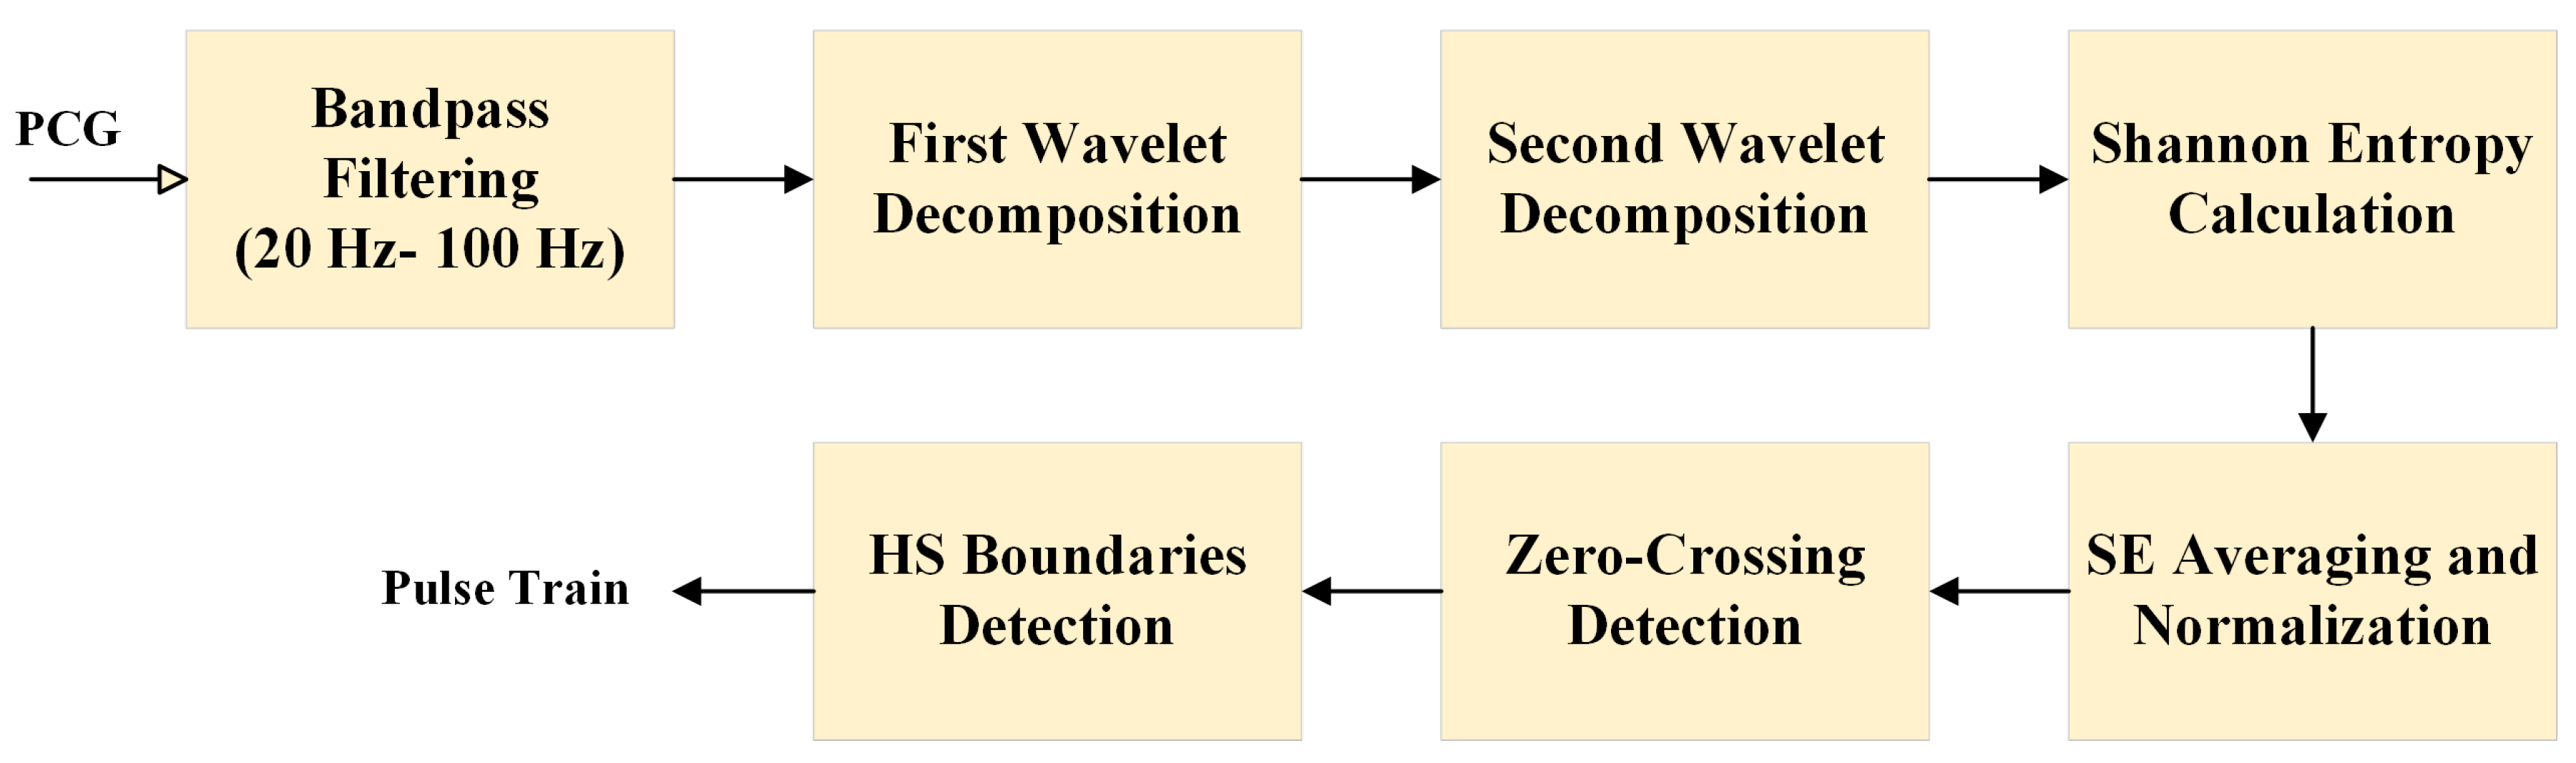
Figure 3.
U-net architecture adapted for 1D PCG signal segmentation from [29]. Each blue box represents a multi-channel feature map, with the number of channels indicated at the top and the temporal size shown at the lower left. Green boxes represent copied feature maps transferred via skip connections. Arrows denote the operations. The final layer outputs a binary segmentation map for heart sound detection.
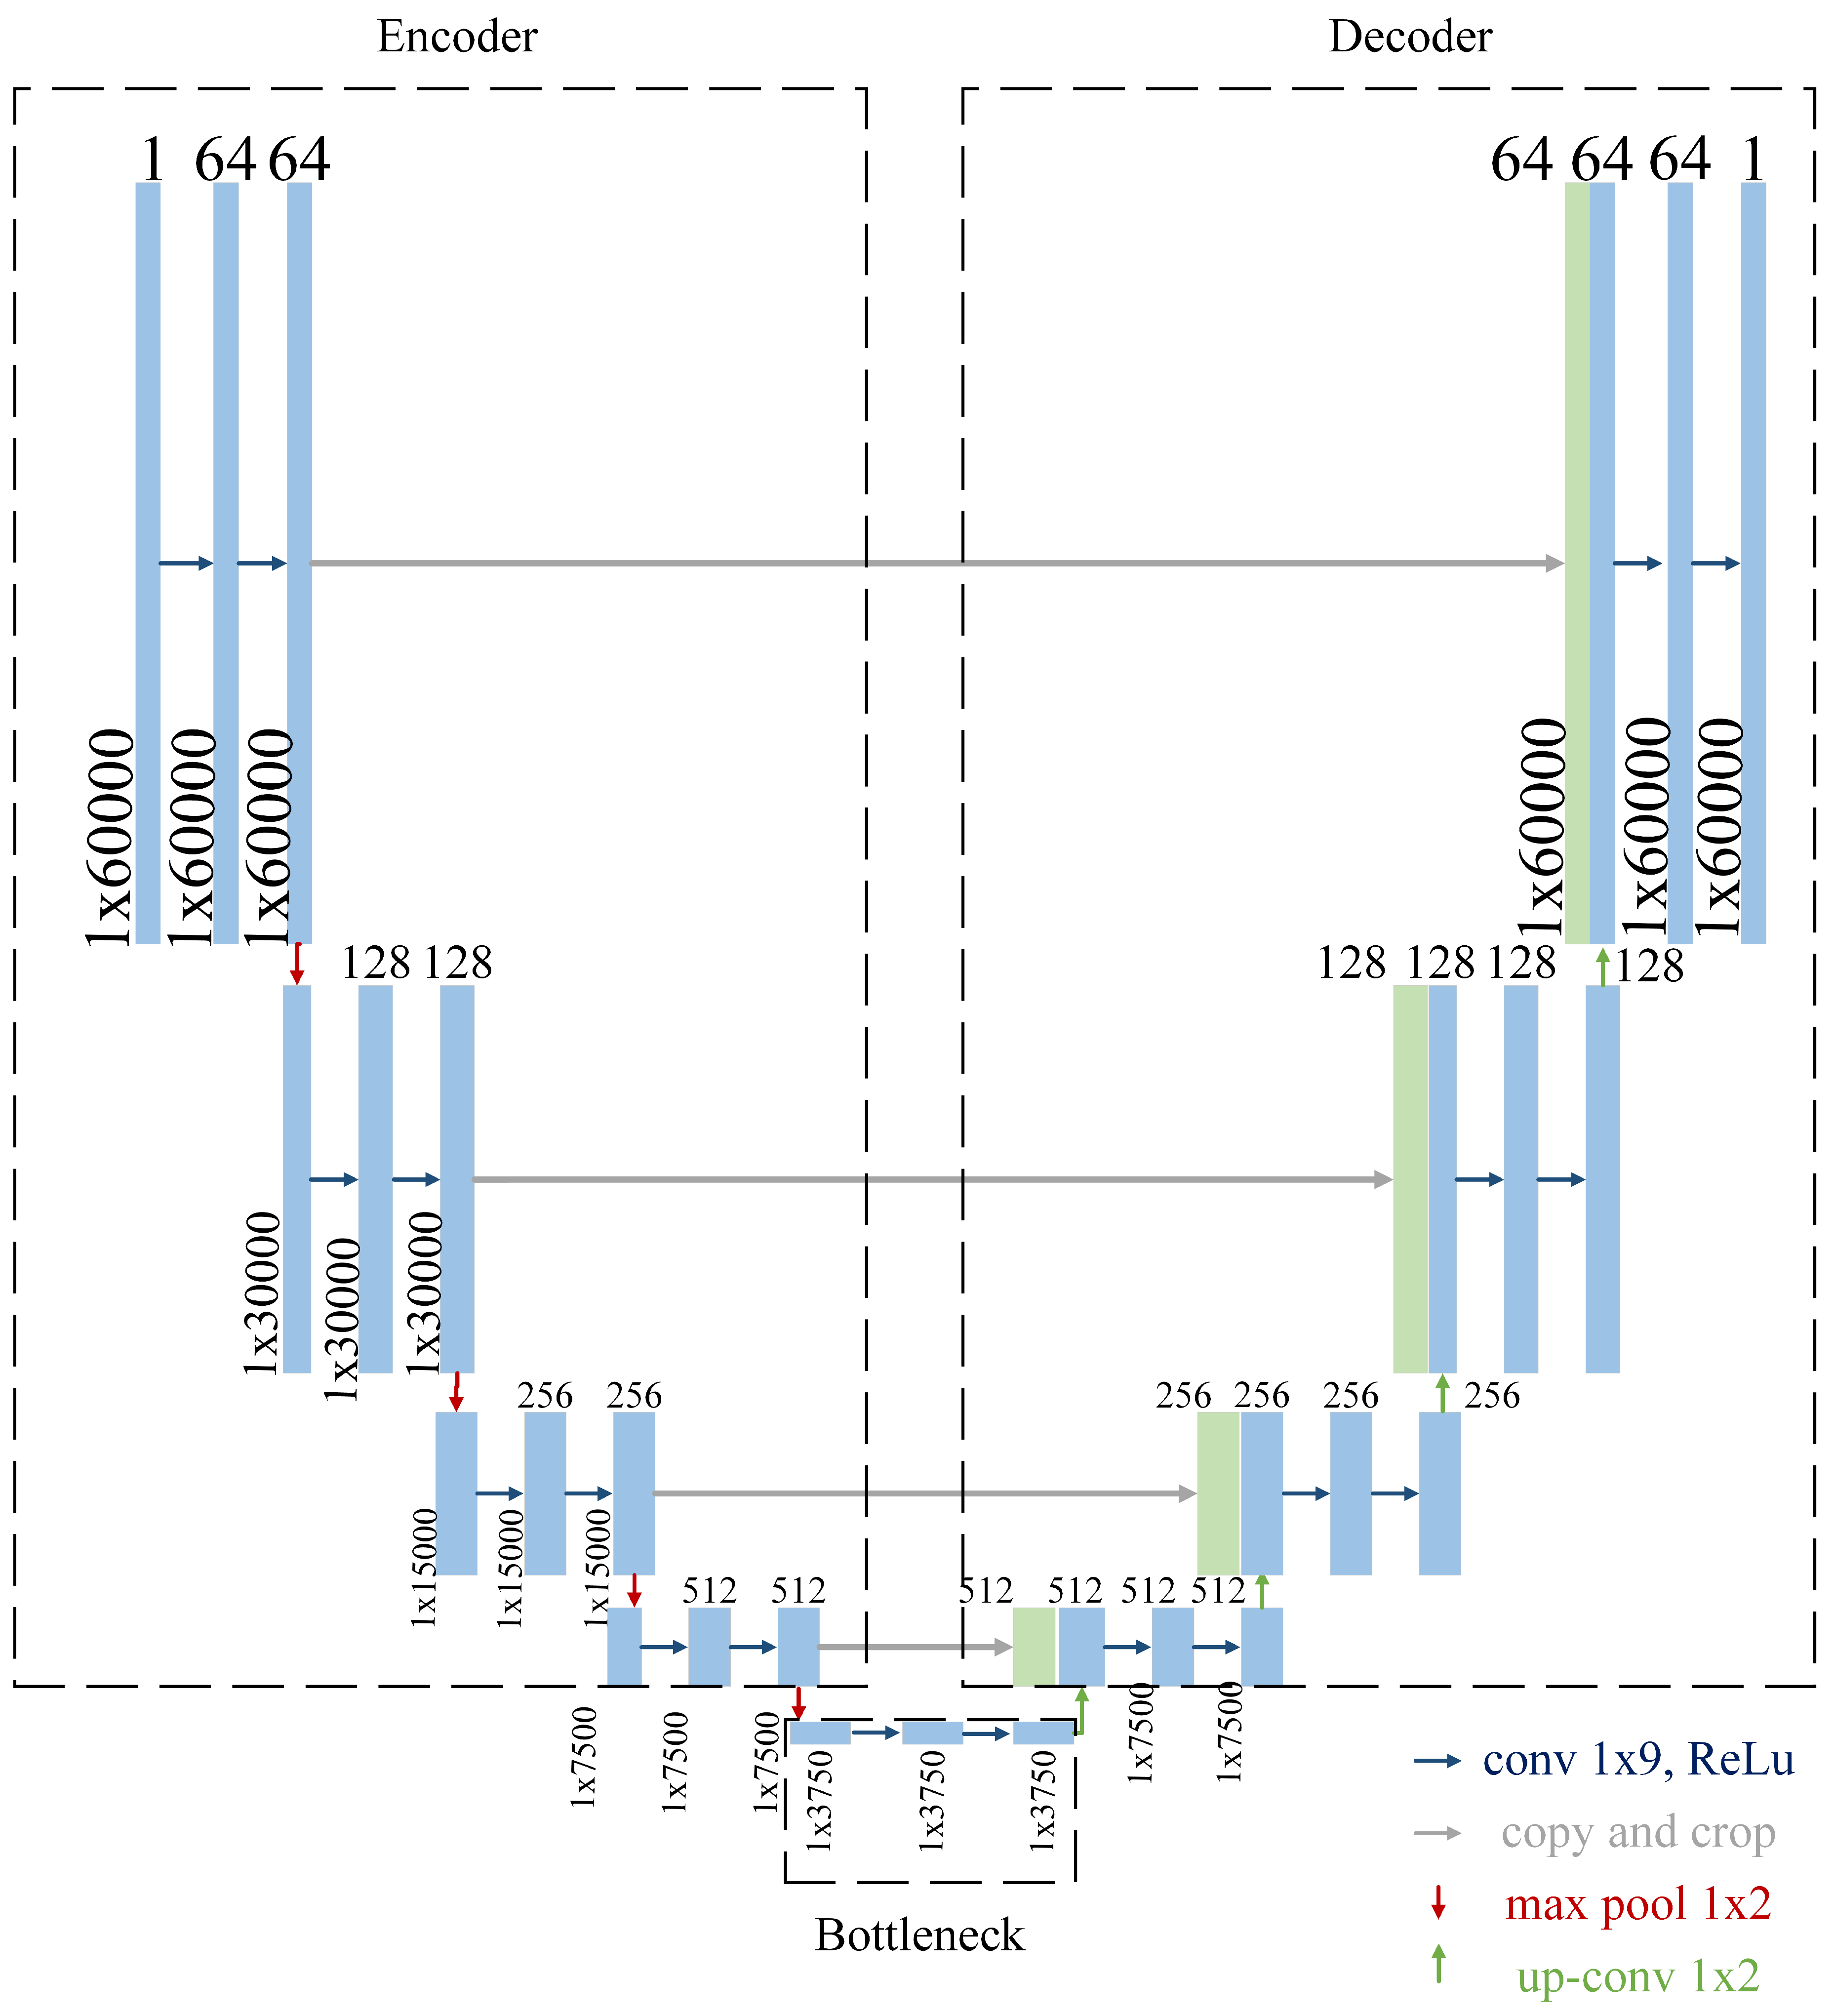
Figure 4.
MATLAB segmentation results. IN
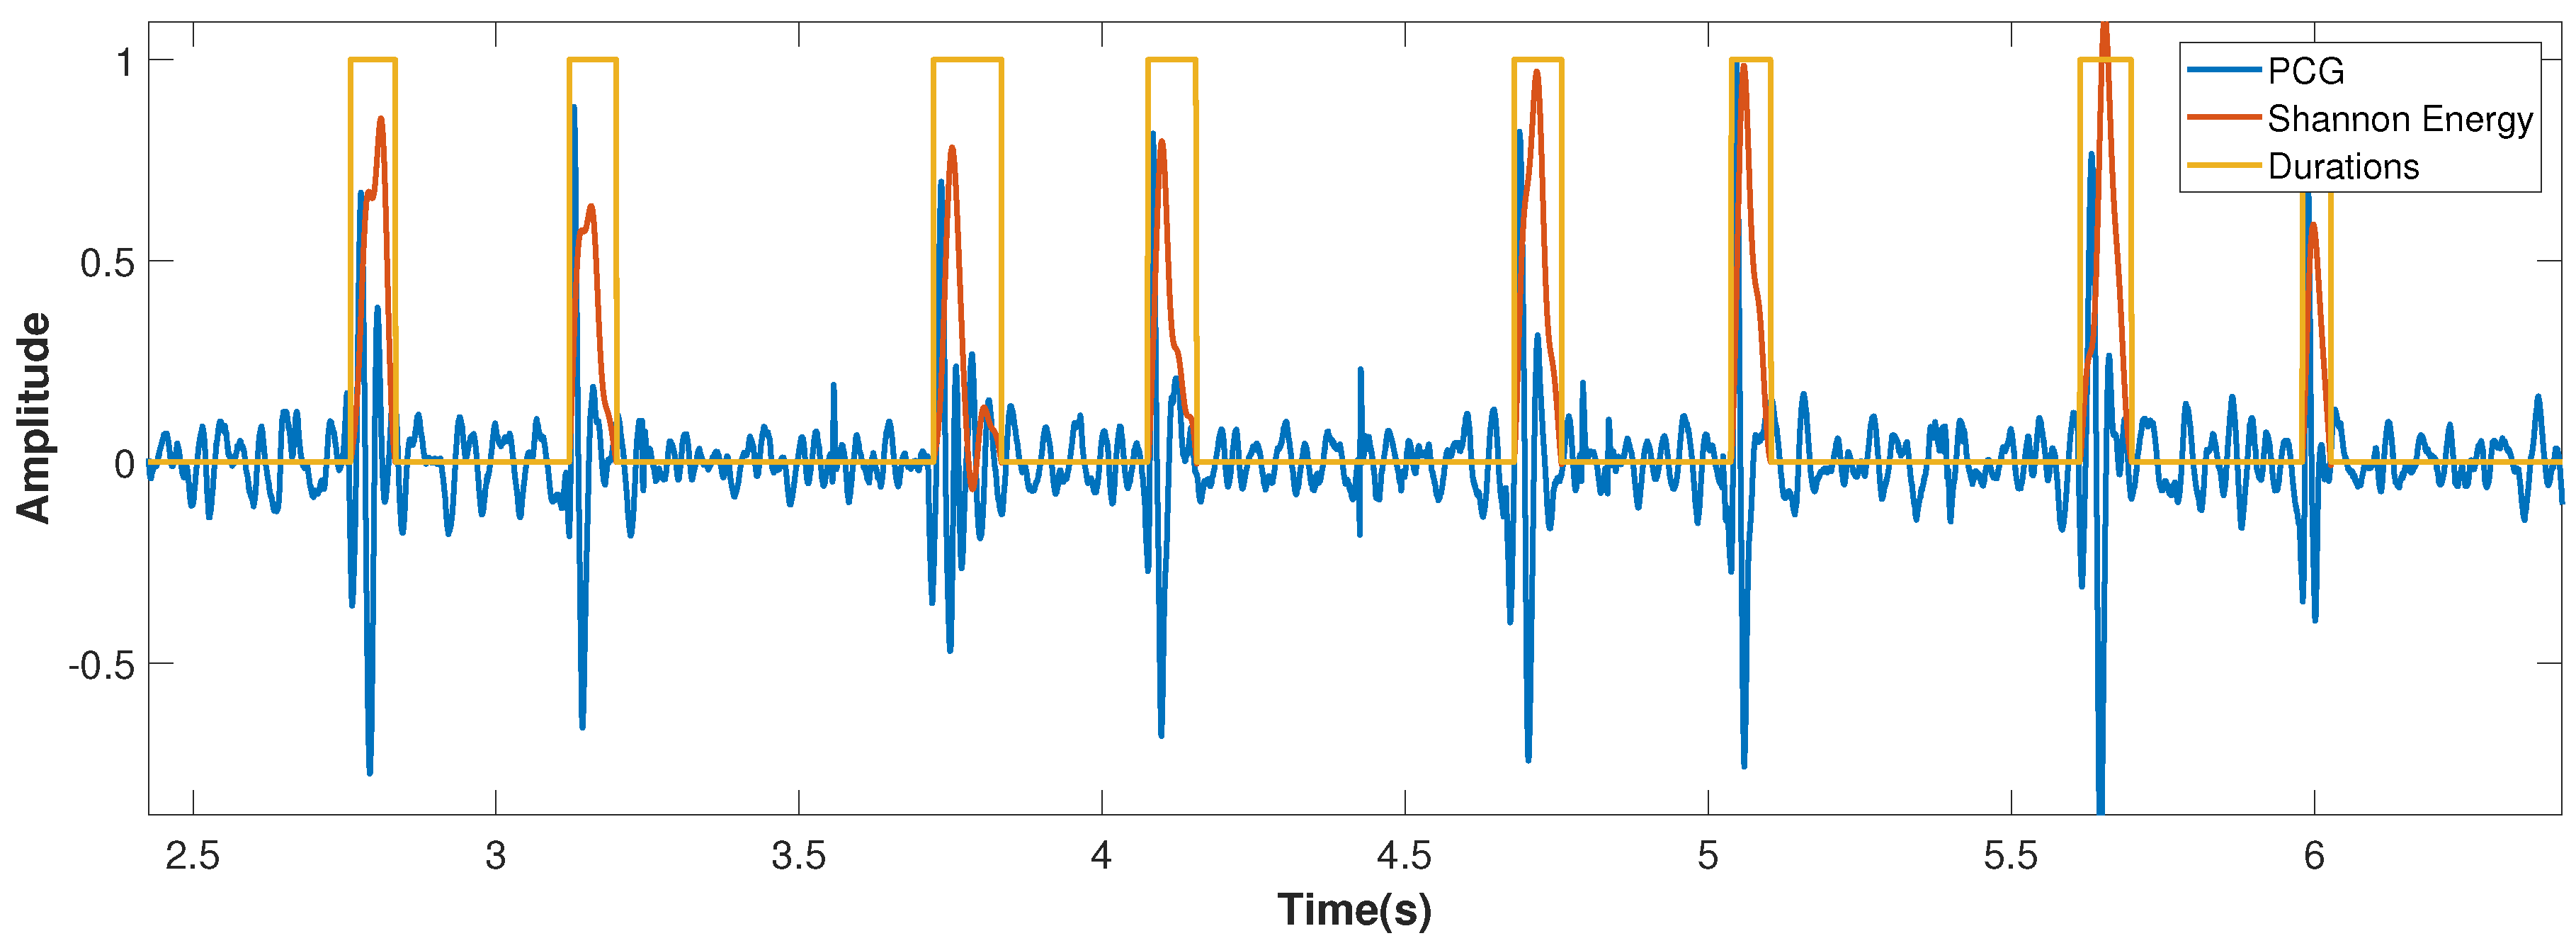
Figure 5.
Display of a PCG signal, and the results using the Shannon Energy based segmentation and the models performed segmentation.
Figure 5.
Display of a PCG signal, and the results using the Shannon Energy based segmentation and the models performed segmentation.
Disclaimer/Publisher’s Note: The statements, opinions and data contained in all publications are solely those of the individual author(s) and contributor(s) and not of MDPI and/or the editor(s). MDPI and/or the editor(s) disclaim responsibility for any injury to people or property resulting from any ideas, methods, instructions or products referred to in the content. |
© 2025 by the authors. Licensee MDPI, Basel, Switzerland. This article is an open access article distributed under the terms and conditions of the Creative Commons Attribution (CC BY) license (http://creativecommons.org/licenses/by/4.0/).
Copyright: This open access article is published under a Creative Commons CC BY 4.0 license, which permit the free download, distribution, and reuse, provided that the author and preprint are cited in any reuse.


