
Submitted:
17 May 2024
Posted:
21 May 2024
You are already at the latest version
Abstract
Accurate segmentation of the Left Ventricle (LV) in Echocardiogram (Echo) images is essential for cardiovascular analysis. Conventional techniques are labor-intensive and exhibit inter-observer variability. Deep learning has emerged as a powerful tool for automated medical image segmentation, offering advantages in speed and potentially superior accuracy. This study explores the efficacy of employing the YOLO (You Only Look Once) segmentation model for automated LV segmentation in Echo images.
YOLO, a cutting-edge object detection model, achieves exceptional speed-accuracy balance through its well-designed architecture. It utilizes efficient dilated convolutional layers and bottleneck blocks for feature extraction, while incorporating innovations like path aggregation and spatial attention mechanisms. These attributes make YOLO a compelling candidate for adaptation to LV segmentation in Echo images. We posit that by fine-tuning a pre-trained YOLO based model on a well-annotated Echo image dataset, we can leverage the model's strengths in real-time processing and precise object localization to achieve robust LV segmentation.
The proposed approach entails fine-tuning a pre-trained YOLO model on a rigorously labeled Echo image dataset. Model performance has been evaluated using established metrics such as mean Average Precision (mAP) at an Intersection over Union (IoU) threshold of 50% (mAP50) with 98.31%and across a range of IoU thresholds from 50% to 95% (mAP50:95) with 75.27%.
Successful implementation of YOLO for LV segmentation has the potential to significantly expedite and standardize Echo image analysis. This advancement could translate to improved clinical decision-making and enhanced patient care.
Keywords:
Left Ventricle(LV)
; echocardiogram
; deep learning
; segmentation
; feature extraction
; dilated convolution
; YOLO
1. Introduction
Cardiovascular disease (CVD) remains the leading cause of mortality globally, accounting for an estimated 17.9 million deaths annually [1]. Accurate assessment of cardiac function is crucial for timely diagnosis, risk stratification, and guiding treatment decisions in patients with CVD [2]. Echocardiography, a non-invasive ultrasound imaging modality, plays a pivotal role in cardiac evaluation [3,4]. Left ventricle (LV) segmentation, the process of delineating the boundaries of the LV chamber in an echocardiographic image, is a fundamental step in quantifying various cardiac parameters including left ventricular ejection fraction (LVEF), a key indicator of cardiac pumping efficiency [3,4].Traditionally, LV segmentation is performed manually by trained cardiologists, a time-consuming and subjective process prone to inter-observer variability [5].
The limitations of manual LV segmentation have fueled the exploration of automated segmentation techniques using machine learning and, more recently, deep learning approaches [6]. Deep learning, particularly convolutional neural networks (CNNs), have demonstrated remarkable success in various medical image analysis tasks, including LV segmentation in echocardiography [7,8].
Despite the advancements in deep learning-based LV segmentation, several challenges persist. Echocardiographic images exhibit significant variability in terms of image quality, acquisition view (apical, parasternal), and patient characteristics, posing challenges for models to generalize effectively [9]. Traditional CNN architectures with limited receptive field sizes may struggle to capture long-range dependencies and contextual information crucial for accurate segmentation, especially in cases where the LV occupies a significant portion of the image [10].
The background region often dominates echocardiographic images compared to the LV area [11]. This class imbalance can lead to models prioritizing background segmentation over accurate LV delineation [12]. Real-world clinical applications necessitate fast and efficient segmentation models to enable seamless integration into clinical workflows [13].
This research aim is to investigate the potential of YOLOv8 for automatic LV segmentation in echocardiography [14,15]. We hypothesize that by leveraging YOLOv8's strengths, we can develop a model that offers the following advantages:
- Improved Accuracy: Achieve high Dice similarity coefficient (DSC) and intersection over union (IoU) metrics, indicating accurate LV delineation.
- Enhanced Generalizability: Demonstrate robust performance across diverse echocardiographic images with varying acquisition views and patient characteristics.
- Computational Efficiency: Maintain faster inference times compared to traditional CNN-based segmentation models.
After reviewing the relevant literature in Section 2, we present the technical details of our approach in Section 3. The experimental evaluation comparing our method against current state-of-the-art techniques is then described in Section 4. Finally, we discuss the implications of our results and outline promising directions for future research in Section 5.
2. Related Work
Echocardiograms, ultrasound images of the heart, have become a cornerstone of cardiovascular diagnosis and management [16]. Traditionally, analyzing these images relied on manual segmentation of anatomical structures, a time-consuming and subjective process [17]. However, the emergence of deep learning has ushered in a new era of automated segmentation, offering the potential to revolutionize how we analyze echocardiograms [18,19].
Early deep learning approaches employed pioneering architectures like U-Net, as introduced in this work , establishing a foundation for automated segmentation of various cardiac structures, including the left ventricle (LV), a crucial chamber responsible for blood pumping [20]. These models achieved promising results, but limitations existed in capturing the intricate anatomical variations present in echocardiograms [21].
Researchers continuously refined these techniques. Encoder-decoder networks were augmented with attention mechanisms, like those introduced by Woo et al. (2018) , allowing the model to focus on critical regions within the image, leading to improved segmentation accuracy for structures like the LV [22,23]. Data augmentation strategies, like random flipping and scaling employed, were implemented to increase training data variability and enhance model generalizability to unseen data [24]. Additionally, advancements in deep learning architectures, such as residual connections and dense blocks, improved training efficiency and potentially yielded better segmentation performance [25].The landscape of deep learning for echocardiogram segmentation continues to evolve [26]. With the availability of 3D echocardiography data, researchers are exploring 3D CNNs or volumetric segmentation approaches to capture the spatial relationships between structures more effectively[27]. This holds immense promise for segmenting complex structures like the LV with intricate shapes [28].
Another exciting trend involves weakly supervised learning techniques. By utilizing less laborious annotations (bounding boxes instead of pixel-wise masks), to address the challenge of acquiring large amounts of fully annotated data [29]. These methods offer the potential to reduce annotation burden while maintaining acceptable segmentation performance [30,31]. Furthermore, Generative Adversarial Networks (GANs) are being investigated for data augmentation. GANs can generate synthetic echocardiogram data that complements real data during training, potentially mitigating the limitations of limited datasets [32].
LV segmentation serves as a prime example of the advancements in this field. cascade CNN architectures [33] and multi-scale attention networks with promising results, achieving high Dice coefficients and IoU metrics [34]. These metrics quantify the overlap between the model's predictions and the ground truth, indicating the accuracy of the segmentation [35].
While deep learning offers immense potential, there are challenges to overcome. Echocardiogram image quality can vary significantly due to acquisition protocols and patient factors [36]. Deep learning models need to be robust to these variations for reliable clinical use [37]. Additionally, acquiring large amounts of high-quality, pixel-wise annotated data remains a challenge. Techniques for handling limited data and transfer learning from related tasks are crucial areas of ongoing research [38,39].
Another critical aspect is interpretability and explainability. Understanding how deep learning models arrive at segmentation results is essential for building trust in their clinical application. There are certain methods to provide insights into the rationale behind the model's predictions, fostering greater confidence in their use for clinical decision-making [40].
Finally, real-time segmentation during image acquisition would significantly improve clinical workflow efficiency [41]. This requires optimizing models for faster inference while maintaining accuracy. Additionally, seamless integration of these models into existing clinical software and workflows is crucial for practical adoption in hospitals [42]. The potential benefits of deep learning-based segmentation in clinical practice are manifold [43]. Automated segmentation can assist healthcare professionals in quantifying anatomical volumes and assessing cardiac function more efficiently and objectively [44]. This can lead to improved diagnostic accuracy for cardiovascular diseases. Furthermore, segmentation results can be used to guide minimally invasive cardiac procedures, enhancing their precision and safety [45]. Ultimately, accurate segmentation can facilitate the development of personalized treatment plans by enabling detailed analysis of a patient's specific cardiac anatomy [46].
Deep learning has revolutionized echocardiogram analysis by enabling automated segmentation of anatomical structures [36,47]. As research continues to address challenges and explore new avenues, we can expect further advancements in this field [48]. Deep learning-based segmentation holds the potential to transform echocardiogram analysis, leading to more efficient workflows, improved clinical decision-making, and ultimately, better patient outcomes [49].
3. Materials and Methods
3.1. Dataset
The dataset used in this study comprised echocardiographic images obtained from patients presenting to the emergency department across multiple metropolitan hospitals. Expert cardiologists meticulously annotated the left LV boundaries in these images to serve as ground truth labels for training and evaluating deep learning models for LV instance segmentation.
A total of 4,781 echocardiographic image cases were selected and split into three subsets: 3,877 for training, 477 for validation, and 427 reserved for testing. The partitioning into these mutually exclusive subsets was performed using a random sampling approach to ensure an unbiased distribution across training, validation, and testing data.
The images were acquired using a variety of echocardiographic modalities (2D, 3D, stress echo) and imaging planes, reflecting the diverse range of data encountered in real-world clinical settings. The dataset intentionally included cases with varying image quality, noise levels, artifacts, and other inherent challenges typical of emergency echocardiography.
For each case, expert cardiologists manually delineated the endocardial borders of the LV cavity throughout the full cardiac cycle, generating precise instance-level segmentation masks. This labor-intensive annotation process leveraged decades of specialist experience to ensure highly accurate ground truth labels.
By rigorously annotating this large, multi-institutional dataset, this study aimed to develop and validate deep learning algorithms capable of providing robust, automated LV segmentation to aid cardiovascular imaging interpretation and quantification in emergency settings.
3.2. YOLOv8’s architecture
YOLOv8 was developed by Ultralytics [50] utilizes a convolutional neural network that can be divided into two main parts: the backbone and the head as shown in Figure 1. A modified version of the Cross Stage Partial (CSP) Darknet53 [51] architecture forms the backbone of YOLOv8. This architecture consists of 53 convolutional layers and employs cross-stage partial connections to improve information flow between the different layers.
The backbone is the base convolutional neural network (CNN) that extracts features from the input image. The backbone takes the input image and produces a feature map, which is a tensor containing high-level representations of the image at different spatial locations.
The neck, also known as the Feature Pyramid Network (FPN), is responsible for combining features from different scales of the backbone's output. The purpose of the neck is to capture both high-resolution and low-resolution information from the input image, which is essential for accurate segmentation. FPN consists of a top-down pathway and a bottom-up pathway. The top-down pathway takes the high-level semantic features from the backbone and upsamples them to higher resolutions, while the bottom-up pathway takes the low-level features and combines them with the upsampled features. This fusion of features from different scales helps the model better localize objects and capture fine-grained details.
The head is the final component of the YOLO segmentation model, responsible for generating the segmentation masks. It takes the combined features from the neck and applies a series of convolutional layers to produce the final segmentation output. In the YOLO segmentation model, the head typically consists of multiple branches, each responsible for predicting the segmentation masks at a different scale. This multi-scale prediction allows the model to capture objects of varying sizes and resolutions.
Each branch in the head outputs a tensor with a specific number of channels, where each channel corresponds to a different class or object category. The values in these channels represent the confidence scores or probabilities of each pixel belonging to a particular class. We chose YOLOv8 for left ventricle segmentation due to its compelling features.
3.3. Proposed Architecture
Our proposed architecture, for instance segmentation, utilizes several modules and techniques to achieve accurate object detection and segmentation as shown in Figure 2. Among them, dilated convolution, c2f, sppf, and segment modules play crucial roles.
3.3.1. Dilated Convolution:
Dilated convolution is an advanced technique employed in convolutional neural networks (CNNs) for tasks such as image segmentation and object detection. Unlike traditional convolution operations, where the kernel weights are applied contiguously across the input, dilated convolution introduces strategically spaced gaps or holes between the kernel elements. This innovative approach enables the network to capture a broader contextual field without increasing the computational complexity or the number of learnable parameters as shown in Figure 3.
3.3.2. C2F (Class-to-Fortitude) Module:
The C2F module is responsible for enhancing the model's ability to distinguish between different object classes. It takes the class predictions (output of the classification head) and the bounding box predictions (output of the regression head) as inputs. The C2F module then applies a series of convolutions and upsampling operations to generate feature maps that are fused with the segmentation features. This fusion helps the segmentation head better differentiate between object instances of different classes, leading to improved instance segmentation performance.
3.3.3. Spatial Pyramid Pooling Fortitude Module:
The SPPF module is an extension of the Spatial Pyramid Pooling Fortitude (SPPF) technique, which has been widely used in object detection models like Faster R-CNN [52] and YOLOv5 [50]. The SPPF module is designed to capture multi-scale features by applying parallel pooling operations at different kernel sizes and strides. This allows the model to effectively handle objects of varying scales and sizes within an image.
In the context of instance segmentation, the SPPF module takes the feature maps from the backbone network and applies parallel pooling operations at different scales. The resulting feature maps are then concatenated and passed through a series of convolutions to generate enhanced feature representations. These multi-scale features are then fused with the segmentation features, aiding the model in detecting and segmenting objects at various scales.
3.3.4. Segmentation Module
Segmentation module is responsible for generating instance segmentation masks from the enhanced feature maps produced by the C2F and SPPF modules. It consists of a set of parallel convolutional layers that generate a fixed number of prototype masks (typically 32 or 64). These prototype masks are then combined with the bounding box predictions and segmentation predictions to produce instance-specific segmentation masks. The key idea behind this module is to learn a set of mask representations during training. During inference, these are adaptively combined and scaled based on the predicted bounding boxes and classes to generate final instance segmentation masks. This approach allows the model to generate high-quality segmentation masks without the need for explicit pixel-wise labeling of instances during training, which can be time-consuming and laborious.
The Darknet Bottleneck module is a key component of the backbone network used in YOLOv8. It is inspired by the Darknet-53 architecture, which was initially introduced in the YOLOv3 object detection model. This module is designed to balance the trade-off between computational efficiency and representational capacity, allowing for efficient feature extraction while preserving important spatial and semantic information. Darknet Bottleneck module consists of the following components:
- Convolutional Layer: The input feature maps are first processed by a convolutional layer with a 1x1 kernel size. This layer serves as a dimensionality reduction step, reducing the number of channels in the feature maps. This operation is computationally efficient and helps reduce the overall computational complexity of the network.
- Batch Normalization and Activation: After the convolutional layer, batch normalization is applied to stabilize the training process and improve convergence. This is followed by an activation function, typically the leaky Rectified Linear Unit ReLU), which introduces non-linearity into the feature representations.
- Convolutional Layer with Bottleneck: The next step involves a convolutional layer with a 3×3 kernel size, which is the main feature extraction component of the module. However, instead of using the full number of channels, a bottleneck approach is employed. The number of channels in this layer is typically set to a lower value (e.g., one-quarter or one-half of the input channels) to reduce computational complexity while still capturing important spatial and semantic information.
The Darknet Bottleneck module is repeated multiple times within the backbone network, with the number of repetitions determined by the specific architecture (e.g., Darknet-53 in YOLOv8). This modular design allows for efficient feature extraction while maintaining a balance between computational complexity and representational capacity.
By incorporating the Darknet Bottleneck module into the YOLOv8 backbone network, the model can efficiently extract rich feature representations from the input images, which are then used by the subsequent modules for accurate instance segmentation.
For medical image segmentation tasks, a combination of Robust TLoss [53] (Truncated L1 Loss) and Dice Loss[54] can be used as the loss function. This combined loss function aims to leverage the strengths of both loss functions: Robust TLoss for handling outliers and Dice Loss for optimizing the overlap between the predicted and ground truth segmentation masks.
Equation (1) for the combined loss function can be written as:
where:
- `X` is the ground truth segmentation mask
- `Y` is the predicted segmentation mask
- `Robust TLoss(X, Y)` is the Robust Truncated L1 Loss between the ground truth and predicted masks
- `Dice Loss(X, Y)` is the Dice Loss between the ground truth and predicted masks
- `α` and `β` are weights that control the relative importance of the two loss terms
The Robust TLoss term is calculated using Equation (2):
This term helps to handle outliers and large errors in the segmentation masks, while still being differentiable for small errors.
The Dice Loss term is calculated using Equation (3):
where `ε` is a small constant value (e.g., 1e-5) added for numerical stability.
By combining these two loss terms, the overall loss function aims to achieve a balance between handling outliers and optimizing the overlap between the predicted and ground truth segmentation masks. The weights `α` and `β` are tuned based on the LV segmentation task and the characteristics of the dataset.
This combined loss function has been used in various medical image segmentation applications, such as tumor segmentation, organ segmentation, and lesion detection, and has shown improved performance compared to using either loss function alone.
YOLOv8's ability to perform detections in real-time is crucial for potential clinical applications where fast segmentation results are essential for diagnosis and treatment decisions. YOLO is a well-known architecture with a large user base. This provides access to readily available implementation resources and facilitates troubleshooting if needed. YOLOv8 offers multiple versions catering to different needs. This allows for choosing a configuration that balances accuracy and resource requirements for deployment in clinical settings.
3.4. Evaluation Metric
3.4.1. Intersection over Union (IoU)
Intersection over Union (IoU) is a classical metric for evaluating the performance of the model for object detection. It calculates the ratio of the overlap and union between the predicted bounding box and the ground truth bounding box, which measures the intersection of these two bounding boxes. The IoU is represented by the following Equation (4):
where A represents the predicted area of the mask, and B represents the ground truth containing the object. The performance of the model improves as the IoU value increases, with higher IoU values indicating less difference between the generated candidate and ground truth bounding boxes.
3.4.2. Mean Average Precision (mAP)
Mean Average Precision (mAP) considers both precision (correctly identified objects) and recall (detecting all true positives) across different IoU thresholds. It provides a comprehensive overview of the model's detection performance. The mAP@50 metric specifically refers to the mAP calculated using an IoU threshold of 0.5. In simpler terms, it represents the average precision of detections where the predicted bounding box or segmentation mask overlaps with the ground truth by at least 50%. This is a commonly used threshold for evaluating object detection models. The mAP@0.5:0.95 metric represents the mean average precision across a range of IoU thresholds, typically from 0.5 to 0.95 with increments of 0.05. It provides a more in-depth analysis of the model's performance under varying degrees of overlap between predictions and ground truth. A higher average mAP across this range suggests the model performs well even with less perfect overlaps.
3.4.3. Precision-recall Curve
Precision-Recall Curve (P-R Curve) is a curve with recall as the x-axis and precision as the y-axis. Each point represents a different threshold value, and all points are connected as a curve. The recall I and precision (P) are calculated according to the following Equations (5) & (6):
where True Positive (TP) denotes the prediction result as a positive class and is judged to be true; False Positive (FP) denotes the prediction result as a positive class but is judged to be false, and False Negative (FN) denotes the prediction result as a negative class but is judged to be false.
4. Results and Discussions
In this study, the training and testing for the network were conducted on a workstation with an Intel Core i7-11700K @3.6GHZ, NVIDIA GeForce RTX 4090 24G GPU, Windows 11 operating system. A pre-trained YOLOv8 model is used in the training process from MS COCO (Microsoft Common Objects in Context) val2017.
Table 1 compares five YOLOv8 models (likely denoted by si–e - n, s, m, l,–x - signifying increasing complexity) across various metrics. These models are evaluated on their ability to identify the LV in medical images. Precision and Recall measure the mo’el's effectiveness in correctly classifying pixels, while mAP50 and mAP50-95 assess overall detection accuracy with varying strictness (Intersection over Union thresholds).
A crucial aspect of the table is the inclusion of model complexity parameters. The number of trainable parameters (millions) and FLOPs (floating-point operations) required per image indicate the mo’el's computational burden. Generally, larger models with more parameters (l, x) tend to achieve higher mAP scores, signifying better segmentation accuracy. However, this comes at the cost of increased computational demand reflected in higher FLOPs.
Table 1 also explores the impact of input image size. By comparing models trained on different resolutions (416, 640, 1280 pixels), we can observe that for some models, increasing the resolution can lead to marginal improvements in segmentation accuracy. This is likely because higher resolution images provide more detailed information about the LV structure.
The key takeaway from this analysIs is Ihe interplay between model complexity and computational efficiency. While larger models consistently outperform smaller ones in terms of mAP scores, this comes at a significant cost. Their increased number of parameters translates to higher computational demands, making them less suitable for real-time applications or deployment on devices with limited resources.
For instance, YOLOv8x-seg achieves the highest mAP scores across all resolutions but requires over 71 million parameters and 344 billion FLOPs per image. Conversely, YOLOv8n-seg, with only 3.4 million parameters and 12.6 billion FLOPs, offers a faster and more resource-friendly solution, albeit with a slight decrease in segmentation accuracy. If prioritizing the highest segmentation accuracy is paramount, a larger model (l or x) might be preferable despite its computational demands. This scenario could be relevant in research settings where precise LV measurements are critical.
However, for real-time applications or deployment on mobile devices, computational efficiency becomes a major concern. In such cases, a smaller model (n or s) might be a more suitable choice. While sacrificing some accuracy, these models offer faster processing speeds and lower memory requirements, making them ideal for resource-constrained environments.
Beyond the metrics presented in Table 1, several other factors influence model selection. The available computational resources and memory constraints of the deployment environment play a crucial role. Additionally, the quality and quantity of training data can significantly impact model performance. Following the training, confusion matrix was generated by analyzing the results matrix as shown in Figure 4. Based on the confusion matrix, the classification model appears to be performing reasonably well for the positive class, but there is one instance misclassified as a false positive and one instance misclassified as a false negative. Henceforth, while the model seems to be doing a decent job, especially for the majority LV class, there are a few misclassified instances for both classes that could potentially be improved upon by further tuning or adjusting the ’odel's parameters or features.
In Table 2, accuracy and precision are of paramount importance, the pursuit of enhanced performance is a constant endeavor. Table 2 presents a comprehensive ablation of four models: Yolov8, RobustTLoss, DiceLoss, and a proposed model, each vying for superiority across the metrics of precision, recall, mAP50, and mAP50-95.
The Yolov8 model serves as the baseline, with respectable scores of 0.93532 for precision, 0.94171 for recall, 0.95777 for mAP50, and 0.62485 for mAP50-95. However, the introduction of RobustTLoss and DiceLoss functions demonstrates the potential for improvement. RobustTLoss model outperforms the baseline across all metrics, boasting a precision of 0.95284, recall of 0.95581, mAP50 of 0.96487, and mAP50-95 of 0.61742. Similarly, DiceLoss model exhibits superior precision (0.94971) and mAP50 (0.96788) compared to baseline, although its recall (0.93488) and mAP50-95 (0.60437) trail slightly behind. While both the RobustTLoss and DiceLoss models demonstrate their prowess, the true standout is the proposed model. With a remarkable precision of 0.98359, recall of 0.97561, mAP50 of 0.98724, and a staggering mAP50-95 of 0.75876, this model sets a new benchmark for object detection performance. Its ability to strike an exquisite balance between precision and recall, coupled with its exceptional mAP50 and mAP50-95 scores, is a testament to the innovative techniques employed in its development.
The proposed model's superiority is particularly evident in the mAP50-95 metric, which evaluates the model's performance across various intersections over union (IoU) thresholds. Its score of 0.75876 is a significant improvement over the baseline and the other models, indicating robust and consistent object detection capabilities across a wide range of scenarios. In Figure 6, mAP50 (mean Average Precision at IoU=0.5) metric evaluates how well the model's predicted segmentation masks overlap with the ground truth masks, considering an intersection over union (IoU) threshold of 0.5. mAP50-95 assesses this overlap across a range of IoU thresholds from 0.5 to 0.95, providing a more comprehensive evaluation of segmentation quality. In this context, the consistent and high performance of the (B) model across precision, recall, mAP50, and mAP50-95 suggests that it is a reliable and accurate approach for left ventricle segmentation. However, the (M) model, while competitive in some metrics like precision and mAP50, exhibits more variability and lower performance in recall and mAP50-95, indicating potential challenges in capturing all relevant left ventricle regions or handling different IoU thresholds.
In Figure 7, it can be evidently seen that the proposed model has outperformed on different kinds of shapes and contours for left ventricle segmentation. Accurate and robust left ventricular segmentation from echo images is crucial for various clinical applications, such as assessing cardiac function, monitoring disease progression, and guiding treatment decisions. Continued refinement and validation of automated segmentation algorithms are essential to ensure reliable and clinically meaningful results.
5. Conclusion
Accurate and reliable left ventricle segmentation from echocardiogram images is a crucial task in cardiovascular imaging and diagnosis. The study demonstrates the potential of automated segmentation models to capture the overall shape and location of the left ventricular cavity with highest mAP50 of 98.31% and map50:95 of 75.27%. However, some instances of misalignment or inaccuracies highlight the need for further refinement and validation of these algorithms.
Precise delineation of the left ventricular boundaries is essential for quantitative assessments, such as measuring volumes, ejection fraction, and regional wall motion abnormalities. These measurements play a vital role in diagnosing and monitoring various cardiovascular conditions, including heart failure, valvular diseases, and myocardial infarctions.
To advance the field of left ventricle echocardiogram segmentation, several areas of future work can be explored:
- Larger and more diverse datasets: Training segmentation models on larger and more diverse datasets, encompassing various pathologies, imaging modalities, and acquisition protocols, can enhance their generalization capabilities and robustness.
- Incorporation of temporal information: Echocardiograms capture dynamic cardiac cycles. Leveraging temporal information by integrating recurrent neural networks or temporal modeling techniques could improve segmentation accuracy and consistency across frames.
- Uncertainty quantification: Developing methods to quantify the uncertainty or confidence of segmentation predictions can provide valuable insights for clinicians and aid in decision-making processes.
By addressing these challenges and opportunities, the field of left ventricle echocardiogram segmentation can advance towards more accurate, reliable, and clinically applicable solutions, ultimately improving cardiovascular care and patient outcomes.
Contribution:
M.B. contributed to the development of the segmentation algorithm and the implementation of the deep learning model. C.W.S. assisted in the data preprocessing and augmentation techniques for the echocardiogram images. M.Y.S. played a role in the evaluation of the segmentation results and the calculation of performance metrics. E.P.C.H. provided guidance and expertise in the field of cardiovascular imaging and interpretation of echocardiograms. M.F.A. contributed to the study design and the clinical validation of the segmentation results. J.S.S. supervised the overall research project, provided valuable insights, and helped in the analysis of the results.
Institutional Review Board:
The approval was granted under reference number 110-069-E.
Funding
This research received no external funding.
Data Availability Statement
The data presented in this study are available on request from the corresponding author.
Conflicts of Interest
The authors declare no conflicts of interest.
References
- Gaziano, T.A. , Cardiovascular diseases worldwide. Public Health Approach Cardiovasc. Dis. Prev. Manag, 2022. 1: p. 8-18.
- Lloyd-Jones, D.M.; Braun, L.T.; Ndumele, C.E.; Smith, S.C.; Sperling, L.S.; Virani, S.S.; Blumenthal, R.S. Use of Risk Assessment Tools to Guide Decision-Making in the Primary Prevention of Atherosclerotic Cardiovascular Disease: A Special Report From the American Heart Association and American College of Cardiology. Circulation 2019, 139, E1162–E1177. [Google Scholar] [CrossRef] [PubMed]
- Chen, R.; Zhu, M.; Sahn, D.J.; Ashraf, M. Non-Invasive Evaluation of Heart Function with Four-Dimensional Echocardiography. PLOS ONE 2016, 11, e0154996–e0154996. [Google Scholar] [CrossRef] [PubMed]
- Cacciapuoti, F. The role of echocardiography in the non-invasive diagnosis of cardiac amyloidosis. J. Echocardiogr. 2015, 13, 84–89. [Google Scholar] [CrossRef] [PubMed]
- Karim, R.; Bhagirath, P.; Claus, P.; Housden, R.J.; Chen, Z.; Karimaghaloo, Z.; Sohn, H.-M.; Rodríguez, L.L.; Vera, S.; Albà, X.; et al. Evaluation of state-of-the-art segmentation algorithms for left ventricle infarct from late Gadolinium enhancement MR images. Med Image Anal. 2016, 30, 95–107. [Google Scholar] [CrossRef] [PubMed]
- Slomka, P.J.; Dey, D.; Sitek, A.; Motwani, M.; Berman, D.S.; Germano, G. Cardiac imaging: working towards fully-automated machine analysis & interpretation. Expert Rev. Med Devices 2017, 14, 197–212. [Google Scholar] [CrossRef] [PubMed]
- Kim, T.; Hedayat, M.; Vaitkus, V.V.; Belohlavek, M.; Krishnamurthy, V.; Borazjani, I. Automatic segmentation of the left ventricle in echocardiographic images using convolutional neural networks. Quant. Imaging Med. Surg. 2021, 11, 1763–1781. [Google Scholar] [CrossRef]
- Wong, K.K.L.; Fortino, G.; Abbott, D. Deep learning-based cardiovascular image diagnosis: A promising challenge. Futur. Gener. Comput. Syst. 2020, 110, 802–811. [Google Scholar] [CrossRef]
- Zolgharni, M. , Automated assessment of echocardiographic image quality using deep convolutional neural networks. 2022, The University of West London.
- Luo, X.; Zhang, H.; Huang, X.; Gong, H.; Zhang, J. DBNet-SI: Dual branch network of shift window attention and inception structure for skin lesion segmentation. Comput. Biol. Med. 2024, 170, 108090. [Google Scholar] [CrossRef]
- Palmieri, V.; Dahlöf, B.; DeQuattro, V.; Sharpe, N.; Bella, J.N.; de Simone, G.; Paranicas, M.; Fishman, D.; Devereux, R.B. Reliability of echocardiographic assessment of left ventricular structure and function: The PRESERVE study. J. Am. Coll. Cardiol. 1999, 34, 1625–1632. [Google Scholar] [CrossRef]
- Jin, X.; Thomas, M.A.; Dise, J.; Kavanaugh, J.; Hilliard, J.; Zoberi, I.; Robinson, C.G.; Hugo, G.D. Robustness of deep learning segmentation of cardiac substructures in noncontrast computed tomography for breast cancer radiotherapy. Med Phys. 2021, 48, 7172–7188. [Google Scholar] [CrossRef]
- Chaudhari, A.S.; Sandino, C.M.; Cole, E.K.; Larson, D.B.; Gold, G.E.; Vasanawala, S.S.; Lungren, M.P.; Hargreaves, B.A.; Langlotz, C.P. Prospective Deployment of Deep Learning in MRI: A Framework for Important Considerations, Challenges, and Recommendations for Best Practices. J. Magn. Reson. Imaging 2021, 54, 357–371. [Google Scholar] [CrossRef] [PubMed]
- He, J.; Yang, L.; Liang, B.; Li, S.; Xu, C. Fetal cardiac ultrasound standard section detection model based on multitask learning and mixed attention mechanism. Neurocomputing 2024. [Google Scholar] [CrossRef]
- Ragab, M.G.; Abdulkadir, S.J.; Muneer, A.; Alqushaibi, A.; Sumiea, E.H.; Qureshi, R.; Al-Selwi, S.M.; Alhussian, H. A Comprehensive Systematic Review of YOLO for Medical Object Detection (2018 to 2023). IEEE Access 2024, 12, 57815–57836. [Google Scholar] [CrossRef]
- Kimura, B.J. Point-of-care cardiac ultrasound techniques in the physical examination: better at the bedside. Heart 2017, 103, 987–994. [Google Scholar] [CrossRef] [PubMed]
- González-Villà, S.; Oliver, A.; Valverde, S.; Wang, L.; Zwiggelaar, R.; Lladó, X. A review on brain structures segmentation in magnetic resonance imaging. Artif. Intell. Med. 2016, 73, 45–69. [Google Scholar] [CrossRef]
- Gopalan, D. and J.S.R. Gibbs, From Early Morphometrics to Machine Learning—What Future for Cardiovascular Imaging of the Pulmonary Circulation? Diagnostics, 2020. 10(12): p. 1004.
- Lang, R.M.; Addetia, K.; Narang, A.; Mor-Avi, V. 3-Dimensional Echocardiography Latest Developments and Future Directions. JACC: Cardiovasc. Imaging 2018, 11, 1854–1878. [Google Scholar] [CrossRef] [PubMed]
- Jaffré, C.M.E. , Deep learning-based segmentation of the aorta from dynamic 2D magnetic resonance images. 2022.
- Roelandt, N.C. Nanda, L. Sugeng, Q.L. CAO, J. Azevedo, S.L. Schwartz, M.A. Vannan, A. Ludomirski, and G. Marx, Dynamic three-dimensional echocardiography: Methods and clinical potential. Echocardiography, 1994. 11(3): p. 237-259.
- Minaee, S., Y. Boykov, F. Porikli, A. Plaza, N. Kehtarnavaz, and D. Terzopoulos, Image segmentation using deep learning: A survey. IEEE transactions on pattern analysis and machine intelligence, 2021. 44(7): p. 3523-3542.
- Li, X.; Li, M.; Yan, P.; Li, G.; Jiang, Y.; Luo, H.; Yin, S. Deep Learning Attention Mechanism in Medical Image Analysis: Basics and Beyonds. Int. J. Netw. Dyn. Intell. 2023, 93–116. [Google Scholar] [CrossRef]
- Oza, P.; Sharma, P.; Patel, S.; Adedoyin, F.; Bruno, A. Image Augmentation Techniques for Mammogram Analysis. J. Imaging 2022, 8, 141. [Google Scholar] [CrossRef]
- Yuan, X.; Shi, J.; Gu, L. A review of deep learning methods for semantic segmentation of remote sensing imagery. Expert Syst. Appl. 2021, 169, 114417. [Google Scholar] [CrossRef]
- Gandhi, S.; Mosleh, W.; Shen, J.; Chow, C.-M. Automation, machine learning, and artificial intelligence in echocardiography: A brave new world. Echocardiography 2018, 35, 1402–1418. [Google Scholar] [CrossRef] [PubMed]
- Chen, C.; Qin, C.; Qiu, H.; Tarroni, G.; Duan, J.; Bai, W.; Rueckert, D. Deep Learning for Cardiac Image Segmentation: A Review. Front. Cardiovasc. Med. 2020, 7, 25. [Google Scholar] [CrossRef] [PubMed]
- Suri, J.; Liu, K.; Singh, S.; Laxminarayan, S.; Zeng, X.; Reden, L. Shape recovery algorithms using level sets in 2-D/3-D medical imagery: a state-of-the-art review. IEEE Trans. Inf. Technol. Biomed. 2002, 6, 8–28. [Google Scholar] [CrossRef] [PubMed]
- Tajbakhsh, N.; Jeyaseelan, L.; Li, Q.; Chiang, J.N.; Wu, Z.; Ding, X. Embracing imperfect datasets: A review of deep learning solutions for medical image segmentation. Med Image Anal. 2020, 63, 101693. [Google Scholar] [CrossRef] [PubMed]
- Yang, L., Y. Zhang, J. Chen, S. Zhang, and D.Z. Chen. Suggestive annotation: A deep active learning framework for biomedical image segmentation. in Medical Image Computing and Computer Assisted Intervention− MICCAI 2017: 20th International Conference, Quebec City, QC, Canada, -13, 2017, Proceedings, Part III 20. 2017. Springer. 11 September.
- Greenwald, N.F.; Miller, G.; Moen, E.; Kong, A.; Kagel, A.; Dougherty, T.; Fullaway, C.C.; McIntosh, B.J.; Leow, K.X.; Schwartz, M.S.; et al. Whole-cell segmentation of tissue images with human-level performance using large-scale data annotation and deep learning. Nat. Biotechnol. 2022, 40, 555–565. [Google Scholar] [CrossRef]
- Kulik, D. , Synthetic Ultrasound Video Generation with Generative Adversarial Networks. 2023, Carleton University.
- Xiong, Z.; Xia, Q.; Hu, Z.; Huang, N.; Bian, C.; Zheng, Y.; Vesal, S.; Ravikumar, N.; Maier, A.; Yang, X.; et al. A global benchmark of algorithms for segmenting the left atrium from late gadolinium-enhanced cardiac magnetic resonance imaging. Med Image Anal. 2020, 67, 101832. [Google Scholar] [CrossRef]
- Ullah, Z.; Usman, M.; Jeon, M.; Gwak, J. Cascade multiscale residual attention CNNs with adaptive ROI for automatic brain tumor segmentation. Inf. Sci. 2022, 608, 1541–1556. [Google Scholar] [CrossRef]
- Valindria, V.V.; Lavdas, I.; Bai, W.; Kamnitsas, K.; Aboagye, E.O.; Rockall, A.G.; Rueckert, D.; Glocker, B. Reverse Classification Accuracy: Predicting Segmentation Performance in the Absence of Ground Truth. IEEE Trans. Med Imaging 2017, 36, 1597–1606. [Google Scholar] [CrossRef] [PubMed]
- Song, Y.; Ren, S.; Lu, Y.; Fu, X.; Wong, K.K.L. Deep learning-based automatic segmentation of images in cardiac radiography: A promising challenge. Comput. Methods Programs Biomed. 2022, 220, 106821. [Google Scholar] [CrossRef]
- Petersen, E., A. Feragen, M.L. da Costa Zemsch, A. Henriksen, O.E. Wiese Christensen, M. Ganz, and A.s.D.N. Initiative. Feature robustness and sex differences in medical imaging: a case study in MRI-based Alzheimer’s disease detection. in International Conference on Medical Image Computing and Computer-Assisted Intervention. 2022. Springer.
- Niu, S.; Liu, Y.; Wang, J.; Song, H. A Decade Survey of Transfer Learning (2010–2020). IEEE Trans. Artif. Intell. 2020, 1, 151–166. [Google Scholar] [CrossRef]
- Zhu, Z., K. Lin, A.K. Jain, and J. Zhou, Transfer learning in deep reinforcement learning: A survey. IEEE Transactions on Pattern Analysis and Machine Intelligence, 2023.
- Zhang, Y.; Liao, Q.V.; Bellamy, R.K.E. Effect of confidence and explanation on accuracy and trust calibration in AI-assisted decision making. FAT* '20: Conference on Fairness, Accountability, and Transparency. LOCATION OF CONFERENCE, SpainDATE OF CONFERENCE;
- Dergachyova, O.; Bouget, D.; Huaulmé, A.; Morandi, X.; Jannin, P. Automatic data-driven real-time segmentation and recognition of surgical workflow. Int. J. Comput. Assist. Radiol. Surg. 2016, 11, 1081–1089. [Google Scholar] [CrossRef]
- Jacob, C.; Sanchez-Vazquez, A.; Ivory, C. Factors Impacting Clinicians’ Adoption of a Clinical Photo Documentation App and its Implications for Clinical Workflows and Quality of Care: Qualitative Case Study. JMIR mHealth uHealth 2020, 8, e20203. [Google Scholar] [CrossRef] [PubMed]
- Xu, P. and H. Liu. Simultaneous reconstruction and segmentation of MRI image by manifold learning. in 2019 IEEE Nuclear Science Symposium and Medical Imaging Conference (NSS/MIC). 2019. IEEE.
- Peng, P.; Lekadir, K.; Gooya, A.; Shao, L.; Petersen, S.E.; Frangi, A.F. A review of heart chamber segmentation for structural and functional analysis using cardiac magnetic resonance imaging. Magn. Reson. Mater. Physics, Biol. Med. 2016, 29, 155–195. [Google Scholar] [CrossRef]
- Lin, A.; Kolossváry, M.; Išgum, I.; Maurovich-Horvat, P.; Slomka, P.J.; Dey, D. Artificial intelligence: improving the efficiency of cardiovascular imaging. Expert Rev. Med Devices 2020, 17, 565–577. [Google Scholar] [CrossRef] [PubMed]
- Peirlinck, M., F. S. Costabal, J. Yao, J. Guccione, S. Tripathy, Y. Wang, D. Ozturk, P. Segars, T. Morrison, and S. Levine, Precision medicine in human heart modeling: Perspectives, challenges, and opportunities. Biomechanics and modeling in mechanobiology, 2021. 20: p. 803-831.
- Madani, A.; Ong, J.R.; Tibrewal, A.; Mofrad, M.R.K. Deep echocardiography: data-efficient supervised and semi-supervised deep learning towards automated diagnosis of cardiac disease. npj Digit. Med. 2018, 1, 1–11. [Google Scholar] [CrossRef] [PubMed]
- Brown, M.E.; Mitchell, M.S. Ethical and Unethical Leadership: Exploring New Avenues for Future Research. Bus. Ethic- Q. 2010, 20, 583–616. [Google Scholar] [CrossRef]
- de Siqueira, V.S.; Borges, M.M.; Furtado, R.G.; Dourado, C.N.; da Costa, R.M. Artificial intelligence applied to support medical decisions for the automatic analysis of echocardiogram images: A systematic review. Artif. Intell. Med. 2021, 120, 102165. [Google Scholar] [CrossRef]
- Ultralytics. YOLOv8 – Ultralytics—Revolutionizing the World of Vision AI (n.d.). 22 Apr 2024]; Available from: https://www.ultralytics.com/yolo.
- Wang, C.-Y., H.-Y.M. Liao, Y.-H. Wu, P.-Y. Chen, J.-W. Hsieh, and I.-H. Yeh. CSPNet: A new backbone that can enhance learning capability of CNN. in Proceedings of the IEEE/CVF conference on computer vision and pattern recognition workshops. 2020.
- Girshick, R. Fast r-cnn. in Proceedings of the IEEE international conference on computer vision. 2015.
- Gonzalez-Jimenez, A., S. Lionetti, P. Gottfrois, F. Gröger, M. Pouly, and A.A. Navarini. Robust t-loss for medical image segmentation. in International Conference on Medical Image Computing and Computer-Assisted Intervention. 2023. Springer.
- Milletari, F.; Navab, N.; Ahmadi, S.-A. V-net: Fully convolutional neural networks for volumetric medical image segmentation. In Proceedings of the 2016 Fourth International Conference on 3D Vision (3DV), Stanford, CA, USA, 25–28 October 2016; pp. 565–571. [Google Scholar]
Figure 1.
Architecture of YOLOv8.
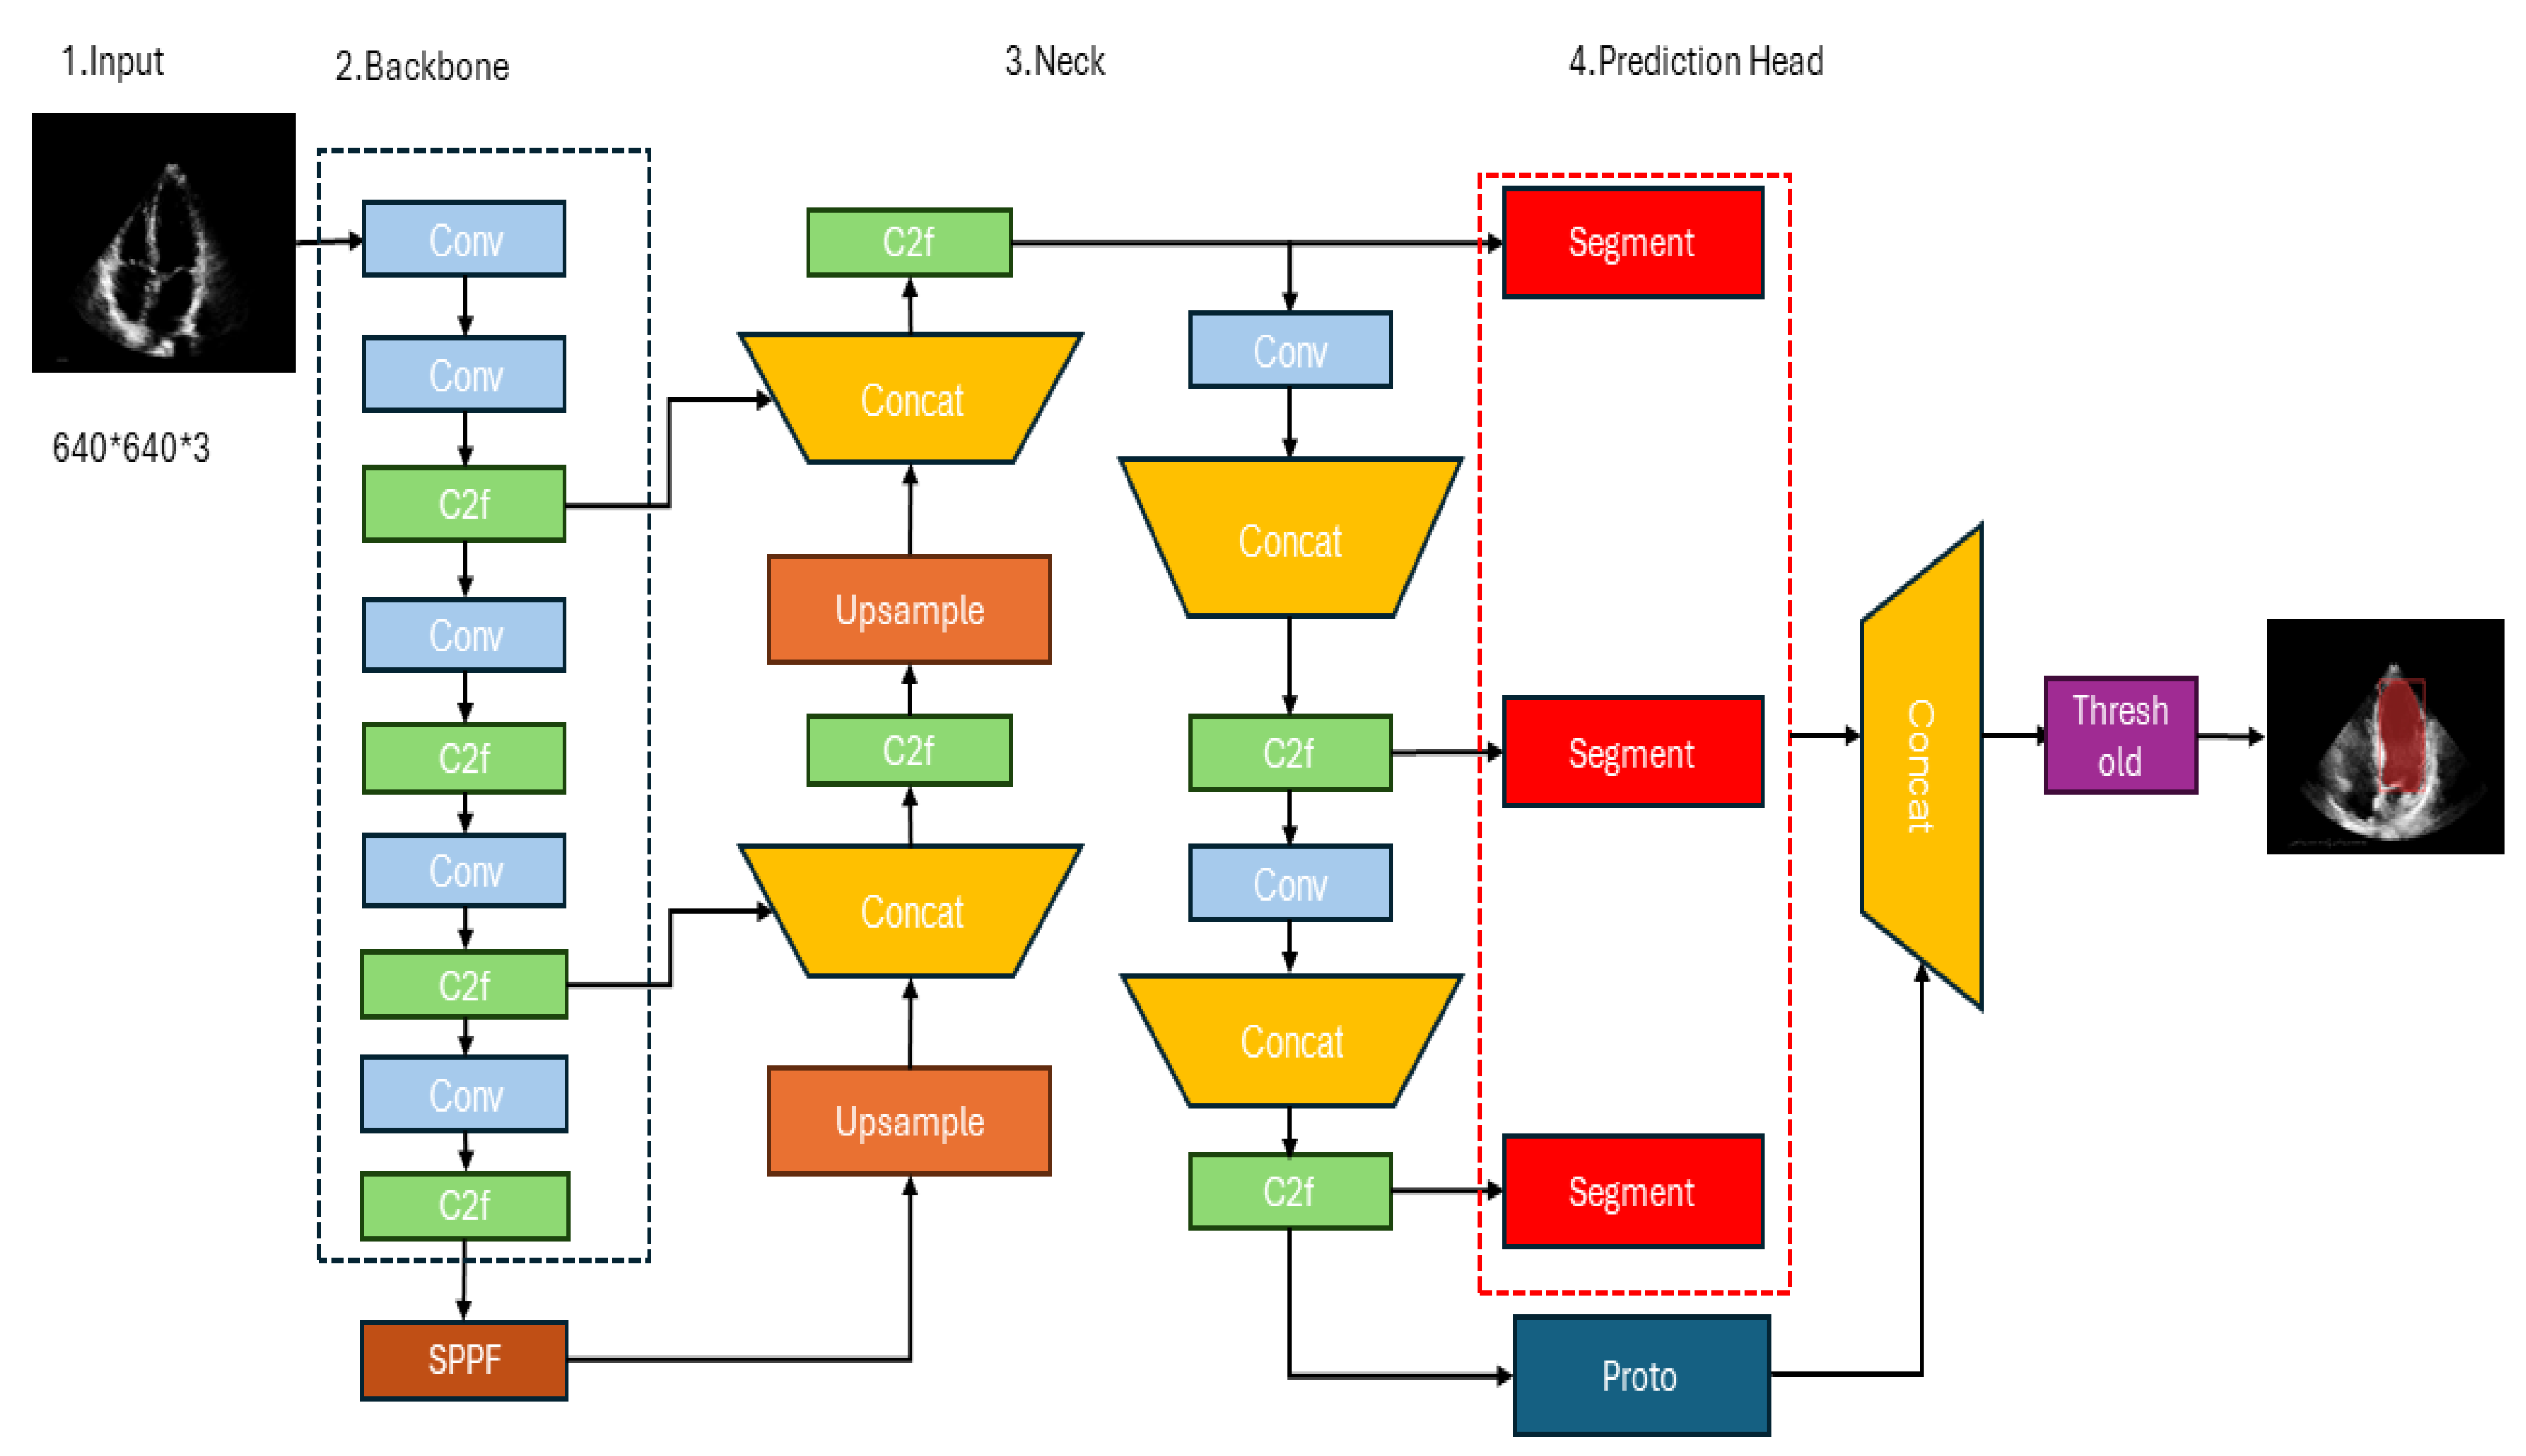
Figure 2.
Improved Architecture of YOLOv8 for left ventricle segmentation.
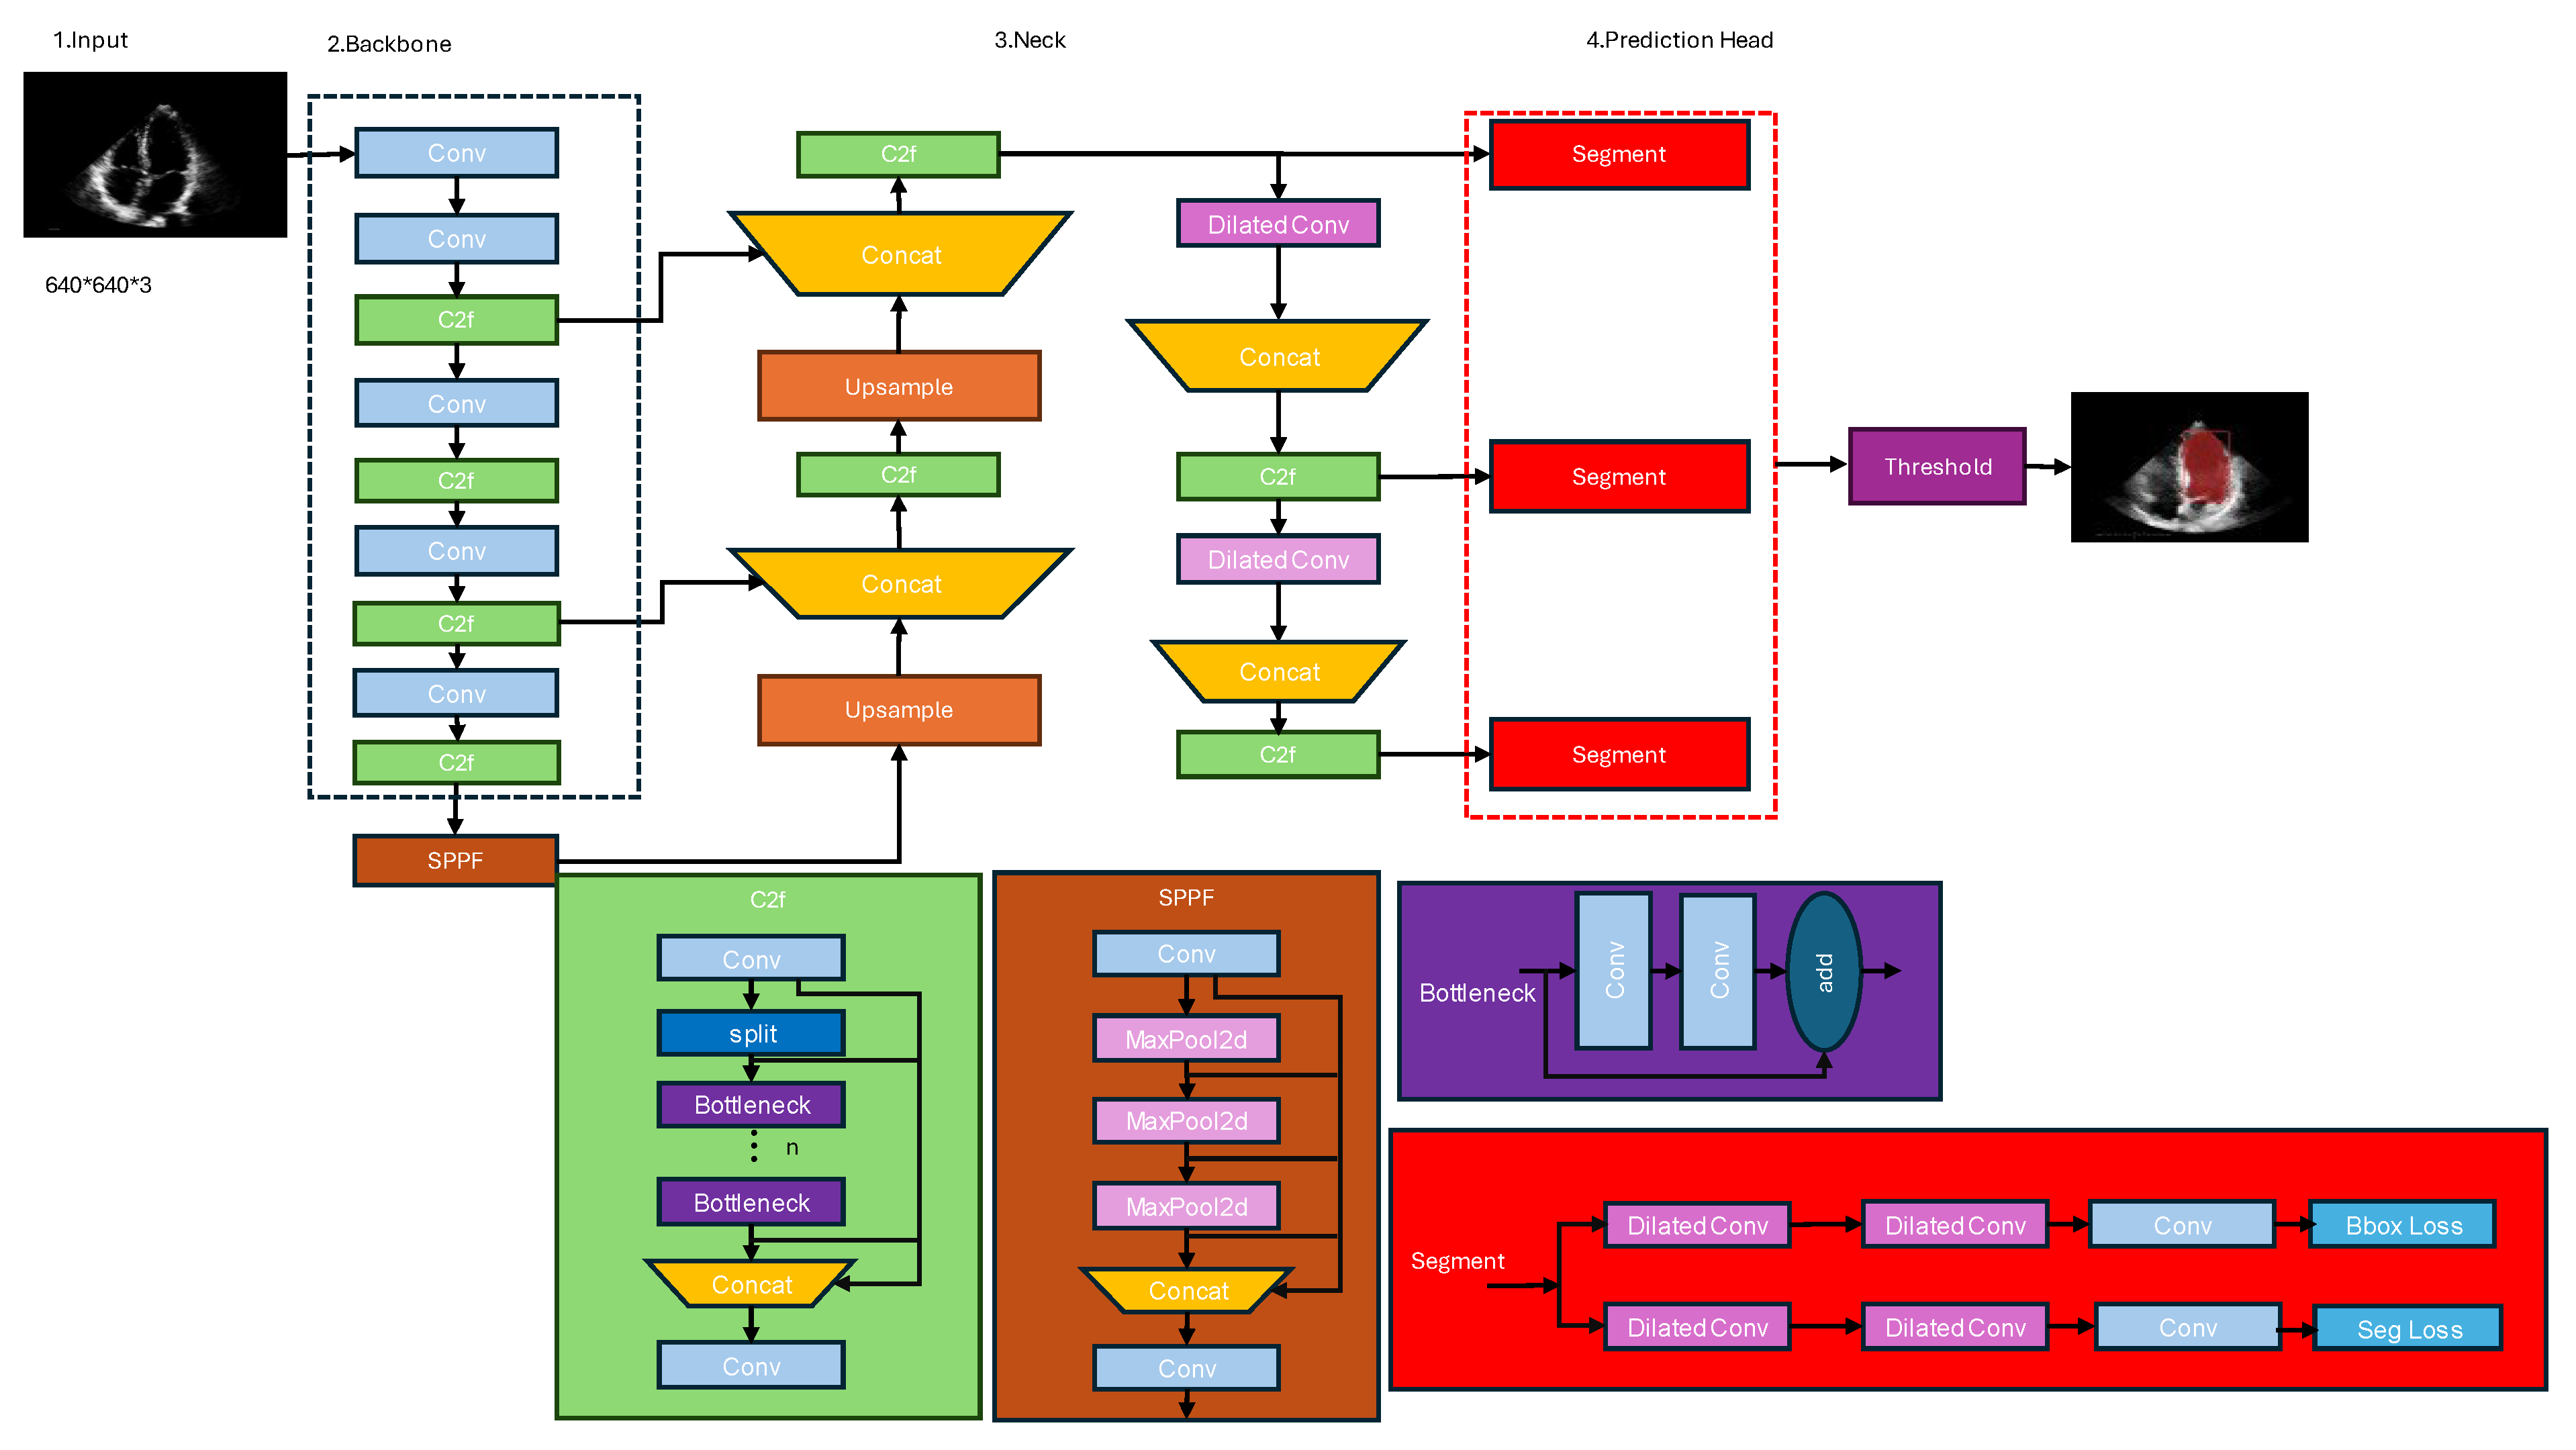
Figure 3.
Different dilation rates in dilated convolutions, using a 3x3 kernel size.
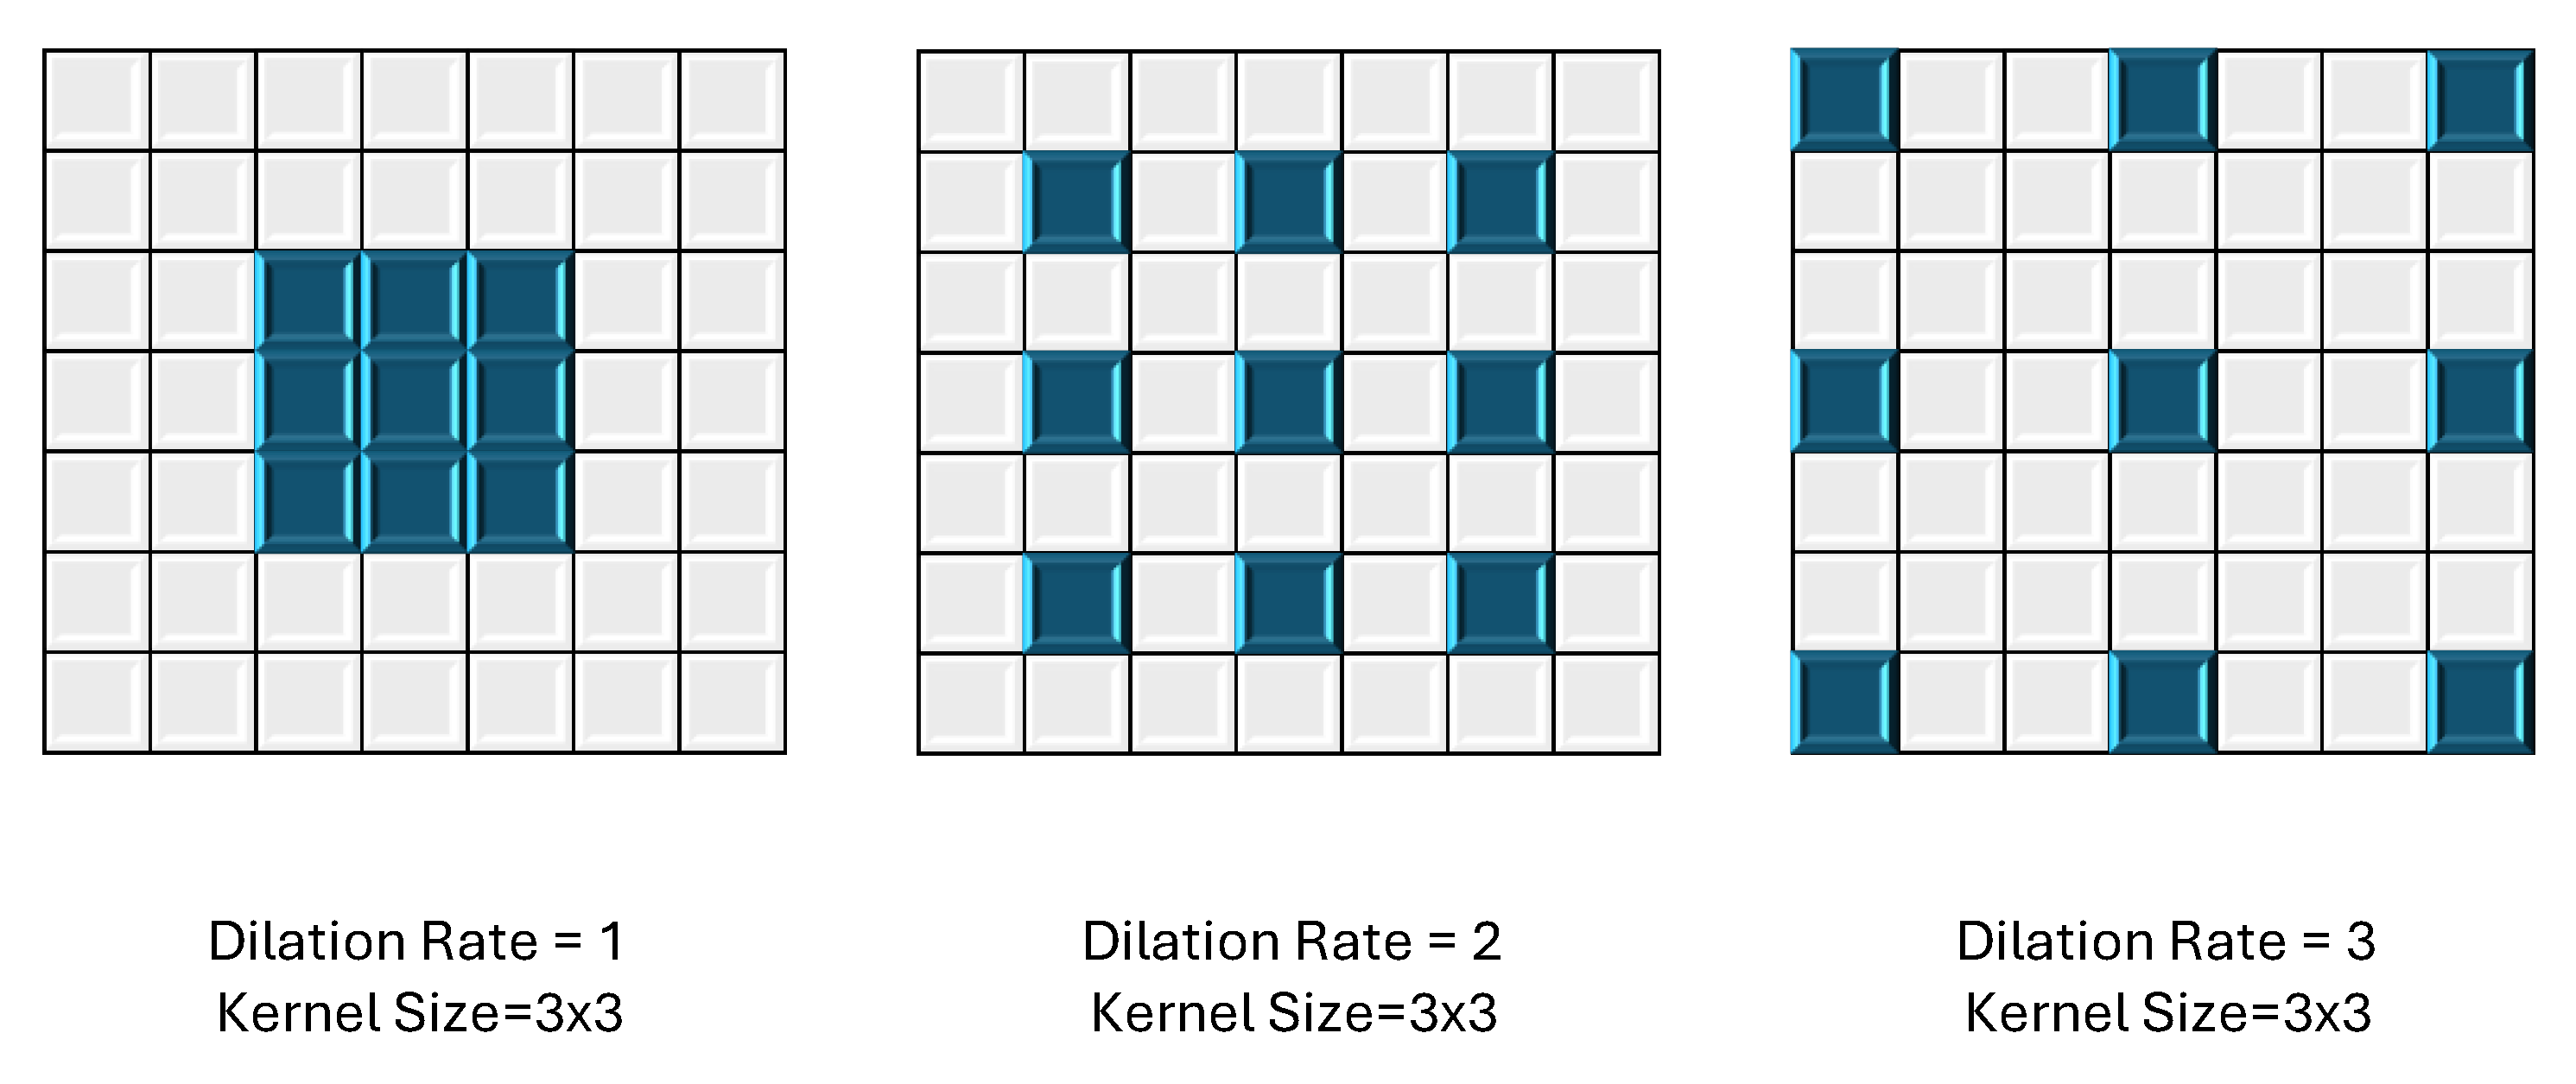
Figure 4.
Confusion matrix.
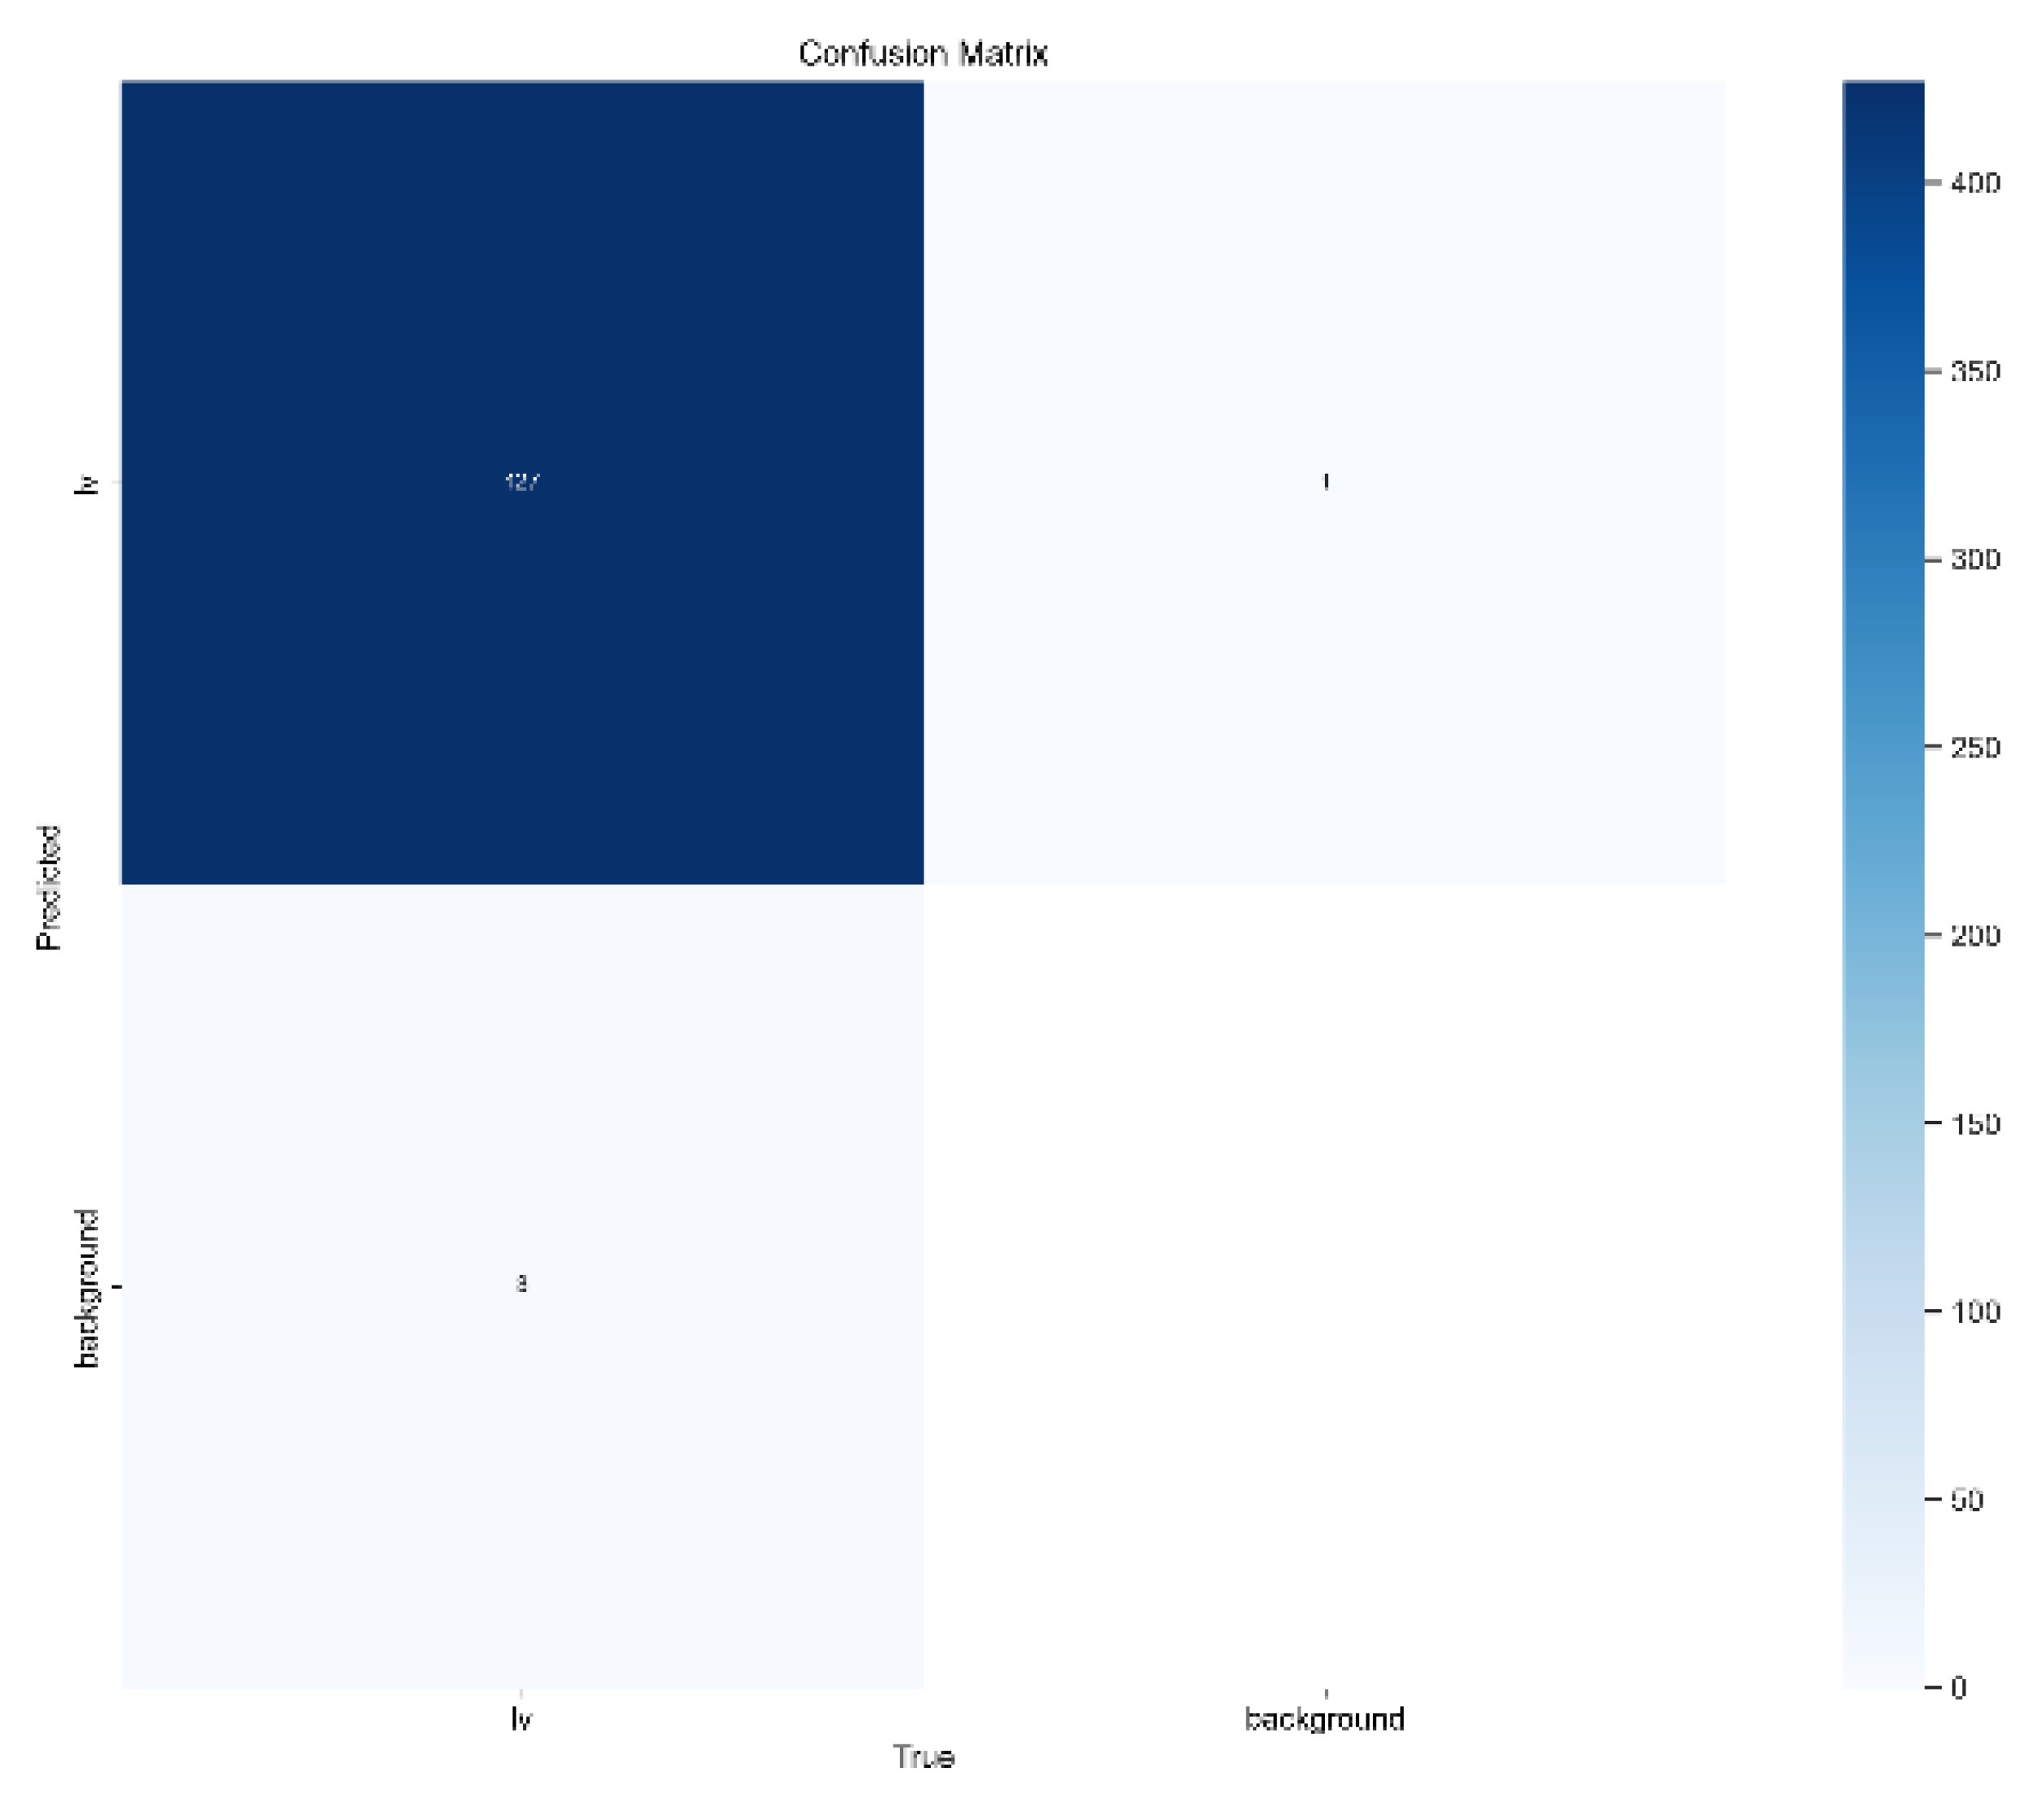
Figure 6.
mAP 50 and mAP50:95 for 200 epochs.
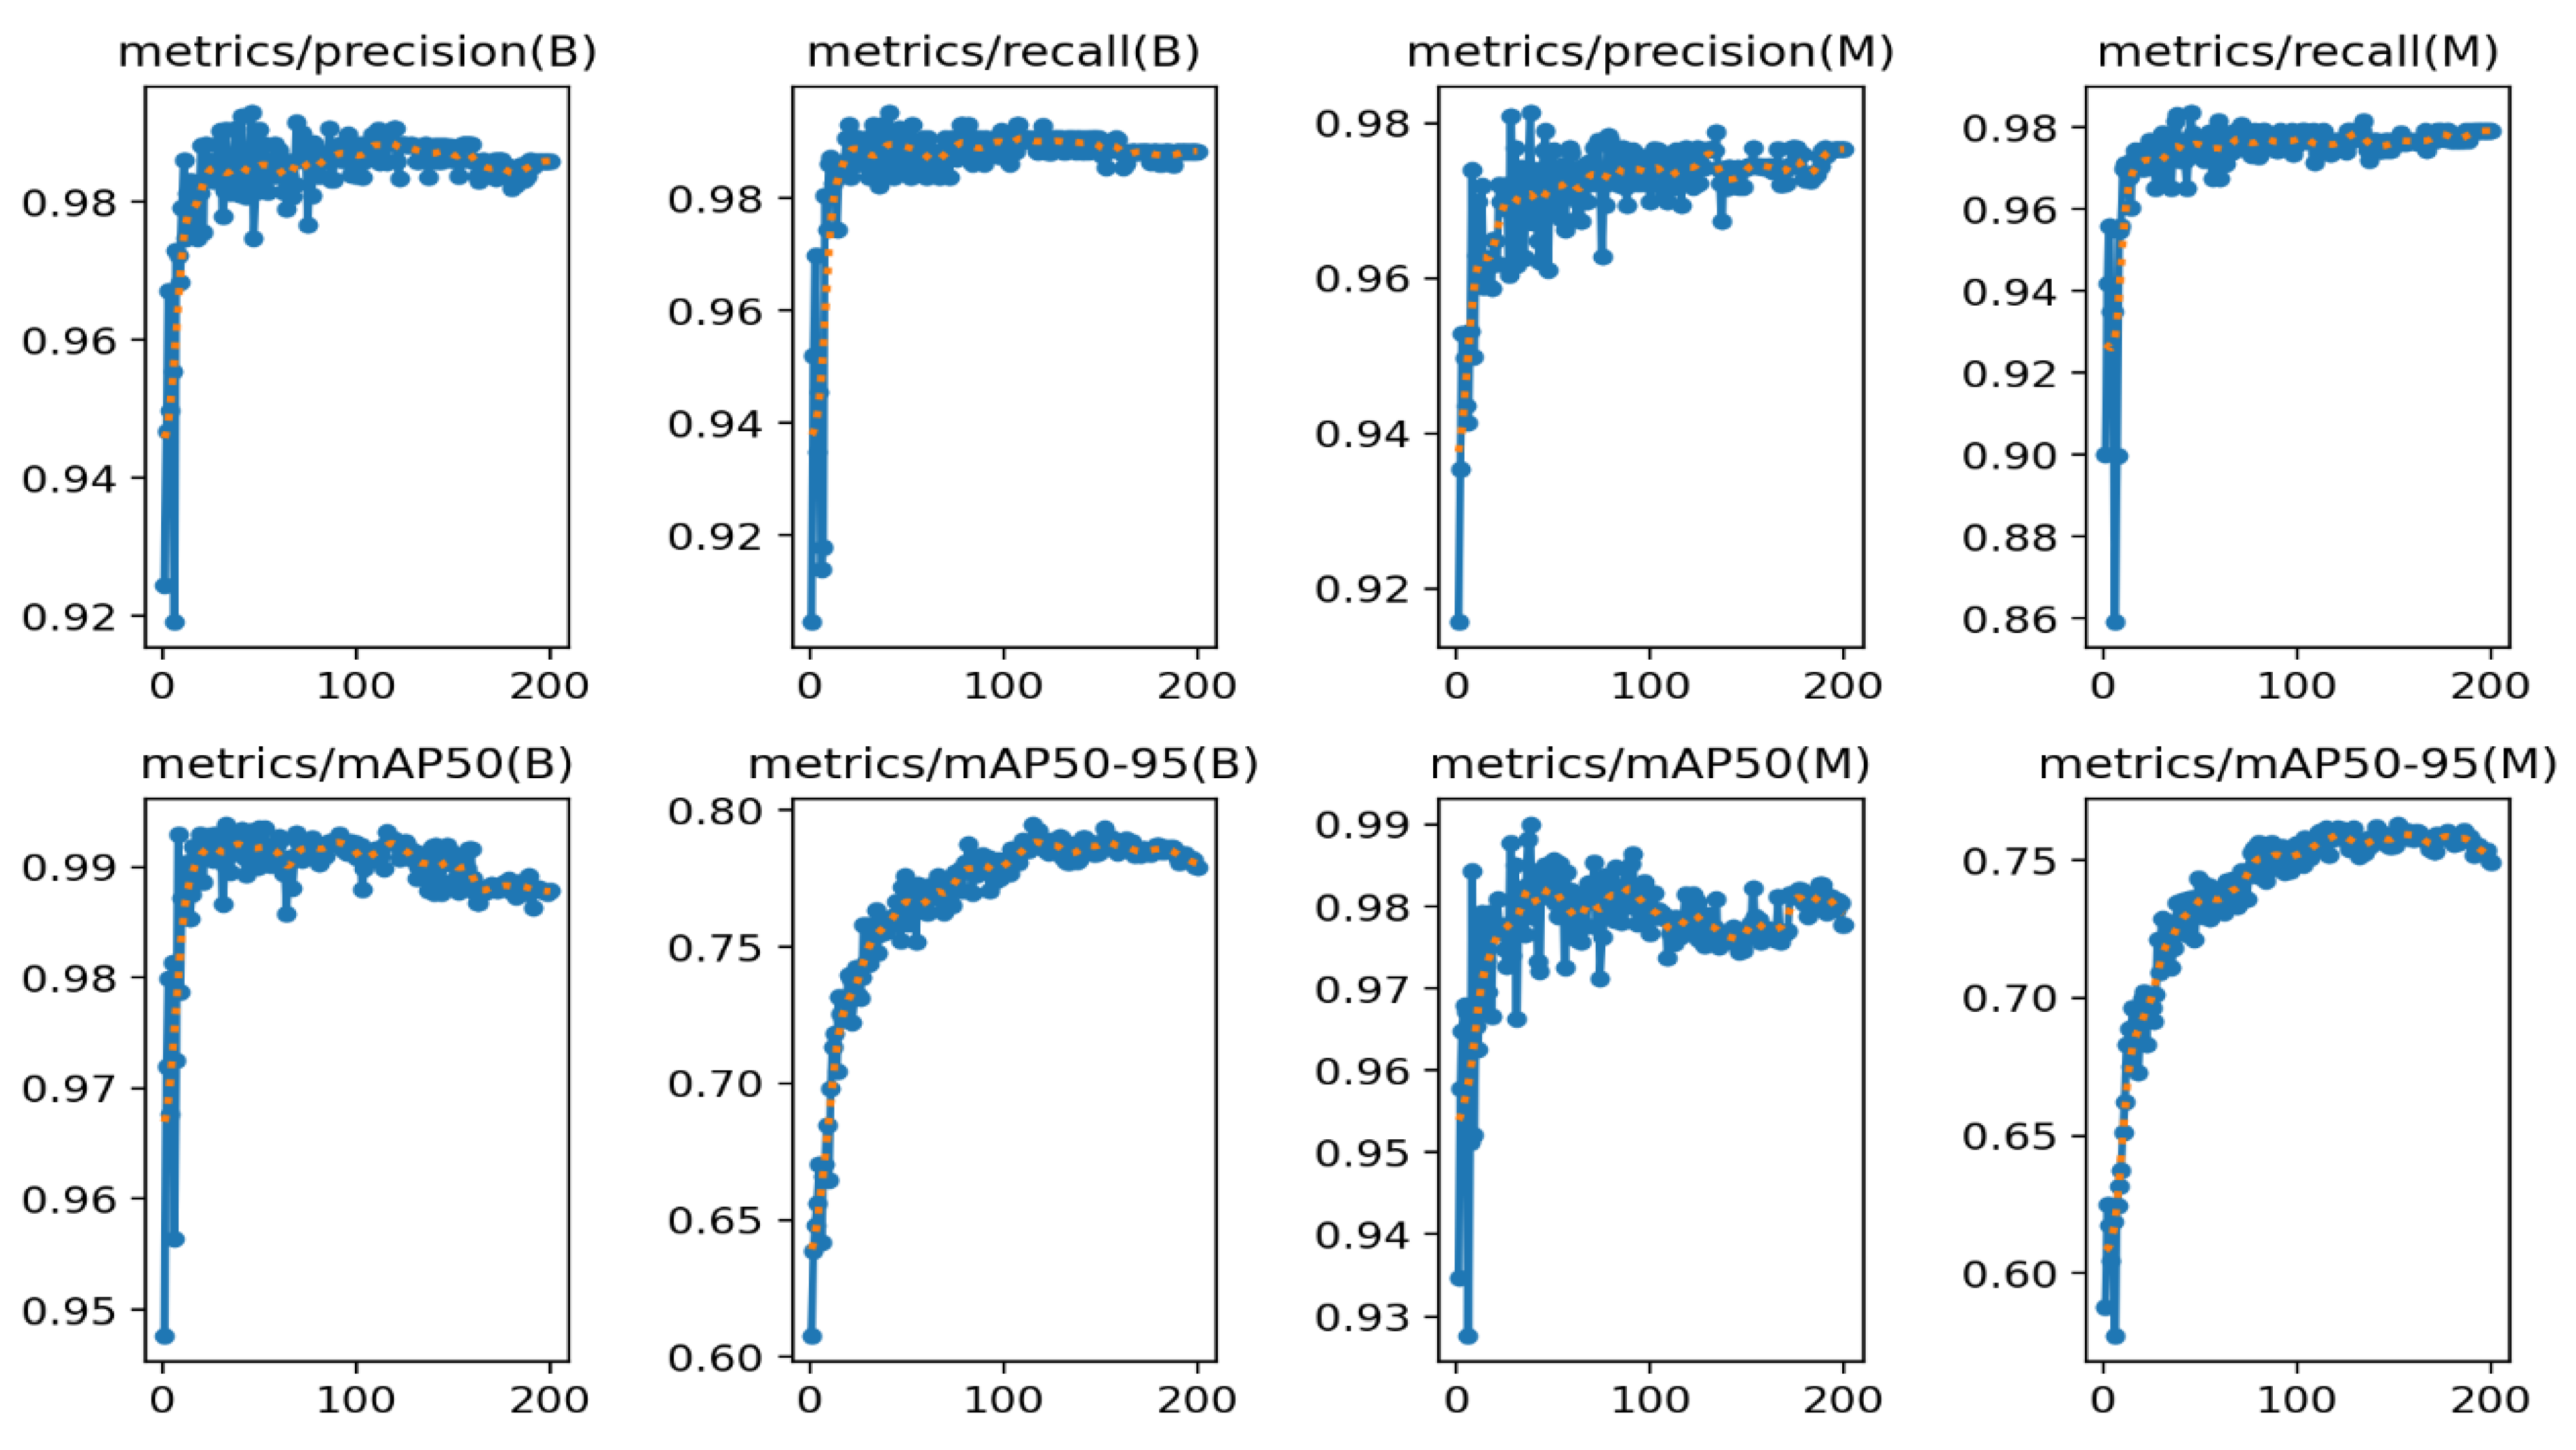
Figure 7.
Predicted Left ventricle segmentation. (a) Ground Truth annotated by the experts (b) Segmentation of frames by model.
Figure 7.
Predicted Left ventricle segmentation. (a) Ground Truth annotated by the experts (b) Segmentation of frames by model.
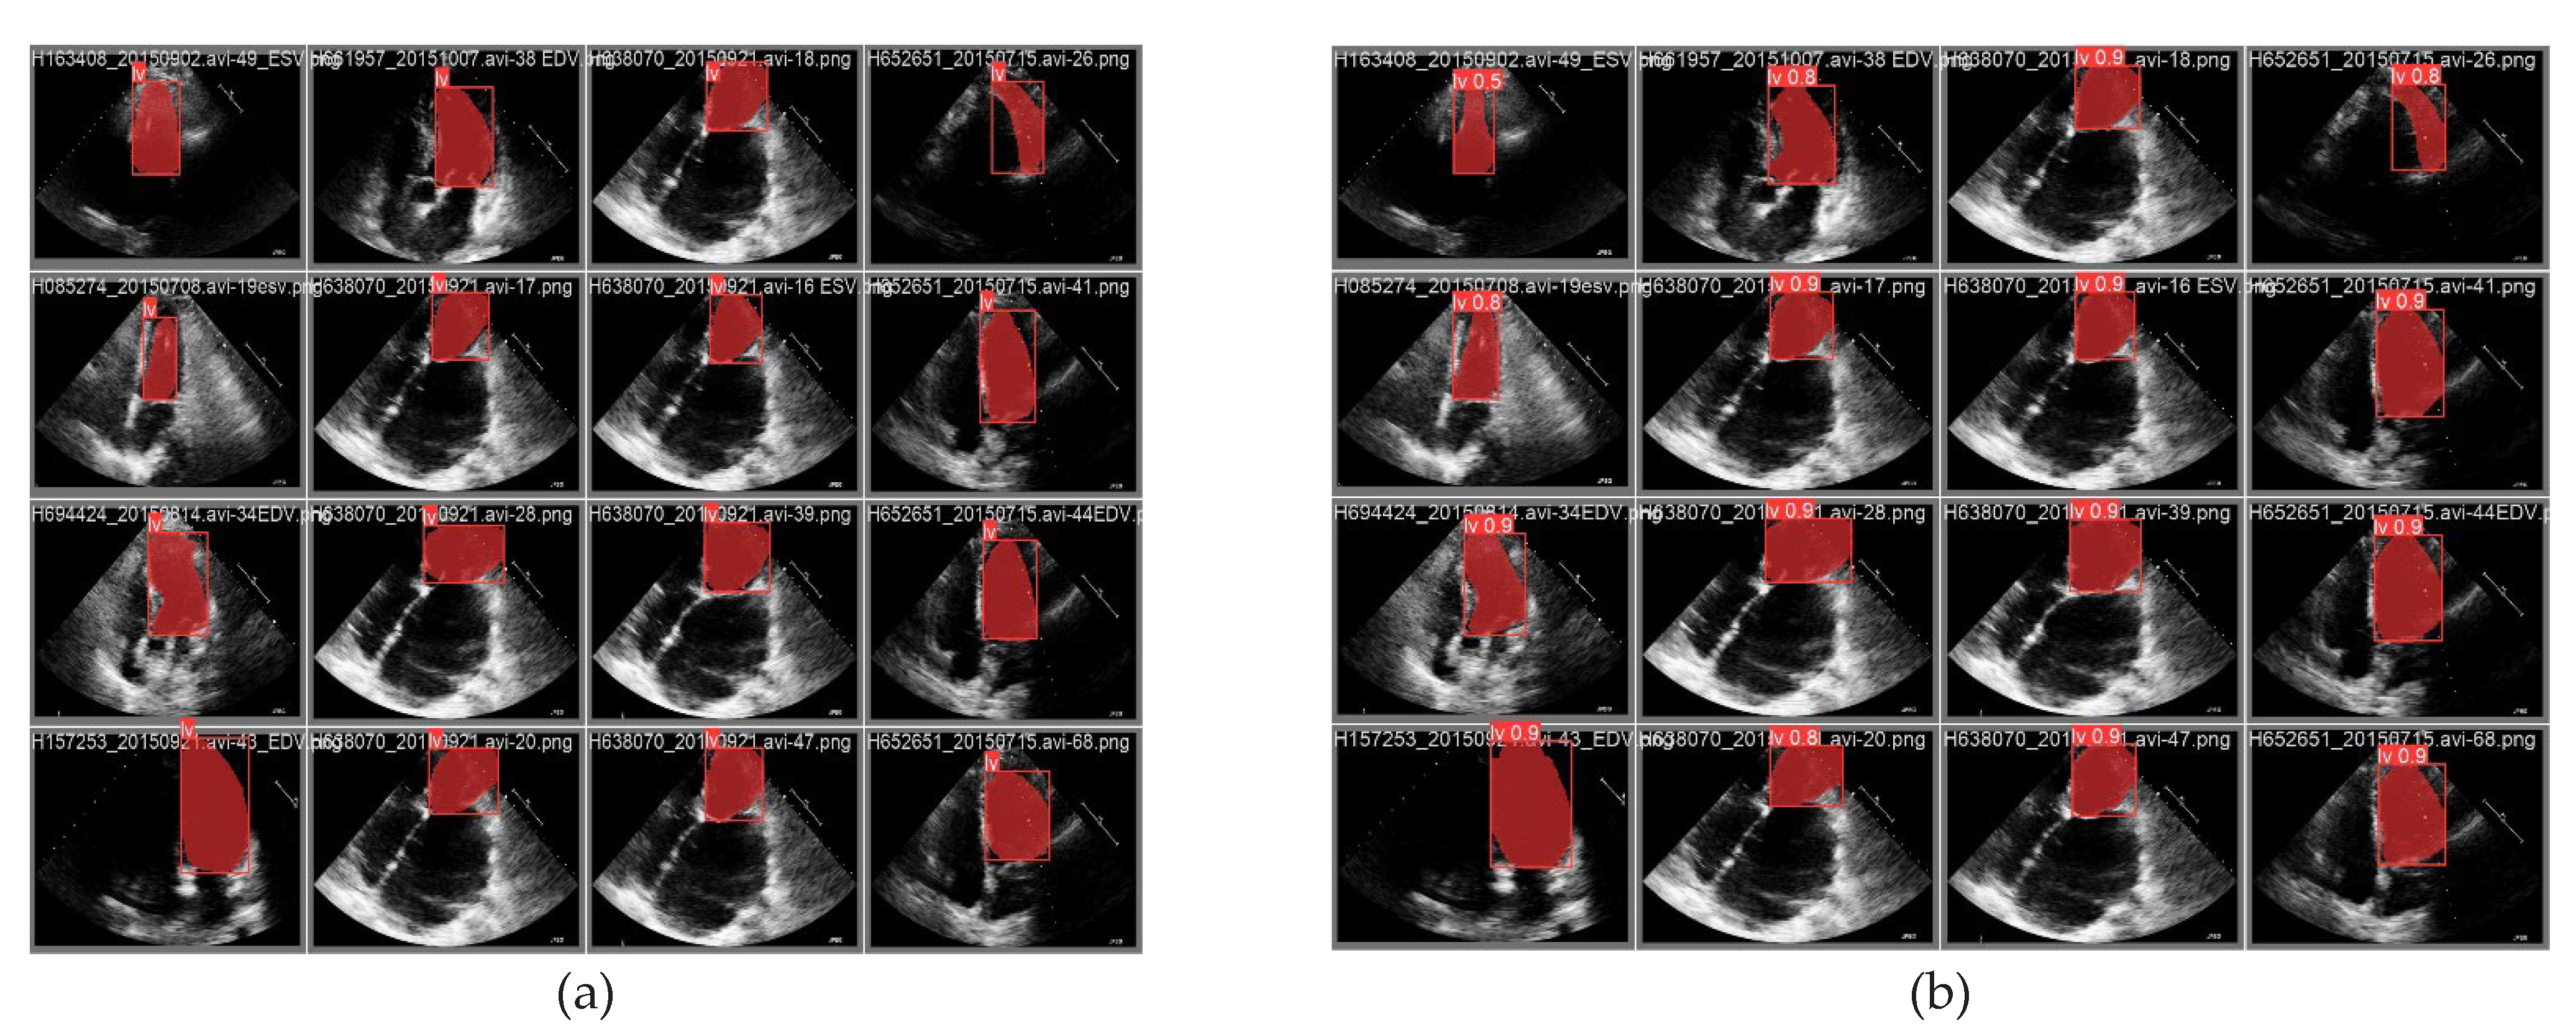

Table 1.
Performance comparison of various YOLO models.
| Model | size (pixels) | Precision | Recall | mAP50 | mAP50-95 | params (M) | FLOPs (B) |
|---|---|---|---|---|---|---|---|
| YOLOv8n-seg | 416 | 0.97247 | 0.95840 | 0.96064 | 0.75742 | 3.4 | 12.6 |
| YOLOv8s-seg | 416 | 0.97306 | 0.96771 | 0.97887 | 0.75604 | 11.8 | 42.6 |
| YOLOv8m-seg | 416 | 0.97363 | 0.97692 | 0.97957 | 0.75818 | 27.3 | 110.2 |
| YOLOv8l-seg | 416 | 0.97338 | 0.97899 | 0.97964 | 0.75626 | 46 | 220.5 |
| YOLOv8x-seg | 416 | 0.97572 | 0.97907 | 0.98005 | 0.75784 | 71.8 | 344.1 |
| YOLOv8n-seg | 640 | 0.97448 | 0.97456 | 0.97973 | 0.75875 | 3.4 | 12.6 |
| YOLOv8s-seg | 640 | 0.97651 | 0.97571 | 0.98164 | 0.76066 | 11.8 | 42.6 |
| YOLOv8m-seg | 640 | 0.9768 | 0.97894 | 0.98271 | 0.75816 | 27.3 | 110.2 |
| YOLOv8l-seg | 640 | 0.97583 | 0.97770 | 0.98263 | 0.75821 | 46 | 220.5 |
| YOLOv8x-seg | 640 | 0.97654 | 0.97921 | 0.98269 | 0.75852 | 71.8 | 344.1 |
| YOLOv8n-seg | 1280 | 0.97651 | 0.97907 | 0.98154 | 0.75671 | 3.4 | 12.6 |
| YOLOv8s-seg | 1280 | 0.97654 | 0.97907 | 0.97932 | 0.75164 | 11.8 | 42.6 |
| YOLOv8m-seg | 1280 | 0.97657 | 0.97907 | 0.98108 | 0.75491 | 27.3 | 110.2 |
| YOLOv8l-seg | 1280 | 0.9766 | 0.97907 | 0.98126 | 0.75542 | 46 | 220.5 |
| YOLOv8x-seg | 1280 | 0.97661 | 0.97907 | 0.98071 | 0.75409 | 71.8 | 344.1 |
Disclaimer/Publisher’s Note: The statements, opinions and data contained in all publications are solely those of the individual author(s) and contributor(s) and not of MDPI and/or the editor(s). MDPI and/or the editor(s) disclaim responsibility for any injury to people or property resulting from any ideas, methods, instructions or products referred to in the content. |
© 2024 by the authors. Licensee MDPI, Basel, Switzerland. This article is an open access article distributed under the terms and conditions of the Creative Commons Attribution (CC BY) license (http://creativecommons.org/licenses/by/4.0/).
Copyright: This open access article is published under a Creative Commons CC BY 4.0 license, which permit the free download, distribution, and reuse, provided that the author and preprint are cited in any reuse.


