
Submitted:
27 January 2025
Posted:
28 January 2025
You are already at the latest version
Abstract
(1) Background: Lotus (Nelumbo nucifera Gaertn.) is an aquatic plant with a long history, with ornamental, edible, medicinal, and commercial value. All parts of lotus are important “homologous and different effects” medicinal herbs as distinct parts of the same plant with different medicinal effects. (2) Methods: Six representative medicinal parts of lotus were selected, i.e., lotus flower (Nelumbinis Flos, Flo), lotus petiolous (Nelumbinis Petiolus, Pet), lotus seedpod (Nelumbinis Receptaculum, Rec), lotus stamen (Nelumbinis Stamen, Sta), lotus seed (Nelumbinis Semen, Sem), and lotus plumule (Nelumbinis Plumula, Plu). Analyzed via UPLC-MS/MS for metabolite profiling and RNA sequencing for gene expression. Weighted gene co-expression network analysis identified several transcription factor families related to flavonoid synthesis. (3) Results: Distinct metabolite accumulation and gene expression patterns were observed, particularly in the flavonoid synthesis pathway. Key findings included important metabolic profiles in stamens, high flavonoid content in light-exposed tissues, and functional differentiation in seeds and plumules. The discovered transcription factor families are essential for flavonoid biosynthesis and contribute to molecular breeding and resource utilization. (4) Conclusion: This study provides an important theoretical basis for molecular breeding of lotus, quality control of medicinal materials, and the rational use of resources obtained from different medicinal parts of lotus.
Keywords:
lotus
; metabolomics
; transcriptomics
; flavonoid biosynthesis
; homologous and different effects
; WGCNA
1. Introduction
Lotus (Nelumbo nucifera Gaertn.) is a perennial aquatic herb of the genus Lotus in the family Lotusaceae, with ornamental, edible, medicinal, and economic values. Lotus has been cultivated for at least 7,000 years in China, nearly all its provinces. It has also been used as a functional food and herbal medicine in Asia for 2000 years [1]. Lotus seed, lotus plumule, lotus seedpod, lotus leaf, lotus petiolus, lotus stamen, lotus root, and lotus flower are all derived from the lotus; however, they are important “homologous and different effects” medicinal herbs as distinct parts of the same plant with different medicinal effects [2].
Among them, lotus leaf, lotus seed, lotus plumule, lotus root, lotus stamen, and lotus seedpod are included in the Chinese Pharmacopoeia. Both the lotus seed and lotus plumule are effective in treating insomnia and spermatorrhea. Besides, lotus seed nourishes the heart calms the mind, strengthens the spleen, and treats diarrhea; on the other hand, lotus plumule also laxes fire and treats delirium. Lotus leaf, lotus seedpod, and lotus root can stop bleeding. The lotus leaf also strengthens the spleen and treats diarrhea; the lotus seedpod treats post-partum stasis, and the lotus root removes blood stasis. Lotus stamen is effective in strengthening the kidney and astringent essence, and treating frequent urination [3]. The two herbs, lotus flower, and lotus petiole, are not included in the Chinese Pharmacopoeia. Nonetheless, they are included in the Chinese medicinal tablet’s concoction specifications of Jiangsu, Shanghai, Hubei, and other regions; they are also used as Chinese local medicines. Lotus flower and lotus petiole can eradicate summer heat. Lotus flowers can also stop bleeding, and exert anti-diabetic, anti-obesity effects and other properties [4]. Lotus petiole can also improve chest tightness, and treat diseases including dysentery and gonorrhea [5].
Previous studies have uncovered that the difference in the efficacy of different medicinal parts of the lotus is attributed to their distinctness in its chemical composition, specifically in its metabolites. Studies on the isolation of chemical components in various tissues of lotus have matured. These chemical components primarily include flavonoids, alkaloids, polyphenols, triterpenoids, proteins, polysaccharides, starch, steroids, and other components [6,7]. Lotus leaf, lotus petiole, lotus seed, and lotus plumule are dominated by alkaloidal components [2,6], with major pharmacological effects including antioxidant activity, anti-tumor, antibacterial, anti-inflammatory, lipid-lowering, and hypoglycaemic effects [8]. Flavonoid constituents are primarily concentrated in light-seeing tissues including lotus leaf, lotus flower, and lotus seedpod [6]; they have pharmacological effects including antioxidant activity, antiviral, antibacterial, anti-inflammatory, analgesic, anti-Alzheimer’s disease, as well as treatment of hypertension and diabetes mellitus [4,6,9,10,11].
Gene mining and functional identification studies on flower color, flower type, genomic features, and resistance of lotus exist at a molecular level [12,13,14,15], and the multi-omics study of lotus is mainly based on transcriptome analysis, interpreting the differences in the synthesis and accumulation and distribution of different active ingredients in its different tissues is less studied. Therefore, elucidating the basis of the difference in lotus plants can elucidate the mechanism of “homologous and different effects” of its medicinal parts. It also provides a theoretical basis for the comprehensive use of lotus resources and the formulation of quality standards for the medicinal use of certain plants of the genus Lotus.
2. Materials and Methods
2.1. Materials
The material used in this study was harvested from Nanchang, Jiangxi Province in June 2024, and was identified as lotus (Nelumbo nucifera Gaertn.) by Dr Yihao Jiang of Nanchang University. Six representative medicinal parts of the lotus plant were selected, i.e., lotus flower (Nelumbinis Flos, Flo), lotus petiolous (Nelumbinis Petiolus, Pet), lotus seedpod (Nelumbinis Receptaculum, Rec), lotus stamen (Nelumbinis Stamen, Sta), lotus seed (Nelumbinis Semen, Sem), and lotus plumule (Nelumbinis Plumula, Plu), with three biological replicates for each tissue sample. After harvesting, the samples were washed and wiped clean, immediately frozen in liquid nitrogen, and placed in a -80 °C cryogenic refrigerator for spare parts.
2.2. Metabolite Extraction Methods
The extraction methods were referred from that in a study by VASILEV N et al [16]. The sample was weighed into a 2 mL centrifuge tube and vortexed with 600 µL of methanol containing 2-chloro-L-phenylalanine (4 ppm) for 30 s. Steel beads were added to the sample and placed into a tissue grinder (MB-96) at 55 Hz for 60 s. The sample was sonicated for 15 min at room temperature and centrifuged at 12,000 rpm at 4°C for 10 min. The supernatant was filtered through a 0.22μm membrane and added to the assay vial for LC-MS. The supernatant was filtered through a 0.22μm membrane; the filtrate was added to the detection vial for LC-MS detection.
2.3. UPLC-MS/MS Conditions
Metabolome analysis was performed on a Thermo Vanquish (Thermo Fisher Scientific, USA) ultra-high performance liquid chromatography (UPLC) system using an ACQUITY UPLC® HSS T3 (2.1×100 mm, 1.8 µm) (Waters, MiRecord, MA, USA) column at a flow rate of 0.3 mL/min and an injection volume of 2 μL at a column temperature of 40 °C. The mobile phase was 0.1% formic acid in positive ion mode. The column temperature was 40 ℃, and the injection volume was 2 μL. In positive ion mode, the mobile phases were 0.1% formic acid acetonitrile (B2) and 0.1% formic acid water (A2). The gradient elution program was as follows: 0~1 min, 8% B2; 1~8 min, 8%~98% B2; 8~10 min, 98% B2; 10~10.1 min, 98%~8% B2; 10.1~12 min, 8% B2. 8% B2. In negative ion mode, the mobile phases were acetonitrile (B3) and 5 mM ammonium formate water (A3), and the gradient elution procedures were: 0~1 min, 8% B3; 1~8 min, 8%~98% B3; 8~10 min, 98% B3; 10~10.1 min, 98%~8% B3; 10.1~12 min, 8% B3.
The results were separately acquired by a Thermo Q Exactive Focus mass spectrometry detector (Thermo Fisher Scientific, USA) with an electrospray ionization source (ESI) in positive and negative ion modes. The positive ion spray voltage was 3.50 kV, the negative ion spray voltage was -2.50 kV, the sheath gas was 40 arb, and the auxiliary gas was 10 arb. The capillary temperature was 325°C, and the primary full scan was performed at a resolution of 70,000, the primary ion scanning range was m/z 100~1000, and the secondary cleavage was performed using an HCD with a collision energy of 30 eV, and the secondary resolution was 17,500. The first 3 ions of the acquired signal were fragmented; dynamic exclusion was used to remove unnecessary MS/MS information [17].
2.4. Metabolite Profiling
A spectrum library of plant substances including primary and secondary plant metabolites was constructed based on standards from public databases including HMDB, MassBank, Knapsack, ReSpect, LipidMaps, and KEGG. Based on the primary molecular weight, retention time, spectra were compared and matched with the database to obtain the qualitative results of metabolites. Differential metabolites (DAMs) were identified by significant difference screening by P-value < 0.05 and VIP > 1 [18]. Functional pathway enrichment and topological analysis of the screened differential metabolites were performed using the MetaboAnalyst software package. The pathways obtained from the enrichment were used to browse the differential metabolite and pathway maps using the KEGG Mapper visualization tool.
2.5. RNA-seq
Libraries were created using the NEBNext Ultra II RNA Library Prep Kit for Illumina. Library quality was checked using an Agilent 2100 Bioanalyzer (Agilent, 2100) and, Agilent High Sensitivity DNA Kit (Agilent, 5067-4626). Total library concentration was detected using Pico green (Quantifluor-ST fluorometer, Promega, E6090; Quant-iT PicoGreen dsDNA Assay Kit, Invitrogen, P7589), and validated library concentration was quantified by QPCR< Thermo Scientific StepOnePlus Real-Time PCR Systems >). The mixed libraries were gradually diluted and quantified, before sequencing in PE150 mode on an Illumina sequencer.
The filtered high-quality sequences (Clean Data) were aligned to the reference genome of the species. Moreover, the Read Count value of each gene was counted using HTSeq (0.9.1) as the raw expression of the gene. Expression was normalized (Normalization) using FPKM to assess gene expression levels. Differential expression analysis between two comparison combinations was performed using DESeq (1.20.0). Differentially expressed genes (DEGs) were screened under the conditions of expression difference ploidy|log2(FoldChange)|>1, and significance P-value <0.05.
2.6. Differential Gene Analysis
KEGG pathway enrichment analysis of differential genes was carried out using topGO with clusterProfiler (3.4.4). P-values were computed using hypergeometric distribution methods to identify pathways significantly enriched for differential genes, thereby determining the major biological functions of differential genes.
Further, protein interactions were analyzed based on the STRING database (https://string-db.org/), hence revealing the relationships between target genes and interrelationships between proteins of the species.
2.7. Weighted Gene Co-Expression Network Analysis
Gene expression levels were obtained by RNA-seq, and the gene co-expression network was constructed using the WGCNA software to achieve efficient mining of sequencing data, classify the data, and select the major effector genes. The co-expression similarity coefficients between genes were calculated using the TOMSimilarity module; a power value of 20 was selected using the pickSoftThreshold function of this software package when the correlation coefficients stabilized. We selected the modules with correlation coefficients of >0.8 to the grouped features. Cytoscape was utilized to draw the gene network diagrams of the modules.
3. Results
3.1. Differential Analysis of Secondary Metabolism in Lotus Tissues
The total ion chromatogram (TIC) of six tissues of lotus in positive and negative ion modes are shown in Figure 1A, 1B, respectively. After screening differential metabolites from the primary metabolite list, 8638 and 8125 differential metabolites were identified in positive and negative ion modes, respectively. Principal component analysis (Figure 1C,D) of metabolites in positive and negative ion modes showed differences in metabolites between groups of different tissues; differences within groups were not apparent, which could explain to a certain extent the unique metabolic characteristics of different tissues. The Sta was clearly distinguished from other tissues with unique metabolic features. Sem and Plu had similar metabolic characteristics. Notably, Pet, Rec, and Flo are the light-seeing tissues of the lotus growing on the water surface. Flo, Rec, and Sem are the flower, the fruit, and the seed of the lotus. The pollen of lotus comes from Sta, and after successful pollination, the pistil develops into Rec, and inside Rec, the Sem develops, and the embryonic root, Plu, develops in Sem. Therefore, we set up the following comparison combinations: Flo vs. Rec, Flo vs. Pet, Rec vs. Pet, Flo vs. Sem, Rec vs. Sem, Sta vs. Rec, Rec vs. Plu, Sem vs. Plu, and Sta vs. Sem.
The Z-score plot can visualize the overall trend and degree of difference in the quantitative values of metabolites among different groupings and samples. Figure 1E shows the top 30 differential metabolites with the greatest degree of variation among the six tissues of the lotus. All the metabolites with a greater degree of variation were significantly enriched in Sta. Based on the results of the principal component analysis, the Z-score plot displayed a unique metabolic profile of Sta. Amygdalin, which has the highest variation among the six tissues and the highest relative content in Sta, is usually broadly distributed in Rosaceae [19], and more commonly found in almond seed kernels as well as apricot pollen [20,21]. Pharmacological effects include cough suppressant, anticancer, anti-inflammatory and analgesic, and hypoglycaemic [19,22]. In addition, metabolite contents including butin, galactaric acid, liquidambaric, geranial, and echinatin in Sta were significantly higher than that of the other five tissues.
MS/MS secondary analysis identified 1094 secondary metabolites in six tissues of lotus (Figure 2A, Table S1), including 122 flavonoids, 95 prenol lipids, 92 organooxygen compounds, 86 fatty acyls, 57 carboxylic acids and derivatives, 54 benzene and substituted derivatives, 50 phenols, 40 terpenoids, and 32 alkaloids and other compounds.
A total of 92 differential metabolites were common to different comparative combinations in different tissues of lotus, including 16 flavonoids, 7 phenols, 6 terpenoids, 6 organooxygen compounds, 4 alkaloids, 4 benzene, and substituted derivatives, 4 prenol lipids and other compounds. Among them, flavonoids had the largest percentage, showing that they had the greatest effect on the efficacy differentiation of different tissues of the lotus (Figure 2B).
To investigate the accumulation pattern of secondary metabolites in different tissues of the lotus, K-means cluster analysis was performed on 1094 secondary metabolites identified in six tissues of the lotus (Figure 2C, Table S2). The findings revealed that secondary metabolites accumulated in different tissues at different patterns. The secondary metabolites were classified into nine different clusters based on the distribution trend of their contents in different tissues. Cluster 1 and Cluster 7 contained 125 and 116 secondary metabolites, respectively, most of which were organooxygen compounds, with a trend of specific accumulation in Pet and Sem. Cluster 3, Cluster 5, and Cluster 9 had 109, 152, and 160 secondary metabolites, respectively, which were majorly flavonoids, and specifically accumulated in Flo, Plu, and Rec, respectively. Cluster 8 had a total of 252 secondary metabolites, specifically accumulating in Sta, most of them being prenol lipids.
The results of the cluster heat map (Figure 2D) showed that flavonoids, organooxygen compounds, fatty acyls, carboxylic acids and derivatives, benzene and substituted derivatives, phenylpropanoids, indoles, and derivatives were significantly enriched in Sta compared to other tissues. Additionally, the constituents enriched in Rec were primarily lactones, and those in Plu were mainly phenols, terpenoids, steroids, steroid derivatives, and imidazopyrimidines. Prenol lipids were the most abundant component in Sem. The most abundant metabolites in Flo were alkaloids, isoflavones, coumarins, and derivatives.
3.2. Transcriptome Analysis of Lotus Tissues
Transcriptome sequencing was performed for the same samples to explore the molecular basis responsible for the flavonoid differences in different tissues Consequently, we obtained 78,966,7166 Clean Reads, with a Q30 above 95% (Table 1). The obtained Unigenes were annotated to 12 major public databases including: GO (75.43%), eggNOG (84%), KEGG (40.39%), SwissprotName (80.51%), MF (64.63%), NR (100%), eggNOG_Category (84%). Swissprot (83.5%), CC (40.14%), Pathway (21.7%), BP (52.9%), Entrez_geneID (100%).
Based on the principal component analysis of the transcriptome (Figure 3A), it is evident that the clustering results between the different tissues were highly consistent with the results of the principal component analysis of the metabolome. Sta remained clustered in a separate group with a unique expression profile. Pet, Rec, and Flo also had similar expression features. In contrast, Sem and Plu were no longer clustered into one group.
3.3. Joint Metabolomic and Transcriptomic Analysis of Lotus Tissues
The joint analysis of metabolism and transcription can not only unravel the relationship pattern of metabolites and genes but also reveal the regulatory mechanism of metabolic pathways in organisms. Based on the number of differential molecules obtained from metabolome and transcriptome assays, the most DAMs were found between Rec and Plu, with 324 DAMs up-regulated and 311 DAMs down-regulated. This was followed by Sta with Rec, with 421 DAMs up-regulated and 212 DAMs down-regulated. The fewest DAMs were found between Sem and Plu, with 206 DAMs up-regulated and 305 DAMs down-regulated. The DEGs between Plu and Rec were the most with 6793 DEGs up-regulated and 4118 DEGs down-regulated. The next largest number of DEGs was Plu and Sem with 5803 DEGs up-regulated and 4020 DEGs down-regulated. Flo with Rec had the least DEGs with 3050 up-regulated and 4019 down-regulated. This shows that the extent of difference in metabolites and genes between the two tissues is not strongly correlated with the distance of growth from each other (Figure 3B).
From the KEGG pathway enrichment results of DAMs and DEGs, the top 20 pathways with the strongest degree of enrichment were selected to draw KEGG pathway bubble maps (Figure 4). In the nine sets of comparison combinations (Flo vs. Rec, Flo vs. Pet, Rec vs. Pet, Flo vs. Sem, Rec vs. Sem, Rec vs. Plu, Sem vs. Plu, Sta vs. Rec, Sta vs. Sem), the flavonoid biosynthesis pathway was enriched in both histologies in six of these groups (Flo vs. Rec, Flo vs. Pet, Rec vs. Pet, Flo vs. Sem, Rec vs. Sem, Sta vs. Rec). The pathway was enriched to 25 DAMs and 31 DEGs in Flo vs. Rec, 26 DAMs and 35 DEGs in Flo vs. Pet, 22 DAMs and 37 DEGs in Rec vs. Pet, 25 DAMs and 35 DEGs in Flo vs. Sem, and 25 DAMs and 35 DEGs in Sta vs. Rec. Rec vs. Sem were enriched to 23 DAMs and 29 DEGs, in Sta vs. Rec were enriched to 24 DAMs and 28 DEGs. KEGG pathway bar graphs were plotted based on the enrichment results (Figure 5), with the red horizontal line indicating a P-value value of 0.01 and the blue horizontal line indicating a P-value value of 0.05. The flavonoid biosynthesis pathway had a P-value of <0.05 in both histologies of the six comparative combinations, suggesting that this pathway is the key regulatory pathway, hence DAMs and DEGs on this pathway were selected for further analysis.
To further investigate the accumulation mechanism of flavonoid compounds, the content of differential metabolites and the expression of differential genes in the pathway were mapped into a heat map, and integrated with the KEGG pathway to map the metabolite and gene heat maps of the flavonoid biosynthesis pathway (Figure 6).
A total of 34 differential flavonoid components, 64 key-acting genes, and 17 key synthases were annotated in the flavonoid biosynthesis pathway. These included: phenylalanine ammonia-lyase (PAL), 4-coumarate-CoA ligase (4CL), chalcone synthase (CHS), trans-cinnamate 4-monooxygenase (CYP73A), shikimate O-hydroxycinnamoyltransferase (HCT), 5-O-(4-coumaroyl)-D-quinate 3’-monooxygenase (C3’H), caffeoyl-CoA O-methyltransferase (CCoAOMT), chalcone isomerase (CHI), phlorizin synthase (PGT1), naringenin 3-dioxygenase (F3H), flavonoid 3’-monooxygenase (F3’H), flavonoid 3’,5’-hydroxylase (F3’5’H), bifunctional dihydro flavonol 4-reductase (DFR), flavanol synthase (FLS), anthocyanidin synthase (ANS), leucoanthocyanidin reductase (LAR), and anthocyanidin reductase (ANR).
Notably, CHS catalyzes the production of various types of chalcone, which is the first rate-limiting enzyme of the flavonoid synthesis pathway; their expression levels can directly indicate the amount of flavonoids synthesized by the plant body [23,24]. Our findings showed that flavonoid components of Cluster 9 were significantly enriched in Rec, which may be because the CHSs were expressed at the highest level in Rec.
CHI catalyzes the production of flavanones from chalcone and is the second rate-limiting enzyme on the flavonoid biosynthetic pathway [25]. The results of the gene heat map showed that the CHIs were expressed at the highest level in Pet, resulting in the highest flavanone content in Pet, including pinocembrin, liquiritigenin, and pinobanksin.
F3’H and F3’5’H synergistically act on the substrate dihydrokaempferol to generate dihydroquercetin and dihydromyricetin, respectively. The content of dihydroquercetin was significantly higher than that of dihydromyricetin in Rec, Sta, and Sem; this was consistent with the relative expression of the F3’Hs and the F3’5’Hs in these three tissues.
DFR and FLS act together on the substrate dihydroflavonols, converting them to colorless anthocyanins and flavonols, respectively [26]. ANS competes with LAR for the same substrate, colorless anthocyanins, converting colorless anthocyanins to anthocyanidins and proanthocyanidins, which influence the coloring mechanism of the plant and have good antioxidant properties [27]. Although the expression level of ANSs was significantly higher in Pet, Rec, and Sem than in other tissues, the results of the metabolite clustering heat map showed that Flo had the highest amount of delphinidin, and Sta and Rec contained a higher amount of pelargonidin. This may be attributed to higher enzyme activity of ANS in these tissues or to the negative regulatory effect of high ANR gene expression on anthocyanins.
3.4. WGCNA of DEGs in Lotus Tissues
We screened highly expressed genes from transcriptome data and 10 key flavonoids from differential metabolites of six tissues of lotus for WGCNA analysis to further analyze the gene expression profile and search for flavonoid synthesis-related gene modules and co-expressed genes.
Among the 17 co-expressed modules identified, we considered the modules that satisfied the conditions of R > 0.8 and P-value < 0.01 as highly related to the corresponding flavonoids. The module-trait heatmap (Figure 7A) showed that the highly expressed genes in Plu were majorly distributed in the blue module, which was highly correlated with (+)-catechin and (+)-gallocatechin. The highly expressed genes in Sta were mainly distributed in the black module and highly correlated with kaempferol. Most of the highly expressed genes in Pet were in the turquoise module and were highly correlated with pinobanksin and naringenin chalcone. The genes highly expressed in Rec are mainly in the magenta module and are highly correlated with luteoforol. The red module is highly correlated with phlorizin and luteoforol, and the genes therein are highly expressed in Rec and Flo. The lightcyan module and the yellow module mainly contain genes that are highly expressed in Flo, which are highly correlated with delphinidin.
Among these modules with a strong correlation with flavonoid metabolites, the black module, turquoise module, magenta module, lightcyan module, and yellow module contained 1, 2, 6, 1, and 3 structural genes related to the flavonoid biosynthesis pathway, respectively. These five modules screened as key modules were used for identifying the genes in the modules (Table 2, Table S3). The black module contains LOC104608517 (FLS) which primarily affects the synthesis of kaempferol. LOC104603248 (HCT), and LOC104588272 (C3’H) in the turquoise module modulate the synthesis of pinobanksin and naringenin chalcone. The important genes in the magenta module for luteoforol synthesis include LOC104601277 (PAL), LOC104589393 (PAL), LOC104602160 (CHS), LOC104602224 (CHS), LOC104605233 (F3H), and LOC104585744 (ANR). The lightcyan module has LOC104611136 (CCoAOMT), which is important for delphinidin synthesis. The important genes in the yellow module for delphinidin synthesis include LOC104595050 (PAL), LOC104601739 (CCoAOMT), and LOC104606654 (CCoAOMT).
Among the five key modules included in Table 2, the screened structural genes related to flavonoid synthesis and the co-expressed genes that have reciprocal relationships with them in the modules were plotted in a heatmap (Figure 7B-7N). Consequently, the genes included in the different modules had specific expression trends in different tissues of the lotus. These genes have an important effect on the accumulation of flavonoids in different tissues.
To further investigate the transcription factors associated with flavonoid synthesis, we identified the transcription factors closely associated with structural genes in these key modules; an interoperability network diagram was drawn together with the structural genes (Figure 7O, Table S4), including 38 nodes and 167 edges, with circles representing the transcription factors and squares the structural genes. These 67 transcription factors were from 26 transcription factor families including 10 WRKY, 8 bHLH, 7 ERF, 4 HD-ZIP and TALE, 3 ARF, C2H2 and NAC, and other transcription factor families. The MCC algorithm was used to screen the top 10 nodes with centrality (Table 3). Among them, bHLH was associated with 7 structural genes and had the highest connectivity. ERF was associated with 6 structural genes, and NF-YC was associated with 5 structural genes. Based on the correlation of structural genes with flavonoids in the modules, we inferred that bHLH directly or indirectly participates in the synthesis of kaempferol, pinobanksin, naringenin chalcone, luteoforol, and delphinidin. ERF is involved in the regulation of the synthesis of pinobanksin, naringenin chalcone, luteoforol, and delphinidin. NF-YC is involved in the regulation of pinobanksin, naringenin chalcone, and luteoforol synthesis.
Discussion
4.1. Relationship Between Tissue Specificity and Pharmacological Effects
Metabolomics analysis revealed that different tissues of lotus had unique metabolic features; specifically, Sta demonstrated significant differences, unlike other tissues. The specific accumulation of flavonoids, alkaloids, and organooxygen compounds not only conferred unique pharmacological activities to different parts of lotus but also elucidated the mechanism of “homologous and different effects”.
Sta has peculiar metabolic features, in which the relative contents of secondary metabolites including amygdalin, liquidambaric, echinatin, and geranial are much higher than that in other tissues. Therefore, this may be the source of its pharmacological antioxidant, anticancer, anti-inflammatory and analgesic, hypoglycaemic, and immunomodulatory properties [11,19,2][35]. Sta can be considered as a key indicator for quality evaluation when developing products related to Sta. Additionally, Sta are enriched with many prenol lipids, which can improve their resistance to salt stress [36].
As light-seeing tissues, Pet, Rec, and Flo have similar metabolic characteristics, which are majorly characterized by abundant accumulation of flavonoid components. Flavonoids are an important class of antioxidants and their synthesis in plants is strongly influenced by light [37]. Pinocembrin, liquiritigenin, pinobanksin, and naringenin chalcone have anti-inflammatory, antimicrobial, anticarcinogenic, antioxidant, neuroprotective, intestinal flora regulator, antidiabetic, anti hyperuricemic, and antiallergic bioactivities [3][44]. The present study revealed that these compounds were more enriched in Pet than in other tissues, which is important for further comprehensively developing and utilizing Pet as well as for developing quality standards for the traditional Chinese medicine Nelumbinis Petiolus. Dihydroquercetin has biological properties including antioxidant, antimicrobial, anticancer, anti-Alzheimer’s disease, cardioprotective and hepatoprotective. It also has a good therapeutic effect on skin-related diseases [45,46]. As a natural botanical rich in dihydroquercetin, Rec can be efficiently used in manufacturing skin wound dressings [47]. Delphinidin exerts good pharmacological activities including anticancer, antidiabetic, anti-obesity, cardiovascular protection, neuroprotection, and inhibition of abnormal angiogenesis [48,49], which is significantly enriched in Flo. It also affects the antidiabetic and anti-obesity pharmacological effects of Flo.
Although Sem and Plu originate from the same organ with some similarity in metabolite composition, their gene expression patterns are significantly distinct. This shows how small genetic differences can cause significant functional differentiation even in similar general environments. The enrichment of metabolites including terpenoids and proanthocyanidins in Plu may be responsible for its antioxidant capacity [6,50]. In addition, terpenoids enriched in Plu that slow down aging and treat senile diseases [5][53], which is the material basis for the anti-aging health effects of Plu. Sem is rich in organooxygen compounds including sugars and lipids, which can provide the body with the required energy and nutrients, and boost the body’s immunity [54], making it an ideal nourishing ingredient. Sem and Plu are rich in alkaloids, which may be responsible for clearing heat and fire, strengthening the heart, and tranquilizing the mind, as well as sedating and hypnotic [5][58].
4.2. Tissue-Specific Regulation of Flavonoid Biosynthetic Pathway
Combined metabolomic and transcriptomic analyses revealed a strong connection between metabolite accumulation and gene expression. Specifically, the flavonoid biosynthesis pathway was significantly enriched in several contrasting combinations of tissues, involving 34 differential flavonoid components and 64 key-acting genes; this suggests that this process is under strict genetic control. The high expression of the CHSs in Rec may be the mechanism for specific enrichment of flavonoid components in Cluster 9 in this tissue. High expression of CHIs in Pet explains the high production of flavonoids including pinocembrin, liquiritigenin, etc. in this tissue. The relative expression of F3’Hs and F3’5’Hs in Rec, Sta, and Sem was consistent with the distribution of the content of dihydroquercetin and dihydromyricetin. We further confirmed the critical role of these genes in flavonoid synthesis. These findings indicate the tissue-specific regulation of the flavonoid biosynthesis pathway and provide a molecular-level mechanism for elucidating differences in the medicinal effects of different parts of lotus.
4.3. Regulatory Role of Transcription Factors in Flavonoid Synthesis
The WGCNA analysis led to the identification of several co-expression modules associated with the flavonoid synthesis, which contained key structural genes and transcription factors involved in the regulation of flavonoid synthesis. Specifically, 26 transcription factor family members, including bHLH, ERF, and NF-YC, were found to interact with several structural genes and participating in the regulation of the synthesis of several flavonoids, including kaempferol, pinobanksin, luteoforol, and delphinidin (Table S4). MYB and bHLH have been implicated in the biosynthesis of flavonoids in Arabidopsis thaliana, maize, tomato, Sechium edulel, and ginkgo [5][65], and can synergistically interact with each other to form an MBW complex with WD40 [60,65,66]. On the other hand, GbMYBR1 modulates flavonoid synthesis in ginkgo, and its overexpression in Arabidopsis thaliana inhibits anthocyanin and flavonol content [63]. These previous reports indicate that transcription factors of flavonoid synthesis are modulated by mutual factors and may have different effects in different plants. In addition, the results indicate that transcription factor families such as WRKY, ERF, HD-Zip, ARF, C2H2, bZIP, and NF-YC regulate flavonoid synthesis [65,67].
In this study, two MYB transcription factors were identified in the yellow module which interacted with the PALs, which positively regulated the accumulation of delphinidin in Flo. Eight bHLH transcription factors were detected in the black, turquoise, magenta, and yellow modules, interacting with the FLSs, C3’Hs, PALs, CHSs, F3Hs, and ANRs and contributing to the positive regulation of kaempferol in Sta, pinobanksin and naringenin chalcone in Pet, luteoforol in Rec and delphinidin in Flo. Seven ERF transcription factors were identified in the turquoise, magenta, and yellow modules, all of which interacted with the C3’Hs, PALs, CHSs, F3Hs, ANRs, and CCoAOMTs, enhancing the accumulation of pinobanksin and naringenin chalcone in Pet, luteoforol in Rec, and delphinidin in Flo. Further analysis revealed that two NF-YC transcription factors were identified in the turquoise, magenta module, with reciprocal relationships with the C3’Hs, PALs, CHSs, F3Hs, ANRs, which positively regulated pinobanksin and naringenin chalcone in Pet, and luteoforol in Rec. Based on these findings, further functional validation and mechanistic studies are advocated to validate the present results and identify potential regulators which could not be identified via the single histology. This will elucidate the mechanism of the regulatory network of lotus metabolism.
4.4. Future Research Directions
In future, researchers need to explore the synthetic pathways of other metabolites and their regulatory mechanisms to uncover the complexity and dynamics of the metabolic regulatory network of lotus, and provide a solid scientific basis for guiding the molecular breeding and rational utilization of lotus. In addition, although some transcription factors associated with flavonoid synthesis have been identified, their specific regulatory mechanisms still need to be further verified. Specifically, through knockout or overexpression of the transcription factors by CRISPR/Cas9 gene editing technology, their specific effects on flavonoid synthesis can be clarified. In addition, the effects of environmental factors such as light, temperature, and water on the accumulation of lotus metabolites also need to be studied in depth to demonstrate how external conditions influence the metabolic regulatory network of lotus. Different tissues of lotus may have exhibit distinct developmental patterns, and thus future studies need to perform time series analyses to explore the metabolite distribution and gene expression characteristics of lotus at different developmental stages, which will provide a scientific basis to improve the management of lotus throughout its life cycle.
5. Conclusions
This systematic analysis of metabolite distribution and gene expression in the six medicinal parts of lotus identified the functional genes involved in flavonoid synthesis, providing molecular evidence to explain the phenomenon of ‘homologous and different effects’ in lotus plants. In future, analysis of the regulatory mechanism of flavonoid biosynthesis pathway and construction of the transcriptional regulatory network of flavonoids may uncover new insights into the molecular breeding of lotus plants rich in specific metabolites, and discover novel medicinal benefits of different parts of lotus. It will also provide a theoretical support for the quality control of medicinal materials to meet the market demands.
Supplementary Materials
The following supporting information can be downloaded at the website of this paper posted on Preprints.org. Table S1: Quantification table of metabolites identified by MS/MS secondary analysis; Table S2: K-means cluster analysis results; Table S3: Information on structural and interacting genes in key modules; Table S4: Information on structural genes and co-expressed transcription factors in key modules.
Author Contributions
Conceptualization, Zhibiao Yu; Data curation, Zhibiao Yu, Xiru Zhou, Yuanfang Luo and Yihao Jiang; Formal analysis, Xiru Zhou and Yuanfang Luo; Investigation, Lei Liang, Zheng Hu and Zhangfeng Ding; Methodology, Zhibiao Yu; Resources, Zhibiao Yu and Yihao Jiang; Writing – original draft, Xiru Zhou; Writing – review & editing, Zhibiao Yu and Yihao Jiang. All authors will be updated at each stage of manuscript processing, including submission, revision, and revision reminder, via emails from our system or the assigned Assistant Editor.
Funding
This research received no external funding.
Institutional Review Board Statement
Not applicable.
Informed Consent Statement
Not applicable.
Data Availability Statement
The raw sequencing data supporting the findings of this study have been deposited in the NCBI Sequence Read Archive (SRA) under the BioProject accession number PRJNA1193345. These data are publicly available and can be accessed through the NCBI SRA database.
Acknowledgments
The authors thank PANOMIX Biomedical Tech Co. for providing testing and sequencing services.
Conflicts of Interest
The authors declare no conflict of interest.
References
- Guo, H. B. Cultivation of Lotus (Nelumbo Nucifera Gaertn. Ssp. Nucifera) and Its Utilization in China. Genet Resour Crop Evol 2009, 56 (3), 323–330. [CrossRef]
- Liu, J.; Chen, S.; Liu, A. Material Basis Analysis of “Homologous and Different Effect” of Lotus Leaf and Lotus Plumule. Chinese Journal of Experimental Traditional Medical Formulae 2020, 131–139. [Google Scholar] [CrossRef]
- National Pharmacopoeia Committee. Pharmacopoeia of the People’s Republic of China, 2020th ed.; China Medical Science Press, 2020.
- On-nom, N.; Thangsiri, S.; Inthachat, W.; Temviriyanukul, P.; Sahasakul, Y.; Chupeerach, C.; Pruesapan, K.; Trisonthi, P.; Siriwan, D.; Suttisansanee, U. Seasonal Effects on Phenolic Contents and In Vitro Health-Promoting Bioactivities of Sacred Lotus (Nelumbo Nucifera). Plants 2023, 12(7), 1441. [Google Scholar] [CrossRef] [PubMed]
- State Administration of Traditional Chinese Medicine of the People’s Republic of China. Chinese Materia Medica, 1999th ed.; Shanghai Scientific & Technical Publishers, 1999.
- Chen, G.; Zhu, M.; Guo, M. Research Advances in Traditional and Modern Use of Nelumbo Nucifera : Phytochemicals, Health Promoting Activities and Beyond. Critical Reviews in Food Science and Nutrition 2019, 59 (sup1), S189–S209. [Google Scholar] [CrossRef]
- Zheng, H.; Han, L.; Shi, W.; Fang, X.; Hong, Y.; Cao, Y. Research Advances in Lotus Leaf as Chinese Dietary Herbal Medicine. Am. J. Chin. Med. 2022, 50(06), 1423–1445. [Google Scholar] [CrossRef]
- Zhang, X.; Wang, X.; Wu, T.; Li, B.; Liu, T.; Wang, R.; Liu, Q.; Liu, Z.; Gong, Y.; Shao, C. Isoliensinine Induces Apoptosis in Triple-Negative Human Breast Cancer Cells through ROS Generation and P38 MAPK/JNK Activation. Sci Rep 2015, 5(1), 12579. [Google Scholar] [CrossRef]
- Temviriyanukul, P.; Sritalahareuthai, V.; Promyos, N.; Thangsiri, S.; Pruesapan, K.; Srinuanchai, W.; Nuchuchua, O.; Siriwan, D.; On-nom, N.; Suttisansanee, U. The Effect of Sacred Lotus (Nelumbo Nucifera) and Its Mixtures on Phenolic Profiles, Antioxidant Activities, and Inhibitions of the Key Enzymes Relevant to Alzheimer’s Disease. Molecules 2020, 25(16), 3713. [Google Scholar] [CrossRef]
- Kashiwada, Y.; Aoshima, A.; Ikeshiro, Y.; Chen, Y.-P.; Furukawa, H.; Itoigawa, M.; Fujioka, T.; Mihashi, K.; Cosentino, L. M.; Morris-Natschke, S. L.; Lee, K.-H. Anti-HIV Benzylisoquinoline Alkaloids and Flavonoids from the Leaves of Nelumbo Nucifera, and Structure–Activity Correlations with Related Alkaloids. Bioorganic & Medicinal Chemistry 2005, 13 (2), 443–448. [CrossRef]
- Borgi, W.; Ghedira, K.; Chouchane, N. Antiinflammatory and Analgesic Activities of Zizyphus Lotus Root Barks. Fitoterapia 2007, 78(1), 16–19. [Google Scholar] [CrossRef]
- Gao, Z.; Liang, Y.; Wang, Y.; Xiao, Y.; Chen, J.; Yang, X.; Shi, T. Genome-Wide Association Study of Traits in Sacred Lotus Uncovers MITE-Associated Variants Underlying Stamen Petaloid and Petal Number Variations. Front. Plant Sci. 2022, 13. [Google Scholar] [CrossRef]
- Zheng, P.; Sun, H.; Liu, J.; Lin, J.; Zhang, X.; Qin, Y.; Zhang, W.; Xu, X.; Deng, X.; Yang, D.; Wang, M.; Zhang, Y.; Song, H.; Huang, Y.; Orozco-Obando, W.; Ming, R.; Yang, M. Comparative Analyses of American and Asian Lotus Genomes Reveal Insights into Petal Color, Carpel Thermogenesis and Domestication. The Plant Journal 2022, 110(5), 1498–1515. [Google Scholar] [CrossRef] [PubMed]
- Mao, T.-Y.; Liu, Y.-Y.; Zhu, H.-H.; Zhang, J.; Yang, J.-X.; Fu, Q.; Wang, N.; Wang, Z. Genome-Wide Analyses of the bHLH Gene Family Reveals Structural and Functional Characteristics in the Aquatic Plant Nelumbo Nucifera. PeerJ 2019, 7, e7153. [Google Scholar] [CrossRef]
- Qi, H.; Yu, F.; Lü, S.; Damaris, R. N.; Dong, G.; Yang, P. Exploring Domestication Pattern in Lotus: Insights from Dispensable Genome Assembly. Front. Plant Sci. 2023, 14. [Google Scholar] [CrossRef] [PubMed]
- Vasilev, N.; Boccard, J.; Lang, G.; Grömping, U.; Fischer, R.; Goepfert, S.; Rudaz, S.; Schillberg, S. Structured Plant Metabolomics for the Simultaneous Exploration of Multiple Factors. Sci Rep 2016, 6(1), 37390. [Google Scholar] [CrossRef] [PubMed]
- Want, E. J.; Masson, P.; Michopoulos, F.; Wilson, I. D.; Theodoridis, G.; Plumb, R. S.; Shockcor, J.; Loftus, N.; Holmes, E.; Nicholson, J. K. Global Metabolic Profiling of Animal and Human Tissues via UPLC-MS. Nat Protoc 2013, 8(1), 17–32. [Google Scholar] [CrossRef] [PubMed]
- Kieffer, D. A.; Piccolo, B. D.; Vaziri, N. D.; Liu, S.; Lau, W. L.; Khazaeli, M.; Nazertehrani, S.; Moore, M. E.; Marco, M. L.; Martin, R. J.; Adams, S. H. Resistant Starch Alters Gut Microbiome and Metabolomic Profiles Concurrent with Amelioration of Chronic Kidney Disease in Rats. American Journal of Physiology-Renal Physiology 2016, 310 (9), F857–F871. [CrossRef]
- He, X.-Y.; Wu, L.-J.; Wang, W.-X.; Xie, P.-J.; Chen, Y.-H.; Wang, F. Amygdalin - A Pharmacological and Toxicological Review. Journal of Ethnopharmacology 2020, 254, 112717. [Google Scholar] [CrossRef] [PubMed]
- Tauber, J. P.; Tozkar, C. Ö.; Schwarz, R. S.; Lopez, D.; Irwin, R. E.; Adler, L. S.; Evans, J. D. Colony-Level Effects of Amygdalin on Honeybees and Their Microbes. Insects 2020, 11(11), 783. [Google Scholar] [CrossRef]
- London-Shafir, I.; Shafir, S.; Eisikowitch, D. Amygdalin in Almond Nectar and Pollen – Facts and Possible Roles. Plant Syst Evol 2003, 238(1), 87–95. [Google Scholar] [CrossRef]
- Li, R.; Zhang, Q.; Liu, J.; He, L.; Huang, Q.; Peng, W.; Wu, C. Processing Methods and Mechanisms for Alkaloid-Rich Chinese Herbal Medicines: A Review - ScienceDirect. [CrossRef]
- Zhao, C.; Liu, X.; Gong, Q.; Cao, J.; Shen, W.; Yin, X.; Grierson, D.; Zhang, B.; Xu, C.; Li, X.; Chen, K.; Sun, C. Three AP2/ERF Family Members Modulate Flavonoid Synthesis by Regulating Type IV Chalcone Isomerase in Citrus. Plant Biotechnology Journal 2021, 19(4), 671–688. [Google Scholar] [CrossRef] [PubMed]
- Guodong, R.; Jianguo, Z.; Xiaoxia, L.; Ying, L. Identification of Putative Genes for Polyphenol Biosynthesis in Olive Fruits and Leaves Using Full-Length Transcriptome Sequencing. Food Chemistry 2019, 300, 125246. [Google Scholar] [CrossRef]
- Burin, T.; Grohar, M. C.; Jakopic, J.; Veberic, R.; Stajner, N.; Cesar, T.; Kunej, U.; Hudina, M. Interplay of Phenolic Compounds and Gene Expression in Phenylpropanoid and Flavonoid Pathways during Olive (Olea Europaea L. ) Ripening of ‘Leccino’ Cultivar. Scientia Horticulturae 2024, 338, 113640. [Google Scholar] [CrossRef]
- Nabavi, S. M.; Šamec, D.; Tomczyk, M.; Milella, L.; Russo, D.; Habtemariam, S.; Suntar, I.; Rastrelli, L.; Daglia, M.; Xiao, J.; Giampieri, F.; Battino, M.; Sobarzo-Sanchez, E.; Nabavi, S. F.; Yousefi, B.; Jeandet, P.; Xu, S.; Shirooie, S. Flavonoid Biosynthetic Pathways in Plants: Versatile Targets for Metabolic Engineering. Biotechnology Advances 2020, 38, 107316. [Google Scholar] [CrossRef] [PubMed]
- Jariani, P.; Shahnejat-Bushehri, A.-A.; Naderi, R.; Zargar, M.; Naghavi, M. R. Characterization of Key Genes in Anthocyanin and Flavonoid Biosynthesis during Floral Development in Rosa Canina L. International Journal of Biological Macromolecules 2024, 276, 133937. [Google Scholar] [CrossRef] [PubMed]
- Silva, G. dos S. e; Marques, J. N. de J.; Linhares, E. P. M.; Bonora, C. M.; Costa, É. T.; Saraiva, M. F. Review of Anticancer Activity of Monoterpenoids: Geraniol, Nerol, Geranial and Neral. Chemico-Biological Interactions 2022, 362, 109994. [Google Scholar] [CrossRef]
- Hong, P.; Liu, Q.-W.; Xie, Y.; Zhang, Q.-H.; Liao, L.; He, Q.-Y.; Li, B.; Xu, W. W. Echinatin Suppresses Esophageal Cancer Tumor Growth and Invasion through Inducing AKT/mTOR-Dependent Autophagy and Apoptosis. Cell Death Dis 2020, 11(7), 1–13. [Google Scholar] [CrossRef] [PubMed]
- Tian, X.; Liu, C.; Jiang, H.-L.; Zhang, Y.; Han, J.; Liu, J.; Chen, M. Cardioprotection Provided by Echinatin against Ischemia/Reperfusion in Isolated Rat Hearts. BMC Cardiovasc Disord 2016, 16(1), 119. [Google Scholar] [CrossRef]
- Zhang, C.; Lin, J.; Zhen, C.; Wang, F.; Sun, X.; Kong, X.; Gao, Y. Amygdalin Protects against Acetaminophen-Induced Acute Liver Failure by Reducing Inflammatory Response and Inhibiting Hepatocyte Death. Biochemical and Biophysical Research Communications 2022, 602, 105–112. [Google Scholar] [CrossRef] [PubMed]
- Shi, J.; Chen, Q.; Xu, M.; Xia, Q.; Zheng, T.; Teng, J.; Li, M.; Fan, L. Recent Updates and Future Perspectives about Amygdalin as a Potential Anticancer Agent: A Review. Cancer Medicine 2019, 8(6), 3004–3011. [Google Scholar] [CrossRef]
- Liang, M.; Li, X.; Ouyang, X.; Xie, H.; Chen, D. Antioxidant Mechanisms of Echinatin and Licochalcone A. Molecules 2019, 24(1), 3. [Google Scholar] [CrossRef] [PubMed]
- Wang, Z.; Zhang, Y.; Shen, Y.; Zhu, C.; Qin, X.; Gao, Y. Liquidambaric Acid Inhibits Cholangiocarcinoma Progression by Disrupting the STAMBPL1/NRF2 Positive Feedback Loop. Phytomedicine 2024, 156303. [Google Scholar] [CrossRef]
- Zhao, X.; Zhu, X.; Tao, H.; Zou, H.; Cao, J.; Chen, Y.; Zhang, Z.; Zhu, Y.; Li, Q.; Li, M. Liquidambaric Acid Inhibits the Proliferation of Hepatocellular Carcinoma Cells by Targeting PPARα-RXRα to down-Regulate Fatty Acid Metabolism. Toxicology and Applied Pharmacology 2024, 490, 117042. [Google Scholar] [CrossRef]
- Baczewska-Dąbrowska, A. H.; Dmuchowski, W.; Gozdowski, D.; Gworek, B.; Jozwiak, A.; Swiezewska, E.; Dąbrowski, P.; Suwara, I. The Importance of Prenol Lipids in Mitigating Salt Stress in the Leaves of Tilia × Euchlora Trees. Trees 2022, 36(1), 393–404. [Google Scholar] [CrossRef]
- Ren, C.; Wang, J.; Xian, B.; Tang, X.; Liu, X.; Hu, X.; Hu, Z.; Wu, Y.; Chen, C.; Wu, Q.; Chen, J.; Pei, J. Transcriptome Analysis of Flavonoid Biosynthesis in Safflower Flowers Grown under Different Light Intensities. PeerJ 2020, 8, e8671. [Google Scholar] [CrossRef]
- Elbatreek, M. H.; Mahdi, I.; Ouchari, W.; Mahmoud, M. F.; Sobeh, M. Current Advances on the Therapeutic Potential of Pinocembrin: An Updated Review. Biomedicine & Pharmacotherapy 2023, 157, 114032. [Google Scholar] [CrossRef]
- Kim, Y. W.; Zhao, R. J.; Park, S. J.; Lee, J. R.; Cho, I. J.; Yang, C. H.; Kim, S. G.; Kim, S. C. Anti-Inflammatory Effects of Liquiritigenin as a Consequence of the Inhibition of NF-κB-Dependent iNOS and Proinflammatory Cytokines Production. British Journal of Pharmacology 2008, 154(1), 165–173. [Google Scholar] [CrossRef] [PubMed]
- Gaur, R.; Yadav, K. S.; Verma, R. K.; Yadav, N. P.; Bhakuni, R. S. In Vivo Anti-Diabetic Activity of Derivatives of Isoliquiritigenin and Liquiritigenin. Phytomedicine 2014, 21(4), 415–422. [Google Scholar] [CrossRef]
- Ramalingam, M.; Kim, H.; Lee, Y.; Lee, Y.-I. Phytochemical and Pharmacological Role of Liquiritigenin and Isoliquiritigenin From Radix Glycyrrhizae in Human Health and Disease Models. Front. Aging Neurosci. 2018, 10. [Google Scholar] [CrossRef] [PubMed]
- Dong, Y.; Huang, H.; Zhao, M.; Sun-Waterhouse, D.; Lin, L.; Xiao, C. Mechanisms Underlying the Xanthine Oxidase Inhibitory Effects of Dietary Flavonoids Galangin and Pinobanksin. Journal of Functional Foods 2016, 24, 26–36. [Google Scholar] [CrossRef]
- Elangovan, B. A Review on Pharmacological Studies of Natural Flavanone: Pinobanksin. 3 Biotech 2024, 14(4), 111. [Google Scholar] [CrossRef] [PubMed]
- Escribano-Ferrer, E.; Queralt Regué, J.; Garcia-Sala, X.; Boix Montañés, A.; Lamuela-Raventos, R. M. In Vivo Anti-Inflammatory and Antiallergic Activity of Pure Naringenin, Naringenin Chalcone, and Quercetin in Mice. J. Nat. Prod. 2019, 82(2), 177–182. [Google Scholar] [CrossRef]
- Sunil, C.; Xu, B. An Insight into the Health-Promoting Effects of Taxifolin (Dihydroquercetin). Phytochemistry 2019, 166, 112066. [Google Scholar] [CrossRef] [PubMed]
- Liu, Z.; Qiu, D.; Yang, T.; Su, J.; Liu, C.; Su, X.; Li, A.; Sun, P.; Li, J.; Yan, L.; Ding, C.; Zhang, S. Research Progress of Dihydroquercetin in the Treatment of Skin Diseases. Molecules 2023, 28(19), 6989. [Google Scholar] [CrossRef]
- Shevelev, A. B.; La Porta, N.; Isakova, E. P.; Martens, S.; Biryukova, Y. K.; Belous, A. S.; Sivokhin, D. A.; Trubnikova, E. V.; Zylkova, M. V.; Belyakova, A. V.; Smirnova, M. S.; Deryabina, Y. I. In Vivo Antimicrobial and Wound-Healing Activity of Resveratrol, Dihydroquercetin, and Dihydromyricetin against Staphylococcus Aureus, Pseudomonas Aeruginosa, and Candida Albicans. Pathogens 2020, 9(4), 296. [Google Scholar] [CrossRef]
- Chen, Z.; Zhang, R.; Shi, W.; Li, L.; Liu, H.; Liu, Z.; Wu, L. The Multifunctional Benefits of Naturally Occurring Delphinidin and Its Glycosides. J. Agric. Food Chem. 2019, 67(41), 11288–11306. [Google Scholar] [CrossRef]
- Lamy, S.; Blanchette, M.; Michaud-Levesque, J.; Lafleur, R.; Durocher, Y.; Moghrabi, A.; Barrette, S.; Gingras, D.; Béliveau, R. Delphinidin, a Dietary Anthocyanidin, Inhibits Vascular Endothelial Growth Factor Receptor-2 Phosphorylation. Carcinogenesis 2006, 27(5), 989–996. [Google Scholar] [CrossRef] [PubMed]
- Wang, X.; Li, B.; Sun, S.; Liu, Q.; Zhu, J.; Zhou, X.; Zhang, H.; Wu, Q.; Wang, L. Analysis of Proanthocyanidins and Flavonols in the Seedpods of Chinese Antique Lotus: A Rich Source of Antioxidants. Food Chemistry 2023, 415, 135756. [Google Scholar] [CrossRef] [PubMed]
- Proshkina, E.; Plyusnin, S.; Babak, T.; Lashmanova, E.; Maganova, F.; Koval, L.; Platonova, E.; Shaposhnikov, M.; Moskalev, A. Terpenoids as Potential Geroprotectors. Antioxidants 2020, 9(6), 529. [Google Scholar] [CrossRef] [PubMed]
- Lin, C.; Zhang, X.; Su, Z.; Xiao, J.; Lv, M.; Cao, Y.; Chen, Y. Carnosol Improved Lifespan and Healthspan by Promoting Antioxidant Capacity in Caenorhabditis Elegans. Oxidative Medicine and Cellular Longevity 2019, 2019(1), 5958043. [Google Scholar] [CrossRef]
- Okoro, N. O.; Odiba, A. S.; Osadebe, P. O.; Omeje, E. O.; Liao, G.; Fang, W.; Jin, C.; Wang, B. Bioactive Phytochemicals with Anti-Aging and Lifespan Extending Potentials in Caenorhabditis Elegans. Molecules 2021, 26(23), 7323. [Google Scholar] [CrossRef]
- Arooj, M.; Imran, S.; Inam-ur-Raheem, M.; Rajoka, M. S. R.; Sameen, A.; Siddique, R.; Sahar, A.; Tariq, S.; Riaz, A.; Hussain, A.; Siddeeg, A.; Aadil, R. M. Lotus Seeds (Nelumbinis Semen) as an Emerging Therapeutic Seed: A Comprehensive Review. Food Science & Nutrition 2021, 9 (7), 3971–3987. [CrossRef]
- Wang, Z.; Li, Y.; Ma, D.; Zeng, M.; Wang, Z.; Qin, F.; Chen, J.; Christian, M.; He, Z. Alkaloids from Lotus (Nelumbo Nucifera): Recent Advances in Biosynthesis, Pharmacokinetics, Bioactivity, Safety, and Industrial Applications. Critical Reviews in Food Science and Nutrition 2023, 63(21), 4867–4900. [Google Scholar] [CrossRef] [PubMed]
- Yan, M.-Z.; Chang, Q.; Zhong, Y.; Xiao, B.-X.; Feng, L.; Cao, F.-R.; Pan, R.-L.; Zhang, Z.-S.; Liao, Y.-H.; Liu, X.-M. Lotus Leaf Alkaloid Extract Displays Sedative–Hypnotic and Anxiolytic Effects through GABAA Receptor. J. Agric. Food Chem. 2015, 63(42), 9277–9285. [Google Scholar] [CrossRef]
- Jung, H. A.; Jin, S. E.; Choi, R. J.; Kim, D. H.; Kim, Y. S.; Ryu, J. H.; Kim, D.-W.; Son, Y. K.; Park, J. J.; Choi, J. S. Anti-Amnesic Activity of Neferine with Antioxidant and Anti-Inflammatory Capacities, as Well as Inhibition of ChEs and BACE1. Life Sciences 2010, 87(13), 420–430. [Google Scholar] [CrossRef]
- Martínez-Vázquez, M.; Estrada-Reyes, R.; Araujo Escalona, A. G.; Ledesma Velázquez, I.; Martínez-Mota, L.; Moreno, J.; Heinze, G. Antidepressant-like Effects of an Alkaloid Extract of the Aerial Parts of Annona Cherimolia in Mice. Journal of Ethnopharmacology 2012, 139(1), 164–170. [Google Scholar] [CrossRef] [PubMed]
- Ye, J.; Hu, T.; Yang, C.; Li, H.; Yang, M.; Ijaz, R.; Ye, Z.; Zhang, Y. Transcriptome Profiling of Tomato Fruit Development Reveals Transcription Factors Associated with Ascorbic Acid, Carotenoid and Flavonoid Biosynthesis. PLOS ONE 2015, 10(7), e0130885. [Google Scholar] [CrossRef] [PubMed]
- Feller, A.; Machemer, K.; Braun, E. L.; Grotewold, E. Evolutionary and Comparative Analysis of MYB and bHLH Plant Transcription Factors. The Plant Journal 2011, 66(1), 94–116. [Google Scholar] [CrossRef]
- Pu, Y.; Wang, C.; Jiang, Y.; Wang, X.; Ai, Y.; Zhuang, W. Metabolic Profiling and Transcriptome Analysis Provide Insights into the Accumulation of Flavonoids in Chayote Fruit during Storage. Front. Nutr. 2023, 10. [Google Scholar] [CrossRef]
- Zhou, T.; Xing, Q.; Bu, J.; Han, W.; Shen, Z. Integrated Metabolomic and Transcriptomic Analysis Reveals the Regulatory Mechanisms of Flavonoid and Alkaloid Biosynthesis in the New and Old Leaves of Murraya Tetramera Huang. BMC Plant Biol 2024, 24(1), 499. [Google Scholar] [CrossRef] [PubMed]
- Su, X.; Xia, Y.; Jiang, W.; Shen, G.; Pang, Y. GbMYBR1 from Ginkgo Biloba Represses Phenylpropanoid Biosynthesis and Trichome Development in Arabidopsis. Planta 2020, 252(4), 68. [Google Scholar] [CrossRef]
- Carretero-Paulet, L.; Galstyan, A.; Roig-Villanova, I.; Martínez-García, J. F.; Bilbao-Castro, J. R.; Robertson, D. L. Genome-Wide Classification and Evolutionary Analysis of the bHLH Family of Transcription Factors in Arabidopsis, Poplar, Rice, Moss, and Algae. Plant Physiology 2010, 153(3), 1398–1412. [Google Scholar] [CrossRef]
- Naik, J.; Misra, P.; Trivedi, P. K.; Pandey, A. Molecular Components Associated with the Regulation of Flavonoid Biosynthesis. Plant Science 2022, 317, 111196. [Google Scholar] [CrossRef] [PubMed]
- Nemesio-Gorriz, M.; Blair, P. B.; Dalman, K.; Hammerbacher, A.; Arnerup, J.; Stenlid, J.; Mukhtar, S. M.; Elfstrand, M. Identification of Norway Spruce MYB-bHLH-WDR Transcription Factor Complex Members Linked to Regulation of the Flavonoid Pathway. Front. Plant Sci. 2017, 8. [Google Scholar] [CrossRef] [PubMed]
- Wang, J.; Li, G.; Li, C.; Zhang, C.; Cui, L.; Ai, G.; Wang, X.; Zheng, F.; Zhang, D.; Larkin, R. M.; Ye, Z.; Zhang, J. NF-Y Plays Essential Roles in Flavonoid Biosynthesis by Modulating Histone Modifications in Tomato. New Phytologist 2021, 229(6), 3237–3252. [Google Scholar] [CrossRef] [PubMed]
Figure 1.
The TIC chromatograms, PCA score plot and Z-score graph of six different tissues in lotus (Pet, Flo, Rec, Sta, Sem and Plu) . (A, B) The TIC chromatograms in positive and negative modes. (C, D) The PCA score plots in positive and negative modes. (E) The Z-score graph of different tissues . (The top 30 differential metabolites with high scores were presented.) .
Figure 2.
Metabolomic profiling of lotus. (A) Pie chart of secondary metabolites classification. (B) Upset plot of DAMs shared among the comparison of Flo vs. Rec, Flo vs. Pet, Rec vs. Pet, Flo vs. Sem, Rec vs. Sem, Sta vs. Rec, Sta vs. Sem, Rec vs. Plu and Sem vs. Plu. (C) K-means clustering grouped the metabolites into 9 clusters. (D) Clustering heatmap of the secondary metabolites detected in 6 lotus tissues. .
Figure 3.
Transcriptomic principal component analysis and histogram of differential molecules number of lotus. (A) The PCA score plot of 6 lotus tissues. (B) Histogram of differential molecules detected by metabolomics and transcriptomics. .
Figure 3.
Transcriptomic principal component analysis and histogram of differential molecules number of lotus. (A) The PCA score plot of 6 lotus tissues. (B) Histogram of differential molecules detected by metabolomics and transcriptomics. .
Figure 4.
KEGG enrichment bubble map. (A) Flo vs. Rec; (B) Flo vs. Pet; (C) Rec vs. Pet; (D) Flo vs. Sem; (E) Rec vs. Sem; (F) Sta vs. Rec; (G) Rec vs. Plu; (H) Sem vs. Plu; (I) Sta vs. Sem.
Figure 4.
KEGG enrichment bubble map. (A) Flo vs. Rec; (B) Flo vs. Pet; (C) Rec vs. Pet; (D) Flo vs. Sem; (E) Rec vs. Sem; (F) Sta vs. Rec; (G) Rec vs. Plu; (H) Sem vs. Plu; (I) Sta vs. Sem.
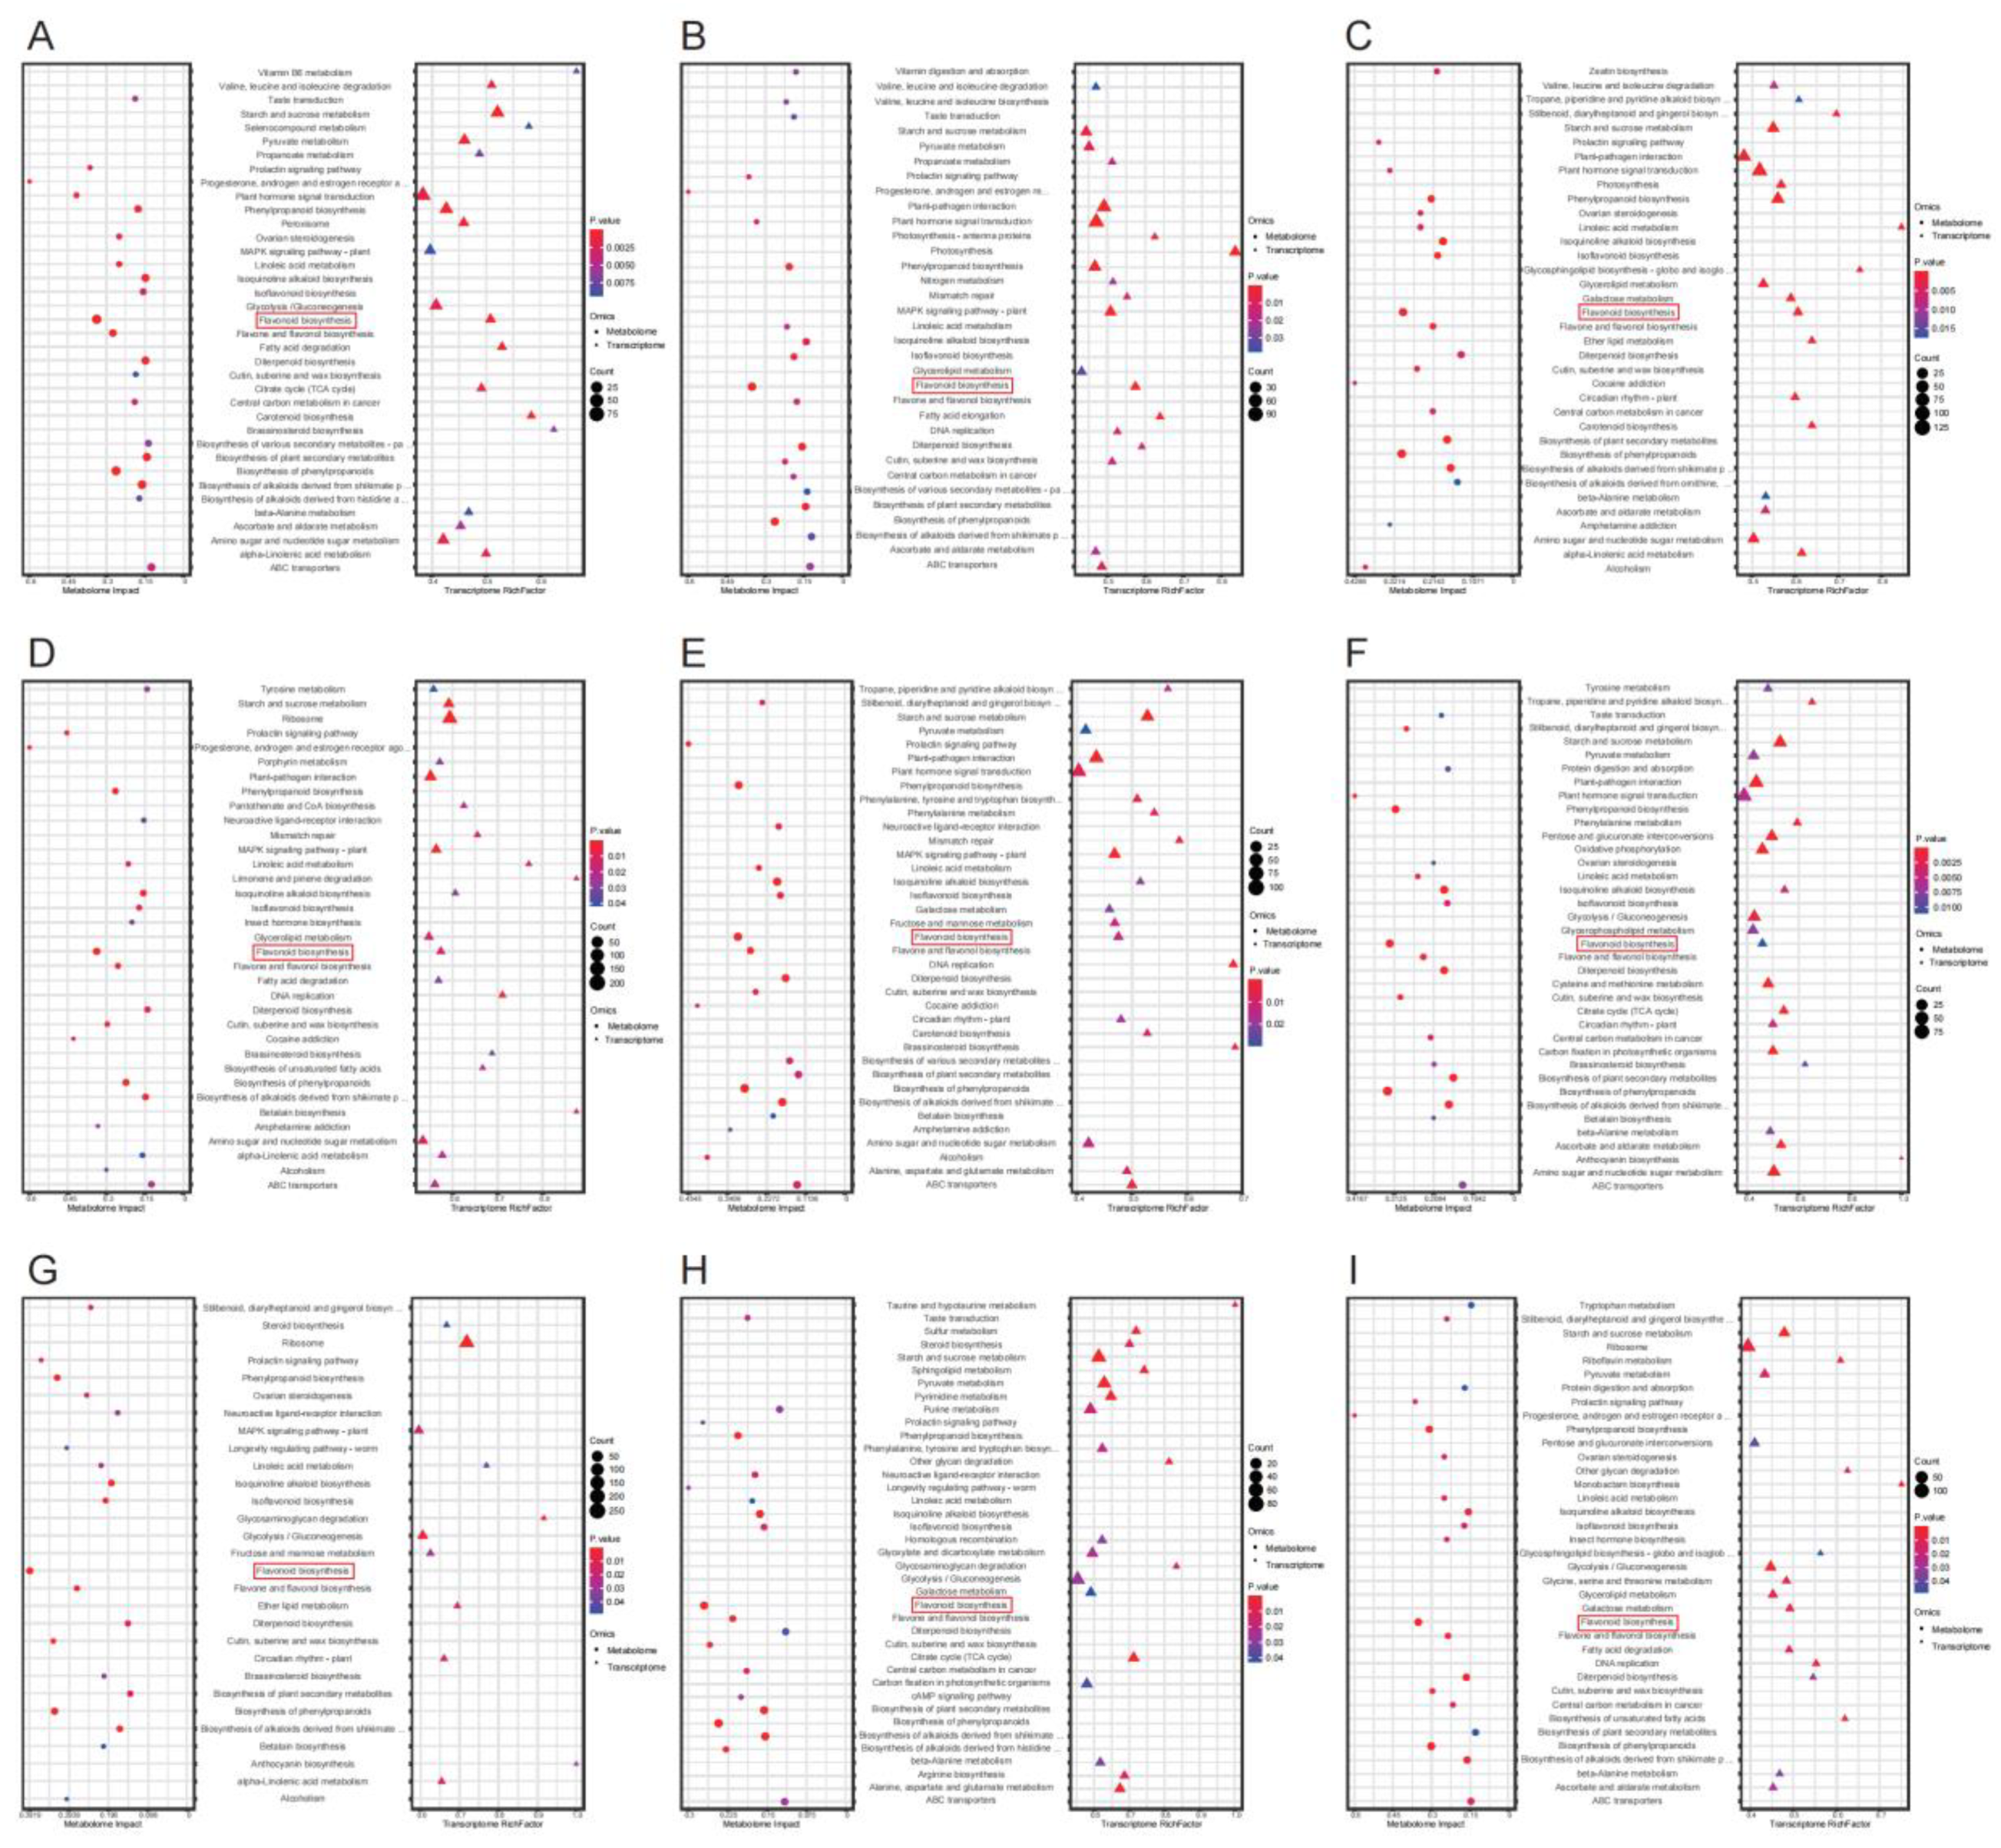
Figure 5.
KEGG enrichment histogram. (The red horizontal line indicates that the P-value is 0.01, and the blue horizontal line indicates that the P-value is 0.05.) (A) Flo vs. Rec; (B) Flo vs. Pet; (C) Rec vs. Pet; (D) Flo vs. Sem; (E) Rec vs. Sem; (F) Sta vs. Rec; (G) Rec vs. Plu; (H) Sem vs. Plu; (I) Sta vs. Sem.
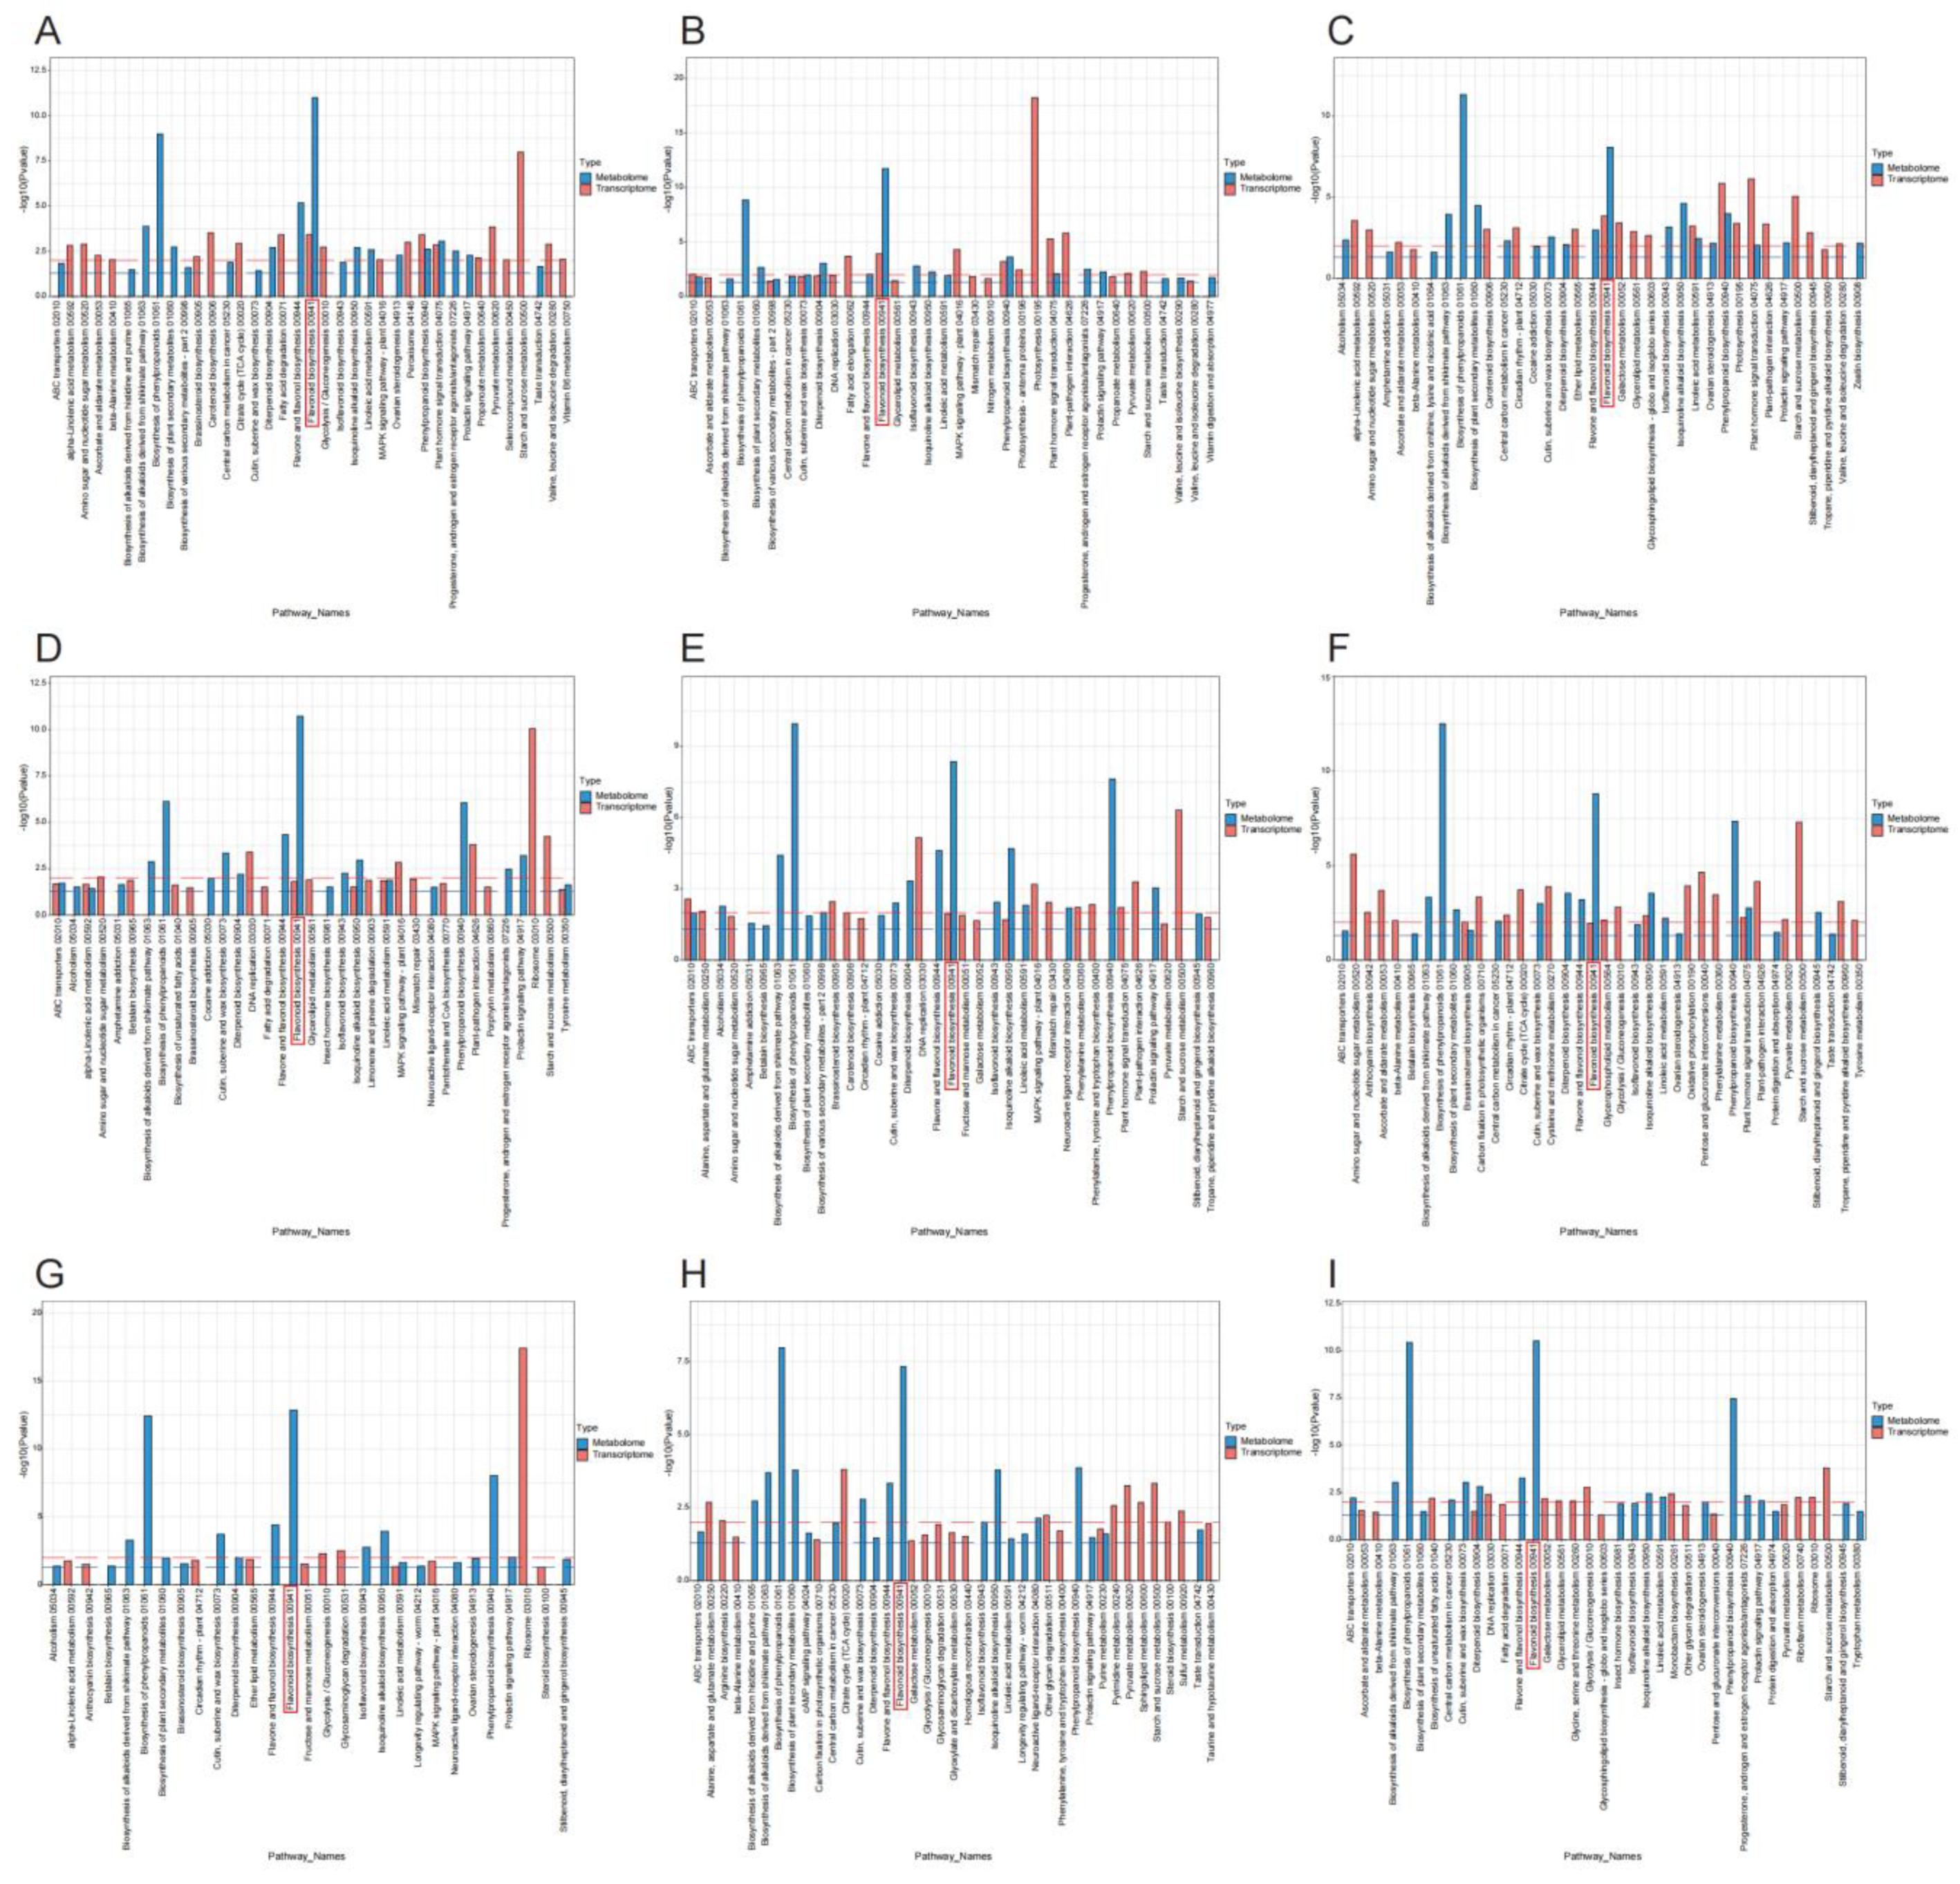
Figure 6.
Heatmap of key genes and metabolites expression in flavonoid biosynthesis pathway of 6 lotus tissues.
Figure 6.
Heatmap of key genes and metabolites expression in flavonoid biosynthesis pathway of 6 lotus tissues.
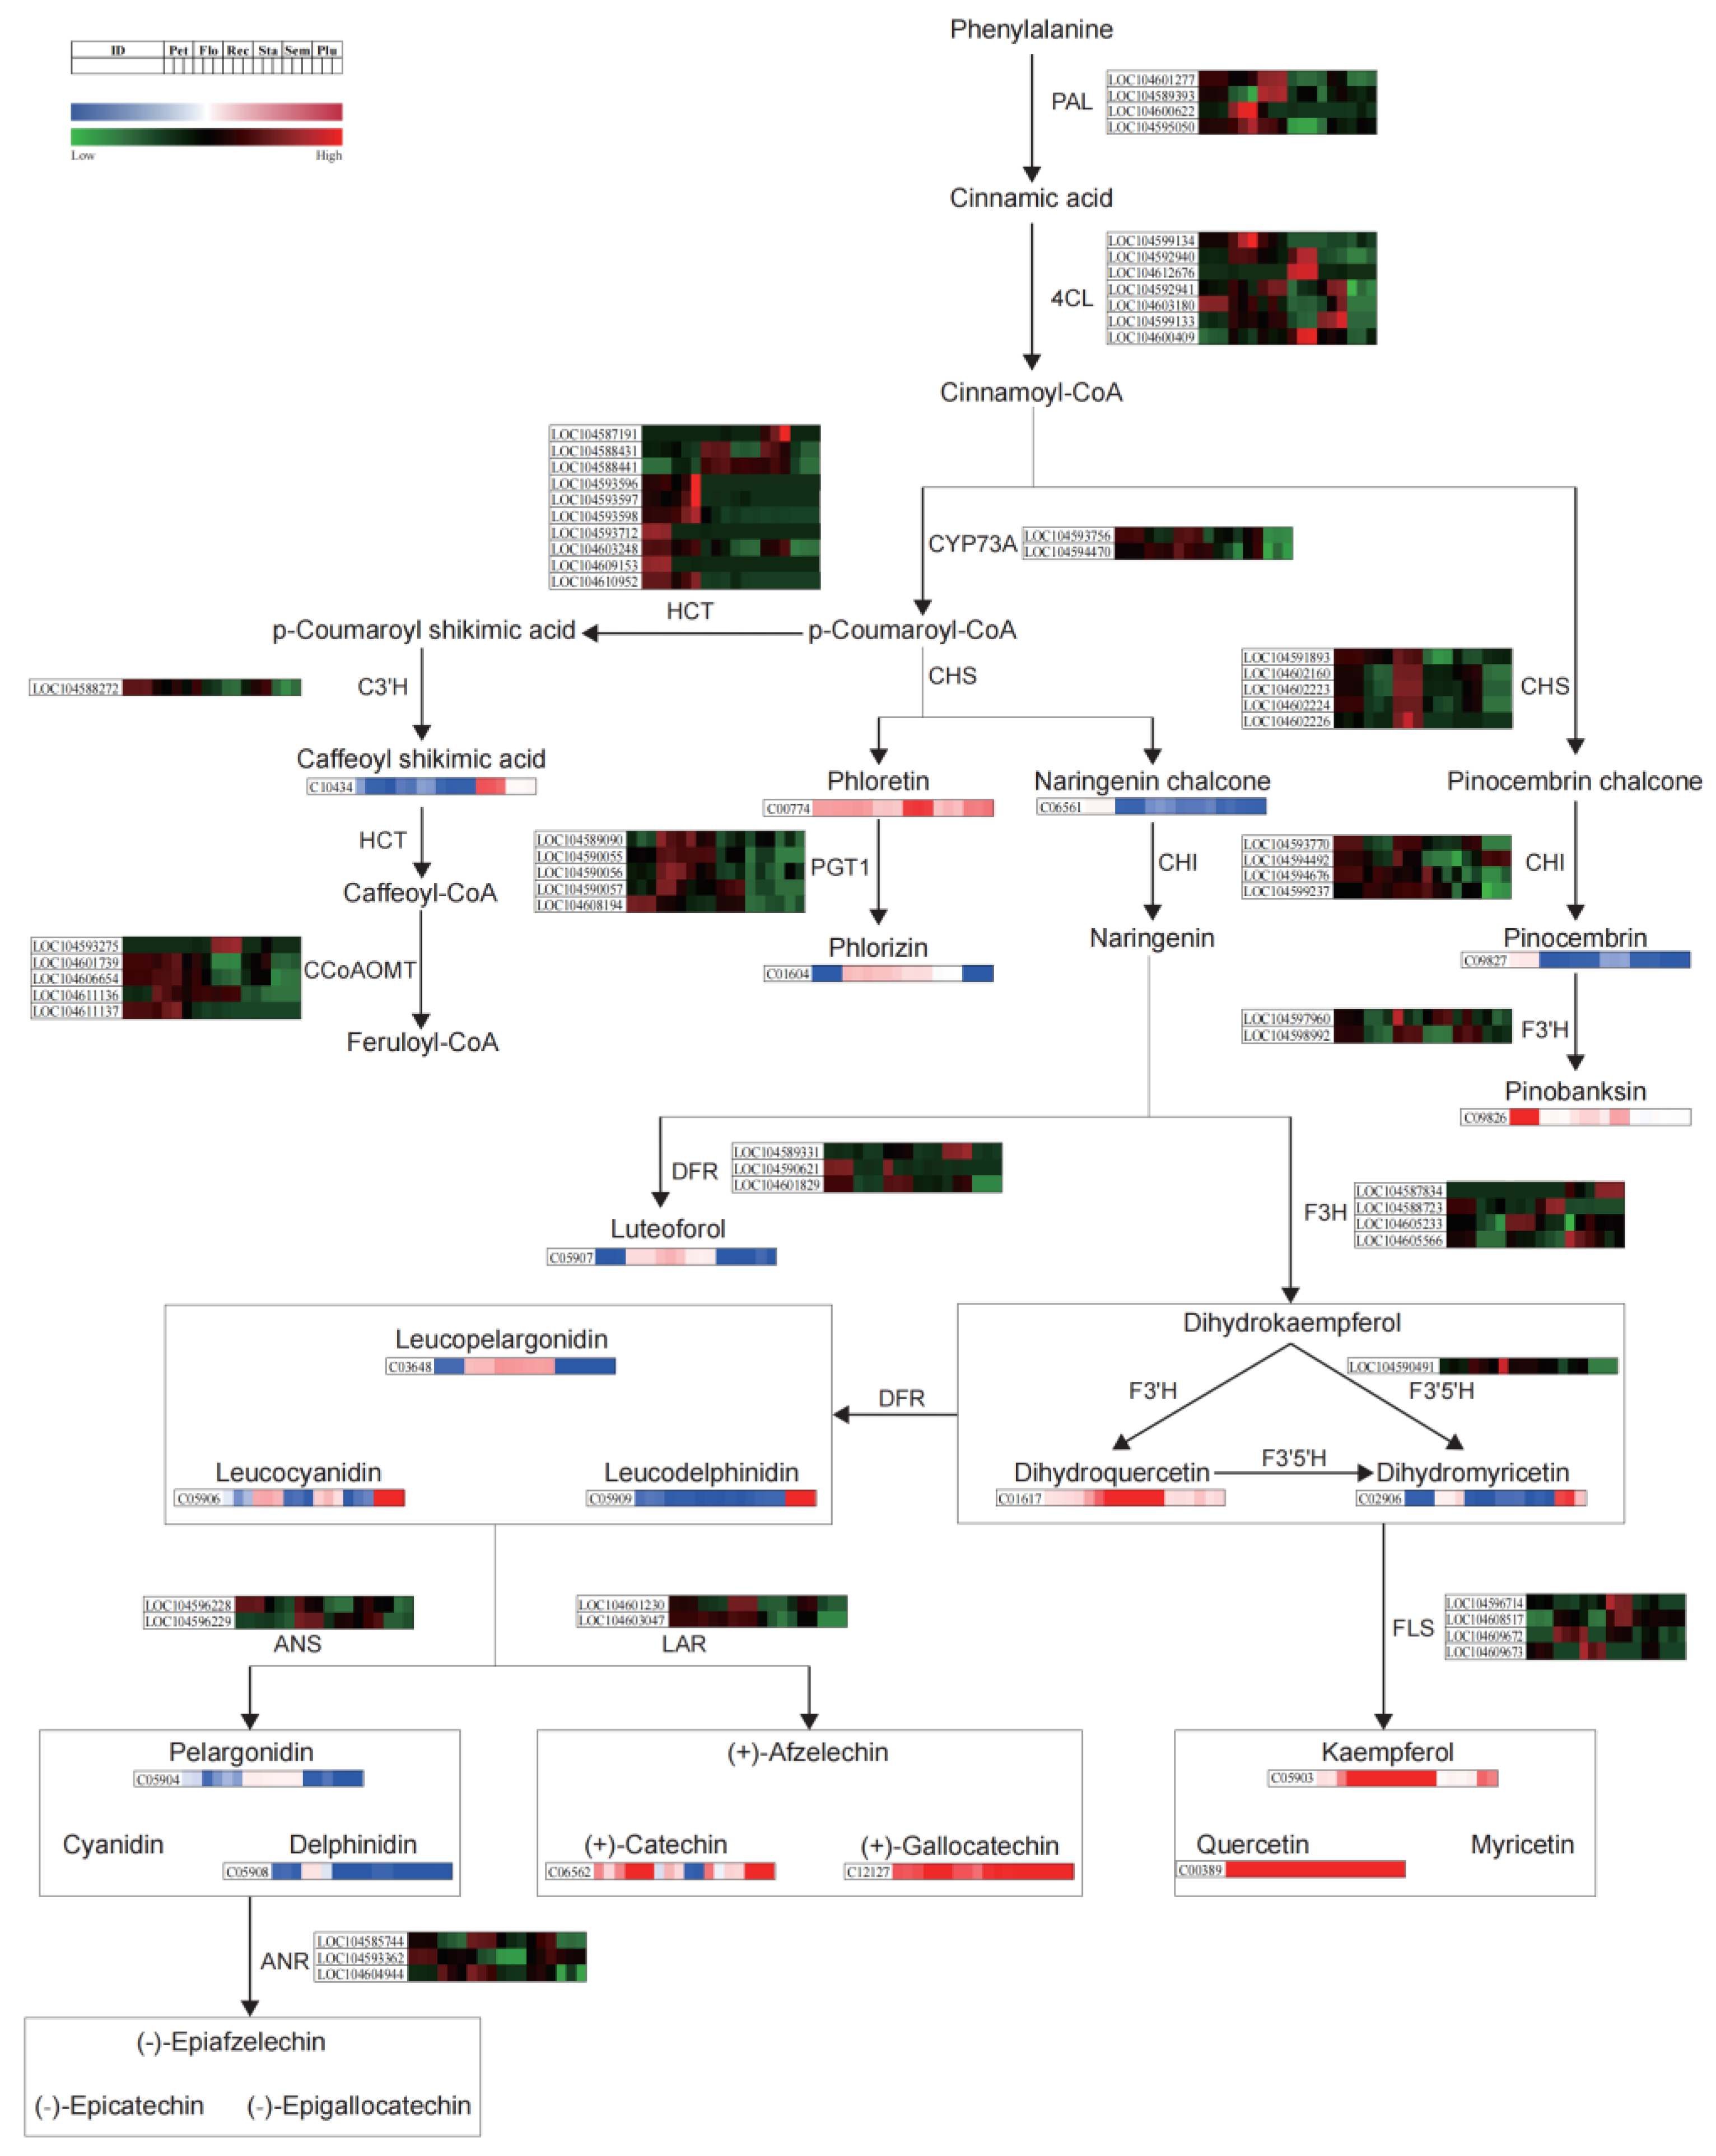
Figure 7.
Identification of genes related in flavonoid synthesis of 6 lotus tissues. (A) Heatmap of module-trait correlation between major flavonoid components and the module characteristic genes. (B) Expression of the structural gene—LOC104608517 (FLS) and its interacting genes in module MEblack. (C,D) Expression of the structural genes—LOC104603248 (HCT) , LOC104588272 (C3’H) and their interacting genes in module MEturquoise. (E-J) Expression of the structural genes—LOC104601277 (PAL) , LOC104589393 (PAL) , LOC104602160 (CHS) , LOC104602224 (CHS) , LOC104605233 (F3H) , LOC104585744 (ANR) and their interacting genes in module MEmagenta. (K) Expression of the structural gene—LOC104611136 (CCoAOMT) and its interacting genes in module MElightcyan. (L-N) Expression of the structural genes—LOC104595050 (PAL) , LOC104601739 (CCoAOMT) , LOC104606654 (CCoAOMT) and their interacting genes in module MEyellow. (O) Network diagram of transcription factors interaction with structural genes.
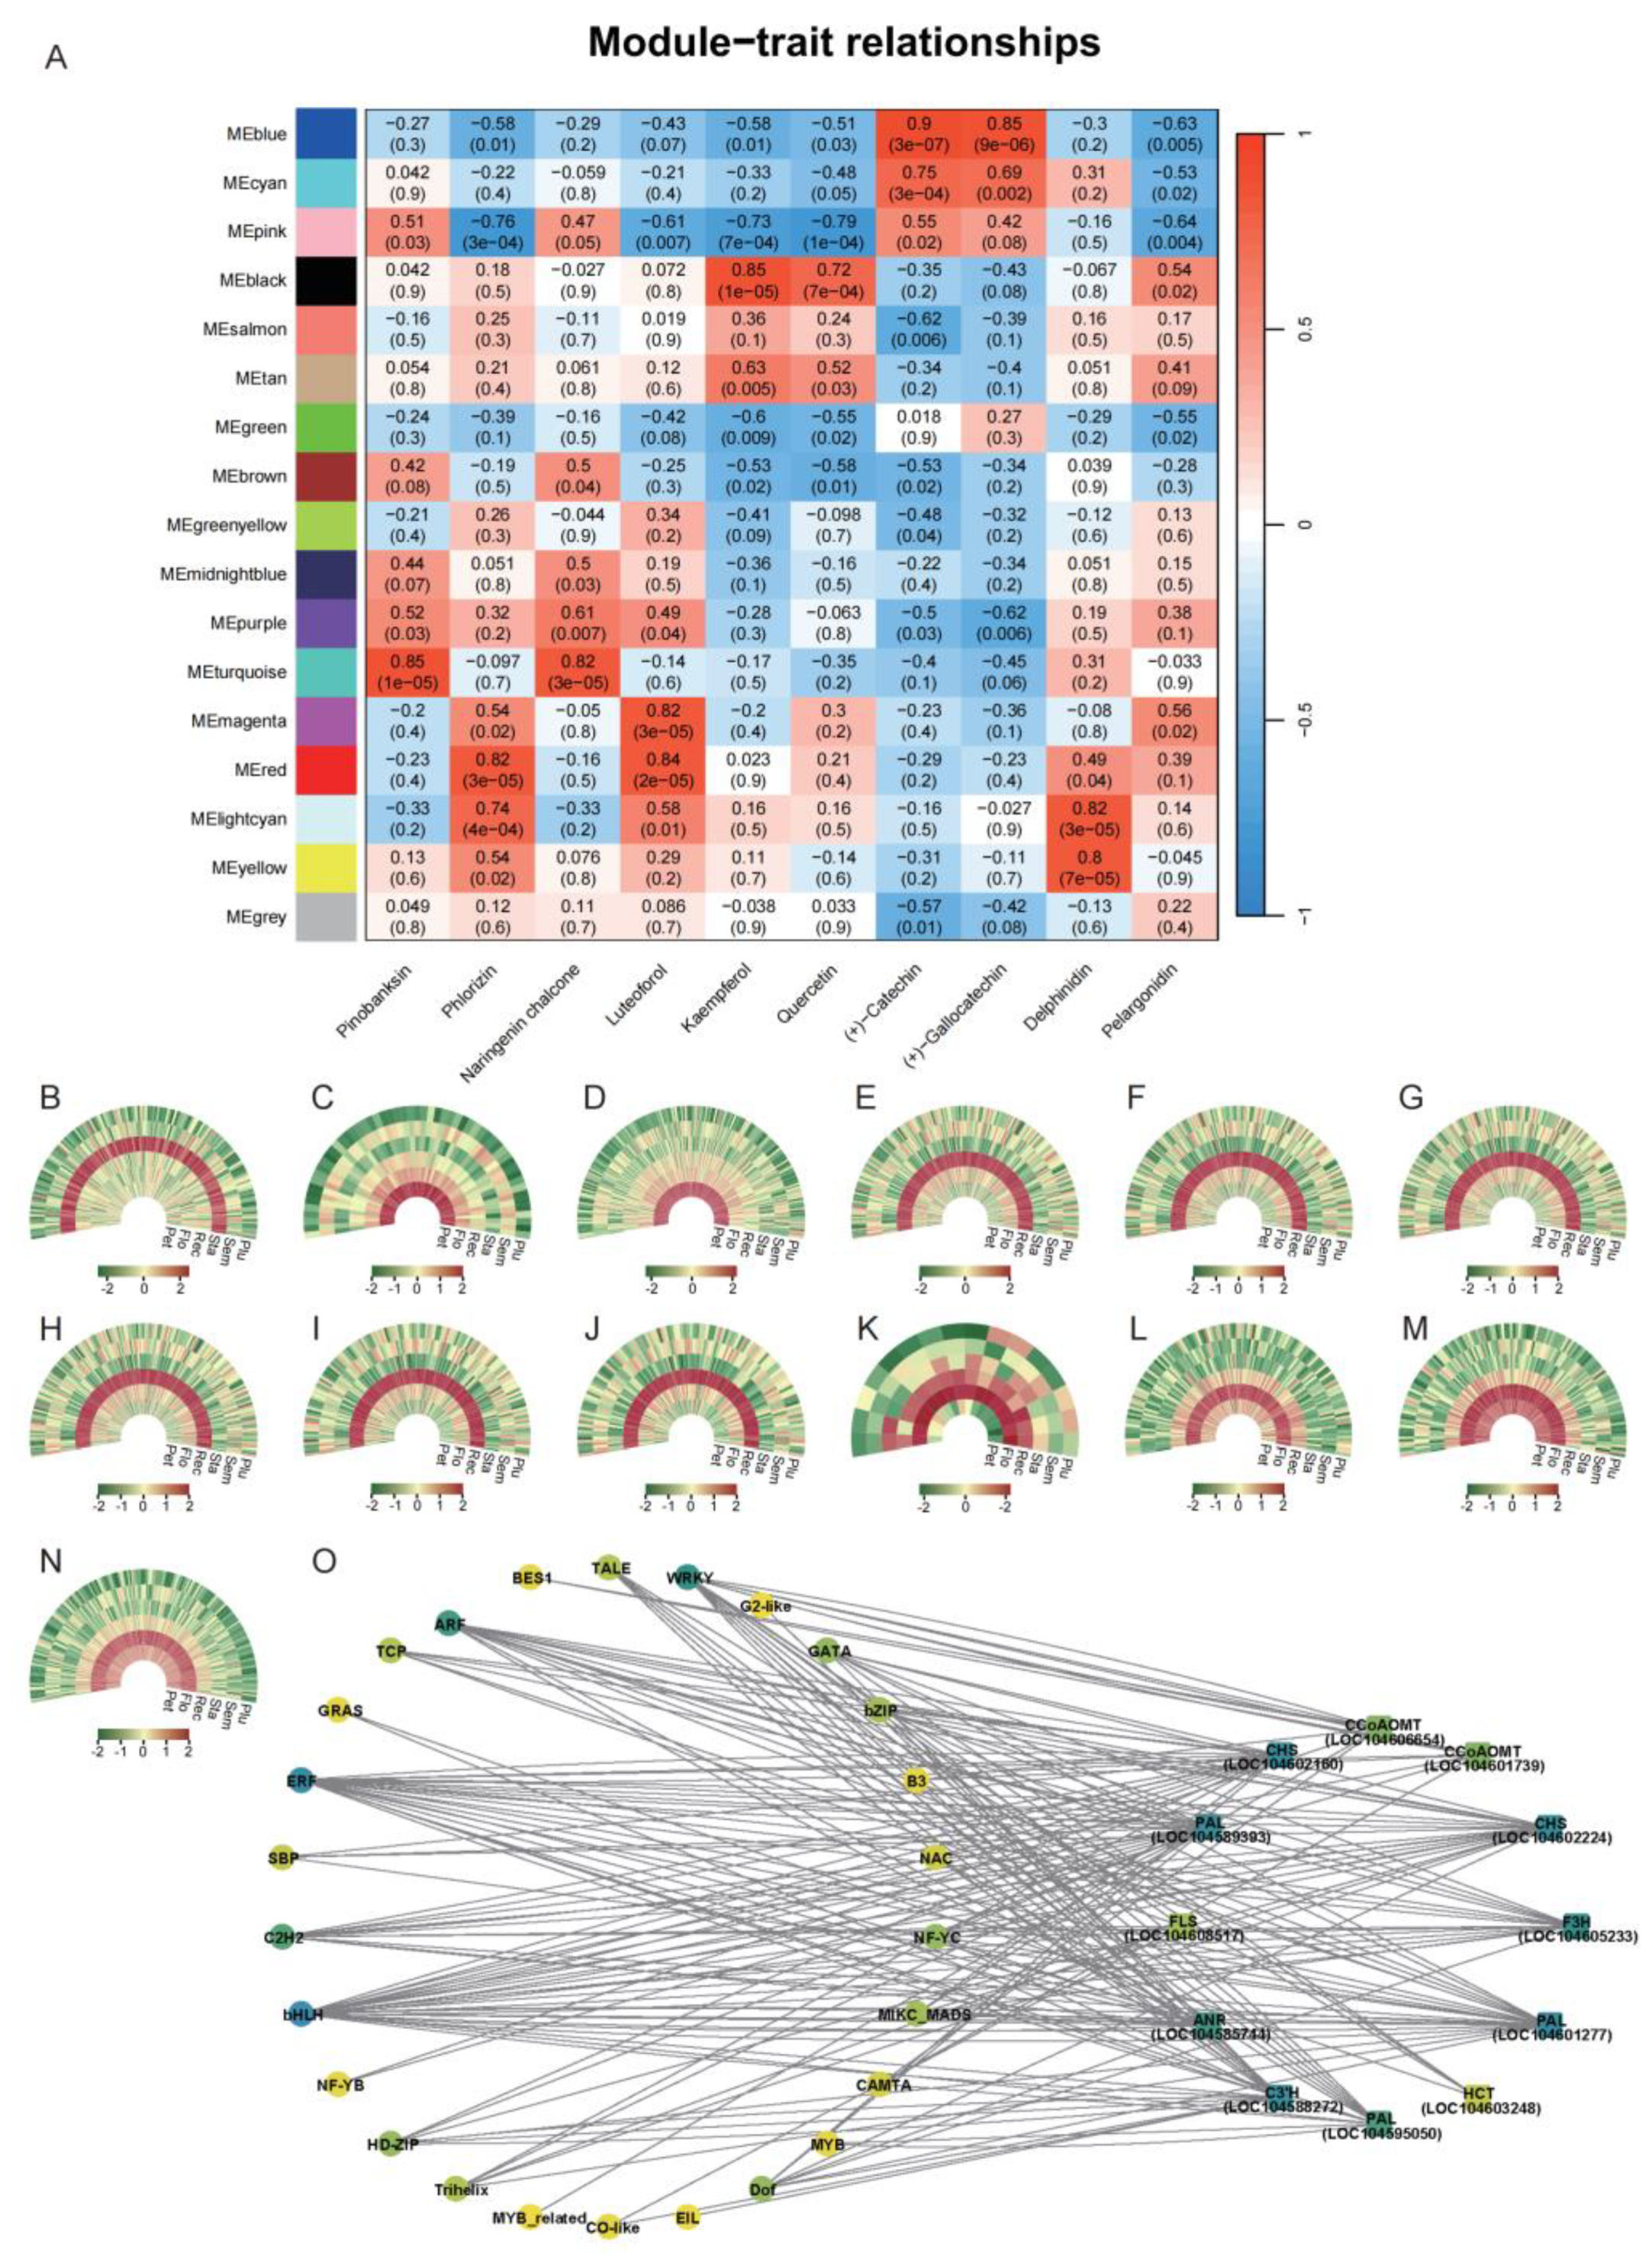

Table 1.
Quality information of transcriptome sequencing of lotus.
| Sample | Reads No. | Clean Reads No. | Clean Data (bp) | N (%) | Q30 (%) |
| Pet1 | 44796076 | 44195988 | 6663704056 | 0.004196 | 96.85 |
| Pet2 | 45964130 | 45336206 | 6825848171 | 0.004153 | 96.8 |
| Pet3 | 50239706 | 49472494 | 7454090951 | 0.007693 | 96.06 |
| Plu1 | 41582154 | 40895430 | 6151047640 | 0.007237 | 95.59 |
| Plu2 | 46805894 | 46177374 | 6952022595 | 0.007229 | 96.18 |
| Plu3 | 54998098 | 54188514 | 8134266098 | 0.007403 | 95.91 |
| Flo1 | 40858150 | 40235688 | 6066986452 | 0.006309 | 96.87 |
| Flo2 | 41037134 | 40556292 | 6118355186 | 0.006397 | 97.52 |
| Flo3 | 45648060 | 45110000 | 6801259085 | 0.006159 | 97.28 |
| Sem1 | 44918700 | 44284232 | 6680348123 | 0.006197 | 97 |
| Sem2 | 43378918 | 42815524 | 6456737375 | 0.006276 | 97.12 |
| Sem3 | 40897244 | 40409936 | 6090914512 | 0.006272 | 97.33 |
| Sta1 | 38924410 | 38349966 | 5780282858 | 0.006001 | 96.9 |
| Sta2 | 43999936 | 43409676 | 6547853705 | 0.006264 | 97.03 |
| Sta3 | 39146748 | 38586882 | 5817568921 | 0.006328 | 96.9 |
| Rec1 | 39690262 | 39175626 | 5904032544 | 0.006293 | 97.07 |
| Rec2 | 45727084 | 45109178 | 6799917596 | 0.006294 | 97.03 |
| Rec3 | 52071532 | 51358160 | 7742502649 | 0.006194 | 96.98 |
| Total | 800684236 | 789667166 | 1.18988E+11 | - | - |
Table 2.
Module identification.
| Module | Structural genes | Interacting genes number | Strongly correlated flavonoids |
| MEblack | LOC104608517 (FLS) | 154 | kaempferol |
| MEturquoise | LOC104603248 (HCT) | 54 | pinobanksin, naringenin chalcone |
| MEturquoise | LOC104588272 (C3’H) | 199 | pinobanksin, naringenin chalcone |
| MEmagenta | LOC104601277 (PAL) | 189 | luteoforol |
| MEmagenta | LOC104589393 (PAL) | 173 | luteoforol |
| MEmagenta | LOC104602160 (CHS) | 181 | luteoforol |
| MEmagenta | LOC104602224 (CHS) | 178 | luteoforol |
| MEmagenta | LOC104605233 (F3H) | 139 | luteoforol |
| MEmagenta | LOC104585744 (ANR) | 116 | luteoforol |
| MElightcyan | LOC104611136 (CCoAOMT) | 15 | delphinidin |
| MEyellow | LOC104595050 (PAL) | 131 | delphinidin |
| MEyellow | LOC104601739 (CCoAOMT) | 133 | delphinidin |
| MEyellow | LOC104606654 (CCoAOMT) | 198 | delphinidin |
Table 3.
The top 10 nodes calculated based on the MCC algorithm.
| Structural genes | Interacting transcription factors | Strongly correlated flavonoids |
| LOC104601277 (PAL) | bHLH,ERF,NF-YC | luteoforol |
| LOC104602224 (CHS) | bHLH,ERF,NF-YC | luteoforol |
| LOC104589393 (PAL) | bHLH,ERF,NF-YC | luteoforol |
| LOC104588272 (C3’H) | bHLH,ERF,NF-YC | pinobanksin, naringenin chalcone |
| LOC104585744 (ANR) | bHLH,ERF,NF-YC | luteoforol |
| LOC104595050 (PAL) | bHLH,ERF | delphinidin |
| LOC104608517 (FLS) | bHLH | kaempferol |
Disclaimer/Publisher’s Note: The statements, opinions and data contained in all publications are solely those of the individual author(s) and contributor(s) and not of MDPI and/or the editor(s). MDPI and/or the editor(s) disclaim responsibility for any injury to people or property resulting from any ideas, methods, instructions or products referred to in the content. |
© 2025 by the authors. Licensee MDPI, Basel, Switzerland. This article is an open access article distributed under the terms and conditions of the Creative Commons Attribution (CC BY) license (http://creativecommons.org/licenses/by/4.0/).
Copyright: This open access article is published under a Creative Commons CC BY 4.0 license, which permit the free download, distribution, and reuse, provided that the author and preprint are cited in any reuse.


