Submitted:
27 January 2025
Posted:
28 January 2025
You are already at the latest version
Abstract
This paper aims to explore the impact of color presentation on the learning environment, especially its effect on cognitive load. The research background section introduces the definition of the physical learning environment and its importance in online and traditional classrooms. Through literature review, this paper clarifies the potential effects of color presentation on cognitive load in different learning environments and points out the shortcomings of existing studies. In this paper, a structural equation model is designed to analyze the relationship between classroom light source, brightness, ceiling height, equipment situation, electronic equipment resolution, brightness and color environment and multimedia color presentation. The research methods section describes the experimental design, participant selection criteria, and data collection process in detail. The research order and the experiment order of this paper systematically show the whole process from literature review to data analysis. The results of this study will provide a theoretical basis for optimizing the color design in the teaching environment to reduce the cognitive load of students and improve the learning effect.
Keywords:
physical learning environment
; color presentation
; cognitive load
; multimedia learning
; structural equation modeling
1. Introduction
With the advent of the electronic age, the traditional classroom learning has gradually transformed into two forms of classroom teaching and online courses. This shift raises an important question: How do different physical learning environments affect the level of cognitive load of learners? Cognitive load theory (CLT) suggests that physical features of the learning environment, such as color presentation, may significantly affect students' cognitive load and learning outcomes. Therefore, understanding these factors is essential to optimize instructional design.
This study followed a systematic research process to ensure the reliability and validity of the results. First of all, we review the relevant theories and previous research results through literature review to provide a theoretical basis for the study. Then, in the research design stage, the research questions, assumptions and methodology are defined. Subsequently, in the experimental design stage, the specific experimental process was planned, and the appropriate participants and experimental materials were selected. In the data collection stage, the necessary data were obtained through the implementation of questionnaires and experiments. Finally, the data analysis phase conducted an in-depth analysis of the data using structural equation modeling and interpreted the findings based on the results of the analysis. In the part of discussion and conclusion, the significance of the results is discussed, and suggestions and future research directions are put forward.
The value of this study is to provide empirical data on the effect of color presentation on cognitive load in different learning environments. Provides guidance for educators and curriculum designers to create more effective learning environments. Enriching cognitive load theory with particular application to multivariate environments. This study systematically analyzed the combined effects of various physical learning environment factors on cognitive load. A structural equation model was developed and validated to predict and explain the relationship between color presentation and cognitive load. Based on the results of the study, specific suggestions are made to improve the color design and environmental layout in teaching practice.
2. Literature Review
Choi believes that the physical learning environment refers to the place where teaching and learning take place, and should be regarded as a causal factor or an independent factor affecting cognitive load. Therefore, both online teaching and classroom teaching will affect the overall level of cognitive load. There are studies comparing these two modes of education, online or classroom learning. In the study of Andrade et al., the term physical learning environment is used to indicate an online or classroom-based course. The physical learning environment is the location where learning takes place. This location can be online or traditional classroom-based. Traditional classroom learning has been transformed into classroom teaching and online courses with the advent of the electronic age. With the option of online courses, it is necessary to understand how the physical learning environment affects the cognitive load level of learners[1]. Students need an optimal environment to reduce the level of cognitive load, and the influence of different physical learning environments on cognitive load is an important issue to be considered in the study of cognitive load[2]. In addition, the study compared how students would learn in two types of physics learning environments, online learning presented by academic content or lectures in video or text form, and traditional classroom learning course content delivered by a teacher in a physical classroom to support the measurement of cognitive load in different physics learning environments. Recent studies have also shown that appropriate context or design, presentation and location of speech are essential to students' cognitive ability, thereby reducing the level of external cognitive load and increasing effective learning. Therefore, the presentation of educational content should be delivered in a way that promotes student learning, thereby reducing the cognitive load that may be caused by learner learning[3]. Choi believes that the physical learning environment should be a separate factor in the CLT model to affect cognitive load and learning. The significance of this factor for learning and its impact on cognitive load need further study. In addition, Greer, Crutchfield, and Woods indicate that further testing of how cognitive load levels are affected by the physical learning environment is needed[4]. Previous studies have focused on the correlation between CLT and online learning, and noted that the color environment of learning tasks may be an important factor in external load.
3. Methods
This study used quantitative research methods and experimental design to explore the effect of color presentation on cognitive load in different physics learning environments. Data were collected through a questionnaire, the design of which was based on previous literature and theoretical frameworks. After being cleaned and coded, the collected data were subjected to structural equation modeling analysis using AMOS software to handle complex multivariate data. Model fitting indicators include chi-square freedom ratio (χ ²/DF), RMSEA, CFI, TLI and IFI. This study aims to answer the following questions: How do different physical learning environments, such as online learning and traditional classroom, affect students' cognitive load? How does color presentation affect cognitive load as an independent factor in these environments? How can learning environments be optimized by adjusting color presentation to reduce cognitive load and improve learning outcomes?
3.1. Participants
The participants of this study were 247 primary school teachers (121 males and 126 females) from the capital cities of China, including 4 teachers aged 25 years and below, 71 teachers aged 26-35 years, 109 teachers aged 36-45 years, 55 teachers aged 46-55 years, and 8 teachers aged 56 years and above, including college, undergraduate and master's degree, and their length of service was also different. As shown in Table 1.
3.2. Process
The specific execution of the experiment is divided into several key steps. The first is the preparation stage of the pre-experiment, in which the experimental conditions and materials are determined. This was followed by a participant recruitment phase in which participants were carefully selected based on established criteria. Then it enters the experimental implementation stage, allowing participants to contact multimedia teaching content in different color environments. In the data recording stage, the participants' responses and questionnaire answers were collected in detail. In the subsequent stage of data collation, the collected data were cleaned and coded for subsequent analysis. Finally, in the stage of model construction and evaluation, the structural equation model is established by using AMOS software, and the fitting evaluation of the model is carried out to ensure the accuracy and scientificity of the research results.
3.3. Materials
Experimental materials included multimedia instructional content, which was presented to participants in different color environments. The change of color environment includes light source, brightness, ceiling height, equipment situation, resolution, brightness and color of electronic equipment.
4. Analysis
In order to better display the color presentation of multimedia learning and further enhance the effect of color presentation, we first need to study the main factors that will have a significant impact on the color presentation of multimedia learning materials. The study uses structural equation modeling (SEM) to explore the factors that affect the color presentation of multimedia learning. SEM is a statistical method that has been increasingly used in scientific research in the social sciences in recent years. The most important reason for the spread of this statistical technique is that the direct and indirect relationships between causal variables can be measured by a single model[5]. Structural equation modeling is a statistical method used to test the relationship between observed and latent variables. An observed variable is a measured variable in the data collection process, and a latent variable is a variable that is measured by connecting to an observed variable. Structural equation modeling can confirm the correspondence of theoretical relational data, and it can be said that structural equation modeling is more suitable for testing hypotheses than other methods[6]. Structural equation modeling consists of a set of linear equations, and the key to regression analysis is to determine how much of the change in the dependent variable is explained by one or more independent variables. While multiple regression analysis is applied to observed variables, structural equation modeling, unlike regression, is a statistical analysis technique that allows research hypotheses to be tested in a single process by modeling complex relationships between many observed and latent variables. In traditional regression analysis, only direct effects can be detected. However, in the structural equation modeling approach, the direct and indirect effects are put together. The purpose of this study is to explore the factors that affect the color presentation effect of multimedia learning, so as to lay the foundation for the influence of color presentation of multimedia learning materials on pupils' cognitive load.
4.1. Preset of Influencing Factors of Color Presentation
Color is often in a dynamic environment, with extremely rich changes, and its changes are affected by many factors[7]. The visual effect of a color is the result of the interaction of its inherent color, the color of the light source and the main color of the environment. All visual colors, in addition to the inherent color of the object itself, will be affected by the light source color and environmental color[8]. The color presentation of multimedia learning is no exception, and its color presentation will also be affected by the light source color and environmental color. In this section, the study of the factors affecting the color presentation is based on the three main factors affecting the color presentation, and the factors affecting the color presentation of multimedia learning materials are presupposed.
4.1.1. Ambient Color
Multimedia learning takes place in the classroom. The color of the physical learning environment in the classroom affects the color presentation of multimedia. 1. The color environment in the classroom: 1-1 colored walls; 1-2 colored curtains; 1-3 Color environment in the classroom.
4.1.2. Playback Equipment
As the inherent color of the object, the playing equipment of the multimedia learning materials will affect the color presentation effect. The equipment is the influencing factor directly related to the color presentation of the multimedia learning materials. Six influencing factors are set in the equipment factor: 2-1 equipment quantity; 2-2 equipment advancement; 2-3 electronic screen; 2-4 projection equipment; 2-5 Resolution of electronic equipment; 2-6 Brightness of electronic devices.
4.1.3. Light Source Color
The light source of the classroom as the light source color affects the color presentation of multimedia learning materials[9]. The color of multimedia learning materials is presented under the screen of the equipment. Another inevitable factor is the color of the light source in the classroom. The color of the light source has a certain impact on the color of multimedia learning materials. It is assumed that the color of the classroom light source will also have an impact on the color presentation of multimedia learning materials. 3. Classroom light source: 3-1 classroom light source adjustment; 3-2 classroom light source cold and warm; In addition, the brightness of the light source is also related to the color of the light source. The visibility of all colors comes from the light source. Multimedia learning materials may be displayed on a luminous electronic screen or on a non-luminous projection screen. In both cases, it is necessary to assume that the brightness of the classroom will affect the color presentation of multimedia learning materials. 4. Classroom brightness: The brightness of the classroom also acts on the color of the multimedia learning materials. The brightness of the classroom acts on the color of the learning materials will change the color brightness. 4-1 Brightness adjustment of the classroom; 4-2 The brightness of the classroom.
4.1.4. Classroom Ceiling Height
The height of the classroom ceiling also has a certain impact on the color reflection of multimedia learning materials, and the height of the classroom ceiling determines the intensity of reflection. Influence factor 5. Height factor: 5-1 The ceiling height of the classroom should be higher than 3 meters; 5-2 The ceiling height of the classroom is less than 3 meters, which will produce reflective effect.
4.2. Design of Survey Tools for Influencing Factors of Color Presentation
4.2.1. Questionnaire design of influencing factors
The questionnaire is designed according to the preset influencing factors in the first section: (see Appendix A)
- (1)
- Color environment in the classroom: 1-1 colored walls; 1-2 colored curtains; 1-3 Color environment in the classroom;
- (2)
- Equipment: 2-1 Quantity of equipment; 2-2 Equipment advancement; 2-3 Electronic screen; 2-4 Projection equipment; 2-5 Resolution of electronic equipment; 2-6 Brightness of electronic equipment;
- (3)
- Classroom light source: 3-1 classroom light source adjustment; 3-2 The light source of the classroom is cold and warm;
- (4)
- Classroom brightness: 4-1 classroom brightness adjustment; 4-2 The brightness of the classroom.
- (5)
- Height factor: the ceiling height of 5-1 classroom is higher than 3 meters; 5-2 The ceiling height of the classroom is less than 3 meters, which will produce reflective effect.
Based on the above predicted variables, the following assumptions are proposed:
H1: The classroom light source has an effect on the color rendering effect.
H2: The brightness of the classroom has an impact on the color rendering effect.
H3: The ceiling height has an effect on the color rendering effect.
H4: The device has an effect on the color rendering.
H5: The device resolution has an effect on the color rendering.
H6: The brightness of electronic equipment has an effect on the color rendering effect.
H7: The indoor color environment has an impact on the color presentation effect.
H8: Teachers' requirements for color elements have an impact on the color presentation effect.
The questionnaire was designed according to the research hypothesis (see Appendix A), and the subjects of the questionnaire on the influencing factors of color presentation were primary school teachers. This is because in primary school classroom subject teaching, although primary school students learn through learning materials, the users of multimedia learning materials are teachers, and most of the producers of commonly used learning materials (such as PPT) are teachers. What type of multimedia equipment is used to play learning materials, under what lighting conditions to play learning materials, and what classroom environmental factors will affect the color presentation of multimedia learning materials, and so on, are all issues that teachers can intuitively feel, so the object of this survey on the factors affecting the color presentation of learning materials is primary school teachers.
The questionnaire included 4 latent variables and 27 questions. The questionnaire was in the form of a seven-level Richter scale. Each question was scored from 1 to 7 points from "strongly disagree" to "strongly agree".
4.2.2. Reliability Test of the Questionnaire on Influencing Factors
Reliability analysis is also known as reliability analysis. In order to ensure the accuracy of the measurement results, it is necessary to analyze the reliability of the valid data in the questionnaire before analysis. The α coefficient of Cronbach's is used for analysis. As shown in Table 2, the α coefficient of Cronbach's is 0.930, which is greater than 0.9, proving that the reliability coefficient of the scale items is relatively high, and the survey data is relatively reliable. The reliability coefficient of the research data is higher than 0.9, indicating that the reliability of the data is of high quality and can be used for further analysis.
4.2.3. Validity Test of the Questionnaire on Influencing Factors
Validity was tested using the KMO and Bartlett tests. In general, the smaller the significance level of the Bartlett test (P < 0.05), the more likely there was a meaningful relationship between the primary variables. It can be seen from Table 3 below that the significance of Bartlett sphericity test is less than 0.05; the KMO value is 0.829, and the KMO value is greater than 0.8. The research data is very suitable for extracting information (reflecting good validity from the side), and the data is suitable for factor analysis.
Exploratory factor analysis was further carried out. According to the extraction principle that the default eigenvalue of the principal component method in factor extraction is greater than 1, as shown in Table 4, factor extraction was carried out on the data collected from the questionnaire. The standard was that the default eigenvalue was greater than 1. Nine common factors were extracted, and the cumulative variance contribution rate was greater than 60%. The extracted explanatory degree was good, indicating that the extracted factors were effective.
4.2.4. Revision of the Questionnaire on Influencing Factors
The factor loading matrix is established, which reflects the degree of correlation between the original variables and the factors. In order to more accurately interpret and name each principal factor, the factor loading matrix is orthogonally rotated using the maximum variance method. When selecting the measurement items, the factor load value is used as the standard of retention and elimination, the factor load matrix is established, the factor load less than 0.5 is eliminated, and finally the items in the same column in the factor arrangement are classified into the same category. Among them, the factor loads of device 2 and device 5 are relatively low, so they are deleted, as shown in Table 5.
After eliminating the items, the questionnaire is divided into nine aspects, and the effect of factor analysis is good. Each index passed the KMO and Bartlett test, and the extracted factor explained variance was greater than 60%, each factor load was greater than 0.5, the dimension division was discriminative, and the items under the same dimension were consistent, so it met the requirements, indicating that the data had good validity, as shown in Table 6.
4.3. Confirmatory Factor Analysis
First of all, the fitting of the confirmatory factors is analyzed, and most of the indicators have good fitting effect. Through the test value, it shows that the effect is good, as shown in Table 7.
Generally speaking, in confirmatory factor analysis, the standardized factor load should be greater than 0.5, the combined reliability CR should be greater than 0.6, and the mean extraction variance AVE should be greater than 0.5, which means that the construct validity of the survey is good. According to the table, the fitting degree of confirmatory factor analysis is in line with the ideal value. According to the table, it can be seen that each topic and dimension are in line with the standard, indicating that the data have good validity, as shown in Table 8.
Finally, the square root of the AVE of the dimension is compared with the correlation coefficient between the dimensions. According to Table 9, it can be seen that the discriminant validity is analyzed. For Factor1, Factor2, Factor3, Factor4, Factor5, Factor6, Factor7, Factor8 and Factor9, the square root mean of AVE is greater than absolute value of the inter-factor correlation coefficient, which means that it has good discriminant validity. The intra-dimension correlation was greater than inter-dimension correlation, indicating that the data had good discriminant validity. To sum up, the reliability and validity of the data are good and suitable for further analysis[10].
4.4. Multiple Regression Analysis
In descriptive statistical analysis, the average
value and standard deviation are generally used to measure the index level of
each variable. The higher the average value, the higher the average level of
the sample for this indicator. The dispersion trend is used to describe the
degree of data dispersion in the data distribution. For example, the standard
deviation indicates the difference between different samples on the same
indicator. The higher the score, the higher the agreement[11]. It can be seen from the following table that
the scores of all aspects are high, indicating that the subjects agree with it,
as shown in the analysis described in Table 10.
Correlation analysis refers to the process of describing and analyzing the nature of the relationship between two or more variables and their degree of correlation. Mark * in the upper right corner of the correlation coefficient, indicating that there is a relationship; Otherwise, it doesn't matter. When the correlation coefficient is greater than 0, there is a positive correlation between the two variables, and when it is less than 0, there is a negative correlation between the two variables.
As shown in Table 11, the color presentation effect is significant with respect to 8 items including the basic attribute of color, the light source of the classroom, the brightness of the classroom, the ceiling height of the classroom, the resolution of the equipment and electronic equipment, the brightness of the electronic equipment, and the color environment, and the correlation coefficients are 0.453, 0.436, 0.449, 0.484, and 0.468, respectively. 0.420, 0.128, 0.427, and the correlation coefficients are all greater than 0, which means that there is a positive correlation between the color rendering effect and the basic attributes of color, the light source of the classroom, the brightness of the classroom, the ceiling height of the classroom, the equipment, the resolution of the electronic equipment, the brightness of the electronic equipment and the color environment.
The R square value of the model is 0.424, which means that the light source of the classroom, the brightness of the classroom, the ceiling height of the classroom, the equipment, the resolution of the electronic equipment, the brightness of the electronic equipment, and the color environment can explain 42.4% of the changes in the color rendering effect, as shown in Table 12.
It is found that the model passes the F test (F = 25.102, p = 0.000 < 0.05), which means that at least one of the light source of the classroom, the brightness of the classroom, the ceiling height of the classroom, the equipment, the resolution of the electronic equipment, the brightness of the electronic equipment, and the color environment will affect the color presentation effect, as shown in Table 13.
The regression analysis results of the model are shown in Table 14:
The regression coefficient of the light source in the classroom is 0.125 (t = 1.664, p = 0.098 > 0.05), which means that the light source in the classroom does not affect the color rendering effect.
The regression coefficient of the brightness of the classroom is 0.211 (t = 3.852, p = 0.000 < 0.01), which means that the brightness of the classroom has a weak effect on the color rendering effect and has no significant effect.
The regression coefficient of the ceiling height of the classroom is 0.176 (t = 2.898, p = 0.004 < 0.01), which means that the ceiling height of the classroom has a weak effect on the color rendering effect and has no significant effect.
The regression coefficient of the equipment is 0.184 (t = 2.962, p = 0.003 < 0.01), which means that the equipment has a weak effect on the color rendering effect and has no significant effect.
The regression coefficient value of the resolution of the electronic device is 0.151 (t = 2.310, p = 0.022 < 0.05), which means that the resolution of the electronic device has a weak effect on the color rendering effect and has no significant effect.
The regression coefficient of the brightness of the electronic device is -0.053 (t = -0.816, p = 0.415 > 0.05), which means that the brightness of the electronic device does not affect the color rendering effect.
The regression coefficient of color environment is 0.160 (t = 2.422, p = 0.016 < 0.05), which means that the effect on color presentation is weak and has no significant effect.
4.5. Construction and Analysis of Structural Equation Model
In this study, structural equation modeling was used to analyze the relationship between the seven influencing factors of multimedia color presentation, including the light source of the classroom, the brightness of the classroom, the ceiling height of the classroom, the equipment situation, the resolution of the electronic equipment, the brightness of the electronic equipment and the color environment. Structural equation modeling can be used to deal with complex multivariate research data, to estimate latent variables and parameters of complex independent and dependent variable prediction models at the same time, and to deal with measurement and analysis problems[12]. This section focuses on the establishment of structural models, the evaluation of structural equation models, and the analysis of structural equation model results.
4.5.1. Construction of Structural Equation Model
Since the questionnaire has been adjusted and modified in the process of model revision, and two items have been added and excluded, after the data are obtained from the evaluation, various indicators in line with the model adaptation are established according to the F confirmatory factor analysis results, as shown in the structural equation model in Figure 1.
4.5.2. Estimation of Structural Equation Models
After constructing the structural model of the study, the model diagram was drawn in AMOS software, and the measurement indicators of each latent variable were added to the model to estimate and test the constructed structural equation model.
First, analyze the model fitting. The chi-square degree of freedom ratio χ ²/DF is less than 3. Most of the other indicators have good fitting effect. The test value shows that the model has good effect, as shown in Table 15.
The confirmatory factor analysis fitting index of the measurement model of the influencing factors of multimedia color presentation constructed in this study is shown in Table 16. The results show that the chi-square freedom ratio χ ²/DF is less than 3, and the fitting index of most indicators is good. Except for the basic attributes of color, classroom brightness and equipment, the other fitting indexes all meet the adaptation criteria. To sum up, the measurement model of the questionnaire on the influencing factors of multimedia color presentation constructed in this study can fit the sample data.
4.5.3. Structural Equation Modeling Results Analysis Data Analysis
- (1)
- The path coefficient of classroom light source on color effect is 0.085, and the P value is greater than 0.05, indicating that there is no significant effect, and the hypothesis is not valid.
- (2)
- The path coefficient of classroom brightness on color effect is 0.285, and the P value is less than 0.05, which indicates that there is a significant positive effect, and the hypothesis is established.
- (3)
- The path coefficient of ceiling height on color effect is 0.19, and the P value is less than 0.05, which indicates that there is a significant positive effect, and the hypothesis is valid.
- (4)
- The path coefficient of the device on the color effect is 0.3, and the P value is less than 0.05, indicating that there is a significant positive effect, and the hypothesis is valid.
- (5)
- The path coefficient of the device resolution on the color effect is 0.125, and the P value is greater than 0.05, indicating that there is no significant effect, and the hypothesis is not valid.
- (6)
- The path coefficient of the brightness of the electronic device on the color effect is -0.067, and the P value is greater than 0.05, indicating that there is no significant effect, and the hypothesis is not valid.
- (7)
- The path coefficient of color environment on color effect is 0.138, and the P value is greater than 0.05, indicating that there is no significant effect, and the hypothesis is not valid.
- (8)
- The path coefficient of color basic attributes is 0.654, and the P value is less than 0.05, which indicates that there is a significant positive influence relationship, and the hypothesis is established.
5. Results
In this study, eight influencing factors are analyzed from four main dimensions of environmental color, light source color, inherent color and basic color attributes, and the structural equation model is used to explore their impact on multimedia color presentation. One factor in each of the four dimensions has no significant effect on color presentation, and one factor in each of the four dimensions has a significant effect on color presentation. And they are all positive correlation.
5.1. Non-Significant Factors
The classroom light source has no significant influence on the color effect, so the influence of the classroom light source on the color presentation is negligible; the brightness of the electronic equipment has no significant influence on the color effect, so the brightness of the electronic equipment needs to be set to a degree that does not affect the color presentation effect; The color environment does not show a significant impact on the color effect, which shows that the wall color and curtain color in most classrooms can not affect the color effect. The device resolution has no significant effect on the path coefficient of color effect, which indicates that the high resolution of multimedia playback devices used in most classrooms will not affect the color presentation of learning materials.
5.2. Significant Factors
(1) The height of the classroom ceiling has a significant positive impact on the color presentation of multimedia learning materials. The main indicators of the height of the classroom ceiling include: the height of the classroom ceiling should be higher than 3 meters; the height of the classroom ceiling less than 3 meters will have a reflective effect on the color presentation of multimedia learning materials, affecting the color presentation effect. Path coefficient is 0. 19, P value is less than 0. 05, and reached a significant level, we can see that the height of the ceiling has a significant impact on the color presentation, and is positively correlated, we should pay attention to the ceiling is higher than three meters in the classroom, the color effect of multimedia learning materials can achieve better results, and will not have a reflective impact on the effect of multimedia color presentation.
The lower the height of the ceiling in the classroom, the more influence it has on the playback effect, and this influence is negative. When the height of the classroom ceiling is less than three meters, the different materials of the classroom ceiling will have different effects on the playback screen. When the ceiling of the classroom is higher than three meters, there is basically no reflective effect on the color presentation of the display screen of the multimedia device. Try to use a classroom with a ceiling higher than three meters to play multimedia learning materials, so as to ensure that the color effect of playing learning materials is not affected by the reflection of the ceiling.
(2) The brightness of the classroom has a significant positive impact on the color presentation of multimedia learning materials. The main indicators of the brightness of the classroom include the overall brightness of the classroom, the brightness settings of each area of the classroom and the brightness adjustment of the classroom. The path coefficient is 0. 285, and the P value is less than 0. 05, and it reaches a significant level, which shows that the overall brightness of the classroom and the brightness of each area have a significant impact on the color rendering effect of multimedia, and the brightness of each area of the classroom should be adjusted to better display the color effect of multimedia learning materials.
The brightness of the classroom has a significant impact on the color rendering effect, when the brightness of the classroom is high, the color rendering effect will be negatively affected. When using electronic devices to play multimedia learning materials, the higher the brightness of the classroom, the brightness of the color presentation will increase to different degrees according to the different playback devices. When the brightness of the classroom is low, it is more conducive to the effect of color presentation, but considering the visual experience of students, the brightness of the classroom should not be low. The low brightness of the classroom will easily lead to visual fatigue, so it is recommended to control the lighting level of each part of the classroom. The brightness in the display area where multimedia learning materials are played in the classroom should be lower than that in the position where students are located, that is, at least the lighting brightness of the play area and the non-play area should be set separately in the classroom.
(3) The choice of equipment has a significant positive impact on the color presentation of multimedia learning materials. The main indicators of equipment selection include: the type of equipment, the advancement of equipment and the choice of equipment. The path coefficient was 0. 3, and the P value was less than 0. 05, which reached the significant level. The playing equipment of multimedia learning materials is a direct factor affecting the color presentation effect, which shows that the classroom has the equipment to display multimedia learning materials, and it is advanced, and the color effect of the equipment is better.
In the investigation of influencing factors, it is found that the advancement of broadcasting equipment can meet the effect of color presentation. The type of playback equipment has a significant impact on the effect of color presentation. It can be seen that different types of equipment are suitable for playing different multimedia learning materials, mainly for electronic screen and projection. The color rendering effect of using electronic screen is better than that of using projector, which is related to the brightness of the classroom in the first suggestion. Because the classroom brightness is not suitable for low settings, if you want to ensure that the color presentation effect is consistent with the main control screen, the lumen of the general projector is not suitable for the classroom, and the color display effect of the electronic screen is suitable for playing multimedia learning materials in the classroom.
(4) The basic attributes of color have a significant positive impact on the color presentation of multimedia learning materials. The basic attributes of color include the hue, saturation and brightness of color presentation. The path coefficient is 0.654, and the P value is less than 0.05, and it reaches a significant level, which shows that the basic attributes of color will affect the effect of color presentation.
The significant factors affecting the color presentation of multimedia learning materials include the brightness of the classroom, the height of the ceiling, the equipment and the basic attributes of color, among which the basic attributes of color are the fundamental causes of the color presentation of multimedia learning materials, which will be reflected in the multimedia learning materials through learning tasks, and ultimately form the color presentation effect of multimedia learning materials. It can be said that this factor is a causal factor of the color presentation effect of multimedia learning. Therefore, the color presentation factors (hue, lightness, saturation, and brightness ratio) of the multimedia learning material, which are converted into the relational model, are used as one of the causal factors of the relational model.
6. Discussion
6.1. Significance of Research Results
The results of this study show that the basic attributes of color, classroom brightness and equipment are the main factors affecting the color presentation of multimedia, and the ceiling height also has some influence. These results help us to better understand the role of color presentation in the learning environment, and provide a reference for optimizing the learning environment.
6.2. Limitations of the Study
In this study, only primary school teachers were investigated, and the sample has certain limitations. Future studies can expand the scope of the sample to further verify the findings.
6.3. Suggestions for Future Research
Future research can further explore the characteristics and rules of color presentation in different learning environments, and provide more theoretical support for educational practice.
7. Conclusions
Based on a survey of 247 primary school teachers in a provincial capital city in China, this study analyzed the impact of color presentation on the learning environment. The results show that the basic attributes of color, the brightness of the classroom and the equipment are the main factors affecting the color presentation of multimedia, and the ceiling height also has some influence. This study provides a new perspective for understanding the role of color presentation in the learning environment and provides a reference for educational practice.
Appendix A
Questionnaire on Influencing Factors of Color Presentation
Questionnaire on Influencing Factors of Color Presentation of Multimedia Learning Materials for Primary School Students
Hello, thank you for participating in this survey. The data generated by this questionnaire is only for academic research. Your personal information will not be disclosed. Please fill in according to the actual situation. Thank you again for your participation!
Are you a primary school teacher? Yes No (end answer)
Your Gender: Male Female
Your age:
A. 25 years and below
B. 26-35 years
C. 36-45 years
D. 46-55 years
E. Age 56 +
Your Education:
A High school and below
B. College and university
C. Undergraduate studies
D. Master and above
Your working years:
A. Less than 1 year
B. 1-3 years
C. 4-6 years
D. 7-9 years
E. 10 years and above
How often you use multimedia learning materials:
A. Never use
B. Rarely used
C. Occasional use
D. Frequent use
E. Always use
Are you concerned about the color of multimedia learning materials?
A. Never pay attention
B. Little attention
C. Occasional attention
D. Regular attention
E. Always be concerned
Do you like to use multimedia learning materials with bright colors?
A. Don't like it very much
B. I don't like it
C. Generally like
D. I prefer it
E. Like it very much
9. Do you like to use multimedia learning materials composed of various colors?
A. Don't like it very much
B. I don't like it
C. Generally like
D. I prefer it
E. Like it very much
10. Do you often use your own multimedia learning materials?
A. Never use
B. Rarely used
C. Use occasionally
D. Frequently used
E. Always use
Please choose the appropriate option according to the actual situation:

| Very Different Meaning |
Very Agree |
||||||
| I think there is enough light in the classroom. | 1 | 2 | 3 | 4 | 5 | 6 | 7 |
| I think the light source in the classroom is reasonable. | 1 | 2 | 3 | 4 | 5 | 6 | 7 |
| I think the light source in the classroom can be adjusted. | 1 | 2 | 3 | 4 | 5 | 6 | 7 |
| I think cold light source is more suitable for the presentation of multimedia learning materials. | 1 | 2 | 3 | 4 | 5 | 6 | 7 |
| 5. I think warm light source is more suitable for the presentation of multimedia learning materials. | 1 | 2 | 3 | 4 | 5 | 6 | 7 |
| 6. I think the combination of cold and warm light sources is more suitable for the presentation of multimedia learning materials. | 1 | 2 | 3 | 4 | 5 | 6 | 7 |
1.1 Light source in the classroom
1.2 Brightness of the classroom
| Very Different Meaning |
Very Agree |
||||||
| 4. I think the overall brightness of the classroom is higher. | 1 | 2 | 3 | 4 | 5 | 6 | 7 |
| 5. I think the brightness setting of each area in the classroom meets the relevant needs. | 1 | 2 | 3 | 4 | 5 | 6 | 7 |
| 6. I think the brightness of the classroom can be adjusted. | 1 | 2 | 3 | 4 | 5 | 6 | 7 |
1.3 Ceiling height of the classroom
| Very Different Meaning |
Very Agree |
||||||
| 7.I think the ceiling height of the classroom should be higher than 3 meters. | 1 | 2 | 3 | 4 | 5 | 6 | 7 |
| 8. I don't think the ceiling height of the classroom will have a reflective effect on the multimedia color presentation. | 1 | 2 | 3 | 4 | 5 | 6 | 7 |
1.4 Equipment
| I strongly disagree | Very Agree |
||||||
| 9. I think the classroom is equipped with equipment to display multimedia learning materials, such as computers, screens, audio and lighting equipment. | 1 | 2 | 3 | 4 | 5 | 6 | 7 |
| 10. I believe that the number of equipment set up in the classroom for use in the presentation of multimedia learning materials is adequate. | 1 | 2 | 3 | 4 | 5 | 6 | 7 |
| 11. I think the equipment set up in the classroom used in the process of playing multimedia learning materials is advanced. | 1 | 2 | 3 | 4 | 5 | 6 | 7 |
| I think the color effect of multimedia learning materials displayed on the electronic screen is better. | 1 | 2 | 3 | 4 | 5 | 6 | 7 |
| 13. I don't think the projector is suitable for displaying the color effect of multimedia learning materials in the classroom. | 1 | 2 | 3 | 4 | 5 | 6 | 7 |
1.5 Resolution of electronic equipment
| Very Different Meaning |
Very Agree |
||||||
| 14. I think the resolution of electronic equipment in the classroom is higher. | 1 | 2 | 3 | 4 | 5 | 6 | 7 |
| 15. I believe that the resolution of electronic devices in the classroom can meet the needs of multimedia learning materials. | 1 | 2 | 3 | 4 | 5 | 6 | 7 |
| 16. I believe that the resolution of electronic devices in the classroom can well present the color of multimedia learning materials. | 1 | 2 | 3 | 4 | 5 | 6 | 7 |
1.6 Brightness of electronic equipment
| Very Different Meaning |
Very Agree |
||||||
| 17. I think the brightness of electronic equipment in the classroom is higher. | 1 | 2 | 3 | 4 | 5 | 6 | 7 |
| 18. I think the brightness of the electronic equipment in the classroom can meet the needs of playing multimedia learning materials. | 1 | 2 | 3 | 4 | 5 | 6 | 7 |
| 19. I think the brightness of the electronic equipment in the classroom can well present the color of multimedia learning materials. | 1 | 2 | 3 | 4 | 5 | 6 | 7 |
2. Teachers' requirements for color presentation of multimedia learning materials
| Very Different Meaning |
Very Agree |
||||||
| 20. I carefully design the hue of multimedia learning materials in terms of color presentation. | 1 | 2 | 3 | 4 | 5 | 6 | 7 |
| 21. I carefully design the brightness of multimedia learning materials in terms of color presentation. | 1 | 2 | 3 | 4 | 5 | 6 | 7 |
| 22. I carefully design the saturation of multimedia learning materials in terms of color presentation. | 1 | 2 | 3 | 4 | 5 | 6 | 7 |
3. Color presentation effect of multimedia learning materials
| Very Different Meaning |
Very Agree |
||||||
| 23. I think the overall effect of the color presentation of multimedia learning materials displayed in the classroom is better. | 1 | 2 | 3 | 4 | 5 | 6 | 7 |
| 24. I believe that the color presentation of multimedia learning materials displayed in the classroom meets the relevant needs, such as the authenticity of the color of objects. | 1 | 2 | 3 | 4 | 5 | 6 | 7 |
| 25. I believe that the color presentation of multimedia learning materials displayed in the classroom can make preschool children feel comfortable and help them learn. | 1 | 2 | 3 | 4 | 5 | 6 | 7 |
4. Color environment in the classroom
| Very Different Meaning |
Very Agree |
||||||||
| 26. I think the colored walls in the classroom have an impact on the color rendering of multimedia learning materials. | 1 | 2 | 3 | 4 | 5 | 6 | 7 | ||
| 27. I think the colored curtains in the classroom have an impact on the reduction of the color presentation of multimedia learning materials. | 1 | 2 | 3 | 4 | 5 | 6 | 7 | ||
| 28. I think the color environment in the classroom should all use warm and bright colors. | 1 | 2 | 3 | 4 | 5 | 6 | 7 | ||
| 29. I think we should try our best to unify the colors of all objects in the classroom. | 1 | 2 | 3 | 4 | 5 | 6 | 7 | ||
References
- Choi H H, Van Merriënboer J J G, Paas F. Effects of the physical environment on cognitive load and learning: Towards a new model of cognitive load[J]. Educational psychology review, 2014, 26: 225-244.
- Buchner J, Buntins K, Kerres M. The impact of augmented reality on cognitive load and performance: A systematic review[J]. Journal of Computer Assisted Learning, 2022, 38(1): 285-303. [CrossRef]
- Shadiev R, Hwang W Y, Huang Y M, et al. The impact of supported and annotated mobile learning on achievement and cognitive load[J]. Journal of Educational Technology & Society, 2015, 18(4): 53-69.
- Greer D L, Crutchfield S A, Woods K L. Cognitive theory of multimedia learning, instructional design principles, and students with learning disabilities in computer-based and online learning environments[J]. Journal of Education, 2013, 193(2): 41-50. [CrossRef]
- Meydan C H, Şeşen H. Yapısal eşitlik modellemesi AMOS uygulamaları[M]. Detay Yayıncılık, 2011.
- Finch H, French B F, Immekus J C. Applied psychometrics using SPSS and AMOS[M]. IAP, 2016.
- Elliot A J, Maier M A. Color-in-context theory[M]. Advances in experimental social psychology. Academic Press, 2012, 45: 61-125.
- Baniani, M. The association between colors, color preferences, and emotions among Japanese students: From elementary school to university[J]. Color Research & Application, 2022, 47(4): 992-1004.
- Baniani, M. The association between colors, color preferences, and emotions among Japanese students: From elementary school to university[J]. Color Research & Application, 2022, 47(4): 992-1004.
- Zhou, J. R. , Zhang, H. B., Sun, L., et al. The Influence of Learners' Emotional Factors on Knowledge Construction in the OMO Model of Education[J]. Journal of Tianshui Normal University, 2021.
- Sun, W. C. A Survey Research on High School Students' Views on Mathematics Learning —— From the Perspective of Students in High Schools in Liuhe District, Nanjing City[J]. Friends of Mathematics, 2014(12): 52 - 55.
- Xue, S. Research on Primary School Students' Understanding of the Nature of Science and Its Influencing Factors[J]. Wuhan: Doctoral Dissertation of Central China Normal University, 2021.
Figure 1.
Structural Equation Model
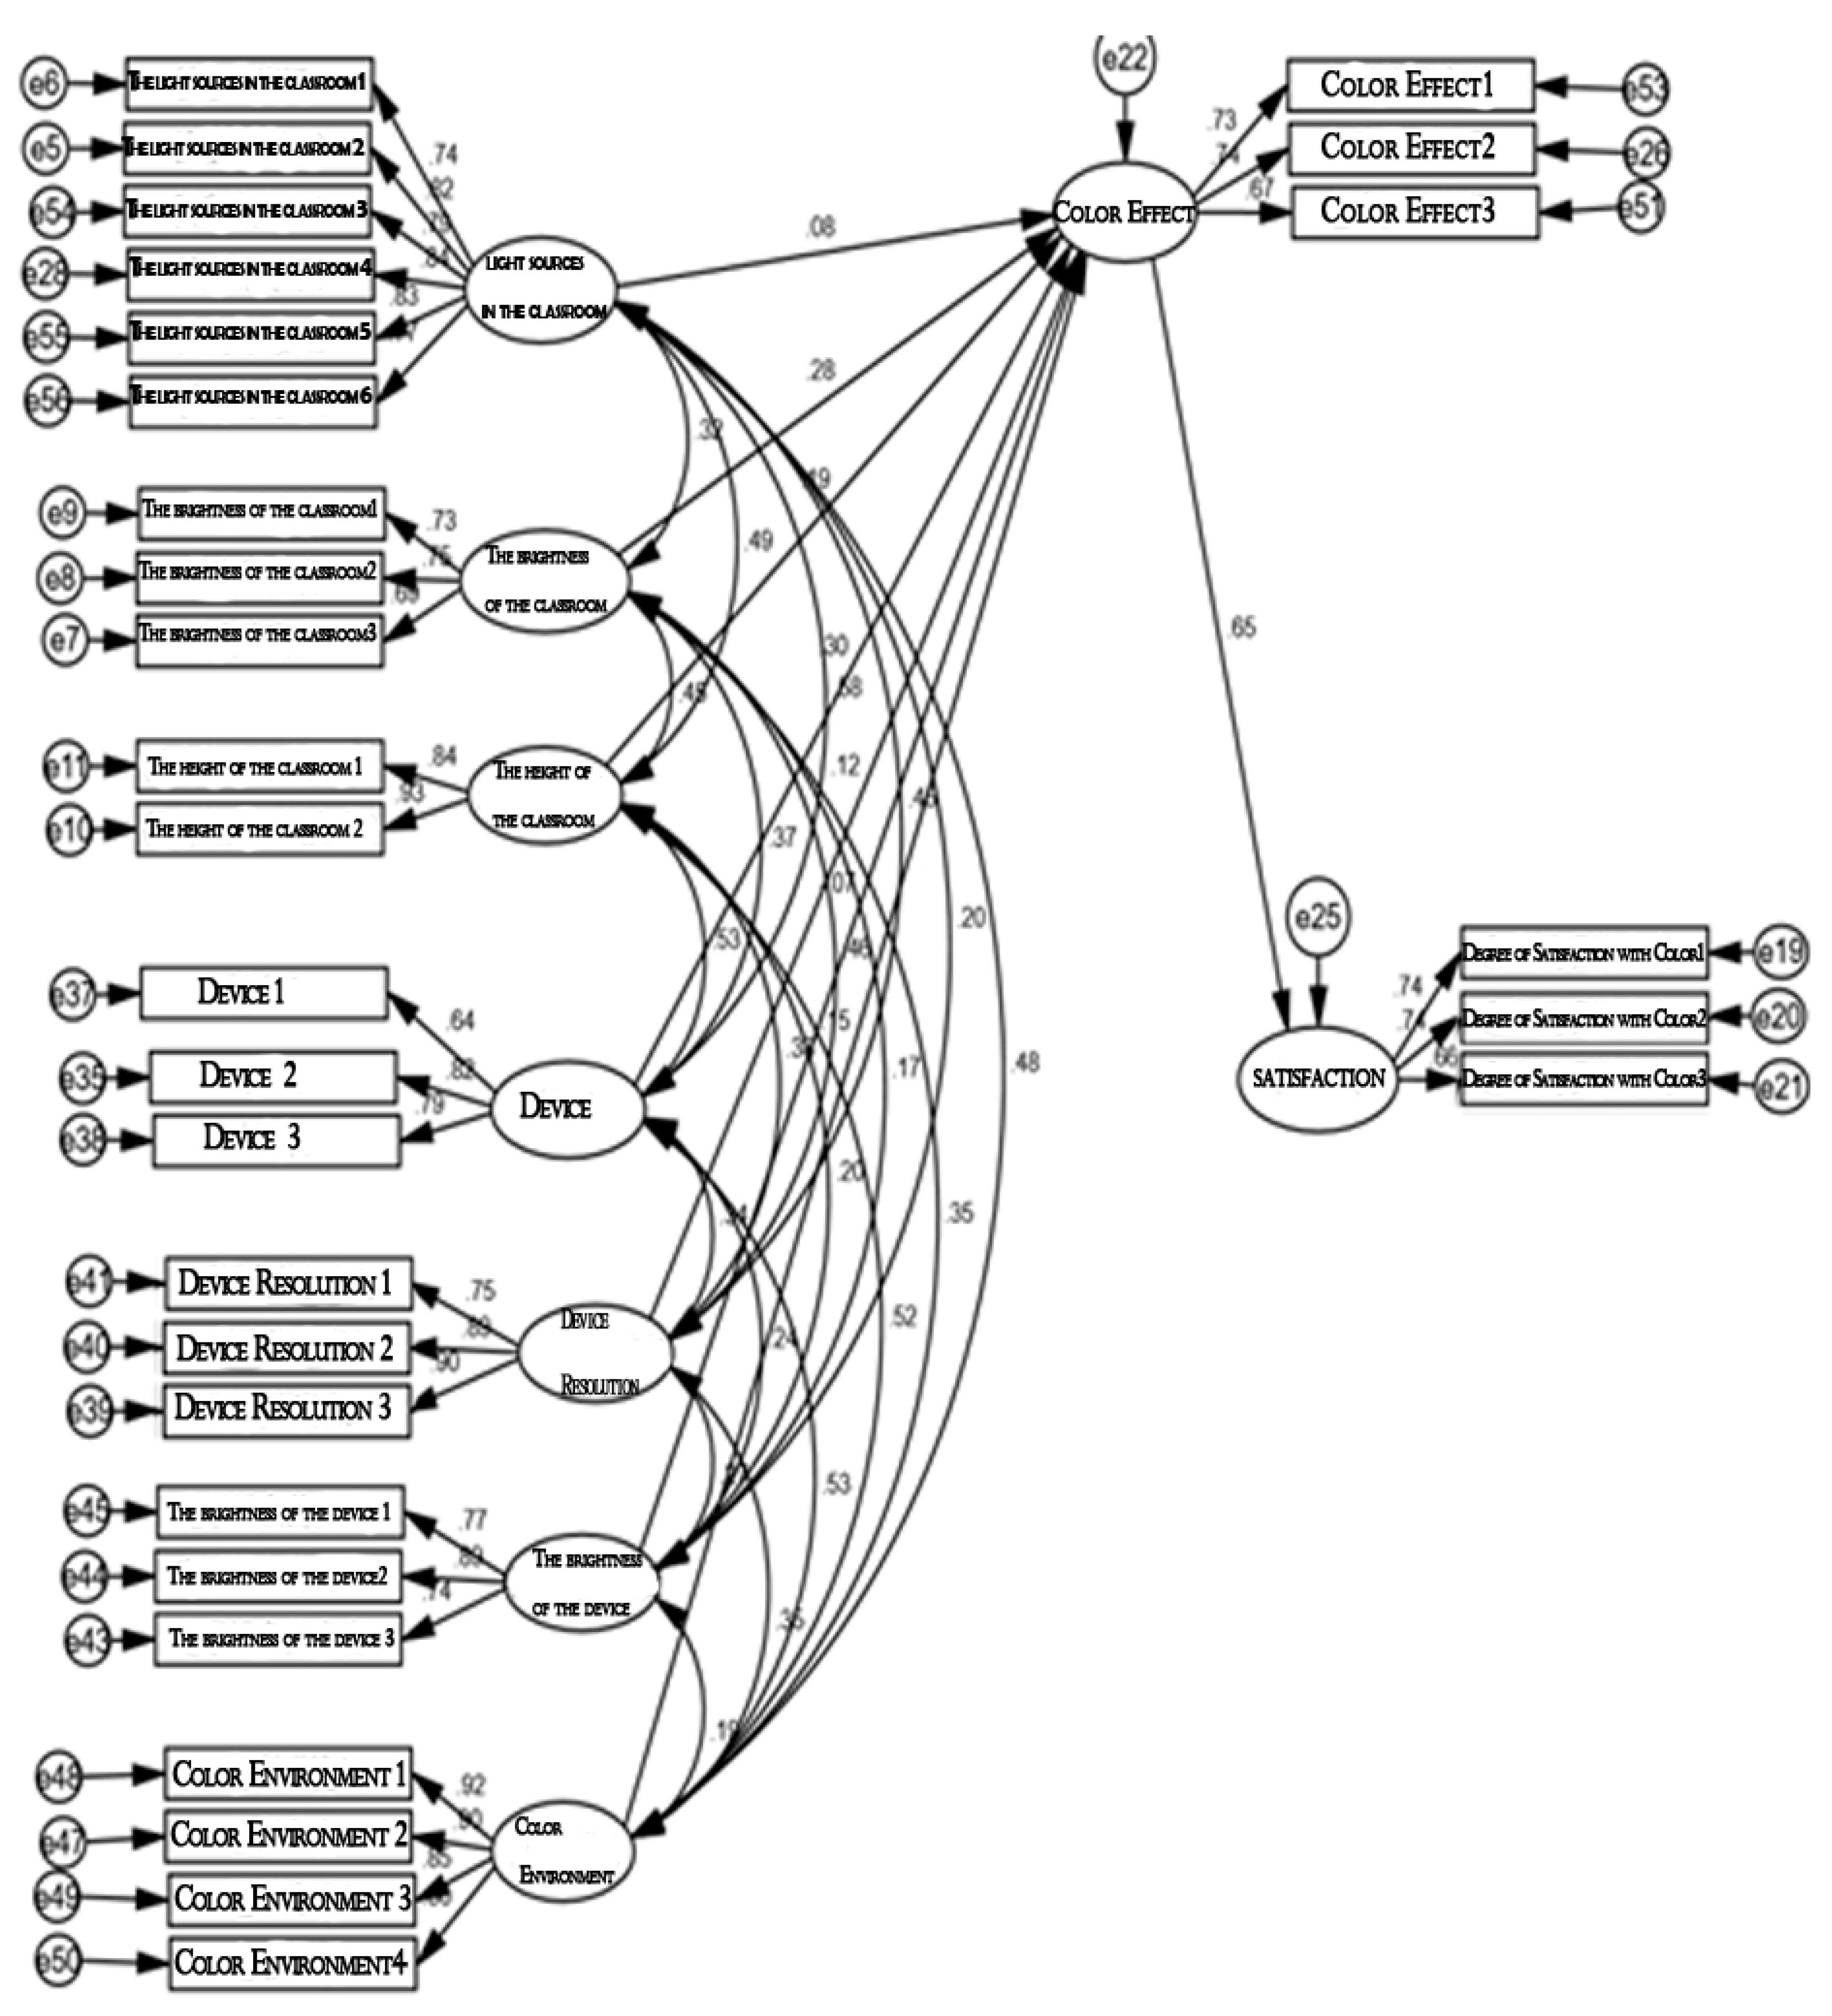
Table 1.
Frequency Analysis Results.
| Name | Options | Frequency | Percentage (%) |
| Gender | A. Male | 121 | 48.99 |
| B. Female | 126 | 51.01 | |
| Age | A. 25 years and below | 4 | 1.62 |
| B. 26-35 years | 71 | 28.75 | |
| C. 36-45 years | 109 | 44.13 | |
| D. 46-55 years | 55 | 22.27 | |
| E. Age 56 + | 8 | 3.24 | |
| Academic qualifications | B. College and university | 135 | 54.66 |
| C. Undergraduate studies | 83 | 33.60 | |
| D. Master and above | 29 | 11.74 | |
| Length of service | A. Less than 1 year | 66 | 26.72 |
| B. 1-3 years | 99 | 40.08 | |
| C. 4-6 years | 51 | 20.65 | |
| D. 7-9 years | 18 | 7.29 | |
| E. 10 years and above | 13 | 5.26 |
Table 2.
Reliability Statistics.
| Scale | Clone Bach Alpha | Cloning Bach Alpha Based on Standardized Term |
| The light source of the classroom | 0.911 | 0.913 |
| The brightness of the classroom | 0.765 | 0.765 |
| Ceiling height of the classroom | 0.876 | 0.877 |
| Equipment | 0.808 | 0.808 |
| Resolution of electronic equipment | 0.878 | 0.878 |
| Brightness of electronic equipment | 0.837 | 0.839 |
| Basic attributes of color | 0.747 | 0.750 |
| Color rendering effect | 0.776 | 0.776 |
| Color environment | 0.892 | 0.891 |
| Total questionnaire | 0.930 | 0.930 |
Table 3.
KMO and Bartlett test.
| KMO sampling appropriateness measure | 0.829 | |
| Bartlett sphericity test | Approximate chi-square | 4942.572 |
| Degrees of freedom | 231 | |
| Significance | 0.000 | |
Table 4.
Interpretation of Total Variance.
| Ingredient | Initial eigenvalue | Extract the sum of the load squares | The sum of the squares of the rotating loads | ||||||
| Total | Variance Percentage |
Cumulative% | Total | Variance Percentage |
Cumulative% | Total Variance Percentage |
Cumulative% | ||
| 1 | 10.550 | 32.969 | 32.969 | 10.550 | 32.969 | 32.969 | 4.630 | 14.468 | 14.468 |
| 2 | 2.403 | 7.509 | 40.479 | 2.403 | 7.509 | 40.479 | 3.080 | 9.624 | 24.092 |
| 3 | 2.272 | 7.101 | 47.579 | 2.272 | 7.101 | 47.579 | 2.470 | 7.720 | 31.812 |
| 4 | 2.037 | 6.365 | 53.944 | 2.037 | 6.365 | 53.944 | 2.419 | 7.558 | 39.370 |
| 5 | 1.714 | 5.357 | 59.300 | 1.714 | 5.357 | 59.300 | 2.383 | 7.446 | 46.816 |
| 6 | 1.349 | 4.216 | 63.516 | 1.349 | 4.216 | 63.516 | 2.320 | 7.251 | 54.067 |
| 7 | 1.115 | 3.486 | 67.001 | 1.115 | 3.486 | 67.001 | 2.244 | 7.013 | 61.080 |
| 8 | 1.105 | 3.452 | 70.453 | 1.105 | 3.452 | 70.453 | 2.232 | 6.974 | 68.054 |
| 9 | 1.037 | 3.242 | 73.695 | 1.037 | 3.242 | 73.695 | 1.805 | 5.642 | 73.695 |
| 10 | 0.663 | 2.072 | 75.767 | ||||||
| 11 | 0.651 | 2.035 | 77.802 | ||||||
| 12 | 0.574 | 1.792 | 79.594 | ||||||
| 13 | 0.545 | 1.704 | 81.298 | ||||||
| 14 | 0.542 | 1.695 | 82.993 | ||||||
| 15 | 0.519 | 1.622 | 84.615 | ||||||
| 16 | 0.470 | 1.470 | 86.085 | ||||||
| 17 | 0.445 | 1.390 | 87.475 | ||||||
| 18 | 0.429 | 1.341 | 88.816 | ||||||
| 19 | 0.393 | 1.230 | 90.045 | ||||||
| 20 | 0.367 | 1.147 | 91.192 | ||||||
| 21 | 0.337 | 1.052 | 92.244 | ||||||
| 22 | 0.332 | 1.037 | 93.282 | ||||||
| 23 | 0.315 | 0.983 | 94.265 | ||||||
| 24 | 0.294 | 0.918 | 95.183 | ||||||
| 25 | 0.265 | 0.828 | 96.011 | ||||||
| 26 | 0.229 | 0.715 | 96.725 | ||||||
| 27 | 0.217 | 0.679 | 97.404 | ||||||
| 28 | 0.198 | 0.619 | 98.023 | ||||||
| 29 | 0.183 | 0.573 | 98.596 | ||||||
| 30 | 0.161 | 0.503 | 99.099 | ||||||
| 31 | 0.153 | 0.480 | 99.579 | ||||||
| 32 | 0.135 | 0.421 | 100.000 | ||||||
Extraction method: principal component analysis.
Table 5.
Rotated Composition Matrix a.
| Ingredient | |||||||||
| 1 | 2 | 3 | 4 | 5 | 6 | 7 | 8 | 9 | |
| Classroom light source 1 | 0.785 | ||||||||
| Light source in the classroom 2 | 0.812 | ||||||||
| Light source in the classroom 3 | 0.740 | ||||||||
| Light source in the classroom 4 | 0.808 | ||||||||
| Light source in the classroom 5 | 0.796 | ||||||||
| Light source in the classroom 6 | 0.779 | ||||||||
| Brightness of the classroom 1 | 0.746 | ||||||||
| Brightness of the classroom 2 | 0.808 | ||||||||
| The brightness of the classroom 3 | 0.750 | ||||||||
| Ceiling height of the classroom1 | 0.830 | ||||||||
| Ceiling height of the classroom2 | 0.803 | ||||||||
| Device 1 | 0.793 | ||||||||
| Device 2 | |||||||||
| Device 3 | 0.747 | ||||||||
| Device 4 | 0.683 | ||||||||
| Device 5 | |||||||||
| Resolution of electronic devices1 | 0.670 | ||||||||
| Resolution of electronic devices2 | 0.891 | ||||||||
| Resolution of the electronic device3 | 0.870 | ||||||||
| Brightness of electronic devices1 | 0.848 | ||||||||
| Brightness of electronic devices2 | 0.883 | ||||||||
| Brightness of electronic devices3 | 0.831 | ||||||||
| Color Basic Attribute 1 | 0.835 | ||||||||
| Color Basic Attributes 2 | 0.742 | ||||||||
| Color Basic Attributes 3 | 0.647 | ||||||||
| Color rendering effect 1 | 0.744 | ||||||||
| Color rendering effect 2 | 0.664 | ||||||||
| Color rendering effect 3 | 0.743 | ||||||||
| Color environment 1 | 0.813 | ||||||||
| Color Environment 2 | 0.840 | ||||||||
| Color environment 3 | 0.764 | ||||||||
| Color environment 4 | 0.817 | ||||||||
| Extraction method: principal component analysis. Rotation method: Kaiser normalized maximum variance method. | |||||||||
| A. The rotation has converged after 6 iterations. | |||||||||
Table 6.
Rotated Composition Matrix a.
| Ingredient | |||||||||
| 1 | 2 | 3 | 4 | 5 | 6 | 7 | 8 | 9 | |
| Classroom light source 1 | 0.785 | ||||||||
| Light source in the classroom 2 | 0.813 | ||||||||
| Light source in the classroom 3 | 0.745 | ||||||||
| Light source in the classroom 4 | 0.812 | ||||||||
| Light source in the classroom 5 | 0.798 | ||||||||
| Light source in the classroom 6 | 0.778 | ||||||||
| Brightness of the classroom 1 | 0.748 | ||||||||
| Brightness of the classroom 2 | 0.810 | ||||||||
| The brightness of the classroom 3 | 0.750 | ||||||||
| Ceiling height of the classroom1 | 0.835 | ||||||||
| Ceiling height of the classroom2 | 0.808 | ||||||||
| Device 1 | 0.801 | ||||||||
| Device 3 | 0.748 | ||||||||
| Device 4 | 0.682 | ||||||||
| Resolution of electronic devices1 | 0.673 | ||||||||
| Resolution of electronic devices2 | 0.891 | ||||||||
| Resolution of the electronic device3 | 0.872 | ||||||||
| Brightness of electronic devices1 | 0.847 | ||||||||
| Brightness of electronic devices2 | 0.886 | ||||||||
| Brightness of electronic devices3 | 0.836 | ||||||||
| Color Basic Attribute 1 | 0.836 | ||||||||
| Color Basic Attributes 2 | 0.738 | ||||||||
| Color Basic Attributes 3 | 0.655 | ||||||||
| Color rendering effect 1 | 0.750 | ||||||||
| Color rendering effect 2 | 0.661 | ||||||||
| Color rendering effect 3 | 0.745 | ||||||||
| Color environment 1 | 0.813 | ||||||||
| Color Environment 2 | 0.843 | ||||||||
| Color environment 3 | 0.763 | ||||||||
| Color environment 4 | 0.825 | ||||||||
| Extraction method: principal component analysis. Rotation method: Kaiser normalized maximum variance method. A. The rotation has converged after 6 iterations. | |||||||||
Table 7.
Confirmatory Factor Fit Indicators.
| Common indicators | Chi-square degree of freedom ratio χ ²/DF | RMSEA | CFI | TLI | IFI |
| Criteria for judgment | <3 | <0.10 | >0.8 | >0.8 | >0.8 |
| Value | 1.594 | 0.049 | 0.946 | 0.937 | 0.947 |
Table 8.
Factor Load Factor.
| Measured item (explicit variable) | Average variance extraction AVE value | Combined Reliability (CR) |
| Classroom light source 1 | 0.637 | 0.913 |
| Light source in the classroom 2 | ||
| Light source in the classroom 3 | ||
| Light source in the classroom 4 | ||
| Light source in the classroom 5 | ||
| Light source in the classroom 6 | ||
| Brightness of the classroom 1 | 0.522 | 0.766 |
| Brightness of the classroom 2 | ||
| The brightness of the classroom 3 | ||
| Ceiling height of the classroom1 | 0.784 | 0.879 |
| Ceiling height of the classroom2 | ||
| Device 1 | 0.568 | 0.796 |
| Device 3 | ||
| Device 4 | ||
| Resolution of electronic devices1 | 0.719 | 0.884 |
| Resolution of electronic devices2 | ||
| Resolution of the electronic device3 | ||
| Brightness of electronic devices1 | 0.643 | 0.843 |
| Brightness of electronic devices2 | ||
| Brightness of electronic devices3 | ||
| Color Basic Attribute 1 | 0.506 | 0.753 |
| Color Basic Attributes 2 | ||
| Color Basic Attributes 3 | ||
| Color rendering effect 1 | 0.537 | 0.777 |
| Color rendering effect 2 | ||
| Color rendering effect 3 | ||
| Color environment 1 | 0.689 | 0.896 |
| Color Environment 2 | ||
| Color environment 3 | ||
| Color environment 4 |
Table 9.
Discriminant Validity: Pearson Correlation and AVE Square Root.
| Factor1 | Factor2 | Factor3 | Factor4 | Factor5 | Factor6 | Factor7 | Factor8 | Factor9 | |
| Factor1 | 0.798 | ||||||||
| Factor2 | 0.272 | 0.723 | |||||||
| Factor3 | 0.428 | 0.367 | 0.886 | ||||||
| Factor4 | 0.490 | 0.303 | 0.455 | 0.754 | |||||
| Factor5 | 0.430 | 0.403 | 0.358 | 0.312 | 0.848 | ||||
| Factor6 | 0.172 | 0.141 | 0.181 | 0.214 | 0.233 | 0.802 | |||
| Factor7 | 0.345 | 0.365 | 0.423 | 0.419 | 0.382 | 0.164 | 0.711 | ||
| Factor8 | 0.436 | 0.449 | 0.484 | 0.468 | 0.420 | 0.128 | 0.453 | 0.733 | |
| Factor9 | 0.417 | 0.261 | 0.433 | 0.411 | 0.307 | 0.137 | 0.330 | 0.427 | 0.830 |
Table 10.
describes the analysis.
| Average value | Standard deviation | |
| Color rendering effect | 4.690 | 1.076 |
| Basic attributes of color | 4.972 | 0.926 |
| The light source of the classroom | 5.398 | 0.888 |
| The brightness of the classroom | 4.916 | 1.101 |
| Ceiling height of the classroom | 3.358 | 1.078 |
| Equipment | 5.049 | 1.060 |
| Resolution of electronic equipment | 4.001 | 0.972 |
| Brightness of electronic equipment | 5.445 | 0.843 |
| Color environment | 3.474 | 0.946 |
Table 11.
Correlation.
| Color rendering effect | Basic attributes of color | The light source of the classroom | The brightness of the classroom | Ceiling height of the classroom | Equipment | Resolution of electronic equipment | Brightness of electronic equipment | Color environment | |
| Color rendering effect | 1 | ||||||||
| Basic attributes of color | 0.453 *** |
1 | |||||||
| The light source of the classroom | 0.436 *** |
0.345*** | 1 | ||||||
| The brightness of the classroom | 0.449 *** |
0.365*** | 0.272 *** |
1 | |||||
| Ceiling height of the classroom | 0.484 *** |
0.423*** | 0.428 *** |
0.367 *** |
1 | ||||
| Equipment | 0.468 *** |
0.419*** | 0.490 *** |
0.303 *** |
0.455*** | 1 | |||
| Resolution of electronic equipment | 0.420 *** |
0.382*** | 0.430 *** |
0.403 *** |
0.358*** | 0.312*** | 1 | ||
| Brightness of electronic equipment | 0.128* | 0.164** | 0.172 ** |
0.141* | 0.181** | 0.214*** | 0.233*** | 1 | |
| Color environment | 0.427 *** |
0.330*** | 0.417 *** |
0.261 *** |
0.433*** | 0.411*** | 0.307*** | 0.137* | 1 |
| * p<0.05 ** p<0.01 *** p<0.001 | |||||||||
Table 12.
Model Summary.
| Model | R | R side | R square after adjustment | Error of standard estimation |
| 1 | 0.651a | 0.424 | 0.407 | 0.82880 |
| Predictors: (constant), color environment, brightness of electronic equipment, brightness of classroom, light source of classroom, resolution of electronic equipment, ceiling height of classroom, equipment. | ||||
Table 13.
ANOVA.
| Model | Sum of squares | Degrees of freedom | Mean Square | F | Significance | |
| 1 | Return | 120.699 | 7 | 17.243 | 25.102 | 0.000b |
| Residual error | 164.171 | 239 | 0.687 | |||
| Total | 284.870 | 246 | ||||
| A. Dependent variable: color rendering effect | ||||||
| B. Predictor variables: (constant) color environment, brightness of electronic equipment, brightness of classroom, light source of classroom, resolution of electronic equipment, ceiling height of classroom, equipment. | ||||||
Table 14.
Factors.
| Model | Unnormalized coefficient | Normalization factor | t | Significance | ||
| B | Standard error | Beta | ||||
| 1 | (Constant) | 0.592 | 0.460 | 1.288 | 0.199 | |
| The light source of the classroom | 0.125 | 0.075 | 0.103 | 1.664 | 0.098 | |
| The brightness of the classroom | 0.211 | 0.055 | 0.216 | 3.852 | 0.000 | |
| Ceiling height of the classroom | 0.176 | 0.061 | 0.176 | 2.898 | 0.004 | |
| Equipment | 0.184 | 0.062 | 0.181 | 2.962 | 0.003 | |
| Resolution of electronic equipment | 0.151 | 0.065 | 0.136 | 2.310 | 0.022 | |
| Brightness of electronic equipment | 0.053 | 0.065 | -0.042 | 0.816 | 0.415 | |
| Color environment | 0.160 | 0.066 | 0.141 | 2.422 | 0.016 | |
| A. Dependent variable: color rendering effect | ||||||
Table 15.
Confirmatory Factor Fit Indicators.
| Common indicators | Chi-square degree of freedom ratio χ ²/DF | RMSEA | CFI | TLI | IFI |
| Criteria for judgment | <3 | <0.10 | >0.8 | >0.8 | >0.8 |
| Value | 1.607 | 0.05 | 0.944 | 0.935 | 0.945 |
Table 16.
Fit index of confirmatory factor analysis of measurement model of influencing factors of multimedia color presentation.
Table 16.
Fit index of confirmatory factor analysis of measurement model of influencing factors of multimedia color presentation.
| Y | X | Estimate | Estimate | S.E. | C.R. | P | |
| Color effect | <--- | Classroom light source | 0.085 | 0.090 | 0.082 | 1.095 | 0.273 |
| Color effect | <--- | Classroom brightness | 0.285 | 0.279 | 0.080 | 3.502 | *** |
| Color effect | <--- | Ceiling height | 0.190 | 0.152 | 0.063 | 2.389 | 0.017 |
| Color effect | <--- | Equipment | 0.300 | 0.251 | 0.076 | 3.318 | *** |
| Color effect | <--- | Device resolution | 0.125 | 0.113 | 0.065 | 1.753 | 0.080 |
| Color effect | <--- | Brightness of electronic equipment | -0.067 | -0.077 | 0.068 | -1.126 | 0.260 |
| Color effect | <--- | Color environment | 0.138 | 0.126 | 0.065 | 1.926 | 0.054 |
| Basic attributes of color | <--- | Color effect | 0.654 | 0.614 | 0.087 | 7.024 | *** |
Disclaimer/Publisher’s Note: The statements, opinions and data contained in all publications are solely those of the individual author(s) and contributor(s) and not of MDPI and/or the editor(s). MDPI and/or the editor(s) disclaim responsibility for any injury to people or property resulting from any ideas, methods, instructions or products referred to in the content. |
© 2025 by the authors. Licensee MDPI, Basel, Switzerland. This article is an open access article distributed under the terms and conditions of the Creative Commons Attribution (CC BY) license (http://creativecommons.org/licenses/by/4.0/).
Copyright: This open access article is published under a Creative Commons CC BY 4.0 license, which permit the free download, distribution, and reuse, provided that the author and preprint are cited in any reuse.


