Submitted:
24 January 2025
Posted:
27 January 2025
You are already at the latest version
Abstract
Tegoprazan is a potassium ion-competitive acid blocker (P-CAB) and novel inhibitor of gastric acid secretion. The crystal is available in two polymorphs, A and B, but their crystal structures have not yet been reported. Liquid and solid-state NMR were used to investigate the tautomeric state, which was found to be identical in both phases. Using these tautomers, the crystal structures of both polymorphs were determined from the X-ray diffraction data obtained with a laboratory powder X-ray diffractometer, employing simulated annealing and Rietveld refinement. It was found that both phases crystallized in the monoclinic space group P21, Z = 4, with the asymmetric unit containing two symmetrically independent molecules.
Keywords:
tautomerism
; desmotropism
; powder X-ray diffraction
; SDPD
; Tegoprazan
1. Introduction
Tegoprazan is a potassium-competitive acid blocker (P-CAB) developed for treating acid-related gastrointestinal disorders [1,2]. While proton pump inhibitors (PPIs) have been widely used for gastroesophageal reflux disease (GERD), P-CABs represent a newer class of powerful and selective inhibitors of gastric acid secretion. P-CABs work more quickly than PPIs and can maintain gastric acid pH control for longer periods. The effectiveness of Tegoprazan stems from its slow release from gastric glands, making it effective regardless of gastric acid levels or food intake. Excessive gastric acid secretion is linked to several diseases, including GERD, also known as reflux esophagitis [3,4], which has led to a growing demand for these agents and extensive research into their use. It has been recognized as useful as a treatment for acid-related gastrointestinal disorders, also two polymorphs of Tegoprazan, A and B have been reported [5,6].
In pharmaceutical product development and maintenance, unexpected demands for quality improvements often arise, requiring rapid yet effective responses. This includes investigating previously unnecessary aspects of even older products, driven by new discoveries of phenomena or therapeutic effects. In such cases, the development of cost-effective, straightforward, and rapid methodologies becomes essential.
As a case in point, the stability of the two Tegoprazan polymorphs was evaluated under accelerated conditions (temperature: 40 ± 2 °C, relative humidity: 75 ± 5 HR%) over an 8-week period, with observations for any significant changes conducted using DSC (Differential Scanning Calorimetry) and XRD (X-ray Diffraction). Significant changes were observed at the eighth week, with polymorph B appearing to undergo a phase transition to polymorph A (Figure S38). No changes were observed in polymorph A. This phase transition phenomenon is expected to have significant implications in pharmacology, as well as in quality control, formulation manufacturing, and other areas. Therefore, it is essential to elucidate the details of this phenomenon. For quantitative phase analysis and similar studies, knowledge of the crystal structure is crucial. However, the crystal structures of polymorphs A and B remain unresolved. In response to this need, we explored a practical approach to crystal structure analysis by utilizing readily available powder samples, laboratory-scale XRD instruments, and cost-efficient Rietveld refinement software. The known method of SDPD (Structure Determination from Powder Diffraction) was considered as one potential solution to address these challenges. While X-ray diffraction often utilizes synchrotron radiation or other advanced accelerator-based facilities, the crystal structures of tegoprazan polymorphs A and B were analyzed using laboratory-based X-ray diffraction (XRD) equipment and powdered samples. This approach was chosen for the following reasons:
Single crystals are commonly used in crystallographic analysis to determine crystal structures, with X-ray diffraction and neutron diffraction being the most widely employed methods. However, they are rarely directly used in pharmaceutical manufacturing. Instead, powders are commonly used as raw materials in pharmaceutical formulations. Additionally, physicochemical studies of crystal polymorphs, such as screening and solubility measurements, often focus on specific crystalline powders. Since crystal transitions frequently occur as solvent-mediated transformations from less stable to more stable forms, in situ X-ray diffraction measurements of phase transitions are desirable for studying crystallographic stability, facilitating rapid crystallographic analysis. Consequently, the aim was to obtain crystallographic data relevant to pharmaceutical formulations not from single crystals, but from the powder form of the production material, emphasizing equivalency. Measurements were conducted using a laboratory powder X-ray diffractometer, which is more accessible compared to synchrotron radiation or similar advanced facilities.
In the course of crystal structure analysis, the tautomeric state of Tegoprazan, specifically the position of the NH group within the benzimidazole skeleton, is a critical factor influencing the accuracy of the analysis. Tautomerism is a well-documented phenomenon in imidazole structures, where the asymmetry of the benzimidazole moiety can result in the formation of structural isomers depending on the position of the NH group [7,8,9,10,11,12]. Therefore, it is imperative to consider the unique structural characteristics of Tegoprazan, particularly its tautomerism, to ensure precise and reliable crystallographic determination.
Liquid-state NMR studies have shown that two tautomers exist when an asymmetric benzimidazole moiety is present. These tautomers are indistinguishable by 1H and 13C-NMR at room temperature because tautomerization occurs rapidly in nonpolar solvents such as CDCl3. In contrast, in polar solvents such as DMSO-d6, the tautomerization rate is slower, allowing the chemical shifts of the two tautomers to become observable due to changes in the position of the NH group in the imidazole ring [13,14,15]. When the benzimidazole moiety is asymmetric and bond to an inducible element, such as oxygen or halogen, 13C-NMR often shows significant differences in the chemical shifts between tautomers. Tautomerism in the solid state is extremely rare, and it is generally assumed that the position of the NH group remains fixed during crystallization from the solution phase. Therefore, it is crucial to determine whether the crystallized form consists of one or both tautomers.
The differences in the chemical shifts of each tautomer in non-protonic solvents were utilized to investigate which tautomer corresponds to the crystallized form of Tegoprazan. To achieve this, solid-state 13C-NMR chemical shifts were compared with the liquid-state 13C-NMR chemical shifts at room temperature and in DMSO-d6. For this comparison, structural analysis of each tautomer via 1D (1H, 13C) and 2D (COSY (Correlation Spectroscopy), ROESY (Rotating Frame Overhauser Enhancement Spectroscopy), HSQC (Heteronuclear Single Quantum Coherence) and HMBC (Heteronuclear Multiple Bond Coherence)) NMR measurements were required, including the identification of each element (1H, 13C, 19F) of the tautomers as shown in Figure 1. The identification was carried out by measuring a mixture (this mixture can be prepared simply by dissolving polymorph A in DMSO-d6. If this approach is unsuccessful, the mixture can be confirmed by adding a trace amount of trifluoroacetic acid, commonly used as a standard reagent for 19F NMR) of each tautomer in DMSO-d6 solution at room temperature.
The analyses revealed that the position of the hydrogen in the NH group, which could not be accurately determined by X-ray diffraction, is identical in both polymorphs A and B of Tegoprazan, corresponding to Tautomer 1, as shown in Figure 1. These results show that the crystal structures of polymorphs A and B are not desmotropic [16,17].
Building on this, the structure of Tautomer 1 was utilized as the basic structure for polymorphs A and B. Their crystal structures were determined using X-ray diffraction data collected with a laboratory powder X-ray diffractometer, employing simulated annealing followed by Rietveld refinement. Both polymorphs were found to crystallize in the monoclinic space group P21 with Z = 4, where the asymmetric unit contains two symmetrically independent molecules.
2. Results and Discussion
2.1. Structural Analysis of Tegoprazan Using NMR Spectroscopy
2.1.1. Analysis of Tautomerization in Tegoprazan
Tegoprazan contains a benzimidazole moiety, and its tautomerization exchange rate in DMSO-d6 is relatively slow, likely due to steric and electronic factors inherent to its molecular structure. This slow exchange rate impacts NMR analysis by allowing distinct peaks for Tautomer 1 and Tautomer 2 to appear in the spectrum, making the precise determination of coupling constants challenging as overlapping signals and broadened peaks complicate spectral interpretation. This allows both Tautomer 1 and Tautomer 2 to be observed simultaneously in the same NMR spectrum. Notably, the two tautomers exhibit distinct chemical shifts for corresponding carbon and hydrogen atoms due to variations in their electronic environments and bonding arrangements, enabling clear differentiation and detailed structural analysis of Tegoprazan in DMSO-d6. In this study, each tautomer present in DMSO-d6 was analyzed simultaneously in a mixed state, and each peak was assigned to the corresponding tautomer. NMR measurements were performed at a temperature of 23 ± 3 °C.
The differences between the Tegoprazan Tautomers 1 and 2 were confirmed by 1H-NMR and 13C-NMR in DMSO-d6, as shown in Tables S1 and S2. These chemical shifts and 1H-1H spin-spin coupling constants were validated using 1D (1H, 13C) NMR, as well as 2D techniques, including COSY, ROESY, HSQC, and HMBC. In an aliphatic six-membered ring, the coupling constant of hydrogens bonded to adjacent carbons differs significantly depending on their spatial orientation. When the hydrogens are in an axial-axial or geminal relationship, the coupling constant ranges from 7–15 Hz, which is larger than the 1.5–5 Hz observed for equatorial-equatorial or axial-equatorial hydrogens. This difference results in distinctive splitting patterns in the 1H-NMR spectrum. In the case of Tegoprazan, the aliphatic carbons 2 and 3 in the chromane moiety exhibit hydrogens bonded to adjacent carbons that present triplet-like splitting patterns when in an axial orientation. Due to tautomerism, with Tautomer 1 and Tautomer 2 coexisting, slight differences in chemical shifts are observed. The differences in value were about those of axial-axial or geminal coupling constants. This overlap of peaks results in a quartet-like pattern. In the chromane moiety, such peaks were indeed identified and attributed to axial hydrogens. In contrast, equatorial hydrogens, with their smaller coupling constants, exhibit doublet-like splitting patterns. The hydrogens bonded to carbons 2 and 3 in the chromane moiety are easily distinguishable based on their chemical shifts, which vary significantly depending on whether the carbon is also bonded to oxygen. This difference further facilitates assignment (See Supplementary Materials Figure S1-S27). C2 of chromane moiety adjacent to oxygen was downfield from C3, appearing ato about 62 ppm, and hydrogen bonded to C2 was also downfield, appearing at about 4.3 ppm The hydrogens of the aliphatic carbons in the chromane moiety of Tegoprazan in DMSO-d6 were labeled as multiplets is to Table S1 and S2 due to the complications introduced by slow tautomerism, which causes overlapping peaks and hinders the precise determination of coupling constants.
The most easily identifiable carbons and hydrogens in Tegoprazan are the chiral carbon (C4) and hydrogen (H4) of chromane moiety. This chiral center is a methine group, consisting of a single carbon atom bonded to a hydrogen atom and an oxygen atom. The chemical shifts of these nuclei were confirmed using HSQC spectra of the positive peaks whose integrals correpons to one proton, showing carbon shifts at 63.05 ppm and 62.59 ppm, and hydrogen shifts at 6.18 ppm and 5.88 ppm, respectively. These two pairs of signals, unique within the structure, served as reference points for assigning the chemical shifts of other carbons and hydrogens in each tautomer. Cross-peaks from COSY, ROESY, HSQC, and HMBC spectra were utilized to identify and assign the chemical shifts, starting from these pairs associated with the chiral center. Fluorine assignments were further clarified using 13C-19F HSQC and 13C-19F HMBC experiments. It must be clarified whether the carbon at the bonding site via oxygen between the chromane and benzimidazole moieties corresponds to the C4 of Tautomer 1 of benzimidazole or the C7 of Tautomer 2.
Initially, the hydrogen at 5.88 ppm was used as a reference for assignment, as its correlation peak in the HMBC spectrum was relatively more distinct compared to the hydrogen at 6.18 ppm. In the process of attributing the chromane moiety, the hydrogen at 5.88 ppm was found to cross-peak with four carbons in HMBC, three of which were carbons of the chromane moiety. The remaining carbon at 141.80 ppm that could not be attributed to the chromane moiety is the carbon of the benzimidazole moiety, which is bonded to chromane via oxygen. Subsequently, using the carbon at 141.80 ppm as a reference, the majority of the hydrogen and carbon atoms were assigned to the benzimidazole moiety, based on the correlation peaks observed in the 2D HMBC and HSQC spectra, as shown in Figure 2. The 1H-NMR analysis reveals distinct splitting patterns for the aromatic hydrogens in the benzimidazole and chromane moieties of Tegoprazan. In the benzimidazole moiety, hydrogens on the benzene ring are located at meta positions relative to each other, resulting in long-range coupling constants of 1–3 Hz. Consequently, these hydrogens appear as singlet-like peaks in the spectrum. In contrast, the aromatic hydrogens on the chromane moiety’s benzene ring, despite also being in meta positions, do not exhibit singlet-like peaks due to the influence of fluorine substitution. Fluorine, attached to a carbon adjacent to the hydrogen-bonded carbon, interacts with hydrogens via spin-spin coupling akin to proton-proton interactions. The coupling constants for ortho position (3JHF) interactions are approximately 6–10 Hz, while those for meta position (4JHF) interactions range from 5 to 6 Hz. Thus, the peak shapes for the aromatic hydrogens in the benzimidazole and chromane moieties are readily distinguishable. In the HMBC spectrum, the carbon at 141.80 ppm exhibits two cross-peaks with singlet-like hydrogens, confirming their assignment to the aromatic hydrogens of the benzimidazole moiety. Among these cross-peaks, the stronger one corresponds to hydrogen 6 closer to the 141.80 ppm carbon. Another one was identified hydrogen 4. Additionally, these aromatic hydrogens show cross-peaks with the carbonyl carbon of the amide group in the HMBC spectrum. The carbonyl carbon further exhibits cross-peaks with the hydrogens of the methyl group attached to the amide nitrogen, solidifying the structural assignments.
C3a and C7a of the imidazole moiety were identified by correlation with a broad singlet-like hydrogen peak around 12.4 ppm with carbon that cross peaks with hydrogen 4 and hydrogen 6 of the benzimidazole moiety identified above in the HMBC spectrum. One such cross-peak corresponds to a hydrogen peak at 12.4 ppm, which also showed a stronger correlation with the carbon at 144.62 ppm. The other two cross-peaks were weaker and of similar intensity, suggesting that these are cross-peaks with carbons C2, C3a, and C7a. C2 exhibited a strong cross-peak with the hydrogen peak of the methyl group at 2.43 ppm in the HMBC spectrum. The carbon of this methyl group was identified as C9, the methyl group attached to imidazole.
Here, the studies by Pinto et al. [18] and Nieto et al. [15] were utilized to precisely identify the position of the NH group in the imidazole ring. Pinto et al. reported that the long-range coupling constants between the NH proton and carbon in imidazole are 2JCH = 2.2 Hz and 3JCH = 8.8 Hz. Here, the carbon of the benzimidazole moiety attached via oxygen to the chiral central carbon of the chroman moiety was assumed to be C7. In other words, it was assumed to have the structure of Tautomer 2. In Tautomer 2, the carbon C7a would appear upfield compared to C3a, which is not adjacent to a carbon bonded to oxygen. In the HMBC measurement, with the long-range coupling set to 8 Hz, the carbon showing a relatively strong correlation peak corresponding to a three-bond coupling (3JCH = 8) with the NH proton was identified as carbon 3a, with a chemical shift of 144.62 ppm. The cross peak between the carbon peak at 125.74 ppm and the NH group hydrogen in the HMBC spectrum indicates a two-bond coupling (2JCH) that is weaker in intensity than the three-bond coupling at 144.68 ppm (3JCH = 8.8 Hz). If the number of each atom in Tautomer 2 is fixed and the NH group hydrogen is bonded to N3 (thus, when the position of the hydrogen in the NH group changes, the numbering changes according to the IUPAC nomenclature, so fixed the number), the cross-peak between the upfield carbon C7a and the NH group hydrogen would be the strongest.
On the other hand, the position of the NH group was also determined to be identical using the method proposed by Roslund et al., which distinguishes between 2JH,C and 3JH,C by utilizing the sign of the coupling constants (the cross-peak enclosed in the red rounded rectangle in Figure 2, and see Figure S25) [19,20].
Hence, the hydrogen, carbon, and fluorine identified from the chiral central hydrogen at 5.88 ppm were found to be reasonable identifications when the structure was set to Tautomer 2.
In benzimidazole, when carbon 4 is assigned to the trans position and carbon 7 to the cis position relative to the NH group, the chemical shift difference of 2-methylbenzimidazole in DMSO-d6 is approximately 7 ppm in 13C-NMR, with the trans-positioned carbon appearing downfield [15]. Similarly, when substituents are bonded to carbons 4 and 7 of the benzimidazole moiety, some difference is observed in the DMSO-d6 solution. Therefore, the carbon of benzimidazole moiety, which is bound via oxygen to the chromane moiety in Tautomer 1, is expected to appear downfield from 141.80 ppm, as explained above, since it is in the trans position relative to the NH group. In fact, the related cross peak between the other 6.18 ppm chiral central hydrogen peak and the carbon of the benzimidazole moiety bonded via oxygen was verified in the HMBC spectrum to be a very weak cross peak with a carbon peak at 146.16 ppm. In the case of Tegoprazan, the bonded carbons from the chromane moiety of Tautomer 1 and Tautomer 2 are trans and cis for the NH group, respectively. The difference in chemical shift was as small as 4.36 ppm compared to 7 ppm for 2-benzimidazole. Subsequently, the remaining unassigned hydrogen, carbon, and fluorine were identified using the same method as described above, with respect to the hydrogen at 6.18 ppm, leading to the elucidation of an additional chromane moiety and benzimidazole moiety. Furthermore, the previously unassigned carbons, such as those at positions 5 or 6 where the amide group is attached, were similarly identified using the relative chemical shift differences based on the differences observed for 2-methylbenzimidazole in DMSO-d6, even in the absence of observable correlation peaks.
2.1.2. Identification of the Tautomer for Tegoprazan Polymorphs A and B
To analyze the crystal structure using powder XRD through Simulated Annealing and Rietveld refinement, it is essential to establish a fundamental structural model. Consequently, a search for the ground-state structure and iterative trial-and-error processes must be conducted. To minimize the number of iterations, it is preferable to exclude structures with low probabilities of existence. For this purpose, it is necessary to investigate the potential of two tautomers that could result in the two polymorphs of Tegoprazan. Solid-state 13C-NMR was employed for this verification. The two tautomers differ in the position of the NH group, and their presence in the crystal affects the observed spectral features as follows:
- If both tautomers coexist within a single crystal, multiple peaks will be observed for each carbon.
- If only one tautomer exists and the asymmetric unit contains a single molecule, a single peak will appear for each carbon.
- If two distinct molecules are present, pairs of peaks in close proximity will be observed, resulting in a simpler spectrum compared to that of coexisting tautomers.
This approach allows the assessment of tautomer distribution and contributes to determining the structural model [21,22,23,24,25].
The 13C-NMR results for each tautomer identified in Section 2.1.1 are mixed-state NMR spectra of the two tautomers, so they were separated into separate charts to facilitate comparison with solid-state 13C-NMR. The work was performed by the Mnova program. Their spectra were compared with the solid-state 13C-NMR of polymorphs A and B as shown in Figure 3.
Figure 3 (A) presents the 13C-NMR spectrum of Tegoprazan measured in DMSO-d6, where all the carbon peaks of Tegoprazan are clearly observed. While Tegoprazan dissolves well in CDCl3, the rapid hydrogen transfer due to tautomerism makes some peaks very weak and difficult to detect. In contrast, the use of DMSO-d6 allows for clear observation of the carbon peaks corresponding to both Tautomer 1 and Tautomer 2.
Figure 3 (B) and (C) show the solid-state 13C-NMR spectra of Polymorphs A and B of Tegoprazan, respectively. Although the shape of the spectra differs from that of the liquid-state spectrum in Figure 3 (A), they appear similar overall. Characteristic peaks such as the methyl group attached to the imidazole moiety's C2, the two methyl groups of the amide, and the carbonyl group are readily distinguishable and consistently appear as paired peaks. Other peaks also appear to follow this pairing pattern.
This observation suggests two possible scenarios: (1) the presence of both tautomers in the crystal due to tautomerism, or (2) a single tautomer exhibiting conformational differences due to hydrogen bonding or intermolecular interactions, giving the appearance of two distinct molecules. The significant structural difference between Tautomer 1 and Tautomer 2 lies in the benzimidazole moiety. The chemical shift region between 125–156 ppm, highlighted by the red circles in the structure shown on the right side of Figure 3, corresponds to carbons observed only in the liquid-state NMR spectrum. An enlarged view of this region is shown at the bottom left of Figure 3.
Figure 3 (d) and (c) display extracted spectra corresponding to Tautomer 1 and Tautomer 2, respectively, from the liquid-state spectrum in Figure 3 (A). In the solid-state spectra (Figure 3 (B) and (C)), broader peaks compared to sharper ones suggest overlap due to closely spaced chemical shifts. The paired peaks in the spectra appear adjacent to each other. Polymorphs A and B exhibit similar patterns despite slight differences in chemical shifts.
By assigning AB to C2, CD to C4, EF to C7a, GH to C3a, and IJ to C6, the spectral assignments become consistent. However, no reasonable assignments can be made for Tautomer 2 based on the observed peaks. Thus, it is concluded that both Polymorphs A and B predominantly contain Tautomer 1. If Tautomer 2 were present in the crystal, peaks corresponding to the C7 and C7a carbons of Tautomer 2 would have been observed in the solid-state spectra.
The exclusive presence of Tautomer 1 in the crystal indicates that two distinct molecules exist in the asymmetric unit (Z′ = 2). This conclusion is consistent with the appearance of paired peaks for each carbon in the solid-state 13C-NMR spectra. If both Tautomer 1 and Tautomer 2 coexisted in the crystal with Z′ = 2, a total of 20 distinct carbon peaks would be observed. However, the spectra of Polymorphs A and B support the conclusion that both have the structure of Tautomer 1. This resembles the peak characteristics of the solid-state 13C-NMR spectrum of testosterone with an α-form polymorph (Z' = 2) [23].
2.2. Structure Determination Using Laboratory X-Ray Diffraction Data
2.2.1. Conformational Analysis of Tegoprazan Prior to Polymorph A and B Refinement
Using the results from the liquid- and solid-state 13C-NMR analysis, which indicated that Tegoprazan exists as Tautomer 1 in the crystalline state, we initiated conformational energy calculations before performing simulated annealing and Rietveld refinement for Polymorphs A and B. Tegoprazan contains seven rotatable bonds (excluding hydrogens), allowing for numerous possible conformers. Since crystallization typically occurs in the lowest-energy conformational state, theoretical calculations were performed to identify the conformer most suitable for crystallization.
Initially, the Conformational Search feature of the Schrödinger software was employed, resulting in 44 conformers. These conformers were overlaid using the benzimidazole moiety as the fixed axis, as shown in Figure 4 (a). The force field was set to OPLS4 (Optimized Potentials for Liquid Simulations 4), with chloroform (CHCl3) selected as the solvent. Although vacuum conditions are often used, CHCl3 was chosen because Tegoprazan is known to crystallize from solvents such as dichloromethane. The method was set to Mixed torsional/Low-mode sampling, with the energy window for saving structures set to 21 kJ/mol and the maximum atom deviation cutoff set to 0.5 Å, ensuring the identification of a sufficient number of candidate conformers.
Each of the 44 conformers was subsequently geometry-optimized using the Minimize function, followed by energy calculation using the Calculation Energy feature. The same OPLS4 force field and CHCl3 solvent settings were applied during the energy calculations. From the resulting conformers, the four lowest-energy conformers were selected for further analysis. Their overlay is shown in Figure 4 (b).
In the overlay, the chromane moiety aligns closely across all four conformers, while the amide moiety exhibits variations in four distinct directions. This observation suggests that the amide region has some flexibility, with the methyl groups on the amide experiencing minimal steric hindrance, thereby allowing multiple low-energy states within an acceptable range.
The conformational search results do not account for crystal packing effects or intermolecular interactions present in the crystalline state. It is well-documented that molecular conformations often differ within crystal structures due to packing forces, as evidenced by the numerous organic compounds with Z' values of 2 or greater reported in the literature [21]. Therefore, the conformations identified in the search do not necessarily correspond to the molecular conformations observed in the crystal structure. Nevertheless, it is reasonable to assume that these identified conformations approximate the actual molecular geometries to some extent.
2.2.2. Simulated Annealing and Rietveld Refinement
Simulated annealing for crystal structure determination using powder XRD incorporates a process that randomly adjusts dihedral angles in freely rotating bonds to identify optimal conformations. If the initial structure used for this process closely resembles the actual molecular conformation within the crystal, faster convergence of the optimization is expected. The four conformers with the lowest total energy exhibit nearly identical positions for the chromane moiety, with only slight variations in the orientation of the amide group. Therefore, the choice of any of these conformers as the initial structure for simulated annealing is not expected to significantly affect the computational time required for the process. Thus, one of the four conformers was arbitrarily selected [See Table S5, Figure S29].
The powder X-ray diffraction data were collected using a RIGAKU SmartLab diffractometer operating in Bragg-Brentano geometry, configured to utilize only the Cu Kα₁ radiation (λ = 1.540593 Å) through a monochromator. The 2θ range measured was from 2° to 45°, while the range used for simulated annealing and Rietveld refinement was from 5° to 35°.
Simulated annealing and Rietveld refinement were performed using the EXPO2014 program [26]. In the simulated annealing process, XRD data, the Kα1 wavelength from the XRD instrument, the constituent elements, and their quantities were input into the program. Simulated annealing was selected as the structural analysis method, and the program was executed. The most probable crystal cell was chosen, and all simulated annealing options were set to automatic. The random seed was set to 1, and the number of runs was set to 100. Initially, a single molecule was used as the model for the simulation, but the Rwp (weighted residual factor) value, which is used to assess the quality of the results, never fell below 50%. Two molecular models were employed to analyze the polymorphs A and B.
Using the two-molecule model, simulated annealing resulted in an Rwp value of approximately 10%. Based on this outcome, Rietveld refinement was performed using the two-molecule structure. In the Rietveld refinement, hydrogen atom treatment was carried out with the hydrogen atom parameters constrained. A total of 68 restraints were applied, comprising 64 restraints (32 per molecule) excluding covalent bonds involving hydrogen and 4 angular restraints. For the hydrogen atom constraints, the atomic displacement parameter for hydrogen (ADP(H)) was set to 1.20, describing the amplitude and range of thermal vibrations in the crystal structure analysis.
The values for the restraints were determined by averaging bond lengths and angles obtained from searchable derivatives of benzimidazole and chromane in the CCDC crystal database. These values were compared with theoretical values derived from the structure optimization of the Tegoprazan molecule. Specifically, bond distances and four C–O–C angles centered on oxygen atoms were used as references.
The peak shape function was modeled using the Pearson VII function, and the March–Dollase preferred orientation correction was applied to account for crystallographic texture. For the orientation correction, various hkl planes (e.g., 100, 010, 001, 110, 101, 011, and 111) were systematically tested to identify the most effective direction for improving refinement accuracy. For both polymorphs A and B, the best results were obtained using the hkl = 100 orientation.
Figure 5 shows the powder XRD pattern after Rietveld refinement, including the experimental data, background, and the difference between the observed and calculated diffraction data based on the final structure, represented by a black solid line. The good agreement between the experimental and theoretical values is evident.
The analysis yielded Rwp values of 9.1 % for polymorph A and 4.9 % for polymorph B, with corresponding goodness of fit coefficients (χ²) of 1.271 and 3.791, respectively. These results indicate good agreement between the experimental data and the calculated XRD data for the converged crystal structures, supporting the reliability of the analysis. Table 1. presents the detailed crystal structures of Tegoprazan polymorphs A and B.
2.3. Crystallographic Structure and Supramolecular Features of Tegoprazan Polymorphs A and B
2.3.1. Crystallographic Structure of Tegoprazan Polymorphs
Tautomerism of Tegoprazan was investigated through liquid-state NMR, and the resulting data, along with solid-state 13C-NMR spectra of polymorphs A and B, confirmed that the Tegoprazan molecules in both polymorphs exist as Tautomer 1. Structural optimization was performed to generate initial structures, and the powder XRD data for the two polymorphs were analyzed using simulated annealing and Rietveld refinement, leading to the elucidation of their structures as described above.
The crystal data for polymorphs A and B of C20H19F2N3O3 (M = 387.38 g/mol) are as follows: both polymorphs are monoclinic, with space group P21 (no. 4), Z = 4, and were measured at 295 °K. A total of 3001 reflections were collected (5.0 ° ≤ 2Θ ≤ 35.0 °). The unit cell parameters for polymorph A are a = 9.7638(5) Å, b = 21.5210(12) Å, c = 9.3267(5) Å, and β = 100.0857(16) °. For polymorph B, the parameters are a = 22.4071(18) Å, b = 8.9485(7) Å, c = 9.6439(8) Å, and β = 97.3652(15) °. The volume for polymorph A is V = 1929.50(18) ų, and for polymorph B, is V = 1917.8(3) ų. Both polymorphs exhibit similar physical properties, with μ(CuKα) = 0.878 and 0.875 mm–1, and calculated densities of Dcalc = 1.334 and 1.329 g/cm³, respectively. The R-factors for polymorph A were Rp = 0.069 and Rwp = 0.091, and for polymorph B, Rp = 0.037 and Rwp = 0.049.
Figure 6 presents a simplified Capped Stick representation of the ellipsoid model shown in Figure 5(b), highlighting the molecular framework with hydrogen atoms for improved clarity. In polymorph A, one of the molecules closely resembles the initial structure used to begin the simulated annealing process, while the other molecule adopts a conformer with a total energy approximately 4.5 kcal/mol higher (Figure S32). In polymorph B, the two molecules are nearly identical, differing only in the orientation of the amide group. As described earlier, a change in the orientation of the amide group alone has a minimal impact on the total energy. Both polymorphs are energetically less favorable than their initial structures, with polymorph B showing an energy increase of approximately 4.5 kcal/mol. This suggests that polymorph B is structurally less stable compared to polymorph A. Nevertheless, it is worth noting that the packing during crystallization, as well as intermolecular interactions such as hydrogen bonding and π-π interactions, may contribute to additional stabilization. These factors suggest that the overall stability of the structure observed in the refinement results may be better understood in the context of the entire crystal rather than individual molecules in isolation.
It was determined that both of these polymorphs adopt a Z' = 2 configuration, where two distinct molecules, rather than a single one, occupy the asymmetric unit.
2.3.2. Supramolecular Features of Tegoprazan Polymorph A
Based on the crystal structure elucidated above, we can now consider the state in which a single molecule crystallizes. Focusing on the hydrogen atoms of the NH groups that are within effective hydrogen bonding distances, it can be observed that the carbonyl oxygen of the amide group interacts with these hydrogen atoms, as shown in Figure 7. In the projection of the structure onto the (101) plane (Figure 7 (a)), alternating conformers are linked in a zigzag pattern by hydrogen bonds with distances of 1.757 Å and 2.034 Å in the direction indicated by the arrows. The figure reveals three distinct "strands," which do not appear to interact with each other.
In the projection onto the (10-1) plane shown in Figure 7 (b), three layers can be observed along the horizontal direction. One of the two hydrogens on the methylene group adjacent to the oxygen of the Chromane moiety forms two π-H interactions with the centroid of the imidazole ring of the benzimidazole moiety, with distances of 2.404 Å and 2.870 Å (Table 2.). These interactions are believed to contribute to the stabilization of the upper and lower layers. Additionally, although the three "strands" in Figure 7(a) appear to be on the same plane, it is evident that the middle strand corresponds to either the upper or lower layer, as the structure suggests.
Hydrogen-bond geometry (Å, °); Cg1 and Cg2 are the centroids of the N1-C5-N2-C7-C6 and N51-C53-N52-C54-C55 ring, respectively.
This structural arrangement highlights the role of hydrogen bonding and π-H interactions in stabilizing the overall crystal packing.
2.3.3. Supramolecular Features of Tegoprazan Polymorph B
Polymorph B, as shown in Figure 6, consists of two conformers that differ solely due to the rotational changes in the carbon-carbon bond between the carbonyl carbon of the amide group and the benzimidazole moiety. This conformational difference is a result of the rotation around this bond.
The crystallization behavior of polymorph B of Tegoprazan, obtained through simulated annealing and Rietveld refinement, was observed from the projections of two planes, (010) and (10-1) (Figure 8). In the projection of the (10-1) plane (Figure 8 (b)), hydrogen bonding interactions were confirmed between the NH group hydrogen and the carbonyl oxygen of the amide group, with bond distances of 1.839 Å and 2.026 Å, similar to those observed in polymorph A. Upon further inspection, it was found that identical conformers exhibit the same hydrogen bonding distances. The central strand has a distance of 1.839 Å, while the two outer strands have hydrogen bonding distances of 2.026 Å (Table 3). Additionally, although the conformers on the sides are identical, the central strand corresponds to a different conformer.
Furthermore, the fluorine-substituted benzene ring of the chromane moiety is positioned almost parallel to and overlapping with the adjacent benzene ring of the chromane moiety. The distance between the centers of these benzene rings, as seen in the projection on the (010) plane, as Figure 8 (a), is 3.707 Å, which is within the range that allows for π–π interactions. This interaction is believed to contribute to the stabilization of the crystallization process, as it involves interactions between adjacent strands. The π–π interaction is characterized by an angle of 6.023°, a centroid-to-centroid distance of 3.707 Å, and a slip distance of 0.914 Å. These interactions are anticipated to play a role in stabilizing the crystal structure
This structural arrangement highlights the role of hydrogen bonding and π-π interactions in stabilizing the overall crystal packing.
2.4. Study of the Crystal Structures of Tegoprazan: Insights into Polymorphs A and B
While single-crystal XRD experiments provide definitive structural elucidation, many pharmaceutical compounds, including Tegoprazan, pose significant challenges in forming suitable single crystals. Moreover, accessing synchrotron radiation facilities can be cost-prohibitive and logistically complex. This study utilized laboratory-scale XRD instruments combined with cost-effective Rietveld refinement programs to achieve accurate structural determination.
Tautomerism in Tegoprazan was predicted based on its molecular structure and further investigated using liquid-state NMR spectroscopy. In CDCl₃, rapid tautomerization resulted in indistinguishable peaks, whereas in DMSO-d6, distinct peaks corresponding to individual tautomers were observed. These findings are critical, as tautomerism can influence formulation, pharmacological properties, and stability. For both polymorphs A and B, solid-state ¹³C-NMR confirmed the presence of only Tautomer 1 within the crystal lattice.
Using Tautomer 1 as the initial structure, iterative simulated annealing and Rietveld refinement determined that both polymorphs A and B crystallize in the monoclinic crystal system with the space group P2₁ and Z = 4. The unit cell parameters of polymorphs A and B are summarized in Table 1.
Supramolecular analysis revealed distinct hydrogen-bonding networks and interactions. Polymorph A forms hydrogen-bonded chains with alternating conformers stabilized by π–H interactions, while polymorph B displays unique strands linked by hydrogen bonds and stabilized by π–π interactions between chromane moieties. Polymorph B's conformer was found to have an energy difference of approximately 4.5 kcal/mol when compared to the lowest-energy conformer detected in conformational search studies, which corresponds to one of the conformers in polymorph A. Despite this energy difference, the higher-energy conformer persists within polymorph B, demonstrating the critical role of stabilizing interactions such as hydrogen bonding and π–π interactions. These findings highlight the intricate balance of forces underlying the stability of Tegoprazan polymorphs and their relevance to pharmaceutical applications.
3. Materials and Methods
Tegoprazan polymorphs A and B were sourced from HK inno.N Corporation and Anhui Haoyuan Pharmaceutical Co., Ltd., respectively, and used without further modification.
The 1H, 19F and 13C NMR spectra of crystalline forms A and B were recorded using a JEOL JNM-ECX400II spectrometer (1H: 400 MHz, 13C: 100 Hz,19F: 376 MHz) at room temperature (25 °C), with DMSO-d6 as the solvent and tetramethylsilane (SiMe4) as the internal reference. 19F NMR Reference Standard was trifluoroacetic acid (CF3COOH), set to -76.55 ppm. The liquid and solid-state NMR measurement conditions were shown in Table S9. The solid-state 13C NMR spectra of phases A and B were acquired using cross-polarization magic angle spinning (13C CP/MAS) on a Bruker AVANCE III HD 400 spectrometer (Germany). The spectra were recorded with a 4 mm zirconia rotor at a spinning speed of 12 kHz, at a frequency of 100.6 MHz. The acquisition time was 37.7 milliseconds (ms), with a relaxation delay of 3 seconds (s), contact times of 2 ms, and 512 scans. The adamantane signal (δ = 38.48 ppm) was used as an external reference. NMR data were processed using MestReNova software (version 14.2.1-27684; Mestrelab Research, 2021).
X-ray diffraction measurements of all samples were conducted using a RIGAKU SmartLab Bragg-Brentano diffractometer in powder X-ray diffraction mode. Data were collected at 295 °K in continuous 2θ-θ scan mode, with a 2θ range of 5 °–35 °. The scan rate was 1°/min, up to 20 °. Single-wavelength Cu Kα1 radiation (λ = 1.540493 Å) was employed, with a voltage of 40 kV and a current of 50 mA, utilizing the D1 detector for signal detection.
Simulated annealing and Rietveld refinement were performed using EXPO 2014 version 1.22.11. Crystal structure imaging and various calculations were conducted with Mercury 2024.3.1 (Build 428097), Olex2 v1.5-alpha, and VESTA ver. 3.90.1a.
The conformational search and energy minimizations were performed using the Schrödinger Suite 2023-1. The OPLS4 force field was employed for geometry optimizations, and single-point energy calculations were conducted using the Jaguar module at the DFT (B3LYP/6-31G(d)) level of theory. Solvent effects were considered using the PCM model with dichloromethane as the solvent.
4. Conclusions
This study demonstrates a practical approach to crystal structure analysis by employing the established Structure Determination from Powder Diffraction (SDPD) method, combined with complementary spectroscopic techniques, including liquid-state and solid-state NMR. Tegoprazan, a compound known to exhibit tautomerism, was selected as a model system. Liquid-state NMR revealed the presence of multiple tautomers in solution, with solvent-specific behavior. In CDCl₃, rapid tautomerization resulted in indistinguishable NMR peaks, while in DMSO-d6, distinct peaks corresponding to individual tautomers were observed. Solid-state ¹³C-NMR provided crucial evidence confirming the exclusive presence of Tautomer 1 within the crystal lattices of polymorphs A and B. These findings underscore the indispensable role of NMR spectroscopy in complementing SDPD for a comprehensive understanding of tautomeric behavior in the solid state.
Using Tautomer 1 as the initial molecular model, iterative simulated annealing and Rietveld refinement with laboratory-scale XRD instrumentation enabled the successful elucidation of the crystal structures of polymorphs A and B. Both polymorphs were found to crystallize in the monoclinic system with the space group P2₁ and Z = 4. Polymorph A was determined to consist of one molecule in a near-ground-state conformation and another in a higher-energy conformation, approximately 4.5 kcal/mol above the ground state. In contrast, polymorph B comprises two identical higher-energy conformers, each with an energy approximately 4.5 kcal/mol above the ground state. These results suggest that polymorph A represents the thermodynamically more stable crystalline form under the investigated conditions.
Notably, the study raises a critical question for future research: if a crystalline system were composed entirely of molecules in near-ground-state conformations, could a more stable polymorph emerge? This question highlights the potential for discovering novel, more stable crystal forms through systematic investigation of conformational and packing stability.
Furthermore, supramolecular analysis revealed that polymorph A forms hydrogen-bonded chains stabilized by π–H interactions, while polymorph B exhibits unique hydrogen-bonded strands stabilized by π–π interactions between chromane moieties. These findings emphasize the importance of intermolecular interactions, such as hydrogen bonding and π–π stacking, in determining the stability and packing of the polymorphs.
In conclusion, this study illustrates the utility of integrating SDPD with advanced spectroscopic techniques, such as NMR, for the detailed investigation of pharmaceutical compounds exhibiting complex behaviors like tautomerism and polymorphism. While SDPD is not a novel technique, its combination with complementary methods in this study has enabled a comprehensive analysis of Tegoprazan's crystal structures. This approach broadens the accessibility of crystal structure determination, particularly in resource-limited settings, and provides valuable insights into the stability and structural diversity of pharmaceutical polymorphs. These findings serve as a foundation for further exploration of the interplay between molecular conformation, tautomerism, and polymorphism in drug development.
Supplementary Materials
The following supporting information can be downloaded at the website of this paper posted on Preprints.org, Table S1: Liquid NMR data of Tegoprazan tautomer 1; Table S2: Liquid NMR chemical shifts of Tegoprazan tautomer 2; Table S3: Liquid and solid-state NMR measurement conditions; Table S4: SS 13C-NMR chemical shift of Tegoprazan phase A; Table S5: SS 13C-NMR chemical shift of Tegoprazan phase B; Figure S1: Tegoprazan: 1H-NMR - Tautomer 1 with chemical shifts; Figure S2: Tegoprazan: 1H-NMR - Tautomer 1 (Expanded); Figure S3:Tegoprazan: 13C-NMR - Tautomer 1 with chemical shifts; Figure S4: Tegoprazan: 13C-NMR - Tautomer 1 (Expanded); Figure S5: Tegoprazan: 19F-NMR - Tautomer 1 with chemical shifts; Figure S6: Tegoprazan: 19F-NMR - Tautomer 1 (Expanded); Figure S7: Tegoprazan: 1H-1H COSY - Tautomer 1 (Assigned); Figure S8: Tegoprazan: Overlay of 1H-13C HSQC and HMBC - Tautomer 1 (Expanded); Figure S9: Tegoprazan: 1H-13C HSQC - Tautomer 1; Figure S10: Tegoprazan: 1H-13C HMBC - Tautomer 1; Figure S11: Tegoprazan: 1H-1H ROESY - Tautomer 1; Figure S12: Tegoprazan: 19F-13C HSQC - Tautomer 1; Figure S13: Tegoprazan: 19F-13C HMBC - Tautomer 1; Figure S14: Tegoprazan 1H-NMR - Tautomer 2 with chemical shifts; Figure S15: Tegoprazan 1H-NMR - Tautomer 2 (Expanded); Figure S16: Tegoprazan 13C-NMR - Tautomer 2 with chemical shifts; Figure S17: Tegoprazan 13C-NMR - Tautomer 2 (Expanded); Figure S18: Tegoprazan 19F-NMR - Tautomer 2 with chemical shifts; Figure S19: Tegoprazan 19F-NMR - Tautomer 2 (Expanded); Figure S20: Tegoprazan 1H-1H COSY - Tautomer 2 (Assigned); Figure S21: Tegoprazan: Overlay of 1H-13C HSQC and HMBC - Tautomer 2 (Expanded); Figure S22: Tegoprazan: 1H-13C HSQC - Tautomer 2; Figure S23: Tegoprazan: 1H-13C HMBC - Tautomer 2; Figure S24: Tegoprazan: 1H-1H ROESY - Tautomer 2; Figure S25: Correlations between the NH proton and C7a (a), C3a (b), C2 (c)[19]; Figure S26: Tegoprazan: 19F-13C HSQC - Tautomer 2; Figure S27: Tegoprazan: 19F-13C HMBC - Tautomer 2; Figure S28: Tegoprazan: Solid-state 13C-NMR – Phase A; Figure S29: Tegoprazan: Solid-state 13C-NMR – Phase B; Figure S30: Superimposition of 44 conformers and 4 optimized structures of Tegoprazan; Figure S31: The initial structure used for determining the crystal structure of Tegoprazan polymorph A and B; Figure S32: Relative Total Energies (ΔErel) (kcal/mol) of Conformers of Tegoprazan; Table S6: Relative energies of the four most stable conformers (Total Energy=Prime Energy); Table S7: Results of Simulated Annealing and Rietveld Refinement; Table S8: Hydrogen-bond geometry of Tegoprazan phase A; Table S9: Hydrogen-bond geometry of Tegoprazan phase B; Figure S33: Rietveld fit to the powder X-ray diffraction data for polymorphs A and B of Tegoprazan. (a) and (b) are polymorphs A and B of Tegoprazan, respectively; Figure S34: The ellipsoid representation of the structures of Tegoprazan polymorphs A and B; Figure S35: Crystallographic structures of Tegoprazan polymorphs A and B determined through simulated annealing and Rietveld refinement; Figure S36: Hydrogen-bonding network in Tegoprazan polymorph A as determined by simulated annealing and Rietveld refinement; Figure S37: Hydrogen-bonding and π-π interactions in Tegoprazan polymorph B as determined by simulated annealing and Rietveld refinement; Figure S38: DSC and XRD Data of Tegoprazan Polymorph B at Various Time Points During the Stability Test.
Author Contributions
Conceptualization, T.Y.; methodology, T.Y.; validation, T.Y., S.R. and J.L.; formal analysis, T.Y.; investigation, J.L. and S.R.; resources, J.K.; data curation, T.Y. and S.R.; writing—original draft preparation, S.R.; writing—review and editing, J.L.; visualization, S.R.; supervision, J.K.; project administration, T.Y.; funding acquisition, J.K. All authors have read and agreed to the published version of the manuscript.
Funding
Funding for this research was provided by: HK inno·N Corporation.
Institutional Review Board Statement
Not applicable.
Informed Consent Statement
Not applicable.
Acknowledgments
The authors thank HK inno·N Corporation for financial support. And we thank KARA (KAIST Analysis Center for Research Advancement) for their assistance with XRD measurements and KBSI (Korea Basic Science Institute) for support with SS-NMR measurements.
Conflicts of Interest
The funders had no role in the design of the study; in the collection, analyses, or interpretation of data; in the writing of the manuscript; or in the decision to publish the results.
Abbreviations
The following abbreviations are used in this manuscript:
| P-CAB | potassium ion-competitive acid block |
| PPIs | proton pump inhibitors |
| GERD | gastroesophageal reflux disease |
| XRD | X-ray Diffraction |
| DSC | Differential Scanning Calorimetry |
| SDPD | Structure Determination from Powder Diffraction |
| COSY | Correlation Spectroscopy |
| ROESY | Rotating Frame Overhauser Enhancement Spectroscopy |
| HSQC | Heteronuclear Single Quantum Coherence |
| HMBC | Heteronu-clear Multiple Bond Coherence |
| OPLS4 | Optimized Potentials for Liquid Simulations 4 |
| IUPAC | International Union of Pure and Applied Chemistry |
| ADP(H) | atomic displacement parameter for hydrogen |
| CCDC | Cambridge Crystallographic Data Centre |
References
- Takahashi, N.; Take, Y. Tegoprazan, a Novel Potassium-Competitive Acid Blocker to Control Gastric Acid Secretion and Motility. J Pharmacol Exp Ther 2018, 364, 275–286. [Google Scholar] [CrossRef]
- Kim, D.K.; Lee, K.H.; Kim, S.J.; Kim, S.J.; Lee, S.J.; Park, C.H.; Kim, B.T.; Song, G.S.; Moon, B.S.; Ryu, S.Y. Effects of Tegoprazan, a Novel Potassium-Competitive Acid Blocker, on Rat Models of Gastric Acid-Related Disease. J Pharmacol Exp Ther 2019, 369, 318–327. [Google Scholar] [CrossRef]
- Kim, M.-G.; Im, Y.-J.; Lee, J.-H.; Kim, E.-Y.; Yeom, S.W.; Kim, J.S. Comparison of Hepatotoxicity of Tegoprazan, a Novel Potassium-Competitive Acid Blocker, with Proton Pump Inhibitors Using Real-World Data: A Nationwide Cohort Study. Front Med (Lausanne) 2023, 1–9. [Google Scholar] [CrossRef]
- Jeon, H.K.; Kim, G.H.; Cheon, Y. Il; Shin, S.C.; Lee, B.J. Efficacy of Tegoprazan in Patients with Laryngopharyngeal Reflux Disease: A Preliminary Feasibility Study. J Clin Med 2023, 12. [Google Scholar] [CrossRef]
- Kim, Y.J.; Kim, E.S.; Lee, Y.; Lee, W.; Kweon, H.; Lee, S.A.; Choi, K. Do; Ko, D.H.; Heo, S.P. Crystalline Form of a Benzimidazole Derivative and a Preparation Method Thereof. Patent US009908870B2 2018, 1–9. [Google Scholar]
- Cao, M.; Chen, D.; Zhang, Z.; Chen, Y.; Jin, F.; Yang, S.; Zheng, B.; Gao, Q. Tegoprazan Crystal Form B and Preparation Method Therefor. Patent WO2024045255A1 2024, 1–23. [Google Scholar]
- Pekmez, N.Ö.; Can, M.; Yildiz, A. Spectroscopic and Electrochemical Observation of Hydrogen-Bonded Imidazole and 2-Aminoimidazole Clusters. Acta Chim Slov 2007, 54, 131–139. [Google Scholar]
- Minkin, V.I.; Garnovskii, A.D.; Elguero, J.; Katritzky, A.R.; Denisko, O. V The Tautomerism of Heterocycles: Five-Membered Rings with Two or More Heteroatoms. Adv Heterocyclic Chem 2000, 76, 157–323. [Google Scholar]
- Claramunt, R.M.; López, C.; Elguero, J. The Structure of Omeprazole in the Solid State: A 13C and 15N NMR/CPMAS Study. ARKIVOC 2005, 5–11. [Google Scholar] [CrossRef]
- García, M.Á.; Claramunt, R.M.; Solčan, T.; Milata, V.; Alkorta, I.; Elguero, J. 13C and 15N NMR Spectra of Aminobenzimidazoles in Solution and in the Solid State. Magn Reson Chem 2009, 47, 100–104. [Google Scholar] [CrossRef]
- Medina, C.P.; López, C.; Claramunt, R.M.; Elguero, J. Synthesis, reactivity, and NMR spectroscopy of 4,6- and 6,7-difluoro-3-methyl-1H-indazoles. J Heterocycl Chem 2009, 46(6), 1408–1412. [Google Scholar] [CrossRef]
- Elguero, J. Polymorphism and Desmotropy in Heterocyclic Crystal Structures. Cryst Growth Des 2011, 11, 4731–4738. [Google Scholar] [CrossRef]
- García-Báez, E. V.; Padilla-Martínez, I.I.; Cruz, A.; Rosales-Hernández, M.C. 13C-NMR Chemical Shifts in 1,3-Benzazoles as a Tautomeric Ratio Criterion. Molecules 2022, 27, 6268. [Google Scholar] [CrossRef]
- Franco-Pérez, M.; Moya-Hernández, R.; Rojas-Hernández, A.; Gutiérrez, A.; Gómez-Balderas, R. Tautomeric Ratio and Prototropic Equilibrium Constants of Tenoxicam, a 1H and 13C NMR Theoretical and Experimental Study. J Phys Chem B 2011, 115, 13593–13598. [Google Scholar] [CrossRef]
- Nieto, C.I.; Cabildo, P.; García, M.Á.; Claramunt, R.M.; Alkorta, I.; Elguero, J. An Experimental and Theoretical NMR Study of NH-Benzimidazoles in Solution and in the Solid State: Proton Transfer and Tautomerism. Beilstein J Org Chem 2014, 10, 1620–1629. [Google Scholar] [CrossRef]
- Holzer, W.; Claramunt, R.M.; López, C.; Alkorta, I.; Elguero, J. A Study in Desmotropy. Solid State Nucl Magn Reson 2008, 34, 68–76. [Google Scholar] [CrossRef]
- Rubčić, M.; Užarević, K.; Halasz, I.; Bregović, N.; Mališ, M.; Đilović, I.; Kokan, Z.; Stein, R. S.; Dinnebier, R.E.; Tomišić, V. Desmotropy, Polymorphism, and Solid-State Proton Transfer: Four Solid Forms of an Aromatic o-Hydroxy Schiff Base. Chem Eur J 2012, 18, 5620–5631. [Google Scholar] [CrossRef]
- Pinto, J.; Silva, V.L.M.; Silva, A.M.S.; Claramunt, R.M.; Sanz, D.; Torralba, M.C.; Torres, M.R.; Reviriego, F.; Alkorta, I.; Elguero, J. The Structure of Azines Derived from C-Formyl-1H-Imidazoles in Solution and in the Solid State: Tautomerism, Configurational and Conformational Studies. Magn Reson Chem 2013, 51, 203–221. [Google Scholar] [CrossRef]
- Roslund, M.U.; Virta, P.; Klika, K.D. Identification of the Major Tautomer for an Etheno Adduct of 2,6-Diaminopurine by Determination of the Sign of nJH,C. Org Lett 2004, 6, 2673–2676. [Google Scholar] [CrossRef]
- Kleinpeter, E. NMR Spectroscopic Study of Tautomerism in Solution and in the Solid State. In Tautomerism: Methods and Theories; Antonov, L., Ed.; Wiley, 2013; pp. 103–143 ISBN 9783527658824.
- Gavezzotti, A. Analysis of the Compression of Molecular Crystal Structures Using Hirshfeld Surfaces. CrystEngComm 2008, 389–398. [Google Scholar] [CrossRef]
- Weeks, C.M.; Duax, W.L.; Osawa, Y. 2a-Hydroxytestosterone Diacetate. Acta Crystallographica Section B 1975, 1502–1504. [Google Scholar] [CrossRef]
- Harris, R.K. Applications of Solid-State NMR to Pharmaceutical Polymorphism and Related Matters. Journal of Pharmacy and Pharmacology 2007, 59, 225–239. [Google Scholar] [CrossRef] [PubMed]
- León, I.; Alonso, E.R.; Mata, S.; Alonso, J.L. Shape of Testosterone. Journal of Physical Chemistry Letters 2021, 12, 6983–6987. [Google Scholar] [CrossRef] [PubMed]
- Roberts, P.J.; Pettersen, R.C.; Sheldrick, G.M.; Isaacs, N.W.; Kennard, O. Crystal and Molecular Structure of 17~-Hydroxyandrost-4-En-3-One (Testosterone). Journal of the Chemical Society, Perkin Transactions 1973, 2, 1978–1983. [Google Scholar] [CrossRef]
- Altomare, A.; Cuocci, C.; Giacovazzo, C.; Moliterni, A.; Rizzi, R.; Corriero, N.; Falcicchio, A. EXPO2013: A Kit of Tools for Phasing Crystal Structures from Powder Data. J Appl Crystallogr 2013, 46, 1231–1235. [Google Scholar] [CrossRef]
Figure 1.
The difference in the position of NH group of Tegoprazan due to tautomerization indicates the presence of two tautomeric isomers, and this structural difference can be confirmed. It is important to note that the atom labels for Tegoprazan follow IUPAC nomenclature, which differs from the labels used in NMR analysis and crystallographic analysis. The distinction in the NMR analysis is made to avoid confusion, as the same numbering is used for both the benzimidazole and chromane moieties.
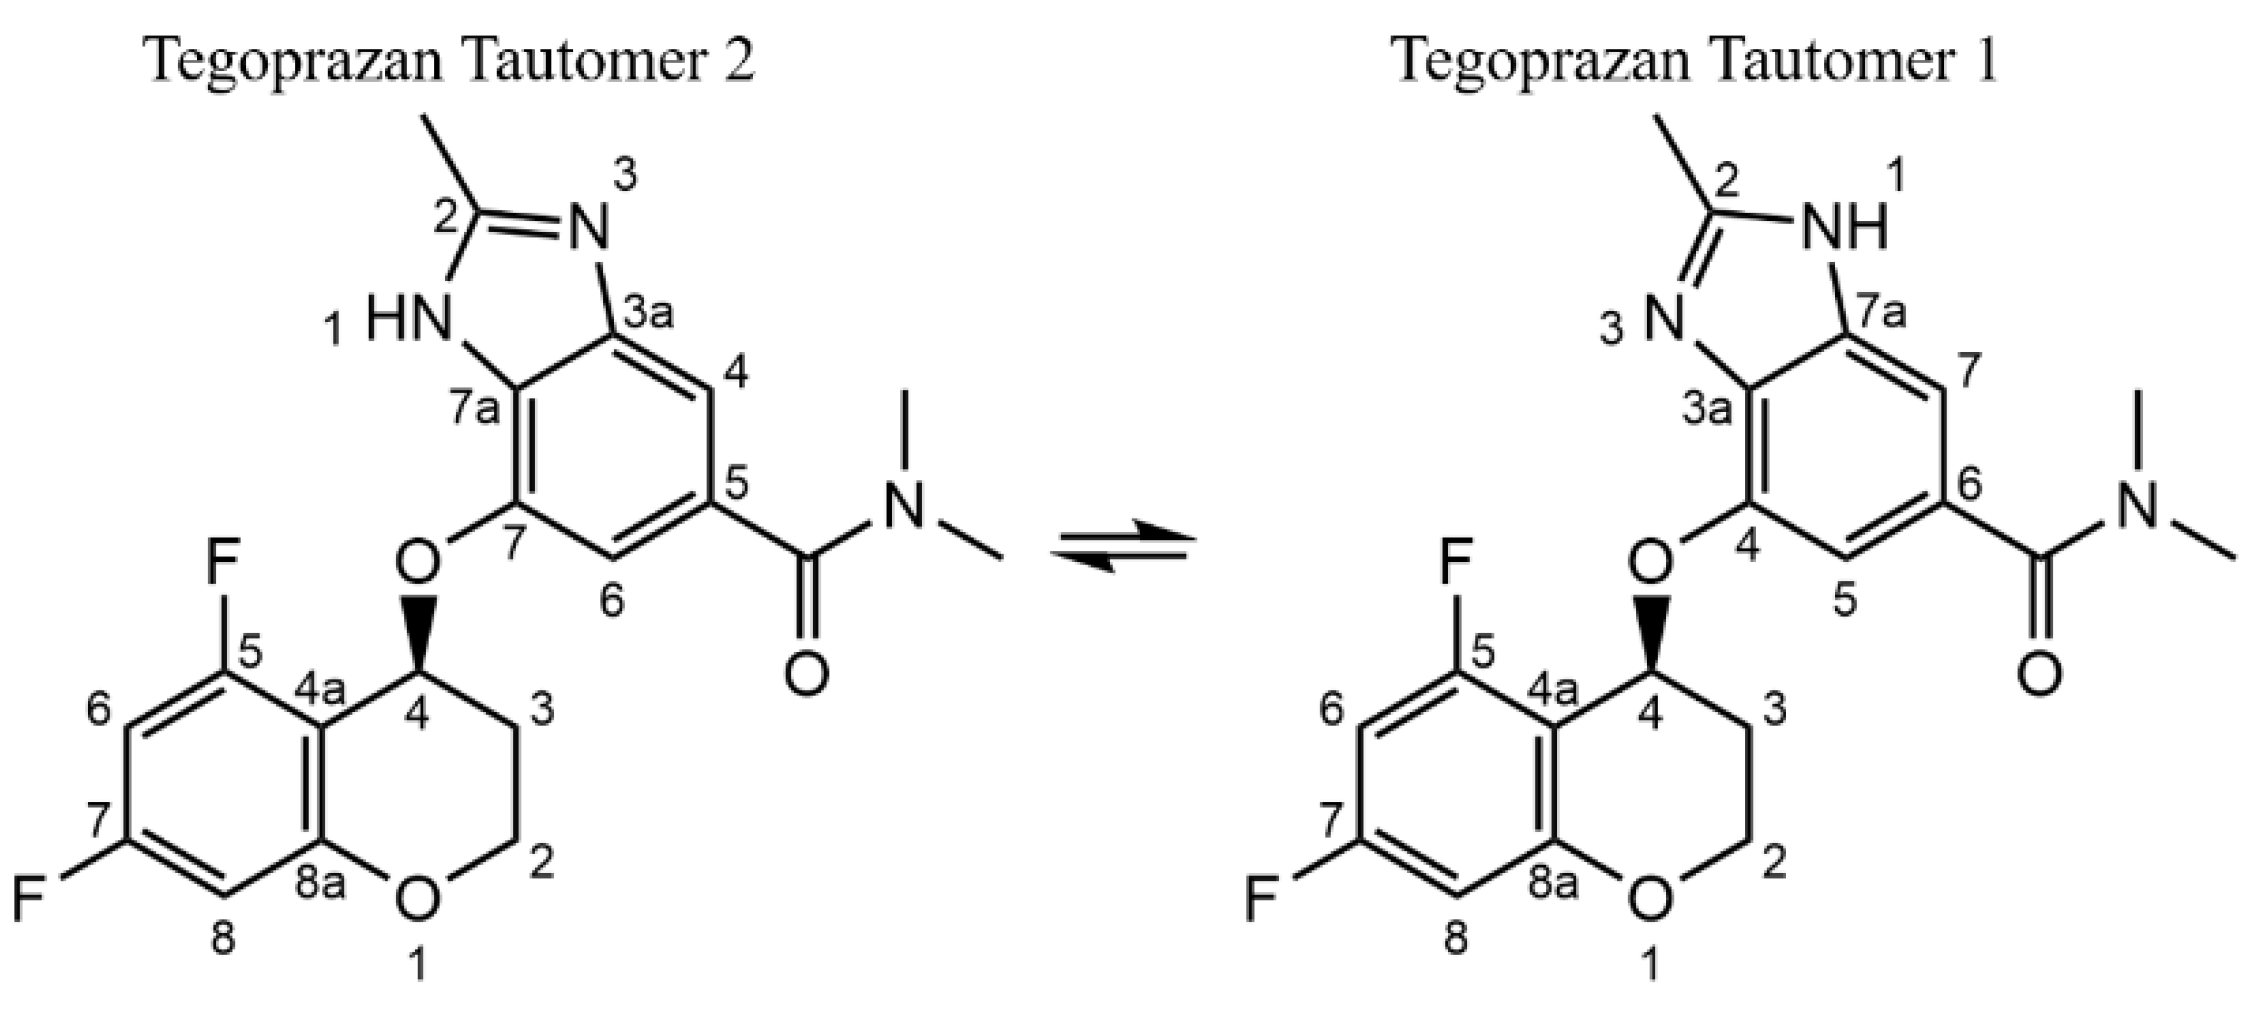
Figure 2.
Chart overlaying 1H-13C HSQC and HMBC spectra of two tautomer mixtures of Tegoprazan measured in DMSO-d6 solution on a 400 MHz NMR instrument. Starting with 5.88 ppm of hydrogen and 141.80 ppm of carbon, the associated carbon and hydrogen were assigned. In the structure of Tegoprazan shown on the left, the curved arrows indicate the positions of carbons and hydrogens that exhibit long-range coupling, as observed through HMBC cross-peaks. Within the benzimidazole moiety, some hydrogens and carbons were identified based on their correlations, enabling partial assignment of the carbon signals. The cross-peaks enclosed in the red rounded rectangle correspond to the interactions between the hydrogen of the NH group and its associated carbons.
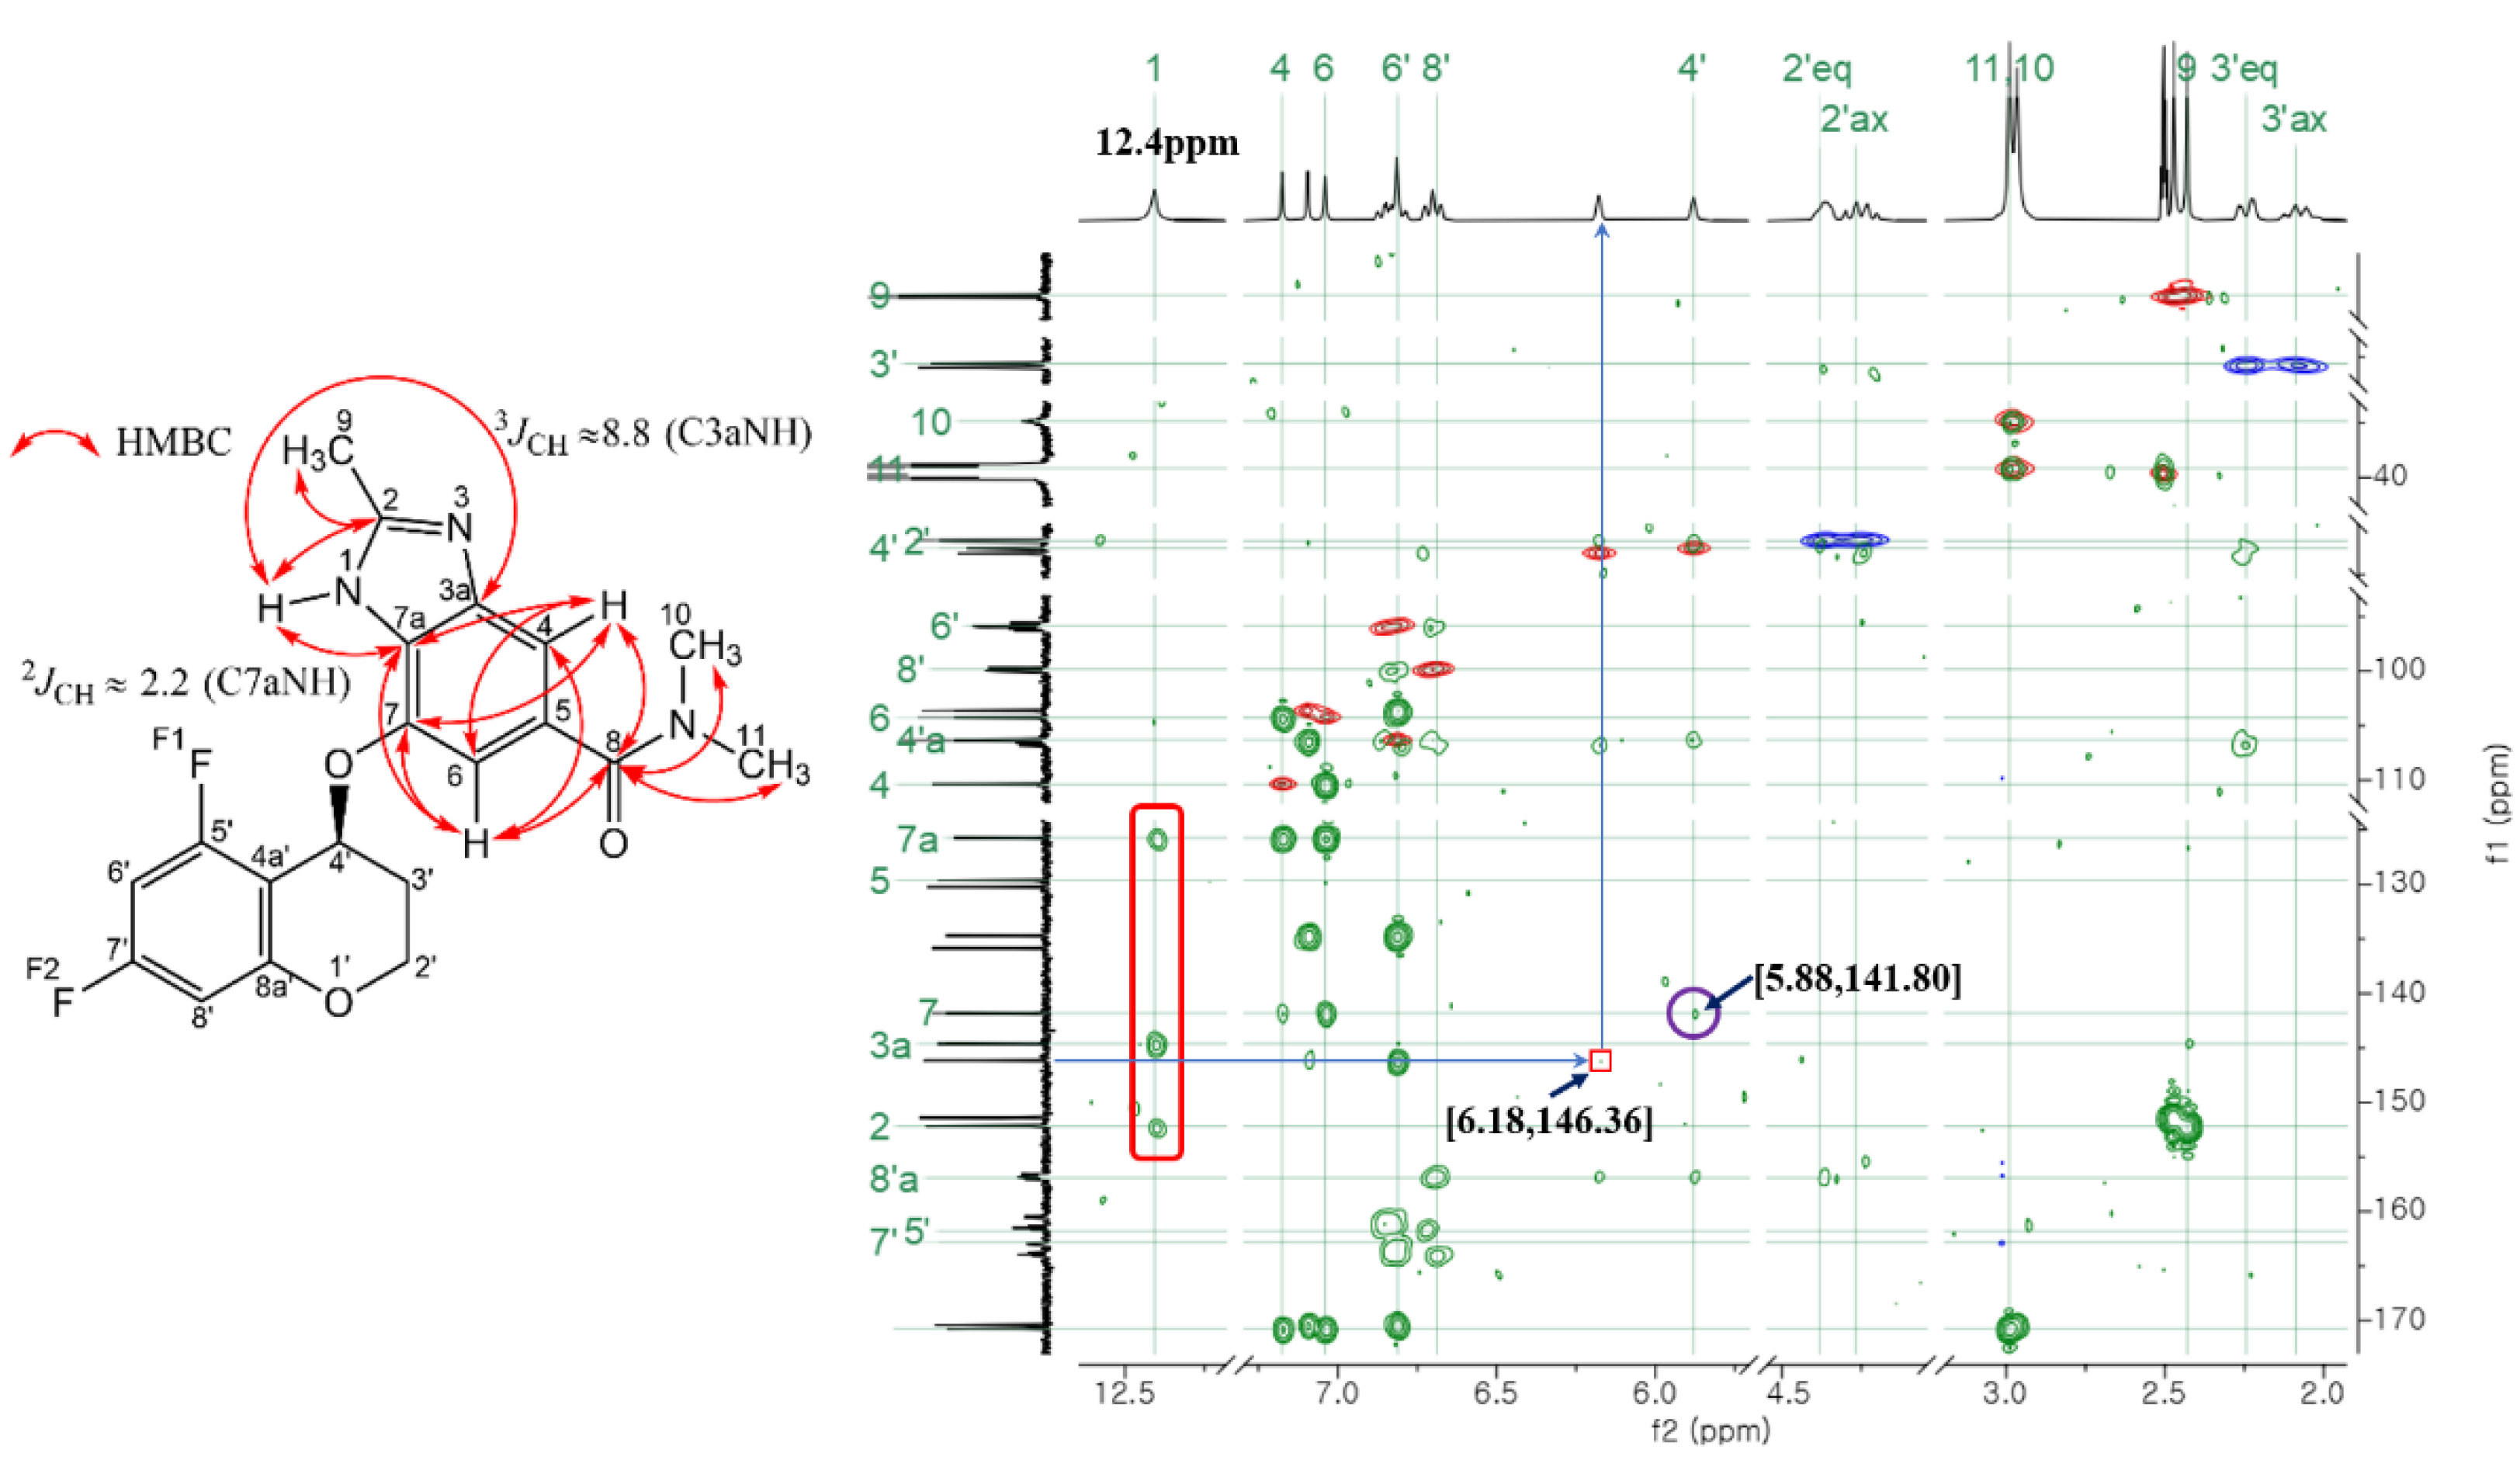
Figure 3.
The comparison of the assigned 13C-NMR spectra of each tautomer with the solid-state 13C-NMR spectra of Tegoprazan polymorphs A and B is presented. The expanded spectral range is 120-156 ppm, and only the carbon of the benzimidazole skeleton appears in this region in the benzimidazole moiety. The Top spectrum (A) represents the liquid-state 13C-NMR spectrum of the tautomeric mixture of Tegoprazan. The second spectrum (B) from the top corresponds to the solid-state 13C-NMR spectrum of polymorph A, while the third spectrum (C) from the top represents the solid-state 13C-NMR spectrum of polymorph B. At the bottom, the spectrum (d) shows only the peaks corresponding to Tautomer 1, extracted from the top spectrum. Similarly, the second spectrum from the bottom displays only the peaks corresponding to Tautomer 2, also extracted from the bottom spectrum. Spectra (a) and (b) provide expanded views of regions (B) and (C), respectively, for enhanced clarity.
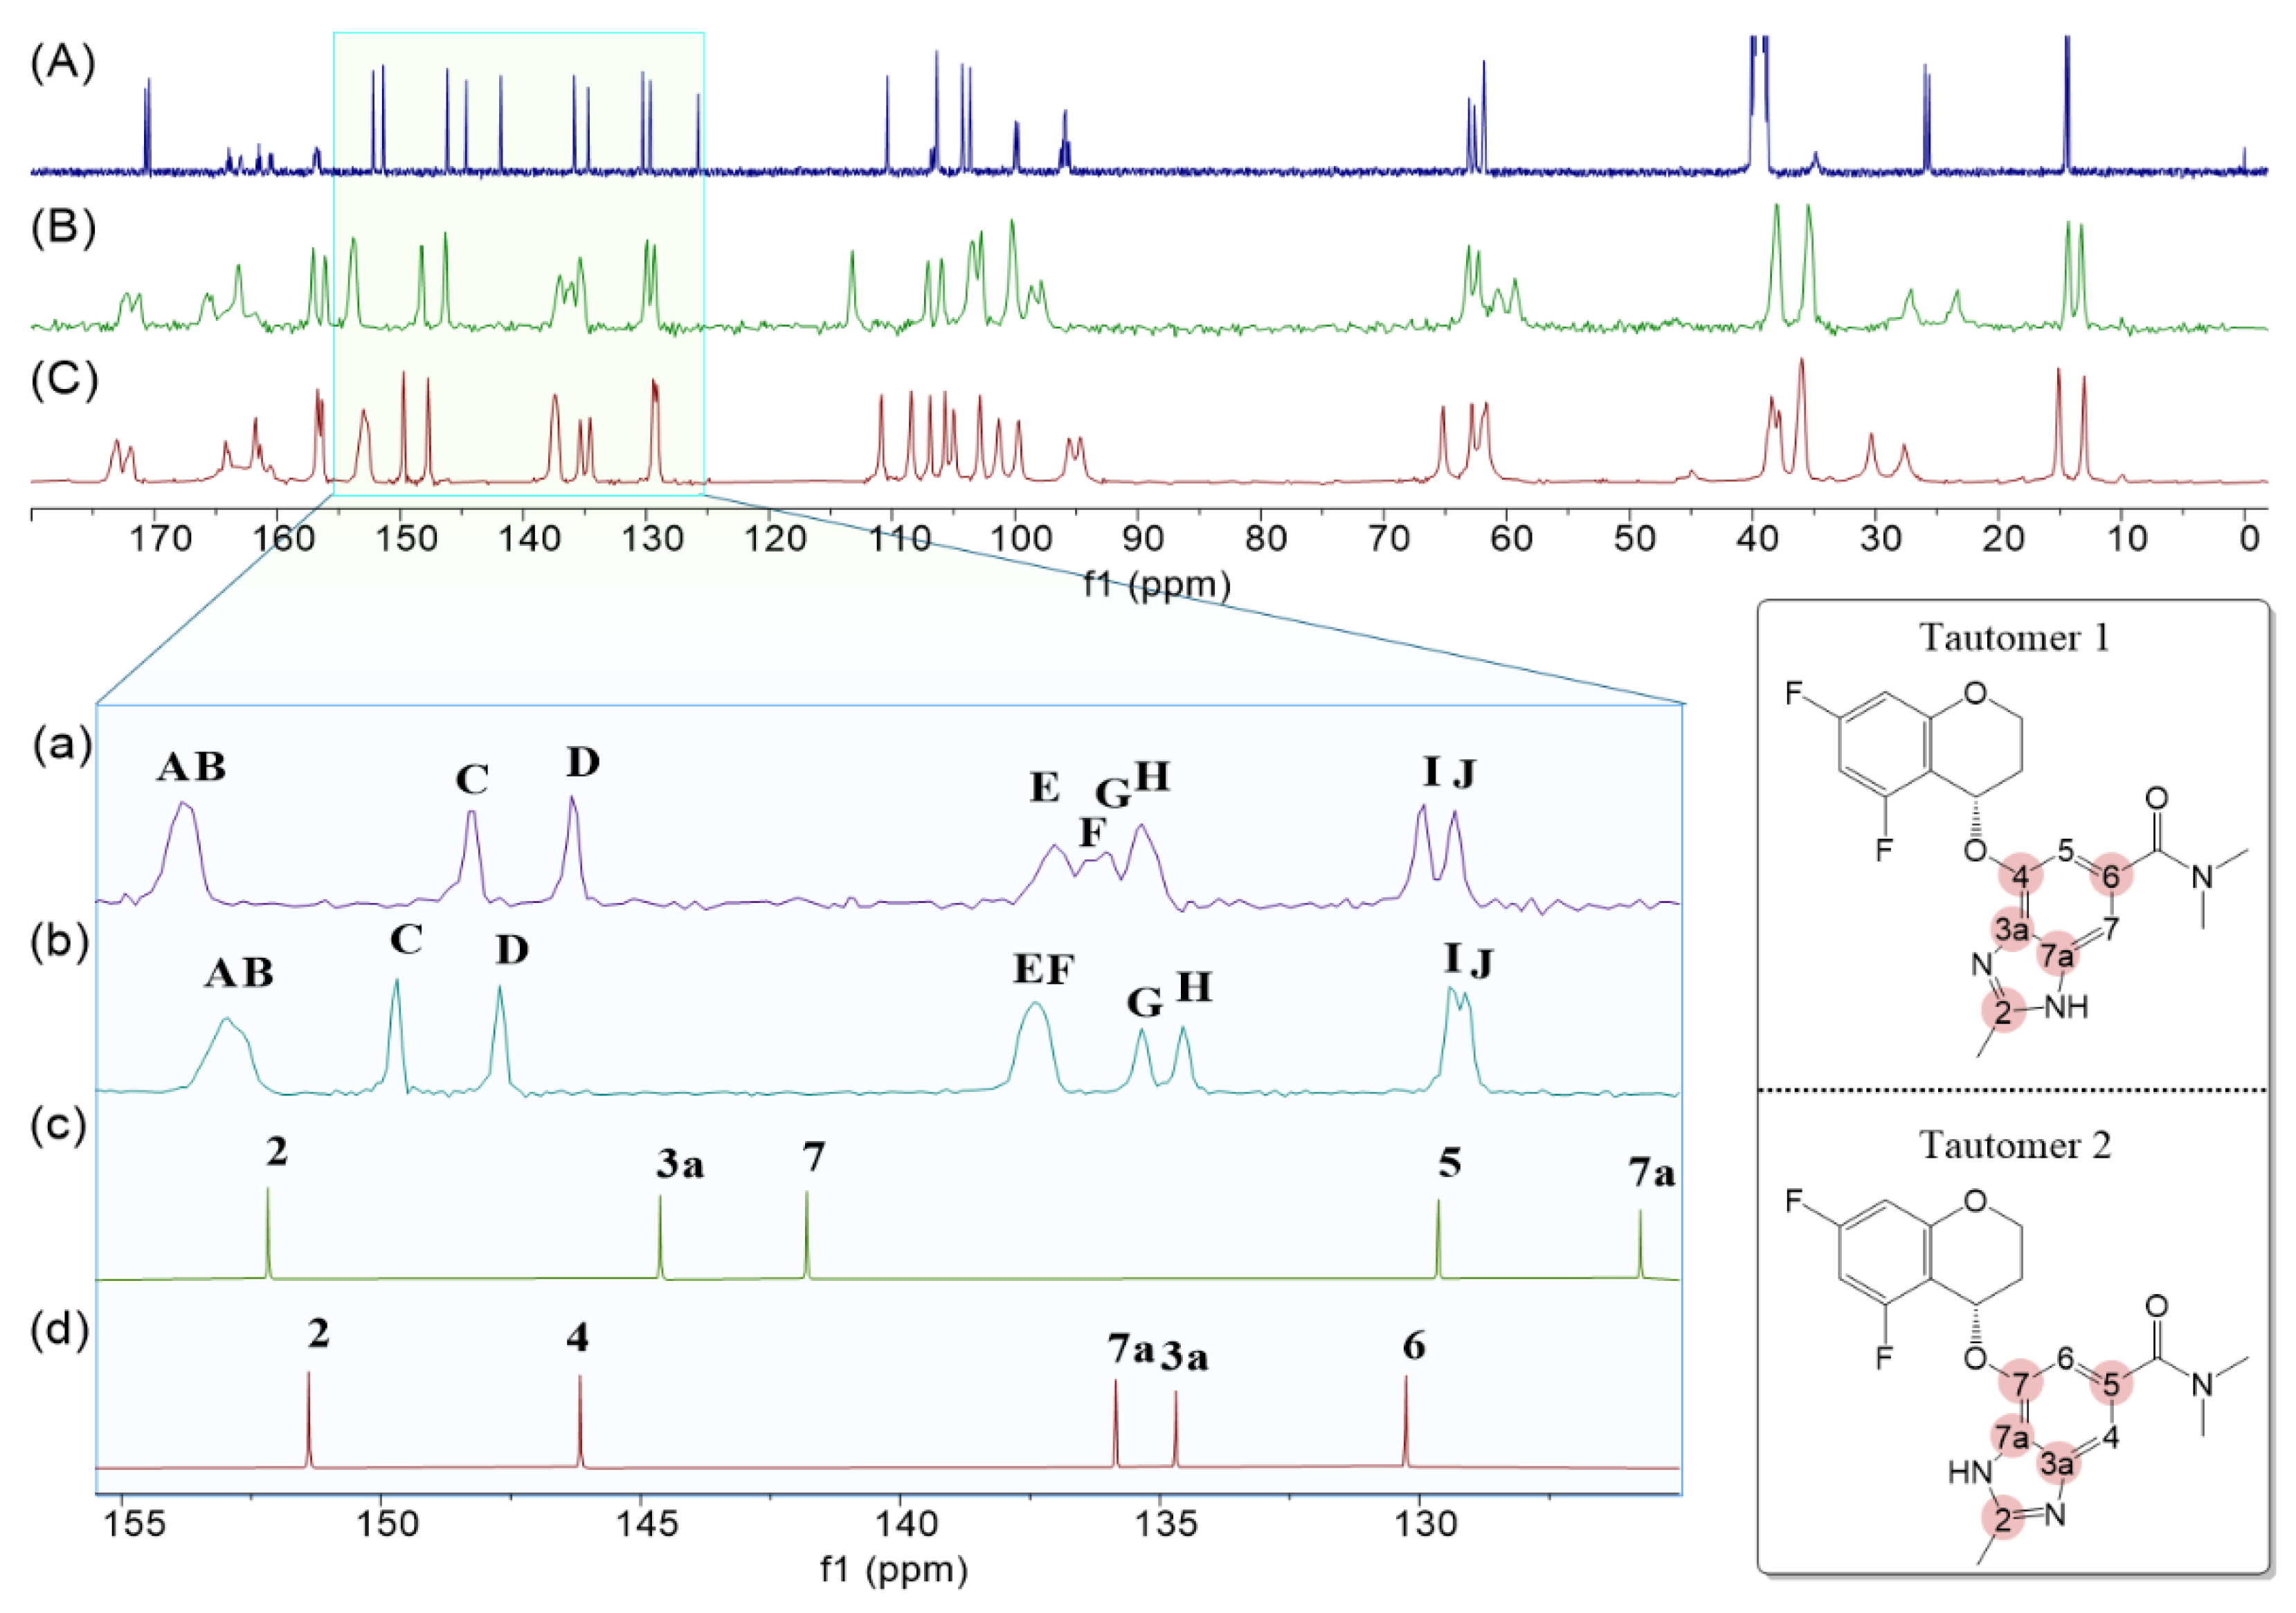
Figure 4.
Overlay of the 44 conformers of Tegoprazan Tautomer 1 after energy minimization, using the Superimpose function in Maestro with the benzimidazole moiety fixed as the reference. (a) Superimposition of all 44 conformers. (b) Superimposition of the four lowest-energy conformers among the 44. The energy difference between the highest- and lowest-energy conformers within these four was 0.2 kcal/mol.
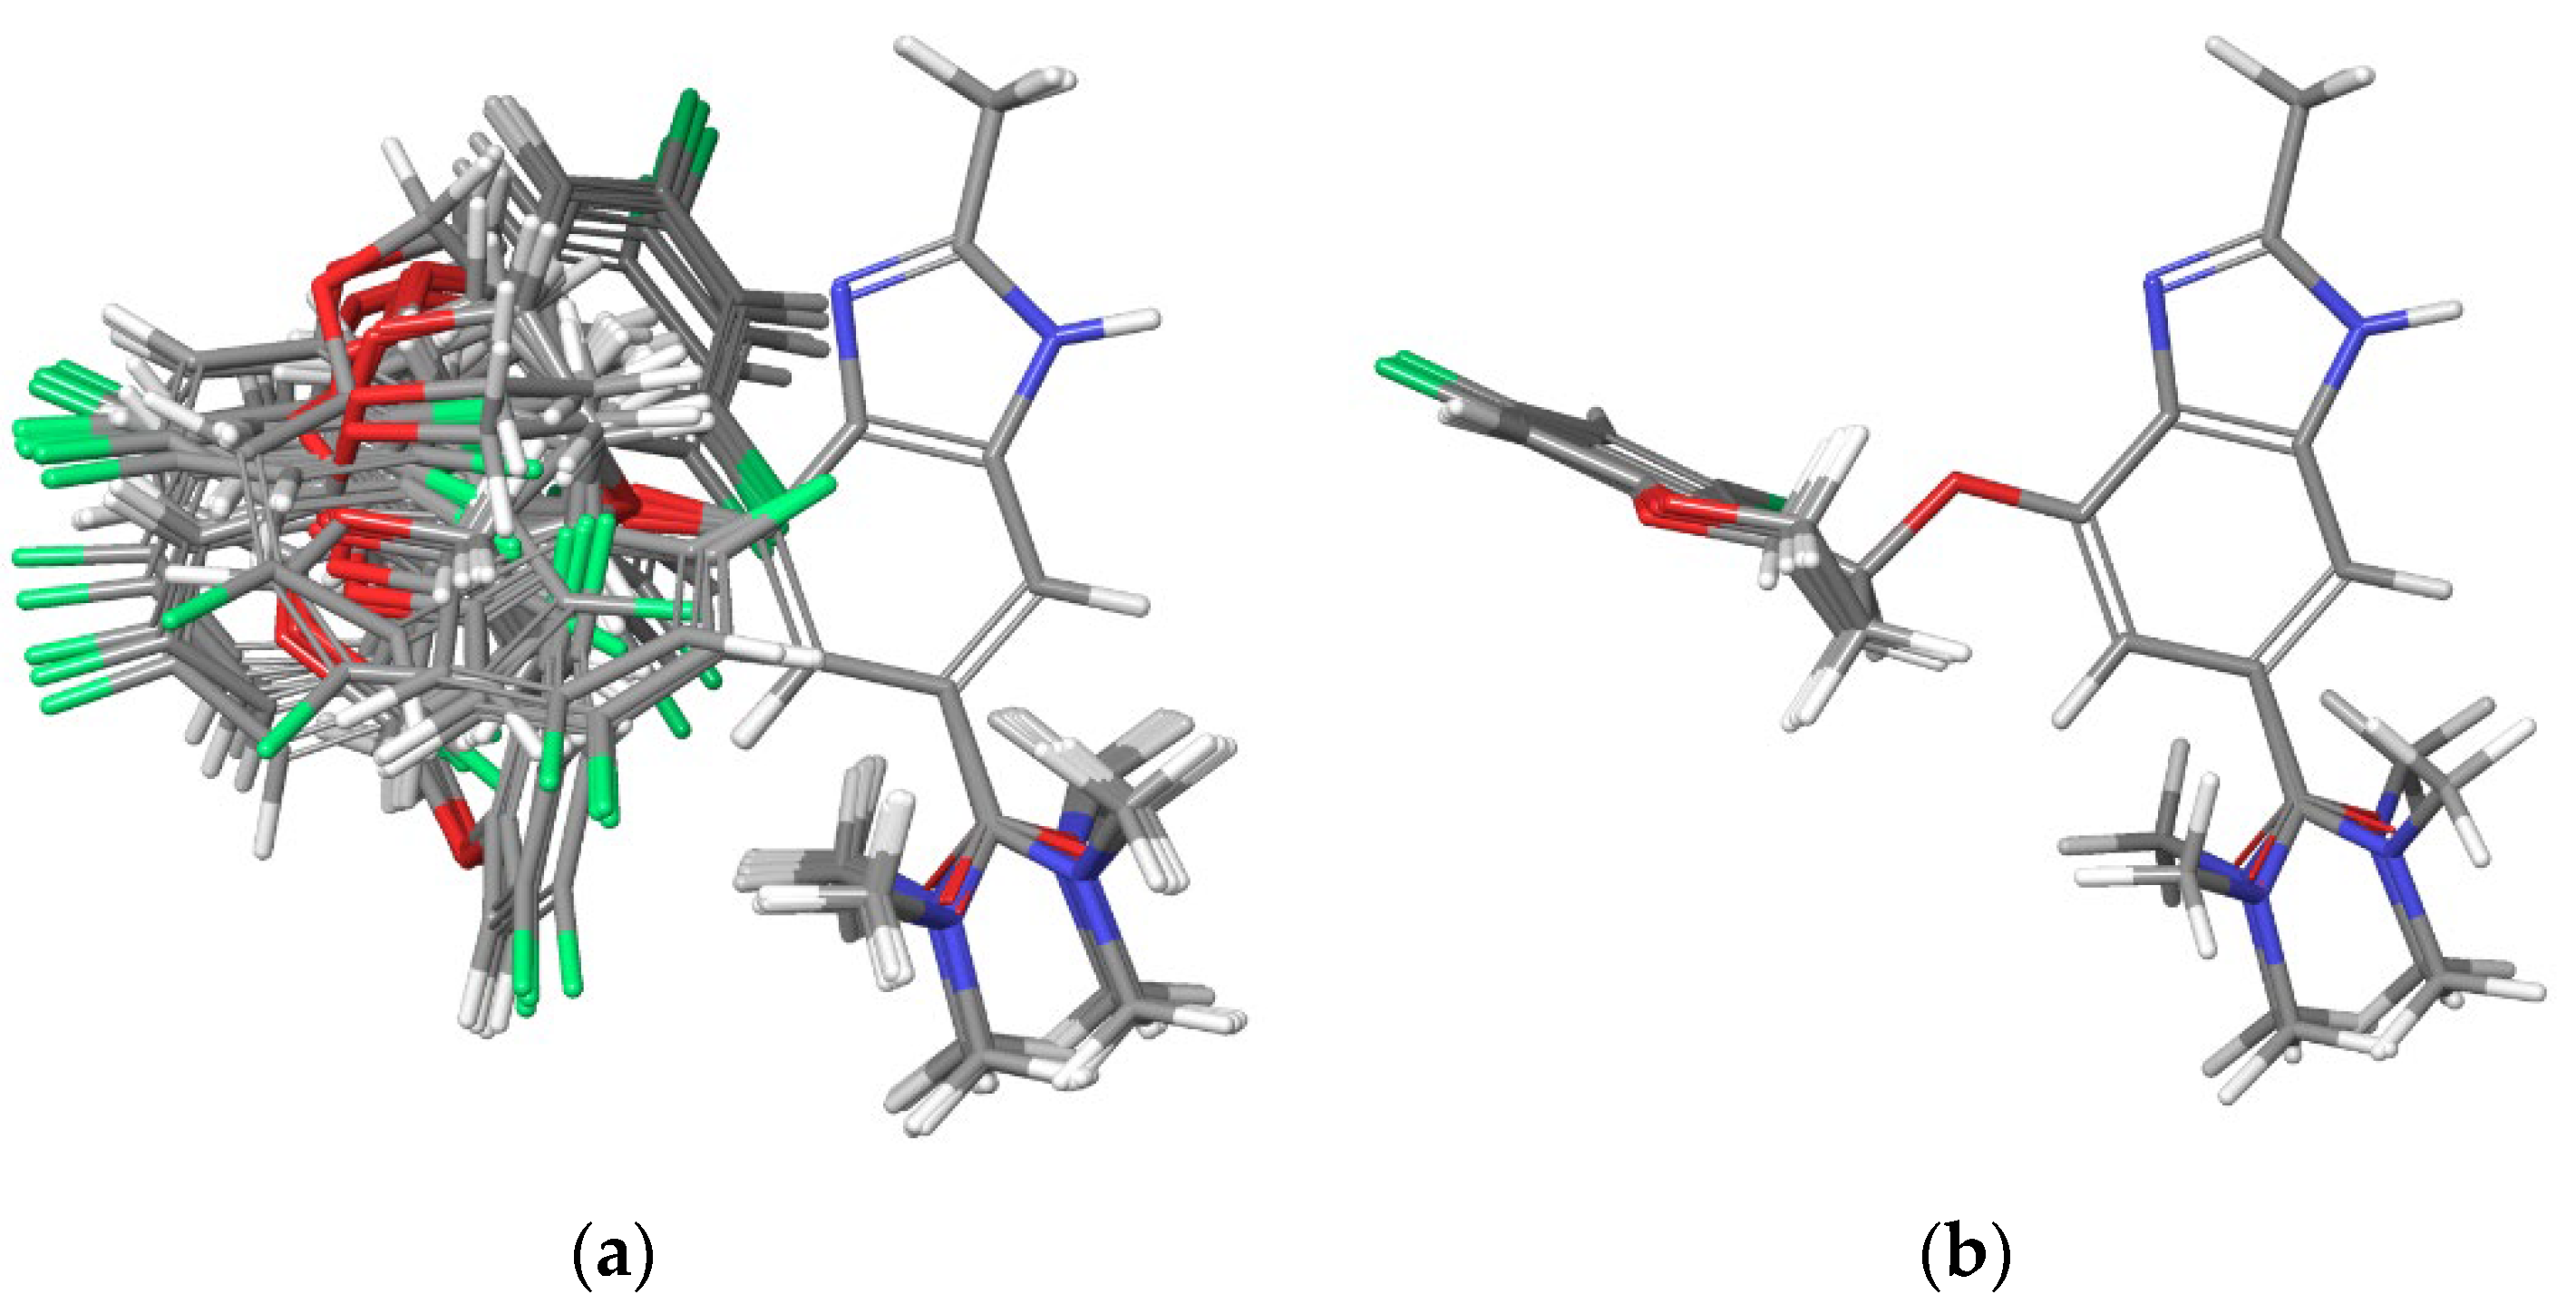
Figure 5.
Rietveld fit to the powder X-ray diffraction data (a) and the ellipsoid representation of the structures of Tegoprazan polymorphs A and B (b). The atomic numbering in (b) is arbitrarily assigned for the convenience of the structural analysis and differs from the numbering based on IUPAC nomenclature or that assigned in NMR structural analysis.
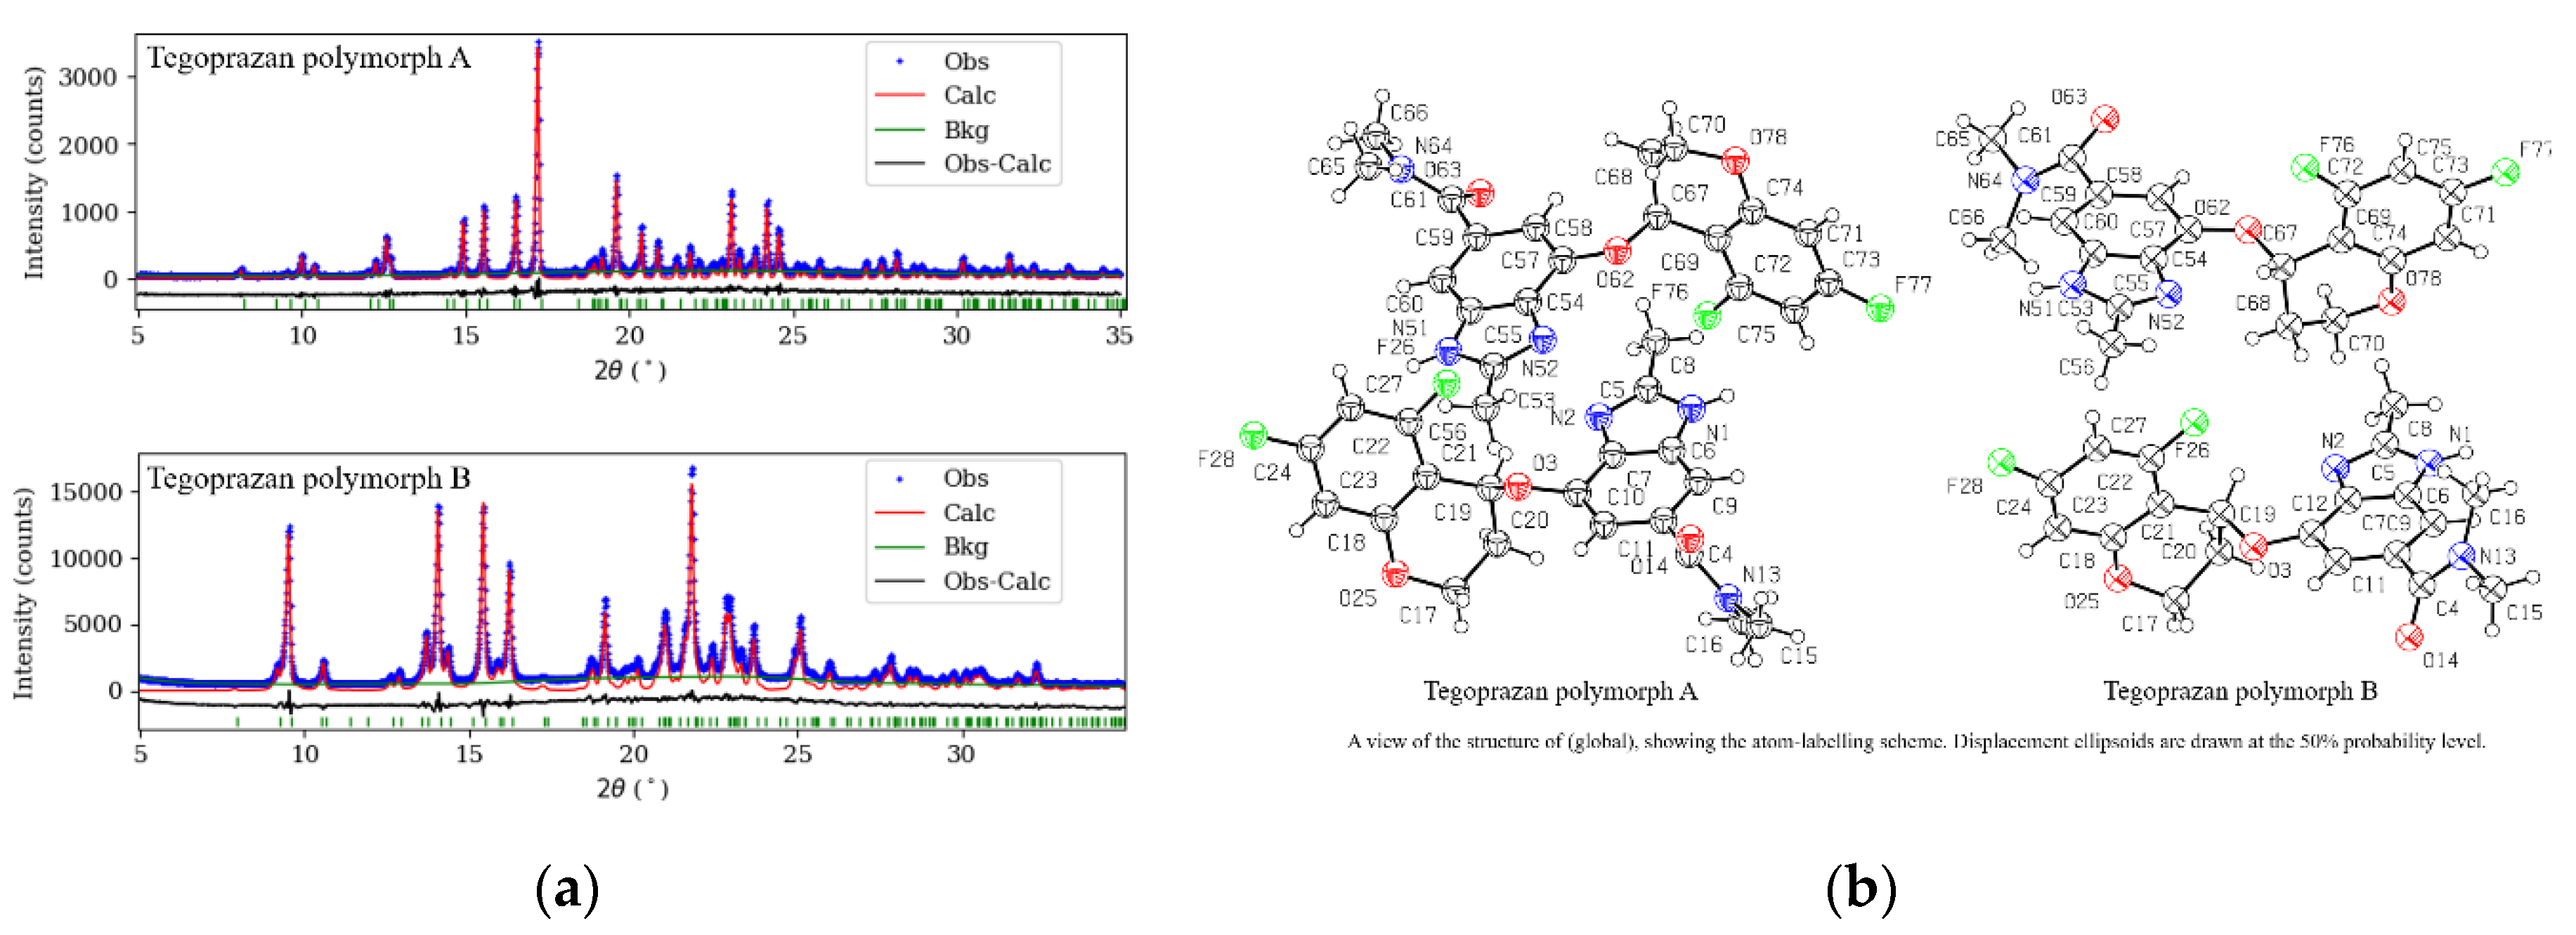
Figure 6.
Structural representations of Tegoprazan polymorphs A and B determined through simulated annealing and Rietveld refinement.
Figure 6.
Structural representations of Tegoprazan polymorphs A and B determined through simulated annealing and Rietveld refinement.
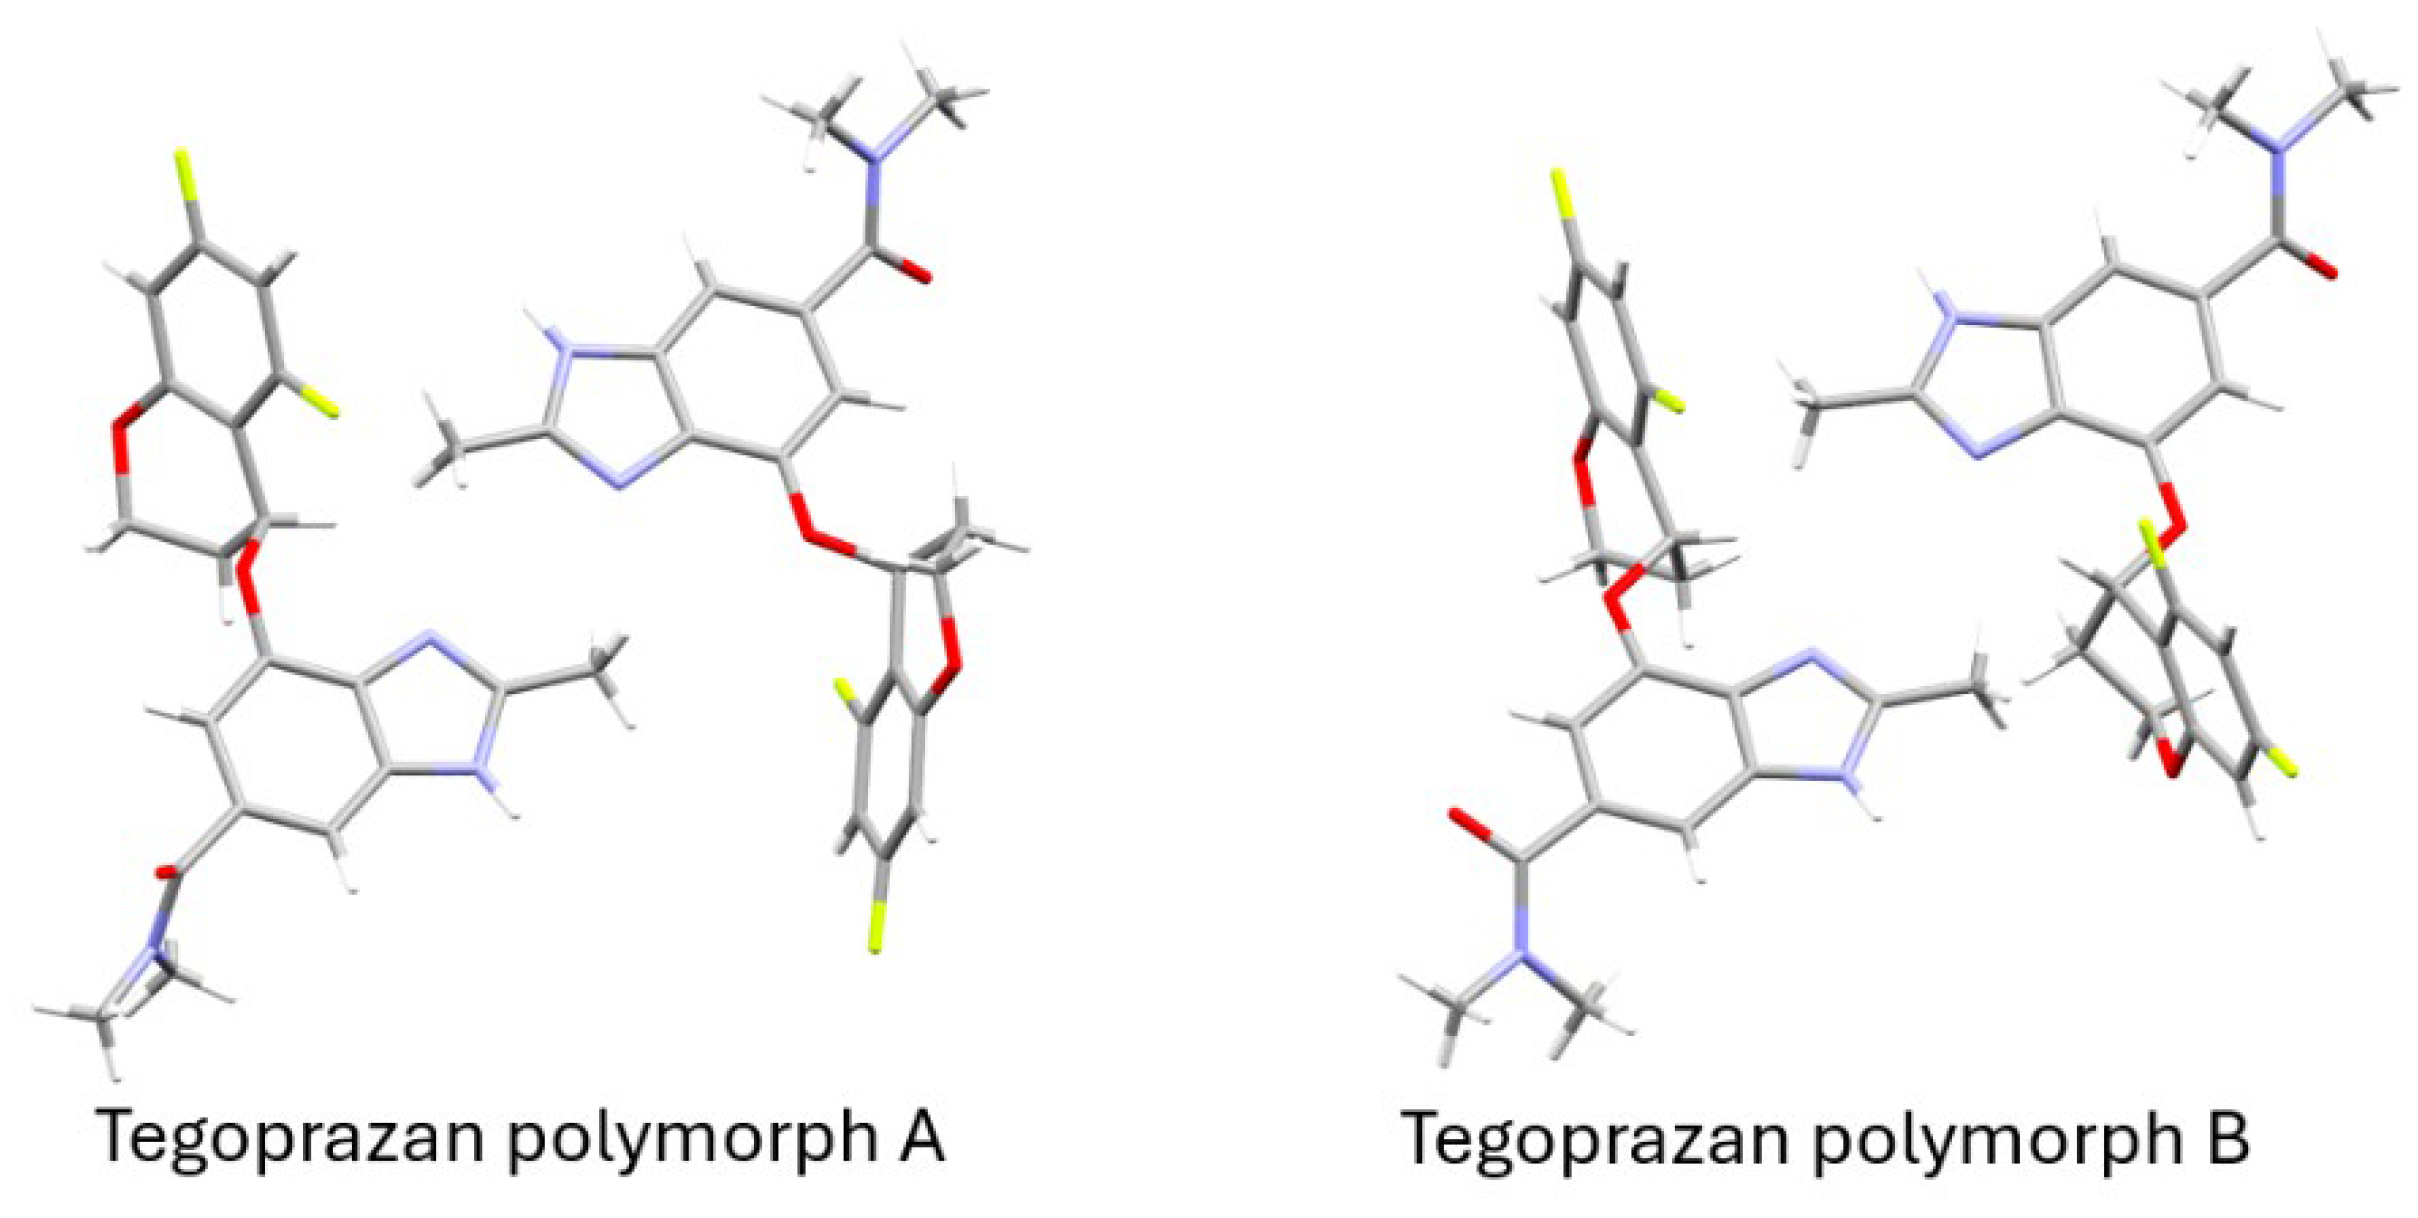
Figure 7.
Supramolecular features of Tegoprazan polymorph A, highlighting hydrogen bonding and π-H interactions contributing to the crystal packing stability. Hydrogen-bonding network in Tegoprazan polymorph A as determined by simulated annealing and Rietveld refinement: A projection onto the (101) plane (a) reveals alternating conformers connected by hydrogen bonds with distances of 1.757 Å and 2.034 Å in the indicated direction, forming three distinct strands with no bonding in the b-direction (Table 2). A projection onto the (10-1) plane illustrates π-H interactions stabilizing interlayer arrangements between adjacent layers. the centroid of the five-membered imidazole ring in the benzimidazole moiety was marked with a filled red circle.
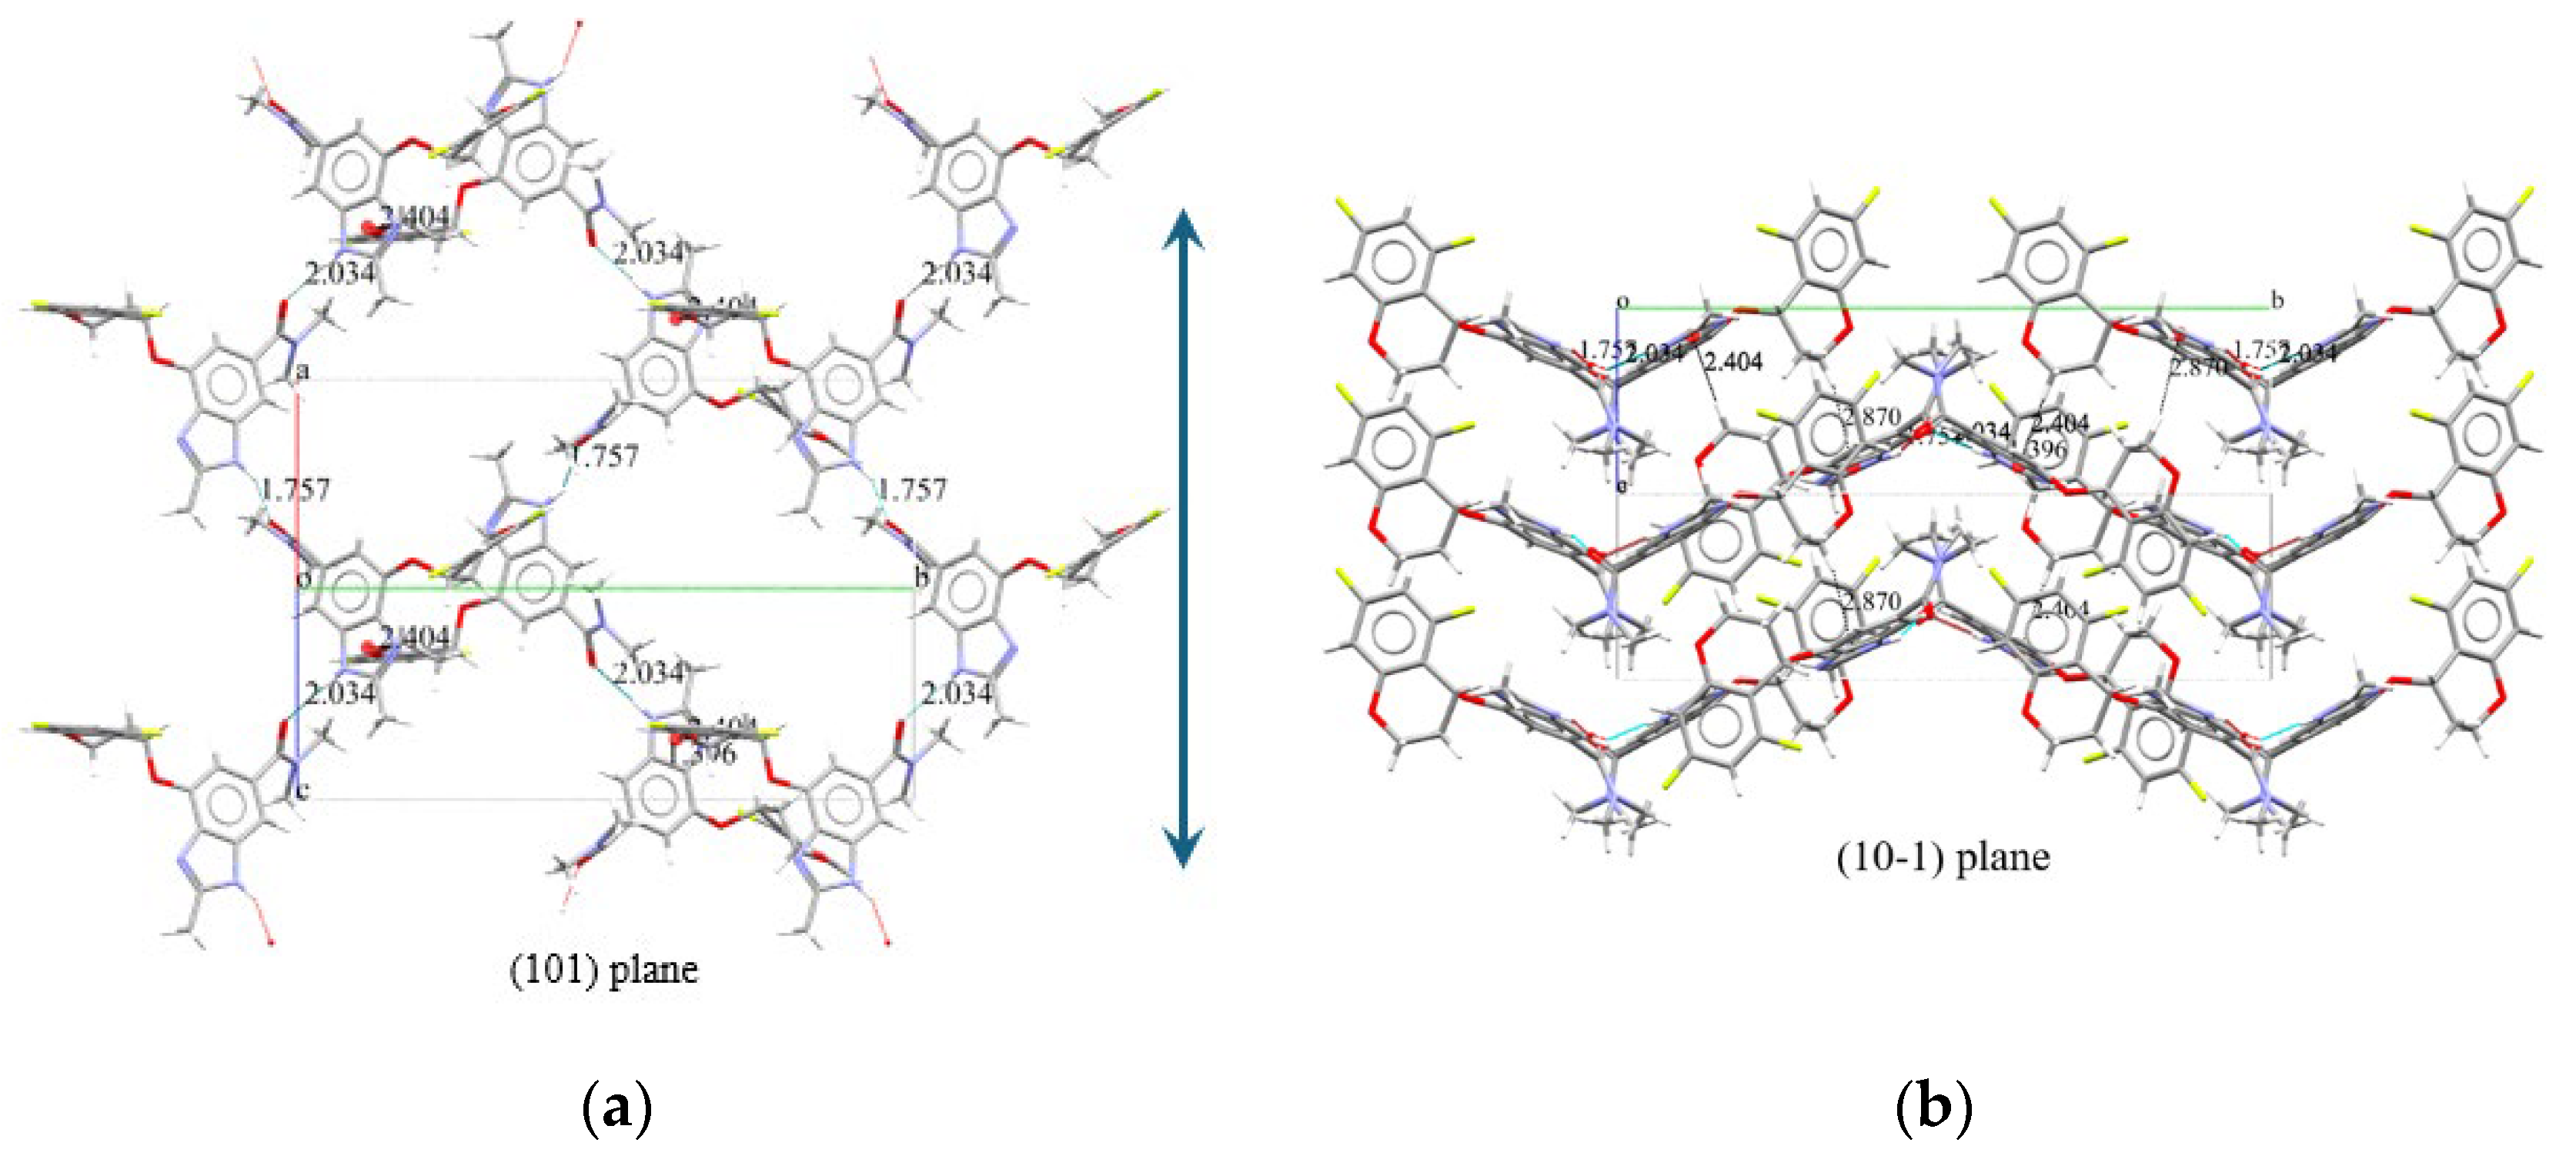
Figure 8.
Supramolecular features of Tegoprazan polymorph B, highlighting hydrogen bonding and π- π interactions contributing to the crystal packing stability. Hydrogen-bonding and π-π interactions in Tegoprazan polymorph B as determined by simulated annealing and Rietveld refinement: A projection onto the (10-1) plane shows identical conformers linked by hydrogen bonds with distances of 1.839 Å and 2.026 Å in the indicated direction, forming three strands. The benzene rings of the Chromane moiety are stabilized by interactions at a centroid-centroid distance of 3.703 Å, slightly offset and contributing to bonding along the a-direction. A projection onto the (101) plane reveals vertically aligned benzene rings positioned at interaction-favorable distances, suggesting stabilization through π-π interactions. The centroid of the benzene ring in the chromane moiety was marked with a filled red circle.
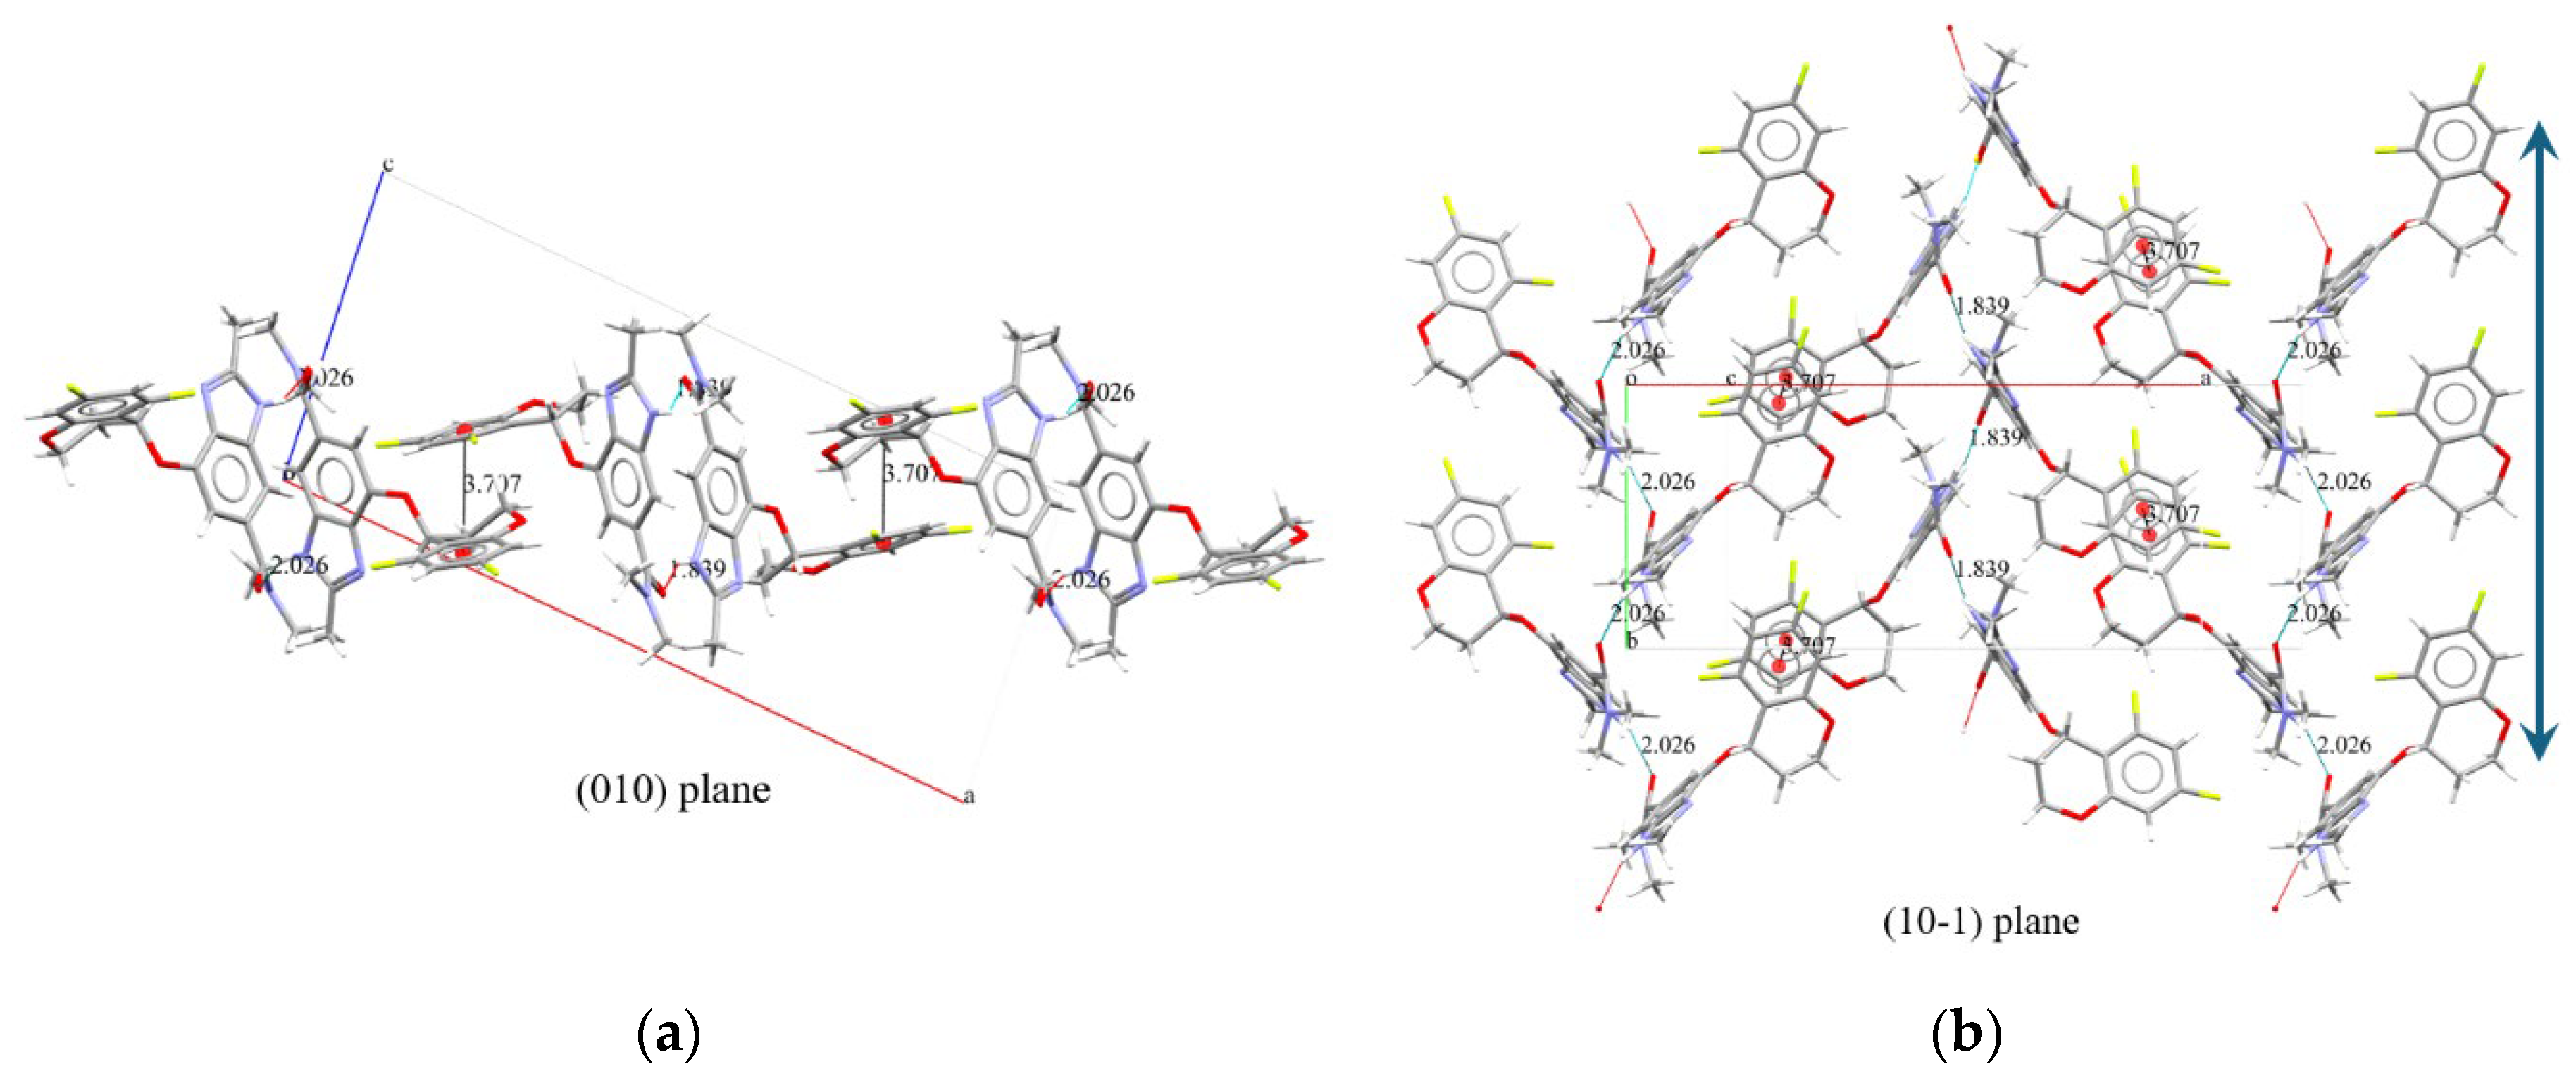

Table 1.
Results of Crystal Structure Determination of Polymorphs A and B of Tegoprazan via Simulated Annealing and Rietveld Refinement.
Table 1.
Results of Crystal Structure Determination of Polymorphs A and B of Tegoprazan via Simulated Annealing and Rietveld Refinement.
| Polymorph | A | B | |
| Crystal data | |||
| Chemical formula | C20H19F2N3O3 | C20H19F2N3O3 | |
| Mr | 387.38 | 387.38 | |
| Crystal system, space group | Monoclinic, P21 | Monoclinic, P21 | |
| Temperature (°K) | 295 | 295 | |
| a, b, c (Å) | 9.7638 (5), 21.5210 (12), 9.3267 (5) | 22.4071 (18), 8.9485 (7), 9.6439 (8) | |
| β (°) | 100.0857 (16) | 97.3652 (15) | |
| V (Å3) | 1929.50 (18) | 1917.8 (3) | |
| Z | 4 | 4 | |
| Radiation type | Cu Kα1, λ = 1.540593 Å | Cu Kα1, λ = 1.540593 Å | |
| Specimen shape, size (mm) | Flat sheet, 20 × 0.2 | Flat sheet, 20 × 0.2 | |
| Data collection | |||
| Diffractometer | RIGAKU SmartLab Bragg Brentano Diffractometer | RIGAKU SmartLab Bragg Brentano Diffractometer | |
| Specimen mounting | Glass plate | Glass plate | |
| Data collection mode | Reflection | Reflection | |
| Scan method | Continuous | Continuous | |
| 2θ values (°) | 2θmin = 5.00 2θmax = 35.00 2θstep = 0.02 |
2θmin = 5.00 2θmax = 35.00 2θstep = 0.02 |
|
| Refinement | |||
| R factors and goodness of fit | Rp = 0.069, Rwp = 0.091, Rexp = 0.081, RBragg = 0.039, χ2 = 1.271 |
Rp = 0.037, Rwp = 0.049, Rexp = 0.025, RBragg = 0.019, χ2 = 3.791 |
|
| No. of parameters | 254 | 254 | |
| No. of restraints | 68 | 68 | |
| H-atom treatment | H-atom parameters constrained | H-atom parameters constrained | |
CCDC 2376144(polymorph A) and 2387615(polymorph B) contains the supplementary crystallographic data for this paper. These data can be obtained free of charge via http://www.ccdc.cam.ac.uk/conts/retrieving.html (or from the CCDC, 12 Union Road, Cambridge CB2 1EZ, UK; Fax: +44 1223 336033; E-mail: deposit@ccdc.cam.ac.uk).
Table 2.
Hydrogen-bond geometry of Tegoprazan phase A.
| D—H⋯A | D—H | H⋯A | D⋯A | D—H⋯A |
| N1—H46 A ⋯O63i | 0.8699 | 2.0335 | 2.9025(11) | 176.84 |
| N51—H94 A ⋯O14ii | 0.8699 | 1.7566 | 2.5555(10) | 151.58 |
| C70—H92 A ⋯Cg1iii | 0.97 | 2.404 | 3.354(1) | 166.11 |
| C17—H40 A ⋯Cg2iii | 0.97 | 2.870 | 3.820(1) | 166.27 |
Symmetry codes: (i) -x+1, y-1/2, -z+1; (ii) -x+2, y+1/2, -z; (iii) 1+x, y, z.
Table 3.
Hydrogen-bond geometry of Tegoprazan phase B.
| D—H⋯A | D—H | H⋯A | D⋯A | D—H⋯A |
| N1—H46 A ⋯O14i | 0.8699 | 1.8388 | 2.6171(16) | 147.93 |
| N51—H94 A ⋯O63ii | 0.8698 | 2.0259 | 2.8210(16) | 151.5 |
Symmetry codes: (i) -x, y+1/2, -z; (ii) -x+1, y+1/2, -z. Hydrogen-bond geometry (Å, °).
Disclaimer/Publisher’s Note: The statements, opinions and data contained in all publications are solely those of the individual author(s) and contributor(s) and not of MDPI and/or the editor(s). MDPI and/or the editor(s) disclaim responsibility for any injury to people or property resulting from any ideas, methods, instructions or products referred to in the content. |
© 2025 by the authors. Licensee MDPI, Basel, Switzerland. This article is an open access article distributed under the terms and conditions of the Creative Commons Attribution (CC BY) license (http://creativecommons.org/licenses/by/4.0/).
Copyright: This open access article is published under a Creative Commons CC BY 4.0 license, which permit the free download, distribution, and reuse, provided that the author and preprint are cited in any reuse.


