
Submitted:
27 January 2025
Posted:
28 January 2025
You are already at the latest version
Abstract
Mangroves are valuable ecosystems that provide significant biological, environmental, ecological, and cultural functions. To inform the development of management plans for the ecosystem's sustainability, it is crucial to evaluate how their land cover, levels of degradation, and phases of restitution have changed. GIS and remote sensing techniques were used to classify, and analyze Landsat images from 1980 to 2022 categorized into nine classes: bare ground, Nypa palms, settlements, coastal sedimentation, river sedimentation, regeneration, matured mangroves, dense forest, and water body. Using the Markovian chain approach, the changes noted during the period were utilized to forecast future trends up to 2052. Findings demonstrated that the mature mangrove area decreased throughout the study. The surface area covered by mature mangroves was 80628.78 hectares in 1980, which decreased by 7.31%, 1.51%, 3.70%, and 5.06% in 1990, 2000, 2010 and 2022 respectively and by 17% for the overall period of 42 years. Additionally, gains of 4.07% from 2000 to 2010 and 6.84% from 1980 to 2022 were observed probably from artificial mangrove regeneration. Settlements, invasive Nypa palms, bare ground (resulting from over-exploitation), and sedimentation of rivers and coast primarily replaced mangroves. The prediction derived indicated the continuous decline in mangroves if not fully protected by law. These results provide vital information to direct future mangrove conservation actions in the recently gazetted Douala-Edea National terrestrial and marine Park and other mangrove blocks along the Gulf of Guinea.
Keywords:
Mangrove
; land cover
; degradation
; restoration
; Markov chain
; Douala-Edea National Park
1. Introduction
Mangrove forests are a form of vegetation found only on the land-sea interface between roughly 30° N and 30° S in latitude [1,2]. Mangrove forests are among the most productive ecosystems because they offer significant socioeconomic, environmental, and cultural benefits to humanity [3,4,5]. Mangroves can withstand a wide range of salinities, from hypersaline waters exceeding 100 parts per thousand to lower salinities of 2 parts per thousand [6]. These ecosystems are extremely valuable on a global scale as they provide ecosystem services that support millions of coastal livelihoods, estuarine, coastal, and terrestrial fauna, atmospheric carbon sequestration, coastal fisheries, shoreline stabilization through storm and flood prevention, and favourable habitat for these species [7,8,9,10]. Currently, healthy mangrove ecosystems are seen as ecosystems of hope to store carbon and create resilience against impending coastal dangers as climate change takes its toll on the world’s population. Mangroves are really now acknowledged as one of the best natural ways to adapt to climate change and lower the chance of disaster [11]. However, mangroves are subject to intense natural and human pressures both on land and in the ocean due to their unique intertidal location and having an increasing impact on this ecosystem’s capacity to colonize and preserve its geographic location.
Following worldwide change scenarios; mangroves and coastal areas are prone to a wide range of environmental hazards; including sea level rise caused by climate change and its associated effects [12]. The coastal ecosystems are highly inhabited and serve as the hubs of many nations’ economies. Land cover changes; population growth; and resource overuse have combined to create a serious environmental problem in the coastal belt as a result of spatial and temporal synergism of their cumulative effects. Scientists and local communities living in coastal areas; especially around mangrove forests have been aware of mangrove forest loss and the resultant impact on the people and nature [13].
The availability of appropriate satellite data and processing techniques has led to improvements in mangrove mapping; yet, validation is still necessary to ensure the accuracy of these maps. A combination of regional maps and ground truth data has been used to estimate global mangroves to be about 181000 km2 [14]. Using about 1000 Landsat images, ground truth data, regional maps, a combination of supervised (and unsupervised classification approaches, gave an estimate of global mangrove area at 137,760 km2 with 94% accuracy using few ground control sites worldwide with none in West Africa [1]. Other studies concluded the global mangrove area changed by 8 437 km2 between 1996 and 2016 [15]. Following a more recent assessment on mangrove restoration potential, 6186 km2 of Africa’s mangrove area was lost due to human activity and 12,641 km2 remained intact though others have noted an increase in the region’s mangrove area [16]. According to a different report, between 1980 and 2005, the global mangrove area decreased by 3,563,000 hectares, with Africa contributing 14% of this loss [17]. Numerous reports on the changes in mangroves on a global and regional scale highlight the need for more local investigations to obtain reliable data. It is important to conduct a regional analysis of the global area change of mangroves to focus conservation efforts using reliable data [18]. The discrepancies in the area estimates indicated above may have resulted from inaccuracies, but they are also probably the result of changes in the mangrove area during several assessment periods [16].
Studies have shown that mangrove conversion and deforestation account for 10% of the world’s total emissions from tropical deforestation or 0.08 to 0.48 Pg CO2 per year [19]. Mangrove forests in Cameroon have been experiencing rapid degradation following uncontrolled exploitation since the 1980s. Between 1980 and 2006, mangrove forests covering over 70,000 ha were severely depleted, suggesting that in the past 30 years, about half of the Cameroonian mangrove regions have disappeared and exponentially in the Wouri estuary [20]. Urbanization, population growth, industrialization, pollution, landfilled detritus, the emergence of invasive species, extension of industrial agriculture, and, more specifically, and deforestation (indiscriminate harvesting using crude tools) for fuel wood are some of the causes that contribute to this land cover dynamics [19,20,21,52,53]. Regional surface temperature is directly impacted by changes in forest cover, such as those caused by afforestation, reforestation, and deforestation. Increase in mangrove coverage meaningfully contributed to local cooling, thereby emphasizing the climate regulation benefits of mangrove conservation [50]. Furthermore, changes in land conditions, brought on by either land use, land cover or climate change, have an impact on both the global and regional climate [19].
Mangroves are marginalized in national agendas for restoration and conservation due to limitation documentation of case studies, weak governance and institutions, best practices for conservation, unreliable data, and limited resources and capacity to produce useful forest monitoring data [11]. Given the importance of mangroves for carbon sequestration, ecological services, biodiversity preservation, it is imperative that we understand how their extent is changing at this time [22]. In this regard, remote sensing techniques have been extensively used in mangrove investigations, ranging from species mapping to measuring the above-ground biomass of mangroves and to determining the optimal locations for mangrove restoration [7,11]. Mangroves are often found in inaccessible locations, so remote sensing offers many advantages over traditional field surveys, including the ability to analyze large forests, cost-effectiveness, and speed of the surveys. Mapping the natural extent of mangroves allows one to quantify the services they provide, and long-term monitoring studies also provide information on the evolution of mangroves over time [13].
The enormous collection of mangrove woods in the Cameroon estuary includes widely established fishing camps in the Douala-Edea National Park (DENP). Each year, its mangrove forests are destroyed to meet the population’s demand for wood energy as well as the needs of the city of Douala, which act as natural barriers to sea level rise and coastal erosion [19]. Using mangrove wood in traditionally kitchen, about 75,000 tons of fish and shrimps is smoked yearly [52]. The DENP is not excluded from the problems faced by mangroves worldwide and to foresee and manage potential risks associated, it becomes essential to analyze the various land cover/land-use and their evolution to have a better understanding of the resilience of this ecosystem. Additionally, these methods and tools offer precise and timely ways to monitor and analyze spatiotemporal land cover trends to evaluate crucial biological processes in coastal ecosystems and at different scales [16,17]. When satellite sensors are used in complementary ways, remote sensing systems can give information that improves the study and management of coastal ecosystems.
In this study, our interest was to identify the different land cover degradative stages, estimate the mangrove extent, and detect and report changes that have occurred from 1980 – 2022, a span of 42 years in the DENP.
2. Materials and Methods
2.1. Description of Study Site
Cameroon stretches from latitude 1o 40 to 13o 05 N and longitude 8o 30 to 16o 10 E and is at the midpoint between West and Central Africa [23,24]. Cameroon mangroves are mainly grouped in three areas from north to south: Rio Del Rey (218000 ha) in the South West Region where two rivers flow out River Ndian and Massake, Cameroon Estuary (180000 ha) in the Littoral Region including Tiko and Limbe (encompassing of rivers Bimbia, Moungo, Wouri, Dibamba and Sanaga) and Ntem Estuary (2000 ha) in the South Region comprising of mouths River Nyong, Lekoundjé and Ntem (47).
The study was conducted within the Douala-Edea National Park (DENP) which is located between latitudes 03° 13’ to 04° 01’N and longitudes 009° 34’ to 10° 00’E (Figure 1). The site is one of the major and biologically rich Cameroon nature reserves established in 1932 and gazetted as National Terrestrial and Marine Park in October 2018. The DENP lies in the southwestern part of Douala in the Subdivisions of Mouanko and Monaka, within the Douala-Kribi basin of the coastal Atlantic Ocean [25]. It stretches about 100km along the Cameroon coastal plains and covers an area of approximately 262935 ha. The zone has an extremely dense hydrological network being a confluence of four of Cameroon’s largest rivers (Rivers Sanaga, Nyong, Dibamba, and Wouri). Its natural margins are defined by the river system bounded in the east by R. Sanaga that separates the area into two equal parts, north by the R. Wouri estuary, west by the Atlantic Ocean, and south by R. Nyong. There are two clear seasons: the dry season from November to March and the rainy season from April to October. The climate is typically equatorial type characterized by regular and abundant rains (3000 - 4000 mm) and generally high temperatures with a monthly average of 24 - 29°C. January, February, and March make the hottest months while the coldest months are July, August, and September Figure 3.2 [9,25]. Salt measurements during the months of August and February revealed 1.5 g/l and 12 g/l respectively. The soil varies from very sandy to very high clay content and in the mangroves, soil is muddy in some places, firm and slushy in other places, making it difficult to walking, if not impossible [26].
The DENP has a high biodiversity value as it is a major wetland area encompassing two basic ecosystems the marine and humid forest. Ticheler, [27] reports that over 135 fish species belonging to 21 families with 21 endemics have been recorded from the River Sanaga. The DENP serves as a refuge for several bird species and seasonal migratory Palearctic waterbird species of which over 60 species have been identified at the mouth of R. Sanaga [28]. The connecting lowland dense tropical humid forest docks diverse fauna resources of conservation importance specifically sea turtles, manatees, elephants, antelopes, chimpanzees, monkeys, and crocodiles. The park is host to more than 10% of the total remaining mangrove stands in Cameroon [5]. These mangroves extend from Mbiako through Yoyo to Manoka within the Cameroon estuary and some patches at the mouth of the Nyong River in the southern limits of the Park. The Rhizophoras (R. racemose, R. mangle, and R. harissonii) also known as the red mangroves are the most dominant species accounting for over 90% of mangrove forest. The R. racemose attains diameter to over 100cm and canopy reaching up to 50m in height, especially at the Sanaga and Wouri estuaries consequently marking them one of the tallest mangroves in the world [5]. Other mangrove species present are Avicennia germinans (Avicenniaceae), Laguncularia racemosa, and Conocarpus erectus (both Combretaceae). All of these species are of the Western mangrove species group, found in America and West Africa (Tomlinson, 1994). The understory includes the pantropical Acrostichum aureum (Pteridaceae) where the canopy is disturbed. Nypa frutican Van Wurmb (Arecaceae), intentionally introduced to Nigeria in 1906 from SE Asia, is ravishing the area today [5,41]. Mangrove associate species present include Dalbergia ecastaphylum and Drepanocarpus lunatus (both Fabaceae), Annona glaba (Annonaceae), Cocos nucifera (Areaceae), Pandanus candelabrum (Pandanaceae), Achornea cordifolia (Euphorbiaceae), Anthocleista vogelii (Gentianaceae), Hibiscus tilaeceus (Malvaceae), Guibourtia demeusei (Fabaceae), Sesuvium portulacastrum (L.) L. (Aizoaceae), Bambusa vulgaris, and Paspalum vaginatum, (Poaceae) [3,5].
2.2. Socioeconomic Characteristics
Since its creation in 1932 as a wildlife reserve and eventual gazettement in 2018, the Park has been threatened with encroachment by more than 60 villages now resident in the Park doing mainly fishing and trade in fisheries products with nearby cities of Douala, Edea, and Kribi, over exploitation, coupled with poor policies enforcement and management. The mangrove area of the park is occupied by over 20 villages and many fishing camps/hamlets (10-1000 persons) with a total mangrove population of more than 6000 [17]. More than 70% of this resident mangrove population consists of foreign nationals from neighbouring countries: Nigeria, Ghana, Benin, and Niger Republics with Nigeria alone having more than 60% of the total population with a greater migratory proportion following the fishing period that spans from November to April. Fish catch is mostly preserved through smoking using mangrove wood preferred for ready availability, high calorific value, and flammability under wet conditions thus reducing processing costs, especially drying before use. Smoked fish production within the area is estimated at between 500 - 1000 tonnes using over 180 000m3 of mangrove wood [29].
2.3. Forest Cover Extent
Data and image acquisition: To quantify the forest extent of the mangroves and understand its dynamics of change over several decades a set of Landsat images Landsat 1, Landsat 5, Landsat 7, and Landsat 8 were analyzed and compared for the years 1980, 1990, 2000, 2010, and 2022 respectively (Table 1). This was done to reflect changes in 9 classes of land cover change, degradative and restitution stages of mangrove forest vis: bare ground, Nypa palms, settlements, coastal sedimentation, river sedimentation, regeneration, matured mangroves, dense forest, and water body. The data was acquired from an open-source platform the United States Geological Survey (glovis.usgs.gov). This platform provides free images according to “acquisition date” and “location”. All the satellite images downloaded were those captured during the dry season, between December and April.
Images were downloaded and imported into remote sensing software ENVI version 5.3 (Exelis Visual Information Solutions) band after band where the separate layers were stacked together to perform different band combinations and other analyses.
Image pre-processing: Pre-classification operations making radiometric and geometric corrections using ENVI 5.3 software served to improve the quality of the images before processing. The images were then pre-processed by stacking the separate layers together. Darkest pixel corrections, filtering, noise reduction, image enhancements, and image sharpening were done all to enhance visualization. The images were resized to the same spatial resolution and sub-sectioned into the study area to facilitate their interpretation [30,31].
Image Processing and Classification: Digital image processing software ENVI 5.3 was used to analyze satellite images and ArcGIS 10.3 was used for shapefiles analysis, surface area calculation, and integrating spatial data to attain the objectives of the study. The data were then projected into the Universal Transverse Mercator (UTM) coordinate system, Datum WGS 84, zone 32N. Multi-temporal satellite data were visualized in Natural False colour and False Colour Composite (FCC) format (Figure 2) and mangroves were identified using a visual interpretation technique. The bands used for the analysis were as follows: B2: Blue band, B3: Green band, B4: Red band, B5: Near infrared, B6: Medium infrared, B7: Thermal infrared.
Image co-registration: Considering that all the images were taken in different years with different sun angles and sun elevations, individual pixels on each of these images could not be superimposed on each other. Thus, to make them align, they were co-registered using the 1980 image as the base image unto which the other images were warped using the image-to-image registration method and first-order polynomial warping function in ENVI 5.3.
Unsupervised classification: In the pre-processed Landsat images, unsupervised classification used was based upon the interactive self-organizing data analysis (ISODATA) algorithm which entails an automatic and computer-generated assignment of spectral signatures to various land use types. The unsupervised classification gives a general understanding and reference about the distribution pattern of pixels with different digital number values. At least 150 Ground Control Points (GCPs) are automatically generated and used during the field phase to verify the different land use types existing in the study area.
Ground truthing: To test the reliability of the unsupervised classification, a ground-truthing survey was done to obtain ground reference data within the study period. During this survey, GPS points were collected from different land uses (forests, bare ground, plantations farmlands, and settlement areas) and water bodies observed using a hand-held Garmin eTrex Venture HC. The recorded coordinates were used to transform former LULC types before performing LULCC detection to generate the final results.
Supervised classification: The Ground control points (GCPs) data obtained from field visits was used in the supervised classification process. The images were classified using the supervised classification technique of Maximum Likelihood Parametric Classifier (MLPC) and Nearest Neighbor Algorithm (NNA) where the training sets (signatures) were provided by the user based on the visual interpretation of the image. This was a step used to identify various land use features on the images. The Maximum Likelihood (ML) classifier differs from vegetation indices in that it assumes that the statistics for each class in each band are normally distributed, and it calculates the probability that a given pixel belongs to a given class. This entailed a computer-generated assignment of spectral signatures to various land use types by assigning spectral classes to each spectral signature. These training signatures were created with at least 10,000 pixels per land cover class [30]. The supervised and final classification based on the GCPs collected during field visits was performed in ENVI 5.3 to determine the actual land cover types in the study area. All ground control points were hence overlain on the classified maps obtained from remote sensing for verification and determination of the accuracy of fit [32].
Accuracy assessment: Due to overlapping spectral reflectance among some land cover classes, the classification was polygonized and exported to ArcGIS version 10.3 for further processing with on-screen manual digitization of some land cover class areas. Accuracy assessments of the different land use land cover maps resulting from maximum likelihood classification were done using field samples and Ground Control Points (GCPs) as validation sets. Accuracy assessment of land-use classes is a significant set for understanding the classification errors, and their impact and for evaluating the quality of the classified image [33]. The statistical measurements of the validation were compiled in a Confusion matrix, producer, user, overall accuracy, and Kappa Statistics (k) [34,35] Equation 1,2,3, and 4. The kappa statistics value is a measure of the agreement between the classification and reference data [36].
where:
Pa= Probability of agreement and
Pe= Probability of random agreement
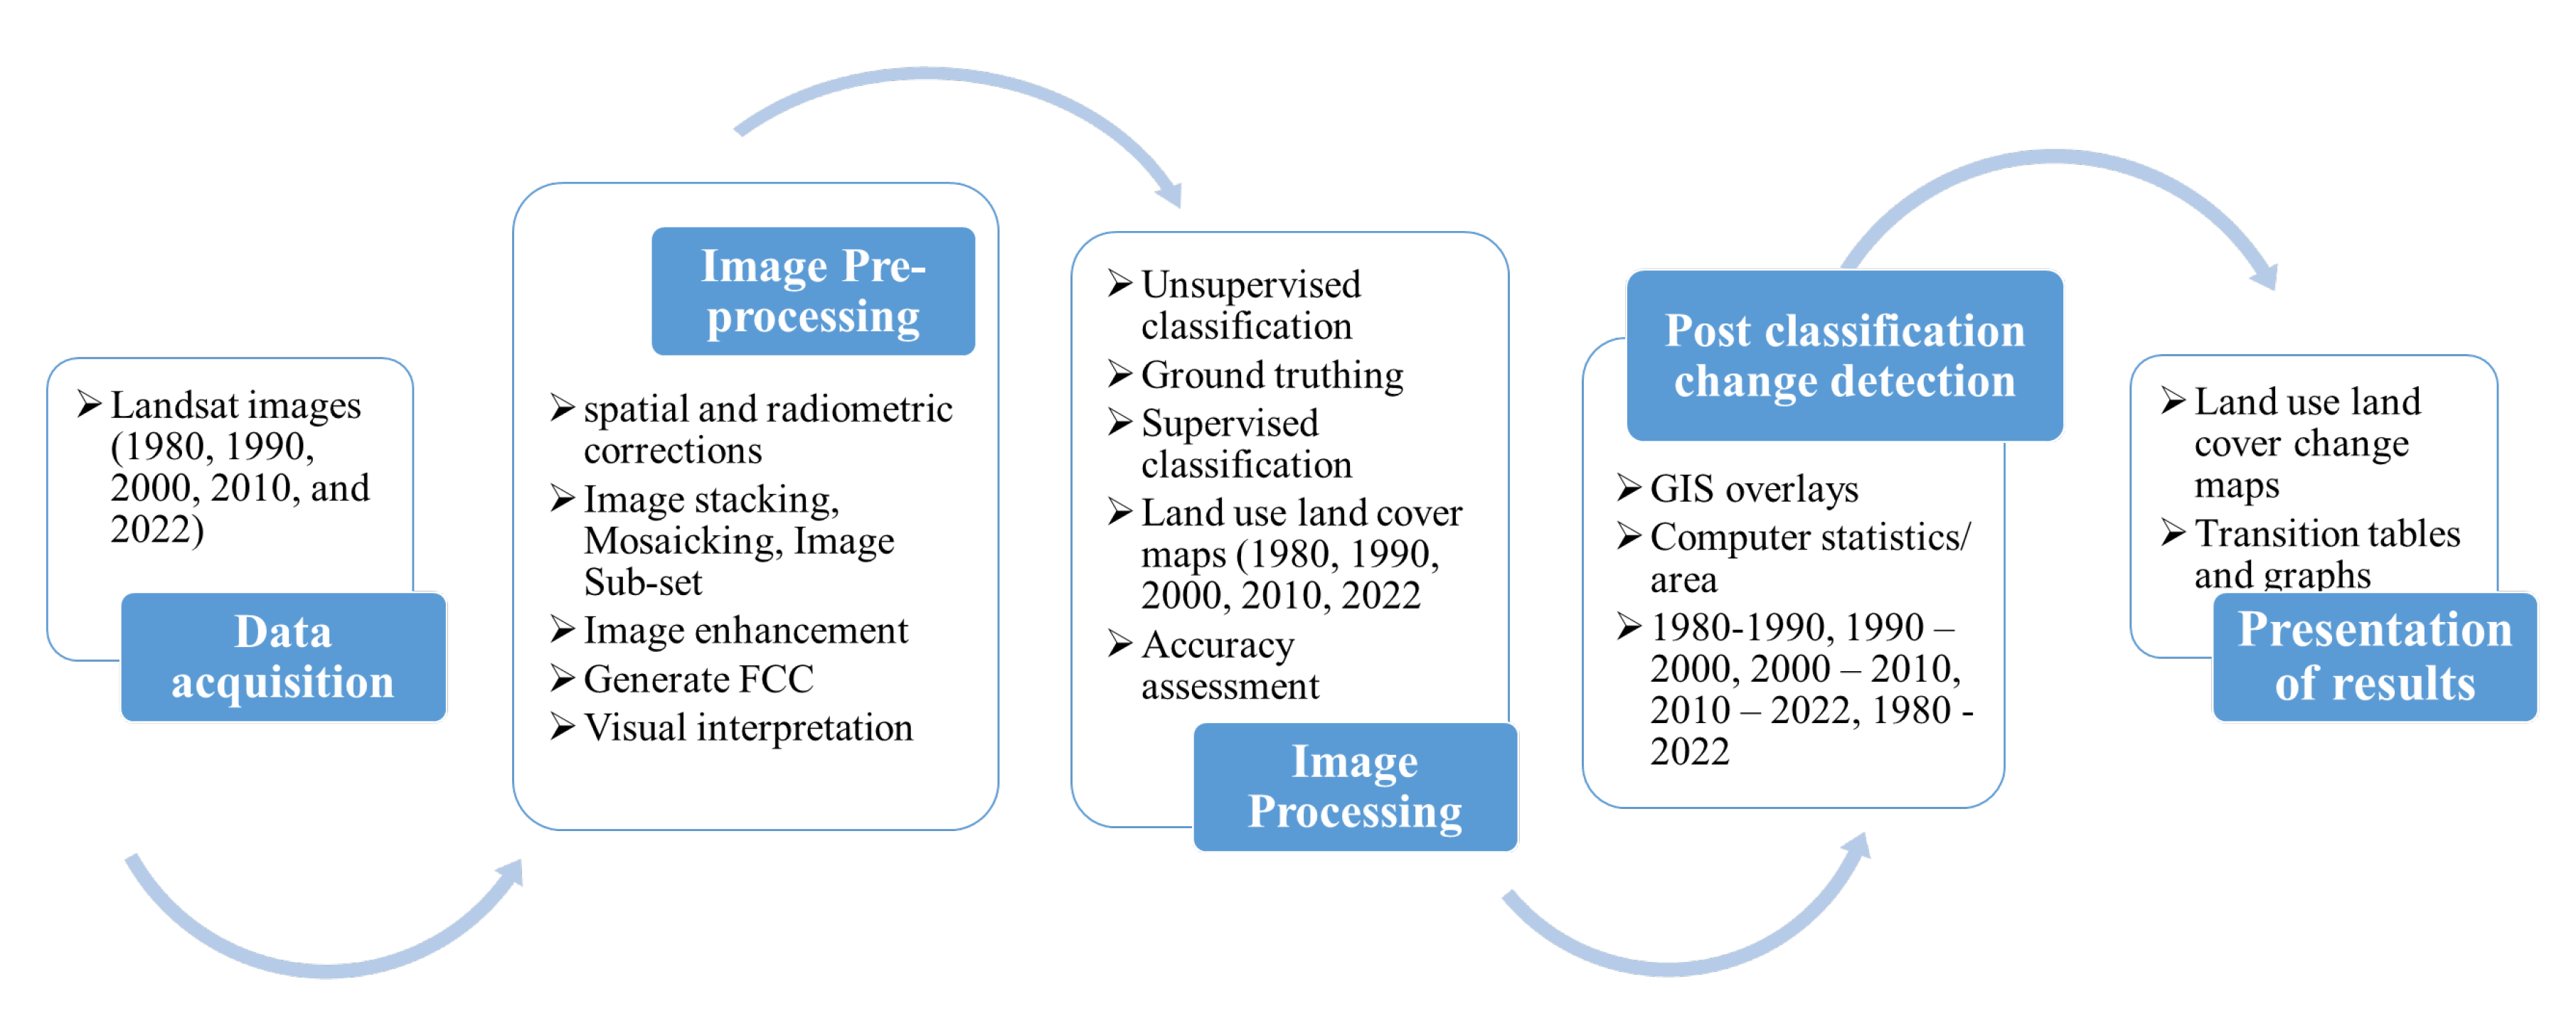
Land cover change detection was done automatically by comparing land cover and land use statistics generated from the multi-spectral and multi-temporal images over an approximately 42-year interval. This used the post-classification approach in which GIS is overlaid in ArcGIS 10.3 based on generated vector themes of the different years. The process of land cover classification and change detection are summarized in Figure 2. The supervised classified maps were subjected to a 4-stage analysis between years. Maps were graded in terms of surface area, area change, % cover change, annual rate of change, and % annual rate of change of the various categories defined. The estimate for the rate of change for each of the different cover categories was computed based on the following formulae 5,6,7 [37]:
where: Area iyearx = area of cover i at the first date,
Area iyearx+1 = area of cover i at the second date,
∑ Areaiyearx = total area at the first date and
i=1
tyears = period in years between the first and second scene acquisition data.
Figure 2.
Summarized procedure for image classification and change detection.
Land cover transition probability matrices
Transition probability matrices were elaborated for 5 periods 1980-1990, 1990-2000, 2000-2010, 2010-2022, and 1980-2022 to describe the changes in each degradation stage. Each matrix represents the probability of the removal of each degradation stage or the probability of transition to another degradation stage from the first to the last year in the period [38]. For a given period, these values were obtained by superimposing the two maps (at t0 and t1) using ENVI 5.3 software and this allows changes in the land cover to be detected between these dates.
Future scenarios for mangroves of the DENP
The transition matrices were used to predict the proportion of each land cover stage, particularly for mangrove at any time based on the Markovian chain model. The projections were based on the assumptions that dynamics observed in 1980-1990, 1980-2000, 1980-2010, 1990-2000, 1990-2010, 1990-2022, 2000-2010, 2000-2022, 2010-2022, and 1980-2022 will prevail. The evolution of the degradation mangrove stage was then predicted over some period using equation 8 [3]:
where:
NTi = PT Noi
NTi = The predicted distribution/area
P = The transition matrix of a period (e.g 1980-1990)
Noi = The distribution/area cover (e.g for 1980)
T = time step for the matrix which is either 1, 1.2, 2, 2.2, 3, 3.3, or 4.2.
The model suitability was validated using a Kolmogorov Simonov (KS) test [46] in R version 4.2.2. For this KS test to be performed, the area predicted from the 1990 scenario was based on the transition matrix during the 1980-1990 period which was compared with the actual distribution for 1990. The distribution and area predicted from the 2022 scenario was based on the transition matrix 1980-2022 and was compared with the actual distribution and area for 2022.
The stable stage distribution and area cover were respectively determined by computing the eigenvalue and the eigenvector associated with each of the transition matrices. The nature and magnitude of the dominant eigenvalue and associated eigenvector were examined for stability. The sign and magnitude of real eigenvalues showed whether there was lost (negative eigenvalues) or increase (positive eigenvalues) in land cover and areal extent. Eigenvalues and vectors were computed using R version 4.2.2.
Mangrove deforestation rate
For the mangrove forest category, the annual deforestation rate (r) was calculated using the formula by [38] Equation 9:
where:
r = the annual average deforestation rate (calculated in % of mangrove loss per year);
A1 and A2 = the initial and final mangrove forest areas, respectively (at dates t1 and t2);
t1 and t2 = the start date and the end date of the period in years considered for the calculation
r < 0 indicates deforestation, whereas r > 0 rather indicates expansion (i.e., no deforestation), r = 0 indicate forest stability i.e., stagnation.
3. Results
3.1. Land Cover Land-Use Categories of Mangroves from 1980-2022 in the DENP
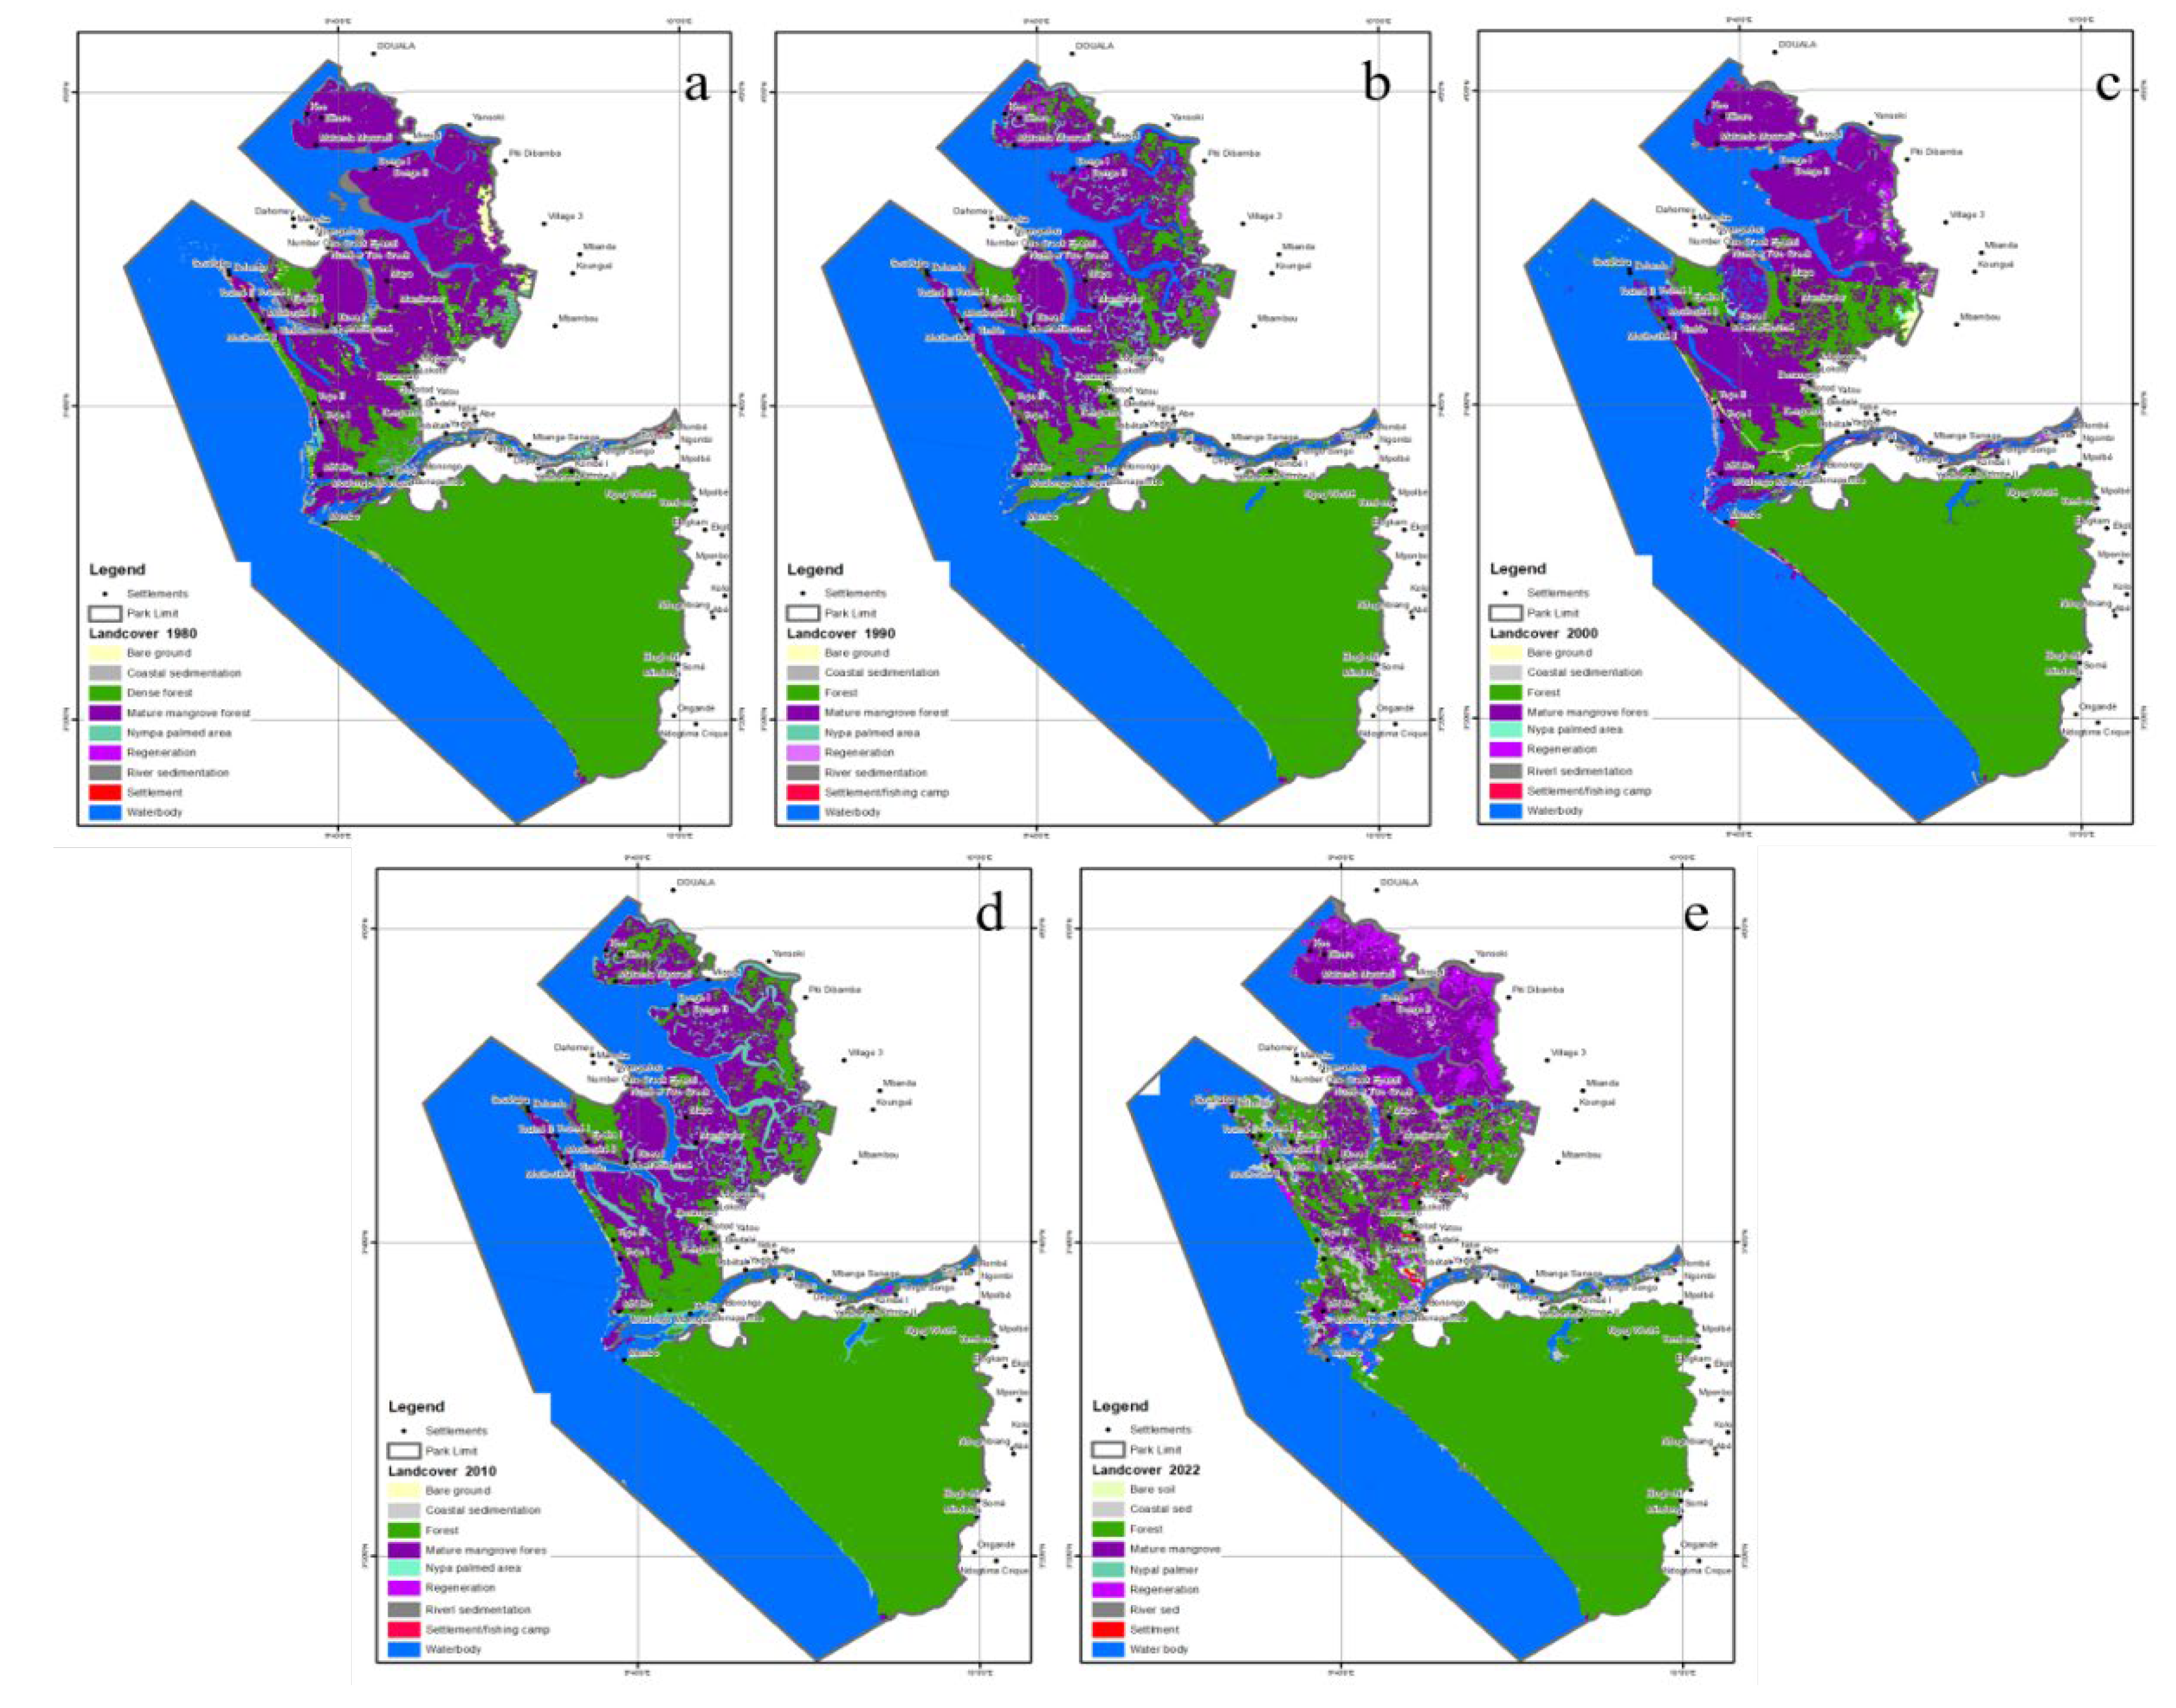
The time series analysis and processing of Landsat TM images from 1980, 1990, 2000, 2010, and 2022 resulted in nine different land use land cover classes as shown in Figure 3. The maps provide useful information about the pattern and extent of mangroves in the past and current situation and highlights the high rate of dynamism in the land cover classes. All through the five maps, water and dense forest were the most dominant land cover categories indicative of areas of interest. There was a continuous increase in bare land or degraded mangrove forests from 1980 to 2022 (Table 2) probably resulting from strong anthropogenic pressure on mature mangrove stands. In the year 1980, matured mangroves occupied a surface area of 89628.78 ha (27.83%), 56005.26 ha (20.52%) in 1990, 52809.52 ha (19.01 %) in 2000, 41598.83 (15.31 %) in 2010, and 288555.16 (10.42 %) by 2022. The population of palms in the DENP stood at 3014.1 ha in 1980 and by the year 2022, the palm had reached 5435.5 ha. We observed that palm occurred at the fringes followed by mangroves forest and then the final transition to the adjacent tropical forest. The fringes were also associated with build-up areas. The area of settlement from the analysis was estimated at 3633.93 ha, 5874.57 ha, 14018.47 ha, 4146.1, and 3270.25 ha in the years 1980, 1990, 2000, 2010, and 2022 respectively. The water body covered a large surface area of the studied area. The total surface area of degraded mangroves to the level of bare ground in 1980 was 1562.93 ha and by 2022 the degradation area had increased to 3934.7 ha at a percentage rate of 1.42.
Figure 3.
Distribution maps of mangrove land cover for the years 1980 (a), 1990(b), 2000 (c). 2010 (d), and 2022 (e).
Figure 3.
Distribution maps of mangrove land cover for the years 1980 (a), 1990(b), 2000 (c). 2010 (d), and 2022 (e).
3.2. Change Detection in Land Cover Land Use in the DENP
Change detection analyses offer information on the expansion and shrinkage rates of the area under study in addition to the areal extent differences in a specific period. The enhancement of image classification resulted in the overall accuracy of 99.28%, 99.88%, 99.54%, 99.7%, and 95.45% for the years 1980, 1990, 2000, 2010, and 2022, respectively and the Kappa coefficient ranged between 0.95 to 0.99 (Table 3). These kappa values are closer to +1 for all images, indicating a satisfactory agreement between observed and predictable accuracy.
A detailed account of area changes observed on the land use land cover classes in the DENP within short periods of ten, twelve, and forty-two years are shown in Table 4. The different land use land cover types identified in the study area were impacted. There was an increase in degraded mangrove areas between 2000 – and 2010 by 1.26%. Comparing the maps between 2010 to 2022, there was a loss in degraded mangroves over the area and an increase of 2.68 % in regenerated mangroves. It cannot go unnoticed that there have also been regeneration efforts both by natural, and artificial means through government ministries, and local, and International NGOs which have boosted the survival of mangroves in the DENP. The increase in mangrove population by regeneration (4.6 % between 2000 – 2010, and 6.85% from 1980-2022) is also at risk from the fast-growing invasive palm in the study, and an increase in river sedimentation poses a threat to the mangrove in this area. The area under the river sedimentation class has changed significantly by 5.72 % in 2022, this can also account for the decrease in mature mangrove forests. The highest decrease in matured mangrove forests was observed between 1980 and 1990 by a percentage of 7.31. Concurrently, waterbody has decreased throughout all the periods but increased for 2000-2010 by 1.96%. The present study also disclosed an increase in river sedimentation with the highest values of 5.72 recorded between 2000-2010.
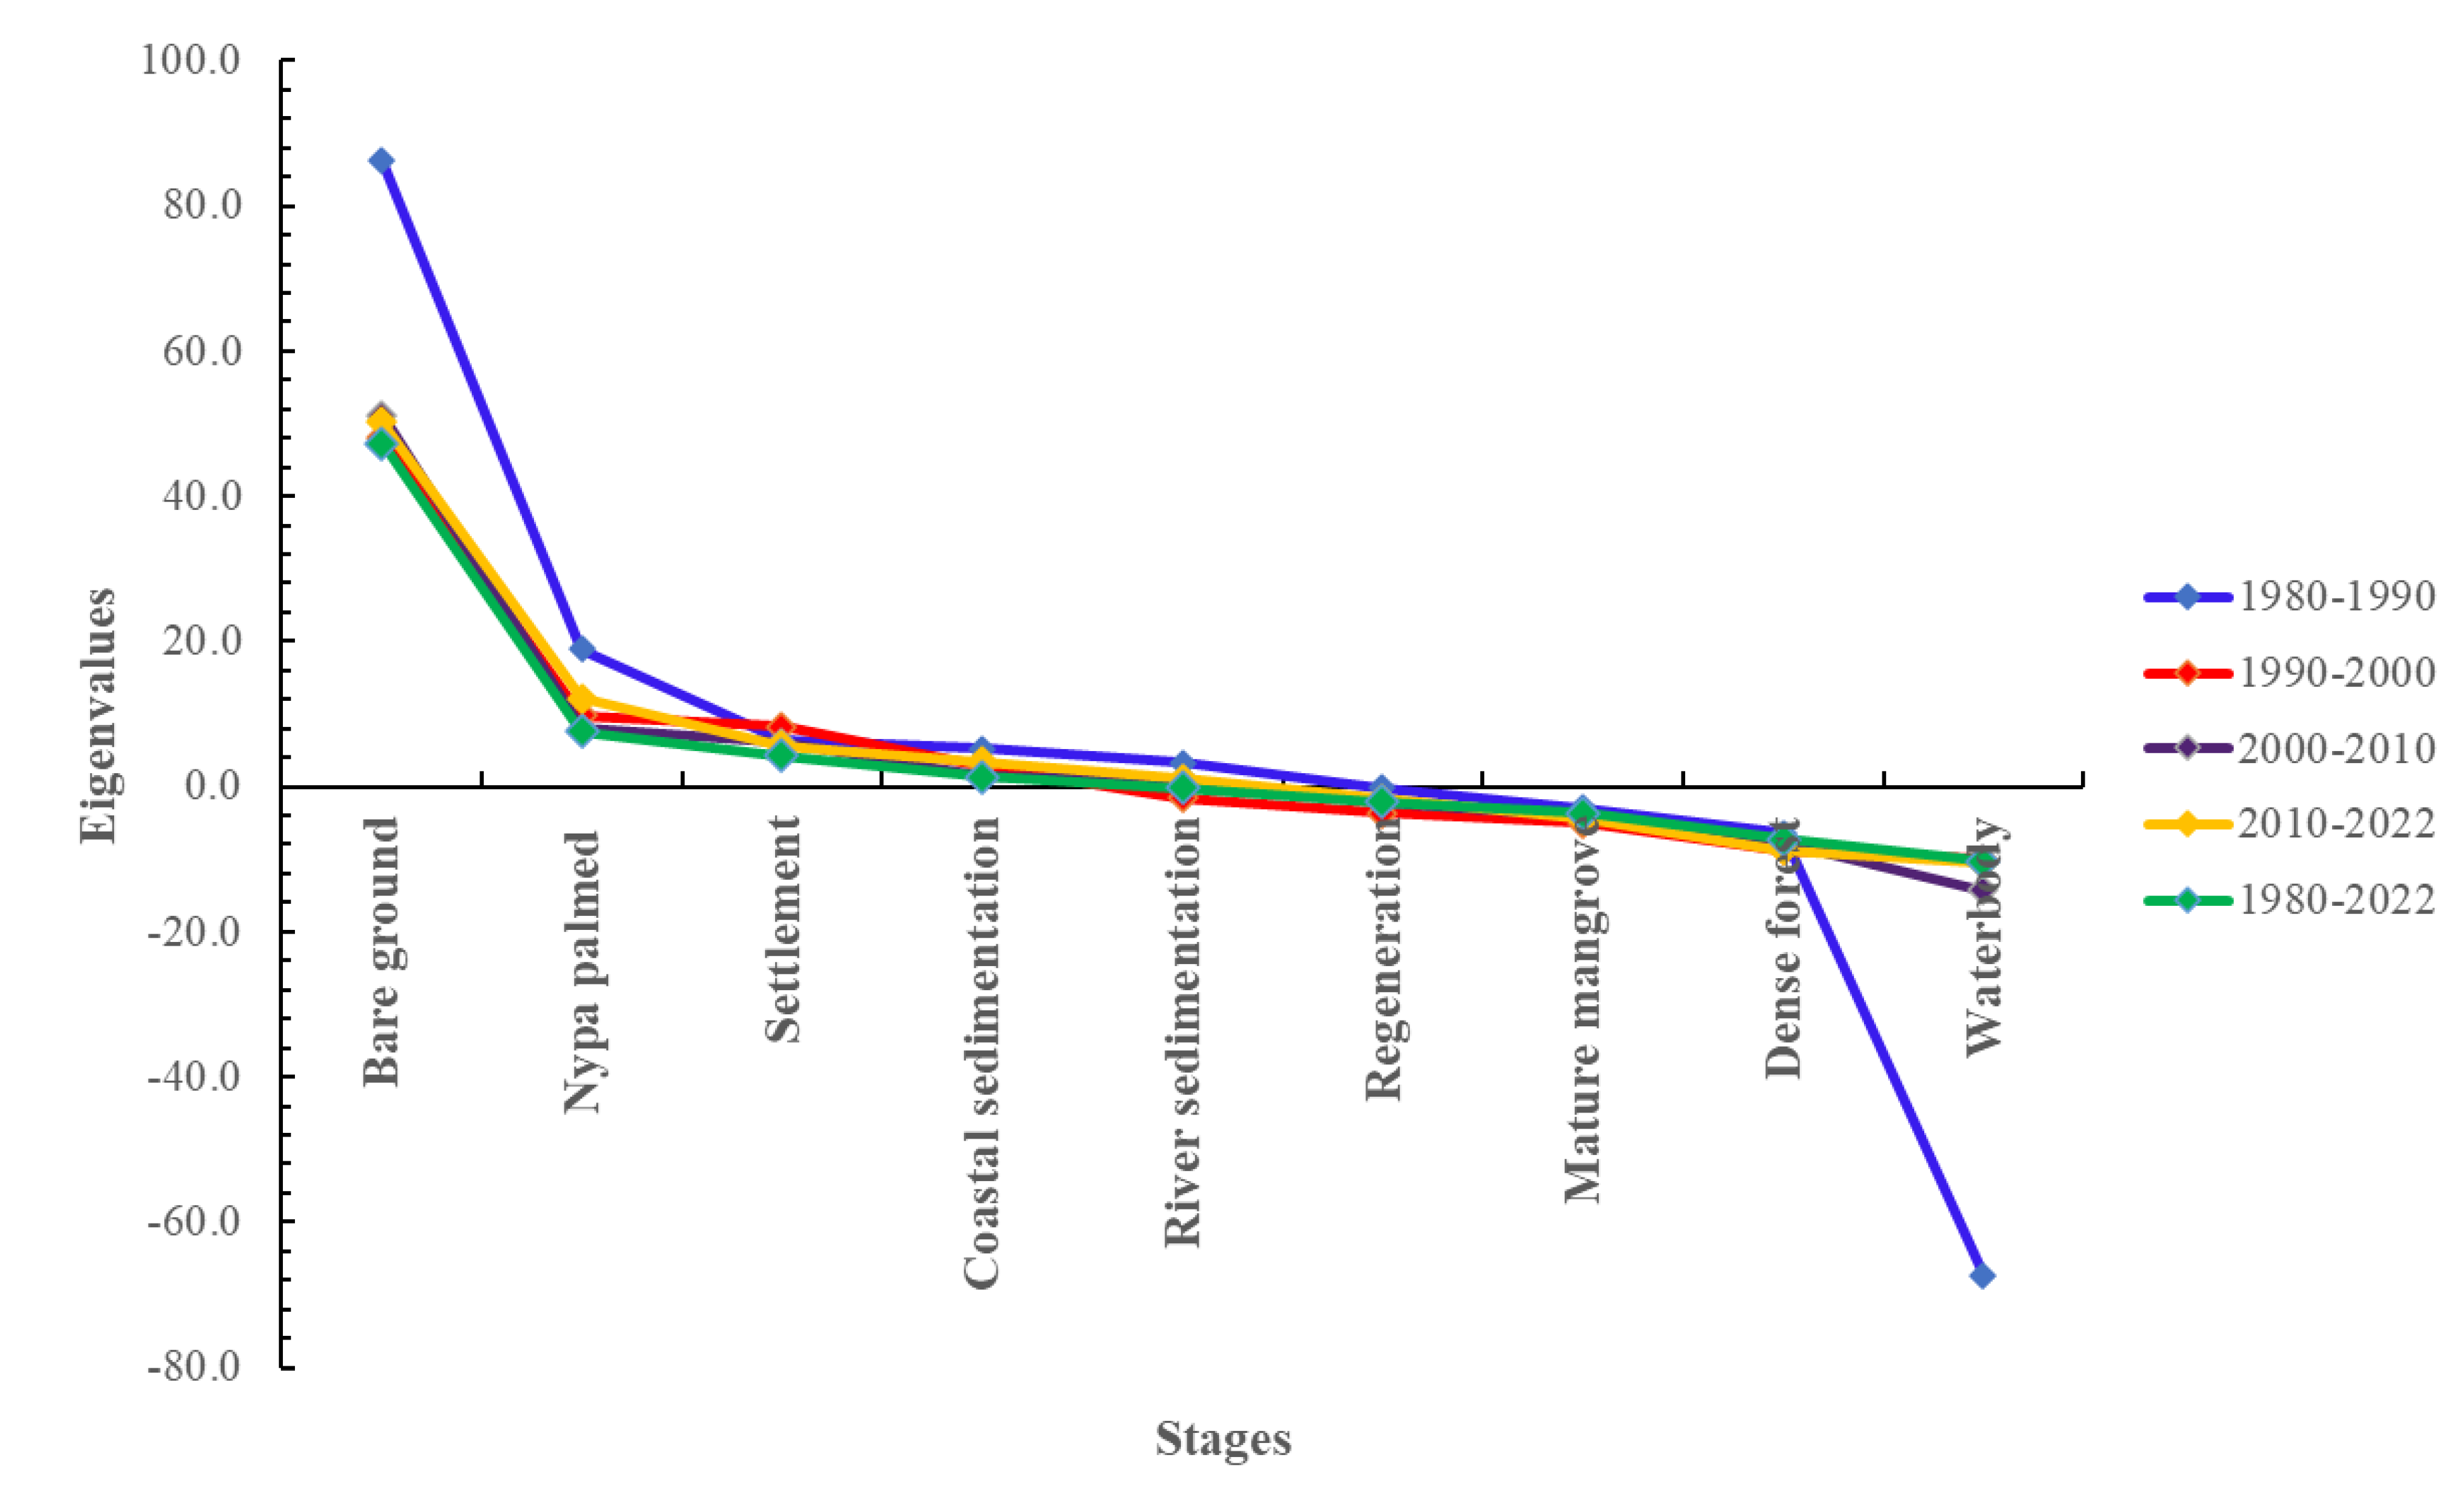
The eigenvalues of the different matrices are presented in Figure 4 and show a general reconstitution of the matrices. There was a high magnitude in eigenvalues from 1980-1990. Even though there was an increase in regeneration its corresponding eigenvalues indicated degradation of this class. While the bare ground, Nypa palm, settlement, and their corresponding eigenvalues showed the reconstitution of these classes.
Figure 4.
Trends in eigenvalues matrices of the different time intervals of mangrove reconstituted stages.
Figure 4.
Trends in eigenvalues matrices of the different time intervals of mangrove reconstituted stages.
3.3. Conversion of Mangroves in the DENP from 1980 to 2022
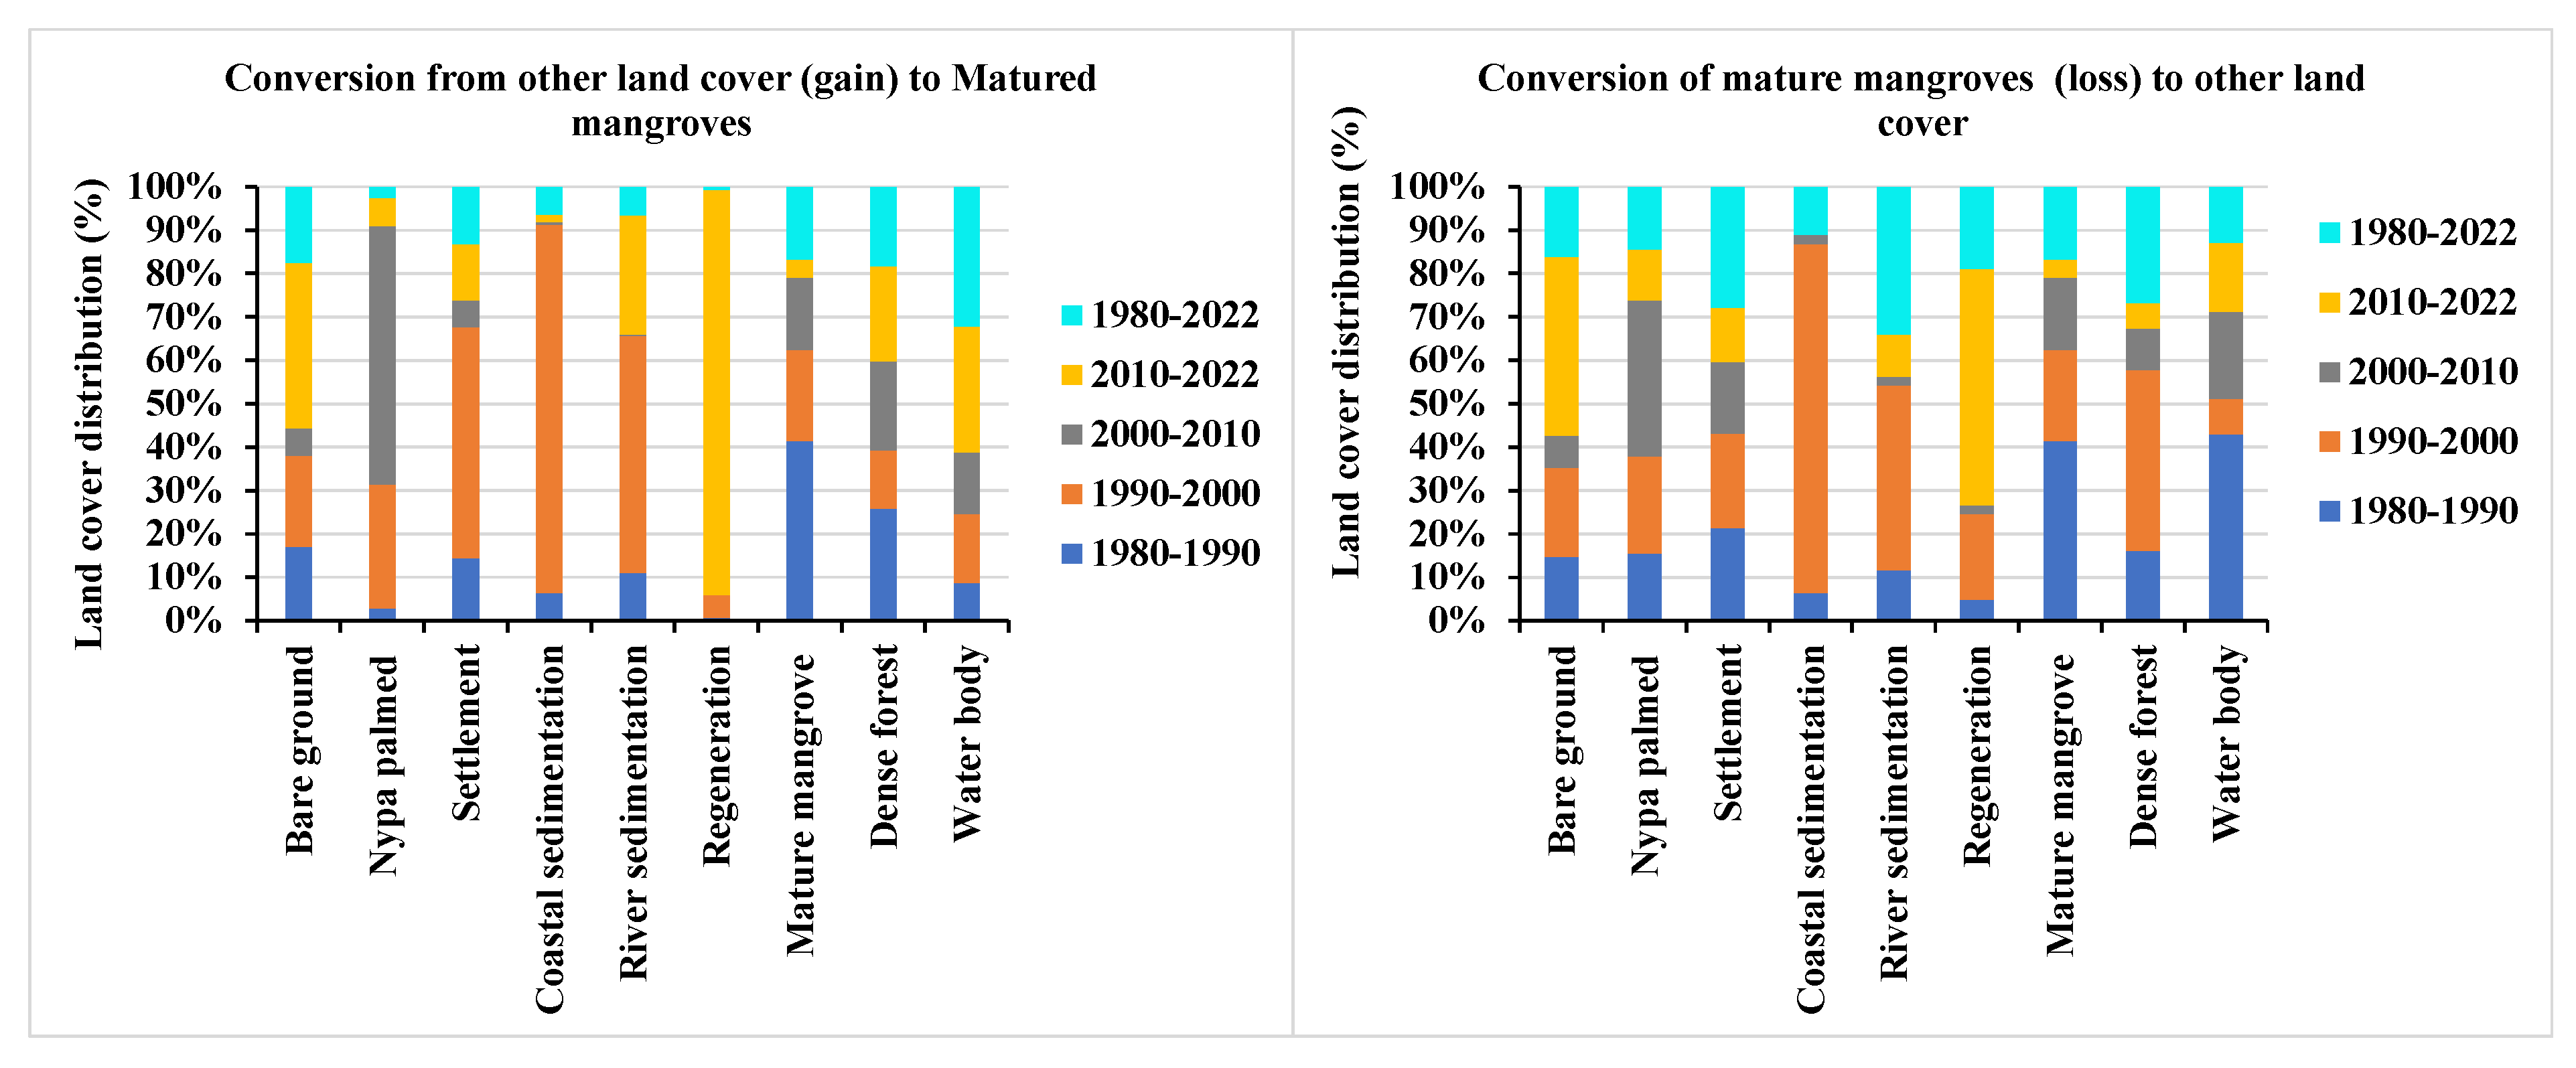
Mangrove loss is a result of the conversion of mangrove forests to other land covers as well as mangrove gains that is the conversion from other uses to mangroves (Figure 5). Between 1980-1990, a large chunk of mature mangrove forest was loss/ converted to other uses mostly settlement, waterbody and bare ground while mangrove gain was mostly from bare ground and settlement during the same period. In the period from 1990-2000, the mangroves were converted mostly to coastal sedimentation, river sedimentation, and gains were as well from coastal sedimentation, river sedimentation, and settlement. Mangrove gain was highest from regeneration both artificial and natural, bare ground, and river sedimentation, while loss was mostly as a result of conversion to bare ground and regeneration sites during the period 2010-2022.
Figure 5.
Conversion of matured mangroves to other land cover and from other land cover to mature mangroves.
Figure 5.
Conversion of matured mangroves to other land cover and from other land cover to mature mangroves.
The average annual deforestation rate of mature mangrove forests was r = -0.036%, -0.006, -0.024, and -0.031 for the years 1980-1990, 1990-2000, 2000-2010, and 2010-2022 respectively, indicating net decline of mature mangroves in the DENP.
3.4. Trends of Mangroves Predictions Following Different Time Matrices
The predictions of mangrove degradative stages with their actual distributions over the period of the study are presented in Figure 6. Following the Kolmogorov-Smirnov (KS) test, he difference between the actual and the predicted probability using the 2000-2010 matrix was not significant (D = 0.556, p > 0.05) though greater (p < 0.05) for the rest of the matrix. The p-values obtained were 0.0082, 0.000041, 0.000041, 0.000041, 0.000041, 0.000041, 0.126, 0.000041, and 0.000041, for 1980-1990, 1980-2000, 1980-2010, 1980-2022, 1990-2000, 1990-2010, 1990-2022, 2000-2010, and 2000-2022 respectively.
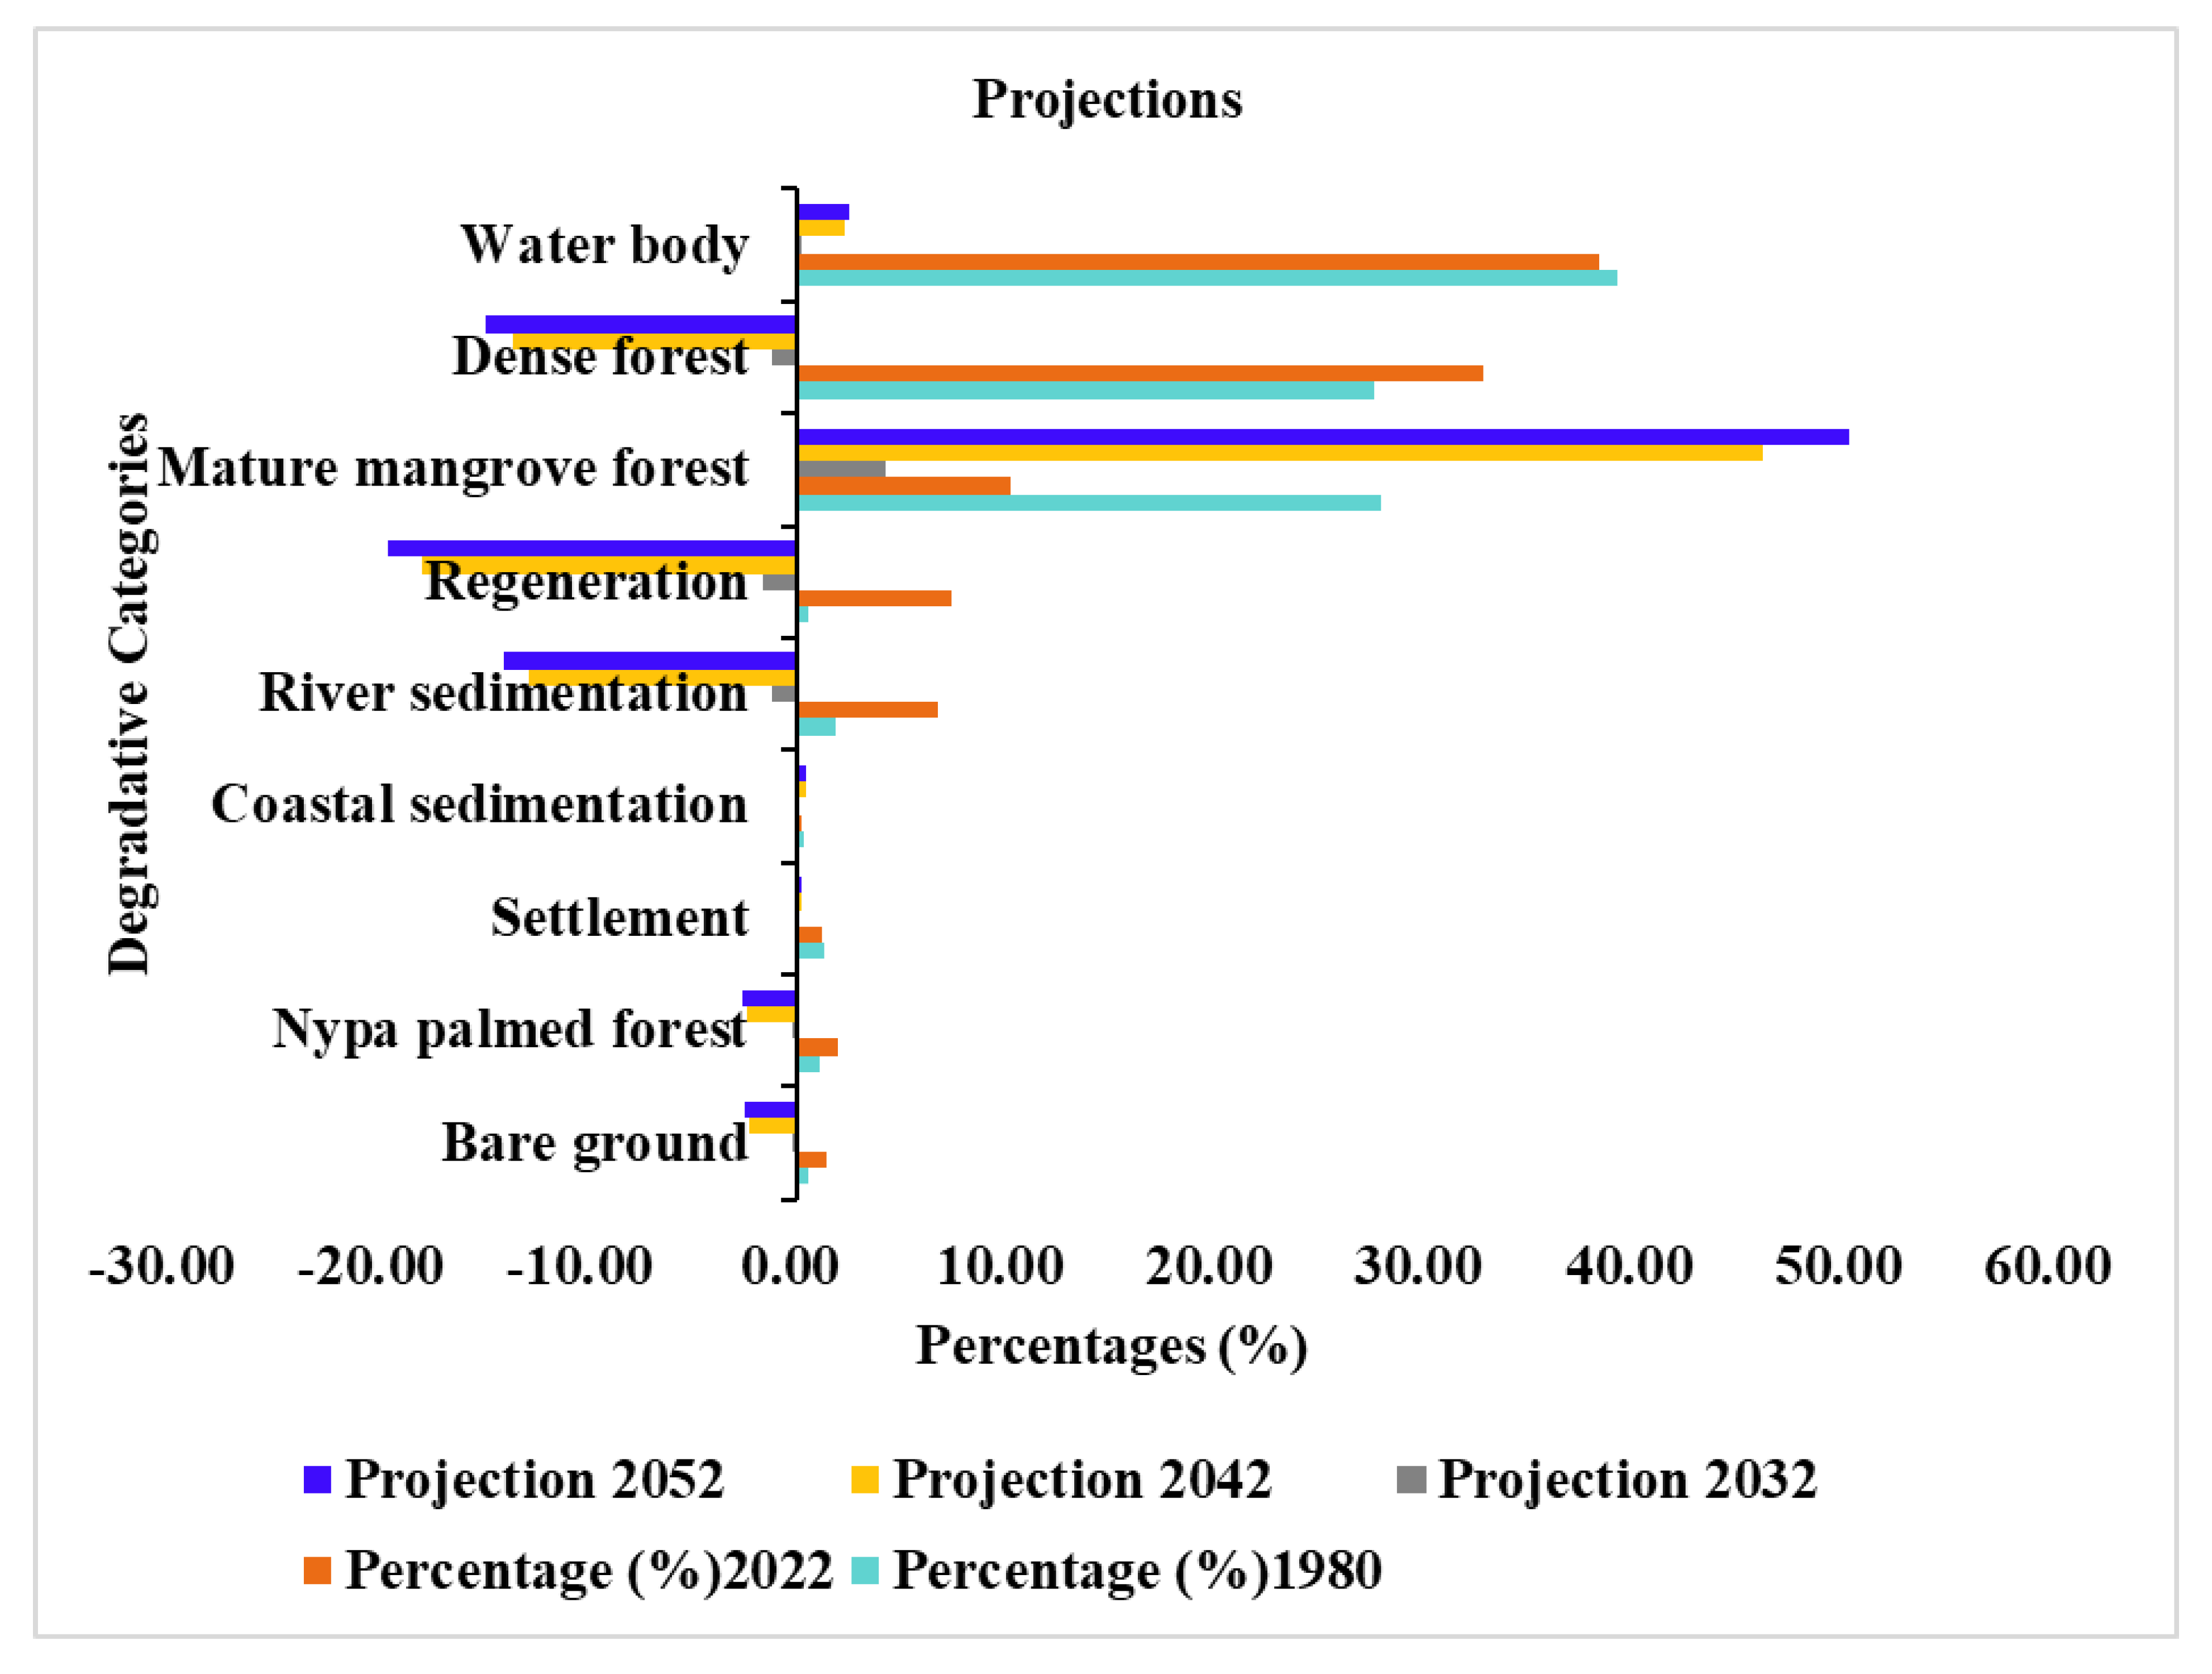
Mangrove projections for 2032, 2042, and 2052 were done based on the cover change in 2022. It illustrated that the bare ground which is as a result of over-exploitation of mangroves to the point where the ground is bare will decline by 2.49% in 2052, while the area covered by settlement and coastal sedimentation will increase by 0.23% and 0.46% respectively. As shown in Figure 6, mature mangrove cover was projected to increase by about 4.19%, 46.06%, and 50.24% in the years 2032, 2042, and 2052 in that order. Meanwhile, the projection of mangrove regeneration demonstrated a decline in those same years by 1.63%, 17.91%, and 19.54%.
Figure 6.
Projection of land cover change from 2022 to 2052.
4. Discussion
The area of mangroves worldwide is decreasing due to increasing human activity, climate change, and unfavourable environmental circumstances. Estimates from this study revealed that matured mangrove areas experienced continuous loss in surface area over the forty-two-year study period. This could be associated with excessive fuel wood harvesting for fuel wood and construction. This result is per what was obtained for Manoka island where 267 ha of mangrove was lost over 32 years between 1986 and 2018 [19]. Munji [52] also revealed that approximately 989 ha of mangrove forest cover was lost to forest clearing and settlement relocation for over 43 years in Cap Cameroon. In response to the sea’s increasing encroachment and the yearly intensification of seasonal surges linked to coastal flooding, the inland retreat has made it necessary to clear mangroves to make room for relocation. Harvesting of logs for fuel wood and poles for construction props are the primary causes of mangrove forest degradation in the Douala-Edéa National Park in general and particularly in the fishing camps of Yoyo 1, Yoyo 2, Youme 1, Youme 2, and Mbiako [21,25]. Fuel wood is the main source of energy used by the island’s inhabitants to cook and smoke fish, particularly the red mangroves (Rhizophora species) [53]. It is exploited illegally in the form of poles mainly by women fish smokers and in the form of logs by illegal operators to meet demand in the city of Douala. The selective harvest of young Rhizophora stems greatly affects natural regeneration and recruitment into larger size classes reducing the ability to renew degraded spaces. Efforts by civil society organizations to use improved ovens for smoking fish to reduce pressure on mangroves have not borne fruit [19]. Fish smokers continue to cut considerable quantities of wood stocked and piled at several large storage depots in the fishing settlements. The demand for fuelwood is high in these fishing camps, while production has dropped considerably due to over-exploitation, a significant factor contributing to deforestation and degradation of mangroves and other associated forests [39]. Mangrove mapping and monitoring in Le Morne using remote sensing techniques demonstrated a significant increase in mangrove cover over the decadal scale with the main class change from mudflat to mangroves. Latest global updates show that between 1996 to 2020, the world’s mangrove extend has declined by 5,245.24 km2, noting that drivers of loss include erosion, agriculture and aquaculture, settlement, non-productive conservation, and extreme climatic events [48,49]. Report on the state of world’s mangrove indicated direct settlement in mangrove area as the main driver of mangrove loss (38%) in West and Central Africa [51].
The surface area occupied by Nypa fructicans witnessed an increase between 1980 and 2022 which can be attributed to invasive tendency of fast growth that out competes mangrove species in open space resulting from harvesting and other forms of degradation. Degraded mangrove forests in the Niger Delta are reported to have been taken over by Nypa palms covering a large extent of the mangroves in Nigeria estimated at 28000 ha in 2022 [40,41]. The continuous invasion of native mangroves could result in a devastating combination of impacts on native habitats, carbon storage, and economic opportunities. The presence of Nypa palms has been reported in all three mangrove blocks along the Cameroon coast and its implications for continuous impact on mangrove habitat assessed [40,42]. Mangroves are therefore facing severe menace from encroachment by the invasive palm which may lead to almost complete ecological substitution of mangroves along the west and central African coastline in the subsequent 50 years.
The observed increase in mangrove regeneration of 19014.97 ha over 42 years through natural and human-aided restoration is an indication of a promising mitigative approach in preventing the proliferation of Nypa palms in degraded mangrove stands in the region. Worldwide mangrove gains have been recorded at approximately 33% and 80% by artificial and natural restoration respectively [49]. It is imperative that we change the way we interact with the environment and move toward a more just and sustainable future where actions that cause ecosystem degradation and loss are eliminated.
The period from 1990-2000 showed a high intrusion of build-up within the park, and a decrease from 2010 through to 2022. This decrease in settlement can be related to climate change’s impact on sea level rise which has led to coastal sedimentation and the burial of some settlements in the area (Figure 7). Land cover changes and the development of numerous human activities in the area have subjected the natural space to a variety of risks that exacerbate the vulnerability of populations to climate change. With deforestation and the degradation of mangroves, the role of a natural green barrier that prevents coastal erosion and limits the propagation of invasive plants is broken. Mangroves play a crucial role in defending the coastline from impairment due to waves and tropical storms, mitigating risks of erosion and flooding to coastal communities [48]. However, communities in DENP are increasingly exposed to climate change risks such as coastal erosion and flooding. In the villages Yoyo 1, Youme 2 and Mbiako, coastal and river sedimentation is causing considerable damage to homes (Figure 7). Many villages and camps in the national park are situated on the shoreline with no safe distance between the sea and homes, making them vulnerable to flooding, sedimentation, and erosion. This exposure combined with coastal erosion and sedimentation aggravates flooding during high tides. In line with our study, [43] in their study to evaluate mangrove forest dynamics in the same area by then still under the status of a reserve, observed a decrease in settlement by 47.21 km2 from the year 2001 – 2015.
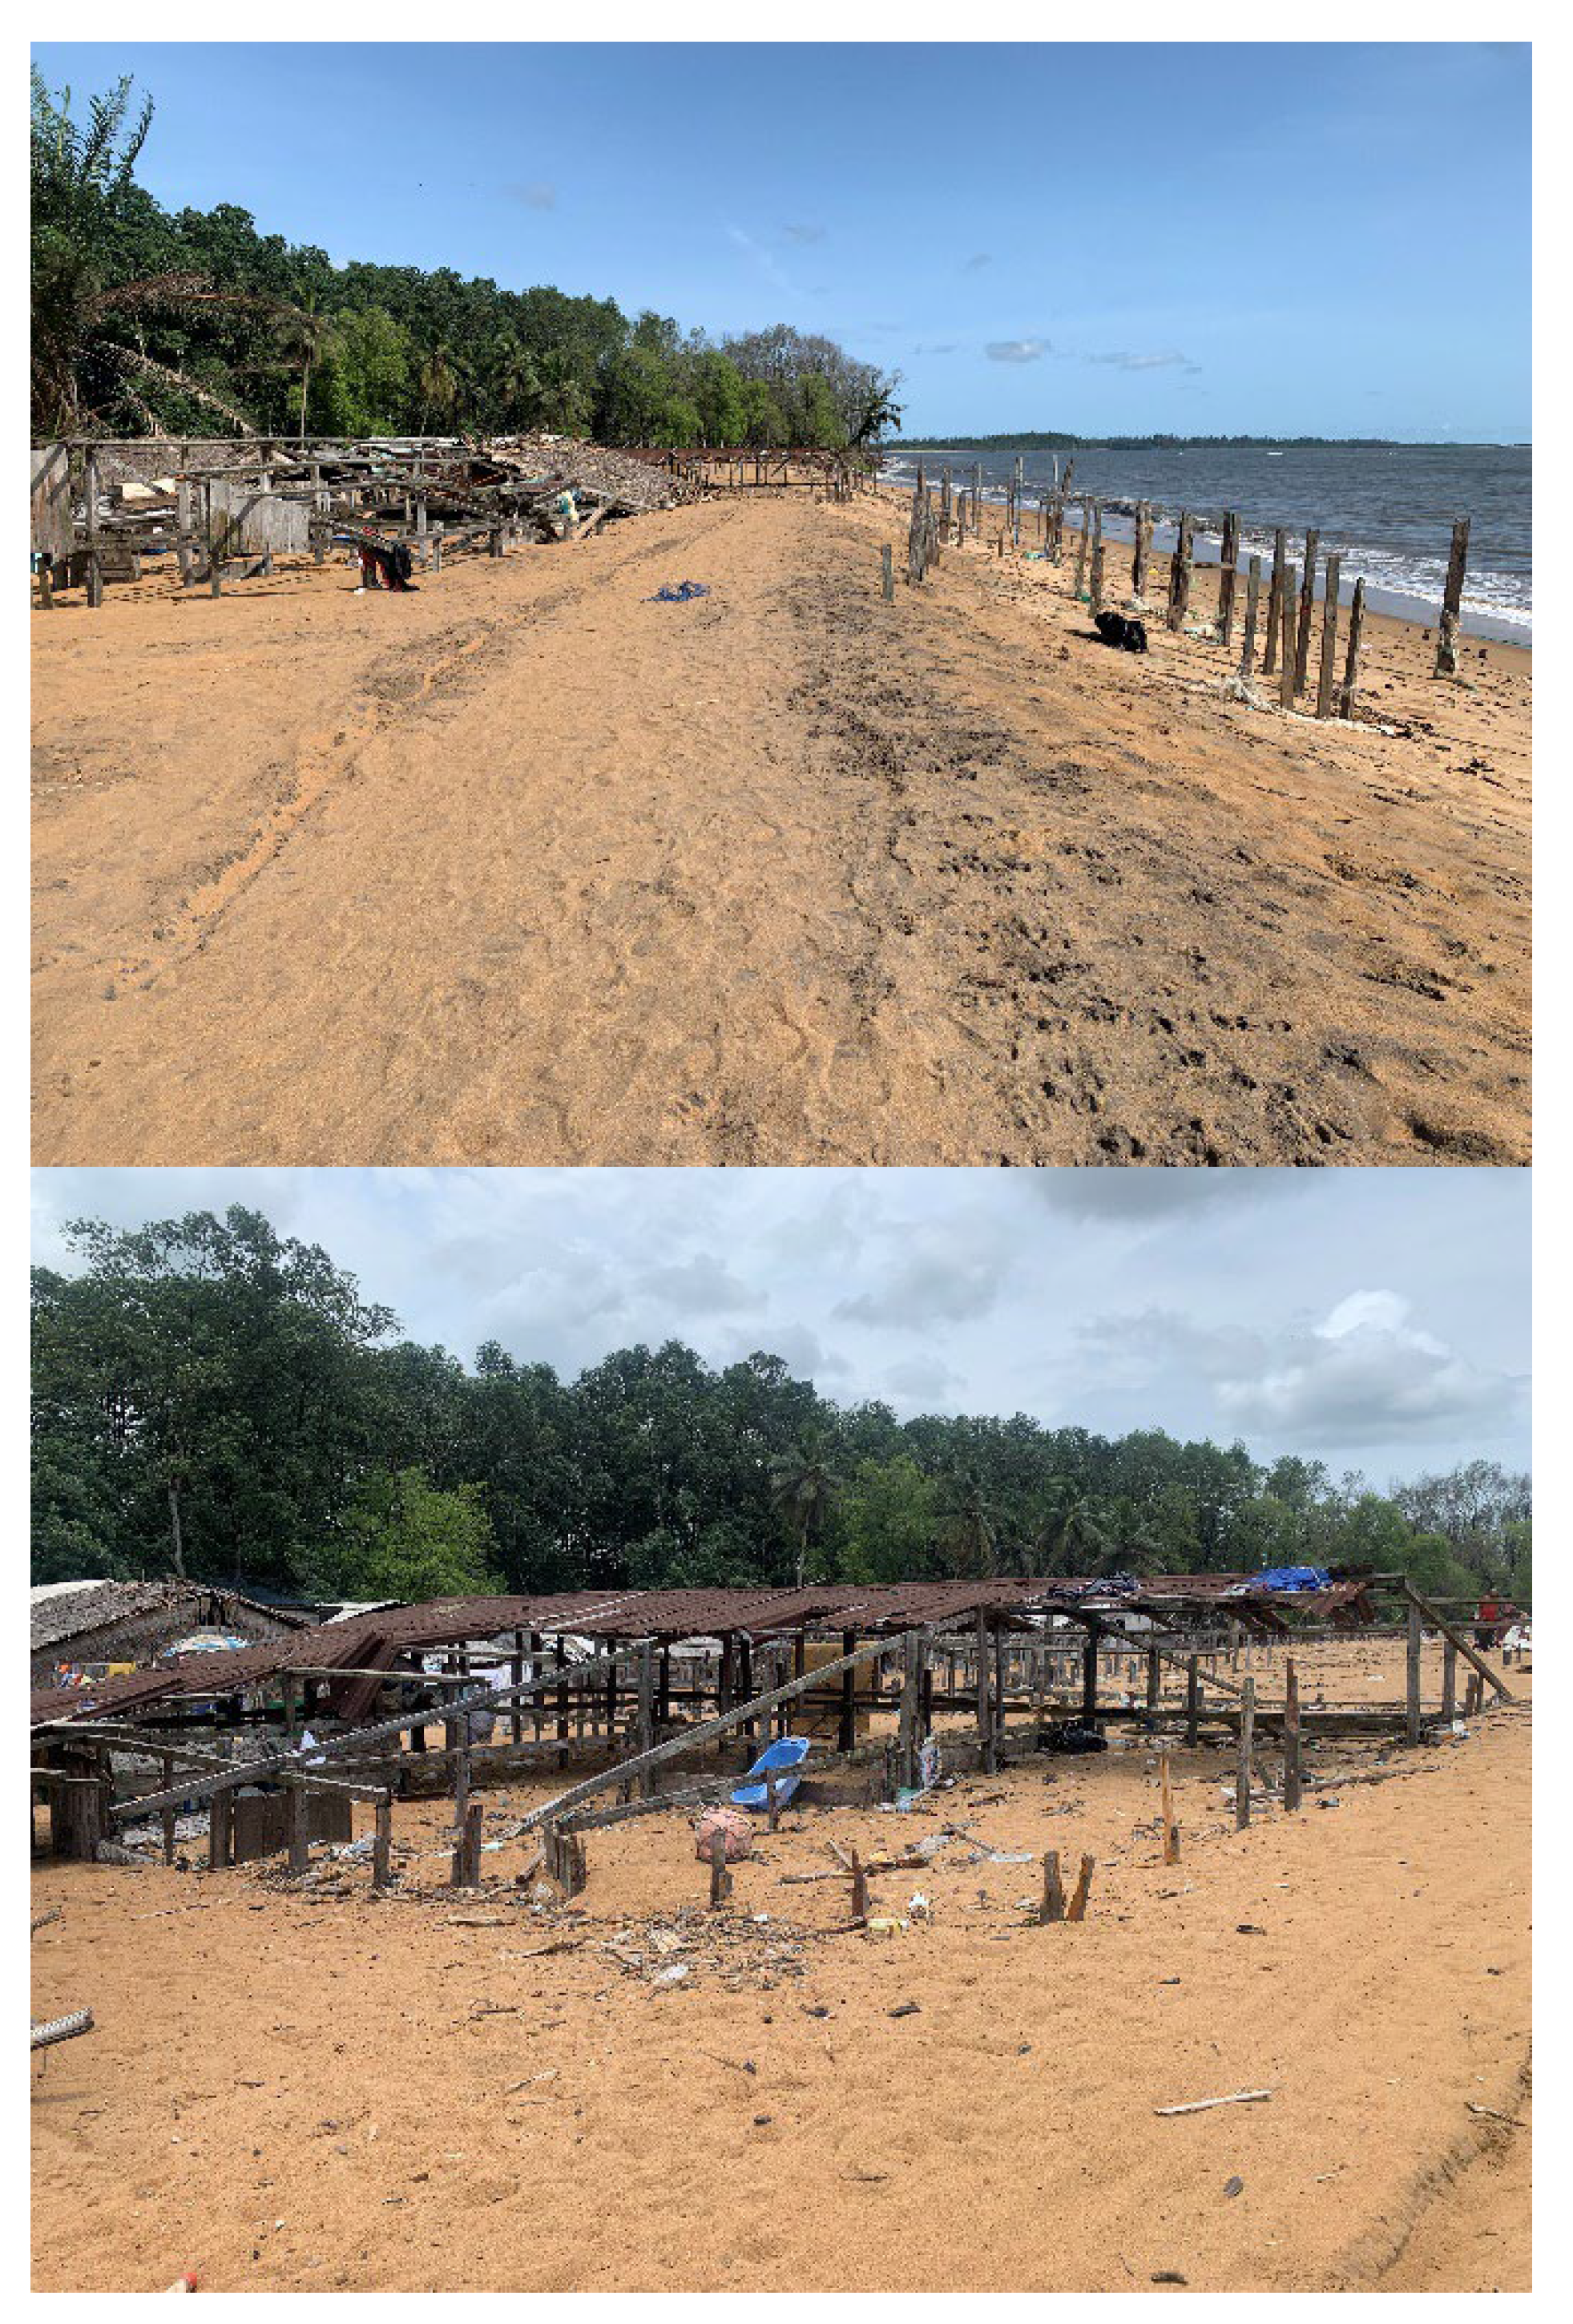
Figure 7.
Homes damaged by coastal sedimentation (sand accretion) in the Douala-Edea National Park.
Contrary to our study, [19] witnessed an increase in settlement in their study in Manoka due to population growth and urban development and infrastructure. While this study presented a decrease in waterbody all through the period except for 2000-2010 and an increase in river sedimentation. A study to understand the dynamics of the landscape of the greater Sundarban area reported that the river claimed several small islands that were home to mangrove forests, but it also created other small islands that are now being progressively overtaken by mangrove forests [44]. Coastal erosion of up to 50m per year and accretion leading to mangrove loss was detected between 2000 and 2018 [45], in a study on mapping mangrove dynamics and colonization patterns in the Suriname coast. However, our study showed a 0.16 % decrease in coastal sedimentation. The assessment of mangrove cover shifts in Segara Anakan showed that mangrove was converted into fishponds, rice fields, settlement areas, and water bodies [51].
Projection of forest area is necessary to recognize the future scenarios of the forest-based on present and past conditions. This will aid humanity to be well prepared to face the danger ahead and make suitable decisions geared at reducing the impacts and degree of damage. The predicted increase in deforestation (bare ground), settlement, and coastal sedimentation in the study highlights an essential need for preventive measures to preserve and restore the mangrove forest ecosystem (Figure 8). While monitoring mangrove forest change and its impact on the environment, there was a considerable decline in mangrove total forest area forecasted to approximately 19% [52]. This reduction queries the longstanding health of the forest ecosystem, while habitat loss, rising carbon emissions, and dwindling biodiversity are just a few of the biological and environmental effects that could arise from a drop-in forest area.
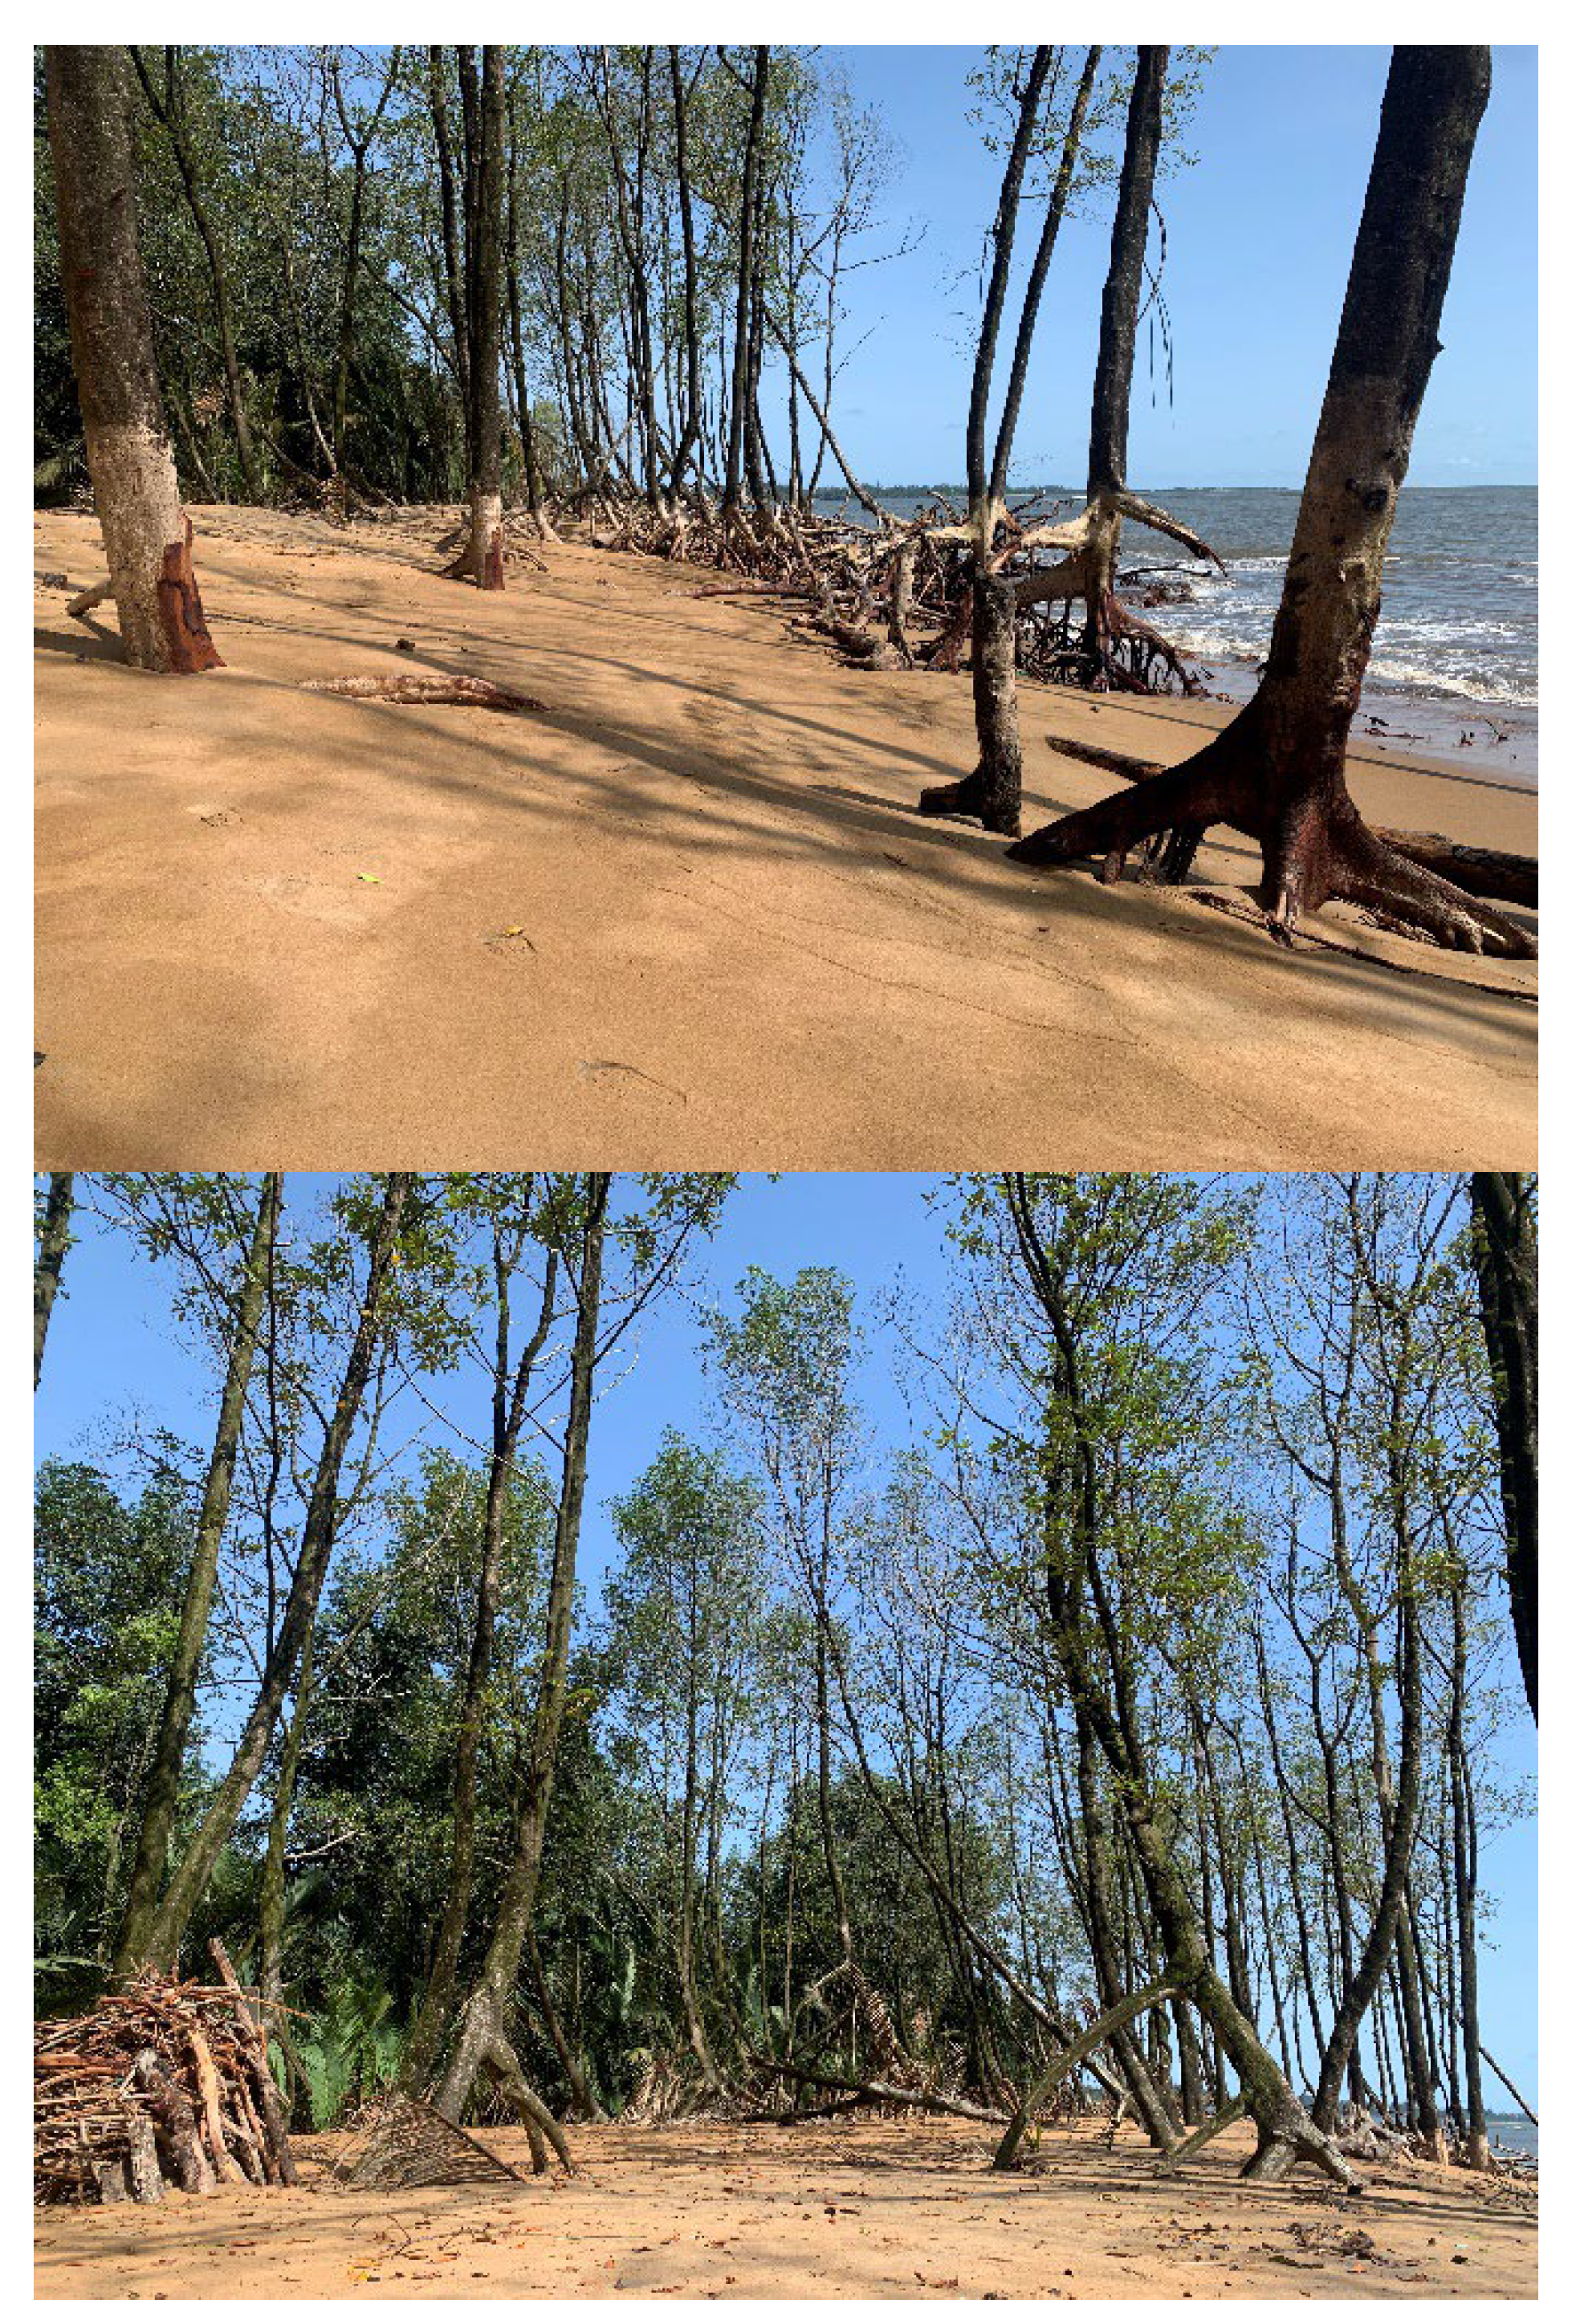
Figure 8.
Mangrove dieback from coastal sedimentation.
The framework for the exploitation of forest resources and the participation of neighbouring communities in management was established by Law No. 94/01 of January 20, 1994, on forestry, wildlife, and fishing, and Decree No. 95/531/PM of August 23, 1995, defining the parameters of application of the forest regime. The destruction of mangroves is exacerbated when people cut wood without permission or fear of punishment. According to [26], human encroachment and development-driven enthusiasm, over-exploitation for fish smoking, and a lack of mangrove policies are all contributing to the alarming pace of deforestation in mangrove forests. Thus, a deficiency of oversight by governmental authorities is one of the factors contributing to the destruction of mangrove ecosystems in this region. Furthermore, the existence of multiple ethnic groups (Cameroonian, Nigerian, Ghanaian, Beninese, etc.) with disparate concerns and viewpoints complicates the application of the law and guarantees its sustainable management. Nypa palm invasions of mangrove forests have been linked to a lack of institutional and policy frameworks, climate change, traits of species and their habitats, land use and cover, and socioeconomic activities [41].
The political and institutional factors that affect the degradation of mangroves in the DENP could also be a result of the insufficiency of forest control teams and the difficulties encountered in law enforcement. The forestry law of 1994 appeared to overlook the wood-energy sector which constitutes the core aspect of forest degradation in fishing camps in the study area. It was loose on mangrove wood-energy value chain and no regulations for forest taxation in terms of mangrove wood exploitation. Applying strategies for the sustainable management of the mangrove ecosystems in Cameroon is challenging. This is because the various actors and decision-makers in the core Ministries of Fisheries and Animal Industries (MINEPIA), Forestry and Wildlife (MINFOF), Environment, Nature Protection and Sustainable Development (MINEPDED) have divergent and conflicting interests resulting in loose and insufficient institutional coordination and lack of decentralization in decision making [53]. Bissonette et al. [53] have reported that actors collect mangrove resources short of actual control which results from the absence of institutions clearly elaborated in the management of mangroves. Scientific knowledge of mangroves has gradually increased and recent actions by the Cameroon government will go a long way to support sustainable management of the existing mangrove stands. The decision to upgrade the Douala-Edea Wildlife Reserve to National Park (its first marine and terrestrial national park) puts 39 982.94ha of mangroves and 99 957.35ha of marine habitat under full protection. Law No. 2024 008 of 24 July 2024 to lay down Forestry and Wildlife regulations now includes mangroves as a category of management forest. Law No. 2024/019 of 23 December 2024 to lay down the rules and regulations governing fisheries and aquaculture in Cameroon provides for mangrove protection as spawning grounds, nurseries and refuge areas for aquatic biodiversity. Mangrove restoration efforts has also be initiated by government and championed by Non-Governmental organisations.
Implication for conservation and sustainable management of mangroves.
In the following three decades, a regression in cover was projected following the long-term dynamics of the mangroves in the study area. With the increased awareness of the ecosystem services and benefits provided by mangroves, actions for its sustainable use now imperative. In areas where mangroves are still intact, appropriate measures must be taken, and restoration/rehabilitation efforts stepped up to guarantee the restoration of degraded areas. There is a need to find strategies that will cause local communities to willingly participate in restoration projects and ensure they participate in conservation initiatives.
Another major concern that requires attention pertains to alternative sources of wood harvested from mangroves due to difficulties in harmonizing conservation efforts with the everyday need of the local population for wood. It would be challenging to eradicate illegal mangrove harvesting, which is a key contributing factor to the decrease of mangroves in the DENP if local communities are not provided with sustainable alternatives. Studies on modern ovens have demonstrated that they cut down on the amount of mangrove wood needed to smoke fish, however, the ovens are small, and the design of the ovens cause burns on the women who smoke the fish. Redesigning the ovens to take in more fish at a time and avoid sustaining fire burns may be a consideration for new mangrove restoration projects. More research is therefore required to comprehend the institutional and socioeconomic drivers behind the locals’ adherence to these conservation initiatives.
Conclusions
The Douala-Edea National Park contains mangrove forests that have declined throughout the study from 1980-1990. The mangrove forest has also experienced an increase as a result of restoration programs through NGOs, and government ministries. The mangroves are under threat from river and coastal sedimentation, human exploitation, and Nypa palm invasion. Predictions using the Markov chain approach indicated that mangroves in this area would continue to improve in the next three decades under the current protection scenario. The degradation has effect on the livelihoods of local communities, biodiversity and while displaying warning of the significant environmental consequences of its exhaustive exploitations. This study demonstrates the importance of geospatial tools for mangrove monitoring because they provide time-sensitive and spatially explicit information that researchers, decision-makers, and other relevant stakeholders can use to develop management plans to improve the various mangrove degradation stages in the Douala-Edea National Park.
Authors Contribution
Conceptualization, G.C., G.A. and M.C.; methodology, G.C., G.A. and M.C.; software, G.A. and M.C.; validation, G.C., G.A. and M. C.; formal analysis, M.C. and G.A.; investigation, M.C. and G.A.; resources, G.C., G.A. and M.C.; data curation, M.C.; writing---original draft preparation, M.C.; writing---review and editing, G.A. and G.C.; visualization, G.A. and G.C.; supervision, G.A. and G.C.; project administration, G.A.; funding acquisition, G.C., G.A. and M.C. All authors have read and agreed to the published version of the manuscript.
Data Availability Statement
The data presented in this study are available on request from the corresponding author.
Acknowledgments
The authors acknowledge with gratitude the financial, logical and material support provided by the Cameroon Wildlife Conservation Society (CWCS) and partners working under the Douala-Edea Coastal Forests, Mangrove, and Marine Programme implemented with Cameroon Ministries of Forestry & Wildlife (MINFOF) and Environment, Nature Protection and Sustainable Development (MINEPDED). We are grateful to Juscar Ndjounguep and Manual Venceslas Prossie of AJESH research team for sourcing the images and their invaluable remote sensing techniques.
Conflicts of Interest
The authors declare no conflict of interest.
References
- Giri, C.; Ochieng, E.; Tieszen, L.L.; Zhu, Z.; Singh, A.; Loveland, T.; Mašek, J.; Duke, N. Status and distribution of mangrove forests of the world using earth observation satellite data. Glob. Ecol. Biogeogr 2010, 20, 154–159. [Google Scholar] [CrossRef]
- Osorio-Olvera L.; Rioja-Nieto R.; Guerra-Martínez F. Prediction of mangrove recovery in natural protected areas of the Yucatan Peninsula. Regional Environ Change 2024, 24:38. [CrossRef]
- Ajonina, N.G. Inventory and modeling mangroves forest stand dynamics following different levels of wood exploitation pressures in the Douala-Edea Atlantic Coast of Cameroon, Central Africa. Ph.D. thesis, Albert-Ludwigs-Universitat Freiburg im Breisgau, Germany, 2008.
- Spalding, M.; Kainuma, M.; Collins, L. World Atlas of Mangroves, 2nd ed. The International Society for Mangrove Ecosystems, Okinawa, Japan 2010. 319pp.
- Ajonina, G.N; Chuyong, G.B. Vulnerability assessment of mangrove forest stands from anthropogenic wood exploitation pressures and sea level rise impacts following a re-census survey and analysis of eight-year-old permanent sample plots in the Douala-Edea Estuary, Cameroon. Report submitted to WWF Central Africa Regional Programme Office. September, 2011.
- Cayetano C.B.; Creencia L.A.; Sullivan E.; Clewely D.; Miller P.I. Multi-spatiotemporal analysis of changes in mangrove forests in Palawan, Philippines: predicting future trends using a support vector machine algorithm and the Markov chain model. UCL Open: Environment 2023, (5):04. [CrossRef]
- Ellison, J.; Jungblut, V.; Anderson, P.; Slaven, C. Manual for Mangrove Monitoring in the Pacific Islands Region. 2012, ISBN: 978-982-04-0433-5 (print), 978-982-04-0434-2 (online).
- Khan, M.N.I.; Sharma, S.; Berger, U.; Koedam, N.; Dahdouh-Guebas, F.; Hagihara, A. How do tree competition and stand dynamics lead to spatial patterns in monospecific mangroves? Biogeosci Discuss 2013, 10: 1685–1716. [CrossRef]
- Ajonina, G.N.; Kairo, J.; Grimsditch, G.; Sembres, T.; Chuyong, G.; Diyouke E. Assessment of Mangrove Carbon Stocks in Cameroon, Gabon, the Republic of Congo (RoC), and the Democratic Republic of Congo (DRC) Including their Potential for Reducing Emissions from Deforestation and Forest Degradation (REDD+). Estuar. of the World 2014. [CrossRef]
- Giri, C.; Long, J.; Abbas, S.; Murali, R.M.; Qamer, F.M.; Pengra B.; Thau D.. Distribution and dynamics of mangrove forests of South Asia. J of Environ. Management 2014, xxx:1–11. [CrossRef]
- Sunkur R.; Kantamaneni K.; Bokhoree C.; Rathnayake U.; Fernado M. Mangrove mapping and monitoring using remote sensing techniques towards climate change resilience. Scientific Reports 2024, 14(1), 6949. [CrossRef]
- Diniz C.; Cortinhas L.; Nerino G.; Rodrigues J.; Sadeck L.; Adami M.; Walfir P.; Souza-Filho M. Brazilian Mangrove Status: Three Decades of Satellite Data Analysis. Remote Sens 2019, 11:808. [CrossRef]
- United Nations Environment Programme. Decades of mangrove forest change: what does it mean for nature, people, and the climate? UNEP 2023, Nairobi.
- Spalding, M.; Blasco, F.; Field, C. World Mangrove Atlas, Version 3, Routledge: Okinawa, Japan, 1997.
- Bunting, P.; Rosenqvist, A.; Lucas, R.; Rebelo, L.M.; Hilarides, L.; Thomas, N.; Hardy, A.; Itoh, T.; Shimada, M.; Finlayson, C. The Global Mangrove Watch—A New 2010 Global Baseline of Mangrove Extent. Remote Sens 2018, 10, 1669. [Google Scholar] [CrossRef]
- Worthington, T.; Spalding, M. Mangrove Restoration Potential: Mangrove Restoration Potential. A Global Map Highlighting a Critical Opportunity; Cambridge University: Cambridge, UK, 2018. [Google Scholar] [CrossRef]
- Thomas N.; Lucas R.; Bunting P.; Hardy A.; Rosenqvist A.; Simard M. Distribution and drivers of global mangrove forest change, 1996–2010. PLoS ONE 2017, 12(6): e0179302. [CrossRef]
- Nwobi, C.; Williams, M; Mitchard, E.T. Rapid mangrove forest loss and Nypa palm (Nypa frutican) expansion in the Niger Delta, 2007–2017. Remote Sens 2020, 12: 2344. Available from:. [CrossRef]
- Tatuebu, T.C.; Sonwa, D.J.; Awono, A.; Mama, M.N.; Fongnzossie, E.; Ngala, M.R.; Essamba, à R.L.F.; Ntja, R.D. Land Cover and Land Use Changes between 1986 and 2018, and Preliminary Carbon Footprint Implications for Manoka Island (Littoral Region of Cameroon). Sustainability 2022, 14, 6301. [CrossRef]
- MINEPDED-RCM. Les Mangroves du Cameroun: État de Lieux et Gestion; MINEPDED-RCM: Cameroun, 2017; 191p. [Google Scholar]
- Ajonina, G.N.; Mumbang, C.; Oum, J.T.N.; Dogmo, F.M.; Eyango, M.T.; Tchoumbougnang, F. Comparing Smoked Fish Quality of Traditional and Improved Modern Ovens Using Dendro-Energy from Mangrove and Tropical Forest Woods and Implications for Conservation in Central African Atlantic Coast, Cameroon. Energy and Earth Sci 2023, 6, No. 1. [CrossRef]
- Bunting, P.; Rosenqvist, A.; Hilarides, L.; Lucas, R.M.; Thomas, N.; Tadono, T.; Worthington, T.A.; Spalding, M.; Murray, N.J.; Rebelo, L.-M. Global Mangrove Extent Change 1996–2020: Global Mangrove Watch Version 3.0. Remote Sens 2022, 14, 3657. [Google Scholar] [CrossRef]
- Foahom, B. Biodiversity Planning Support Programme Integrating Biodiversity into the Forestry Sector: Cameroon Case Study. International workshop on "Integration of Biodiversity in National Forestry Planning Programme" held in CIFOR Headquarters, Bogor, Indonesia, 2001.
- Yengoh, G.T.; Hickler, T.; Tchuinte, A. Agro-climatic resources and challenges to food production in Cameroon. Geocarto International 2011, 26(4), 251–273. [Google Scholar] [CrossRef]
- Feka, N.Z.; Chuyong, G.B.; Ajonina, G.N. Sustainable utilization of mangroves using improved fish smoking systems: a management perspective from the Douala-Edea wildlife reserve, Cameroon. Tropical Conservation Sci 2009, 2(4), 450–468. [Google Scholar] [CrossRef]
- Moudingo, J.E.; Ajonina, G. N.; Diyouke, E.M. Mangrove Social and Ecological Resilience Geared in the Cameroon Estuary. Pyrex J. of Eco and the Natural Environment 2015, 1(4), 037–044. [Google Scholar]
- Ticheler, H. Fish Biodiversity in West African Wetlands. Wetlands International, Wageningen, The Netherlands 2000, 78p.
- CWCS. Activity Report 2000/Rapport d’activites 2000. Cameroon Wildlife Conservation Society (Mouanko, Cameroon) December 2001, 43pp.
- Ajonina, G.N.; Usongo, L. Preliminary Quantitative impact assessment of wood extraction on the mangroves of Douala-Edea Forest Reserve Cameroon. Tropical Biodivers 2001, 7(2), 137–149. [Google Scholar]
- Congalton, R.G. A review of assessing the accuracy of classifications of remotely sensed data. Remote Sens. Environ 1991, 37(1), 35–46. [Google Scholar] [CrossRef]
- Trotter, C.M. Characterizing the topographic effect at red wavelengths using juvenile conifer canopies. International J Remote Sens 1998, 19(11), 2215–2221. [Google Scholar] [CrossRef]
- Campbell, J.B.; Randolph, H.W. Introduction to Remote Sensing. Fifth Edition. The Guilford Press, New York, USA, 2011; pp. 335-516.
- Ahmad, F.; Goparaju, L.; Qayum, A. LULC analysis of urban spaces using Markov chain predictive model at Ranchi in India. Spat. Inf. Res 2017. [Google Scholar] [CrossRef]
- Disperati, L.; Pasquale S., G. Assessment of land-use and land-cover changes from 1965 to 2014 in Tam Giang-Cau Hai Lagoon, central Vietnam. Applied Geography 2015, 58, 48–64. [Google Scholar] [CrossRef]
- Mishra, P. K.; Rai, A.; Rai, S.C. Land use and land cover change detection using geospatial techniques in the Sikkim Himalaya, India. The Egyptian J of Remote Sens and Space Sci 2019, S1110982318302035. [Google Scholar] [CrossRef]
- Kashaigili, J. J.; Boniface P.M.; Matthew M.; Fredrick L.M. Dynamics of Usangu plains wetlands: Use of remote sensing and GIS as management decision tools. Physics and Chemistry of the Earth 31, 2006, 967–975. [CrossRef]
- Zanvo, M.G.S.; Barima, Y.S.S.; Salako, K.V.; Koua, K.A.N.; Kolawole, M.A.; Assogbadjo, A. E.; Glèlè, K.R. Mapping spatio-temporal changes in mangroves cover and projection in 2050 of their future state in Benin. Bois et Forêts des Tropiques 2021, 350, 29-42. [CrossRef]
- Barenblitt, A.; Fatoyinbo, L.; Thomas, N.; Stovall, A.; Sousa, C.; Nwobi, C.; Duncanson, L. Invasion in the Niger Delta: remote sensing of mangrove conversion to invasive Nypa frutican from 2015 to 2020. Remote Sens in Eco and Conservation 2023, 1–19. [Google Scholar] [CrossRef]
- Feka, N.Z.; Ajonina, G.N. Drivers causing decline of mangrove in west-Central Africa: a review. International J of Biodivers Sci, Eco Serv and Management 2011, 7, 217–230. [CrossRef]
- Moudingo, J.H; Ajonina, G.; Dibong, D.; Tomedi, M. Introduction, Distribution and Drivers of Non-native Mangrove Palm Nypa fruticans Van Wurmb (Arecaceae) in Cameroon, Gulf of Guinea. Advances in Eco and Environ Research 2019, 1–13. [Google Scholar]
- Numbere, A.O. Impact of Invasive Nypa Palm (Nypa fruticans) on Mangroves in Coastal Areas of the Niger Delta Region, Nigeria. 2019, Chapter 13, pp. 425-453.
- Findi, E.N.; Wantim, M.N. Using Remote Sensing and GIS to Evaluate Mangrove Forest Dynamics in Douala-Edea Reserve, Cameroon. Journal of Materials and Environmental Science 2022, 13(3), 222–235. [Google Scholar]
- Sardar, P.; Samadder, S.R. Understanding the dynamics of landscape of greater Sundarban area using multi-layer perceptron Markov chain and landscape statistics approach. Ecological Indicators 2021, 121, 106914. [Google Scholar] [CrossRef]
- De Jong, S.M.; Shen, Y.; De Vries, J.; Bijnaar, G.; Van, M.B.; Augustinus, P.; Verweij, P. Mapping mangrove dynamics and colonization patterns at the Suriname coast using historic satellite data and the LandTrendr algorithm. International J of Appl Earth Observation and Geoinfor 2021, 97, 102293. [Google Scholar] [CrossRef]
- Chen C.F.; Nguyen-Thanh S.; Chang N.B.; Chen R.C.; Chang L.Y.; Valdez M.; Centeno G.; Thompson C.A.; and Aceituno J.L. Multi-Decadal Mangrove Forest Change Detection and Prediction in Honduras, Central America, with Landsat Imagery and a Markov Chain Model. Remote Sens 2013, 5: 6408-6426. [CrossRef]
- Cameroon Mangrove Conservation Network (CMN). Informing and educating the Cameroonian public on mangrove conservation issues. Matanda News, 2007, Vol 1 No1.
- Global Mangrove Watch (GMW). Integrating Mangrove Ecosystems into NDCs with the Global Mangrove Watch. globalmangrovewatch.org, Updated version, 2024.
- Leal, M.; Spalding, M.D (editors). The State of the World’s Mangroves 2024. Global Mangrove Alliance, 2024. 71 pp. [CrossRef]
- Al-huqail, A.A.; Islam, Z.; Al-Harbi, H.F. Mangroves trend and their impact on surface temperature in Al-Wajh Lagoon: a study aligned with Saudi Arabia’s vision 2030. Fronts in Environ Sci 2024, 12:1439425. [CrossRef]
- Syafina, H.A.; Hartoko, A.; Max, R.M.; Febrianto, S. Assessing mangrove cover shifts in Segara Anakan, Cilacap through Land Use Land Cover based on multitemporal satellite images. AACL Bioflux 2024, 17(2), 798 - 810.
- Saoum, M.R.; Sarkar, S.K. Monitoring mangrove forest change and its impacts on the environment. Ecol Indicators, 2024, 159, 111666. [CrossRef]
- Munji, C.A.; Bele, M.Y.; Idinoba, M.E.; Sonwa, D.J. Floods and mangrove forests, friends or foes? Perceptions of relationships and risks in Cameroon coastal mangroves. Estuar. Coast. Shelf Sci. 2014, 140, 67–75. [Google Scholar] [CrossRef]
- Bissonnette, J.-F.; Dossa, K.F.; Nsangou, C.A.; Satchie, Y.A.; Moussa, H.; Miassi, Y.E.; Gravel, N.; Marie, G.; Onguene, R. What Occurs within the Mangrove Ecosystems of the Douala Region in Cameroon? Exploring the Challenging Governance of Readily Available Woody Resources in the Wouri Estuary. Environments 2024, 11, 121. [Google Scholar] [CrossRef]
Figure 1.
Location of the Douala–Edea National Park (Produced by Cameroon Wildlife Conservation Society, 2018).
Figure 1.
Location of the Douala–Edea National Park (Produced by Cameroon Wildlife Conservation Society, 2018).

Figure 2.
Colour composite of the study site: (a) Natural False colour, (b) False colour.
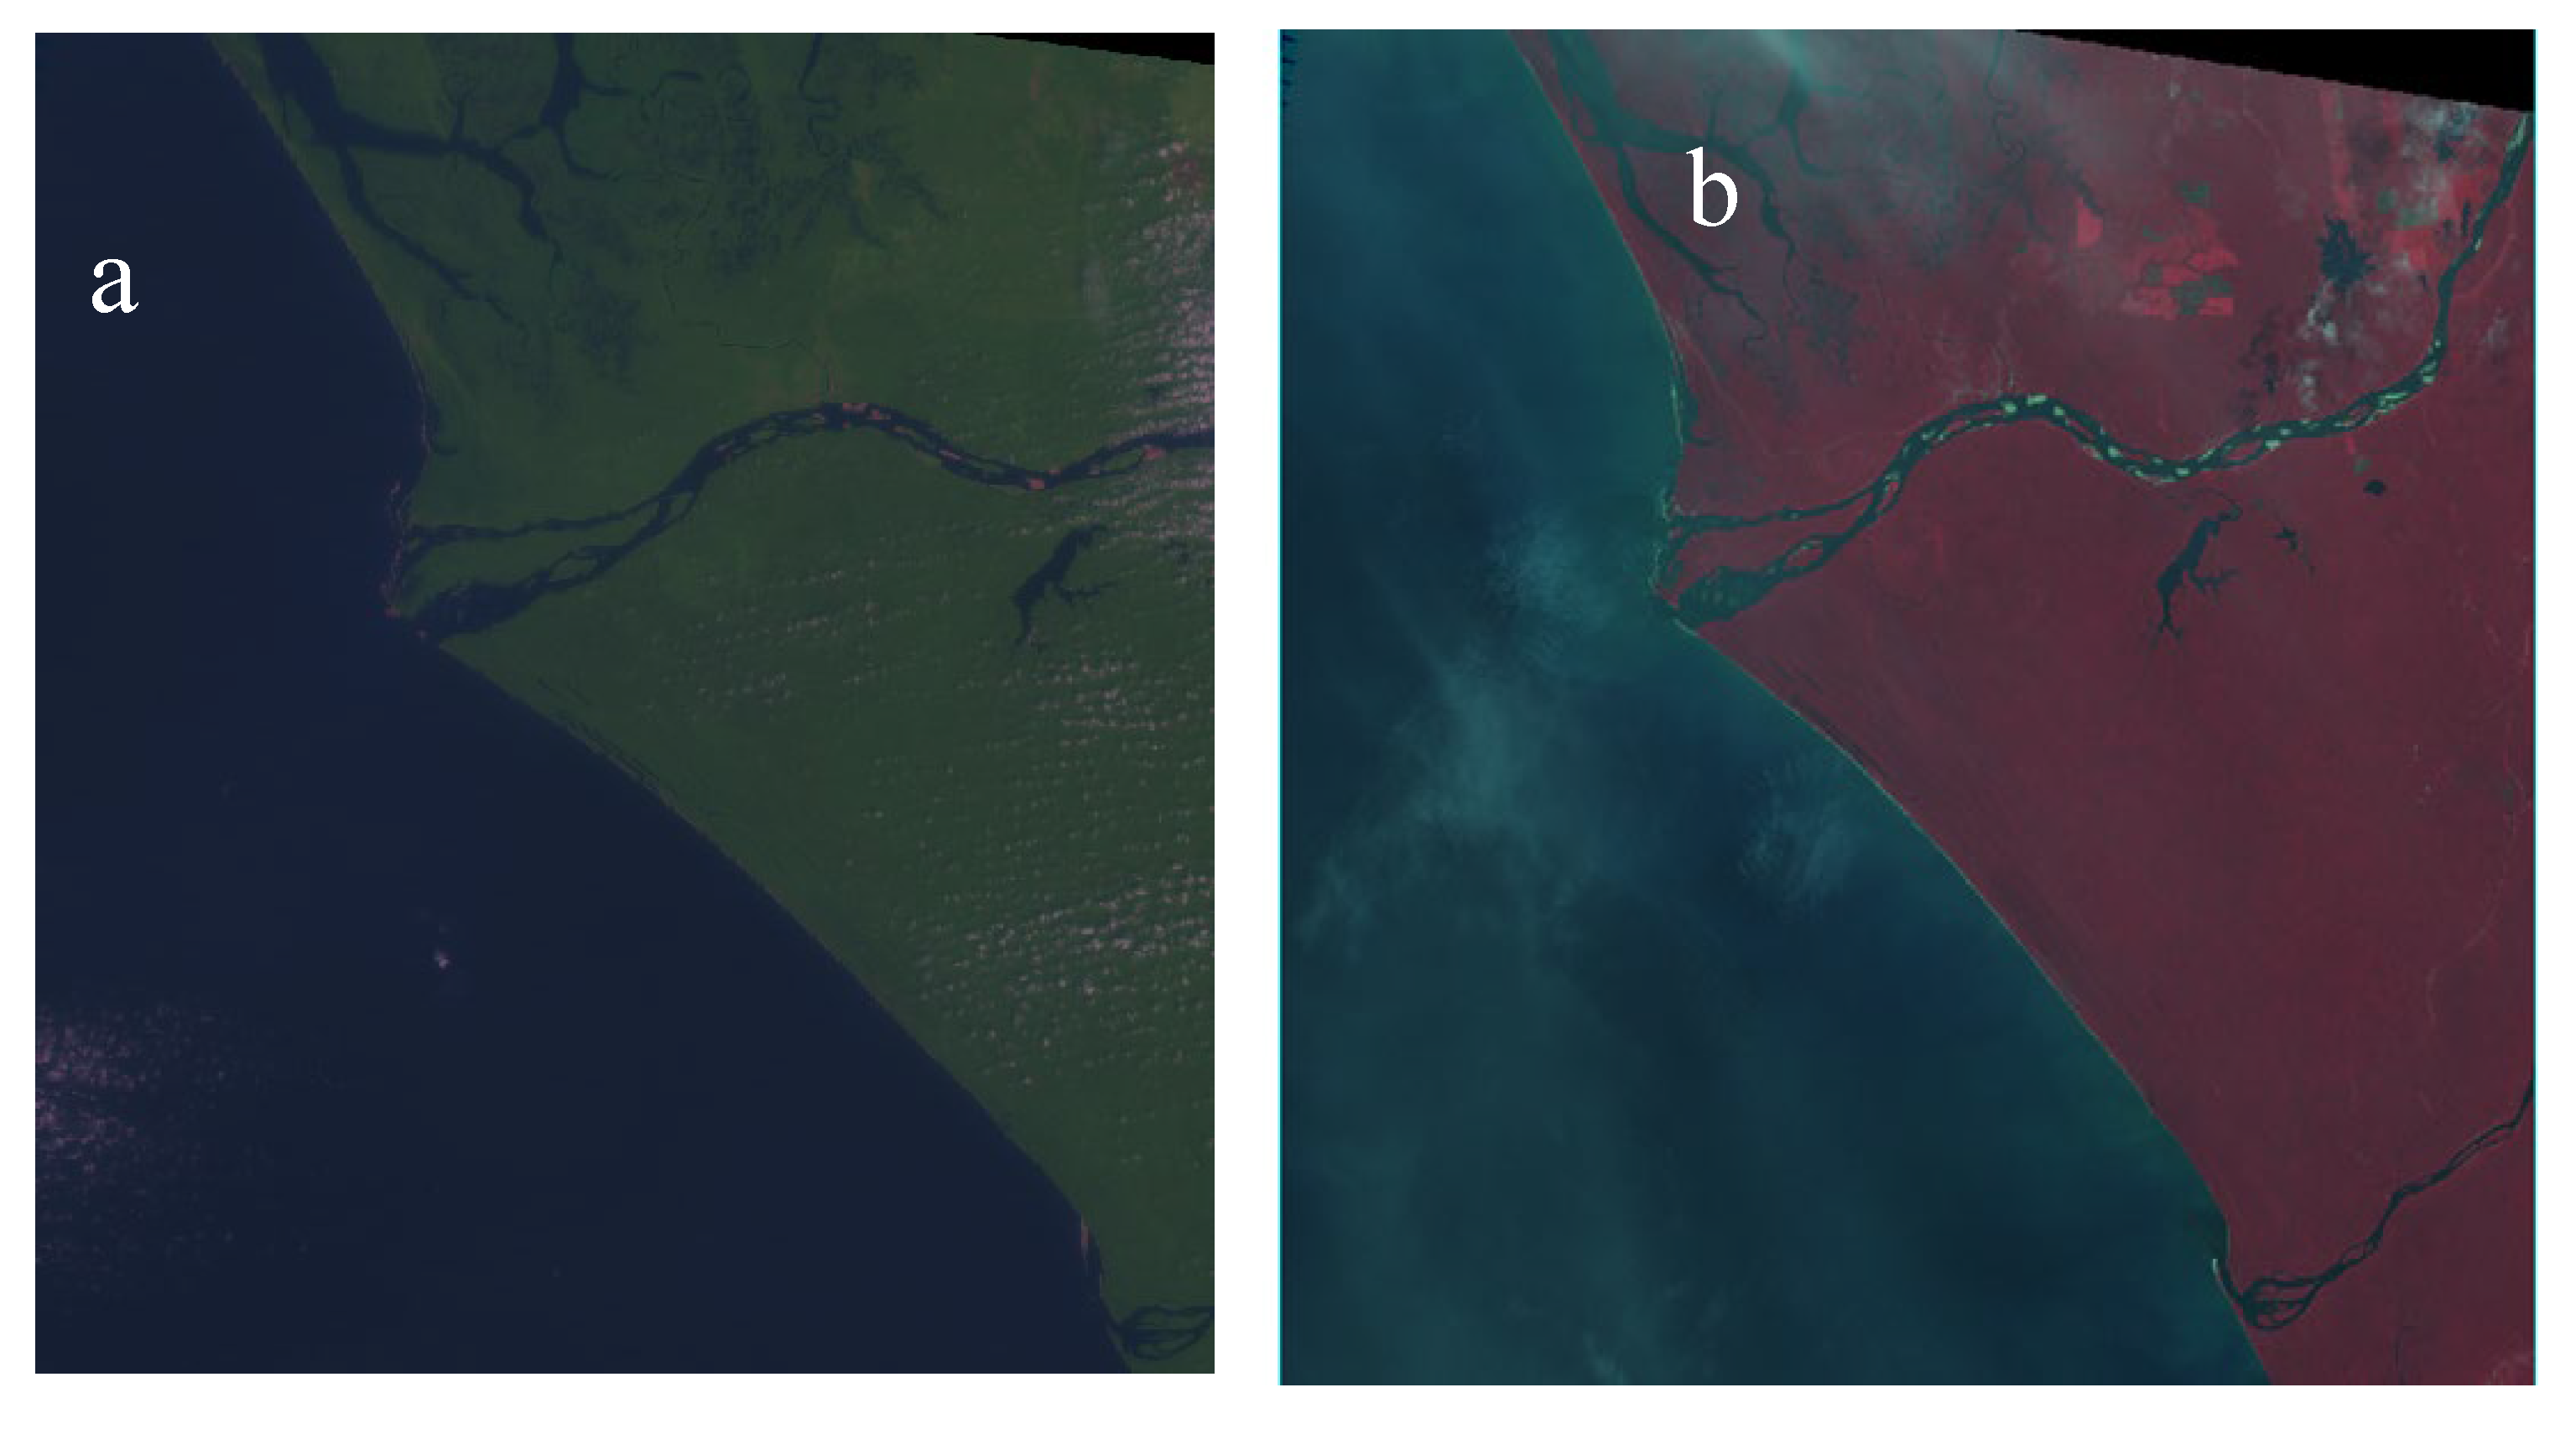

Table 1.
Characteristics of the image used for time series analysis.
| Image date | Image type | Resolution | Image name |
|---|---|---|---|
| 1980 | Landsat 1 | 30m | LM01_L1TP_200058_19800201_20200909_02_T2 |
| 1990 | Landsat 5 | 30m | LM05_L1TP_186057_19901221_20200830_02_T2 |
| 2000 | Landsat 7 | 30m | LE07_186058_20000426_20299917_02_T1 |
| 2010 | Landsat 7 | 30m | LE07_L1TP_186058_20100426_20200917_02_T1 |
| 2022 | Landsat 8 | 30m | LC08_L1TP_186057_20221221_20211229_01_T1 |
Table 2.
Area assessment of land cover categories with time and surface area occupied.
| Classes | 1980 | 1990 | 2000 | 2010 | 2022 | |||||
|---|---|---|---|---|---|---|---|---|---|---|
| Size (ha) | % | Size (ha) | % | Size (ha) | % | Size (ha) | % | Size (ha) | % | |
| Bare ground | 1562.93 | 0.54 | 3702.7 | 1.36 | 2645.91 | 0.95 | 6016.12 | 2.21 | 3934.7 | 1.41 |
| Nypa palmed | 3014.1 | 1.04 | 4877.02 | 1.79 | 5123.64 | 1.84 | 5119.4 | 1.88 | 5435.5 | 1.95 |
| Settlement | 3633.93 | 1.25 | 5874.57 | 2.15 | 14018.47 | 5.05 | 4146.1 | 1.53 | 3270.25 | 1.17 |
| Coastal sedimentation | 1032.66 | 0.36 | 7501.81 | 2.75 | 483.59 | 0.17 | 499.38 | 0.18 | 542.36 | 0.19 |
| River sedimentation | 5427.1 | 1.87 | 8519.16 | 3.12 | 1437.72 | 0.52 | 2814.95 | 1.04 | 18837.27 | 6.76 |
| Regeneration | 1417.87 | 0.49 | 6397.35 | 2.34 | 1600.27 | 0.58 | 12631.84 | 4.65 | 20432.84 | 7.33 |
| Mature mangrove | 80628.78 | 27.83 | 56005.26 | 20.52 | 52809.52 | 19.01 | 41598.83 | 15.31 | 28555.16 | 10.24 |
| Dense forest | 79731.84 | 27.52 | 75927 | 27.81 | 96432.38 | 34.71 | 92590.18 | 34.07 | 91186.22 | 32.71 |
| Waterbody | 113298.2 | 39.10 | 104190.9 | 38.17 | 103263.7 | 37.17 | 106354.7 | 39.13 | 106614.8 | 38.24 |
| Total | 289747.4 | 100 | 272995.7 | 100 | 277815.2 | 100 | 271771.5 | 100 | 278809.1 | 100 |
Table 3.
Transition matrix of mangroves in the Douala-Edea National Park between 1980 – 2022 (hectares).
Table 3.
Transition matrix of mangroves in the Douala-Edea National Park between 1980 – 2022 (hectares).
| 1980 - 1990 Matrix | |||||||||
|---|---|---|---|---|---|---|---|---|---|
| Class | Bare ground | Nypa palmed | Settlement | Coastal sedimentation | River sedimentation | Regeneration | Mature mangrove | Dense forest | Waterbody |
| Bare ground | 10.53 | 8.64 | 7.17 | 12.8 | 12.25 | 25.71 | 4.81 | 10.01 | 0.53 |
| Nypa palmed | 2.43 | 2.85 | 1.58 | 1.6 | 1.64 | 1.15 | 2.37 | 3.06 | 0.08 |
| Settlement | 3.93 | 4.14 | 4.64 | 6.28 | 6.97 | 1.99 | 3.70 | 1.89 | 2.92 |
| Coastal sedimentation | 1.61 | 1.39 | 2.80 | 1.23 | 1.73 | 1.67 | 0.61 | 0.68 | 0.97 |
| River sedimentation | 0.45 | 0.83 | 1.18 | 0.42 | 0.26 | 5.06 | 0.55 | 1.42 | 0.15 |
| Regeneration | 0.65 | 0.54 | 0.46 | 0.67 | 0.62 | 0.00 | 0.55 | 0.63 | 0.01 |
| Mature mangrove | 9.74 | 15.67 | 15.32 | 5.48 | 5.5 | 5.58 | 31.09 | 13.66 | 5.83 |
| Dense forest | 31.85 | 40.32 | 33.21 | 27.77 | 27.9 | 31.92 | 43.42 | 53.51 | 5.44 |
| Waterbody | 37.99 | 24.46 | 33.35 | 42.06 | 42.87 | 26.73 | 11.97 | 14.10 | 84.06 |
| Eigenvalues | 86.147 | 18.968 | 6.28788 | 5.275392 | 3.270026 | -0.12715 | -2.983 | -6.455 | -67.34 |
| Overall Accuracy = 99.28 %; Kappa Coefficient = 0.99 | |||||||||
| 1990-2000 Matrix | |||||||||
| Class | Bare ground | Nypa palmed | Settlement | Coastal sedimentation | River sedimentation | Regeneration | Mature mangrove | Dense forest | Waterbody |
| Bare ground | 8.87 | 5.68 | 6.18 | 3.41 | 0.91 | 11.12 | 2.50 | 1.28 | 0.28 |
| Nypa palmed | 2.73 | 12.22 | 4.38 | 8.09 | 3.63 | 3.44 | 14.87 | 1.64 | 0.78 |
| Settlement | 4.16 | 5.61 | 5.57 | 12.02 | 13.17 | 6.03 | 8.51 | 1.78 | 1.86 |
| Coastal sedimentation | 1.71 | 2.37 | 0.92 | 0.26 | 0.05 | 1.42 | 1.11 | 0.29 | 0.19 |
| River sedimentation | 5.01 | 4.82 | 2.37 | 2.05 | 0.96 | 4.14 | 1.74 | 0.61 | 0.22 |
| Regeneration | 19.91 | 1.06 | 4.48 | 1.36 | 1.81 | 5.64 | 0.80 | 1.11 | 0.03 |
| Mature mangrove forest | 5.71 | 14.01 | 9.61 | 9.45 | 12.75 | 5.01 | 22.66 | 37.18 | 1.2 |
| Dense forest | 47.42 | 31.07 | 54.05 | 49.83 | 64.59 | 61.63 | 23.77 | 54.69 | 1.29 |
| Waterbody | 4.48 | 23.17 | 12.43 | 13.53 | 2.13 | 1.56 | 24.04 | 1.41 | 94.14 |
| Eigenvalue | 48.074 | 9.7198 | 8.267054 | 2.913851 | -1.5569 | -3.61043 | -5.06613 | -8.704 | -10.04 |
| Overall Accuracy = 99.88 %; Kappa Coefficient = 0.99 | |||||||||
| 2000-2010 Confusion Matrix | |||||||||
| Class | Bare ground | Nypa palmed | Settlement | Coastal sedimentation | River sedimentation | Regeneration | Mature mangrove | Dense forest | Waterbody |
| Bare ground | 10.66 | 1.90 | 11.07 | 7.52 | 14.39 | 21.96 | 1.06 | 2.02 | 0.02 |
| Nypa palmed | 1.44 | 28.96 | 1.16 | 1.77 | 1.49 | 2.36 | 29.37 | 9.75 | 3.48 |
| Settlement | 1.18 | 0.66 | 2.58 | 0.92 | 1.67 | 1.77 | 0.41 | 0.26 | 0.02 |
| Coastal sedimentation | 0.13 | 0.37 | 0.22 | 0.74 | 0.49 | 0.05 | 0.15 | 0.06 | 0.01 |
| River sedimentation | 0.12 | 0.25 | 0.05 | 0.39 | 0.25 | 0.02 | 0.06 | 0.03 | 0.01 |
| Regeneration | 1.04 | 0.05 | 2.17 | 1.11 | 3.95 | 2.38 | 0.03 | 0.10 | 0.00 |
| Mature mangrove | 2.88 | 21.33 | 3.04 | 3.92 | 3.66 | 2.02 | 18.98 | 6.78 | 2.99 |
| Dense forest | 68.91 | 16.38 | 76.64 | 27.74 | 65.30 | 67.75 | 28.36 | 76.68 | 0.36 |
| Waterbody | 13.64 | 30.1 | 3.09 | 55.89 | 8.81 | 1.70 | 21.58 | 4.32 | 93.11 |
| Eigenvalue | 51.123 | 7.9746 | 6.003135 | 1.545931 | 0.989714 | -2.18137 | -4.24709 | -7.855 | -14.35 |
| Overall Accuracy = 99.54 %; Kappa Coefficient = 0.99 | |||||||||
| 2010-2022 Confusion Matrix | |||||||||
| Class | Bare ground | Nypa palmed | Settlement | Coastal sedimentation | River sedimentation | Regeneration | Mature mangrove | Dense forest | Waterbody |
| Bare ground | 1.01 | 2.16 | 1.49 | 0.43 | 1.08 | 2.74 | 2.80 | 3.03 | 1.06 |
| Nypa palmed | 4.35 | 4.17 | 4.99 | 0.00 | 5.75 | 4.65 | 3.20 | 1.99 | 1.26 |
| Settlement | 1.32 | 1.84 | 0.85 | 1.73 | 0.54 | 2.29 | 2.92 | 2.98 | 0.47 |
| Coastal sedimentation | 0.47 | 0.22 | 0.11 | 0.00 | 0.05 | 0.33 | 0.32 | 0.31 | 0.74 |
| River sedimentation | 4.02 | 1.11 | 0.42 | 3.03 | 0.18 | 2.21 | 2.64 | 2.35 | 0.58 |
| Regeneration | 1.93 | 7.45 | 6.63 | 2.60 | 6.34 | 12.40 | 7.33 | 9.86 | 2.54 |
| Mature mangrove | 7.08 | 6.98 | 7.87 | 0.00 | 8.75 | 6.98 | 6.25 | 4.28 | 2.28 |
| Dense forest | 19.85 | 38.19 | 40.41 | 15.58 | 33.63 | 50.27 | 31.81 | 44.16 | 5.69 |
| Waterbody | 59.97 | 37.89 | 37.23 | 76.62 | 43.69 | 18.12 | 42.74 | 31.04 | 85.38 |
| Eigenvalue | 50.194 | 12.182 | 5.623 | 3.435 | 0.999 | -1.662 | -4.439 | -8.826 | -10.51 |
| Overall Accuracy = 99.75 %; Kappa Coefficient = 0.99 | |||||||||
| 1980-2022 Confusion Matrix | |||||||||
| Class | Bare ground | Nypa palmed | Settlement | Coastal sedimentation | River sedimentation | Regeneration | Mature mangrove | Dense forest | Waterbody |
| Bare ground | 8.47 | 4.51 | 4.23 | 0.00 | 5.59 | 4.89 | 4.91 | 4.01 | 1.61 |
| Nypa palmed | 1.35 | 2.09 | 1.36 | 0.00 | 1.40 | 1.53 | 2.13 | 1.98 | 0.33 |
| Settlement | 4.46 | 3.33 | 2.98 | 0.00 | 3.93 | 2.65 | 3.40 | 2.82 | 2.70 |
| Coastal sedimentation | 1.55 | 0.88 | 0.69 | 0.00 | 0.89 | 0.30 | 0.61 | 0.38 | 1.52 |
| River sedimentation | 0.62 | 0.60 | 0.51 | 0.00 | 0.98 | 0.48 | 0.33 | 0.57 | 0.36 |
| Regeneration | 0.32 | 0.47 | 0.31 | 0.00 | 0.26 | 0.27 | 0.50 | 0.37 | 0.11 |
| Mature mangrove | 10.64 | 14.51 | 19.84 | 9.38 | 16.01 | 21.59 | 12.51 | 22.70 | 1.75 |
| Dense forest | 23.71 | 31.53 | 36.27 | 0.00 | 33.77 | 37.88 | 30.60 | 25.37 | 4.06 |
| Waterbody | 48.53 | 41.36 | 33.32 | 90.63 | 36.66 | 29.60 | 44.41 | 40.92 | 87.51 |
| Eigenvalue | 47.225 | 7.554 | 4.181 | 1.372 | -0.142 | -2.107 | -3.655 | -7.189 | -10.239 |
| Overall Accuracy = 95.45 %; Kappa Coefficient = 0.95 | |||||||||
Table 4.
Changes in the land cover of mangroves within periods of 10 years, 12 years, and 42 years.
| Classes | 1980 – 1990 | 1990 - 2000 | 2000 - 2010 | 2010-2022 | 1980 - 2022 | |||||
|---|---|---|---|---|---|---|---|---|---|---|
| Size (ha) | % | Size (ha) | % | Size (ha) | % | Size (ha) | % | Size (ha) | % | |
| Bare ground | 2139.77 | 0.82 | -1056.79 | -0.40 | 3370.21 | 1.26 | -2081.42 | -0.80 | 2371.77 | 0.87 |
| Nypa palmed | 1862.92 | 0.75 | 246.62 | 0.06 | -4.24 | 0.04 | 316.1 | 0.07 | 2421.4 | 0.91 |
| Settlement | 2240.64 | 0.90 | 8143.9 | 2.89 | -9872.37 | -3.52 | -875.85 | -0.35 | -363.68 | -0.08 |
| Coastal sedimentation | 6469.15 | 2.39 | -7018.22 | -2.57 | 15.79 | 0.01 | 42.98 | 0.01 | -490.3 | -0.16 |
| River sedimentation | 3092.06 | 1.25 | -7081.44 | -2.60 | 1377.23 | 0.52 | 16022.32 | 5.72 | 13410.17 | 4.88 |
| Regeneration | 4979.48 | 1.85 | -4797.08 | -1.77 | 11031.57 | 4.07 | 7801 | 2.68 | 19014.97 | 6.84 |
| Mature mangrove | -24623.5 | -7.31 | -3195.74 | -1.51 | -11210.7 | -3.70 | -13043.7 | -5.06 | -52073.6 | -17.59 |
| Dense forest | -3804.84 | 0.29 | 20505.38 | 6.90 | -3842.2 | -0.64 | -1403.96 | -1.36 | 11454.38 | 5.19 |
| Waterbody | -9107.37 | -0.94 | -927.17 | -1.00 | 3091.04 | 1.96 | 260.09 | -0.89 | -6683.41 | -0.86 |
Disclaimer/Publisher’s Note: The statements, opinions and data contained in all publications are solely those of the individual author(s) and contributor(s) and not of MDPI and/or the editor(s). MDPI and/or the editor(s) disclaim responsibility for any injury to people or property resulting from any ideas, methods, instructions or products referred to in the content. |
© 2025 by the authors. Licensee MDPI, Basel, Switzerland. This article is an open access article distributed under the terms and conditions of the Creative Commons Attribution (CC BY) license (http://creativecommons.org/licenses/by/4.0/).
Copyright: This open access article is published under a Creative Commons CC BY 4.0 license, which permit the free download, distribution, and reuse, provided that the author and preprint are cited in any reuse.


