
Submitted:
25 January 2025
Posted:
27 January 2025
You are already at the latest version
Abstract
In an enzyme-based fuel cell system, glucose oxidase and laccase were immobilized on carbon papers as the anode and cathode electrodes. A conductive polymer (polypyrrole) was added to improve conductivity. The mediator and enzyme were mixed in a phosphate buffer solution for entrapment. A Nafion 212 membrane separated the two half-cells. Power density measurements were taken at a glucose concentration of 10 mM across different operating voltages. Potassium hexacyanoferrate III was used as a redox mediator in the anode, and 2,2'-azino-bis (3-ethylbenzothiazoline-6-sulfonic acid) in the cathode to boost power output. The biofuel cell, constructed from acrylic (40 mm × 50 mm × 50 mm) with a working volume of 20 mm × 30 mm × 40 mm, was assembled using a rubber gasket to secure the Nafion membrane. Micropore tape covering the electrodes extended the system's operational lifespan. Without micropore tape, the maximum power density was 57.6 μW/cm² at 0.24 V. With micropore tape, the cell achieved a maximum power density of 324.9 μW/cm² at 0.57 V, sustaining performance for 20 day. Thus, micropore tape effectively enhances enzyme retention and biofuel cell performance.
Keywords:
Enzyme-based fuel cells
; glucose oxidase
; laccase
; conductive polymer
; cell design
1. Introduction
Since the nineteenth-century industrial revolution, continuous industrial advancements have made energy a vital element of development and progress [1]. Energy issues remain critical today, underscoring their essential role in daily life and technological advancement as drivers of human civilization. The invention of the steam engine in the nineteenth century ignited the Industrial Revolution, while the rise of information technology fueled the second Industrial Revolution in the twentieth century. In the twenty-first century, biotechnology is anticipated to profoundly shape human civilization (Biotechnology Industry White Paper, 2012) [2].
Biotechnology and nanotechnology are considered the leading industries of the new century. Humans have been using biotechnology for thousands of years, with techniques such as pickling, brewing, and baking being early examples [3]. Biotechnology uses biological procedures, cells, bio-fermentation, and biological metabolites to manufacture products, improve traditional production processes, and enhance human life science and technology [4,5]. Biotechnology is an interdisciplinary science with applications in life sciences, medicine, agriculture, marine studies, energy, environmental protection, and chemistry. It is expected to drive a new wave of technological revolution, following petrochemical, aviation, nuclear, and information technology breakthroughs. Advanced countries prioritize biotechnology development, positioning it as one of the most promising industries of the 21st century [6]. Biotechnology research is in the ascendant, and the development of the biotechnology industry has just started. The future of medicine, health care, agriculture, environmental protection, specialization, food, and other fields will be significantly impacted. Many countries will see the biotechnology industry as the future of the emerging industries' most potential strongly promoted [7].
The increasing global demand for sustainable energy sources has driven significant interest in biofuel cells as a promising alternative for clean energy generation. Enzyme-based biofuel cells, in particular, offer a unique approach due to their use of biological catalysts for energy conversion, making them both eco-friendly and efficient [8]. However, optimizing their design for long-term stability, higher power output, and reduced enzyme degradation remains a critical challenge. This study aims to explore innovative electrode designs and material combinations to address these limitations and enhance the performance and operational lifespan of biofuel cells for potential real-world energy applications [9]. This type of biofuel cell is similar to microbial fuel cells but differs significantly. Due to the high specificity of various enzymes, different fuels can be selected for diverse applications. In 2001, a self-powering glucose sensor using glucose as fuel was developed to monitor diabetes mellitus and blood glucose levels in the body [10]. The use of enzymes in the system so that the overall chemical reaction is relatively simple to avoid the use of intact microorganisms produced by various complex biochemical reactions is the primary reaction caused by interference and other unpredictable situations [11]. However, enzymes are difficult to obtain and expensive. Adding enzymes to the system, such as glucose oxidase at the anode and laccase at the cathode, introduces competition and complexity. Enzyme activity varies with environmental factors like temperature and pH, further complicating system design. Additionally, electron and proton transfer must be carefully considered. Electron transfer involves moving the biological catalyst to the electron transfer solution through the metabolic pathway. The number of electrons released by the biological catalyst and captured by the electron transport medium directly influences the current magnitude [12]. Only a few references have been made to improve the use of electrodes to improve the current.
This study investigated enzyme-based biofuel cells, optimizing electrode design, enzyme immobilization, buffer selection, and conductive polymers to enhance power output, stability, and operational lifespan. In this study, glucose oxidase (GOx), conductive polymer, and dielectric were immobilized on the electrode surface at the anode end [13]. The cathode end was immobilized on the laccase and conductive polymer. It is necessary to design the enzyme fuel cell with the best output voltage (V), the power density is high, and the output time is prolonged [14]. To optimize the battery's overall efficiency, it is necessary to make the electrode with high conductivity, surface area, porosity, and biocompatibility [15]. This study uses a microtape type to entrap the enzyme, immobilize the enzyme in the electrode, and keep the enzyme activity similar to that of the free enzyme. It will increase the power density and can be run long, not to reduce the activity.
2. Results and Discussions
2.1. Cyclic Voltammetry Analysis of Electrode
Cyclic voltammetry (CV) is a powerful electrochemical technique that studies an electrode's redox reaction mechanisms (oxidation and reduction). It involves sweeping the electrode potential from a lower to a higher voltage and back, allowing the system to reach equilibrium. During this process, the electrode's potential and the resulting current are measured, providing valuable insights into the tested system's electrochemical behavior, reaction kinetics, and diffusion properties. [16,17].
The copper-type (CP) electrode, as prepared in Section 3.3, was tested to evaluate the performance of conductive polymers, specifically polypyrrole (PPy) and polyaniline (PANI), mixed with phosphate buffer solutions (PBS) of varying pH levels using CV. The electrode was immersed in a 10 mM glucose buffer solution (pH 7) at 0 h and 1 h, with a scanning rate of 0.01 V/s. CV test results showed that while the electrochemical and reduction potentials remained nearly identical across different pH values of PBS, the polarization peaks varied. For the six tested electrodes showing quasi-reversible reactions in Table 1, the oxidation potential of the PPy conductive polymer ranged from -0.58 V to -0.55 V (vs. Ag/AgCl). The polarization peaks were observed at 7.8%, 6%, and 15.2%, respectively. The polarization effect for PPy was notably higher than that for PANI, particularly in slightly acidic conditions.
Additionally, the polarization potential of the PPy electrode was higher than that of the PANI electrode (Figure 1), suggesting that PPy exhibits more excellent electrochemical oxidation activity toward glucose and better hydrogen evolution performance compared to PANI. The prepared CP electrode was immersed in a glucose buffer solution (10 mM glucose, pH 7) for 1 h and then tested using CV under the conditions previously described. Comparing the CV results before and after the 1 h immersion showed an increase in the electrode's polarization peak and a shift in the polarization curve (Figure 1). This suggests that after immersion, the electrode exhibited an upward trend in glucose oxidative activity and improved hydrogen evolution performance.
CV test results in Figure 2 indicated that differences in conductive polymers affected the electrochemical performance of the prepared buffer solution with the same pH value. Higher electroconductivity and reduction potential were observed with increased conductive polymer content, leading to a higher electrode position current. Overall, the polarization area of the PPy electrode was more extensive than that of the PANI electrode, as shown in Figure 2. This suggests that the PPy electrode exhibits more significant glucose oxidation activity and enhanced hydrogen evolution performance than the PANI electrode.
The CV test results in Figure 3 showed that the integrated areas of the anodic oxidation and cathodic reduction polarization curves were nearly equal for electrodes A1 to A9, indicating quasi-reversible reactions. The anode compositions of A1 to A9 are listed in Table 7 in Section 3.3. The primary differences among the electrodes were their electro-oxidation activity toward glucose and the extent of hydrogen evolution. Based on Figure 3, the electro-oxidation activity was ranked as A3 > A6 > A2 > A9 > A5 > A8 > A4 > A1 > A7.
Calculation of diffusion coefficient (D₀) for reversible reactions using the Randles-Sevcik Equation
 where A is electrode surface area(cm²), D₀ is the diffusion coefficient(cm²/s), C₀ is the initial concentration of the reactant(mol/cm³), ν is the scan rate(V/s), and n is the number of charge transfers. The constant values in this study are A = 1, C0 = 0.1,υ = 0.01, and n = 2.
Additionally, the standard potential (E0) of the glucose oxidase electrode can be determined from the difference between the oxidation potential (Epa) and the reduction potential (Epc). The calculation formula is as follows:
Using Equations (1) and (2), the diffusion coefficients (D₀) and standard potentials (E0) for electrodes A1 to A9 were obtained, as summarized in Table 2. Anodes A3 and A6 exhibit relatively higher D0 values of 56.1x10⁻¹⁴ cm2/s and 42.8 x10⁻¹⁴ cm2/s, respectively, suggesting faster diffusion of reactive species, which likely contributes to their superior performance in terms of electrochemical activity. In contrast, lower D0 values, such as 2.0x10⁻¹⁴ cm2/s for A7, indicate slower mass transport, which can limit the overall reaction rate at the electrode surface.
The standard potential reflects the intrinsic tendency of a species to gain or lose electrons under standard conditions. E0 values for anodes A1 to A9 range between -0.479 V and -0.499 V. These values indicate that all anodes exhibit reducing behavior relative to the standard hydrogen electrode. The E0 values of A3 and A6, at -0.498 V and -0.492 V, respectively, align with their higher D₀ values, suggesting these anodes facilitate efficient electron transfer and demonstrate a balanced redox activity. On the other hand, slight variations in E0 among other anodes can reflect differences in material composition or surface characteristics, impacting the redox kinetics. Anodes A3 and A6 stand out as high-performing candidates due to their advantageous D₀ and E0 profiles, highlighting the importance of these metrics in guiding material selection and design.

Table 2.
Diffusion coefficients and standard potentials for different anode electrodes.
| anode | A1 | A2 | A3 | A4 | A5 | A6 | A7 | A8 | A9 |
|---|---|---|---|---|---|---|---|---|---|
| D0x1014 (cm²/s) | 7.48 | 36.9 | 56.1 | 7.96 | 20.9 | 42.8 | 2.01 | 14.5 | 29.7 |
| E0 | -0.491 | -0.498 | -0.498 | -0.479 | -0.499 | -0.492 | -0.485 | -0.487 | -0.498 |
2.2. Enzyme Fuel Cell Performance Test Analysis
A bipolar system was used to analyze the enzyme-based biofuel cell system. A 4-channel thermocouple differential analog input module measured voltage, current, and temperature, with operating conditions controlled and data analyzed using LabVIEW software. The temperature was kept below 40 °C during enzyme immobilization on the electrode surface to prevent enzyme inactivation.
The CP electrodes were tested with nine different concentrations of anions and cations (Table 7 and Table 8 in Section 3.3). The fuel cells consisted of anode enzyme electrodes (A1 to A9) and cathode enzyme electrodes (C1 to C9). Each fuel cell configuration was assembled by placing the electrodes in the anode and cathode compartments of the fuel cell setup.
The computer sampled data at three points per second, storing a set of data every 1/3 second, totaling 10,800 data points over 60 min. To compare the power, current, and potential differences among the 81 enzyme battery groups and minimize errors from single-point measurements, the average potential and power over the first minute were recorded for each group (Table 3). The total power output over 60 min was also integrated and summarized in Table 4. Performance Results Summary are as follows:
A1 Electrode: The best initial performance was observed with A1C5 and A1C9, achieving potentials above 0.5 V and power outputs exceeding 250 μW/cm² in Table 3. The total energy after 60 min exceeded 800 J for both batteries, as shown in Table 4.
Table 3.
Enzyme battery potential and power density.
| cell | A1C1 | A1C2 | A1C3 | A1C4 | A1C5 | A1C6 | A1C7 | A1C8 | A1C9 |
|---|---|---|---|---|---|---|---|---|---|
| Initial voltage(V) | 0.422 | 0.377 | 0.390 | 0.409 | 0.513 | 0.458 | 0.262 | 0.329 | 0.500 |
| Power density(μW/cm2) | 178.1 | 141.8 | 152.3 | 167.3 | 263.3 | 209.4 | 68.7 | 107.9 | 249.7 |
| cell | A2C1 | A2C2 | A2C3 | A2C4 | A2C5 | A2C6 | A2C7 | A2C8 | A2C9 |
| Initial voltage(V) | 0.534 | 0.355 | 0.414 | 0.428 | 0.491 | 0.406 | 0.380 | 0.277 | 0.515 |
| Power density(μW/cm2) | 285.5 | 125.9 | 171.3 | 183.3 | 241.5 | 164.8 | 144.1 | 76.6 | 264.8 |
| cell | A3C1 | A3C2 | A3C3 | A3C4 | A3C5 | A3C6 | A3C7 | A3C8 | A3C9 |
| Initial voltage(V) | 0.482 | 0.374 | 0.476 | 0.387 | 0.429 | 0.377 | 0.415 | 0.244 | 0.513 |
| Power density(μW/cm2) | 232.4 | 139.6 | 226.3 | 149.7 | 184.4 | 142.3 | 172.5 | 59.6 | 263.2 |
| cell | A4C1 | A4C2 | A4C3 | A4C4 | A4C5 | A4C6 | A4C7 | A4C8 | A4C9 |
| Initial voltage(V) | 0.394 | 0.390 | 0.381 | 0.397 | 0.407 | 0.399 | 0.359 | 0.303 | 0.542 |
| Power density(μW/cm2) | 155.2 | 151.9 | 145.2 | 157.4 | 166.0 | 159.1 | 129.0 | 91.8 | 293.5 |
| cell | A5C1 | A5C2 | A5C3 | A5C4 | A5C5 | A5C6 | A5C7 | A5C8 | A5C9 |
| Initial voltage(V) | 0.433 | 0.370 | 0.361 | 0.376 | 0.308 | 0.442 | 0.366 | 0.324 | 0.469 |
| Power density(μW/cm2) | 187.1 | 137.1 | 130.3 | 141.6 | 94.7 | 195.3 | 133.7 | 105.2 | 220.2 |
| cell | A6C1 | A6C2 | A6C3 | A6C4 | A6C5 | A6C6 | A6C7 | A6C8 | A6C9 |
| Initial voltage(V) | 0.388 | 0.400 | 0.400 | 0.270 | 0.406 | 0.417 | 0.396 | 0.362 | 0.479 |
| Power density(μW/cm2) | 150.3 | 160.3 | 159.6 | 73.1 | 165.0 | 173.7 | 156.7 | 131.2 | 229.2 |
| cell | A7C1 | A7C2 | A7C3 | A7C4 | A7C5 | A7C6 | A7C7 | A7C8 | A7C9 |
| Initial voltage(V) | 0.421 | 0.379 | 0.398 | 0.271 | 0.373 | 0.391 | 0.472 | 0.329 | 0.459 |
| Power density(μW/cm2) | 177.5 | 144.0 | 158.4 | 73.7 | 139.4 | 153.1 | 222.4 | 108.5 | 211.0 |
| cell | A8C1 | A8C2 | A8C3 | A8C4 | A8C5 | A8C6 | A8C7 | A8C8 | A8C9 |
| Initial voltage(V) | 0.397 | 0.437 | 0.441 | 0.287 | 0.482 | 0.344 | 0.432 | 0.328 | 0.446 |
| Power density(μW/cm2) | 157.9 | 191.3 | 194.5 | 82.4 | 232.8 | 118.4 | 186.8 | 107.6 | 199.3 |
| cell | A9C1 | A9C2 | A9C3 | A9C4 | A9C5 | A9C6 | A9C7 | A9C8 | A9C9 |
| Initial voltage(V) | 0.380 | 0.353 | 0.377 | 0.378 | 0.455 | 0.382 | 0.354 | 0.369 | 0.512 |
| Power density(μW/cm2) | 144.2 | 124.3 | 142.3 | 142.6 | 206.6 | 145.6 | 125.2 | 136.0 | 261.7 |
Table 4.
Enzyme Battery Power Meter.
| cell | A1C1 | A1C2 | A1C3 | A1C4 | A1C5 | A1C6 | A1C7 | A1C8 | A1C9 |
| power (J) | 655 | 700 | 672 | 498 | 801 | 756 | 438 | 486 | 919 |
| cell | A2C1 | A2C2 | A2C3 | A2C4 | A2C5 | A2C6 | A2C7 | A2C8 | A2C9 |
| power(J) | 877 | 738 | 819 | 574 | 902 | 808 | 484 | 529 | 1020 |
| cell | A3C1 | A3C2 | A3C3 | A3C4 | A3C5 | A3C6 | A3C7 | A3C8 | A3C9 |
| power(J) | 774 | 673 | 941 | 577 | 876 | 719 | 576 | 501 | 981 |
| cell | A4C1 | A4C2 | A4C3 | A4C4 | A4C5 | A4C6 | A4C7 | A4C8 | A4C9 |
| power(J) | 611 | 647 | 574 | 423 | 650 | 673 | 496 | 432 | 922 |
| cell | A5C1 | A5C2 | A5C3 | A5C4 | A5C5 | A5C6 | A5C7 | A5C8 | A5C9 |
| power(J) | 655 | 546 | 684 | 388 | 646 | 684 | 480 | 430 | 868 |
| cell | A6C1 | A6C2 | A6C3 | A6C4 | A6C5 | A6C6 | A6C7 | A6C8 | A6C9 |
| power(J) | 764 | 748 | 754 | 530 | 907 | 800 | 654 | 635 | 948 |
| cell | A7C1 | A7C2 | A7C3 | A7C4 | A7C5 | A7C6 | A7C7 | A7C8 | A7C9 |
| power(J) | 671 | 582 | 602 | 442 | 782 | 697 | 515 | 456 | 844 |
| cell | A8C1 | A8C2 | A8C3 | A8C4 | A8C5 | A8C6 | A8C7 | A8C8 | A8C9 |
| power(J) | 631 | 611 | 803 | 424 | 784 | 809 | 493 | 490 | 777 |
| cell | A9C1 | A9C2 | A9C3 | A9C4 | A9C5 | A9C6 | A9C7 | A9C8 | A9C9 |
| power(J) | 640 | 561 | 568 | 391 | 813 | 548 | 336 | 415 | 920 |
A2 Electrode: Best initial performance observed with A2C1 and A2C9, with potentials above 0.5 V and power outputs exceeding 250 μW/cm². Total energy output after 60 min was highest for A2C1, A2C3, A2C5, A2C6, and A2C9, with A2C9 reaching over 1000 J.
A3 Electrode: Best initial performance observed with A3C9, achieving a potential of 0.513 V and a power output of 263 μW/cm². Total energy after 60 min exceeded 800 J for A3C3, A3C5, and A3C9, with A3C9 approaching 1000 J.
A4 Electrode: The best initial performance was observed with A4C9, which reached a potential of 0.542 V and a power output of 293 μW/cm². After 60 min, only A4C9 performed well, reaching 921 J of energy output.
A5 Electrode: Performance was generally lower, with all nine groups showing potentials below 0.5 V. Only A5C9 performed better after 60 min, reaching 868 J.
A6 Electrode: Similar results were observed, with all nine groups having potentials below 0.5 V. However, A6C5 and A6C9 showed superior performance with energy outputs exceeding 900 J.
A7 electrode: The most effective combinations were A7C7 and A7C9, which achieved potentials of 0.472 V and 0.459 V, with power outputs of 222 μW/cm² and 211 μW/cm², respectively. After 60 minutes, only the A7C9 configuration exceeded 844 J in total energy generation.
A8 electrode: The optimal performance with A8C5 and A8C9, recording potentials of 0.482 V and 0.446 V and power outputs of 233 μW/cm² and 199 μW/cm². Notably, the total energy generated by A8C3 and A8C6 exceeded 800 J over the same duration.
A9 electrode: The highest performance was observed with A9C9, which recorded a potential of 0.512 V and a power output of 262 μW/cm². After 60 min, A9C5 and A9C9 achieved total energy outputs exceeding 800 J.
A consistent trend emerged with cathode electrodes C5 and C9, which frequently outperformed other combinations across various anode types, indicating superior catalytic activity and efficient electron transfer. The pH of the buffer solution also played a significant role, with C5 and C9 cathodes prepared with citrate buffer solution (CBS, pH 5) consistently demonstrating enhanced performance. The acidic conditions optimized laccase activity in the cathode chamber, leading to better biofuel cell performance.
Regarding the anode's pH influence, combinations A2 to A6 prepared with phosphate buffer solution (PBS, pH 6 and 7) exhibited better glucose oxidation activity, suggesting that glucose oxidase (GOx) operates more effectively under neutral or slightly acidic conditions. Electrode composition also significantly impacted performance, with anode electrodes A2, A3, A8, and A9 and cathode electrodes C2, C3, C6, C8, and C9 showing higher polypyrrole (PPy) content. This higher PPy concentration correlated with improved conductivity and electron transfer, consistently resulting in better performance.
Battery lifetime analysis revealed that the longest-lasting batteries included anode electrodes A2, A3, A7, and A9, and cathode electrodes C2, C3, C6, C8, and C9. The correlation between higher PPy content and improved energy retention was evident, as batteries with this composition demonstrated prolonged operational life and stability.
The choice of cathode electrode proved more critical to overall enzyme fuel cell performance than the anode. Cathode electrodes C5 and C9 prepared with citrate buffer at pH 5 and higher PPy content delivered the most consistent and optimal results. Enzyme activity was also pH-dependent, with acidic conditions favoring laccase and neutral conditions favoring glucose oxidase. Ultimately, the combination of higher PPy content and optimized buffer conditions significantly enhanced the performance and longevity of enzyme biofuel cells.
Figure 4.
shows a plot of potential against time using biofuel cells with the same anode electrode.
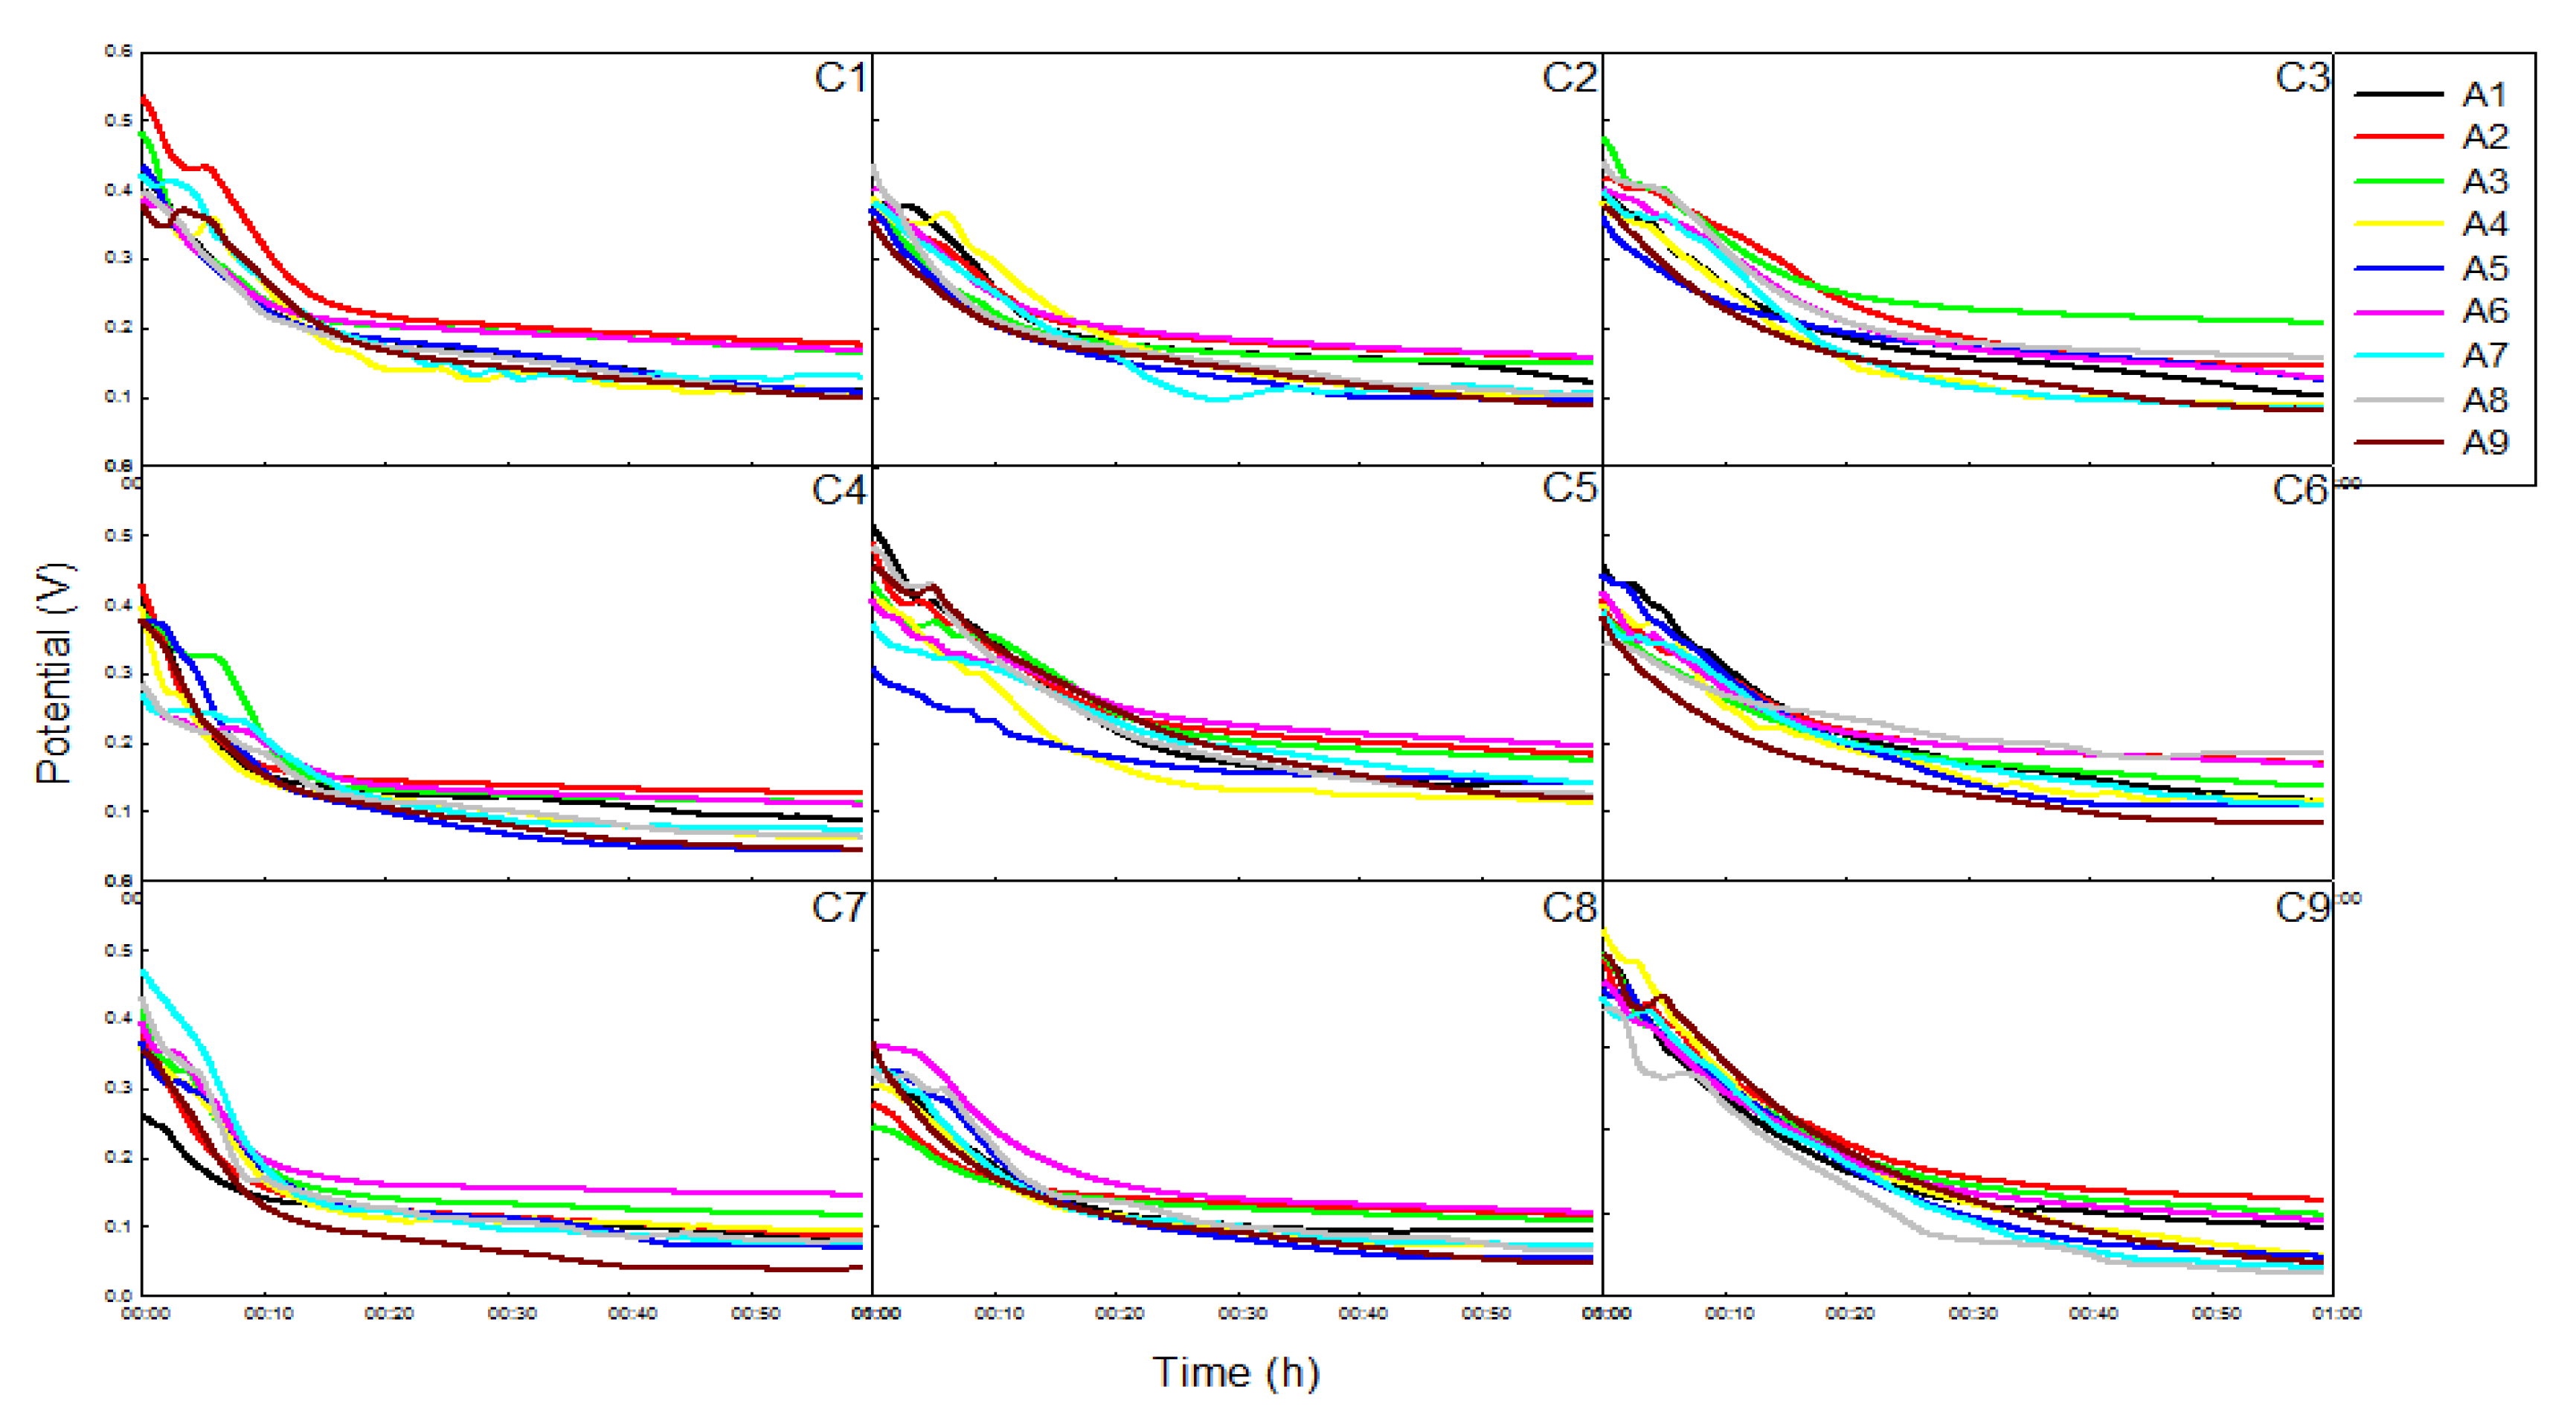
Based on initial battery performance statistics, the best-performing enzyme batteries were anode electrodes A1, A2, and A3 and cathode electrodes C1, C5, and C9. The combination of different anode and cathode electrodes showed varying results without a clear overall trend. However, conductive polymer PPy content influenced oxidative activity, with the following observed activation order: A3 > A6 > A2 > A9 > A5 > A8 > A4 > A1 > A7. The concentration of PPy was observed to influence the electrode’s oxidative performance but not the overall energy release in the enzyme fuel cell system.
For cathode performance, cathode electrodes C5 and C9 consistently showed superior performance in terms of initial efficiency and total energy output. Modulating enzyme fuel cells with C5 and C9 cathodes showed improved energy generation, indicating that the cathode plays a more critical role than the anode in fuel cell efficiency.
In continuous operation testing for CP vs. CP3M electrodes in Figure 5, the sample concentration combination (enzyme concentration = 5 U/10μL, conductive polymer concentration = 15mM, mediator concentration =10mM, buffer solution pH = 5) was tested for continuous operation over 7 day using CP and CP3M electrodes. On the 3rd day, the buffer solution (anode side) and ultrapure water (cathode side) were replaced during the period. CP3M electrode results in a voltage drop rate of 0.32 V at 102.4 μW/cm² by day 2, and voltage stabilized around 0.3 V after buffer solution replacement on day 3. The CP3M electrode maintained better voltage stability due to the enzyme immobilization effect and breathable tape coverage, preventing rapid glucose depletion.
CP Electrode Results in voltage dropped significantly by day 2, likely due to glucose depletion. After buffer solution replacement on day 3, the voltage spiked to 0.38 V but gradually reduced to 0.24 V. Power density is 57.6 μW/cm², indicating enzyme immobilization was effective but less stable than CP3M.
In potential-time analysis (First 12 h), the CP Electrode showed faster initial performance, possibly due to the absence of a breathable tape barrier allowing more immediate enzyme interaction. The CP3M electrode exhibited delayed but stronger performance after 1.5 h, likely due to the breathable tape creating a diffusion barrier that initially slowed the reaction but stabilized the enzyme immobilization for long-term activity.
For the first 30 h, adding breathable tape did not significantly affect overall efficiency and initially slowed the reaction. Voltage increased as the system stabilized. The voltage drop after peak output may be linked to the limitations of the Nafion 212 proton exchange membrane. As the current density increased, mass transfer limitations affected ion exchange and glucose availability, reducing performance. The cathode electrode significantly influences enzyme fuel cell performance more than the anode. Higher conductive polymer content enhances oxidative performance but does not directly impact overall energy release. The CP3M electrode, with breathable tape, showed better long-term stability and enzyme retention, while the CP electrode exhibited faster initial performance but lower stability over time. Cathode combinations (C5 and C9) with slightly acidic conditions (pH 5) and higher PPy content yielded the best results.
A phosphate buffer solution (PBS) with a glucose concentration of 10 mM was used in the anode tank, while ultra-pure water was introduced into the cathode tank. A Nafion 212 proton exchange membrane (PEM) was placed between the compartments to facilitate proton transfer. However, the membrane allowed proton flow in both directions instead of exclusively from the anode to the cathode. Due to the higher glucose concentration in the anode compared to the cathode, a concentration gradient developed. This caused water dissociation in the cathode, generating H⁺ and OH⁻ ions. The H⁺ ions migrated back into the anode, disrupting proton transfer from glucose oxidation catalyzed by glucose oxidase and reducing electron flow in the external circuit.
CP and CP3M electrodes were prepared using the optimal enzyme solution. The anode electrode was immersed in a PBS buffer with 10 mM glucose, while the cathode electrode was soaked in ultra-pure water for 2 days before assembly. The fuel cell was tested continuously for 20 day, as shown in Figure 6.
After assembly, the CP and CP3M batteries showed an upward voltage trend during the first three days. The CP3M battery maintained a stable voltage of around 0.5 V, while the CP battery voltage decreased to approximately 0.2 V, indicating better enzyme immobilization in the CP3M electrode.
After 14 day, the battery voltage declined, likely due to glucose depletion in the anode tank. Overall, the CP3M electrode extended the fuel cell's operational lifespan to 20 days, achieving a peak voltage of 0.57 V and a power density of 324.9 μW/cm². Its stability and performance were superior to the CP electrode, as summarized in Table 5.
The results of this study, compared with those from the literature (Table 6), show variations in battery performance despite using glucose oxidase and laccase as the primary oxidation enzymes for the anode and cathode, respectively. These differences can be attributed to the addition of conductive polymers, mediator materials, and buffer solutions, which influence the overall power output. Electrode design also affected performance. Covering the electrode surface with breathable tape led to an upward trend in battery power output, offering a promising direction for future research and fuel cell optimization. [18].
3. Materials and Methods
3.1. Chemicals
Phosphate buffer solution (PBS), carbon nanotube (CNT), PPy, polyanimine, 2,2-azino-bis (3-ethylbenzothiazoline-6-sulphonic acid) (ABTS), potassium ferrocyanide (III) K3Fe(CN6), glucosidase (GOx), and laccase (Lac) were purchased from Sigma-Aldrich (St. Louis, USA). Glucose, N-(3-dimethylaminopropyl)-N’-ethylcarbodimide, and N-hydroxysuccinimide were from Fisher Chemical (Leicestershire, UK).
3.2. Electrolyte Solution
To prepare phosphate-buffered saline (PBS) at pH 7 and 0.2 M concentration, 0.477 mol of monosodium phosphate and 0.523 mol of disodium sulfate were dissolved in distilled water. The pH was measured using a pH meter (JENWAY 3510, Barloworld Scientific Ltd, Dunmow, Essex, U.K.) and adjusted to neutrality using sulfuric acid or sodium hydroxide. The solution volume was then increased to 1 liter with distilled water, creating a stock solution of 1 M PBS. This stock was later diluted to prepare buffers with concentrations of 0.4, 0.5, and 0.1 M as needed. Sorensen's phosphate buffer solution (pKa = 7.2, pH 5.8–8.0, 0.1 M), consisting of NaH2PO4 and Na2SO4, was specifically used in the research. Additionally, citrate buffer solution (CBS, pH 5) was prepared by combining 100 mL of citric acid (0.1 M) with 100 mL of sodium citrate (0.1 M).
3.3. Preparation of Enzyme Solution and Immobilization Technique
Two buffer solutions, phosphate buffer solution (PBS) and citrate buffer solution (CBS), were prepared and used for the anode and cathode solutions, respectively, with pH values of 5.0, 6.0, and 7.0. A glucose solution (0.01 M) was prepared by dissolving 0.36 g of glucose powder in 200 mL of PBS (pH 7.0) and reconstituted the day before each experiment.
The anode glucose oxidase solution was prepared by mixing polypyrrole (PPy) (5 mM, 0.0885 g), potassium hexacyanoferrate (III) (K3Fe(CN)6) (10 mM, 0.00525 g), and glucose oxidase (5 U/10 μL) in 16 mL of PBS (pH 5.0). The cathode laccase solution was prepared with PPy (5 mM, 0.0885 g), 2,2'-azino-bis (3-ethylbenzothiazoline-6-sulfonic acid) (ABTS, 10 mM, 0.08775 g), and laccase (5 U/10 μL) in 16 mL of CBS (pH 5.0).
Table 7 and Table 8 detail the compositions of the glucose oxidase (GOx) solution in the anode and the laccase solution in the cathode, respectively.
The electrodes were prepared using a copper wire (2 mm diameter) covered with two copper tapes (10 mm × 10 mm) and carbon paper. The bioanode and biocathode were created by drop-coating 40 μL of the respective anode and cathode enzyme solutions onto the carbon paper surface using a pipette. Once the enzyme solution was uniformly coated and completely dried, enzyme immobilization was considered complete. This electrode was referred to as the CP electrode (Figure 7a). A layer of 3M ventilation tape (3M™ Micropore™ Surgical Tape, Taiwan) was then applied over the CP electrode, creating the CP3M electrode. The electrode was stored at 4 °C in a refrigerator. For testing, a 10 mM PBS glucose solution was introduced to the anode and cathode cells.
3.4. Performance Test of the Enzyme-Based Biofuel Cell
The cell was fabricated from polymethylmethacrylate using a CNC milling machine (Mitsubishi CNC M70, Japan) (Figure 8). The external dimensions were 40 mm × 50 mm × 50 mm, while the inner tank volume measured 20 mm × 30 mm × 40 mm. The center of the tank's bottom was hollowed out to create a groove (8 mm × 8 mm × 0.5 mm), as shown in Figure 8. This groove was designed to accommodate a rotating magnet with a diameter of 20 mm. Additionally, a circular groove (0.5 mm deep) was machined around the round hole to hold a rubber gasket securely.
The tested enzyme-based biofuel cells consisted of GOx, potassium hexacyanoferrate (III) (K3Fe(CN)6), a polymer, carbon nanotubes (CNT), and a Nafion® 212 proton-exchange membrane. The biocathode chamber contained a carbon nanoballs paper (surface area = 1 cm²) immobilized with laccase and ABTS. Oxygen was bubbled into the system at a flow rate of 1 mL/min. The bioanode was in contact with a PBS solution (pH 7) containing 10 mM glucose, while the carbon nanoballs paper (cathode) was immersed in a catholyte saturated with oxygen. The power output performance of the biofuel cell was characterized using a slow scan rate, a two-electrode voltage measurement, and current signals received by a 24-bit differential analog module. Data was transmitted to a computer for analysis using LabVIEW® software at a constant temperature of 37°C.
3.5. Cyclic Voltammetry
The CV apparatus used was a CH 600 electrochemical analyzer (Bio-Analytical Systems, USA) connected to an Acer computer (Taiwan). A three-electrode cell configuration was employed, consisting of a modified carbon paper electrode (1 cm×1 cm) as the working electrode, a platinum wire as the auxiliary electrode, and an Ag/AgCl electrode (3M KCl) as the reference electrode. The working electrode was modified with various combinations of bioanode enzyme, biocathode enzyme, potassium ferrocyanide (mediator), and CNT for each experimental setup. The tests were conducted at 37°C, with the electrode immersed in a 10 mM glucose solution (pH 7). The scanning rate was set at 0.01 V/s. For PPy as the conductive polymer, the scanning voltage ranged from -0.7 V to -0.3 V, while PANI ranged from -0.4 V to 0.2 V. The reference electrode used was Ag/AgCl. Electrodes were allowed to stabilize in the glucose solution for 5 minutes before testing began.
Each electrode underwent six testing segments, with experimental data collected from segments 3 and 4. CV was utilized to determine the diffusion coefficients of different mediator-enzyme combinations. For accurate results, each CV scan was considered one segment from the initial to the final potential, with two segments forming a complete cyclic curve.
4. Conclusions
This study successfully demonstrated the effectiveness of the CP3M electrode design, which incorporates breathable tape for enhanced enzyme retention and long-term stability. Polypyrrole as a conductive polymer further improved oxidative activity and hydrogen evolution, particularly under slightly acidic conditions. The CP3M electrode consistently outperformed the CP electrode in both short-term and long-term electrochemical performance, achieving higher voltage output, power density, and extended operational lifespan. The optimized buffer conditions (PBS for GOx and CBS for laccase) and the use of PPy significantly contributed to the observed enhanced catalytic efficiency.
The findings also highlighted the importance of enzyme retention strategies and membrane design in enzyme-based biofuel cells. While the CP3M electrode design demonstrated significant improvements, challenges such as mass transfer limitations and reverse proton migration still need to be addressed. This study provides a strong foundation for future research in enzyme-based biofuel cells. The CP3M design has enhanced enzyme retention and stable power generation and offers a promising pathway for developing sustainable energy solutions. By refining membrane properties, enzyme immobilization techniques, and buffer selection, future studies can further enhance the efficiency, longevity, and applicability of biofuel cells for real-world energy applications.
Notations
| ABTS | |
| CP | copper-type |
| CP3M | copper-type with 3M micropore type |
| CV | cyclic voltammetry |
| EIS | electrochemical impedance spectroscopy |
| Gox | glucosidase |
| Lac | laccase |
| PANI | polyaniline |
| PBS | phosphate buffer solution |
| PPy | polypyrrole |
Author Contributions
Adama A. Bojang and Damayanti Damayanti wrote the paper and rechecked the data by conducting further experimentation. Chang-Yen Chen did the initial experimentation and tabulation of results, and Ho Shing Wu supervised and did the final edition. All authors have read and agreed to the published version of the manuscript.
Institutional Review Board Statement
Not applicable.
Informed Consent Statement
Not applicable.
Data Availability Statement
Not applicable.
Conflicts of Interest
The authors declare no conflicts of interest.
References
- Zebda, A.; Innocent, C.; Renaud, L.; Certin, M.; Pichot, F.; Ferrigno, R.; Tingry, S. Enzyme-Based Microfluidic Biofuel Cell to Generate Micropower in Biofuel's Engineering Process Technology; 2011; p. 564.
- Kim, J.; Jia, H.; Wang, P. Challenges in biocatalysis for enzyme-based biofuel cells. Biotechnology Advances 2006, 24, 296–308. [Google Scholar] [CrossRef] [PubMed]
- Żygowska, M. Design, fabrication and characterisation of components for microfluidic enzymatic biofuel cells, Thesis, National University of Ireland, Cork. National University of Ireland, Cork 2014.
- Wong, Y.; Yu, J. Laccase-catalyzed Decolorization of Synthetic Dye. Water research 1999, 33, 3512–3520. [Google Scholar] [CrossRef]
- XU, Q.y.; LIU, C.b.; Wu, H.s. Low-cost Immobilized Enzyme Glucose Sensor based on Laminar Flow. Journal of Physics: Conference Series, The 6th International Conference on Chemical Materials and Process 2020, 1681, 012008. [Google Scholar] [CrossRef]
- Wong, C.M.; Wong, K.H.; Chen, X.D. Glucose oxidase: natural occurrence, function, properties and industrial applications. Applied microbiology and biotechnology 2008, 78, 927–938. [Google Scholar] [CrossRef]
- Jaeger, K.E.; Eggert, T. Enantioselective biocatalysis optimized by directed evolution. Current opinion in biotechnology 2004, 15, 305–313. [Google Scholar] [CrossRef]
- Ummalyma, S.B.; Bhaskar, T. Recent advances in the role of biocatalyst in biofuel cells and its application: An overview. Biotechnology and Genetic Engineering Reviews 2024, 40, 2051–2089. [Google Scholar] [CrossRef]
- Cao, L.; Chen, J.; Pang, J.; Qu, H.; Liu, J.; Gao, J. Research Progress in Enzyme Biofuel Cells Modified Using Nanomaterials and Their Implementation as Self-Powered Sensors. Molecules 2024, 29, 257. [Google Scholar] [CrossRef]
- Blanford, C.F.; Heath, R.S.; Armstrong, F.A. A stable electrode for high-potential, electrocatalytic O(2) reduction based on rational attachment of a blue copper oxidase to a graphite surface. Chem Commun (Camb) 2007, 1710–1712. [Google Scholar] [CrossRef]
- Moore, C.M.; Akers, N.L.; Hill, A.D.; Johnson, Z.C.; Minteer, S.D. Improving the Environment for Immobilized Dehydrogenase Enzymes by Modifying Nafion with Tetraalkylammonium Bromides. Biomacromolecules 2004, 5, 1241–1247. [Google Scholar] [CrossRef]
- Heineman, W.R.; Kissinge, P.T. Analytical Electrochemistry: Methodology and Applications of Dynamic Techniques. Anal. Chem. 1980, 52, 138R–151R. [Google Scholar] [CrossRef]
- Ismagilov, R.F.; Stroock, A.D.; Kenis, P.J.A.; Whitesides, G.; Stone, H.A. Experimental and theoretical scaling laws for transverse diffusive broadening in two-phase laminar flows in microchannels. Applied Physics Letters 2000, 76, 2376. [Google Scholar] [CrossRef]
- Dai, D.J.; Chan, D.S.; Wu, H.S. Modified Carbon Nanoball on Electrode Surface Using Plasma in Enzyme-Based Biofuel Cells. Energy Procedia 2012, 14, 1804–1810. [Google Scholar] [CrossRef]
- Roth, G.J.; Calverley, D.C. Aspirin, Platelets, and Thrombosis: Theory and Practice. Blood 1994, 83, 885–898. [Google Scholar] [CrossRef] [PubMed]
- Munauwarah, R.; Bojang, A.A.; Wu, H.S. Characterization of enzyme immobilized carbon electrode using covalent-entrapment with polypyrrole. Journal of the Chinese Institute of Engineers 2018, 41, 710–719. [Google Scholar] [CrossRef]
- Bojang, A.A.; Wu, H.S. Characterization of electrode performance in enzymatic biofuel cells using cyclic voltammetry and electrochemical impedance Spectroscopy. Catalysts 2020, 10, 1–20. [Google Scholar] [CrossRef]
- Hayes, J.R.; Engstrom, A.M.; Friesen, C. Orthogonal flow membraneless fuel cell. Journal of Power Sources 2008, 183, 257–259. [Google Scholar] [CrossRef]
- Kashyap, D.; Venkateswaran, P.S.; Dwivedi, P.K.; Kim, Y.H.; Kim, G.M.; Sharma, A.; Goel, S. Recent developments in enzymatic biofuel cell: towards implantable integrated micro-devices. Int. J. Nanoparticles 2015, 8, 61–81. [Google Scholar] [CrossRef]
- Ding, S.N.; Holzinger, M.; Mousty, C.; Cosnier, S. Laccase electrodes based on the combination of single-walled carbon nanotubes and redox layered double hydroxides: Towards the development of biocathode for biofuel cells. Journal of Power Sources 2010, 195, 4714–4717. [Google Scholar] [CrossRef]
- Klis, M.; Maicka, E.; Michota, A.; Bukowska, J.; Sek, S.; Rogalski, J.; Bilewicz, R. Electroreduction of laccase covalently bound to organothiol monolayers on gold electrodes. Electrochimica Acta 2007, 52, 5591–5598. [Google Scholar] [CrossRef]
- Shim, J.; Kim, G.-Y.; Moon, S.-H. Covalent co-immobilization of glucose oxidase and ferrocenedicarboxylic acid for an enzymatic biofuel cell. Journal of Electroanalytical Chemistry 2011, 653, 14–20. [Google Scholar] [CrossRef]
- Calabrese Barton, S.; Gallaway, J.; Atanassov, P. Enzymatic Biofuel Cells for Implantable and Microscale Devices. Chemical Reviews 2004, 104, 4867–4886. [Google Scholar] [CrossRef] [PubMed]
- Zebda, A.; Renaud, L.; Cretin, M.; Pichot, F.; Innocent, C.; Ferrigno, R.; Tingry, S. A microfluidic glucose biofuel cell to generate micropower from enzymes at ambient temperature. Electrochemistry Communications 2009, 11, 592–595. [Google Scholar] [CrossRef]
- Willner, I.; Yan, Y.M.; Willner, B.; Tel-Vered, R. Integrated Enzyme-Based Biofuel Cells-A Review. Fuel Cells 2009, 9, 7–24. [Google Scholar] [CrossRef]
Figure 1.
CV diagram using different polymers (a) PPy (b)PANI for different pH. ( : pH5
: pH5 : pH 6
 : pH 7), immersed at 0 h in a glucose buffer solution; (
 : pH 5
 : pH 6
 : pH 7), immersed at 1 h in a glucose buffer solution.
: pH5: pH 6: pH 7), immersed at 0 h in a glucose buffer solution; (: pH 5: pH 6: pH 7), immersed at 1 h in a glucose buffer solution.
Figure 1.
CV diagram using different polymers (a) PPy (b)PANI for different pH. (: pH5: pH 6: pH 7), immersed at 0 h in a glucose buffer solution; (: pH 5: pH 6: pH 7), immersed at 1 h in a glucose buffer solution.
: pH5: pH 6: pH 7), immersed at 0 h in a glucose buffer solution; (: pH 5: pH 6: pH 7), immersed at 1 h in a glucose buffer solution.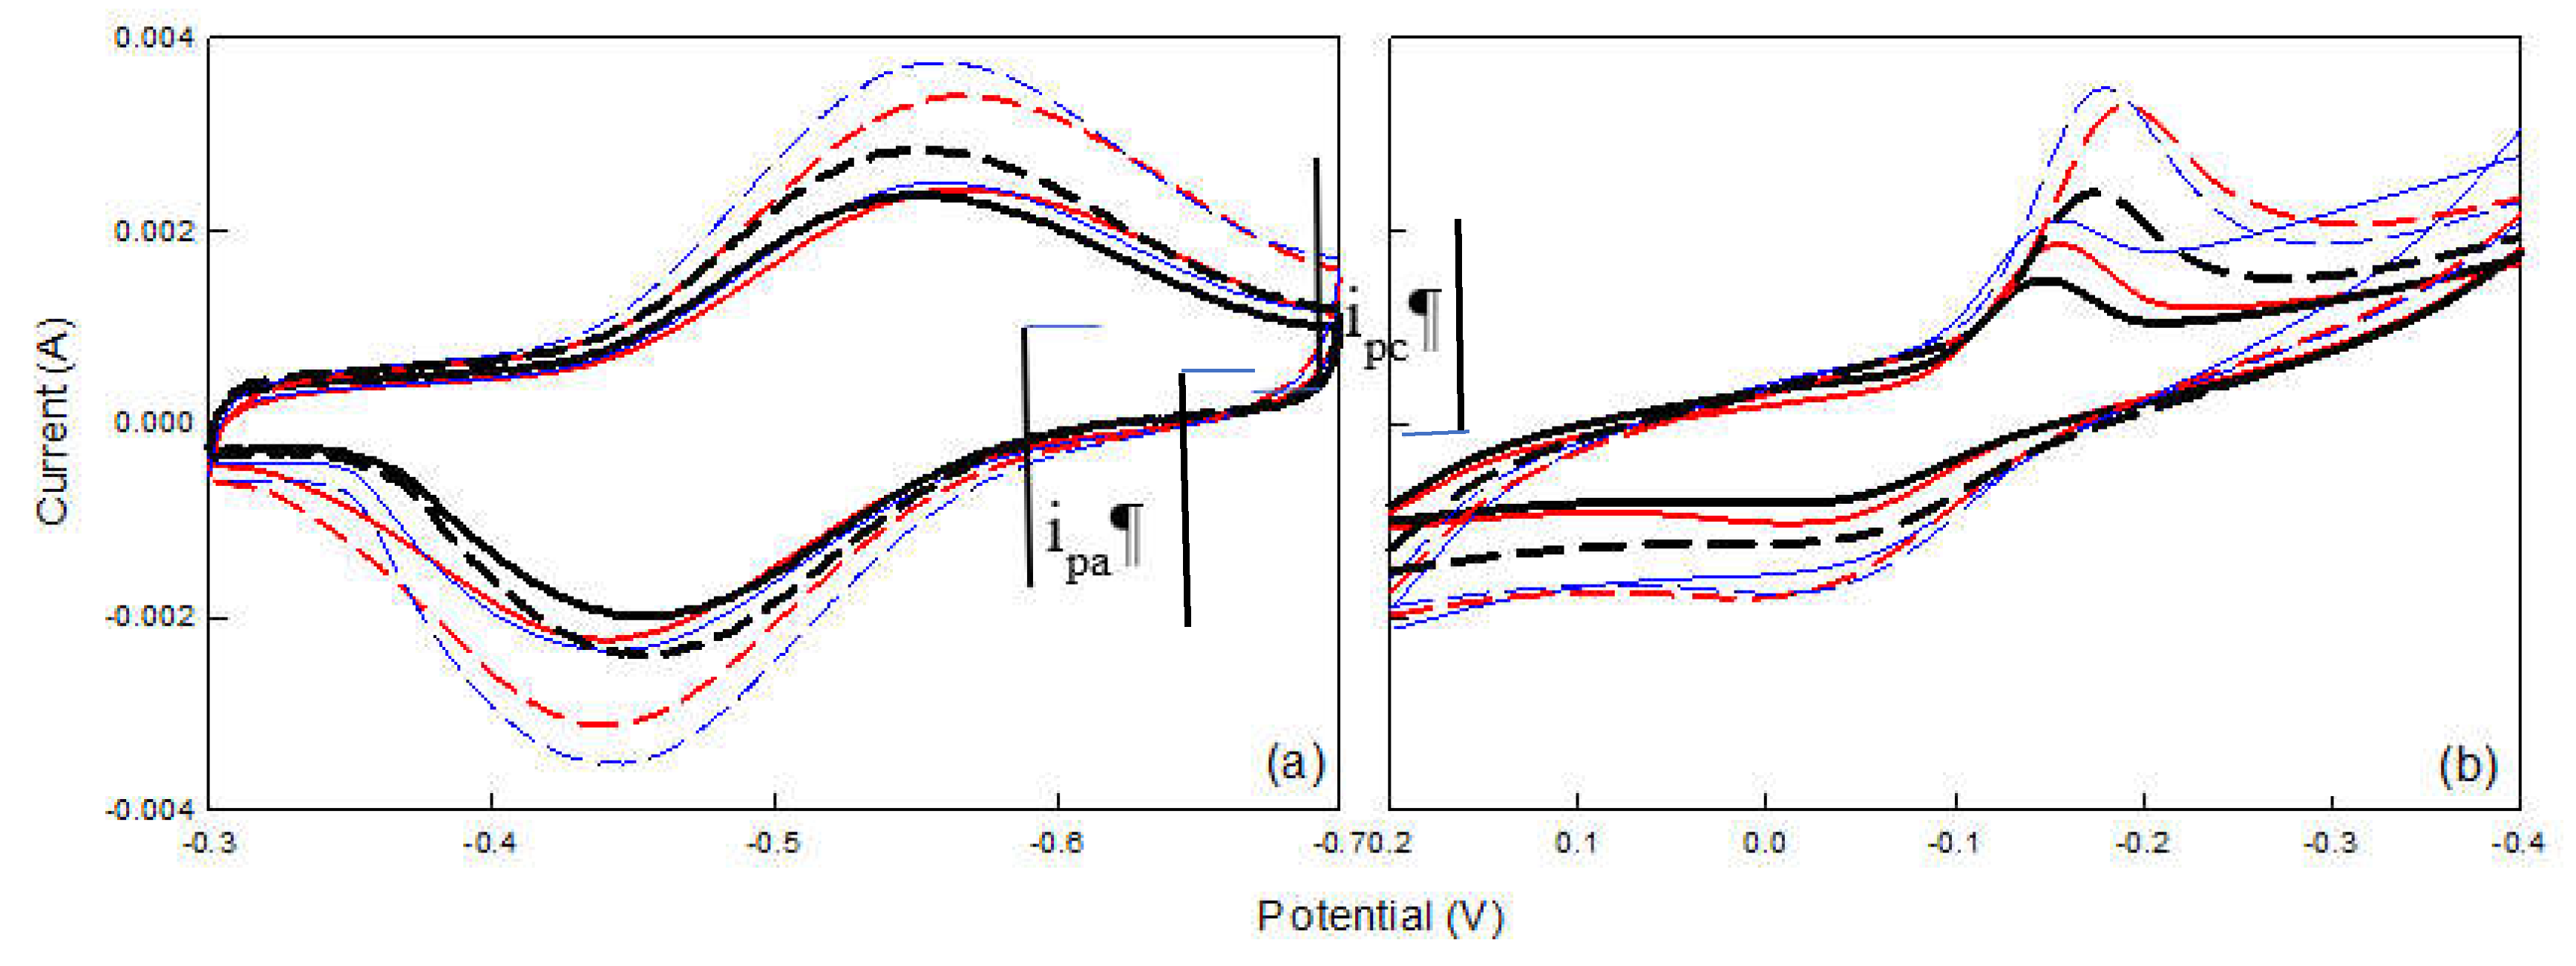
Figure 2.
Comparison of CV between PPy and PANI electrodes. PPy (mM)= ( :10,
:10, :20,
:20,  : 30,
: 30,  :40), PANI (mM)= (
 :10,
:10, ,20,
,20,  : 30
: 30 :40), blank (mM)=: 0, GOx (5U/10μL), Fe(CN)63-(10mM), pH=7.
:10,:20, : 30, :40), PANI (mM)= (:10,,20, : 30:40), blank (mM)=: 0, GOx (5U/10μL), Fe(CN)63-(10mM), pH=7.
Figure 2.
Comparison of CV between PPy and PANI electrodes. PPy (mM)= (:10,:20, : 30, :40), PANI (mM)= (:10,,20, : 30:40), blank (mM)=: 0, GOx (5U/10μL), Fe(CN)63-(10mM), pH=7.
:10,:20, : 30, :40), PANI (mM)= (:10,,20, : 30:40), blank (mM)=: 0, GOx (5U/10μL), Fe(CN)63-(10mM), pH=7.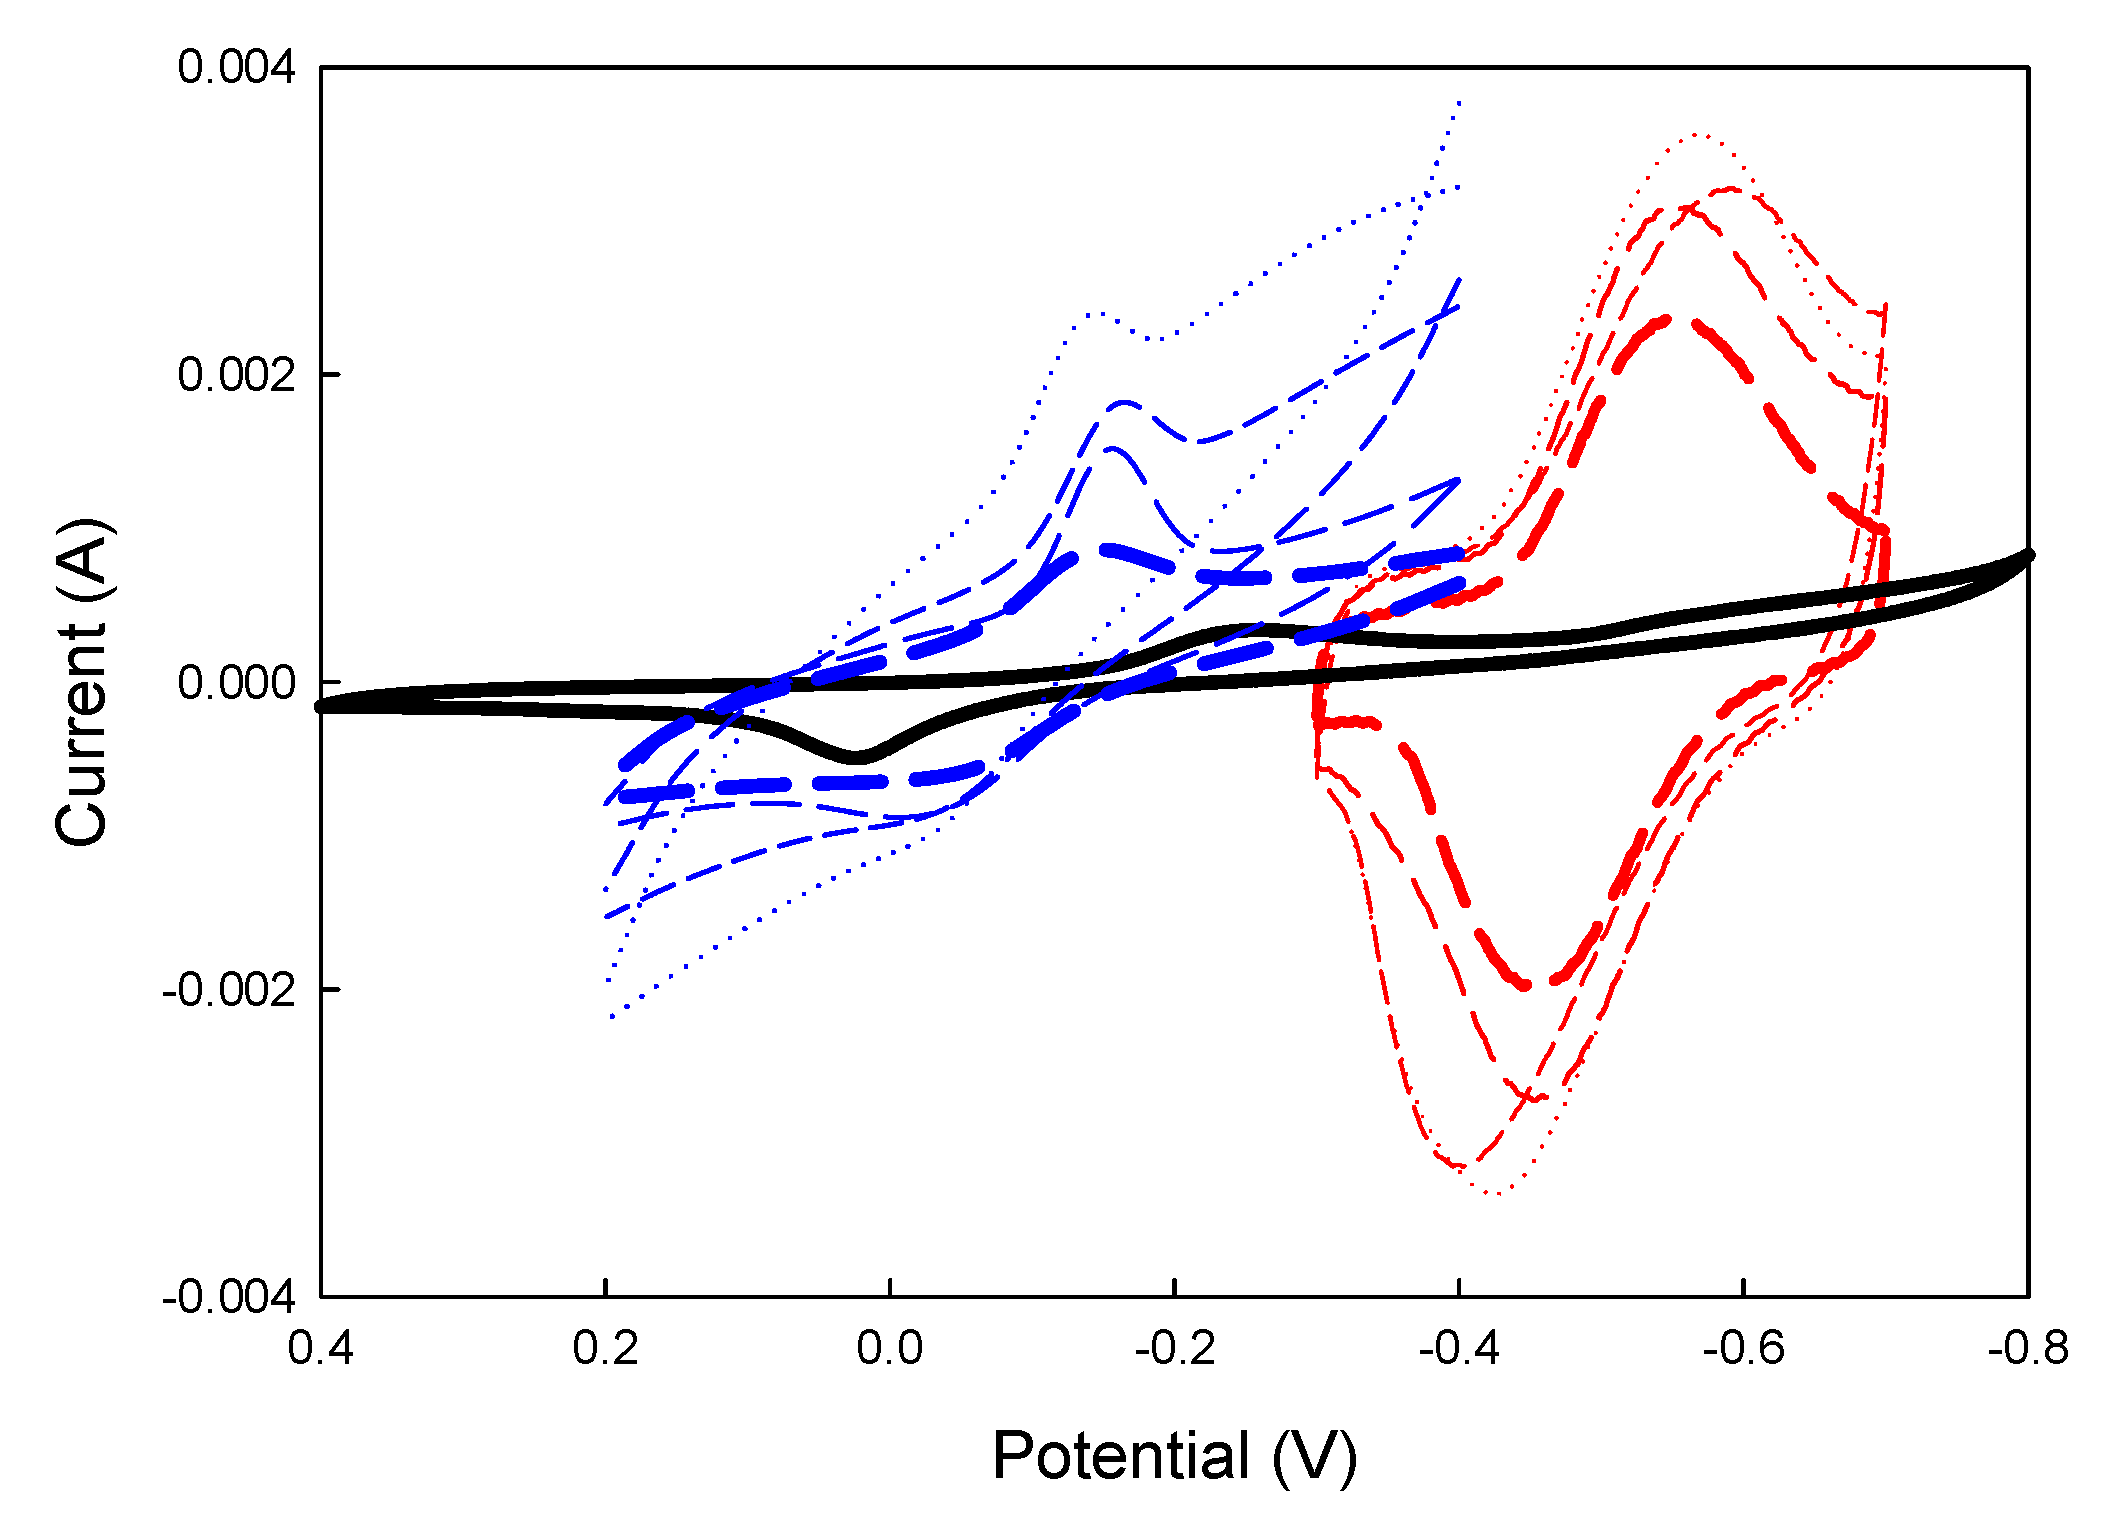
Figure 3.
Comparison of CV of different Anode A1 to A9 electrode.
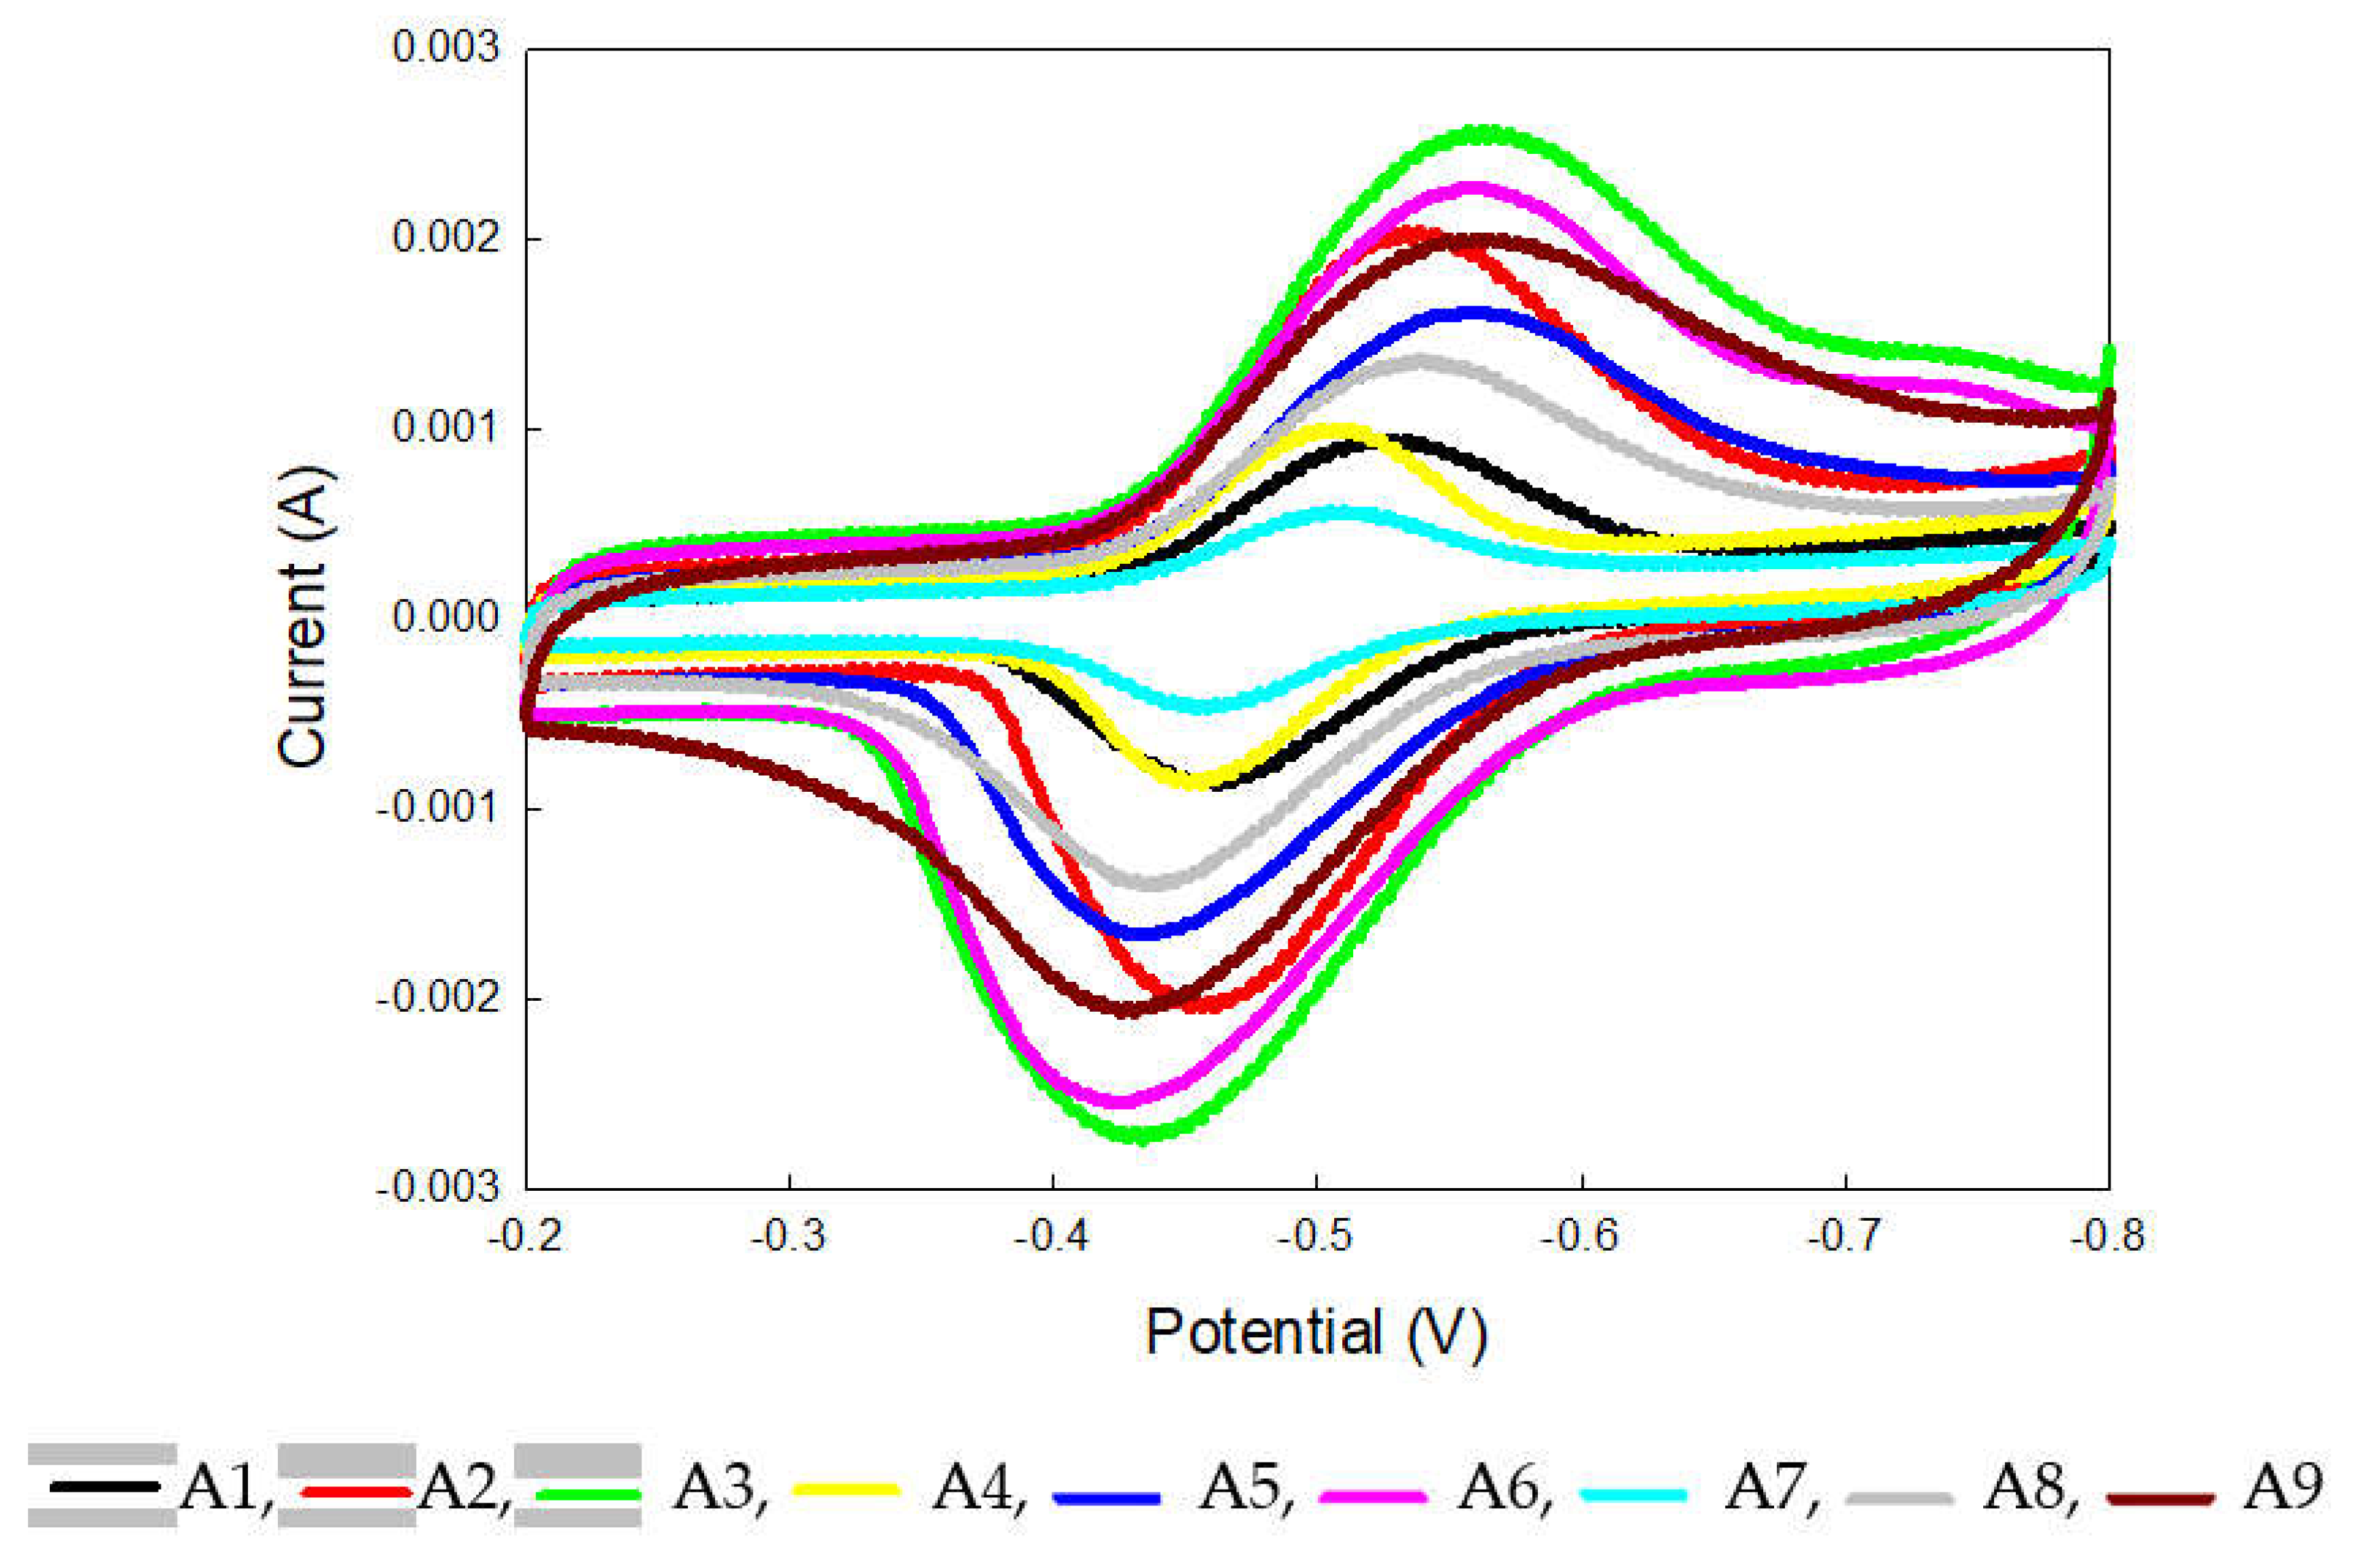
Figure 5.
Potential of enzymatic fuel cells for electrodes Cp and CPM3 Electrode from time on stream. Enzyme concentration 5 (U / 10 μL), conductive polymer concentration conditions 15 (mM), mediator concentration 10 (mM), buffer solution pH = 5. Anode: buffer solution PBS (containing glucose concentration 10 mM); Cathode: Ultra-pure water.
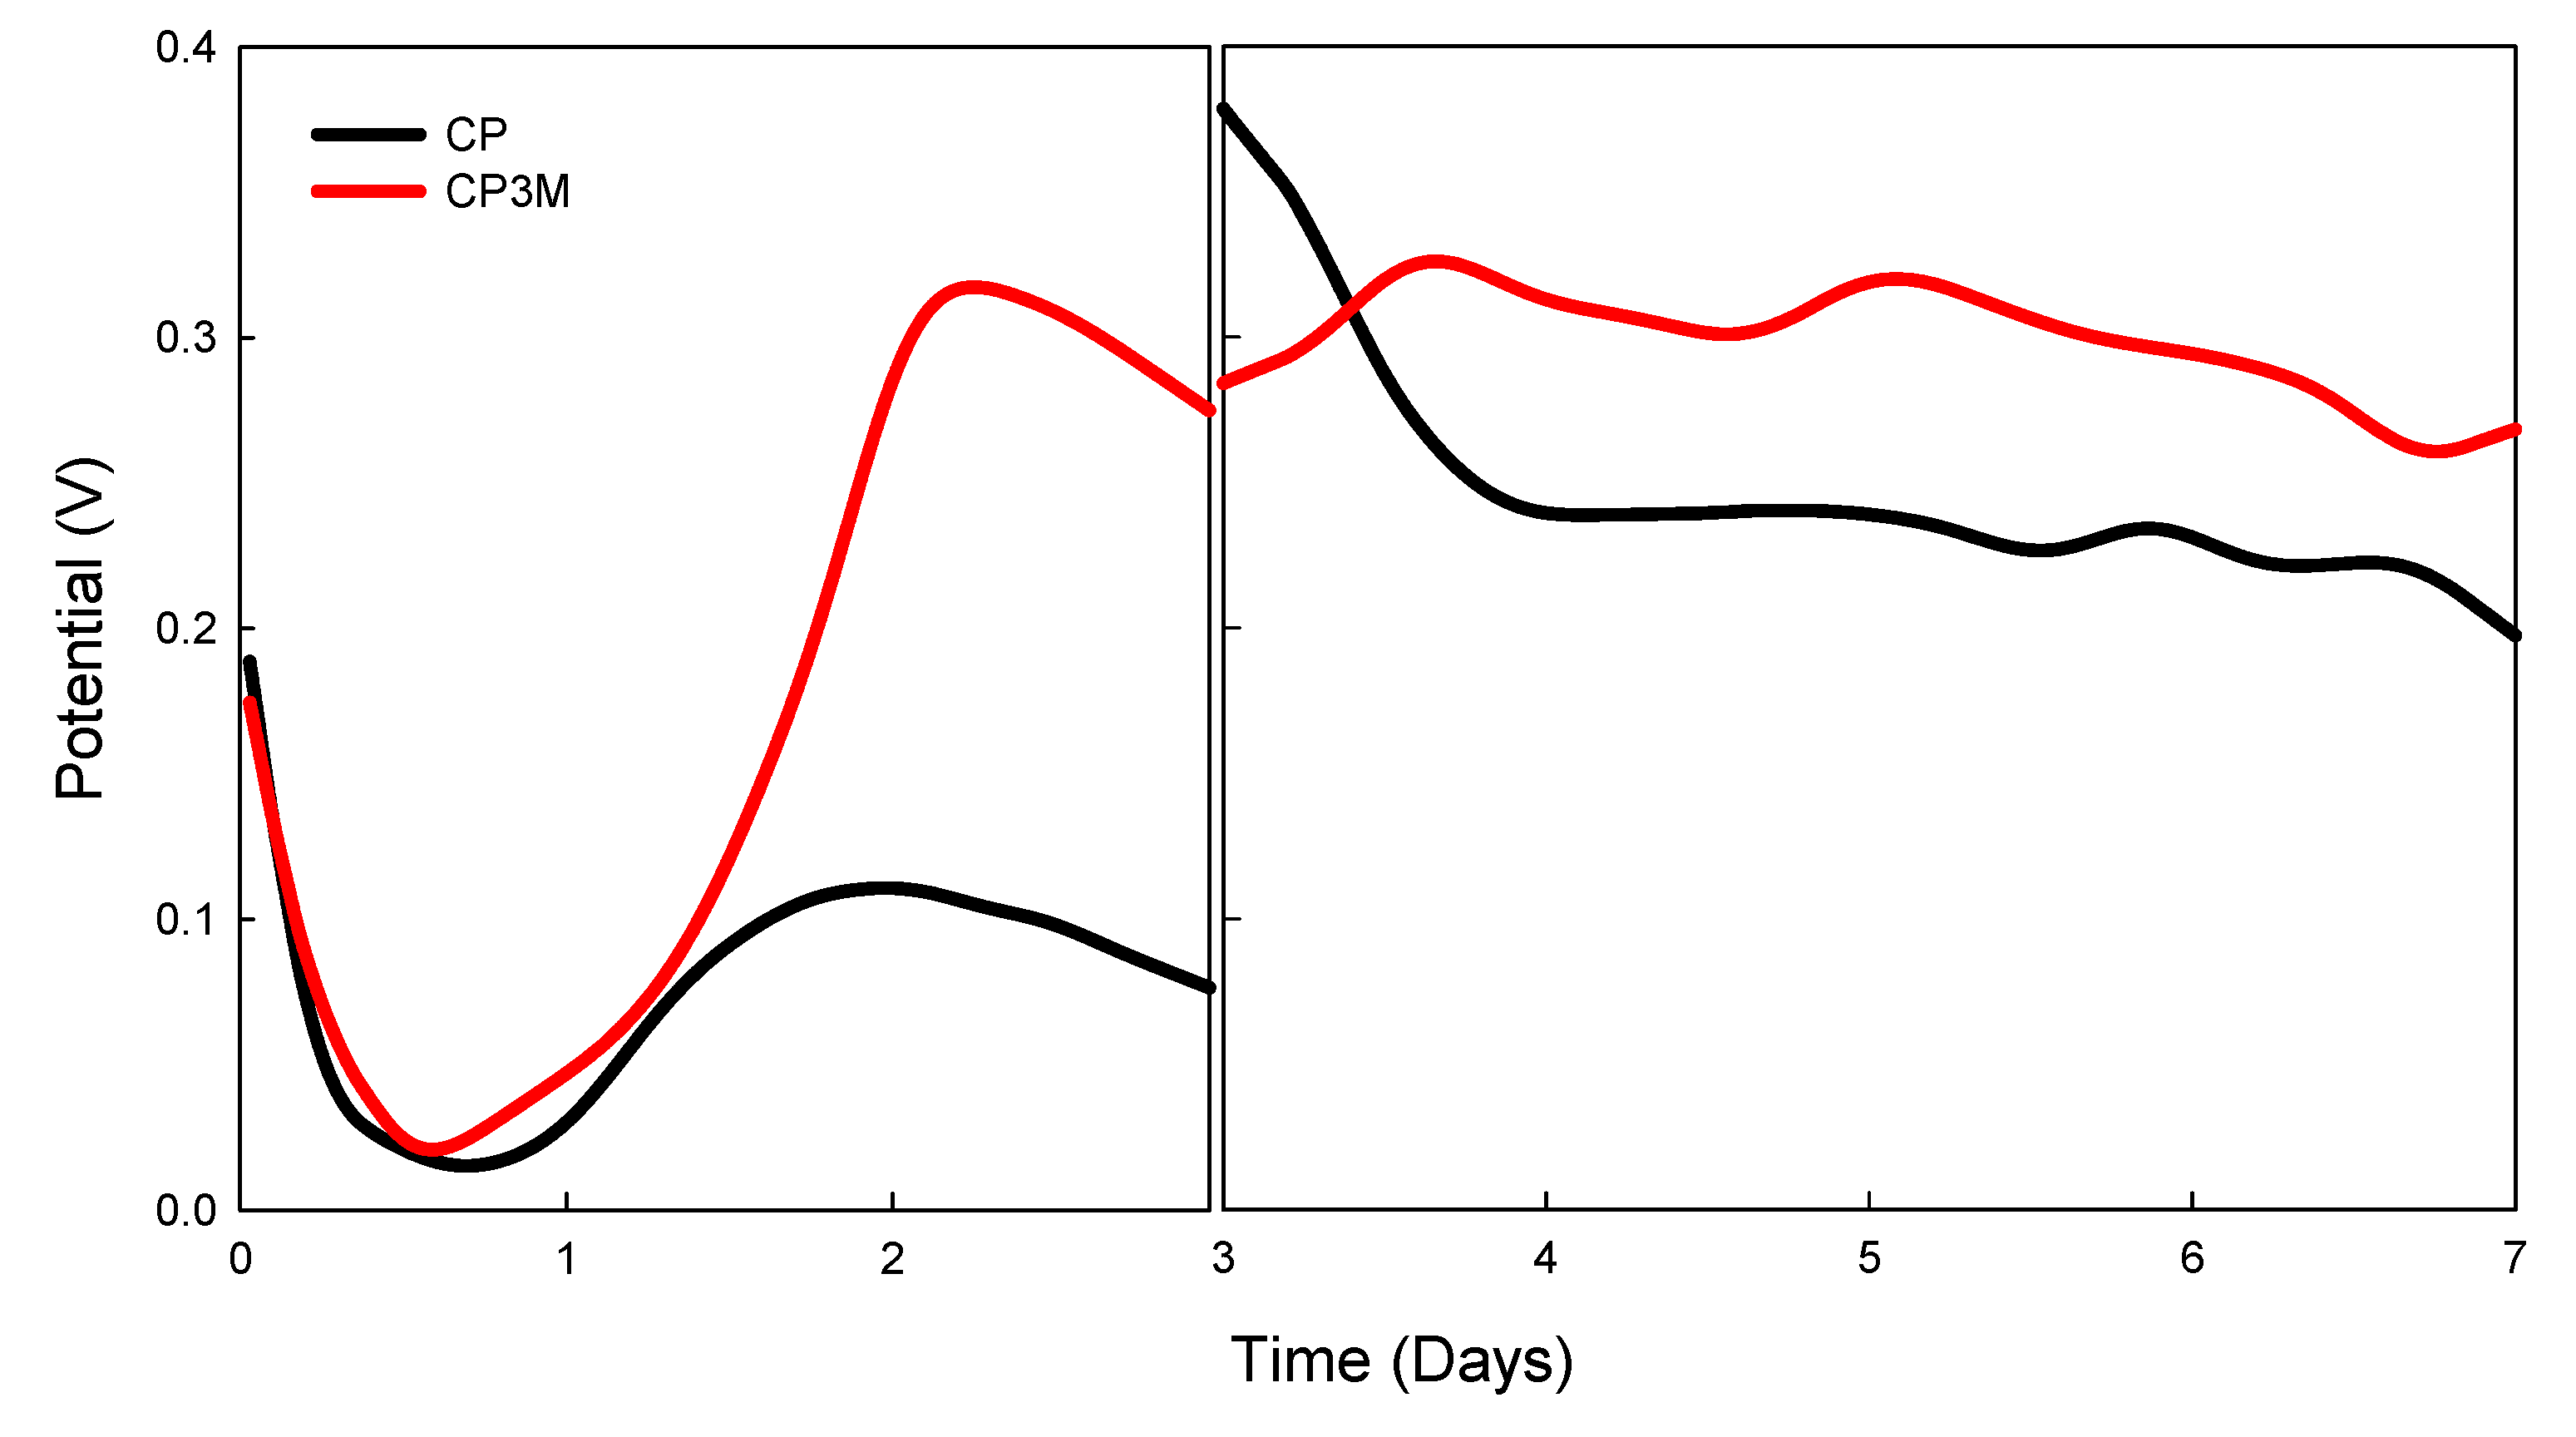
Figure 6.
Enzymatic electrode with potential, current with time. Enzyme concentration 5 (U / 10 μL), conductive polymer concentration 15 (mM), mediator concentration 10 (mM), buffer solution pH = 5. Anode: buffer solution PBS (containing glucose concentration 10 mM) Cathode: Ultrapure water. Black line: CP electrode, red line: CP3M electrode.
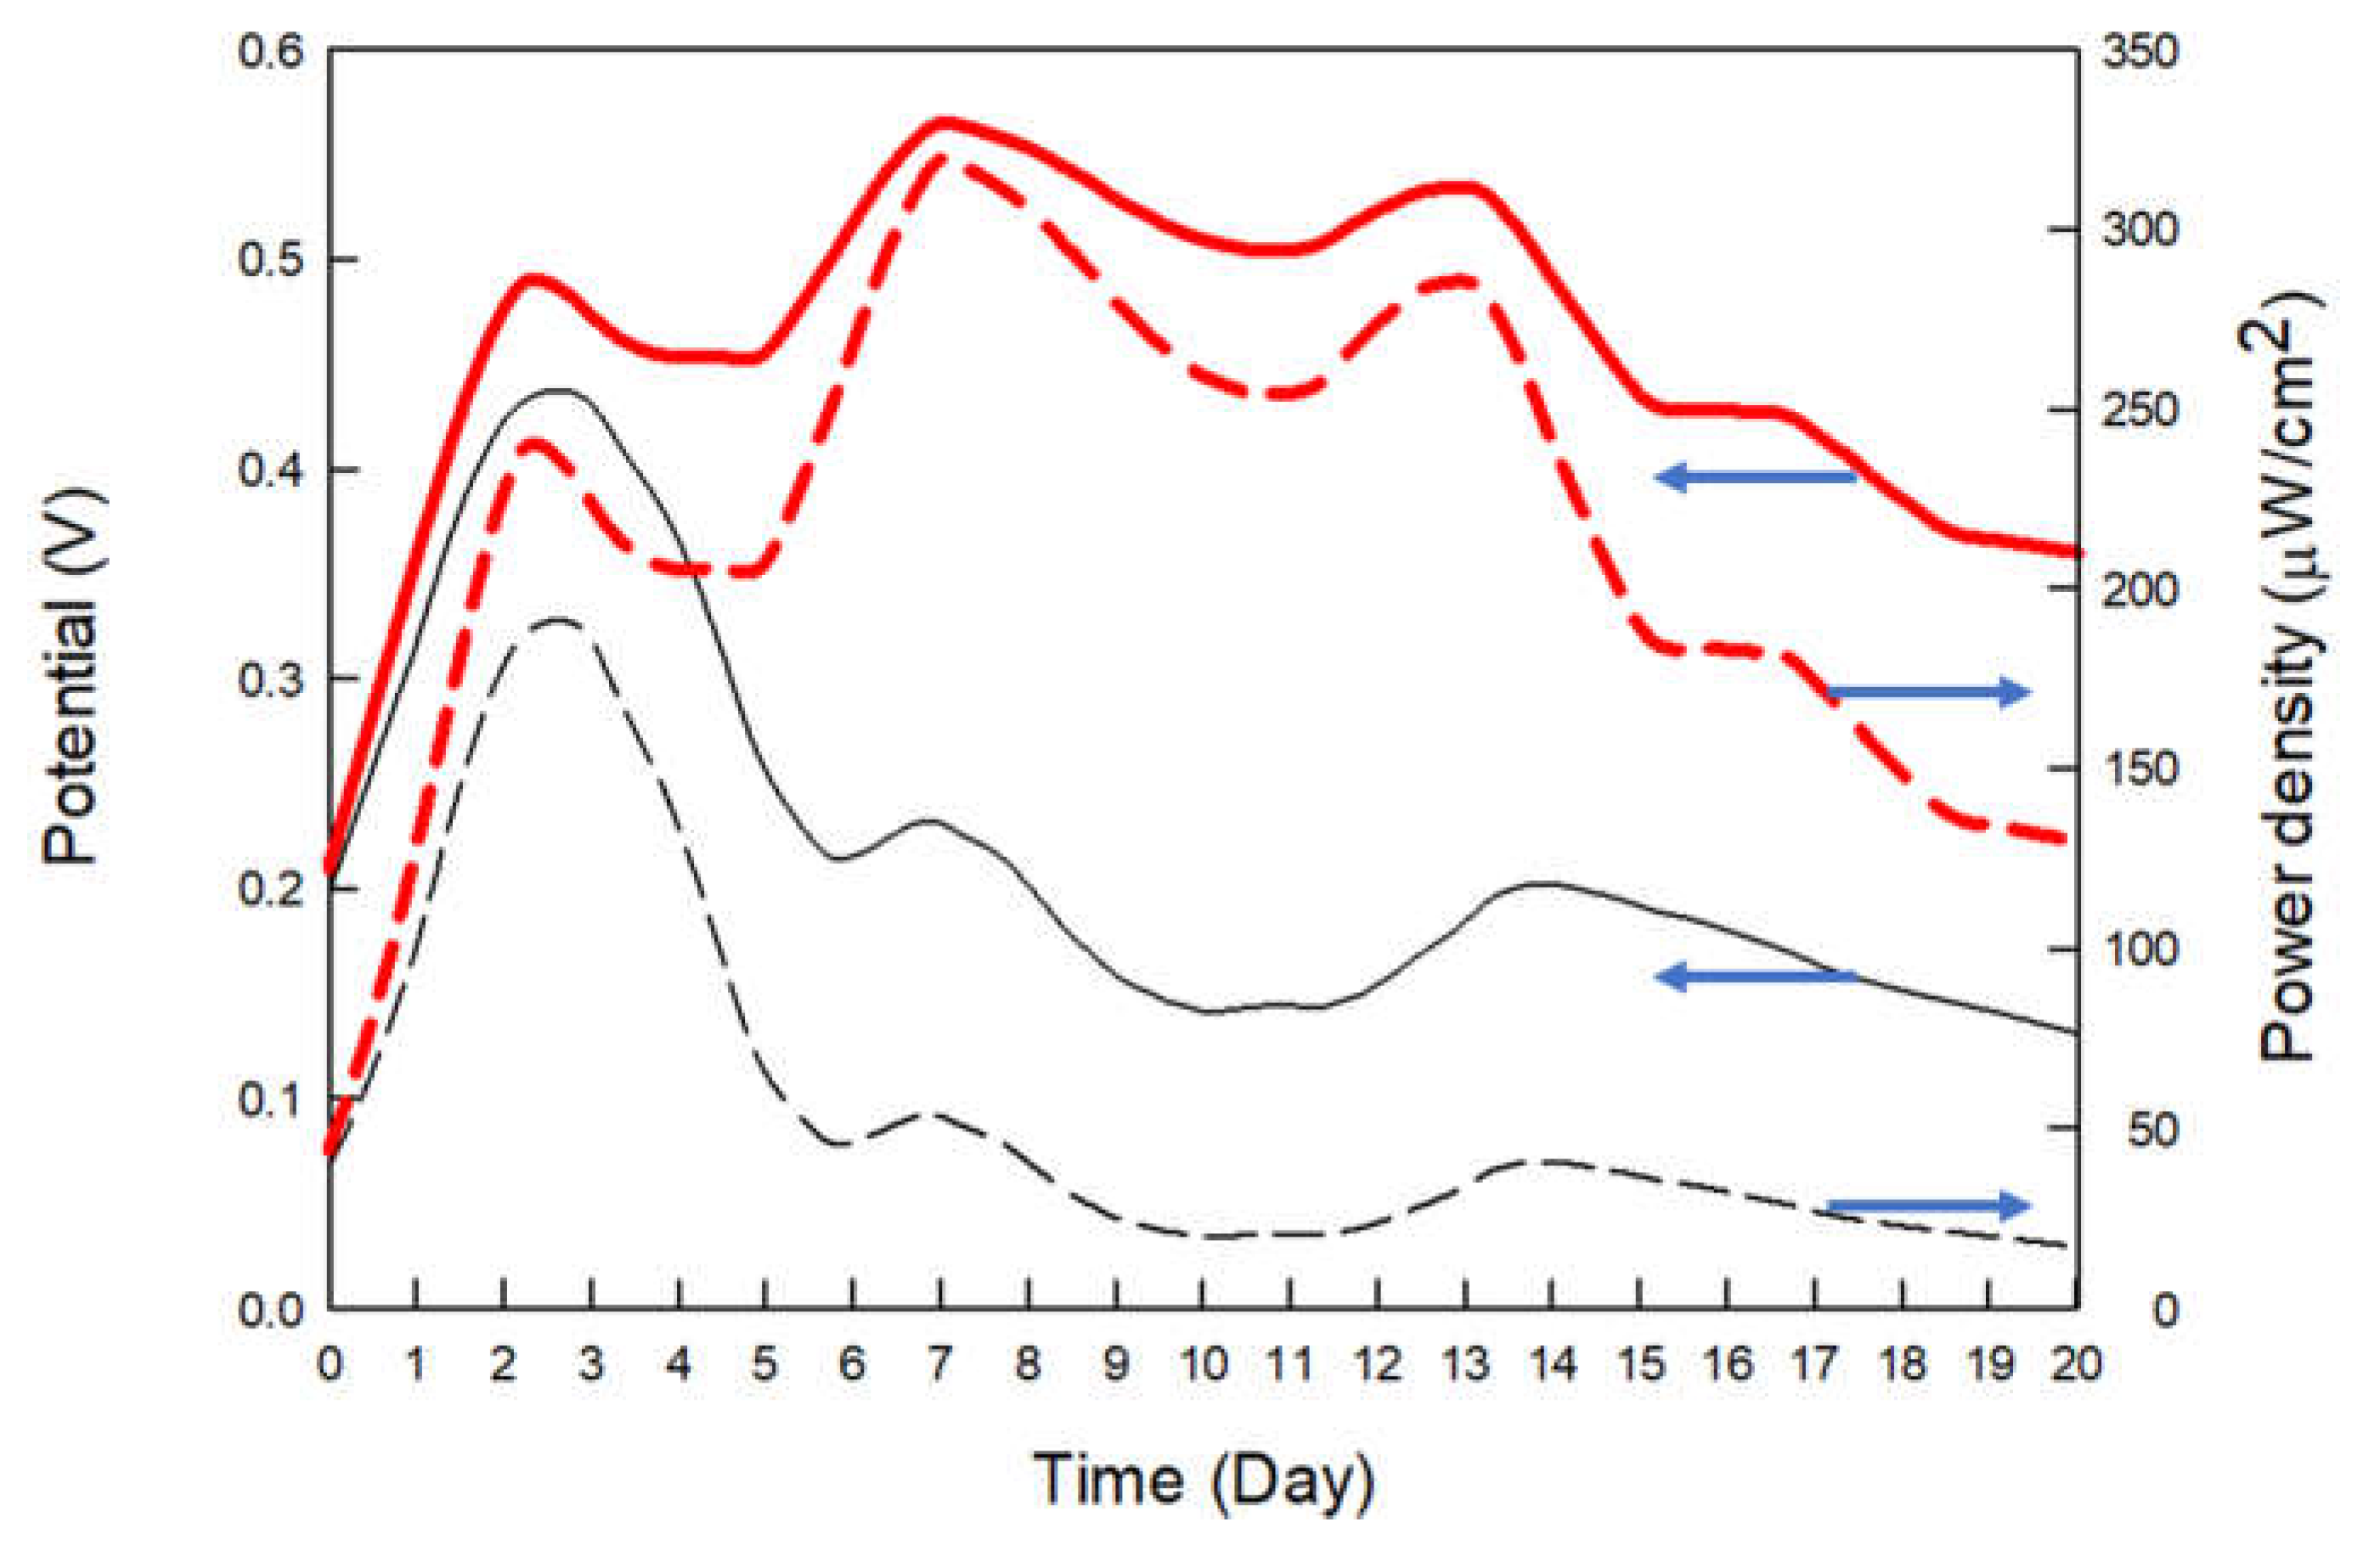
Figure 7.
Electrode construction for (a) CP electrode and (b) CP3M electrode.
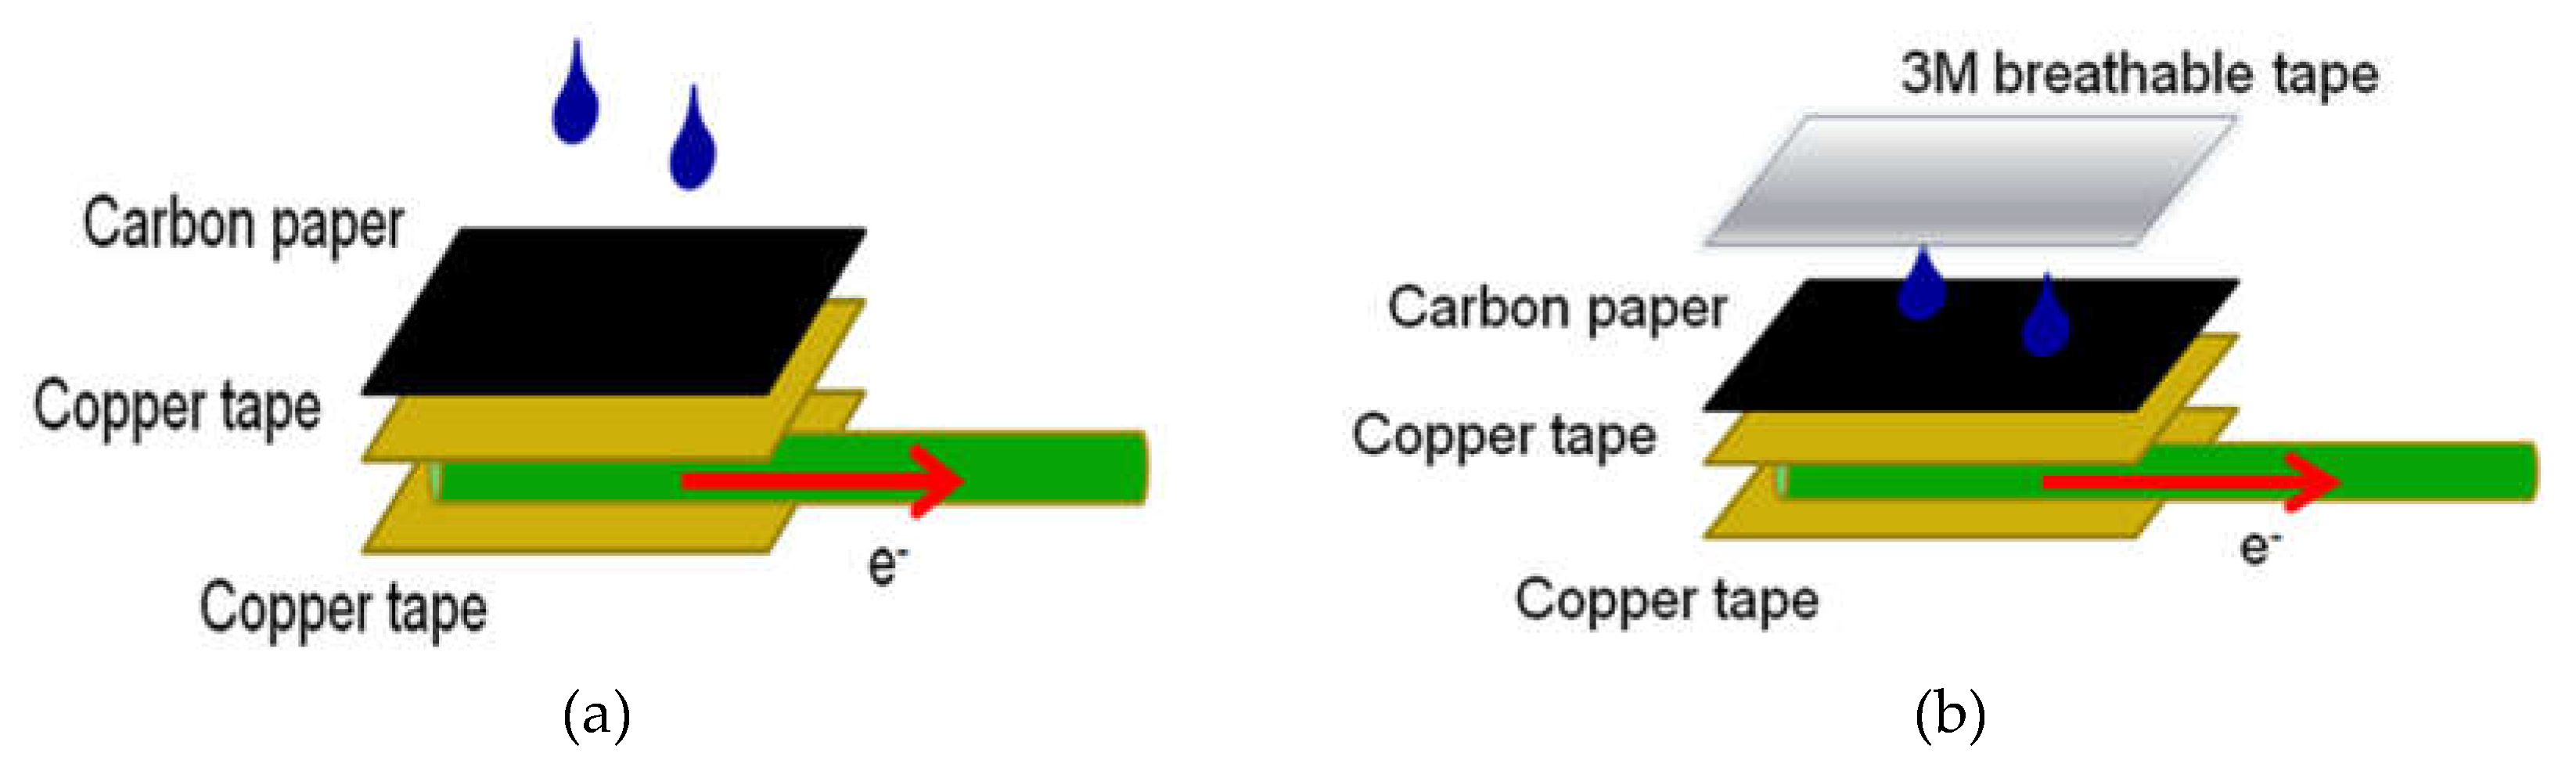
Figure 8.
Structure of enzyme-based biofuel cell.
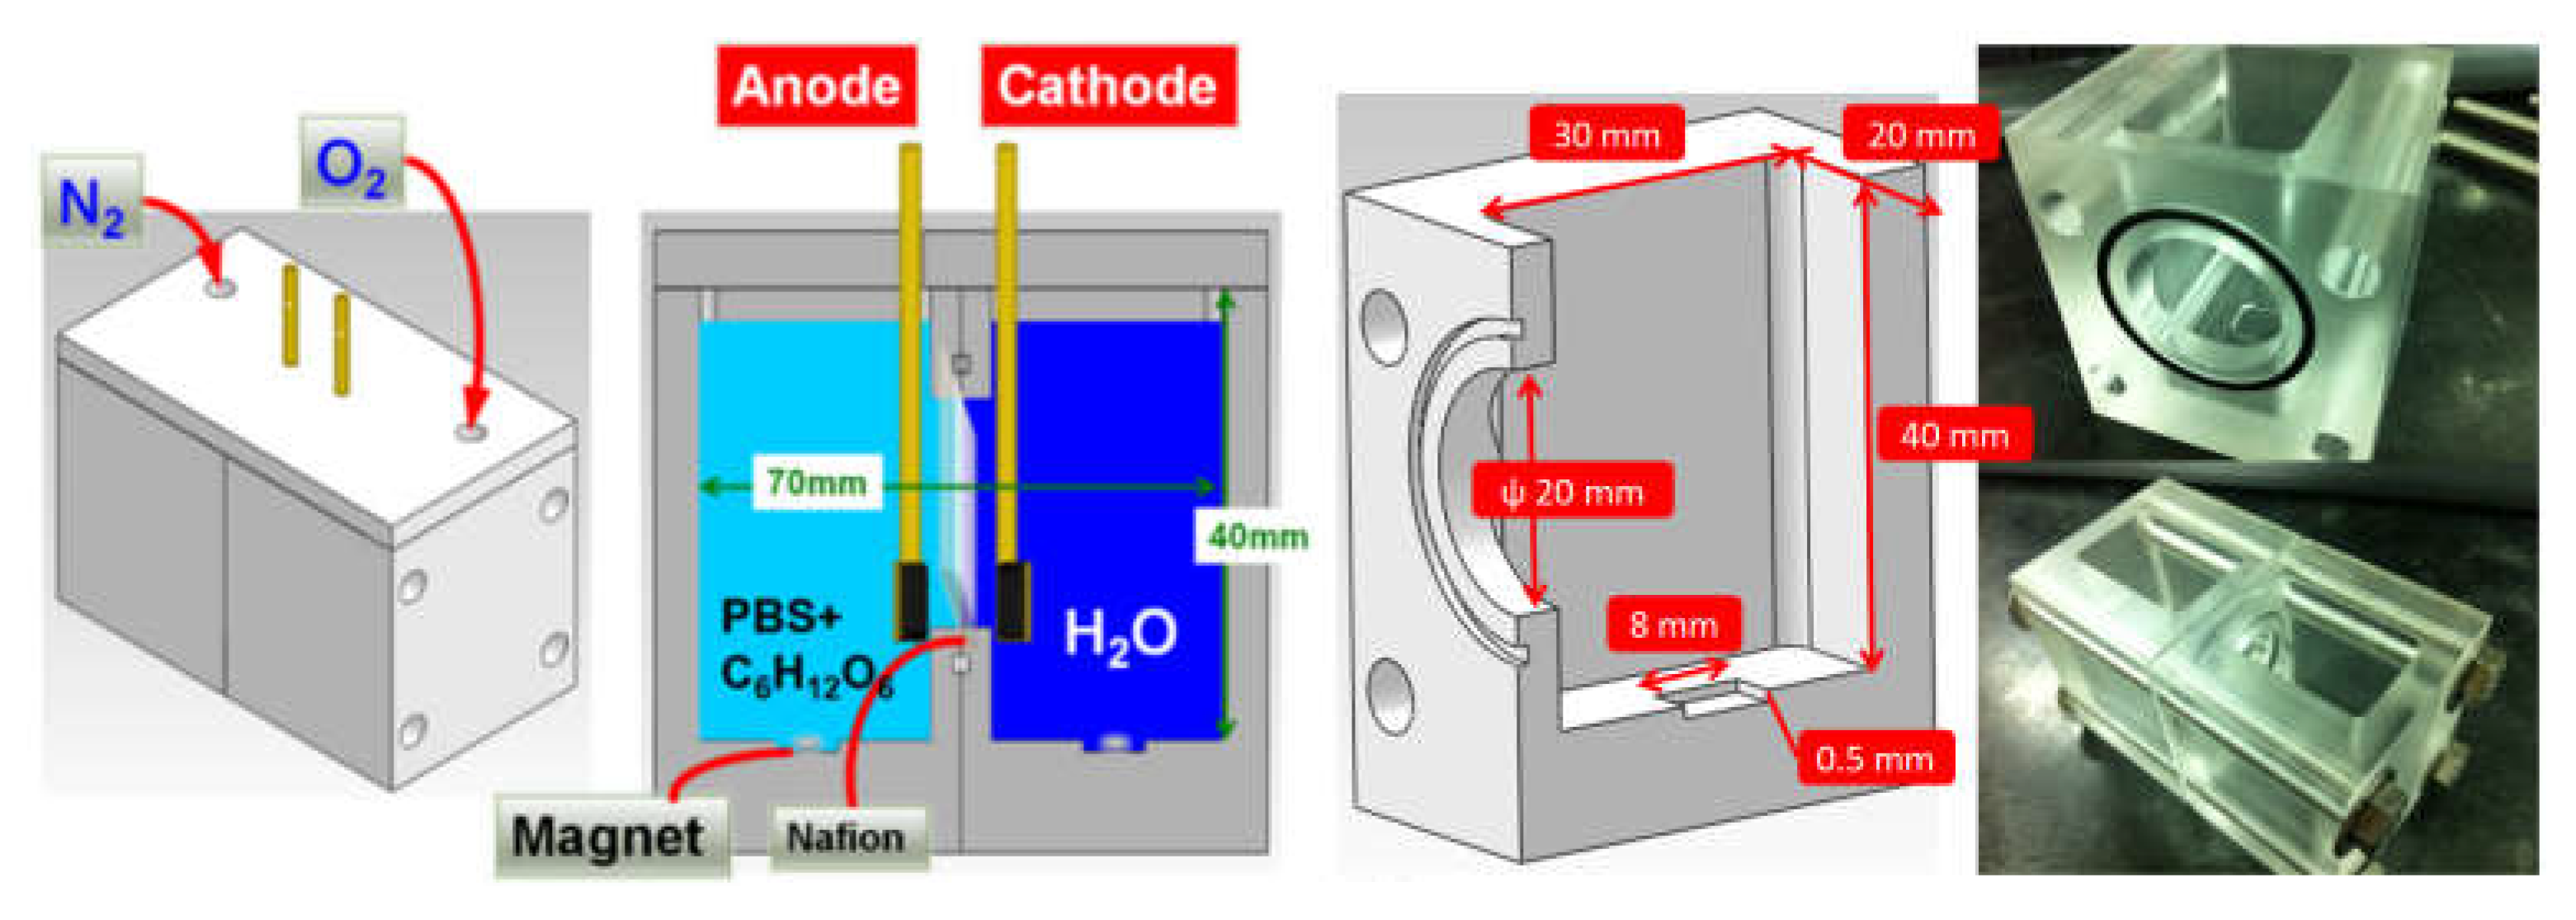
Table 1.
Comparison of electrode polarization peaks under different polymers and pH.
| Current | PPy5b | PPy6 | PPy7 | PANI5 | PANI6 | PANI7 |
|---|---|---|---|---|---|---|
| ipa(A) | 2.42×10⁻³ | 2.49×10⁻³ | 2.36×10⁻³ | 2.34×10⁻³ | 2.51×10⁻³ | 1.94×10⁻³ |
| ipc(A) | -2.23×10⁻³ | -2.34×10⁻³ | -2×10⁻³ | -1.45×10⁻³ | -1.72×10⁻³ | -1.01×10⁻³ |
| △ia | 7.8% | 6% | 15.2% | 38% | 31.4% | 47.9% |
a△i, ipa: anodic peak current , ipc: cathodic peak current; b The number indicates the pH value.
Table 5.
Comparison of two kinds of electrode production of enzyme fuel cell.
| electrode | Response time | Voltage (V) | Power density (μW/cm2) |
|---|---|---|---|
| CP | excellent | 0.24 | 57.6 |
| CP3M | good | 0.57 | 324.9 |
Table 6.
Comparison of biofuel cells using glucose and laccase as the enzyme.
| System (oxidation/ reduction) |
Enzyme (anode/ cathode) |
Concentration (mM) (anode/ cathode) |
Electrode | Electrolyte | Potential (V) |
Power (W/cm2) |
Time(hr) | Reference |
|---|---|---|---|---|---|---|---|---|
| Glucose/O2 | GOx/LAc | 10/10 | Graphite disc electrodes with Os-complex | PBS, pH 4.4~7.4 |
0.3 pH4.4 0.4pH5.5 0.25pH7.4 |
10,40 and 16 (37℃) |
- - - | [19] |
| Glucose/O2 | GOx/LAc | 5/1 | Graphite electrode modified with CNT | PBS, pH 5.86 |
0.2 | 4.1 (20℃) |
- - - | [2] |
| Glucose/O2 | GOx/LAc | 10/10 | Carbon electrode modified with polypyrrole | PBS, pH 7.4 |
0.41 | 27 (37℃) |
144 | [20] |
| Glucose/O2 | GOx/LAc | 10/10 | Carbon fiber Electrodes with SWNT | PBS, pH 7.4 |
0.4 | 58 (25℃) |
50 | [21] |
| Glucose/O2 | GOx/LAc | 60/3 | Carbon fiber electrodes with CNT | PBS, pH 7.0 CBS,pH 5.0 |
0.65 | 45 (37℃) |
1 | [22] |
| Glucose/O2 | GOx/LAc | 3/3 | Au electrode 0.0314 cm2 | PBS, pH 7.0 Membrane -less | 0.46 | 0.442 (25℃) |
100 | [23] |
| Glucose/O2 | GOx/LAc | 10/5 | Gold electrode (10 mm length and 2 mm wide) | PBS, pH 7.0 CBS,pH 3.0 |
0.3 | 110 (23℃) |
- - - | [24] |
| Glucose/O2 | GOx/LAc | 5/5 | Au electrode | PBS, pH 6.0 | 0.226 | 178 (25℃) |
- - - | [25] |
| Glucose/O2 | GOx/LAc | 40/40 | Carbon paper | PBS, pH 7.0 CBS,pH 5.0 |
0.35 | 122.6 (37℃) |
100 | [6] |
| Glucose/O2 | GOx/LAc | 40/40 | Carbon paper covered with tape | PBS,pH 5.0 CBS,pH 5.0 |
0.57 | 324.9 (37℃) |
480 | This study |
Table 7.
Composition of GOx solution in the anode cell.
| No | GOx (U/10μL) | PPy (mM) | Fe(CN)63-(mM) | pH |
|---|---|---|---|---|
| A1 | 5 | 5 | 10 | 5 |
| A2 | 5 | 10 | 20 | 6 |
| A3 | 5 | 15 | 30 | 7 |
| A4 | 10 | 5 | 20 | 7 |
| A5 | 10 | 10 | 30 | 5 |
| A6 | 10 | 15 | 10 | 6 |
| A7 | 15 | 5 | 30 | 6 |
| A8 | 15 | 10 | 10 | 7 |
| A9 | 15 | 15 | 20 | 5 |
Table 8.
Composition of laccase solution in the cathode cell.
| No | Laccase (U/10μL) | PPy (mM) | ABTS(mM) | pH |
|---|---|---|---|---|
| C1 | 5 | 5 | 10 | 5 |
| C2 | 5 | 10 | 20 | 6 |
| C3 | 5 | 15 | 30 | 7 |
| C4 | 10 | 5 | 20 | 7 |
| C5 | 10 | 10 | 30 | 5 |
| C6 | 10 | 15 | 10 | 6 |
| C7 | 15 | 5 | 30 | 6 |
| C8 | 15 | 10 | 10 | 7 |
| C9 | 15 | 15 | 20 | 5 |
Disclaimer/Publisher’s Note: The statements, opinions and data contained in all publications are solely those of the individual author(s) and contributor(s) and not of MDPI and/or the editor(s). MDPI and/or the editor(s) disclaim responsibility for any injury to people or property resulting from any ideas, methods, instructions or products referred to in the content. |
© 2025 by the authors. Licensee MDPI, Basel, Switzerland. This article is an open access article distributed under the terms and conditions of the Creative Commons Attribution (CC BY) license (http://creativecommons.org/licenses/by/4.0/).
Copyright: This open access article is published under a Creative Commons CC BY 4.0 license, which permit the free download, distribution, and reuse, provided that the author and preprint are cited in any reuse.


