
Submitted:
26 January 2025
Posted:
27 January 2025
You are already at the latest version
Abstract
Developing metrics for quantifying the virulence of pathogens (e.g., viruses) is a historical and recently reinvigorated topic of research interest with both theoretical and practical applications in medical, industrial, and environmental microbiology. In the wake of several recent pandemics and outbreaks (e.g., COVID-19, Zika, Dengue, Avian Influenza), where multiple strains of a virus propagated through host populations, methods for assessing relative virulence (VR) between strains has re-emerged as a “hot topic”. Recent publications have considered metrics for determining VR that extend beyond the practice of calculating differences in maximum specific growth rates (mmax) from growth curves of a virus-infected hosts versus uninfected host controls. While some metrics appear best-suited for single-virus/single-host (SVSH) infections that feature canonical host growth with well-defined lag, exponential, stationary, and mortality phases, others may be more robust for infections exhibiting non-canonical infected host growth patterns. Regardless of the metric used, one feature that most approaches have in common is a focus on the exponential growth phase of the virus-host interaction (i.e., from late lag to early stationary phase). Often neglected is the back-half of the growth curve. Following a recent report introducing the Stacy-Ceballos Inhibition Index (ISC), a metric for quantifying relative virulence (VR) between viruses, we have turned our attention to the equally important parameter of relative resilience (RR) between hosts infected in SVSH infections. Although host resilience during a viral infection impacts the entire growth curve, RR has a particular biological significance during extinction (i.e., the mortality phase). Specifically, it is important to assess how long a host (or population) will remain viable post-infection. In this report, we argue that calculating RR using a modification of ISC provides a robust metric for comparisons between SVSH infections. Data from fusellovirus infections in Sulfolobales and bacteriophage infections in Mycobacteriales form the basis for applying this approach for quantifying host resilience.
Keywords:
resilience
; virulence
; sulfolobales
; mycobacteriales
; fusellovirus
; archaea
; bacteriophage
; Sulfolobus Spindle-shaped Virus
; Gordoniaceae
; Sulfolobaceae
1. Introduction
The emergence of pathogens (e.g., viruses) consisting of multiple strains, which may each impose different dynamics on host viability, prompts the need for a robust metric for quantifying relative virulence (VR). Multiple studies have offered metrics or indices to compare VR between different virus strains. With few exceptions, these studies focus on measures associated with changes in the exponential growth phase of the infected host.
Recently, we developed a method that weighs area-under-the-curve (AUC) between defined limits within exponential phase growth against peak growth (Nasymptote) to calculate an index of inhibition (ISC) for determining VR [1]. A subsequent study from another group suggested that an index based on the centroid of a limited AUC is a more robust metric [2]. Each method has its respective strengths and utility depending upon the nature of the infection dynamic. Both ignore the back-end of the growth curve - the mortality phase.
Indeed, mortality phase dynamics are almost universally neglected in reports on host-pathogen interactions [1,2,3,4,5,6]. This is surprising since the ability of a host or host population to persist during infection is critical to a holistic understanding of the infection dynamic. Assessing host resilience during mortality phase upon exposure to a stressor, such as a biological agent or toxin, is as critical as quantifying the magnitude of detriment levied on host growth during the exponential growth phase.
In industrial microbiology, quantifying cell viability in the presence of a stressor, such as the toxic effects of ethanol on yeast during fermentation [7], is essential for process optimization. Yet, rudimentary metrics like maximum specific extinction rate (i.e., νmax), are still used. In biomedical sciences Infectious Dose 50 (ID50) and Lethal Dose 50 (LD50) provide limited insight into resilience [8,9]. In vivo, ID50 is the dose of inoculum required to cause infection in 50% of the host population. In vitro, an equivalent measure, TCID50, is used to measure the concentration of infectious agent required to induce infection in 50% of cells (or tissue) under study [10]. For TCID50 either a biochemical marker or some detectable cytopathic effect (e.g., cell lysis, cell morphology conversion, multinucleation) is used to define when the host population is 50% infected. Although these metrics are useful when comparing resilience between hosts infected with highly virulent pathogens (e.g., ebolavirus), their utility is limited in many systems. For example, LD50, which is the dose of an agent required such that 50% of the population is eliminated, is dependent on cell death; yet, many viral infections are non-lytic and do not cause gross cell lysis [11,12]. Similarly, the robustness of ID50 is dependent upon a proven indicator of host infection; however, some viruses can switch between two or more replication strategies during the progression of an infection, while others show distinct dynamics between low-dose versus high-dose inoculations. Therefore, there are numerous cases where LD50, ID50, or TCID50 fail as a robust metric of resilience, especially prior to or after the 50% cut-off (Figure 1). To more accurately characterize relative virulence between viruses or relative resilience between hosts, it is necessary to consider other features of the host growth curve and to develop robust and informative metrics that are aligned with the observed physiology.
In this study, we argue that quantifying host resilience during a viral infection is as important as determining virus virulence. Extrapolating from wet lab data using two virus systems – fuselloviruses (Sulfolobus Spindle-shaped Viruses) of Saccharolobus sp. and bacteriophage (“Gordoniaphage”) of Gordonia sp., we develop metrics for assessing relative resilience (RR) between hosts when: (a) a given host is infected with different viruses in single-virus/single-host (SVSH) infections; or, (b) comparing responses of two different hosts infected using a single virus genotype in SVSH infections. With advances in high-throughput sequencing, proven bioinformatics workflows, and the availability of robust metrics for quantifying resilience (and virulence), there exists an opportunity to relate physiological phenomena to the underlying -omics substrates driving virus-host interactions.
2. Materials and Methods
2.1. Host Cultures
2.1.1. Saccharolobus Solfataricus Strain P2
Cultures of S. solfataricus strain P2 (DSM1617) were cultured as previously described [11,13]. In brief, stocks of S. solfataricus strain P2 stored at −80°C were partially thawed on ice. 10–20 μl of stock was added to a 20 ml glass test tube containing 10 ml of 1X Yeast-Sucrose (YS) media [11,13,14] at room temperature (RT). Test tubes were placed in a rack fixed within an incubator-shaker and incubated overnight at 78°C and 90 RPM of shaking. Once cultures reached an optical density (OD600nm) of ~0.6, 3.0 mL of cell suspension was inoculated into 300 mL of pre-heated fresh 1X YS media in a 1L baffled Erlenmeyer flask. Scaled-up cultures were, again, incubated at 78°C and 90 RPM of shaking until reaching an OD600nm = 0.08. For each trial, 10–300ml cultures in 1L flasks were prepared (5X uninfected control and 5X infected replicates). These cultures were then used in infection assays (see section 2.3).
2.1.2. Gordonia terrae Strain CAG3
Cultures of Gordonia terrae CAG3, a derivative lab strain of G. terrae strain 3612 (ATCC 25594) were cultured as previously described [15]. In brief, G. terrae CAG3 stored at -80°C was plated on peptone-yeast-calcium (PYCa) agar [15,16] using a streak method and incubated at 30°C for 96 h. Single colony isolates were selected and used to inoculate 200 ml of PYCa broth in a 1 L baffled Erlenmeyer flask, which were incubated at 30°C for 96 h with 250 RPM of shaking. Cell density was determined by serial dilution and spread plating on PYCa plates [17,18].
2.2. Culture and Titering of Viruses
2.2.1. Sulfolobus Spindle-Shaped Viruses
S. solfataricus strain Gθ is a laboratory strain that is susceptible to multiple strains of the Sulfolobus Spindle-shaped Virus (SSV), including SSV1 and SSV8. S. solfataricus strain Gθ is used to propagate SSVs for infection assays. Stocks of S. solfataricus strain Gθ infected with SSV1 and S. solfataricus strain Gθ infected with SSV8 were individually prepared as described for Saccharolobus solfataricus strain P2 (see section 2.1.1. above). Upon reaching an OD600nm of 0.6, 300ml of culture was harvested and subsequently centrifuged for 20 min at 6000 RPM to separate cell mass from virus (Sorvall RT Legend Centrifuge, Fiberlite fixed-angle rotor; ThermoFisher, Pittsburgh, PA). The virus-containing supernatant was decanted and filtered through a 0.45 μm filter to remove any residual cell debris. The filtrate was then concentrated to ∼2.0 mL using a Centricon Plus-70 spin concentration cup assembly (Millipore Corp., Billerica, MA, USA). Ten 100μl aliquots of virus suspension were prepared as working stocks. The remaining 1 ml of virus concentrate is stored in 10% glycerol at −80°C to archive and for future use. Working virus stocks were stored at 4°C and used as inoculum for infection assays within 2-3 weeks of preparation. For longer-term storage, working stocks were stored at −80°C in 10% glycerol to mitigate degradation. Serial dilution plaque assays were performed to quantify virus titer as previously described [11,13,19]. Transmission electron microscopy (TEM) was used to confirm the presence of virions as previously described [11,19].
2.2.2. Gordoniaphage
Bacteriophage of G. terrae strain CAG3 was propagated through double-layer PYCa agar plaque plates [15,20,21]. Plates exhibiting significant lysing of the host lawn (i.e., webbed plaque plates) were flooded with bacteriophage buffer solution [20,21] and incubated at room temperature for 8 h. Following incubation, the lysate was collected and filtered through a 0.22 μm PES filter (Millipore, USA) to remove residual cell debris. The resulting lysate containing bacteriophage in suspension was titered using serial dilution of double-layer PYCa agar plaque assays on G. terrae strain CAG3 lawns [15]. After titering, lysate was stored at 4°C for subsequent use in infection assays.
2.3. Infection Assays
2.3.1. S. solfataricus Strain P2 - Sulfolobus Spindle-Shaped Virus (SSV) Infection Assays
Seed cultures of S. solfataricus strain P2 (DSM1617) were prepared. Using 25 ml glass test tubes, 100 μl of cell suspension at ~3 x 10⁸ cells/ml was pipetted into 10 ml of YS media at room temperature. Test tubes were covered with aluminum foil and then incubated at 78°C with 90 RPM of shaking until the seed culture density reached an OD600nm of 0.6. Subsequently, ten (10) parallel cultures containing 300ml of media prewarmed to 78°C in 1L baffled Erlenmeyer flasks were initiated by adding 1 ml of seed culture at OD600nm = 0.6. Flasks were then allowed to incubate at 78°C with 90 RPM of shaking until the upscaled cultures reached an OD600nm of 0.2. If selected flasks had higher or lower cell density, then these were corrected to OD600nm = 0.2 via dilution with prewarmed media or by mixing higher concentration cultures with lower concentration cultures. Once all ten cultures were adjusted to 300ml and an OD600nm = 0.2, five were inoculated with fusellovirus from working stocks in a volume calculated to produce a multiplicity of infection (MOI) of 0.5. The other five flasks served as uninfected controls. All flasks were incubated at 78°C with 90 RPM of shaking. OD600nm readings were taken every 6 h from all ten flasks and recorded.
2.3.2. G. terrae CA3 - Gordoniaphage Infection Assays
Liquid cultures of G. terrae CAG3 were diluted in 2X PYC broth to a cell density of 2.0 x 10⁶ cells/ml. Stock bacteriophage solution was diluted to 1 x 10⁶ pfu/ml using bacteriophage buffer solution. For infections, 120 ml culture volumes of host-bacteriophage mixtures were prepared by mixing 60 ml of the G. terrae CAG3 culture with an equal volume of bacteriophage suspension in a 250 ml baffled Erlenmeyer flask with venting. Negative control (i.e., uninfected host) cultures were prepared by mixing 60 ml of G. terrae CAG3 culture with an equal volume of the buffer solution. Cultures were incubated at 30°C with 250 RPM of shaking for up to 304 hours post-infection (hpi). Beginning at 16 hpi, a 1.2 ml sample was taken from each flask every 8 h for cell density determination. Cell density was determined by adding 150 μl into microplate wells and taking an OD600nm reading using an absorbance spectrometer (Spark20M, Tecan Life Sciences; Mannedorf, Switzerland) [22,23].
2.4. Data Analyses
2.4.1. Growth Curve Data Curation and Extrapolation
Using an Eppendorf Model 6131 biophotometer (Thermo Fisher Scientific, California, USA), 600 nm incident light was used to measure optical density (OD600nm) through a 1 cm wide transparent cuvette containing 1 ml of cell culture sampled from larger-scale incubating cultures (e.g., 120 ml – 300 ml). Samples were taken at regular intervals (e.g., every 6 h or 8 h). Sampling intervals were selected based on the doubling time of uninfected host growth. These readily obtainable absorbance readings serve as a proxy for more direct (and typically more laborious) measures of cell density (e.g., cell counts via hemacytometry). OD600nm data were plotted as a function of time for replicates (e.g., 3X) uninfected control cultures as well as for the virus-infected host cultures (also in 3X replicates). For select datasets, wet lab absorbance data were complemented by computer-generated extrapolations to either: (a) generate a hypothetical infection pattern with a purposeful change in virulence (e.g., φR2); or, (b) to demonstrate different potential outcomes to mortality phase profiles during extinction. Extrapolated datasets were used to test the robustness of metrics and predictive power of mathematical modeling strategies. Wet lab data versus extrapolated computer-generated data are differentiated within the text and figure legends.
2.4.2. Maximum Specific Growth and Extinction Rates
Values for maximum specific growth rate (μmax) and maximum specific extinction rate (νmax) were calculated as the slope of the line tangent to the inflection point on the exponential growth phase or decline phase of the growth curves, respectively [24,25]. For both multi-modal growth profiles and growth profiles that do not exhibit canonical exponential growth or mortality dynamics, biologically meaningful values for μmax and νmax were not determined. In brief, maximum specific growth rate was calculated as previously described [24,25]:
Similarly, maximum specific extinction rate, νmax, was calculated as:
2.4.3. Relative Resilience (RR) Calculations
Several approaches for calculating a value for and comparing relative resilience (RR) of virus-infected hosts were undertaken. In short, two main methods were used: a Stacy-Ceballos Inhibition Index (ISC)-based approach [D]; and a Centroid Index (CI)-based approach [2]. In select cases, both methods were used to compare metric robustness. Application of these methods to assess RR values based on dynamics of the exponential growth phase, extinction phase, or over the entirety of the growth curves forms the based on the arguments made regarding the utility of different approaches. For canonical growth profiles, RR could be calculated as the multiplicative inverse or “reciprocal” of VR [1] or CI [2], which are alternative metrics for quantifying virulence (or relative virulence) from virus-infected host growth data. In brief,
where VR is calculated as follows:
or,
{Note: A typographical error is corrected from the original paper [D] in equation 6a above; specifically, (ti+1 + ti) has been corrected to (ti+1 – ti)}.
ISC is calculated as follows:
where PImax is given by,
and PIAUC on non-log transformed cell density data is given by,
or
AUC is calculated by:
Code is available online at https://github.com/eichristenson/Stacy-Ceballos-Index as an opens source tool for VR and https://github.com/SocheataHour/Relative_Resilience.git for RR.
2.4.4. Relative Resilience Using Centroid Index (CI)
Centroid Index (CI)-based approach to calculating relative resilience (RR) is based on taking the reciprocal of CI as shown [2]:
The Centroid_Index_Calculator software files for Windows and MacOS are deposited into Zenodo and are available at https://doi.org/10.5281/zenodo.11137800.
3. Results
3.1. Conventional Metrics are inadequate for Quantifying Relative Resilence (RR)
3.1.1. LD50, TCID50, and ID50 Fail as Metrics for Assessing Resilience in Virus-Host Systems
There are multiple measures that have been used to assess host resilience to a toxic or infectious agent. Lethal Dose 50 (LD50) is the dose of an agent required such that 50% of the population is eliminated [26]. In vitro, Tissue Culture Infectious Dose (TCID50) is the inoculum concentration (i.e., number of infectious agents) required to cause infection in 50% of the host population under investigation [27]. In vivo, Infectious Dose 50 (ID50), also known as median infectious dose, is the inoculum required to cause infection in 50% of the host population after a defined time period [28]. Minimum Infectious Dose (MIN) is the minimum number of infectious agents required to cause illness [29]. These measures provide limited information regarding host resilience. An organism that requires a higher dose of a toxic agent to reach the 50% cut-off point may be considered more resilient than a host that succumbs to a weaker, lower dose. Relative Resilience (RR) may also be assessed when a host organism is challenged by two (or more) different pathogens (e.g., viruses).
When comparing RR of a host infected in single-host/single-virus (SHSV) infections to two different viruses, the host will have a higher RR to the virus that requires a higher inoculum (e.g., greater number of infectious virus particles) to reach the 50% cut-off (Figure 1A). However, these measures fail when replication dynamics differ between virus-host pairs. If a host responds to two different viruses in SHSV infections by reaching the 50% cut-off point at the same inoculum concentration but then the remaining individuals within the host population respond differently with one succumbing rapidly (Figure 1B, blue line) while the other exhibits a delayed extinction beyond the 50% cut-off (Figure 1B, red line), then LD50, TCID50, and ID50 measures do not adequately describe host resilience. These metrics would suggest that the host has the same relative resilience to each virus when, in fact, the host is more resilient when subjected to infection by virus 2 (Figure 1B, red line).
3.1.2. Log Growth Phase Dynamics Provide Limited Information About Host Resilience
Indeed, growth curve profiles can vary significantly between different virus-host pairings. Among the most divergent growth profiles are those between an organism that is infected with a non-lytic virus versus one that is infected with a lytic virus.
Sulfolobus Spindle-shaped Virus 8 (SSV8) is known to be a non-lytic replicator that blebs virions from the host cell membrane as a form of viral egress rather than causing gross cell lysis [11]. Multiple species and geographic variants of the family Sulfolobaceae that serve as permissive hosts to SSV8 exhibit archetypal non-lytic replication (Figure 2A). However, when these same hosts are subjected to infection with SSV9, an isolate from geothermal springs in Kamchatka, Russia, a distinct growth profile emerges (Figure 2B) suggesting lytic replication [9]. Not only are these growth curves distinct but it can be concluded that under equivalent multiplicity of infection (MOI), SSV9 is more virulent on these Sulfolobales hosts, than SSV8. Considering these data in terms of host resilience, it can be concluded without need of a robust metric that all three hosts are more resilient during infection by SSV8 than SSV9 (i.e., RRSSV8 >> RRSSV9). Aligned with the bulk of the published literature, virulence and resilience are determine by dynamics occurring from the lag phage through late exponential growth. (However, see section 3.3., below).
3.2. Calculating Resilience as the Reciprocal of Virulence is Limited
3.2.1. Relative Resilience May Be Described as the Reciprocal of Relative Virulence
When considering metrics for RR, it is tempting to conclude that resilience is simply the reciprocal of virulence (i.e., RR = 1/VR). For the simplest cases, such as growth profiles with canonical non-lytic infection dynamics (Figure 3A), determining VR first and then calculating RR as 1/VR may prove useful. However, as stated above, virus-host growth curve profiles and underlying virus replication dynamics vary greatly by system.
There are even cases where viral infection appears to enhance host growth during the lag through exponential phases of the virus-host interaction. This is counter-intuitive since viruses are generally described as parasitic, meaning that they cause detriment to host viability. However, some viruses, including at least one bacteriophage of the host Gordonia terrae [15,20] can exhibit this type of dynamic (Figure 3B). Under these conditions and others, calculating RR as 1/VR fails to capture the essence of the dynamic and proves not to be a reliable metric for RR.
3.2.2. Calculating RR as the Reciprocal of VR Is Not Reliable for Select Infection Profiles
As illustrated in Table 1, using an ISC-based calculation for VR [1] shows that SSV8 is exhibits a greater than three-fold level of virulence on host S. solfataricus strain P2 than SSV1. SSV8 has a VR of 27.039, while SSV1 has a VR of 8.457 on S. solfataricus strain P2 (Table 1, column 2). By calculating RR as 1/VR, RRSV8 for S. solfataricus strain P2 infected with SSV8 is 0.0369, while RRSV1 for the host infected with SSV1 is 0.118 (Table 1, column 3). These calculations show a three-fold increase in resilience when the host is infected with SSV1 versus SSV8 (i.e., RRSV1 >> RRSV8).
However, when applying the same analytical workflow to the Gordoniaphage data, the metric fails. Specifically, φR1 (a.k.a., phage RUTHY) is a bacteriophage isolate that appears to enhance growth of host Gordonia terrae CAG3 from late lag phase through late log phase (Figure 3B, blue line). A computer-generated attenuated strain φR2 enhances host growth but to a lesser extent (Figure 3B, red line). Apart from the semantic problem that there is no need for resilience against an agent that is enhancing growth, calculating RR as 1/VR fails to provide an interpretable conclusion. Specifically, VR for φR1 is 54.84 and VR for φR2 is 45.67 indicating that VRφR1 > VRφR2 (Table 1, column 2, red), which is clearly not the case. Calculating RR based on VR yields RRφR1 for the host at 0.018 and RRφR2 at 0.021 (Table 1, column 2, red), indicating RRφR2 > RRφR1 for the G. terrae CAG3, which is incorrect.
Although these two cases are selected to demonstrate the lack of robustness in using 1/VR to calculate RR, there are more subtle and less obvious situations in which this metric could fail. Notwithstanding being highly divergent cases of virus-host interaction profiles, both growth curves have a common feature that is problematic for robustly assessing RR. Specifically, it is noted that the above datasets and, indeed, the majority of pathogen-host data in the literature relies on analysis of the exponential growth phase of growth curves.
3.3. The Mortality Phase of a Host Growth Profile is Critical to Describing Resilience
3.3.1. Mortality Phase Dynamics Are as Critical as Log Phase Dynamics for Determining RR
Ignoring mortality phase dynamics when assessing the relative resilience of a host to infection by a set of pathogens is a conceptual flaw. Indeed, in pathogen-host interactions the mortality phase may comprise two-thirds (or more) of the complete interaction.
Moreover, traditional measures for assessing resilience such as maximum specific extinction rate (νmax) or similar metrics [7,8,9,28] are inadequate (Figure 4A and Table 2). These metrics lack robustness for the same reasons that maximuim specific growth rate (μmax) is limited in quantifying relative virulence [1].
To demonstrate the importance of mortality phase dynamics in growth curve analysis data from the Fuselloviridae-Sulfolobales system were re-analyzed using time-points from stationary to death phase (78-270 hpi). Both νmax and AUC were used to calculate RR (Table 2). Resilience as measured by νmax for S. solfataricus strain P2 infected with SSV1 versus the same host infected with SSV8 indicates that the slope of the line tangent to the inflection point is greater for SSV1-infected host than for SSV8-infected host. This implies that there is a sharper decline in host extinction for SSV1 than SSV8, which in turn suggests that the host is less resilient to SSV1 infection. We know this not to be the case. Thus, using νmax as a metric is inadequate. Note that the negative only indicates a declining rather than inclining slope, which could cause further confusion when using νmax as a metric for RR. However, when we use an AUC [1,11], ISC [1], or CI [2] based measure for RR, the correct relationship emerges. Specifically, for AUCSV1 there is an ~18% decrease over control, AUCSV8 ~38% decrease over control, which indicates that RRSV1 > RRSV8 (Table 2, column 3). The equates to an ~1.3 fold difference in RRSV1 > RRSV8, which is correct in terms of direction but may not be robust in terms of magnitude of difference. When resilience is calculated using either an ISC-based RR (or 1/CI-based measure), there is a greater than two-fold difference in relative resilience (Table 2, columns 4 and 6). This provides a magnitude of RR more aligned with other wet lab data (e.g., sizes of plaques or “halos” on plates). In other words, the interpretation would be that RRSV1 >> RRSV8, as previously shown [1,11].
3.3.2. Metrics Are More Robust When the Entire Curve Is Included in Resilience Calculations
Since neither VR nor RR are phenomena exclusive to the front-half or back-half of the infected host growth curve, a more robust approach is to calculate RR based on limits that extends through the entire curve unless there is a valid reason to limit the time interval (see section 3.4, below). Reanalysis of the same dataset from 0-270 hpi (Table 3) shows an approximate three-fold difference in RRSV1 versus RRSV8 for ISC-based calculations and an approximate two-fold difference for CI-based resilience. Again, the ISC-based calculation for RR shows the greatest magnitude of difference, which is more consistent with wet lab results that indicate that SSV8 exhibits a very strong effect on host growth [1,11].
3.4. Limitations and Limit Selection in Calculating Relative Resilience
3.4.1. Phase Shifts and Non-Canonical Growth Profiles in Virus-Host Interactions
Despite the robustness of ISC-based RR calculations for canonical virus infections in non-lytic and, in most cases, lytic systems, there are virus-host dynamics which still elude the presented mathematical approaches. One of the more common confounds is a major phase shift in host growth upon infection (Figure 5A). Both ISC and CI derived calculations for RR lack robustness and fail to accurately describe host resilience in these cases.
Indeed, for cases of significant phase shift, resilience based on interpreting AUC may suggest that host infected with virus 1 results in a larger host population than host infected with virus 2 (e.g., RRV1 > RRV2), while 1/AUC shows RRV1 ≈ RRV2 (Table 4, columns 1 and 2). Both ISC-based calculations and 1/CI suggest that RRV1 > RRV2 (Table 4, columns 4 and 6). These conclusions would be controversial (i.e., not robust) given that host infected with virus 2 actually persists in culture longer than host infected with virus 1 (i.e., RRV2 > RRV1).
This raises the issue of whether host resilience should be defined based on peak growth (i.e., maximum cell density) or longevity amidst infection. An evolutionary perspective would favor defining species longevity (versus early extinction) as key to host resilience. In short, metrics fail or lack robustness when there are significant phase shifts in the infected host growth profile or “crossing over” dynamics which may result in less growth (i.e., host cell density) but greater persistence or “host longevity”. Longevity would suggest greater species resilience from an ecological or evolutionary perspective.
For the case of viral-induced enhancement of host growth, another non-canonical dynamic, like that observed in select bacteriophage on Gordonia terrae CAG3 (Figure 5B), ISC-based RR fails by suggesting that the host infected with φR2 is more resilient than host infected with φR1 (Table 5, column 4). Resilience determined by 1/CI (Table 5, column 6) seems to offer a biologically meaningful result in terms of direction even if the accuracy of the magnitude of effect lacks robustness. Both cases, of course, requires semantics to be ignored since resilience is successful persistence in the presence of a challenge, which loses meaning when growth is enhanced.
3.4.2. Setting Limits of Integration to Capture Impacts of Virus Dynamics on Host Growth
Despite notable virus-host dynamics that confound otherwise robust measures of host resilience during viral infection and prior arguments in favor of basing calculations on the entirety of the virus-host growth dynamic (i.e., from lag through mortality phases), there is a reasonable argument for selecting limits of integration within a sub-domain of the complete dataset. Applying limits of integration to calculate a “local RR” may not only overcome some of the aforementioned confounds but may also offer biological insights not resolvable in a calculation based on the entire growth profile.
A host exhibiting two distinct growth profiles when infected with two different virus strains (e.g., virus 1 and virus 2) in SHSV infections can be evaluated using the methods previously described for calculating RR over the entirety of the growth curve (Figure 6). These RR calculations indicate that RRHV1 ≈ RRHV2 (Table 6, column 2). However, if “local” RR values are calculated using sub-domains of the overall infection dynamic, results offer biologically meaningful insights that are not captured by integration over the entire curve (Table 6, columns 3 and 4). Specifically, integrating between limits over an initial burst (Figure 6, lines a and b) indicate that RRV1 ≈ RRV2 – a result that is similar to integrating across the entire curve. However, when integrating across limits later in the virus-host dynamic (Figure 6, lines c and d), RR calculations indicate that RRV1 < RRV2, something that was not captured when integrating across the entire domain. Mindful that there is always a virus replication cycle underlying every host growth curve (but not typically presented), integrating between limits within sub-domains of the virus-infected host growth profile may be an indication of specific cellular and molecular mechanisms characteristic of the dynamic. For example, the increased RR for the host when infected with virus 2 later in the profile could be an indication of activation of a plasmid-based resistance factor [31] or a CRISPR/Cas mechanism [32,33,34,35].
For this particular dataset (Figure 6), other physiologically meaningful features are observed. First, both host cultures infected with virus 1 and virus 2, respectively, reach the same peak growth level (i.e., cell density) prior to the first burst event, indicating that the viruses have comparable detriment to host growth compared to the uninfected control (black line). However, the first burst event indicates the the host was less productive with respect to producing virions of virus 2 (red, dashed) than virions of virus 1 (blue dashed). This may have some relationship to the fact that while virus 1 causes a second burst event, the host appears to no longer lyse and release virions for virus 2 after the initial burst.
4. Discussion
As viral outbreaks and pandemic scale events continue to be problematic, including: coronaviruses (COVID), flaviviruses (Dengue virus), orthomyxoviruses (Flu viruses), paramyxoviruses (Respiratory Syncytial Viruses), arboviruses (Zika virus), potyviruses (Potato Virus Y), rhabdoviruses (coffee ringspot virus), and other animal or plant viruses, it has become increasingly important to address some of the major gaps in virology that prevent accurate predictions of parameters such as virulent strain emergence, time-course to attenuation, frequency of recombination (or reassortment) events, propensity for host species jump, and transmission rates. Having a robust set metrics for quantifying virus virulence and host resilience is an essential first step to meaningful parameterizing of mathematical models with predictive power to forecast such virus-host events.
Recently, we showed the inadequacy of using maximum specific growth rate (μmax) and area-under-the-curve (AUC) to quantify virulence [1]. In this study, we show that lethal dose 50 (LD50), Tissue Culture Infectious Dose 50 (TCID50), Infectious Dose 50 (ID50) and similar measures are also limited in quantifying virus virulence and host resilience. We also show that calculating maximum specific extinction rate (νmax) lacks robustness as a metric for host resilience. Using wet lab data and computer-generated extrapolations of wet lab data, we provide a series of virus-infected host growth profiles that are amenable to assessing relative resilience of a host amidst infection by different strains of virus.
4.1. The ISC-Based Relative Resilience (RR) Metric Is Generally Robust
Indeed, our wet lab data and modeling (i.e., computer-generated growth curves) demonstrate the usefulness of an ISC-based approach in calculating relative resilience (RR). For highly canonical non-lytic and lytic infections, RR may be calculated as the reciprocal of an ISC-based VR value (i.e., RR = 1/VR). We also argue that since the mortality phase can comprise a significant portion of the infection dynamic, the complete growth curve from lag phase through late mortality phase should be used to assess RR, whenever possible. Although many publications have offered measures of virulence and resilience using the exponential growth phase (i.e., lag phage-to-early stationary phase) portion of the curve, robust measures are best achieved by evaluating the entirety of the infected host curve. Even with long stationary phase, in batch cultures, there ultimately must be an extinction due to infection-by-nutrient load effects, resulting in nutrient depletion and cell death. [Note that other stressors such as shifts in pH and temperature also influence dynamics]. Thus, for the systems that we studied, the most robust metric for assessing host resilience to viral infection is an ISC-based RR (equations 5-10).
Nonetheless, there are select infection profiles that are not amenable to this approach. A few of these cases (e.g., phase shifts and viral-induced enhancement of host growth) may require a slightly different approach.
4.2. Integration Within Biologically Meaningful Limits
For any analysis of virus-infected host growth, it is prudent to recall that underlying the readily measured cell density values, which are used to generate host growth profiles, is a corresponding virus replication curve often comprised of distinct phases including: inoculation (i.e., absorption or binding), eclipse, burst or blebbing, and virus degradation. These overlap with the basic stages of the virus replication cycle: attachment, penetration, replication, assembly, and egress. Although we argue that robust metrics for calculating RR should be based on considering the entire host growth curve, there is also rationale for calculating RR values for sub-domains within the larger virus-host interaction dynamic. Specifically, for detailed assessment of host growth during viral infection at time-points corresponding to a particular viral replication stage or transitions between stages, it may be biologically meaningful to integrate between strategically selected limits to calculate a “local” RR value. This is also a highly valuable approach if there is a research objective to elucidate -omics substrates (e.g., transcriptomics, metabolomics, elementomics) that relate to the physiology featured during select intervals of the virus-host interaction. Not only does integration between limits of a sub-section of the infected host growth curve allow us to overcome some of the noted confounds (e.g., phase shift) but by mapping -omics to physiology, a more in depth understanding of how molecular substrates result in changes in resilience (or virulence) may also be achieved.
5. Conclusions
In summary, focusing on virus virulence and/or host resilience will depend upon the scientific question being addressed. Furthermore, the chosen metric to quantify RR (or VR) will depend on the nature of the specific virus-host system under study and its dynamics. For the experimental and computer-generated virus-infected host growth curves that were considered for this study, an ISC-based RR metric proved robust canonical lytic and non-lytic virus-host interactions. In general, it is prudent to base calculations on the entire growth curve; however, there are biologically-relevant reasons to integrate between select limits when calculating RR (or VR) across a sub-domain of the complete growth profile. This may be particularly useful when addressing questions about molecular mechanisms (e.g., -omics substrates) that may be driving physiological responses along intervals of interest in the virus-infected host growth curve.
Supplementary Materials
No supplementary materials provided.
Author Contributions
Author contirbutions are as follows: Conceptualization, R.M.C.; methodology, R.M.C., A.P., S.H., R.P..; software, S.H.; validation, R.M.C., S.Y.H. and S.H.; formal analysis, R.M.C., S.H.; investigation, R.M.C., S.H., A.P., S.Y.H., R.P.; resources, R.M.C., R.P..; data curation, S.H., A.P., S.Y.H.; writing—original draft preparation, R.M.C., S.H..; writing—review and editing, R.M.C., S.H., A.P., S.Y.H., R.P..; visualization, R.M.C..; supervision, R.M.C., R.P.; project administration, R.M.C..; funding acquisition, R.M.C.. All authors have read and agreed to the published version of the manuscript.
Funding
This research was funded by the U.S. National Science Foundation Division of Biological Infrastructure (NSF DBI award #2119968).
Data Availability Statement
The original contributions presented in this study are included in the article and/or supplementary material. Code may be found at https://github.com/eichristenson/Stacy-Ceballos-Index for VR and https://github.com/SocheataHour/Relative_Resilience.git for RR. Authors follow open source standards. Further inquiries can be directed to the corresponding author.
Acknowledgments
The authors acknowledge Mr. Enrique “Rick” Marroquin, Jr. and Ms. Xue “Yuki” Yang for their technical and administrative support in organizing data for this article.
Conflicts of Interest
The authors declare no conflicts of interest.
References
- Ceballos, R.M.; Stacy, C.L. Quantifying Relative Virulence: When μ Max Fails and AUC Alone Just Is Not Enough. J. Gen. Virol. 2021, 102. [Google Scholar] [CrossRef]
- Hosseini, N.; Chehreghani, M.; Moineau, S.; Charette, S.J. Centroid of the Bacterial Growth Curves: A Metric to Assess Phage Efficiency. Commun Biol 2024, 7, 673. [Google Scholar] [CrossRef] [PubMed]
- Hall, B.G.; Acar, H.; Nandipati, A.; Barlow, M. Growth Rates Made Easy. Mol. Biol. Evol. 2014, 31, 232–238. [Google Scholar] [CrossRef] [PubMed]
- Peleg, M.; Corradini, M.G. Microbial Growth Curves: What the Models Tell Us and What They Cannot. Crit. Rev. Food Sci. 2011, 51, 917–945. [Google Scholar] [CrossRef] [PubMed]
- Konopacki, M.; Grygorcewicz, B.; Dołęgowska, B.; Kordas, M.; Rakoczy, R. PhageScore: A Simple Method for Comparative Evaluation of Bacteriophages Lytic Activity. Biochem. Eng. J 2020, 161, 107652. [Google Scholar] [CrossRef]
- Storms, Z.J.; Teel, M.R.; Mercurio, K.; Sauvageau, D. The Virulence Index: A Metric for Quantitative Analysis of Phage Virulence. PHAGE 2020, 1, 27–36. [Google Scholar] [CrossRef] [PubMed]
- Tsao, G.T. Annual Reports on Fermentation Processes, 1st ed.; Elsevier Science & Technology: Chantilly, United States, 1985; pp. 11–18. [Google Scholar]
- Flint, S.J.; Racaniello, V.R.; Rall, G.F.; Hatziioannou, T.; Skalka, A.M. Principles of Virology, Volume 2: Molecular Biology, 5th ed.; Wiley: New York, United States, 2020; pp. 171–175. [Google Scholar]
- Horn, H.J. Simplified LD50 (or ED50) Calculations. Biometrics 1956, 12, 311–322. [Google Scholar] [CrossRef]
- Kawana, F.; Shigeta, S.; Hosoya, M.; Suzuki, H.; De Clercq, E. Inhibitory Effects of Antiviral Compounds on Respiratory Syncytial Virus Replication in Vitro. Antimicrobial Agents and Chemotherapy 1987, 31, 1225–1230. [Google Scholar] [CrossRef]
- Ceballos, R.M.; Drummond, C.G.; Stacy, C.L.; Padilla-Crespo, E.; Stedman, K.M. Host-Dependent Differences in Replication Strategy of the Sulfolobus Spindle-Shaped Virus Strain SSV9 (a.k.a., SSVK1): Infection Profiles in Hosts of the Family Sulfolobaceae. Front. Microbiol. 2020, 11, 1218. [Google Scholar] [CrossRef] [PubMed]
- Bird, S.W.; Maynard, N.D.; Covert, M.W.; Kirkegaard, K. Nonlytic Viral Spread Enhanced by Autophagy Components. Proc Natl Acad Sci U S A 2014, 111, 13081–13086. [Google Scholar] [CrossRef]
- Ceballos, R.M.; Marceau, C.D.; Marceau, J.O.; Morris, S.; Clore, A.J.; Stedman, K.M. Differential Virus Host-Ranges of the Fuselloviridae of Hyperthermophilic Archaea: Implications for Evolution in Extreme Environments. Front. Microbio. 2012, 3. [Google Scholar] [CrossRef] [PubMed]
- Stedman, K.M.; She, Q.; Phan, H.; Arnold, H.P.; Holz, I.; Garrett, R.A.; Zillig, W. Relationships between Fuselloviruses Infecting the Extremely Thermophilic Archaeon Sulfolobus: SSV1 and SSV2. Res. Microbiol. 2003, 154, 295–302. [Google Scholar] [CrossRef] [PubMed]
- Christenson, E.I.; Zhang, Q.; Plymale, R. An Adapted Optical Density-Based Microplate Assay for Characterizing Actinobacteriophage Infection. JoVE 2023, 65482. [Google Scholar] [CrossRef]
- Petrovski, S.; Seviour, R.J.; Tillett, D. Genome Sequence and Characterization of the Tsukamurella Bacteriophage TPA2. Appl Environ Microbiol 2011, 77, 1389–1398. [Google Scholar] [CrossRef] [PubMed]
- Van Alst, A.J. Growth Curves: Generating Growth Curves Using Colony Forming Units and Optical Density Measurements; MyJoVE Corp: Cambridge, MA, 2016. [Google Scholar]
- Wise, K., 2006. Preparing spread plates protocols. Am. Soc. Microbiol. Microbe Libr. Available online: http://www.asmscience. org/content/education/protocol/protocol, 3085.
- She, Q.; Singh, R.K.; Confalonieri, F.; Zivanovic, Y.; Allard, G.; Awayez, M.J.; Chan-Weiher, C.C.-Y.; Clausen, I.G.; Curtis, B.A.; De Moors, A.; et al. The Complete Genome of the Crenarchaeon Sulfolobus Solfataricus P2. Proc. Natl. Acad. Sci. U.S.A. 2001, 98, 7835–7840. [Google Scholar] [CrossRef]
- Courteaux, T. A Broad Host Range Study of Gordonia terrae Bacteriophages. Master's thesis, University of Louisiana at Monroe, 700 University Ave, Monroe, LA 71209, May 2024.
- Poxleitner, M., Pope, W.H., Jacobs-Sera, D., Sivanathan, V. and Hatfull, G.F., 2018. SEA-PHAGES phage discovery guide. HHMI SEA-PHAGES Phage Discov Guide. Available online: https://seaphages.org/blog/2018/09/05/sea-phages-phage-discovery-guide-online (accessed on 11 January 2025).
- Krishnamurthi, V.R.; Niyonshuti, I.I.; Chen, J.; Wang, Y. A New Analysis Method for Evaluating Bacterial Growth with Microplate Readers. PLoS ONE 2021, 16, e0245205. [Google Scholar] [CrossRef] [PubMed]
- Rajnovic, D.; Muñoz-Berbel, X.; Mas, J. Fast Phage Detection and Quantification: An Optical Density-Based Approach. PLoS ONE 2019, 14, e0216292. [Google Scholar] [CrossRef] [PubMed]
- Zwietering, M.H.; Jongenburger, I.; Rombouts, F.M.; Van ’T Riet, K. Modeling of the Bacterial Growth Curve. Appl Environ Microbiol 1990, 56, 1875–1881. [Google Scholar] [CrossRef]
- Hall, B.G.; Acar, H.; Nandipati, A.; Barlow, M. Growth Rates Made Easy. Mol. Biol. Evol. 2014, 31, 232–238. [Google Scholar] [CrossRef] [PubMed]
- Rispin, A.; Farrar, D.; Margosches, E.; Gupta, K.; Stitzel, K.; Carr, G.; Greene, M.; Meyer, W.; McCall, D. Alternative Methods for the Median Lethal Dose (LD50) Test: The Up-and-Down Procedure for Acute Oral Toxicity. ILAR Journal 2002, 43, 233–243. [Google Scholar] [CrossRef]
- Li, J.; Hu, D.; Ding, X.; Chen, Y.; Pan, Y.; Qiu, L.; Che, X. Enzyme-Linked Immunosorbent Assay-Format Tissue Culture Infectious Dose-50 Test for Titrating Dengue Virus. PLoS ONE 2011, 6, e22553. [Google Scholar] [CrossRef] [PubMed]
- Chan, T.C.; Jiang, J.; Temenak, J.J.; Richards, A.L. Development of a Rapid Method for Determining the Infectious Dose (ID)50 of Orientia Tsutsugamushi in a Scrub Typhus Mouse Model for the Evaluation of Vaccine Candidates. Vaccine 2003, 21, 4550–4554. [Google Scholar] [CrossRef] [PubMed]
- Karimzadeh, S.; Bhopal, R.; Nguyen Tien, H. Review of Infective Dose, Routes of Transmission and Outcome of COVID-19 Caused by the SARS-COV-2: Comparison with Other Respiratory Viruses. Epidemiol. Infect. 2021, 149, e96. [Google Scholar] [CrossRef]
- Peng, X. Evidence for the Horizontal Transfer of an Integrase Gene from a Fusellovirus to a pRN-like Plasmid within a Single Strain of Sulfolobus and the Implications for Plasmid Survival. Microbiology 2008, 154, 383–391. [Google Scholar] [CrossRef]
- Catchpole, R.J.; Barbe, V.; Magdelenat, G.; Marguet, E.; Terns, M.; Oberto, J.; Forterre, P.; Da Cunha, V. A Self-Transmissible Plasmid from a Hyperthermophile That Facilitates Genetic Modification of Diverse Archaea. Nat. Microbiol. 2023, 8, 1339–1347. [Google Scholar] [CrossRef] [PubMed]
- Barrangou, R.; Fremaux, C.; Deveau, H.; Richards, M.; Boyaval, P.; Moineau, S.; Romero, D.A.; Horvath, P. CRISPR Provides Acquired Resistance Against Viruses in Prokaryotes. Science 2007, 315, 1709–1712. [Google Scholar] [CrossRef] [PubMed]
- Jansen, Ruud.; Embden, Jan.D.A. van; Gaastra, Wim.; Schouls, Leo.M. Identification of Genes That Are Associated with DNA Repeats in Prokaryotes. Mol. Microbiol. 2002, 43, 1565–1575. [Google Scholar] [CrossRef] [PubMed]
- Marraffini, L.A.; Sontheimer, E.J. CRISPR Interference: RNA-Directed Adaptive Immunity in Bacteria and Archaea. Nat. Rev. Genet. 2010, 11, 181–190. [Google Scholar] [CrossRef] [PubMed]
- Deveau, H.; Garneau, J.E.; Moineau, S. CRISPR/Cas System and Its Role in Phage-Bacteria Interactions. Annu. Rev. Microbiol. 2010, 64, 475–493. [Google Scholar] [CrossRef] [PubMed]
Figure 1.
Example of LD50 (or ID50) with failure scenario. (A) The host infected with Virus 1 (blue) is more resilient than the same host infected with Virus 2 (red) because it takes a larger inoculum to reach LD50. (B) LD50 is equivalent for both cases when host is infected with Virus 1 (blue) and when host is infected with Virus 2 (red); however, the host persists longer with Virus 2 infection (red), thus the LD50 metric fails to accurately determine relative resilience (RR) of host infected with virus 1 versus virus 2.
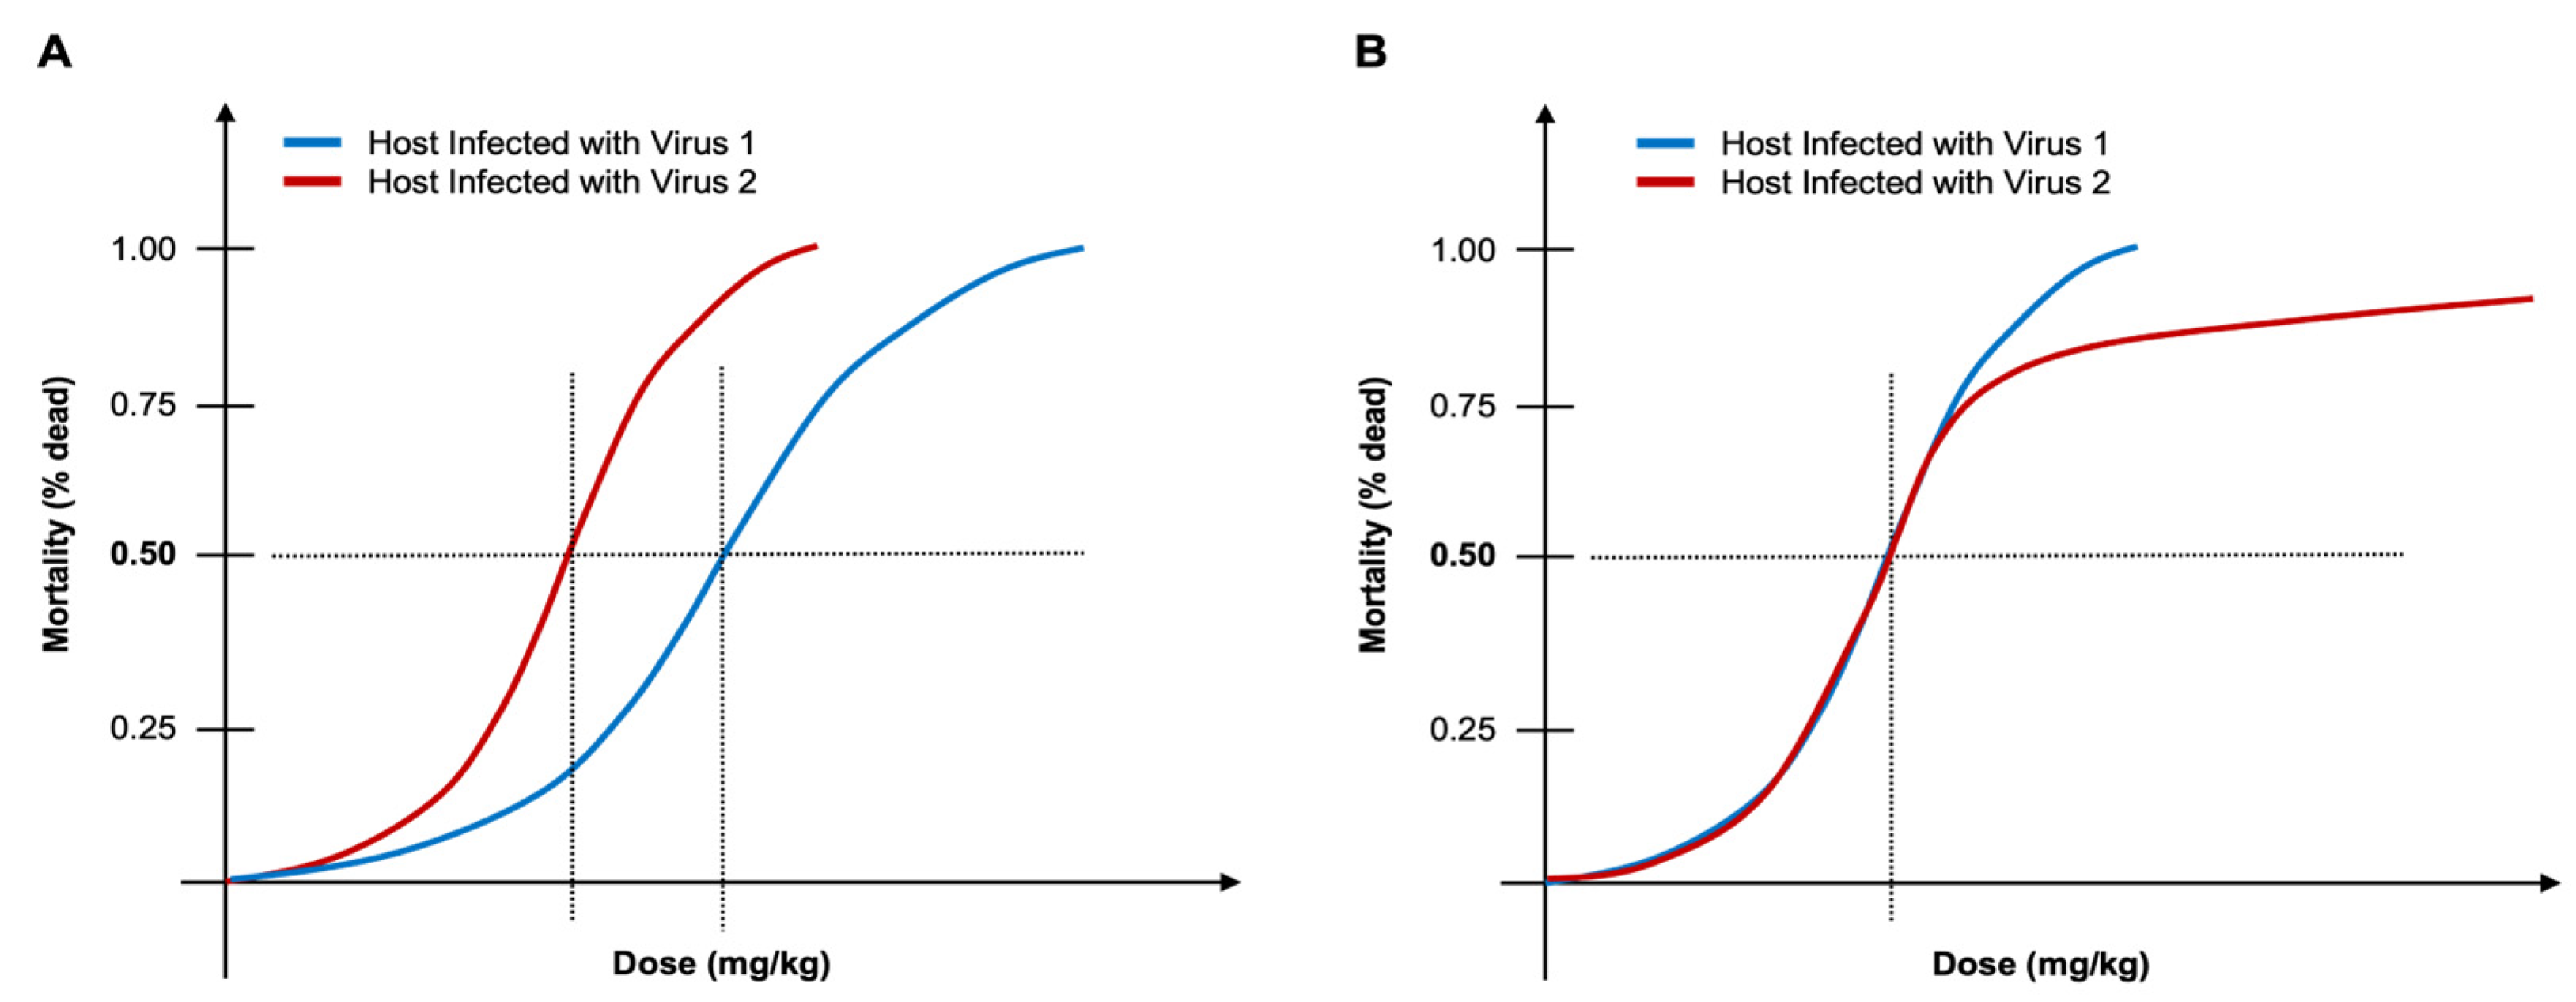
Figure 2.
Canonical non-lytic versus lytic growth profiles. (A) Sulfolobus Spindle-shaped Virus 8 (SSV8) [1,11] is used to infect cultures of different species and geographic isolates (i.e., strains) of Sulfolobales: S. solfataricus strain P2 (DSM1617) [19] originally isolated from thermal springs in Piscarelli, Italy (blue); S. solfataricus strain S441 isolated from Troll Bridge hot spring, Lassen Volcanic National Park, USA [13] (red); and, S. islandicus strain HVE10/4 isolated from Hveragerdi geothermal springs in Iceland [30] (green). Growth curves for uninfected controls for each host are also provided (black, dark grey, grey, respectively). (B) S. solfataricus strain P2 (blue), S. solfataricus strain S441 (red), and S. islandicus strain HVE10/4 (green) infected with SSV9, which induces bulk cell lysis during infection [11].
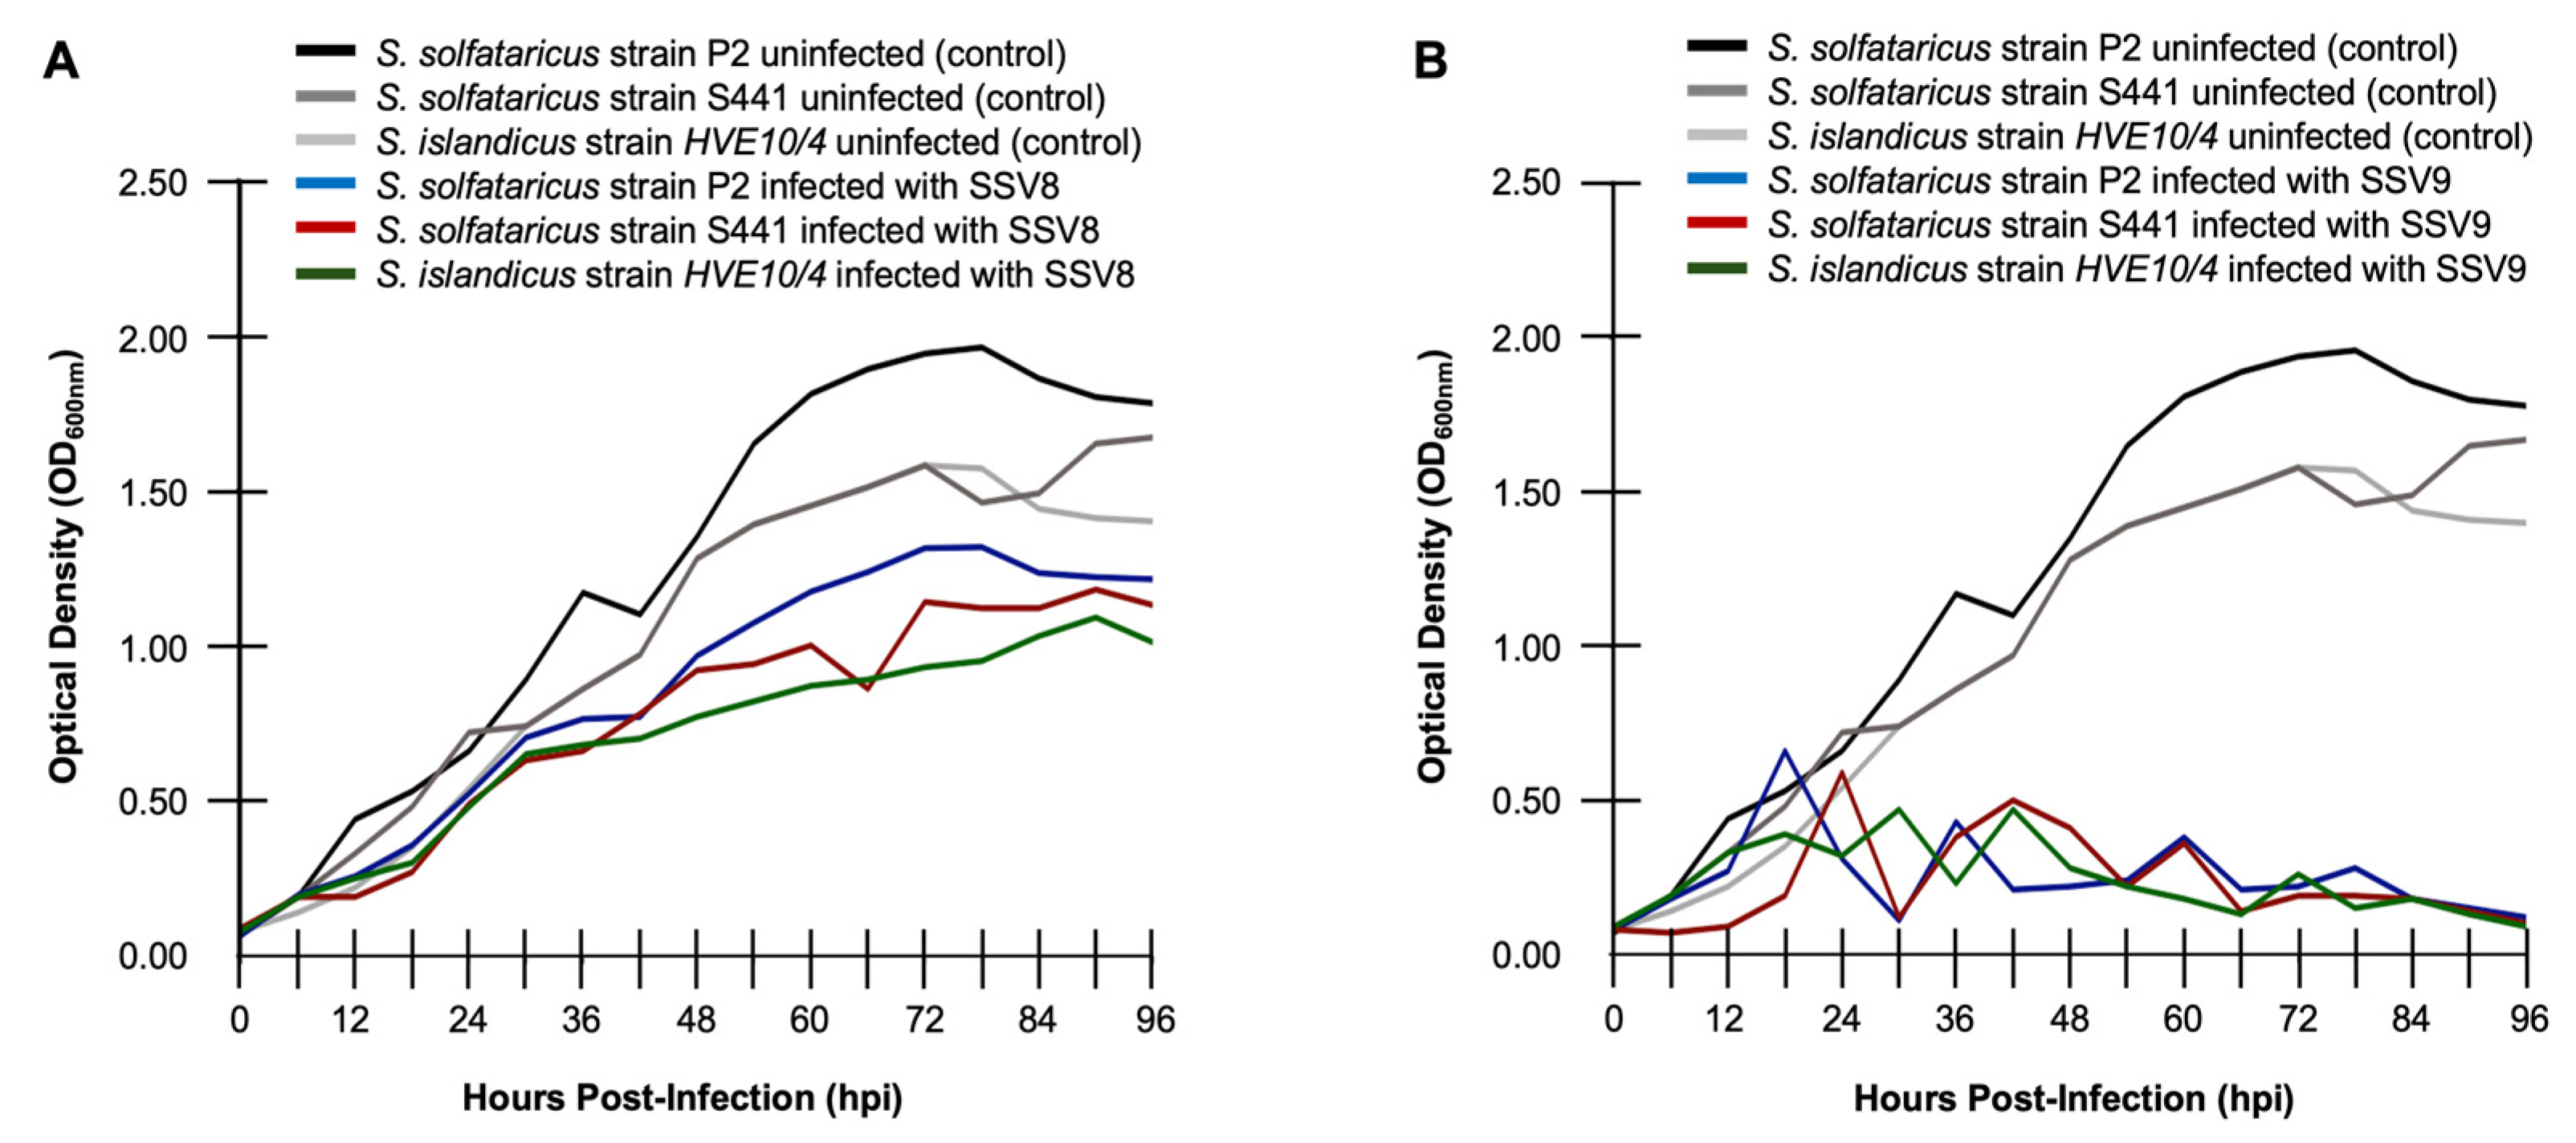
Figure 3.
Calculating RR in canonical host growth versus confounding non-canonical host growth profiles. (A) Host growth curves for SSV1-infected S. solfataricus strain P2 (blue), SSV8-infected S. solfataricus strain P2 (red), and an uninfected control (black), shows that RRSV1 >> RRSV8 via RR = 1/VR calculations. (B) Non-canonical growth profiles of a bacteriophage infecting host Gordonia terrae strain CAG3 feature host growth enhancement.
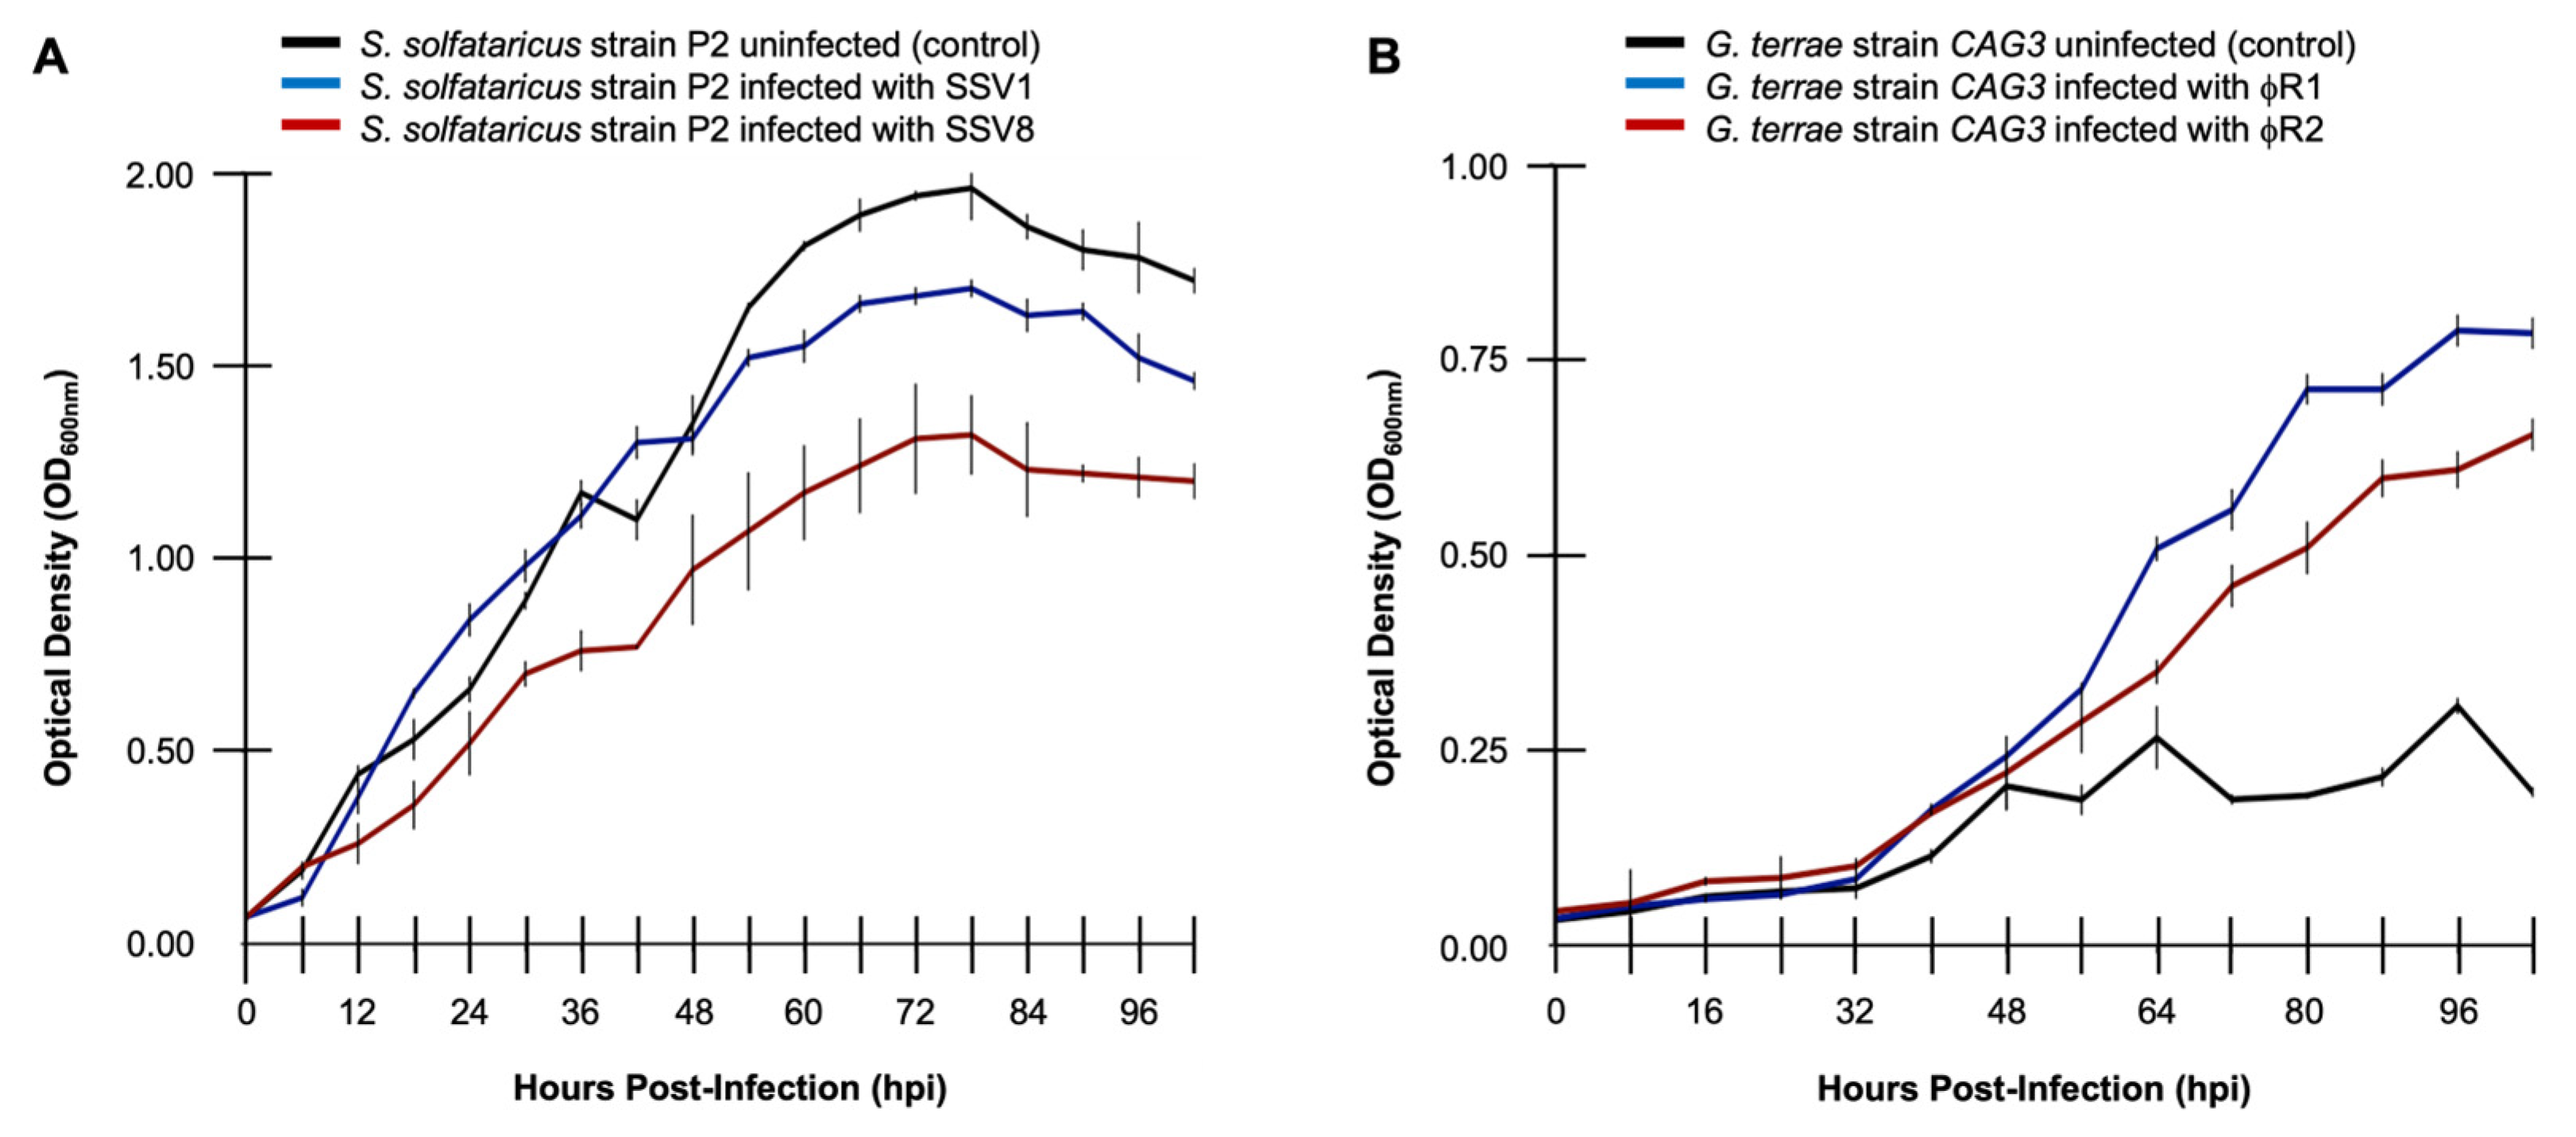
Figure 4.
The importance of mortality phase dynamics in determining host resilience. (A) Calculating RR using maximum specific extinction rate (νmax) for fusellovirus-infected S. solfataricus strain P2. Steeper slope for νmax calculated for SSV1 infection when comparted to SSV8 infection. (B) Resilience assessment using area-under-the-curve (AUC) based metrics (e.g., ISC) which includes the mortality phase.
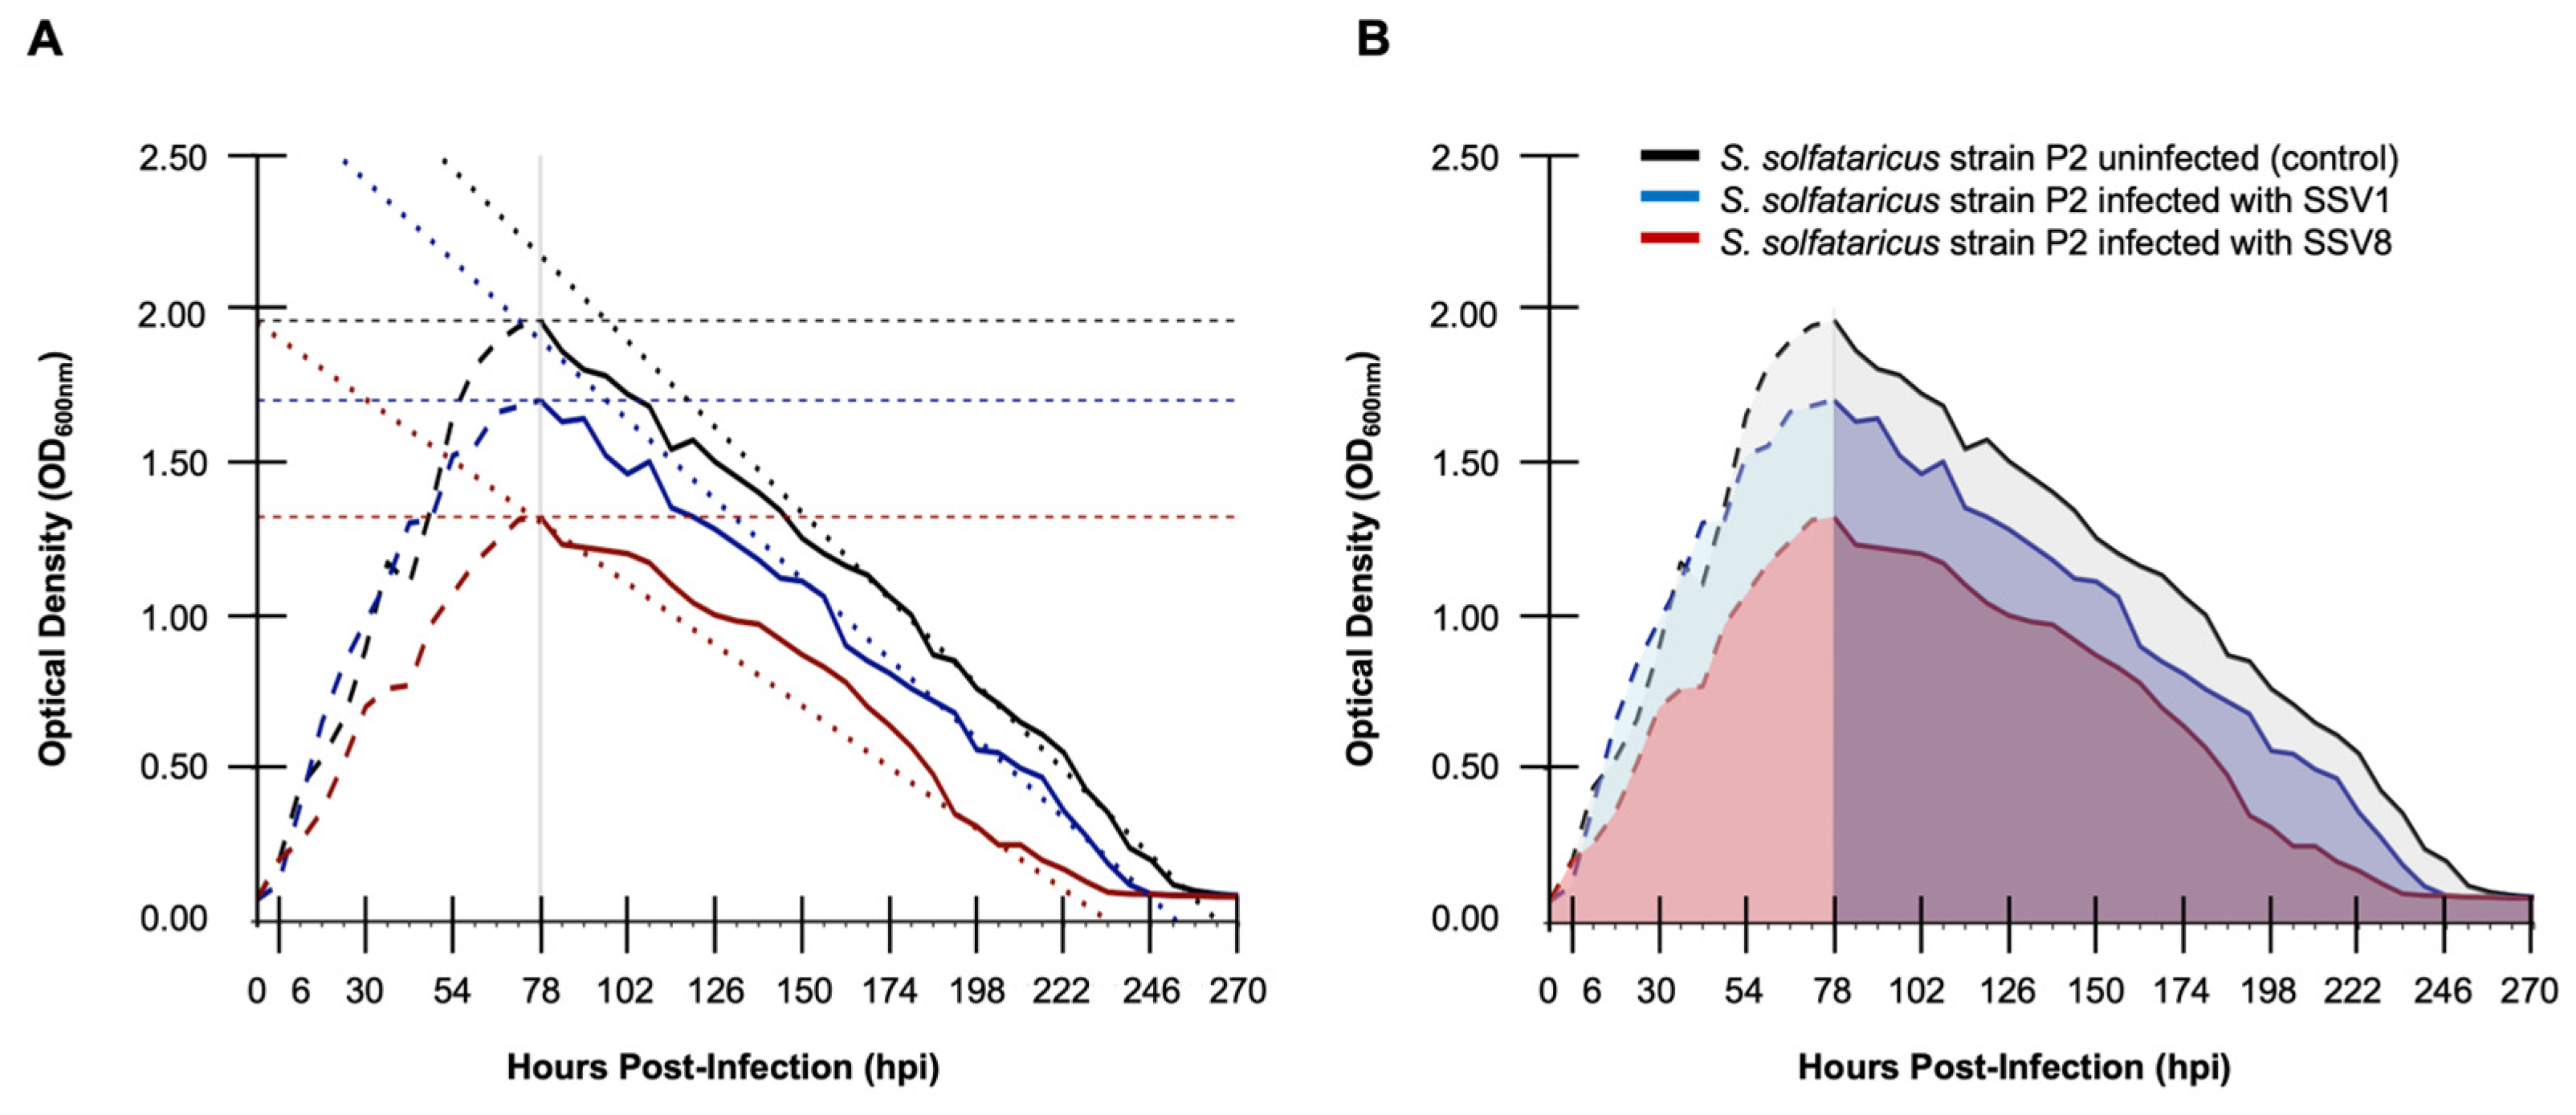
Figure 5.
Non-canonical virus-infected host growth profiles that confound RR calculations. (A) Simulated infection profile showing uninfected (i.e., control) host growth (black), virus 1-infected host growth curve with phase shift (blue), and virus 1-infected host growth with phase shift and cross-over (red). (B) Simulated bacteriophage-infected Gordonia terrae CAG3 growth extrapolated from wet lab data showing virus-induced host growth (red and blue) with uninfected host control (black).
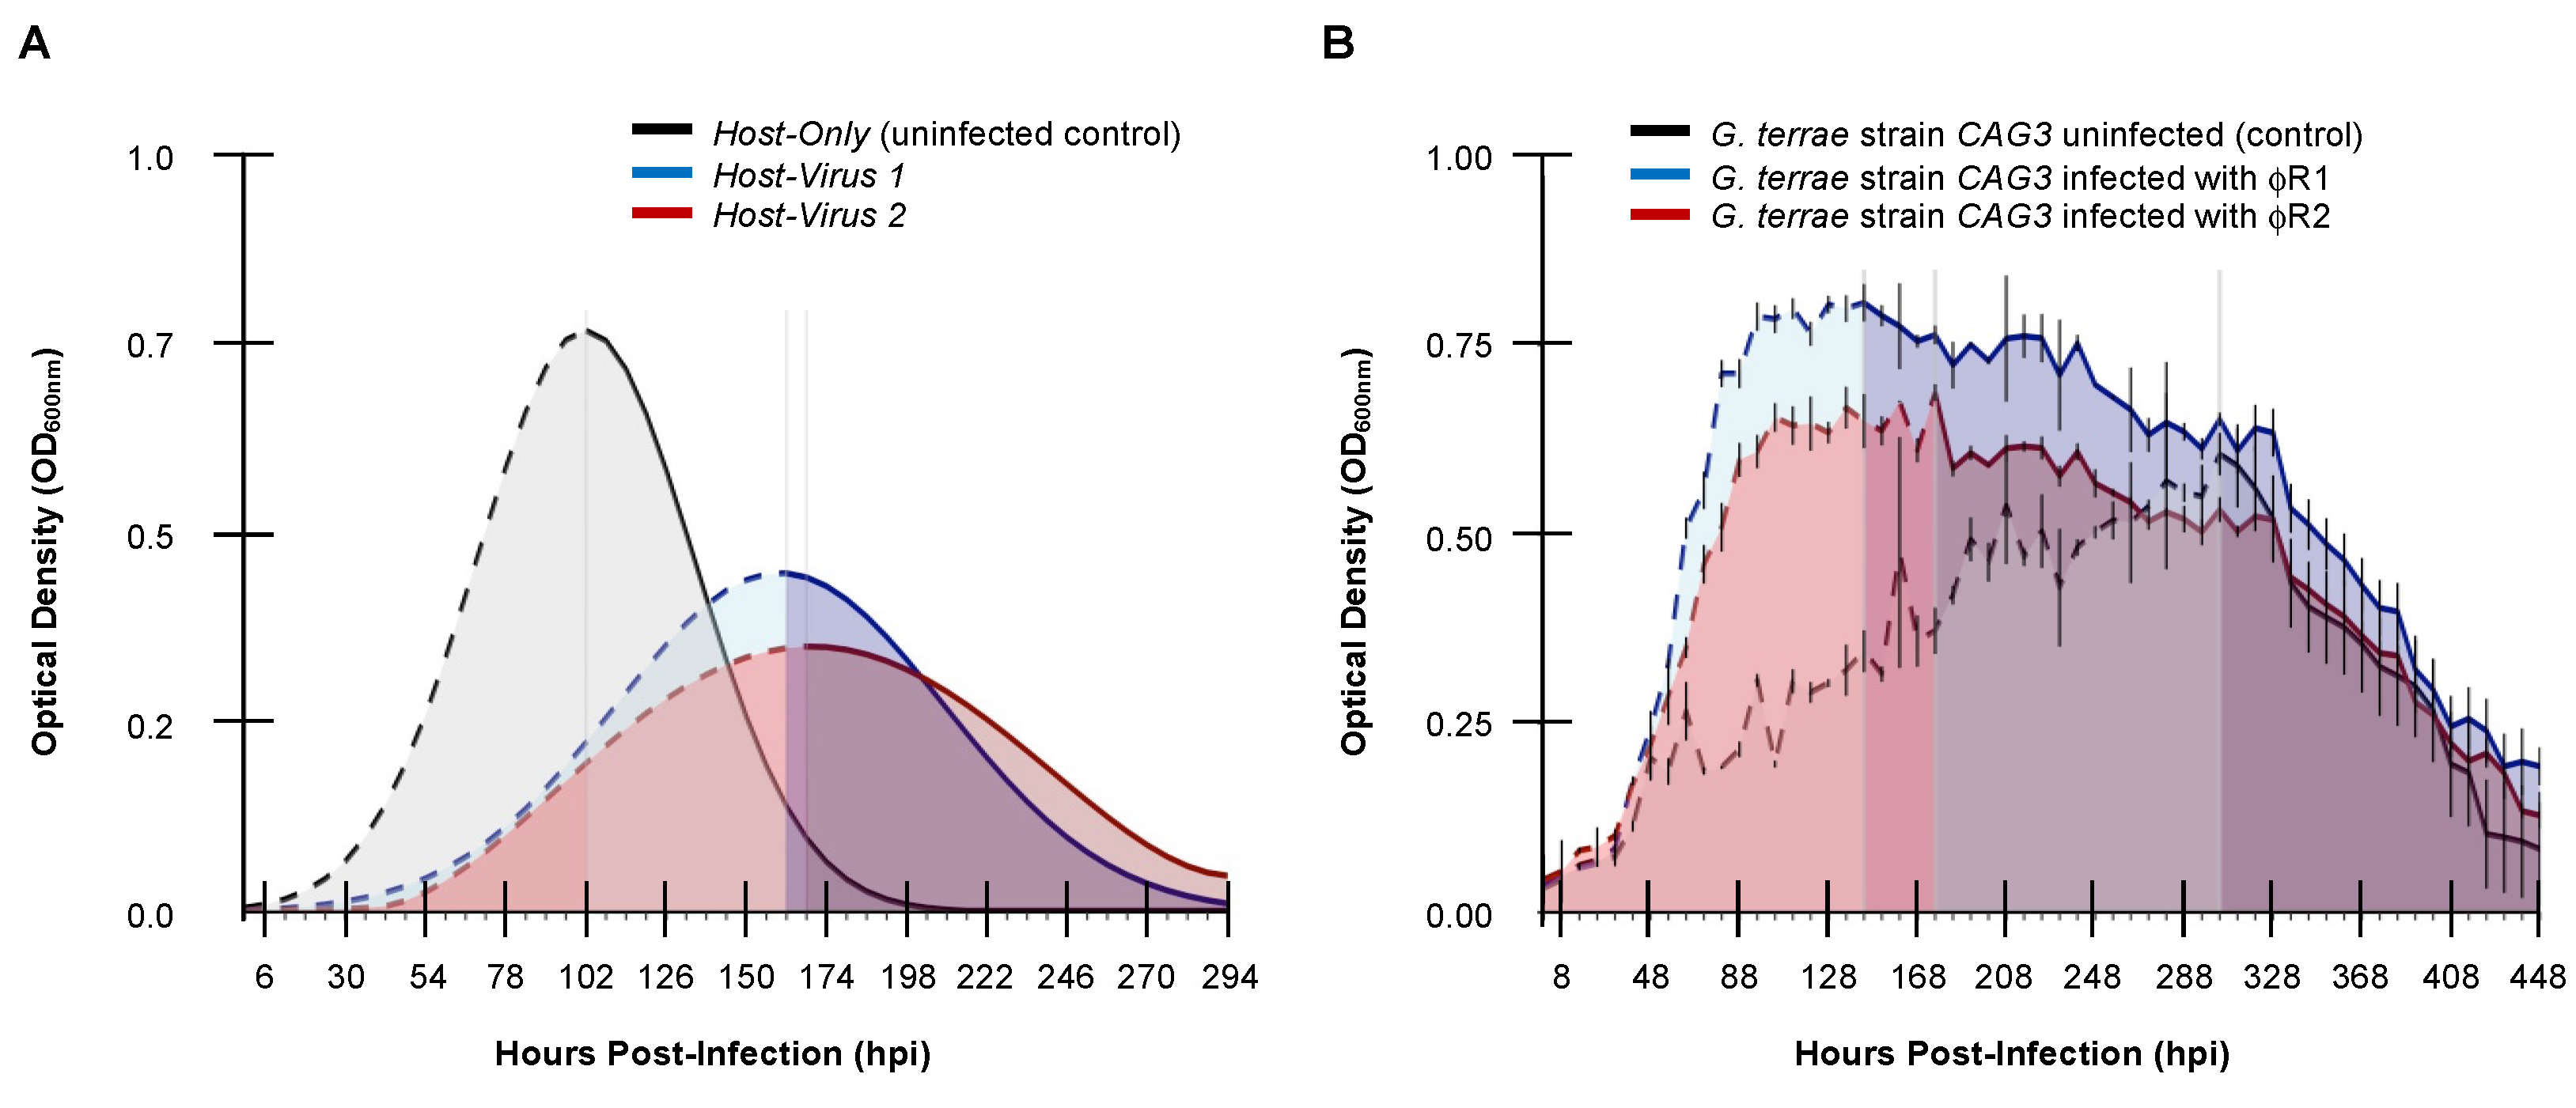
Figure 6.
Limits of integration for calculating relative resilience (RR) for sub-domain dynamics. Simulated growth curves of a susceptible and permissive host infected with two different viruses, virus 1 and virus 2. Uninfected (control) host (black), virus 1-infected host (medium gray), virus 2-infected host (dark gray). Virus counts (hfu/mL) shown for virus 1 (blue dashed) and virus 2 (red dashed).
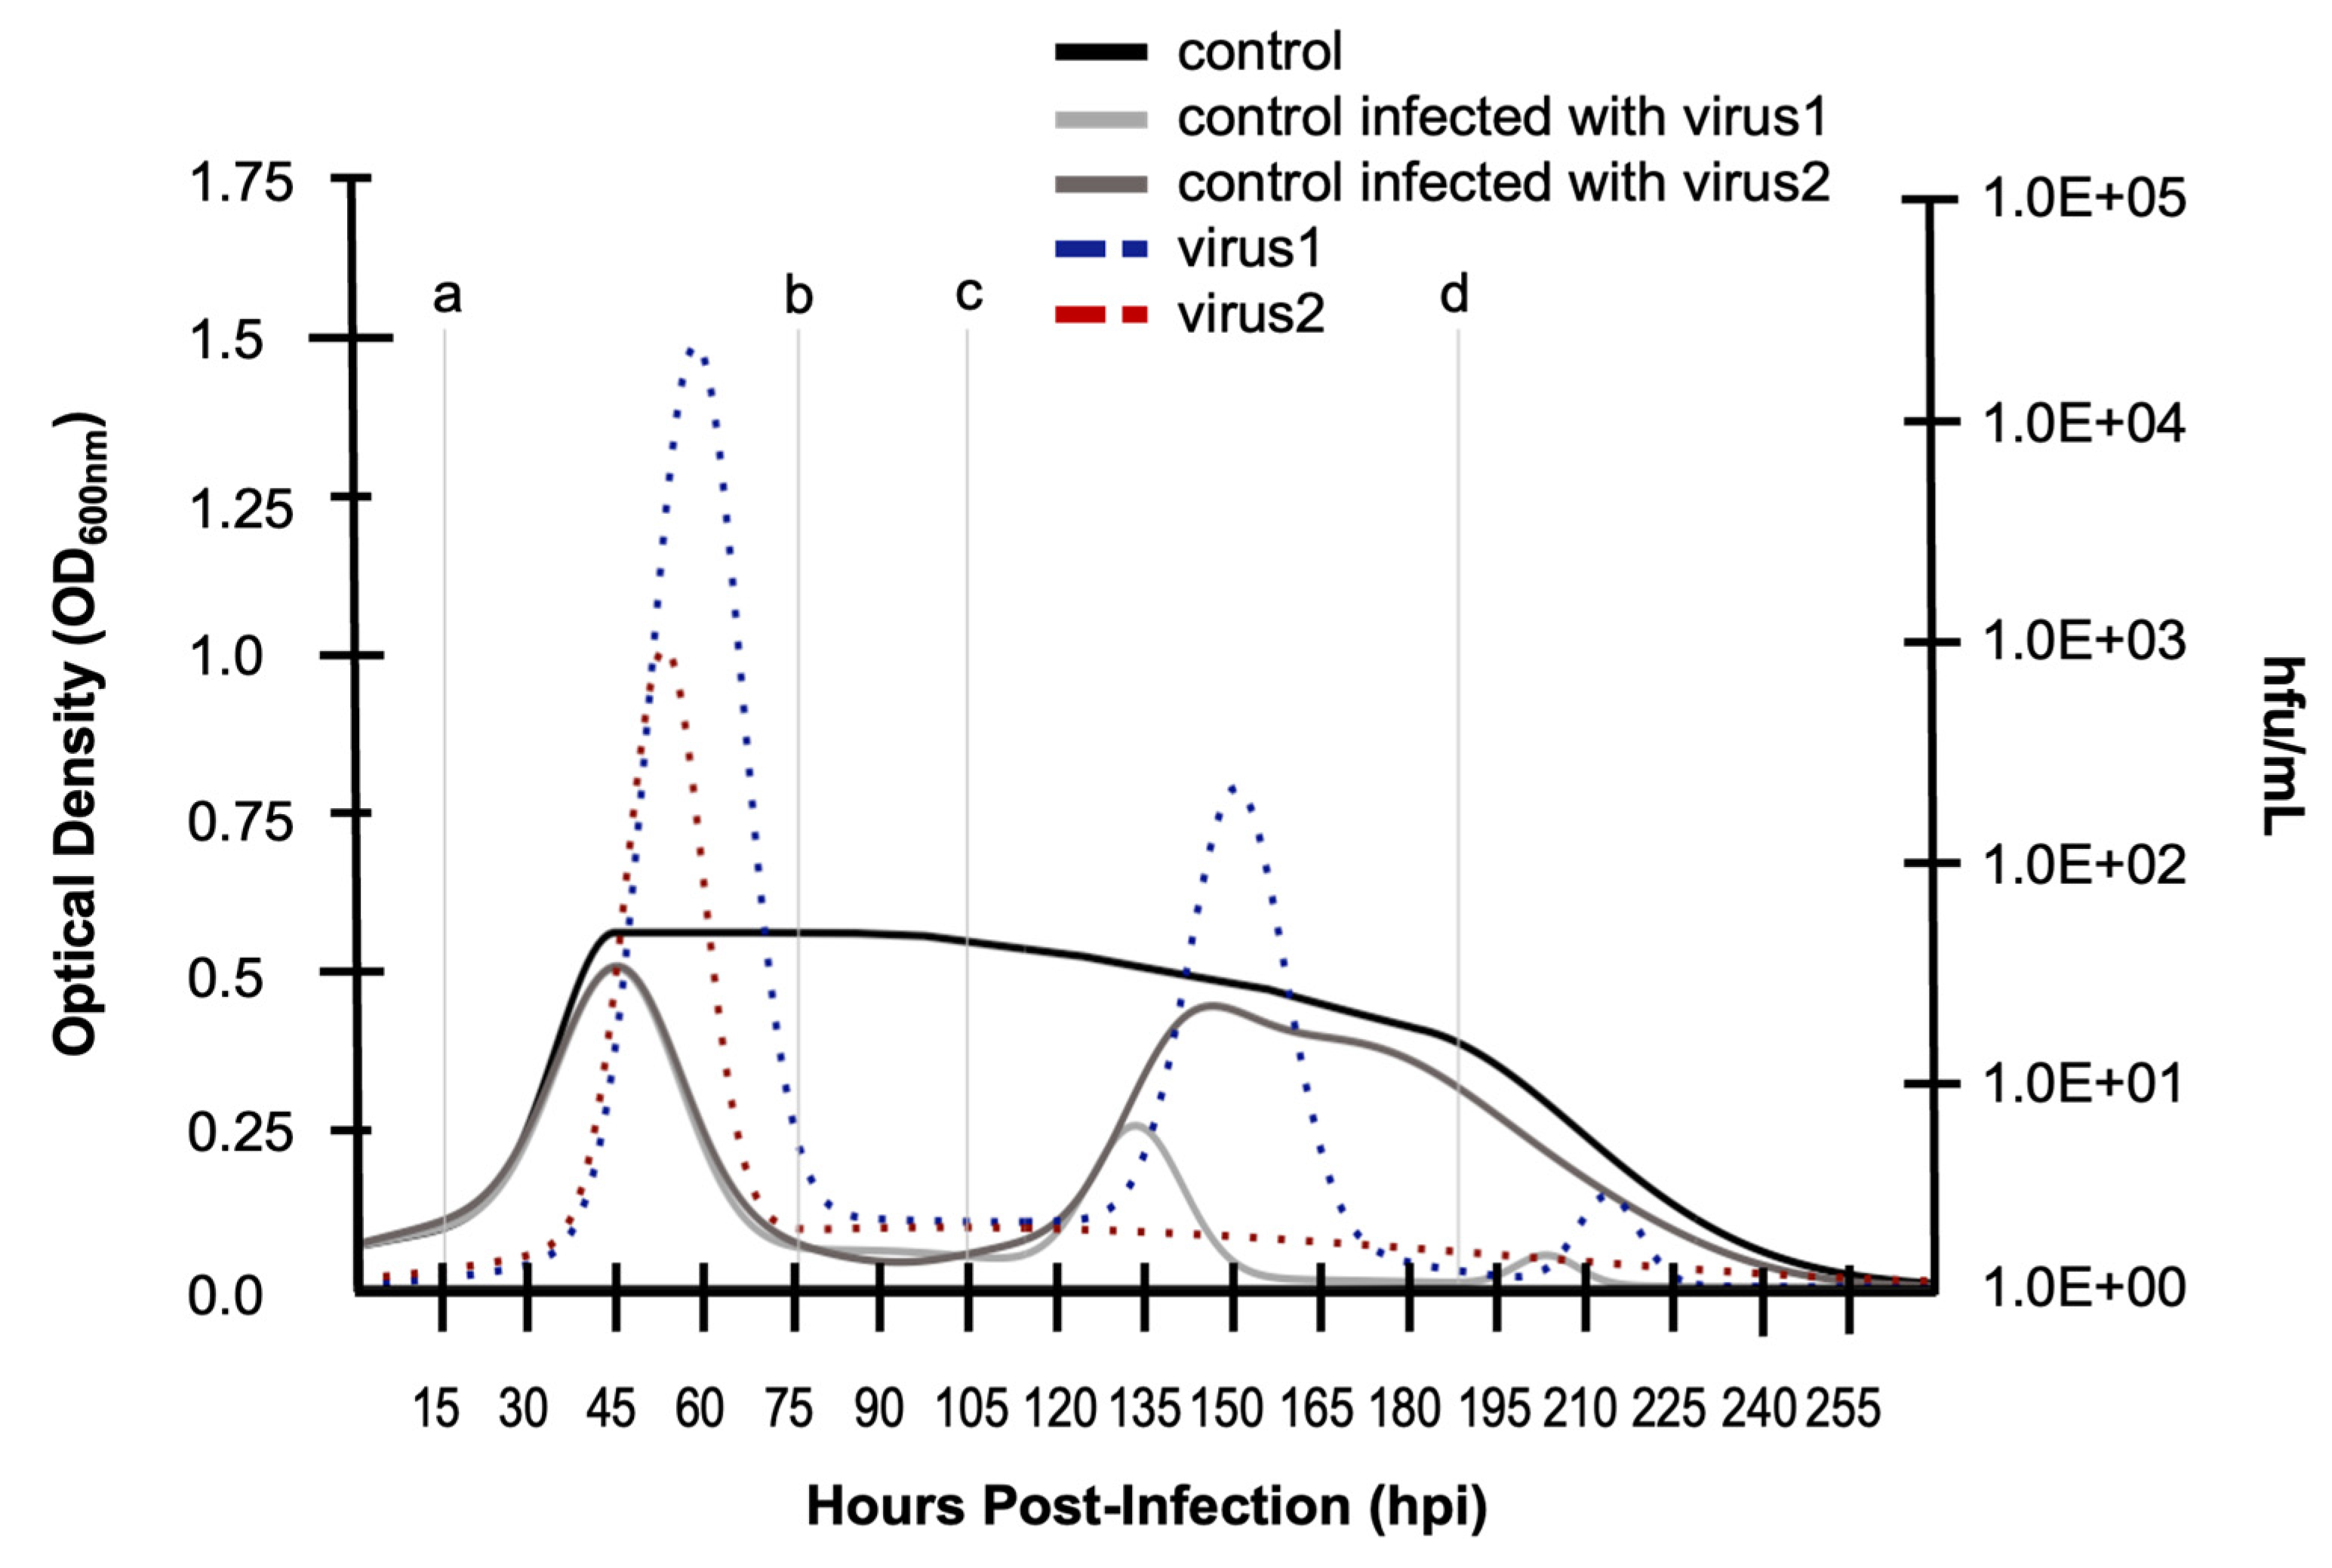

Table 1.
Determining relative resilience based on virulence calculation using RR as 1/VR.
| Metric (limit) |
VR (0-96 hpi) |
RR (0-96 hpi) |
|---|---|---|
| SSV1 SSV8 |
8.457 | - |
| 27.039 | - | |
|
S. solfataricus strain P2 - SSV1 S. solfataricus strain P2 - SSV8 |
- - |
0.118 0.0369 |
| φR1 φR2 |
54.84 45.67 |
- - |
|
G. terrae strain CAG3 - φR1 G. terrae strain CAG3 - φR2 |
- | 0.018 |
| - | 0.021 |
* Wet lab data were used for all cases except φR2. Data for φR2 was computer-generated to address the problem being described with using 1/VR as a metric for RR. Red font indicates that the metric fails or lacks robustness.
Table 2.
Determining relative resilience based on virulence calculation using RR as 1/VR or 1/CI.
| Metrics (limit) |
νmax | AUC (78-270 hpi) |
VR (78-270 hpi) |
RR (78-270 hpi) |
CI (78-270 hpi) |
1/CI (78-270 hpi) |
|---|---|---|---|---|---|---|
| Control SSV1 SSV8 |
-0.011 | 192.018 | - | - | - | - |
| -0.017 -0.006 |
158.326 118.800 |
13.516 32.482 |
- - |
0.156 0.349 |
- - |
|
|
S. solfataricus P2 - SSV1 S. solfataricus P2 - SSV8 |
- - |
- - |
- - |
0.073 0.030 |
- - |
6.373 2.865 |
Table 3.
Determining relative resilience based on virulence calculation using RR as 1/VR or 1/CI.
| Metrics (limit) |
AUC (0-270 hpi) |
VR (0-270 hpi) |
RR (0-270 hpi) |
CI (0-270 hpi) |
1/CI (0-270 hpi) |
|---|---|---|---|---|---|
| Control SSV1 SSV8 |
279.764 242.136 178.950 |
- 10.703 31.068 |
- - - |
- 0.156 0.338 |
- - - |
|
S. solfataricus strain P2 - SSV1 S. solfataricus strain P2 - SSV8 |
- - |
- - |
0.093 0.032 |
- - |
6.410 2.958 |
Table 4.
Failure of RR calculations for phase shifted infected-host growth profiles.
| Metrics (limit) |
AUC (0-294 hpi) |
1/AUC (0-294 hpi) |
VR (0-294 hpi) |
RR (0-294 hpi) |
CI (0-294 hpi) |
1/CI (0-294 hpi) |
|---|---|---|---|---|---|---|
| Host Virus1 Virus2 |
62.584 - - |
- - - |
- 54.023 63.868 |
- - - |
- 0.083 0.183 |
- - - |
| Host - Virus1 Host - Virus2 |
54.572 50.109 |
0.018 0.019 |
- - |
0.018 0.015 |
- - |
12.048 5.464 |
* Red font indicates that the metric fails or lacks robustness.
Table 5.
CI-based RR calculation for bacteriophage-infected host Gordonia terrae CAG3.
| Metrics (limit) |
AUC (0-448 hpi) |
1/AUC (0-448 hpi) |
VR (0-448 hpi) |
RR (0-448 hpi) |
CI (0-448 hpi) |
1/CI (0-448 hpi) |
|---|---|---|---|---|---|---|
|
G. terrae strain CAG3 φR1 φR2 |
151.288 - - |
- - - |
- 69.513 44.892 |
- - - |
- -0.403 -0.141 |
- - - |
|
G. terrae strain CAG3 - φR1 G. terrae strain CAG3 - φR2 |
242.035 199.524 |
0.004 0.005 |
- - |
0.014 0.022 |
- - |
-2.479 -7.054 |
* Metrics calculated on simulated growth extrapolated from we lab data. Data for φR2 was computer-generated to address the problem being described with using 1/VR as a metric for RR. Red font indicates that the metric fails or lacks robustness.
Table 6.
Selection of Integration Limits and RR Calculations.
| Metrics (limit) |
RR (0-270 hpi) |
RR (15–75 hpi) |
RR (105–188 hpi) |
|---|---|---|---|
| Host – Virus1 Host – Virus2 |
0.048 0.050 |
0.105 0.105 |
0.014 0.020 |
Disclaimer/Publisher’s Note: The statements, opinions and data contained in all publications are solely those of the individual author(s) and contributor(s) and not of MDPI and/or the editor(s). MDPI and/or the editor(s) disclaim responsibility for any injury to people or property resulting from any ideas, methods, instructions or products referred to in the content. |
© 2025 by the authors. Licensee MDPI, Basel, Switzerland. This article is an open access article distributed under the terms and conditions of the Creative Commons Attribution (CC BY) license (http://creativecommons.org/licenses/by/4.0/).
Copyright: This open access article is published under a Creative Commons CC BY 4.0 license, which permit the free download, distribution, and reuse, provided that the author and preprint are cited in any reuse.


