Preprint
Article

This version is not peer-reviewed.

Growth Associated Protein-43 Loss Promotes Cardiac Hypertrophy Through Ca2+ and ROS Imbalance

A peer-reviewed article of this preprint also exists.

Submitted:

23 January 2025

Posted:

24 January 2025

You are already at the latest version

Abstract

Growth Associated Protein-43 (GAP-43) is a calmodulin-binding protein, originally found in neurons, that in skeletal muscle regulates handlings of intracellular Ca2+ dynamics. According to its role in Ca2+ regulation, myotubes from GAP-43-null mice display alterations in spontaneous Ca2+ oscillations and evoked Ca2+ release. Emerging hypothesis is that GAP-43 regulates CaM interac-tions with RyR and DHPR Ca2+ channels. Loss of GAP-43 promotes cardiac hypertrophy in new-born knockout mice, extending the physiological role of GAP43 in cardiac muscle. We investigated the role of GAP-43 in cardiomyocytes deriving from GAP-43 knockout (GAP-43-/-) mice, evaluating intracellular Ca2+ variation and its correlation with the levels of reactive oxygen species (ROS), considering their importance in cardiovascular physiology. In GAP-43-/- cardiomyocytes we found increased expression of markers of cardiac hypertrophy, Ca2+ alterations and high mitochondria ROS levels (O2.¯) together with increased oxidized functional proteins. The treatment with a CaM inhibitor (W7) restored Ca2+ and ROS alterations possibly due to high mitochondrial Ca2+ entry by mitochondrial Ca2+ uniporter. Indeed, Ru360 was able to abolish the O2.¯ mitochondrial production. Our results suggest that GAP-43 has a key role in the regulation of Ca2+ and ROS homeostasis, whose alterations could trigger heart disease.

Keywords: 
;  ;  ;  ;  ;  ;  

1. Introduction

Growth-associated protein-43 (GAP-43) is highly expressed during axon growth and synaptogenesis. Its involvement in neuronal development has been demonstrated by gene knockout studies. Homozygous knockout of GAP-43 (GAP-43-/-) mice are characterized by high neonatal lethality, resulting in 5–10% survival to adulthood [1]. Although GAP-43 has long been classified as a neuron-specific protein, there are several studies that describe the presence of this protein in non-nervous tissues as well [2,3]. In skeletal muscle it has been found in meromyosin positive cells in the limbs of the chicken embryo and in human skeletal muscle in subjects suffering from interstitial myositis, hypothesizing its involvement in the regenerative processes associated with muscle diseases [4,5]. In mouse skeletal muscle the expression and intracellular localization of GAP-43 follows a distinct progression associated with differentiation from myoblasts to myotubes. Undifferentiated cells show a robust nuclear localization of GAP-43 with an irregular pattern of diffuse spots in the cytosol. In myotubes the protein is re-localized at cytoplasmic level forming regular transversal streaks. Co-localization and functional analyzes demonstrated that the protein is positioned close to Ca2+ release units and the mitochondria, suggesting that GAP-43 may play a key role in Ca2+ homeostasis in skeletal muscle [6].
Interestingly, also in skeletal muscle of lower vertebrate (amphibians and fishes) GAP-43 localizes closely to the triad junction suggesting a conserved physiological role across species [7]. Depending on the species, GAP-43 is composed of 194-238 amino acids, containing a conserved IQ motif which makes the protein capable of binding calmodulin (CaM). The binding to CaM is conditioned by the presence of high intracellular Ca2+ concentrations or by the phosphorylation of a serine residue (ser41) within the CaM binding IQ domain. In these conditions the binding affinity between CaM and GAP-43 is drastically reduced, allowing CaM mobilization towards its intracellular targets [8]. In this regard intracellular Ca2+ homeostasis was investigated in myotubes deriving from differentiated satellite cells of wild-type and GAP-43-/- mice. These findings revealed an increased amplitude and frequency of spontaneous and stimulated Ca2+ oscillations due to increased Ca2+ currents via dihydropyridine and ryanodine receptor Ca2+ channels (DHPR and RyR, respectively) as a consequence of an alteration of CaM operated control. The proposed hypothesis was that GAP-43 regulates downstream CaM interactions with RyR and DHPR to modulate Ca2+ channel opening. Indeed, W7, a specific CaM inhibitor, was able to restore the Ca2+ currents in GAP-43-/- myotubes. It has been postulated that GAP-43 provides a "functional microdomain" that locates the CaM near the Ca2+ release units [9].
Studies carried out in adult GAP-43-/- mice revealed a reduced expression of force which was accompanied by a reduced body weight. Ultra-structural analyzes by electron microscopy on the diaphragm and EDL muscles (early and late functional maturing tissues, respectively) from GAP-43-/- mice have shown a delay in the degree of triads maturation as well as a reduction of their number, even if, the formation of the neuromuscular junctions was normal. This data highlighted that GAP-43 may play a role in the processes that accompany the development and functional maturation of skeletal muscle [9]. Interestingly, Rahmati and Taherabadin found lower levels of GAP-43 in atrophied gastrocnemius muscle in diabetic animals, suggesting that the level of GAP-43 could be a critical factor for skeletal muscle mass and size [10].
Recently, published data from our laboratory demonstrate that GAP-43 is expressed also in mice heart muscle and that its expression is related to the tissue development: at birth, high protein levels which decrease towards adulthood. In addition, we have shown that GAP-43 is located near dyads. Interestingly, GAP-43-/- mice develop cardiac remodeling and hypertrophy showing increased cardiac mass index, thicker ventricular wall and interventricular septum with a reduced ventricular chamber area. Moreover, cross-sectional areas of GAP-43-/- heart fibers are increased as well as the expression levels of myosin heavy chain, these results emphasize that cardiac hypertrophy could be at least a co-morbidity factor of sudden death in offspring of GAP-43-/- mice [11].
Also the dis-homeostasis in Ca2+ handling is often reported in hypertrophic cardiomyocytes in which prolonged activation of Ca2+-calmodulin dependent protein kinase II (CaMKII) signals is involved playing a key role [12]. In this regard, the functional link between intracellular Ca2+ control and mitochondrial redox status is of fundamental importance. Indeed, under physiological conditions, fluctuations in reactive oxygen species (ROS) act as essential signaling molecules to control cellular functions in the cardiovascular system.[13,14].
The aim of this study is to define the role of GAP-43 in intracellular Ca2+ homeostasis in cardiomyocytes and its relationship with ROS balance.
Using cardiomyocytes isolated from hearts of neonatal wild type (WT) and GAP-43-/- C57BL/6 mice, intracellular Ca2+ and ROS levels were analyzed. GAP-43-/- -cardiomyocytes showed altered spontaneous Ca2+ oscillations and higher ROS levels compared to WT-cardiomyocytes.
Our findings suggest that GAP-43 has a role in controlling intracellular Ca2+ homeostasis and balancing mitochondrial ROS levels, whose alteration may be responsible for the initiation of a hypertrophic program in cardiac cells.

2. Materials and Methods

2.1. Chemicals and Materials

Unless otherwise indicated, cell culture media, sera, antibiotics, and cell culture dishware were obtained from Thermo Fisher Scientific (Monza, Italy), and reagents and standards from Merck Life Science S.r.l. (Milan, Italy).

2.2. Animal Models

C57BL/6 GAP43 heterozygous (GAP43+/-) mice were kindly provided by Karina F. Meiri, State University of New York, USA (Maier et al, 1999). GAP43+/- mice were crossed and progeny was genotyped by PCR to discriminate wild-type (WT) and homozygous (GAP43-/-) mice from GAP43+/- mice, according to the protocol described by Bevere et al., 2022 [11]. All experiments were performed using WT and GAP43-/- mice.
The experimentation and housing of animals were performed at the Center for Advanced Studies and Technology (CAST), Chieti, in accordance with European Guidelines for the use of animals in research (2010/63/EU) and the requirements of Italian laws (D.L. 26/2014), and were approved by the “Organismo preposto al benessere animale” (OpBA) of the “G. d’Annunzio” University of Chieti-Pescara and with authorization no. 4739.n.ias from the Italian Ministry of Health [principal investigator S.G.].

2.3. Isolation of Primary Cardiomyocytes from Neonatal Mouse Heart

After genotype screening, WT and GAP43-/- neonatal mice were sacrificed according to the authorized procedure and their hearts were removed to obtain primary cardiomyocytes using Thermo Fisher Pierce™ Primary Cardiomyocyte Isolation Kit (Thermo Fisher Scientific) and following the manufacturer instructions. All experiments were performed on cardiomyocytes seven days after -dissection and cell seeding.

2.4. Western Blotting

Protein extracts for Western blotting were purified from isolated cardiomyocytes of the WT and GAP43-/- neonatal mice. The cardiomyocytes were washed in cold PBS, scraped and collected in ice-cold RIPA lysis buffer (Thermo Fisher Scientific). After centrifugation (10000 × g, for 10 min at 4°C), the protein concentrations in the supernatants were determined (Bio-Rad protein assay; Bio-Rad Laboratories S.r.l, Segrate, Italy). Samples (20 μg) were resuspended in Laemmli buffer and separated by SDS-PAGE on 8%, 10% or 12% (w/v) homogeneous slab gels, and then electroblotted onto nitrocellulose membranes (AmershamTM-ProtranTM-0.45 μm NC, GE Healthcare, Cologno Monzese, Italy). The membranes were blocked with a TBS-Tween 0.1% solution with 5% milk, and then incubated overnight at 4 °C with the following primary antibodies: mouse monoclonal antibody anti- cardiac-myosin heavy chain (cMYH, 1:1.000 dilution; Thermo Fisher Scientific); mouse monoclonal antibody anti α-actinin (1:1.000 dilution; Merck Life Science S.r.l.); mouse monoclonal antibody anti-MYH7 (1:1.000 dilution; Santa Cruz Biotechnology Inc., SantaCruz, CA, USA.); rabbit monoclonal anti-CaMKII phosphorylated (p-CaMKII, 1:1.000 dilution; Cell Signaling Technology, Massachusetts, USA); rabbit monoclonal anti-CaMKII (1:1.000 dilution; Cell Signaling Technology); mouse monoclonal anti-Nkx-2.5 (1:1.000 dilution; Santa Cruz Biotechnology Inc.); rabbit polyclonal anti-GATA4 (1:1.000 dilution; Merck Life Science S.r.l.); mouse monoclonal antibody anti-Cav1.2 (1:1.000 dilution; Thermo Fisher Scientific); rabbit monoclonal antibody anti-RyR2 (1:1.000 dilution; Thermo Fisher Scientific); rabbit polyclonal antibody anti-calcineurin (1:500 dilution; Merck Life Science S.r.l.); rabbit polyclonal antibody anti-SERCA2 (1:1.000 dilution; Thermo Fisher Scientific); rabbit polyclonal antibody anti-SOD1 (1:1.000 dilution; Thermo Fisher Scientific); mouse monoclonal antibody anti-SOD2 (1:1.000 dilution; Thermo Fisher Scientific); rabbit polyclonal antibody anti-catalase (1:1.000 dilution; Thermo Fisher Scientific); rabbit polyclonal anti-GPX1 (1:1000 dilution, Thermo Fisher Scientific); mouse monoclonal antibody anti-NOX2 (1: 500 dilution; Santa Cruz Biotechnology Inc.); rabbit monoclonal antibody anti- NOX4 (1: 1000 dilution Thermo Fisher Scientific); rabbit polyclonal anti-nitrotyrosine (1:1.000 dilution; Merck Life Science S.r.l.); mouse monoclonal anti-4-Hydroxynonenal (4-HNE, 1:1.000 dilution; Thermo Fisher Scientific). After washing, the membranes were incubated with horseradish-peroxidase-conjugated appropriate secondary antibodies (1:10,000 dilution) for 1 h at room temperature (RT), and the signals were detected using chemiluminescence kits (GE Healthcare) and an image acquisition system (Uvitec, Cambridge, UK). A mouse monoclonal antibody anti-β-actin (1:1.000 dilution; Santa Cruz Biotechnology Inc.), a rabbit monoclonal antibody anti-vinculin (1:10000 dilution Abcam, Cambridge, UK) or a mouse monoclonal antibody anti-GAPDH (1:10.000 dilution; Merck Life Science S.r.l.) were used as loading controls.

2.5. Cytosolic and Mitochondrial Ca2+ Imaging

Intracellular Ca2+ levels were monitored using Fluo-4 acetoxymethyl ester (Fluo-4/AM, Thermo Fisher Scientific). An upright Zeiss Axio Examiner microscope (Carl Zeiss, Jena, Germany) was used, equipped with 40 X water immersion objective (0.75 NA) and connected by optical fiber to a 75W Xenon lamp and a monochromator (OptoScan; Cairn Instrument, UK). The WT and GAP43-/- cardiomyocytes were incubated with 5 µM Fluo-4/AM in normal external solution (NES: 140 mM NaCl, 2.8 mM KCl, 2 mM CaCl2, 2 mM MgCl2, 10 mM glucose, 10 mM Hepes, pH 7.3) supplemented with 1% (w/v) bovine serum albumin (BSA) for 30 min at 37 °C. Recordings on Fluo4-loaded cells were performed in NES or, where indicated, in NES containing 1 mM n-acetyl-l-cysteine (NAC, after a pre-incubation of 24h in the cell growth medium containing NAC) or in NES containing 20 μM n-(6-aminohexyl)-5-chloro-1-naphthalenesulfonamide hydrochloride (W7, after a pre-incubation of 10 min in cell growth medium containing W7). The Fluo4-loaded cells were excited at 488 nm, and the fluorescence images were acquired at 1 frame/50ms with a 12-bit digital EMCCD camera (PhotoEvolve 512; Photometrics; Tucson, AZ, USA). The temporal analysis was calculated as as f/f0, where f is the mean fluorescence intensity signal of a selected cell area of a single loaded cell acquired during a time lapse, and f0 is the mean fluorescence intensity of the same cell calculated from the first time point acquired. AnomalyExplorer software was used to identify normal and abnormal Ca2+ transients, categorized in different abnormality subgroups [15].
To evaluate mitochondrial Ca2+ levels, WT and GAP43-/- cardiomyocytes were simultaneously incubated with 5 μM Fluo-4 AM and 5 μM MitoTracker Deep Red (Thermo Fisher Scientific) in NES supplemented with 1% BSA for 45 min at RT in the dark. After incubation time, recordings on cardiomyocytes were performed with a confocal microscope (ZEISS LSM 800) equipped with Zeiss Axiovert 200 inverted microscope, a Plan Neofluar oil-immersion objective (40X/1.3 NA) and the LSM 3.0 image analysis software (Carl Zeiss). The fluorescence signals were simultaneously acquired by setting excitation at 488 nm for Fluo-4 and 640 nm for MitoTracker Deep Red. Image acquisition was performed at 2 frames/s for 1 min. The quantitative analysis of fluorescence intensity of the Fluo-4 in the MitoTracker Deep Red-stained mitochondria was determined using Fiji-ImageJ software (National Institutes of Health, NIH, USA). For each cell in the acquired field, five randomly selected regions of interest (ROIs) were chosen in the Mitotracker Deep Red channel to identify mitochondria area within the cells. Then, the fluorescence intensity of the chosen ROIs was quantified in the corresponding areas of the Fluo-4 channel. Some experiments were performed in the presence of 10 µM Ru360, an inhibitor of mitochondrial Ca2+ uniporter (Calbiochem, Merck Life Science S.r.l.), that was applied 5 min before the data acquisition and during recording.

2.6. ROS and Mitochondrial Superoxide Anion Levels Measurements

ROS or mitochondrial superoxide anion (O2·-) levels were evaluated using confocal microscopy (Zeiss LSM 800) and specific dyes: 2',7'-dichlorodihydrofluorescein diacetate (H2DCF-DA, Thermo Fisher Scientific) for ROS levels and MitoSOX RED (Thermo Fisher Scientific) for O2·- levels. WT and GAP43-/- cardiomyocytes were incubated in NES for 40 min at 37 °C with 10 µM H2DCF-DA or for 15 min at 37 °C with 5 μM MitoSOX. Recordings on H2DCF-DA- or MitoSOX-loaded cells were performed in NES or, where indicated, in NES containing 1 mM NAC (after a pre-incubation for 24 h in cell growth medium containing 1 mM NAC), or 20 μM W7 (after a _pre-incubation for 10 min in growth medium containing 20 μM W7), or 10 µM Ru360 (after a _pre-incubation for 5 min in growth medium containing 10 μM Ru360). Fluorescence signals were acquired at 488 nm for H2DCF-DA or 543 nm for MitoSOX Red. Fluorescence intensity was quantified using Fiji Image J software. The ROS levels were expressed as ratio between fluorescence intensity and area unit (F/μm2) while the O2·- levels as arbitrary unit (A.U.) of fluorescence.

2.7. Mitochondrial Membrane Potential Measurements

Mitochondrial membrane potentials were determined using JC-1 (5,5′,6,6′-tetrachloro-1,1′,3,3′-tetraethylbenzimidazolylcarbocyanine iodide/chloride; Thermo Fisher Scientific), a cationic carbocyaninic dye that accumulates in the mitochondria. Cardiomyocytes were incubated for 10 min at 37 °C with 5 μM JC-1 in cell medium. After washing with NES, the loaded cells were observed using the same setup and analysis software employed for evaluating intracellular ROS levels. Fluorescence signals were acquired using excitation of 488 nm and collected at 522 nm for J-monomer (green fluorescence) and 605 nm for J-aggregates (red fluorescence) [16]. Data were expressed as ratio between red and green fluorescence of JC-1-loaded cells.

2.8. Immunofluorescence Staining

WT and GAP43-/- cardiomyocytes were fixed with 4% paraformaldehyde for 10 min at RT. After three washings with PBS, cardiomyocytes were permeabilized with a 0.2% Triton X-100 solution for 10 min, incubated in blocking buffer (PBS containing 10% goat serum) for 1 h at RT, and incubated overnight at 4°C with primary antibody, a rabbit monoclonal anti-TOM20 (1:500 dilution; Thermo Fisher Scientific). Primary antibodies were revealed by 1 h incubation with secondary goat anti-rabbit Alexa 488 (1:200 dilution; Thermo Fisher Scientific) and the images were acquired using a confocal microscope (Zeiss LSM 800).

2.9. Measurements of Glucose and Lactate Levels in Cell Culture Medium

Cell medium of WT and GAP43-/- cardiomyocytes was removed and centrifuged at 13000 × g, for 15 min at 4 °C to remove cell debris. Glucose and lactate levels in the supernatants were assayed using a Free Style Optium glucometer (Abbot Laboratories, Rome, Italy) and a Lactate Pro Analyser (Arkray Inc. Kyoto, Japan), respectively. The values were expressed as grams of glucose (g glucose) or moles of lactate (mol lactate) normalized with the protein concentration of the corresponding cell samples [17].

2.10. Statistical Analysis

All collected data, unless not otherwise indicated, were expressed as the means ± standard error of the mean (S.E.M.) from, at least, three independent experiments and compared using Student’s t-test with Prism5 software (GraphPad, San Diego, CA, USA). p values < 0.05 were considered statistically significant.

3. Results

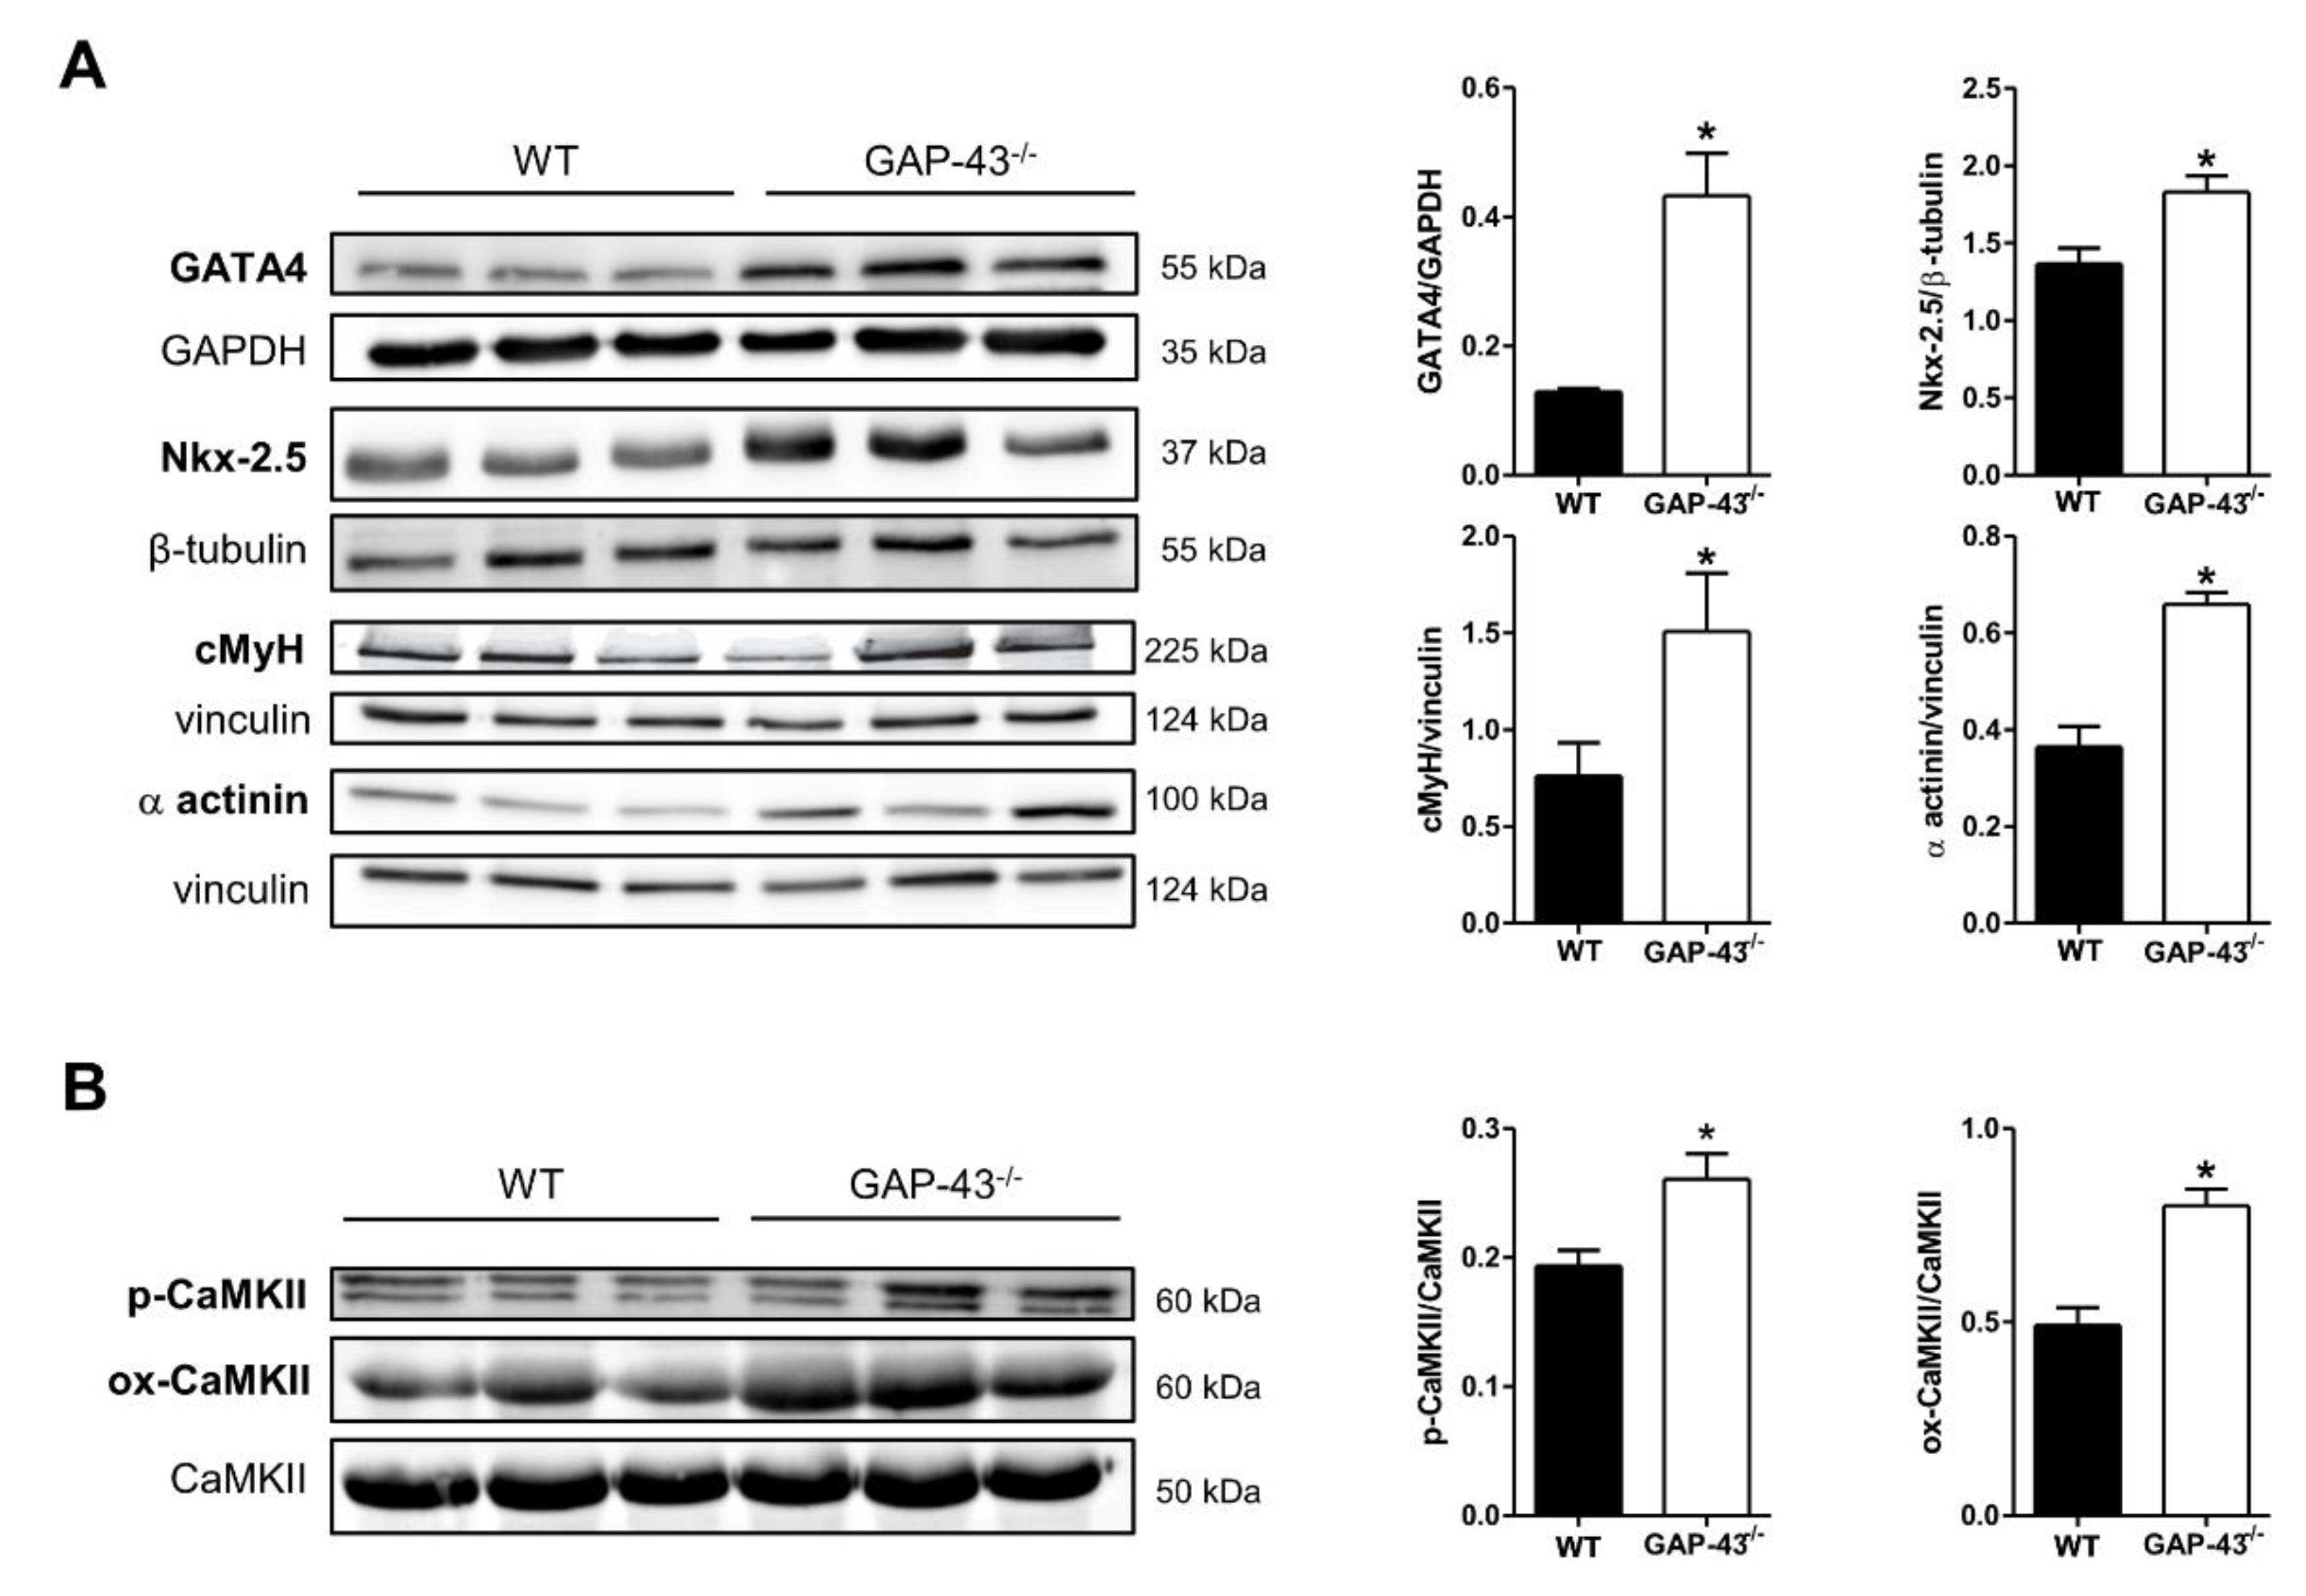
3.1. GAP-43 Knockout Cardiomyocytes Express a Hypertrophic Phenotype

Previous studies carried out from our laboratory on newborn GAP-43-/- mice revealed an increase in cardiac size and bilateral ventricular hypertrophy. To evaluate the presence of markers involved in cardiac hypertrophy, cardiomyocytes isolated from neonatal WT and GAP-43-/- hearts were examined after 7 days of culture. Western blot analyses (Figure 1A) revealed increased expression levels of GATA-4 and Nkx2.5, both transcription factors involved in heart development and hypertrophic growth, in GAP-43-/- cardiomyocytes compared to WT ones.
The presence in knockout cardiomyocytes of a hypertrophic phenotype was also confirmed by increased levels of myofibrillar cardiac proteins as myosin heavy chain and α-actinin. Finally, in GAP-43-/- cardiomyocytes we also found increased levels of phosphorylated and oxidized form of CaMKII (Figure 1B) which are involved in the signaling of Ca2+ mediated- or regulated-activities as excitation-contraction and excitation-transcription coupling.

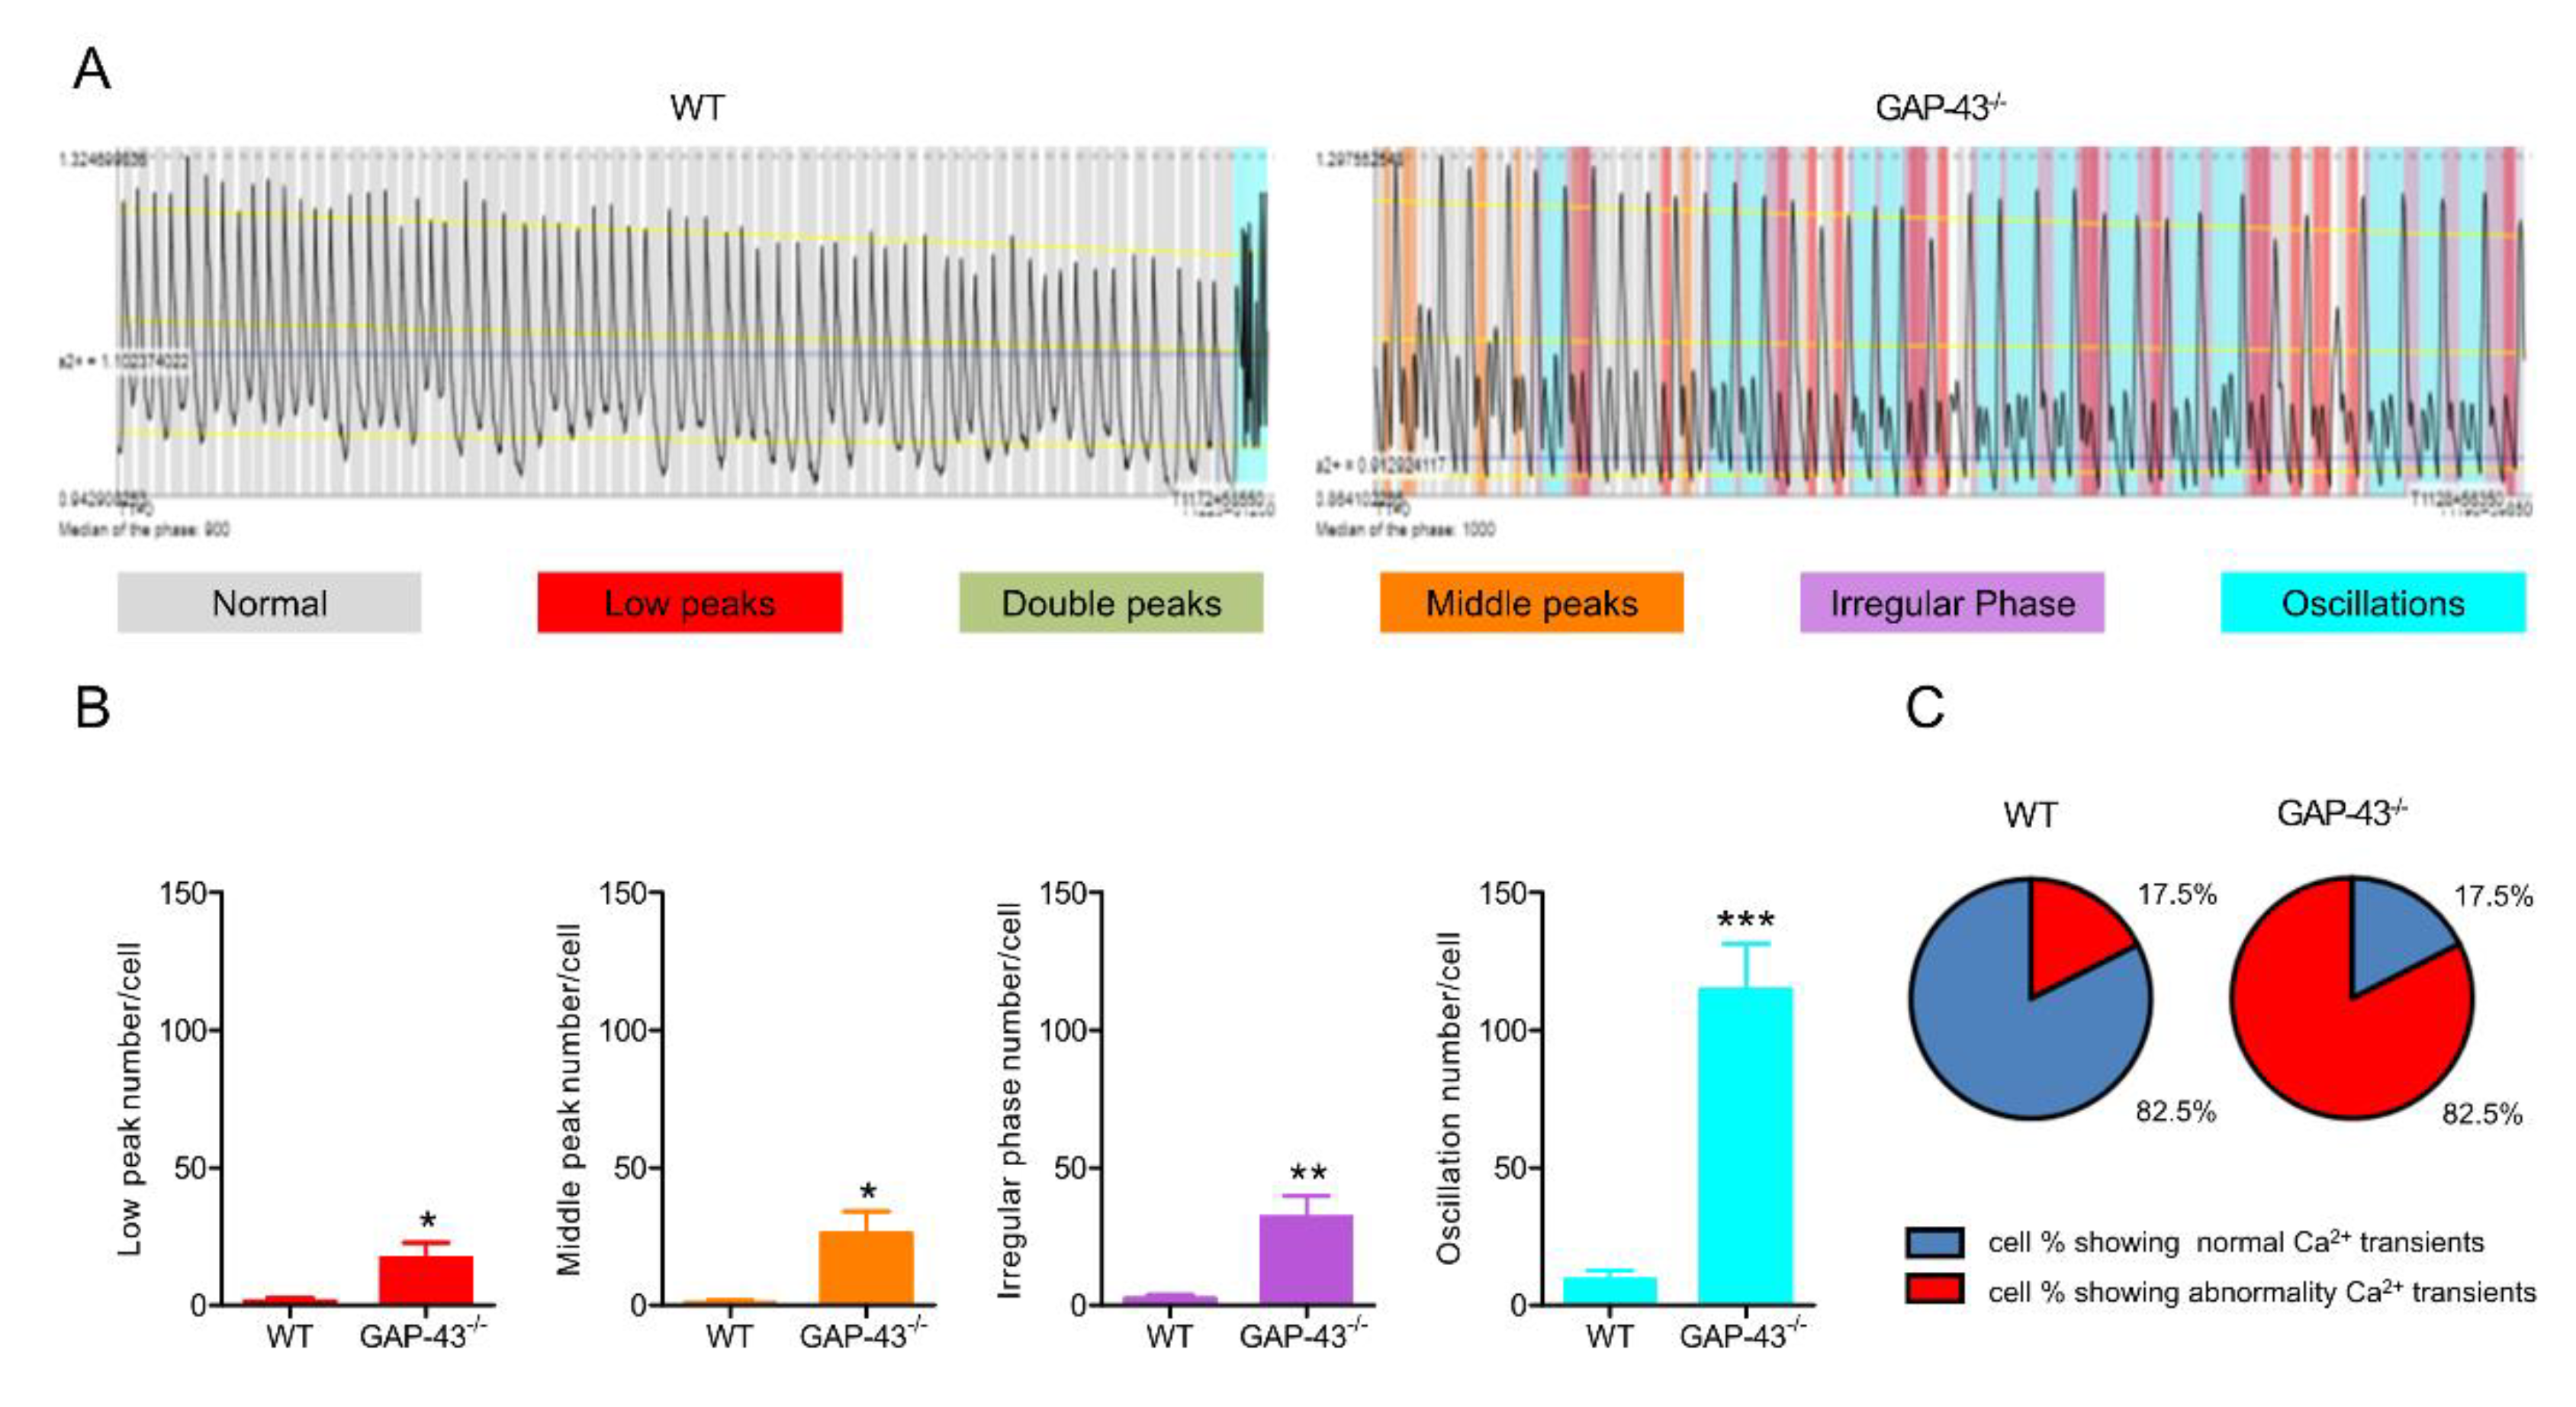
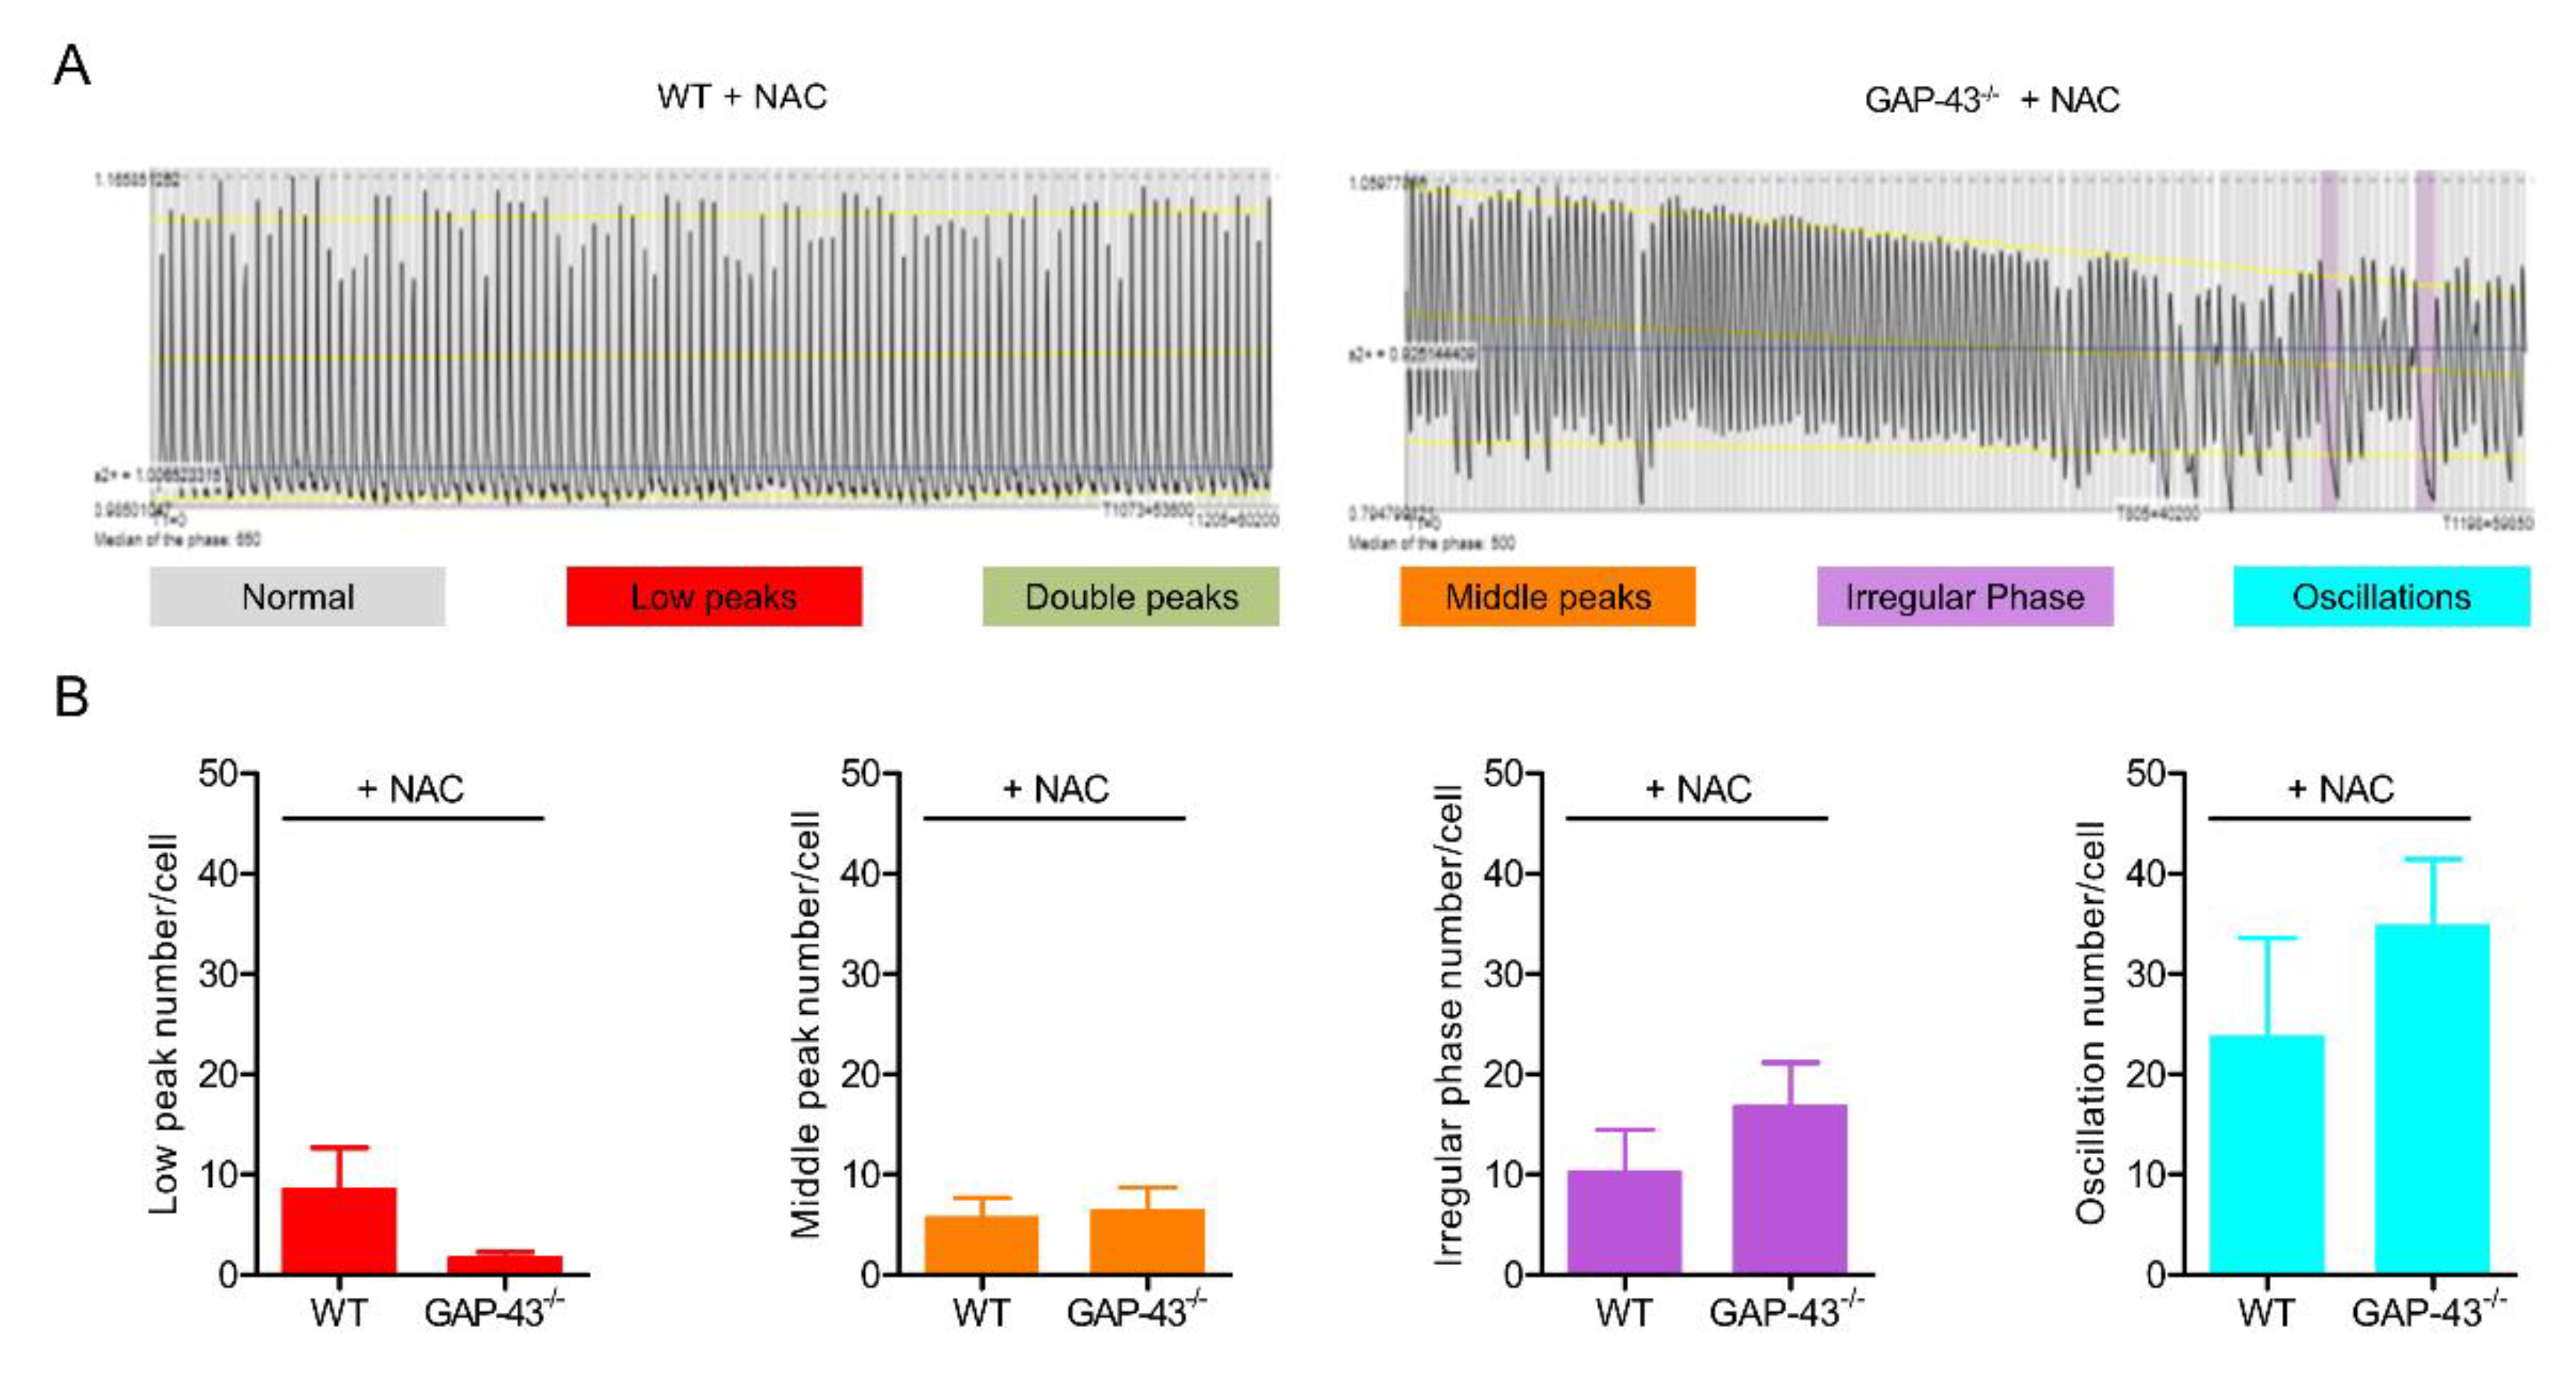
3.2. GAP-43 Knockout Cardiomyocytes Show Intracellular Ca2+ Dyshomeostasis.

Intracellular Ca2+ is a critical regulator of cardiomyocyte function. In heart contraction, it acts not only as link between electrical signal and mechanical coupling, but also controls numerous cardiomyocyte activities, including gene transcription and mitochondrial functions. For this reason, we investigated the spontaneous Ca2+ oscillations in WT and GAP-43-/- cardiomyocytes (supplemental materials Video S2 and S3 respectively). We used conventional fluorescence video microscopy in living cells loaded with the Ca2+ probe Fluo-4 analyzing the patterns recorded using a software tool (Anomaly Explorer) capable of highlighting anomalies in the spontaneous oscillations of intracellular Ca2+ (Figure 2A).
Results from this approach revealed that a high number of GAP-43-/-cardiomyocytes showed the presence of abnormalities in the spontaneous intracellular Ca2+ oscillations, this number was more than 4 folds higher than WT one (Figure 2C). Moreover, among the anomalies recognized, we found that the presence of low peak, middle peak, irregular phase and oscillation appeared to be significantly increased in GAP-43-/- cardiomyocytes in comparison to WT ones (Figure 2B). Interestingly, the treatment of cardiomyocytes with 20µM W7, a CaM inhibitor, was able to drastically reduce the number of GAP-43-/- cardiomyocytes showing abnormalities and differences observed in the subgroups of anomalies recognized (Figure 3B).
Interestingly, also the treatment of the GAP-43-/- cardiomyocytes with 1mM NAC, an antioxidant, reduced the alterations in the spontaneous Ca2+ oscillations, although to a lesser extent than the treatment with W7 (Figure 4).

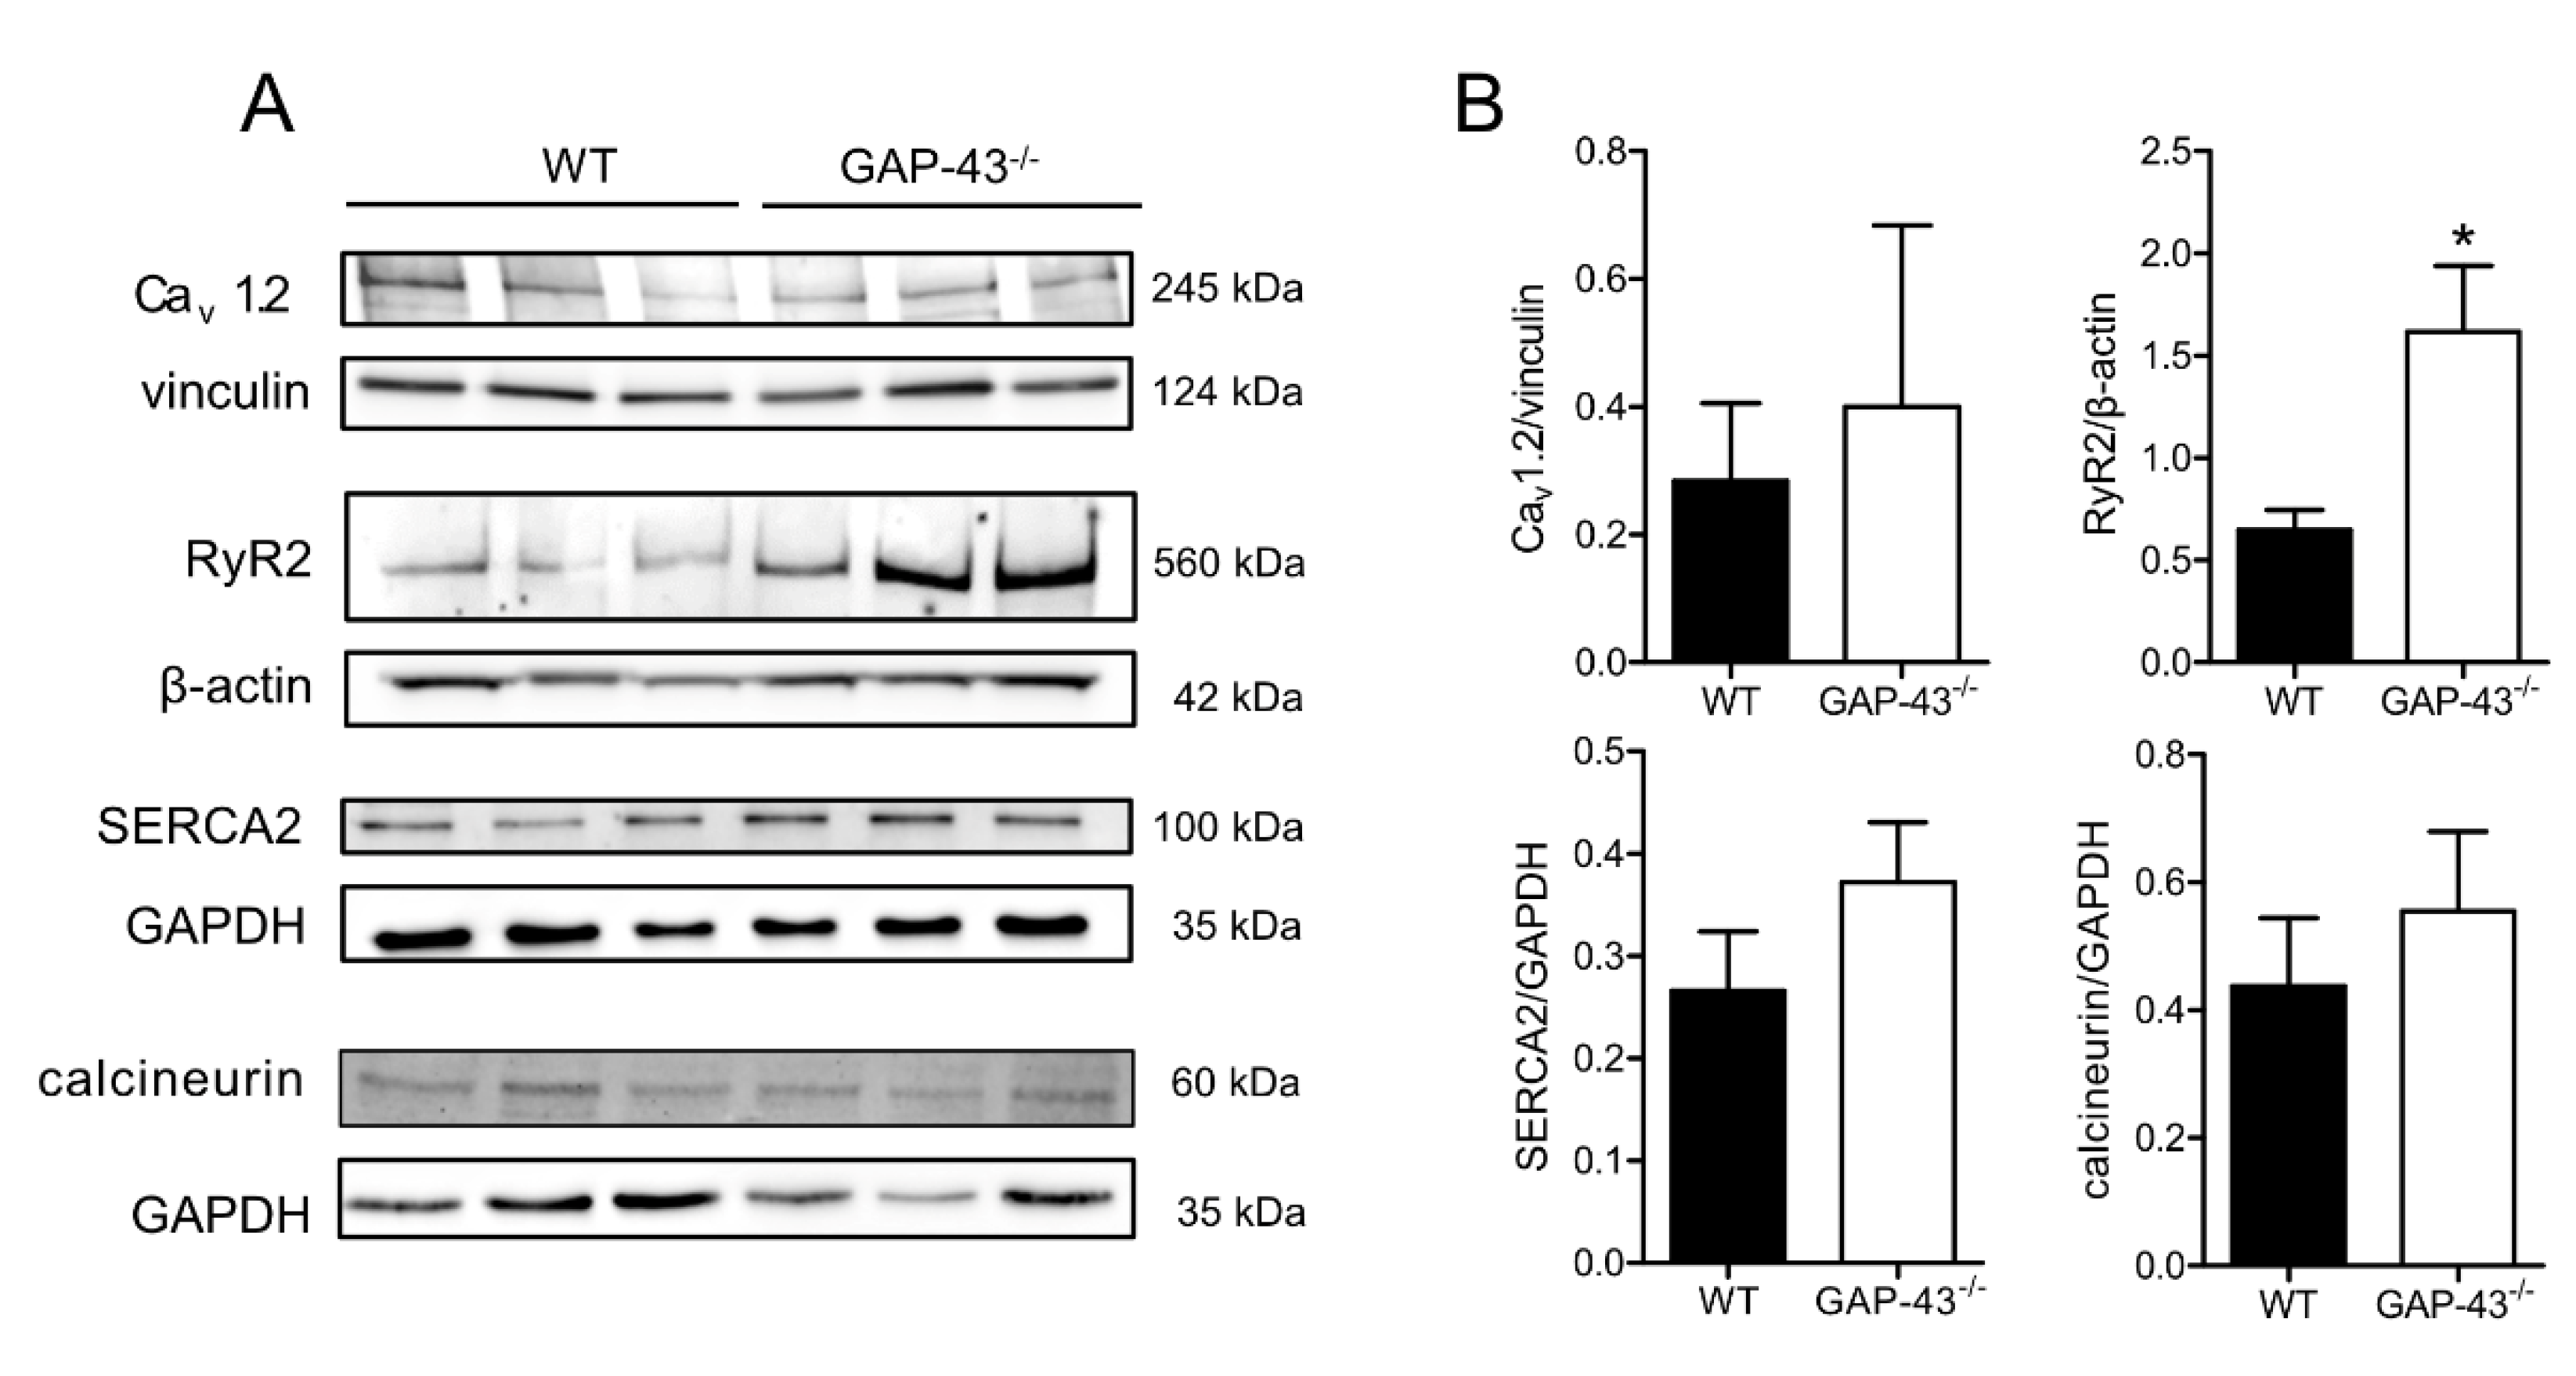
3.3. Expression Levels of Ca2+ Handling Proteins

Considering the importance of Ca2+ homeostasis in cardiomyocytes we evaluated the expression levels of sarcolemma, sarcoplasmic reticulum and cytosolic proteins involved in intracellular Ca2+ handling (Figure 5).
In GAP-43-/- cardiomyocytes, we observed a slight increase, although not significant, in the expression of the voltage-dependent Ca2+ channel Cav1.2, while the expression of ryanodine receptor type 2 (RyR2) was significantly increased, and the sarcoplasmic reticulum Ca2+-ATP pump type 2 (SERCA2) expression level did not change. The rise of intracellular Ca2+ in cardiomyocytes is sensed by Ca2+-activated protein phosphatase calcineurin, that are involved in the regulation of many cardiac functions. In this regard, we found unchanged the calcineurin levels in GAP-43-/- cardiomyocytes (Figure 5A and B).

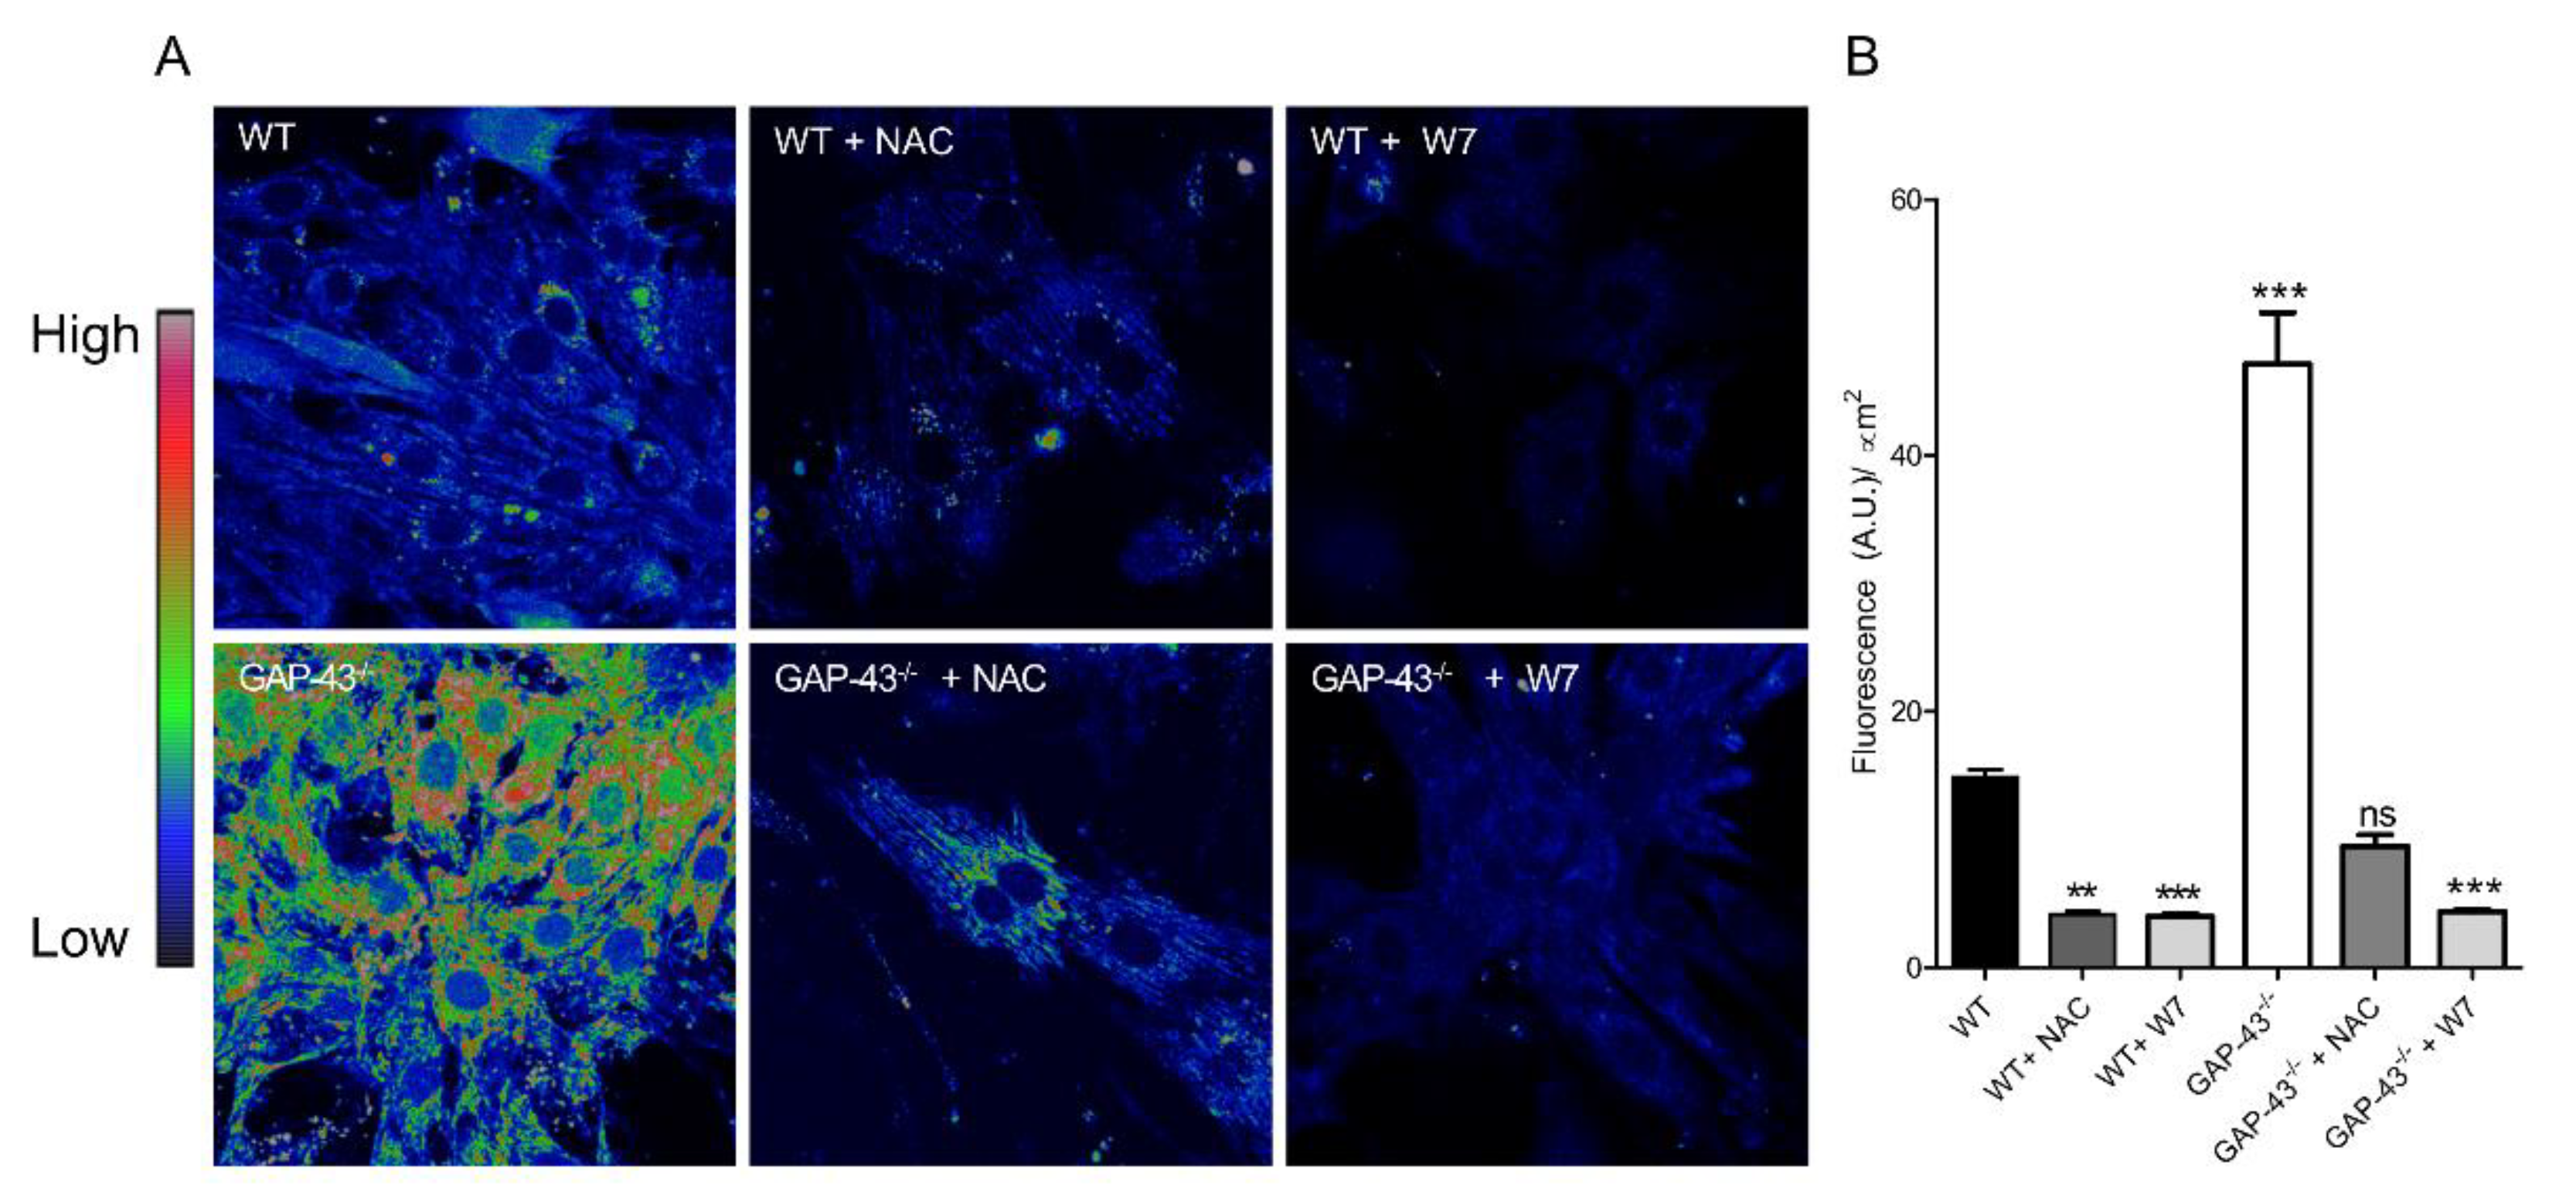
3.4. GAP43-/- Cardiomyocytes Produce Increased Amounts of ROS.

Given the crosstalk between Ca2+ homeostasis and oxidative stress, ROS levels were assayed using a specific dye (H2DCF-DA) and confocal microscopy (Figure 6a). The results showed that ROS levels were about three folds greater in GAP-43-/- cardiomyocytes compared to WT ones (Figure 4b). As expected, the administration of the antioxidant NAC (1mM) decreased ROS levels, and, interestingly, in the presence of the specific inhibitor of CaM (20 µM W7), ROS levels increase was strongly reduced in GAP-43-/- cardiomyocytes. To note, we observed a significant reduction in ROS levels also in WT treated with W7 or NAC (Figure 6b).
Starting from this evidence we investigated the expression levels of NOX2, one of the main cytoplasmic enzymes capable of generating ROS, and of the antioxidant enzymes SOD1, SOD2 and catalase. No significant differences were found between the tested genotypes (see supplemental material Figure S1: Expression of pro-oxidant and antioxidant enzymes)

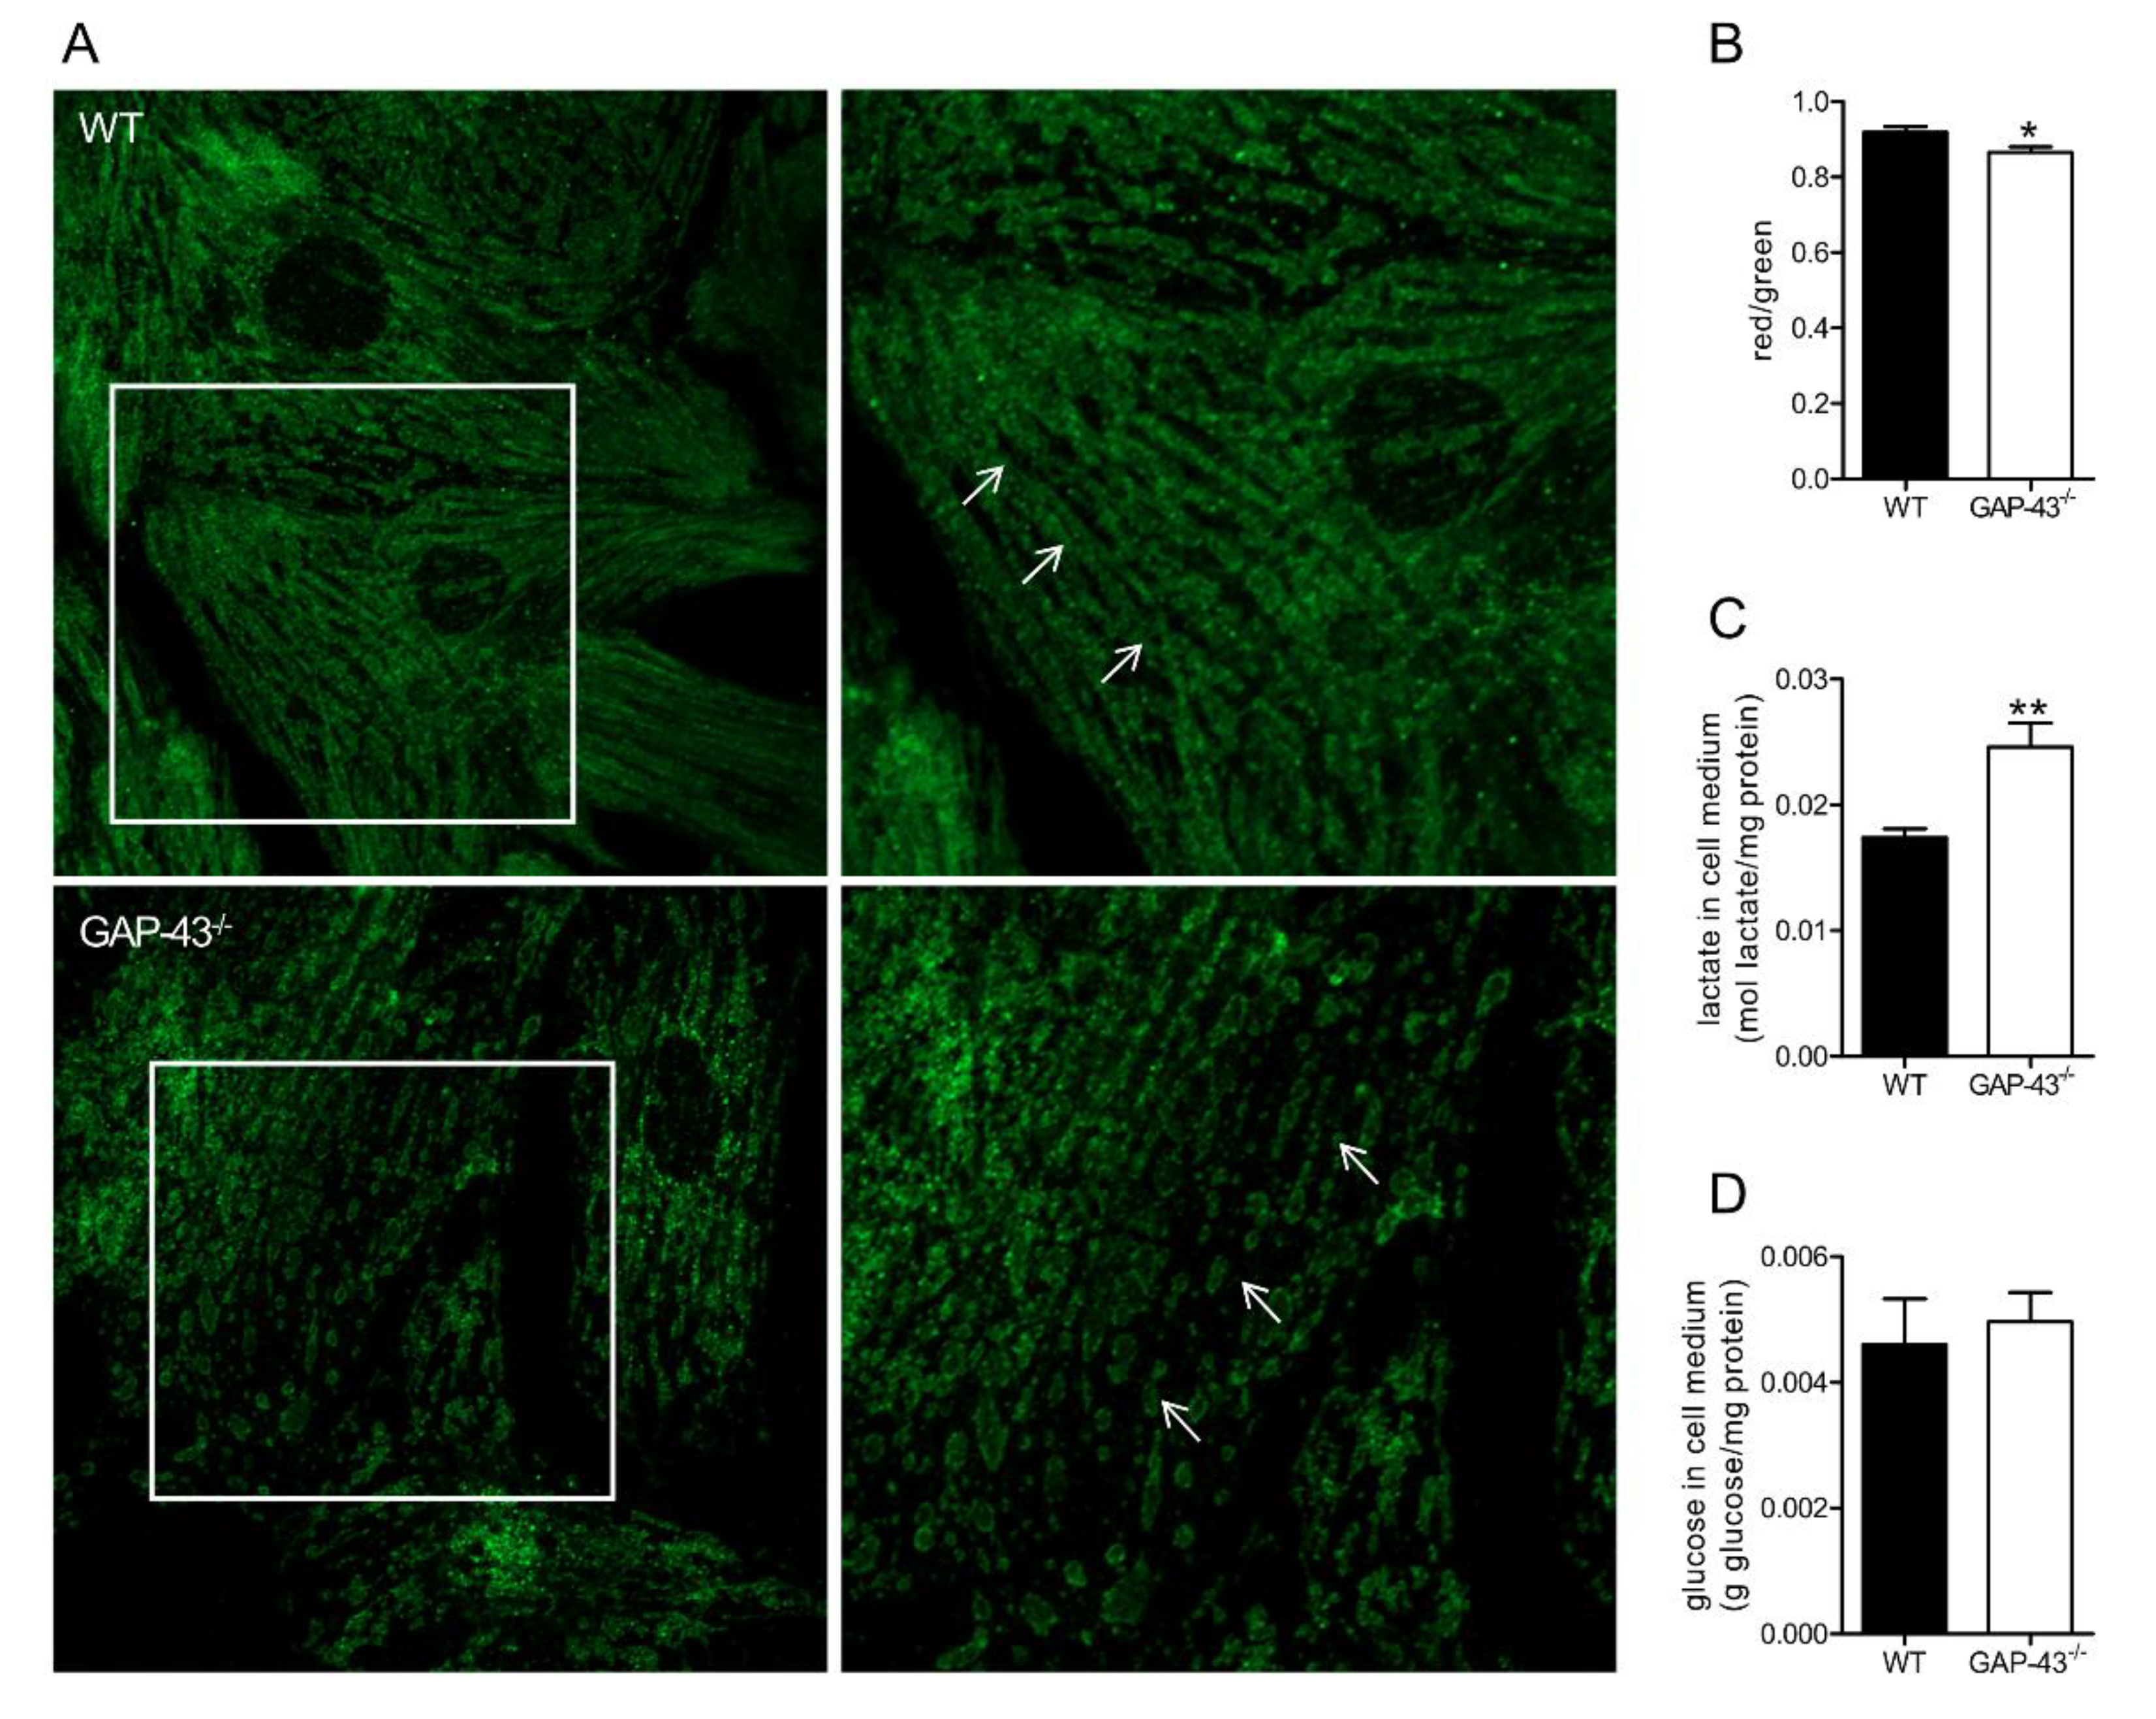
3.5. GAP-43-/- Mitochondria Show Altered Morphology and Metabolism

Considering the increased ROS levels in GAP-43-/- cardiomyocytes we evaluated the morphological aspects of mitochondria and analyzed features of mitochondria functionality. Mitochondria morphology was highlighted by the staining of outer membrane translocase 20 (TOM20) and images were acquired by confocal microscopy (Figure 7). The immunofluorescence staining depicted in WT cardiomyocytes a higher proportion of elongated mitochondria than in GAP-43-/- ones in which mitochondria appeared more spheroid- or donut-like shaped (Figure 7A). To verify whether the morphological alterations were also accompanied by differences in mitochondrial health we used JC-1 to measure the degree of mitochondrial polarization. These experiments revealed that the mitochondrial membrane potential was reduced in GAP-43-/- cardiomyocytes in comparison to WT ones (Figure 7B), indicating the presence of unhealthy mitochondria. Furthermore, indirect evidences of an altered mitochondria metabolism in GAP-43-/- cardiomyocytes came from increased levels of lactate without a corresponding glucose consumption found in culture medium of GAP-43-/- cardiomyocytes (Figure 7C and D).

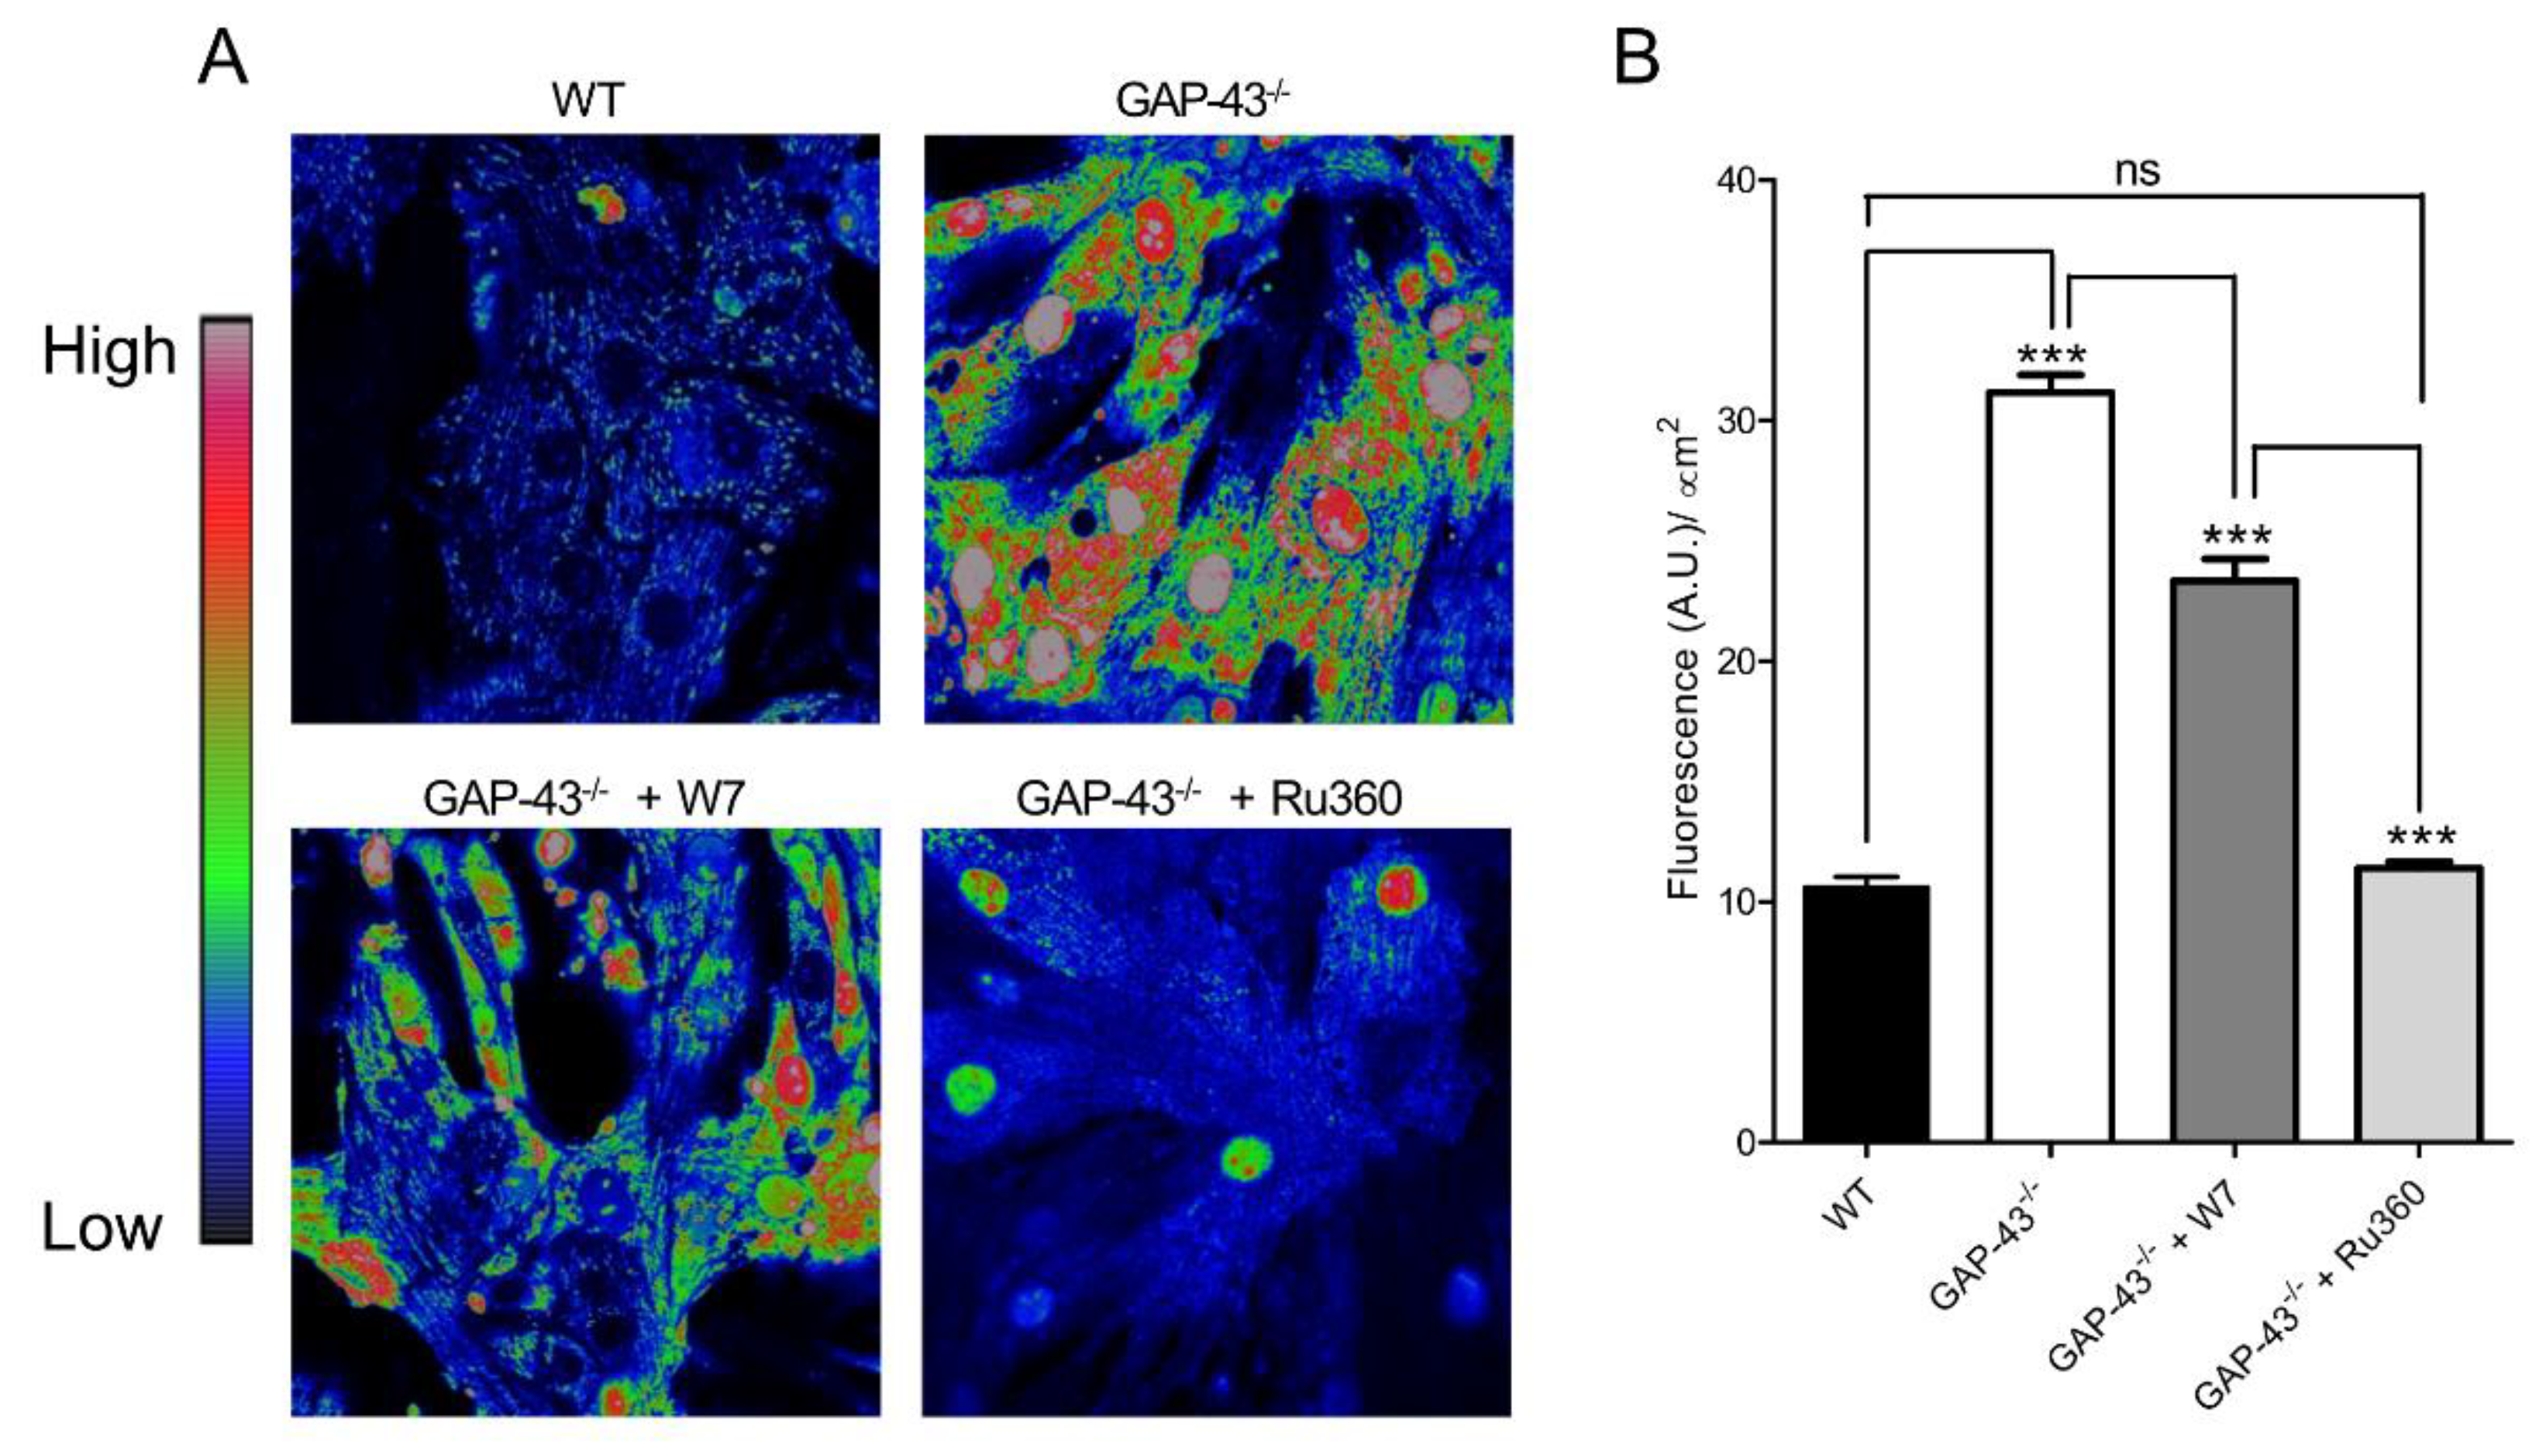
3.5. GAP-43-/- Mitochondria Shows Ca2+ Overload and Superoxide Production

To explain the morphological and functional alterations of mitochondria, considering the results on Ca2+ homeostasis reported above, we analyzed the Ca2+ content in mitochondria by using confocal microscopy and two dyes: Fluo-4 and MitoTracker Deep Red to highlight Ca2+ levels in mitochondria area (Figure 8A). Compared to WT cardiomyocytes, the GAP-43-/- ones showed an increase in mitochondrial Ca2+ levels, abolished by Ru360, a specific inhibitor of mitochondrial Ca2+ uniporter (MCU) which allows Ca2+ entry in mitochondria (Figure 8B).
The excessive mitochondrial oxidative stress is critically dependent on mitochondrial Ca2+ loading that promoted a large production of ROS. Among those, we evaluated the levels of superoxide anion (O2·−) using MitoSOX and confocal microscopy (Figure 9A). The results showed that O2·− levels were about three folds increased in GAP-43-/- cardiomyocytes’ mitochondria compared to WT ones (Figure 9B). The superoxide anion increase was only partially counteracted by the treatement with W7, a CaM inhibitor (Figure 9B). Interestingly, the presence of Ru360, blocking mitochondrial Ca2+ uptake, abolished the execess of superoxide anion generation observed in GAP-43-/- mitochondria (Figure 9B).

4. Discussion

Since its discovery in rat synaptosomes, more than 30 years ago, much evidence is gathering that GAP-43 could also play a functional role in tissues other than the nervous one. GAP-43, thanks to its IQ domain, can bind CaM, modulating its availability to downstream targets in relationship to intracellular Ca2+ concentration. Past, but also recent evidence from our laboratory, reveals that GAP-43 is expressed in skeletal and cardiac muscles [4,6,7,9], in both tissues it shares similar locations near the Ca2+ release units, and, interestingly, GAP-43 −/− mice develop cardiac hypertrophy [11]. Starting from this evidence, here we demonstrated that, in mouse cardiomyocytes, GAP-43 is involved in the control of intracellular Ca2+ homeostasis and ROS balance that in turn, if altered, can be a cause, or at least contribute to, cardiomyocyte hypertrophy. Hypertrophic stimuli activate a complex signaling cascade involving Ca2+-CaM signaling but also MAPK and PI-3K [18], that converge on to a common program targeting the activity of specific transcription factors as GATA-4 and Nkx-2.5 [19,20]. We found that the hypertrophic phenotype is maintained in in vitro isolated GAP-43-/- cardiomyocytes, indicating that the hypertrophic program is probably induced by the lack of expression of GAP-43. Indeed, after dissociation and 7 days of culture, GAP-43-/- cardiomyocytes, compared to WT, maintained higher expression levels of GATA-4 and Nkx-2.5, this would lead to the exclusion of external regulatory factors, as overloading pressure, promoting the hypothesis that the absence of GAP-43 could activate a hypertrophic program. In this respect, in our experimental condition we found that GAP-43-/- cardiomyocytes expressed increased levels of cMyH and α-actinin both markers of cardiac hypertrophy [21].
One emerging evidence from our study is related to the disruption of Ca2+ homeostasis in GAP-43-/- cardiomyocytes. In cardiac cells, Ca2+ has a central role in triggering contraction and relaxation processes, but it is also involved in mediating intracellular signaling directly or through Ca2+-CaM complex [22]. Similar alterations in the pattern of spontaneous Ca2+ oscillations were found also in GAP-43-/- myotubes, highlighting a common mechanism involving GAP-43 and CaM in the control of Ca2+ homeostasis in striated muscles [9]. This aspect is also confirmed by the evidence that W7, a CaM inhibitor, counteracted the Ca2+ alterations in GAP-43-/- cardiomyocytes. Interestingly, GAP-43 localizes in papillary muscle of adult mice close to α-actinin depicting spots at the two sides of the Z-line [11]. This localization could reflect the functional role of GAP-43 in cardiac muscle; indeed, in a position close to the dyads, GAP-43 interacting with CaM could take a place in modulating the dyads Ca2+ release during the contraction/relaxation process. Due to its physiological role, alterations of Ca2+ homeostasis are known as a major contributor to the heart dysfunction, as it plays a central role in systolic and diastolic changes, arrhythmogenesis, and hypertrophy [23,24]. In cardiac myocytes the systolic Ca2+ transient occurs when Ca2+ is released from the sarcoplasmic reticulum (SR). The SR Ca2+ release is triggered by Ca2+ influx, through L-type Ca2+ channels involving RYR2 channels by Ca2+ induced-Ca2+ release (CICR) mechanism. From the analysis of the expression of the main proteins involved in intracellular Ca2+ signaling we observed an increase in RYR2 proteins in GAP-43-/- cardiomyocytes, while Cav 1.2 and SERCA2 were unchanged. Alterations in Ca2+ handling proteins, unbalancing the ratio between Ca2+ release and storage, not only can induce abnormality of CICR but is also associated with cardiac hypertrophy [25,26]. Numerous evidences indicate the critical role of the CaM-RYR2 interaction in the fine regulation of SR Ca2+ release, where alterations in the interaction of these proteins can develop heart disease [27,28,29]. Alterations in intracellular Ca2+ homeostasis can have an effect also on CaMKII activity. In GAP-43 −/− cardiomyocytes we found a significant increase in the active/phosphorylated form of CaMKII, this result is in line with evidences linking frequency of Ca2+ oscillations to Ca/CaM elevations and CaMKII transition in the phosphorylated state [30]. Phosphorylated CaMKII is a key element in cardiomyocyte physiology due to its ability to regulate numerous signaling linked to excitation-contraction coupling and excitation-transcription coupling [31]. It is interesting to note that CaM and CaMKII are localized in many sites in the cardiomyocytes, including the nucleus however, the highest concentrations appear at the transverse tubules where excitation-contraction coupling occurs and where we found located also the GAP-43 [11,32]. So, here the loss of interaction of GAP-43 -/- and CaM could be responsible for an altered CaMKII activity. We found that GAP-43 -/- cardiomyocytes are more prone to produce ROS. Treatment of GAP-43-/- cardiomyocytes with an antioxidant such as NAC reduce ROS production although to a less significant extent compared to control cultures. However, the use of W7, capable of inhibiting CaM-dependent activities, appears to be more effective in significantly reducing ROS levels. This effect appears to be accompanied by an altered mitochondria morphology with the appearance of donut-shaped mitochondria in GAP-43-/- cardiomyocyte indicative of an alteration of mitochondrial functionality. Indeed, the presence of a metabolic unbalance in these mitochondria is supported by a modest but significant reduction in mitochondrial membrane potential and an increase in lactate production, although glucose consumption does not appear to be altered. These findings are particularly significant since much evidence suggests that a variation in the redox status in cardiomyocytes can cause or contribute to the development of a hypertrophic phenotype [33,34]. To deeply investigate the relationship between Ca2+ dyshomeostasis and ROS imbalance observed, we took into consideration the involvement of the mitochondrial Ca2+ uniporter. The comparison of mitochondrial Ca2+ levels in GAP43-/- and WT cardiomyocytes highlighted a significant increase of mitochondrial Ca2+ in the former, this increase was blocked using Ru360, an MCU inhibitor. Increased mitochondrial Ca2+ levels, via MCU observed in GAP-43-/- cardiomyocytes correlates with what is known in the literature in relation to the interplay between mitochondrial respiration/production of free radicals and Ca2+ oscillations [35]. The major mitochondria redox molecules are the superoxide anion radical (O2•−) and the hydrogen peroxide. Mainly, O2•− is produced in the electron transfer chains in mitochondria generated by electrons that leak from complex I and III that reduce O2 [36]. Investigating superoxide anion production, we found that mitochondria of GAP43-/- cardiomyocytes showed a significant increase in superoxide anion levels, blunted by W7, but completely reversed by Ru360. Also other Authors reported that the reduction of expression levels of MCU by mean of shRNA or its inhibition using Ru360 prevented mitochondrial Ca2+ overload in hypertrophic models [37]. From another side it has been reported that mitochondrial Ca2+ accumulation by MCU enhancer promotes proarrhythmic spontaneous Ca2+ waves in rat ventricular myocytes that in turn had detrimental effects on intracellular Ca2+ handling and ROS production [38]. MCU complex is finely regulated in heart in physiological and pathological conditions (i.e. cardiac hypertrophy), implying that its function is dynamically regulated based on the context [39]. In GAP-43-/- model we observed that both intracellular Ca2+ and ROS levels are imbalanced. The increased levels of ROS can lead to an oxidation of CaMKII that can also shift the activation of CaMKII from a Ca/CaM dependent to an independent mode, favoring and prolonging its activation state. Indeed, it has been demonstrated that Ca/CaM independent activity of CaMKII is also a consequence of conditions that promote CaMKII oxidation, [40]. CaMKII activation can potentially increase or downregulate myriad genes and the proteins they encode. In fact, on one hand, some isoforms as CaMKIIδC activates cardiomyocyte apoptosis program by way of mitochondrial death pathway [41,42], on the other hand CaMKIIδB promotes cardiomyocyte survival and growth. This latter aspect appears to be promoted by CaMKII by means of two signaling ways: phosphorylation of HSF1 and HSP70 triggering [43] or GATA-4 mediated co-activation and induction of the antiapoptotic protein Bcl-2 [44]. Even if we have not direct indication of isoform preferentially activated in our experiments, we found an increased expression of GATA-4 that is in line with the pro-survival/hypertrophic program activated in GAP-43 −/− cardiac tissue as we previously demonstrated [11].

5. Conclusions

In conclusion, our results suggest that GAP-43 has a role in controlling intracellular Ca2+ concentration and ROS levels in cardiac cells. The absence of GAP43 could alter normal CaM signaling resulting in increased calcium levels with mitochondrial calcium overload favoring the increase of ROS and a sustained activation of CaMKII which could be the cause, or contribute, to the activation of transcriptional signals leading to the observed hypertrophy. The evidence that the absence of GAP-43 also favors a hypertrophic phenotype in vitro opens new perspectives in this field of research, which will therefore require further investigation in the future.

Supplementary Materials

The following supporting information can be downloaded at the website of this paper posted on Preprints.org, Figure S1: Expression of pro-oxidant and antioxidant enzymes; Video S2: WT cardiomyocytes spontaneous Ca2+ oscillations; Video S3: GAP-43−/− cardiomyocytes spontaneous Ca2+ oscillations

Author Contributions

Conceptualization, Simone Guarnieri; Data curation, Michele Bevere and Caterina Morabito; Formal analysis, Maria Mariggiò; Funding acquisition, Simone Guarnieri; Investigation, Michele Bevere, Caterina Morabito, Delia Verucci and Noemi Di Sinno; Supervision, Simone Guarnieri; Writing – original draft, Simone Guarnieri; Writing – review & editing, Michele Bevere, Caterina Morabito and Maria Mariggiò.

Funding

This work was supported by “G. d'Annunzio” University research funds to SG and MAM, and by Ministero dell’Università e della Ricerca grant PRIN 2022 PNRR CUP D53D23021680001 “Ionic mechanisms involved in cardiomyopathy: novel pharmacological targets”

Institutional Review Board Statement

The animal study protocol was approved by the Institutional Review Board “Organismo preposto al Benessere Animale (OpBA)” of “G. d'Annunzio” University and Italian Ministry of Health (protocol code F4738.N.0Z9/ 03 April 2023).”

Data Availability Statement

The data supporting the conclusions of this article will be made available by the authors on request.

Conflicts of Interest

The authors declare no conflict of interest.

References

  1. Strittmatter, S.M.; Fankhauser, C.; Huang, P.L.; Mashimo, H.; Fishman, M.C. Neuronal pathfinding is abnormal in mice lacking the neuronal growth cone protein GAP-43. Cell 1995, 80, 445–452. [Google Scholar] [CrossRef] [PubMed]
  2. da Cunha, A.; Vitkovic, L. Regulation of immunoreactive GAP-43 expression in rat cortical macroglia is cell type specific. J Cell Biol 1990, 111, 209–215. [Google Scholar] [CrossRef] [PubMed]
  3. Deloulme, J.C.; Janet, T.; Au, D.; Storm, D.R.; Sensenbrenner, M.; Baudier, J. Neuromodulin (GAP43): a neuronal protein kinase C substrate is also present in 0-2A glial cell lineage. Characterization of neuromodulin in secondary cultures of oligodendrocytes and comparison with the neuronal antigen. J Cell Biol 1990, 111, 1559–1569. [Google Scholar] [CrossRef] [PubMed]
  4. Stocker, K.M.; Ciment, G.; Baizer, L. GAP-43 in non-neuronal cells of the embryonic chick limb: clues to function. Perspect Dev Neurobiol 1992, 1, 53–62. [Google Scholar]
  5. Heuss, D.; Schlotzer-Schrehardt, U. Subcellular localization of phosphoprotein B-50 in regenerating muscle. An immuno-electron microscopic study. Neurol Res 1998, 20, 360–364. [Google Scholar] [CrossRef]
  6. Guarnieri, S.; Morabito, C.; Paolini, C.; Boncompagni, S.; Pilla, R.; Fano-Illic, G.; Mariggio, M.A. Growth associated protein 43 is expressed in skeletal muscle fibers and is localized in proximity of mitochondria and calcium release units. PLoS One 2013, 8, e53267. [Google Scholar] [CrossRef]
  7. Caprara, G.A.; Perni, S.; Morabito, C.; Mariggio, M.A.; Guarnieri, S. Specific association of growth-associated protein 43 with calcium release units in skeletal muscles of lower vertebrates. European journal of histochemistry : EJH 2014, 58, 2453. [Google Scholar] [CrossRef]
  8. Mosevitsky, M.I. Nerve ending "signal" proteins GAP-43, MARCKS, and BASP1. Int Rev Cytol 2005, 245, 245–325. [Google Scholar]
  9. Caprara, G.A.; Morabito, C.; Perni, S.; Navarra, R.; Guarnieri, S.; Mariggio, M.A. Evidence for Altered Ca(2+) Handling in Growth Associated Protein 43-Knockout Skeletal Muscle. Frontiers in physiology 2016, 7, 493. [Google Scholar] [CrossRef]
  10. Rahmati, M.; Taherabadi, S.J. The effects of exercise training on Kinesin and GAP-43 expression in skeletal muscle fibers of STZ-induced diabetic rats. Scientific reports 2021, 11, 9535. [Google Scholar] [CrossRef]
  11. Bevere, M.; Morabito, C.; Guarnieri, S.; Mariggio, M.A. Mice lacking growth-associated protein 43 develop cardiac remodeling and hypertrophy. Histochemistry and cell biology 2022, 157, 547–556. [Google Scholar] [CrossRef] [PubMed]
  12. Helms, A.S.; Alvarado, F.J.; Yob, J.; Tang, V.T.; Pagani, F.; Russell, M.W.; Valdivia, H.H.; Day, S.M. Genotype-Dependent and -Independent Calcium Signaling Dysregulation in Human Hypertrophic Cardiomyopathy. Circulation 2016, 134, 1738–1748. [Google Scholar] [CrossRef] [PubMed]
  13. Turrens, J.F. Mitochondrial formation of reactive oxygen species. J Physiol 2003, 552, 335–344. [Google Scholar] [CrossRef] [PubMed]
  14. Aon, M.A.; Cortassa, S.; Marban, E.; O'Rourke, B. Synchronized whole cell oscillations in mitochondrial metabolism triggered by a local release of reactive oxygen species in cardiac myocytes. J Biol Chem 2003, 278, 44735–44744. [Google Scholar] [CrossRef]
  15. Penttinen, K.; Siirtola, H.; Avalos-Salguero, J.; Vainio, T.; Juhola, M.; Aalto-Setala, K. Novel Analysis Software for Detecting and Classifying Ca2+ Transient Abnormalities in Stem Cell-Derived Cardiomyocytes. PLoS One 2015, 10, e0135806. [Google Scholar] [CrossRef]
  16. Morabito, C.; Rovetta, F.; Bizzarri, M.; Mazzoleni, G.; Fano, G.; Mariggio, M.A. Modulation of redox status and calcium handling by extremely low frequency electromagnetic fields in C2C12 muscle cells: A real-time, single-cell approach. Free Radic Biol Med 2010, 48, 579–589. [Google Scholar] [CrossRef]
  17. Berardini, M.; Gesualdi, L.; Morabito, C.; Ferranti, F.; Reale, A.; Zampieri, M.; Karpach, K.; Tinari, A.; Bertuccini, L.; Guarnieri, S.; et al. Simulated Microgravity Exposure Induces Antioxidant Barrier Deregulation and Mitochondria Enlargement in TCam-2 Cell Spheroids. Cells 2023, 12. [Google Scholar] [CrossRef]
  18. Tham, Y.K.; Bernardo, B.C.; Ooi, J.Y.; Weeks, K.L.; McMullen, J.R. Pathophysiology of cardiac hypertrophy and heart failure: signaling pathways and novel therapeutic targets. Arch Toxicol 2015, 89, 1401–1438. [Google Scholar] [CrossRef]
  19. Liang, Q.; De Windt, L.J.; Witt, S.A.; Kimball, T.R.; Markham, B.E.; Molkentin, J.D. The transcription factors GATA4 and GATA6 regulate cardiomyocyte hypertrophy in vitro and in vivo. J Biol Chem 2001, 276, 30245–30253. [Google Scholar] [CrossRef]
  20. Akazawa, H.; Komuro, I. Roles of cardiac transcription factors in cardiac hypertrophy. Circ Res 2003, 92, 1079–1088. [Google Scholar] [CrossRef]
  21. Ridinger, H.; Rutenberg, C.; Lutz, D.; Buness, A.; Petersen, I.; Amann, K.; Maercker, C. Expression and tissue localization of beta-catenin, alpha-actinin and chondroitin sulfate proteoglycan 6 is modulated during rat and human left ventricular hypertrophy. Exp Mol Pathol 2009, 86, 23–31. [Google Scholar] [CrossRef] [PubMed]
  22. Sorensen, A.B.; Sondergaard, M.T.; Overgaard, M.T. Calmodulin in a heartbeat. FEBS J 2013, 280, 5511–5532. [Google Scholar] [CrossRef] [PubMed]
  23. Bers, D.M. Altered cardiac myocyte Ca regulation in heart failure. Physiology (Bethesda) 2006, 21, 380–387. [Google Scholar] [CrossRef]
  24. Mazeto, I.F.S.; Okoshi, K.; Silveira, C.; Sant'Ana, P.G.; Silva, V.L.D.; Mota, G.A.F.; Souza, S.L.B.; Vileigas, D.F.; Padovani, C.R.; Cicogna, A.C. Calcium homeostasis behavior and cardiac function on left ventricular remodeling by pressure overload. Braz J Med Biol Res 2021, 54, e10138. [Google Scholar] [CrossRef] [PubMed]
  25. Yano, M.; Ikeda, Y.; Matsuzaki, M. Altered intracellular Ca2+ handling in heart failure. J Clin Invest 2005, 115, 556–564. [Google Scholar] [CrossRef]
  26. Muth, J.N.; Bodi, I.; Lewis, W.; Varadi, G.; Schwartz, A. A Ca(2+)-dependent transgenic model of cardiac hypertrophy: A role for protein kinase Calpha. Circulation 2001, 103, 140–147. [Google Scholar] [CrossRef]
  27. Yamaguchi, N.; Takahashi, N.; Xu, L.; Smithies, O.; Meissner, G. Early cardiac hypertrophy in mice with impaired calmodulin regulation of cardiac muscle Ca release channel. J Clin Invest 2007, 117, 1344–1353. [Google Scholar] [CrossRef]
  28. Xu, X.; Yano, M.; Uchinoumi, H.; Hino, A.; Suetomi, T.; Ono, M.; Tateishi, H.; Oda, T.; Okuda, S.; Doi, M.; et al. Defective calmodulin binding to the cardiac ryanodine receptor plays a key role in CPVT-associated channel dysfunction. Biochem Biophys Res Commun 2010, 394, 660–666. [Google Scholar] [CrossRef]
  29. Ono, M.; Yano, M.; Hino, A.; Suetomi, T.; Xu, X.; Susa, T.; Uchinoumi, H.; Tateishi, H.; Oda, T.; Okuda, S.; et al. Dissociation of calmodulin from cardiac ryanodine receptor causes aberrant Ca(2+) release in heart failure. Cardiovasc Res 2010, 87, 609–617. [Google Scholar] [CrossRef]
  30. De Koninck, P.; Schulman, H. Sensitivity of CaM kinase II to the frequency of Ca2+ oscillations. Science 1998, 279, 227–230. [Google Scholar] [CrossRef]
  31. Bers, D.M. Ca(2)(+)-calmodulin-dependent protein kinase II regulation of cardiac excitation-transcription coupling. Heart Rhythm 2011, 8, 1101–1104. [Google Scholar] [CrossRef] [PubMed]
  32. Bers, D.M.; Grandi, E. Calcium/calmodulin-dependent kinase II regulation of cardiac ion channels. J Cardiovasc Pharmacol 2009, 54, 180–187. [Google Scholar] [CrossRef] [PubMed]
  33. Takimoto, E.; Kass, D.A. Role of oxidative stress in cardiac hypertrophy and remodeling. Hypertension 2007, 49, 241–248. [Google Scholar] [CrossRef] [PubMed]
  34. Sabri, A.; Hughie, H.H.; Lucchesi, P.A. Regulation of hypertrophic and apoptotic signaling pathways by reactive oxygen species in cardiac myocytes. Antioxid Redox Signal 2003, 5, 731–740. [Google Scholar] [CrossRef]
  35. Pitter, J.G.; Maechler, P.; Wollheim, C.B.; Spat, A. Mitochondria respond to Ca2+ already in the submicromolar range: correlation with redox state. Cell Calcium 2002, 31, 97–104. [Google Scholar] [CrossRef]
  36. Kuznetsov, A.V.; Margreiter, R.; Ausserlechner, M.J.; Hagenbuchner, J. The Complex Interplay between Mitochondria, ROS and Entire Cellular Metabolism. Antioxidants (Basel) 2022, 11. [Google Scholar] [CrossRef]
  37. Alves-Figueiredo, H.; Silva-Platas, C.; Estrada, M.; Oropeza-Almazan, Y.; Ramos-Gonzalez, M.; Bernal-Ramirez, J.; Vazquez-Garza, E.; Tellez, A.; Salazar-Ramirez, F.; Mendez-Fernandez, A.; et al. Mitochondrial Ca(2+) Uniporter-Dependent Energetic Dysfunction Drives Hypertrophy in Heart Failure. JACC Basic Transl Sci 2024, 9, 496–518. [Google Scholar] [CrossRef]
  38. Hamilton, S.; Terentyeva, R.; Kim, T.Y.; Bronk, P.; Clements, R.T.; J, O.U.; Csordas, G.; Choi, B.R.; Terentyev, D. Pharmacological Modulation of Mitochondrial Ca(2+) Content Regulates Sarcoplasmic Reticulum Ca(2+) Release via Oxidation of the Ryanodine Receptor by Mitochondria-Derived Reactive Oxygen Species. Frontiers in physiology 2018, 9, 1831. [Google Scholar] [CrossRef]
  39. Zaglia, T.; Ceriotti, P.; Campo, A.; Borile, G.; Armani, A.; Carullo, P.; Prando, V.; Coppini, R.; Vida, V.; Stolen, T.O.; et al. Content of mitochondrial calcium uniporter (MCU) in cardiomyocytes is regulated by microRNA-1 in physiologic and pathologic hypertrophy. Proc Natl Acad Sci U S A 2017, 114, E9006–E9015. [Google Scholar] [CrossRef]
  40. Erickson, J.R.; Joiner, M.L.; Guan, X.; Kutschke, W.; Yang, J.; Oddis, C.V.; Bartlett, R.K.; Lowe, J.S.; O'Donnell, S.E.; Aykin-Burns, N.; et al. A dynamic pathway for calcium-independent activation of CaMKII by methionine oxidation. Cell 2008, 133, 462–474. [Google Scholar] [CrossRef]
  41. Zhu, W.Z.; Wang, S.Q.; Chakir, K.; Yang, D.; Zhang, T.; Brown, J.H.; Devic, E.; Kobilka, B.K.; Cheng, H.; Xiao, R.P. Linkage of beta1-adrenergic stimulation to apoptotic heart cell death through protein kinase A-independent activation of Ca2+/calmodulin kinase II. J Clin Invest 2003, 111, 617–625. [Google Scholar] [CrossRef] [PubMed]
  42. Zhu, W.; Woo, A.Y.; Yang, D.; Cheng, H.; Crow, M.T.; Xiao, R.P. Activation of CaMKIIdeltaC is a common intermediate of diverse death stimuli-induced heart muscle cell apoptosis. J Biol Chem 2007, 282, 10833–10839. [Google Scholar] [CrossRef] [PubMed]
  43. Peng, W.; Zhang, Y.; Zheng, M.; Cheng, H.; Zhu, W.; Cao, C.M.; Xiao, R.P. Cardioprotection by CaMKII-deltaB is mediated by phosphorylation of heat shock factor 1 and subsequent expression of inducible heat shock protein 70. Circ Res 2010, 106, 102–110. [Google Scholar] [CrossRef] [PubMed]
  44. Little, G.H.; Saw, A.; Bai, Y.; Dow, J.; Marjoram, P.; Simkhovich, B.; Leeka, J.; Kedes, L.; Kloner, R.A.; Poizat, C. Critical role of nuclear calcium/calmodulin-dependent protein kinase IIdeltaB in cardiomyocyte survival in cardiomyopathy. J Biol Chem 2009, 284, 24857–24868. [Google Scholar] [CrossRef] [PubMed]
Figure 1. Protein expression levels of key factors involved in cardiac hypertrophy. A. Western blots of GATA4, Nkx-2.5, cMYH and α-actinin proteins derived from WT or GAP-43-/- cardiomyocytes, and the corresponding densitometric analyses. B. Western blots of p-CaMKII and Met281/282 oxidized CaMKII (ox-CaMKII) proteins from WT or GAP-43-/- cardiomyocytes, and the corresponding densitometric analyses. The densitometric analyses in A and B were plotted as the ratio between the optical density (OD) x mm2 of each band and the OD x mm2 of the corresponding loading control (GAPDH, β-tubulin, Vinculin and CaMKII). Data are expressed as means ± S.E.M. from three independent biological samples. * p < 0.05 (Student's t-test).
Preprints 147094 g001
Figure 2. Ca2+ transient abnormalities. A. Representative Ca2+ signal abnormality patterns detected by AnomalyExplorer software [15] in WT (left image) and GAP-43-/- (right image) cardiomyocytes loaded with Fluo-4. Each color-coded represents both normal Ca2+ signals (in gray) and different abnormalities such as low peaks, double peaks, medium peaks, oscillation, irregular phase. B. Quantitative analysis of the different Ca2+ transient abnormalities. The values are means ± S.E.M. from three independent experiments. p < 0.05, **p < 0.01 ***p < 0.001 (Students' t-tests). C. Cake graphs indicate the cell percentage showing different Ca2+ transient signals. A total of 251 WT and 856 GAP-43-/- cardiomyocytes were examined.
Preprints 147094 g002
Figure 3. CaM inhibitor restored Ca2+ dis-homeostasis in GAP-43-/- cardiomyocytes. A. Representative Ca2+ signal abnormality patterns detected by Anomaly Explorer software [15] in WT (left image) and GAP-43-/- (right image) cardiomyocytes loaded with Fluo-4 and treated with 20 μM W7, a CaM inhibitor. Each color-coded represents both normal Ca2+ signals (in gray) and different abnormalities such as low peaks, double peaks, medium peaks, oscillation, irregular phase. B. Quantitative analysis of the different Ca2+ transient abnormalities. The values are means ± S.E.M. from three independent experiments. C. Cake graphs indicate the cell percentage showing different Ca2+ transient signals. A total of 1589 WT and 1547 GAP-43-/- cardiomyocytes were examined.
Preprints 147094 g003
Figure 4. Impact of the antioxidant NAC on spontaneous Ca2+ oscillations in GAP-43-/- cardiomyocytes. A. Representative Ca2+ signal abnormality patterns detected by Anomaly Explorer software [15] in WT (left image) and GAP-43-/- (right image) cardiomyocytes loaded with Fluo-4 and treated with 1 mM NAC, a pharmacological antioxidant. Each color-coded represents both normal Ca2+ signals (in gray) and different abnormalities such as low peaks, double peaks, medium peaks, oscillation, irregular phase. B. Quantitative analysis of the different Ca2+ transient abnormalities. The values are means ± S.E.M. from three independent experiments.
Preprints 147094 g004
Figure 5. Expression levels of Ca2+ handling proteins. A. Immunoblots of Cav 1.2, RyR2, SERCA2 and calcineurin from WT or GAP-43-/- cardiomyocytes. B. Corresponding densitometric analyses of Western blous in panel A. The densitometric analyses are plotted as the ratio between the optical density (OD) x mm2 of each band and the OD x mm2 of the corrisponding loading control (vinculin, β-actin or GAPDH). Data are expressed as means ± S.E.M. from three independent biological samples. *p < 0.05 (Student’s t-test).
Preprints 147094 g005
Figure 6. ROS levels in GAP-43-/- cardiomyocytes. A. Representative confocal images of WT or GAP-43-/- cardiomyocytes without or with 1mM NAC or 20µM W7 loaded with H2DCFDA. B. Quantitative analysis of ROS levels in cardiomyocytes, expressed as a ratio between cell mean fluorescence intensity (Arbitrary Unity, A.U.) and cell area (µm2). The values are means ± SEM from three independent experiments. **p < 0.01 ***p < 0.001, ****p < 0.0001, versus WT (Students' t-tests).
Preprints 147094 g006
Figure 7. Mitochondria morphology and metabolism changes in GAP-43-/- cardiomyocytes. A. Representative confocal images of mitochondria in WT (top panels) and GAP-43-/- (bottom panels) cardiomyocytes immunostained with anti-TOM20 (400x magnification). The right panels are enlarged sections of the white boxes. The white arrows indicate the different mitochondria morphology in WT (top panel) and in GAP-43-/- (bottom panel) cardiomyocytes. B. Mitochondrial membrane potential in WT and GAP-43-/- cardiomyocytes loaded with JC-1, plotted as the ratio between red and green fluorescence of JC-1. Data are means ± S.E.M. from 523 WT and 681 GAP-43-/- cardiomyocytes from three independent experiments. C. Lactate released in cardiomyocyte cell medium. D. Glucose levels in cardiomyocyte cell medium. Data in panels C and D are means ± S.E.M. from six independent experiments of WT cardiomyocyte cultures and from five independent experiments of GAP-43-/- cardiomyocyte cultures. *p < 0.05 ; ** p < 0.01 (Student’s t-tests).
Preprints 147094 g007
Figure 8. Increased mitochondrial Ca2+ levels in GAP-43-/- cardiomyocytes. A. Representative confocal images of WT and GAP-43-/- cardiomyocytes monitored in absence (top images) or presence of Ru360, a specific mitochondrial Ca2+ uptake inhibitor (bottom images). Cells were loaded with Fluo-4 (green fluorescence) and Mitotracker Deep Red (red fluorescence) in order to measure mitochondrial Ca2+ collecting cell ares with green and red fluorescence co-localization. B. Quantitative analysis of mitochondrial Ca2+ levels expressed as mean green fluorescence intensity per cell. Data are mean ± S.E.M. derived from three independent experiments (WT cardiomyocytes: n=739; GAP-43-/- cardiomyocytes: n=415; WT + Ru360 cardiomyocytes: n=551; GAP-43-/- + Ru360 cardiomyocytes: n=546). ***p < 0.001 versus WT , §§§ p < 0.001 versus GAP-43-/- (Student’s t-tests).
Preprints 147094 g008
Figure 9. Increased superoxide anion levels in GAP-43-/- cardiomyocytes. A. Representative confocal images of WT cardiomyocytes and GAP-43-/- cardiomyocytes without (top images) or with W7 or Ru360 (bottom left and bottom right images, respectively) loaded with MitoSOX, a mitochondrial superoxide anion indicator. B. Quantitative analysis of O2●- levels expressed as a ratio between cell mean fluorescence intensity (O2●-) and area unit (µm2). Data derived from three independent experiments (WT cardiomyocytes: n=577, GAP-43-/- cardiomyocytes: n=947, GAP-43-/- + W7 cardiomyocytes: n=908, GAP-43-/- + Ru360 cardiomyocytes: n=808). ***p < 0.001 (Student’s t-tests).
Preprints 147094 g009
Disclaimer/Publisher’s Note: The statements, opinions and data contained in all publications are solely those of the individual author(s) and contributor(s) and not of MDPI and/or the editor(s). MDPI and/or the editor(s) disclaim responsibility for any injury to people or property resulting from any ideas, methods, instructions or products referred to in the content.
Copyright: This open access article is published under a Creative Commons CC BY 4.0 license, which permit the free download, distribution, and reuse, provided that the author and preprint are cited in any reuse.
Prerpints.org logo

Preprints.org is a free preprint server supported by MDPI in Basel, Switzerland.

Subscribe

Disclaimer

Terms of Use

Privacy Policy

Privacy Settings

© 2025 MDPI (Basel, Switzerland) unless otherwise stated