1. Introduction
It is generally agreed that sustainability is a concept that refers to the ability to conduct socioeconomic activities that are ecologically feasibility, economically viable and socially acceptable. Thus, sustainability is based on the three pillars of social welfare, economic growth and conservation of environmental resources. Sustainable socioeconomic activities improve the overall well-being of societies by protecting human and environmental health while creating economic opportunities. This has a positive long-term impact on individuals' quality of life (QOL). Consequently, QOL and sustainability are intrinsically linked. That is, our relationship with the socioecological system determines the QOL that is achievable.
A diverse set of factors interact to shape QOL at the personal and the broader social context. The level of influence of each factor is determined by the needs of the individual or society. The higher the priority of the need, the greater the impact on well-being. For example, it is reasonable to assume that a biological need, such as food, is a priority need. If this need is not met, problems arise in a wide range of areas, from public health to economic production. In this context, the impact of food security on social welfare and quality of life is high. This line of reasoning is confirmed by the fact that hunger is a priority item in the Sustainable Development Goals (SDGs) declared by the United Nations (UN). SDG 2 aims to end hunger worldwide, achieve food security and promote sustainable agriculture [
1], all of which ultimately relate to long-term QOL. Although food security is essential for achieving a desirable QOL, it is only possible within the context of the system of variables that it interact with to produce the desirable QOL. That is, QOL is an emerging property derived from a complex of interacting variables. In one sense, food security is necessary but not sufficient for achieving a desirable QOL.
Failure to identify the important components of QOL can lead to ineffective targeting of social interventions and the consequent inefficient use of resources and lack of progress toward sustainable development goals. The main objective of this study is to contribute to the development of more effective social policies and intervention strategies by identifying the components of QOL in the context of low income underserved communities in Guilford County, North Carolina, USA and analyzing their contributions to the QOL of individuals. This study examines the impact of food security, which is one of the sub-elements of sustainability, on QOL, which is also one of the goals of sustainability.
In the literature, there is debate on the meaning or more precisely the definition of Quality of life [
2,
3,
4,
5]. This study draws on the definition proposed by the World Health Organization, which is an individual's perception of their position in life relative to their goals, expectations and standards as these are assessed within the context of their culture and value systems in which they live [
6]. Standard indicators of the quality of life include wealth, employment, the environment, physical and mental health, education, recreation and leisure time, social belonging, religious beliefs, safety, security and freedom. QOL has a wide range of contexts, including the fields of international development, healthcare, politics and employment. For example, health related QOL (HRQOL) is an evaluation of QOL and its relationship with health [
7].
This study investigates QOL from the perspective of the lived experience of underserved low-income communities, given that improving Quality of Life (QOL), especially among poor communities, has been the focus of governing bodies: international, national, state, and local. QOL is a multidimensional concept that can be viewed from a political, economic, social, or individual perspective [
8]. In literature one perspective on QOL identifies levels of quality of life classified as: individual and societal levels. In each level there is an objective and subjective component [
9]. To clarify, the objective QOL component refers to that aspect of QOL that is described using measures such as social and economic indicators, while the subjective component deals with the individual’s perception or experience of well-being such as satisfaction with one’s status or with the objective aspects such as income, health care, security, services.
Another perspective classifies individual quality of life along two dimensions, chances/outcomes and internal/external [
10,
11,
12]. From our perspective the interesting thing about this classification are the four qualities of life dimensions identified from external/internal typology. For example, the external typology includes livability, and the utility of life afforded the individual in the referenced environment, while the internal environment describes the life-ability and satisfaction of the individual with life in the referenced environment. Considering the external environment, livability describes the prevailing external environment which sets the condition for an individual to seek a better quality of life. It is the focus of economic indices and social indicators which seek to measure QOL and is generally referred to as standard of living or well-being [
11,
12,
13,
14]. The other individual kind of QOL –life-ability identifies the individual’s capacity to marshal his abilities and skills to seek and achieve a higher standard of living or personal well-being. Specifically, it includes an individual’s health status, education level, intellectual capacity, and social skills [
15]. The life-ability aspect of the individual quality of life is the focus of the UN human development and poverty indices. The third aspect of an individual’s quality of life points to the individual’s behavior with respect to others, his contribution to society and the happiness of those around him. The fourth kind of individual QOL is the individual’s life satisfaction. This fourth kind of individual QOL is derived from the interaction between his life-ability and livability of the environment. In practical terms, this means the ability of the individual to exploit opportunities available in or provided by the environment to achieve a level of wellbeing that brings him satisfaction.
From the above review of literature on QOL, it is reasonable to deduce that the environment in which the individual lives and the ability of the individual to employ his abilities to marshal resources determines his standard of living or wellbeing and that of society and others around him. Yet, in measuring quality of life, emphasis is mostly on aggregate measures such as GDP, which leads to a popular false notion that QOL can be captured by a single measure. From the above discussion it is also clear that QOL of the individual depends on two factors, first the ability and skill of the individual to make use of opportunities and resources in the environment to advance his quality of life and second, is the amount and quality of resources and opportunities available in the environment.
If we hypothesize that QOL is life’s goal, then individuals are naturally motivated to pursue actions that they believe will lead to better QOL. For this paper, we define the series of actions the individual takes, which over time falls into a stable pattern of preferred behavior as the individual’s lifestyle. Thus, it is reasonable to conclude that the goal of a particular lifestyle is the attainment of a satisfactory QOL. In this light, one prominent academic view holds that preferences are a part of who we are and are stable (considered and rational), not easily swayed by external influences such as exhortations from teachers or pastors or pedantic lesson from experts on the benefits of modifying one’s preference to achieve desired goals [
16].
Still, a more recent academic view is that where we live, the people we associate with, culture, history, the community as a whole and many other external factors help to shape our preferences [
17], and as such our lifestyle. This latter perspective supports the contention that lifestyle as a pattern of behavior is modifiable and provides strong justification for undertaking programs that target the modification of lifestyle to promote valued health and quality of life outcomes. On the other hand, the view that preferences are considered, coherent and rational, indicates that experts should not patronize or take for granted that people’s preferences are whimsical and devoid of a rational basis. Both perspectives, then, have valued practical implications for leveraging insights into the basis for people’s current behavior, in a variety of environments, to improve future behavior and achieve positive quality of life and health outcomes considering the socioecological context in which they live.
For example, based on the latter view the individual’s lived experience is shaped in context, people learn from and adapt to their environment by developing strategies that help them survive and thrive where possible. The first perspective helps us understand that these strategies are considered, thought out and coherent and not the product of whimsy. Efforts to address pressing social issues, including sustainable development, must first consider how context shapes individuals' lived experiences and existing lifestyles before proposing solutions for underserved communities. This means that success in our efforts is more likely if we start where people are and gradually move them to where we want them to be. Second, people and their lifestyle are part of a system. Implying that there are several factors working together to define the system and patterns of behavior (lifestyle) we observe [
18].
To use the topical issue of addressing food insecurity as an example again; it should be recognized that food security is only one factor among several that impacts lifestyle and the overall quality of life for people living in insecure food communities. Addressing food insecurity in isolation may dampen the potential positive impact on quality of life if notice is not taken of how it fits into the overall lived experience or lifestyle of the target community. That is, providing food alone may not improve the quality-of-life outlook for communities if we fail to acknowledge that communities and individuals are part of a larger system that defines their lifestyle and quality of life status. Since we live in a socioecological system, our lifestyle determines how we relate to the environment, which in turn defines the level of sustainability that is achievable.
The inference here is that there may be potential complementarities that, if considered, will add value to or multiply the impact of efforts to address sustainability and associated food insecurity and modify lifestyle towards achieving collective impact [
19] and desirable QOL goals; but if ignored could nullify all such efforts. To leverage potential complementarities, it will be necessary to define from the perspective of the community the components of QOL that is the objective of lifestyle.
Consequently, the aim of this study is to identify the components of QOL and the relative importance or priorities that communities in the defined study area attribute to them. That is, to find the weights of the components and to better understand what contributes to quality of life. The study examined six key elements: Spiritual well-being, food security, health services, social connections, economic opportunities and community assets. Data for this research was collected through surveys and in-depth interviews conducted in 2023. The analysis used best-worst scaling (BWS) to rank and prioritize these dimensions according to their impact on QOL.
2. Methodology
Research Design
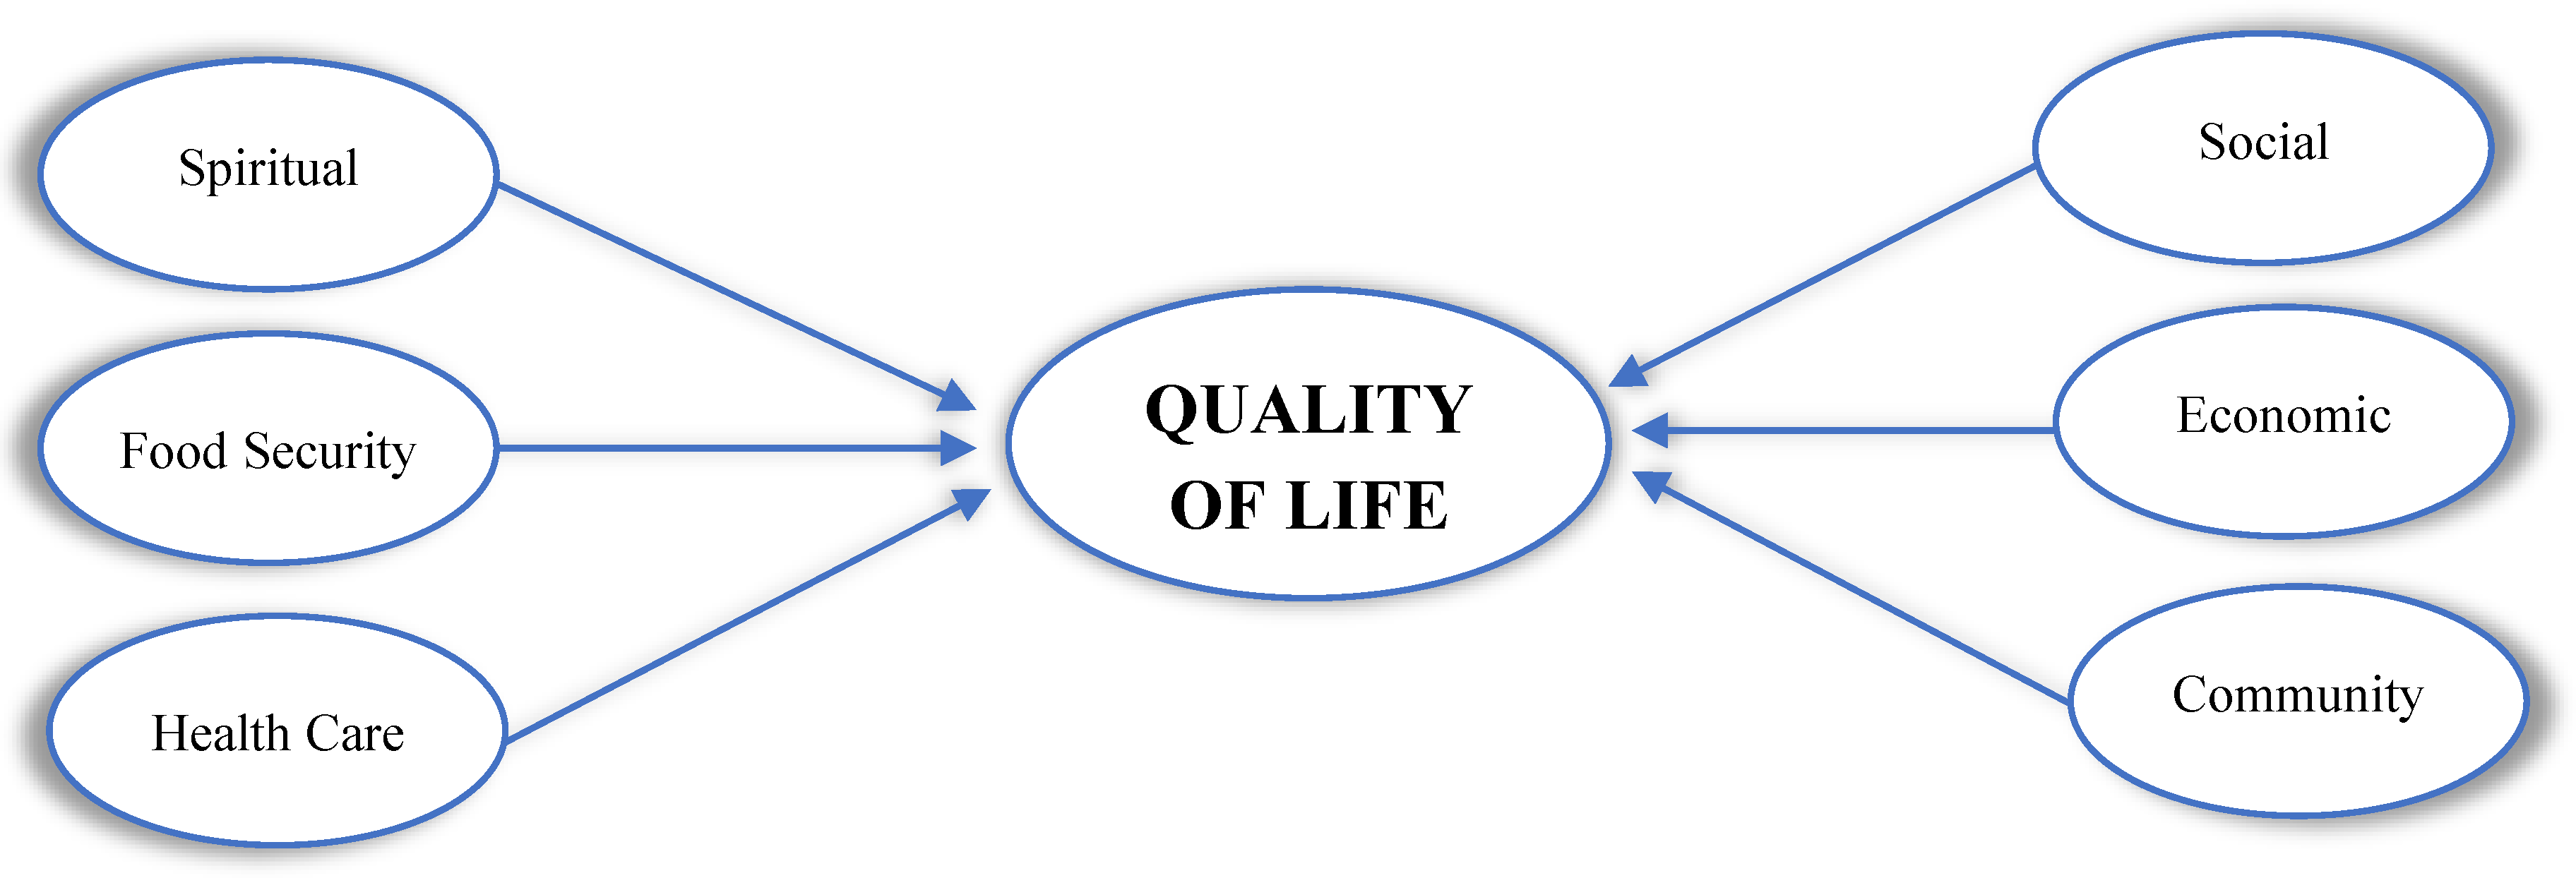
In consideration of the data gathered from the existing literature, this study incorporates six key factors as influencing the Quality of Life. These variables are postulated to impact the quality of life, and a structural model is consequently constructed. Obviously, according to this research design, our hypothesis is that each of these variables (spiritual well-being, food security, health care, social connections, economic opportunities and community assets) has an impact on quality of life.
Figure 1.
Structural Model of Quality of Life.
Figure 1.
Structural Model of Quality of Life.
Sampling and Data Collection
The factors identified above were initially identified from our experience working with underserved communities in Eastern Grreensboro in Guilford County, North Carolina. Researchers then conducted a series of in-depth interviews employing the ethnographic approach to further validate the factors. The main data for this study was collected directly from individuals living in Guilford County, North Carolina through survey methodology, ensuring firsthand insights for analysis. In obtaining the data, the sample size was determined as 280 using the proportional sample size calculation formula developed by Nelson, based on a 95% confidence interval and a 6% margin of error [
20].
The questionnaire for the study was designed employing a format that facilitated the collection of data on each factor that facilitated the application of best worst scaling (BWS) in an the Qualtrics online survey portal.
Telephone survey method was used for the data collection. Despite its apparent simplicity, this method required more than ten attempts to complete a single questionnaire. The responses obtained from individuals in the study were recorded in an online survey database. The downloaded data was reviewed to ensure that the analysis was unbiased and consistent. The data were made ready for analysis by removing the missing data and inconsistent questionnaires [
20,
58].
Removing inconsistent questionnaires from the data set is a crucial step to improve the quality of the survey data and ensure the reliability of the results [
21]. Inconsistencies may result from contradictions, denials or illogical responses. Eliminating such data contributes to a more solid foundation for analysis. A study conducted at the University of North Carolina emphasizes that removing inconsistent or misleading data from the analysis can increase the reliability of the results [
22,
23]. It is common practice to remove inconsistent data to maintain data integrity and improve the accuracy of the analysis. We subjected our data to this refinement process in the literature and removed missing and erroneous data [
24]. By removing these data, the margin of error in the representativeness of the sample to the population increased slightly but was still within acceptable limits.
Data Analysis
The
ISAC Analysis Procedure, named by Cankurt, was used to identify the preferences and characteristics of subgroups according to the objectives of the study [
23]. The ISAC Analysis Procedure is a multi-stage analytical approach used to systematically examine and interpret complex phenomena, especially in the context of social sciences, consumer behavior, or any field where understanding underlying patterns and relationships is crucial. The ISAC Analysis Procedure takes its name from the initials of the Identification, Segmentation and Characterization stages.
Besides the ISAC Procedure, the main analysis method used in the study is
Best Worst Scaling (BWS). It was used to analyze the data obtained from individuals. BWS was preferred by the researchers as it requires fewer comparisons compared to other alternatives and thus facilitates difficult survey administration [
25,
26,
27].
In addition, simple descriptive statistics such as frequency, percentage, mean and median were calculated to provide more detailed information about the population.
ISAC Analysis Procedure
The ISAC Analysis Procedure is a multi-stage analytical approach that is utilized to systematically study and interpret complex phenomena, particularly in the context of social sciences, consumer behavior, or any field where understanding the underlying patterns and relationships is of paramount importance. The ISAC Analysis Procedure is named for its three stages: Identification, Segmentation, and Characterization. Indeed, it is a research process that is employed by numerous researchers, either in its entirety or in part. However, the ISAC procedure was defined and developed with the objective of making the process more recognizable, easier to remember, and easier to understand [
23].
Stage 1: Identification
The initial stage of the ISAC process is identification. The initial step involves calculating descriptive statistics which reveal the structure of the data. These include means, standard deviations, minimum and maximum values, and frequencies for variables of interest. Following this, dimension reduction is conducted to identify variables for use in further analysis, with the aim of achieving the research purpose [
28].
Stage 2: Segmentation
The second stage of the ISAC procedure is segmentation. This stage involves dividing a population, community, or target group into defined subgroups based on specific characteristics [
29,
30]. These characteristics may be demographic, psychographic, behavioral, geographic, or other variables related to the research focus [
31]. The process of segmentation enables researchers to gain insight into the specific needs, behaviors, attitudes, and opinions of distinct groups (segments), thereby facilitating the development of strategies that are tailored to the unique requirements of each segment [
23].
Stage 3: Characterization
The characterization stage represents one of the final and most pivotal phases of the ISAC analytical process. In this stage, the groups delineated in the segmentation process are subjected to a comprehensive examination, with the objective of elucidating the distinctive attributes of each segment [
29]. In the characterization process, each segment is initially examined through the lens of pertinent data, including demographic information, psychographic characteristics, and behavioral tendencies [
32]. As a consequence of this analysis, the distinctive characteristics of each segment are discerned. Subsequently, fictitious characters, designated as personas, are constructed based on the aforementioned segments. Personas represent a typical member of the segment and reflect the typical characteristics of that segment, including needs, motivations, and behaviors. Personas facilitate a deeper comprehension of the target audience and serve as a compass for the formulation of strategies and policies tailored to these personas [
33,
34].
In conclusion, the ISAC Analysis Procedure is particularly advantageous in domains such as marketing, as evidenced by its efficacy in this study, where it enables researchers and analysts to derive actionable insights through a systematic and structured examination of the data. The segmentation process, in this case, enhances policy-making effectiveness by facilitating the customization of programs.
Best-Worst Scaling
BW Scaling was developed by Louviere and Woodworth (1990) as a multiple-choice method for pairwise comparisons. However, two years later, in 1992, a paper published by Louviere et al. demonstrated the scientific basis and application of this approach [
35,
36].
BWS is a method derived from the pairwise comparison method for multiple options that ask respondents to select both the most and least attractive options or attributes from a set of options. It is an easy-to-apply method for the study, ranking and modeling of preference and choice problems for academics and practitioners in business, social sciences and other disciplines, especially in marketing. BWS avoids many rating scale problems and appeals to those who want to measure subjective quantities with known measurement properties that can be easily interpreted and applied [
25].
Best Worst Scaling (BWS), also known as Maximum Difference Scaling, is a method designed to capture precise preferences by asking respondents to select the most and least preferred items from a given set. This method has emerged as a more robust alternative to the problems of bias, inconsistency, central tendency bias, and social desirability bias inherent in traditional ratings. By focusing on extremes, BWS enables researchers to obtain richer and more nuanced preference data and often achieve greater reliability than traditional methods [
37]. BWS has been widely applied in disciplines such as marketing, business, agriculture, health, education and public policy. It allows researchers to rank preferences clearly, providing insights into the relative importance of items [
38,
39].
Its main advantage for researchers stems from its ability to provide interval-scale data from simple ranked responses, which makes it a first choice for generating priority rankings. By simplifying respondents' tasks while increasing the granularity of the data collected, BWS is an easy-to-apply and analyze alternative to methods such as Simple Ranking, Pairwise Comparison, Fuzzy Pairwise Comparison and Conjoint Analysis. In addition, BWS avoids many rating scale problems and appeals to those who want to measure subjective quantities with known measurement properties that can be easily interpreted and applied [
40].
3. Results and Discussion
As explained in the method section, the research design follows the ISAC Analysis Procedure: Identification, Segmentation, and Characterization.
3.1. Identification
In this phase the sample is described according to demographic variables and their subgroups as follows: age, race, gender, education, relationship status and employment (employment status), and priority ratings established.
Table 1 shows the number and percentage distribution of these variables according to their subgroups.
The findings obtained from the sample in
Table 1 are compared and interpreted with Guilford County, NC state data and US averages.
Gender: The sample has a higher proportion of Female respondents (59.62%) compared to Male respondents (40.39%). Guilford County and the U.S. exhibit a slightly more balanced gender distribution, with females accounting for approximately 52% of the population [
41,
59].
Age: The sample is predominantly made up of adults (52.53%), followed by Early Seniors (20.28%) and Seniors (19.82%), with a lower proportion of Young Adults (2.30%). In contrast, Guilford County has approximately 9% of the population between the ages of 18-24 and 16% who are 65 years of age or older [
41,
59]. Nationally, the US population has a higher proportion of young adults at 21% and a smaller elderly population at 16% [
41]. The under-representation of young adults is considered to be limited and may fail to fully reflect the perspectives of this group.
Race: The racial composition is primarily White (53.00%) and Black or African American (40.60%), with smaller representations of American Indian or Alaska Native (1.40%). Guilford County's racial demographics indicate 56% White and 35% Black or African American [
59], aligning closely with the sample. Nationally, the proportions are 60% White and 13.6% Black [
41]. The elevated representation of Black participants aligns more closely with Guilford County than national averages, highlighting the region's unique demographic composition.
Education: Participants with a Bachelor’s degree (35.00%) and Master’s degree or higher (27.20%) are prominent in the sample, collectively surpassing 60% of respondents. Comparatively, in Guilford County, approximately 30% of residents hold a Bachelor’s degree and 14% hold graduate or professional degrees [
42]. Nationally, these rates are 21% and 13%, respectively [
41]. The sample reflects a higher education level than both regional and national averages, suggesting a potentially more specialized or affluent respondent pool.
Relationship Status: Nearly half of the participants are Married and living with their spouse (47.00%), while 21.20% are single. Guilford County reports a marriage rate of 43%, with 37% of adults single [
41]. Nationally, the marriage rate is 48%, with a similar proportion of singles [
43]. It is observed that the calculated relationship values in the sample are close to the NC and national values.
Employment: The majority of respondents work full-time (61.30%), while 24.40% are retired. Guilford County's labor force participation rate is 63%, closely reflecting the employment trend of this sample [
42]. Nationally, the labor force participation rate is 62.6% [
44]. It can be seen that the data obtained from the samples are close to the county, state and national values.
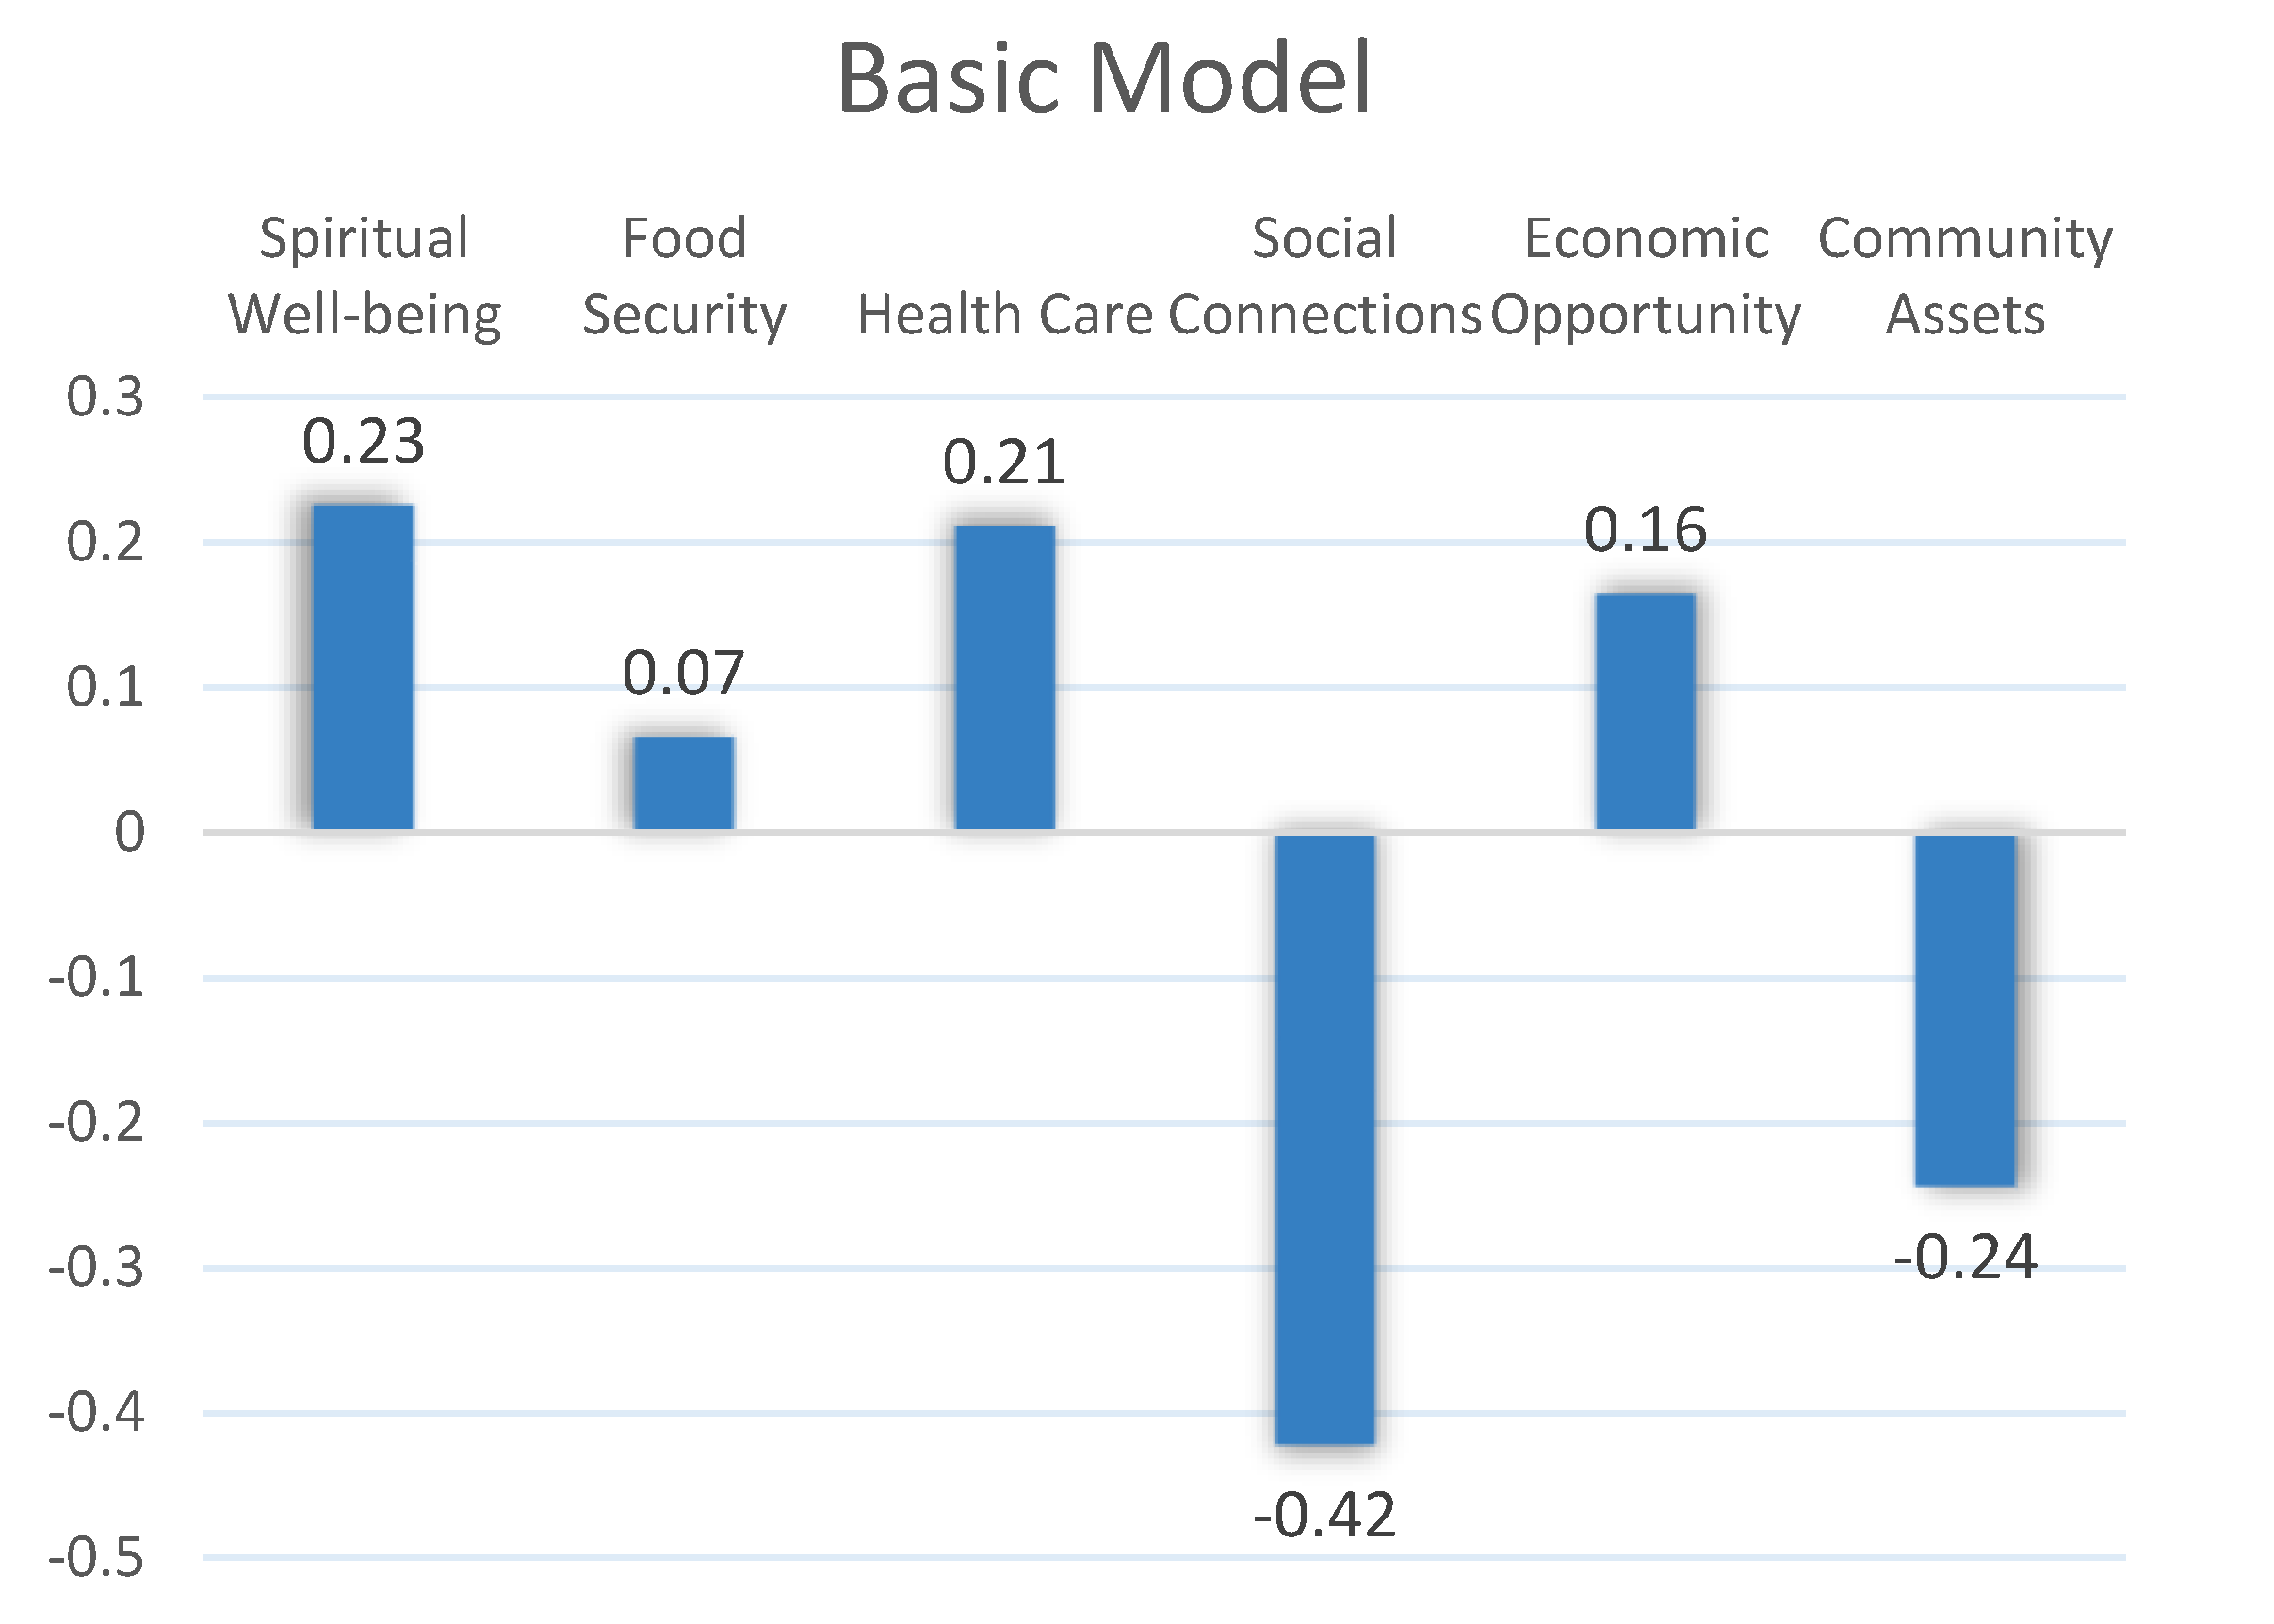
Priority ratings, the results indicated that Spiritual Well-being (0.23) emerged as the most significant factor in terms of relative weights, followed by Health Care (0.21), Economic Opportunity (0.16) and Food Security (0.07), while Community Assets (-0.24) and Social Connections (-0.42) were considered the least influential. This research provides valuable insights into the priorities that can enhance life quality, informing policymakers and stakeholders in targeted community planning and resource allocation. The findings of this study emphasize the pivotal role of spiritual well-being in enhancing the quality of life within the community (
Table 2).
One of the main tasks of policy makers, perhaps the first, is to improve the QOL of society. In doing so, it is essential for them to identify the most effective factors for using scarce public resources in the most efficient way. The knowledge gained from this study can increase the efficiency of efforts to improve the overall quality of life.
The present analysis, based on the Best-Worst Scaling (BWS) methodology, assesses six key dimensions affecting quality of life under the general model: spiritual well-being, food security, health care, social connections, economic opportunities and social assets. The relative impacts of these factors on overall quality of life are identified and insights are revealed. Due to the nature of the BWS method, some factors received positive and some others negative values. However, the negative ones are not interpreted here as having a negative impact. This is a relative ranking, with positive factors having a higher impact and negative factors having a lower impact relative to zero value. The BWS method is basically a method of determining the relative weights of other factors based on the maximum difference between the most and least influential (
Figure 2).
Among the factors assessed, the results underline the most important role of
Spiritual Well-being. Spiritual Well-being emerges as the most important positive contributor to QOL with a weight of 0.225. This finding underscores the critical role of personal and community spiritual practices in supporting spiritual well-being and emotional stability. Moreover, this finding is consistent with studies emphasizing the importance of spiritual satisfaction in supporting psychological resilience and emotional stability [
45]. Spiritual practices are often linked to improved mental health outcomes and increased life satisfaction, especially in communities experiencing distress [
46].
Health Care emerges as the second most influential factor with a weight of 0.211. Access to quality health cares has long been recognized as a cornerstone of quality of life, as highlighted by Marmot and Wilkinson (2012), who argue that equitable health systems play a crucial role in reducing social inequalities [
57]. Studies have shown that improving healthcare access can reduce mortality rates and increase subjective well-being, particularly in vulnerable populations [
47,
48].
Economic Opportunities also contribute positively to quality of life but have a relatively higher weight with a value of 0.164. This reflects the idea that economic security provides a foundation for addressing other dimensions of well-being, such as access to education and social mobility [
49]. The literature strongly supports the importance of economic opportunity in promoting a sense of independence and social inclusion, particularly in low-income communities [
50].
Food Security, with a moderate contribution of 0.065, suggests that its impact on quality of life may be overshadowed by other areas when basic nutritional needs are met. This observation is in line with the findings of Smith and Haddad [
51], who find that food security is a critical determinant of well-being primarily in contexts of scarcity. However, existing literature reinforces its critical importance in addressing health disparities and promoting physical health, particularly in low-income and marginalized populations [
52,
53].
At the least influential end of the spectrum is
Social Connections with a value of -0.423. This is in line with Holt-Lunstad et al.'s [
51] research showing that social isolation is strongly associated with poor mental health outcomes and reduced life expectancy. The low contribution of
Community Assets of -0.244 also highlights the detrimental effects of limited access to social resources and echoes Putnam's (2000) [
54] findings on the erosion of social capital and its effects on collective well-being. Evidence suggests that disparities in access to community assets, such as parks, transportation, and public facilities, exacerbate socioeconomic inequalities and hinder community well-being [
55].
In summary, these findings reinforce the multidimensional nature of QOL determinants and demonstrate the interplay between individual, social and systemic factors. They emphasize the need for policies that prioritize spiritual well-being, equitable health care and strong economic opportunities, while addressing social and societal deficiencies that undermine QOL.
3.2. Segmentation
After seeing the overall picture in the previous section, a deeper insight is reached through segmentation. This is already a stage where the ISAC Analysis Procedure method guides us. In the segmentation stage, the preferences of the subgroups that make up the overall model are compared. Each subgroup represents a segment. We tried to determine the change in the preferences of the individuals participating in the survey according to these segments. In the following, the general model will be compared with the subgroups of gender, age, race, education and employment.
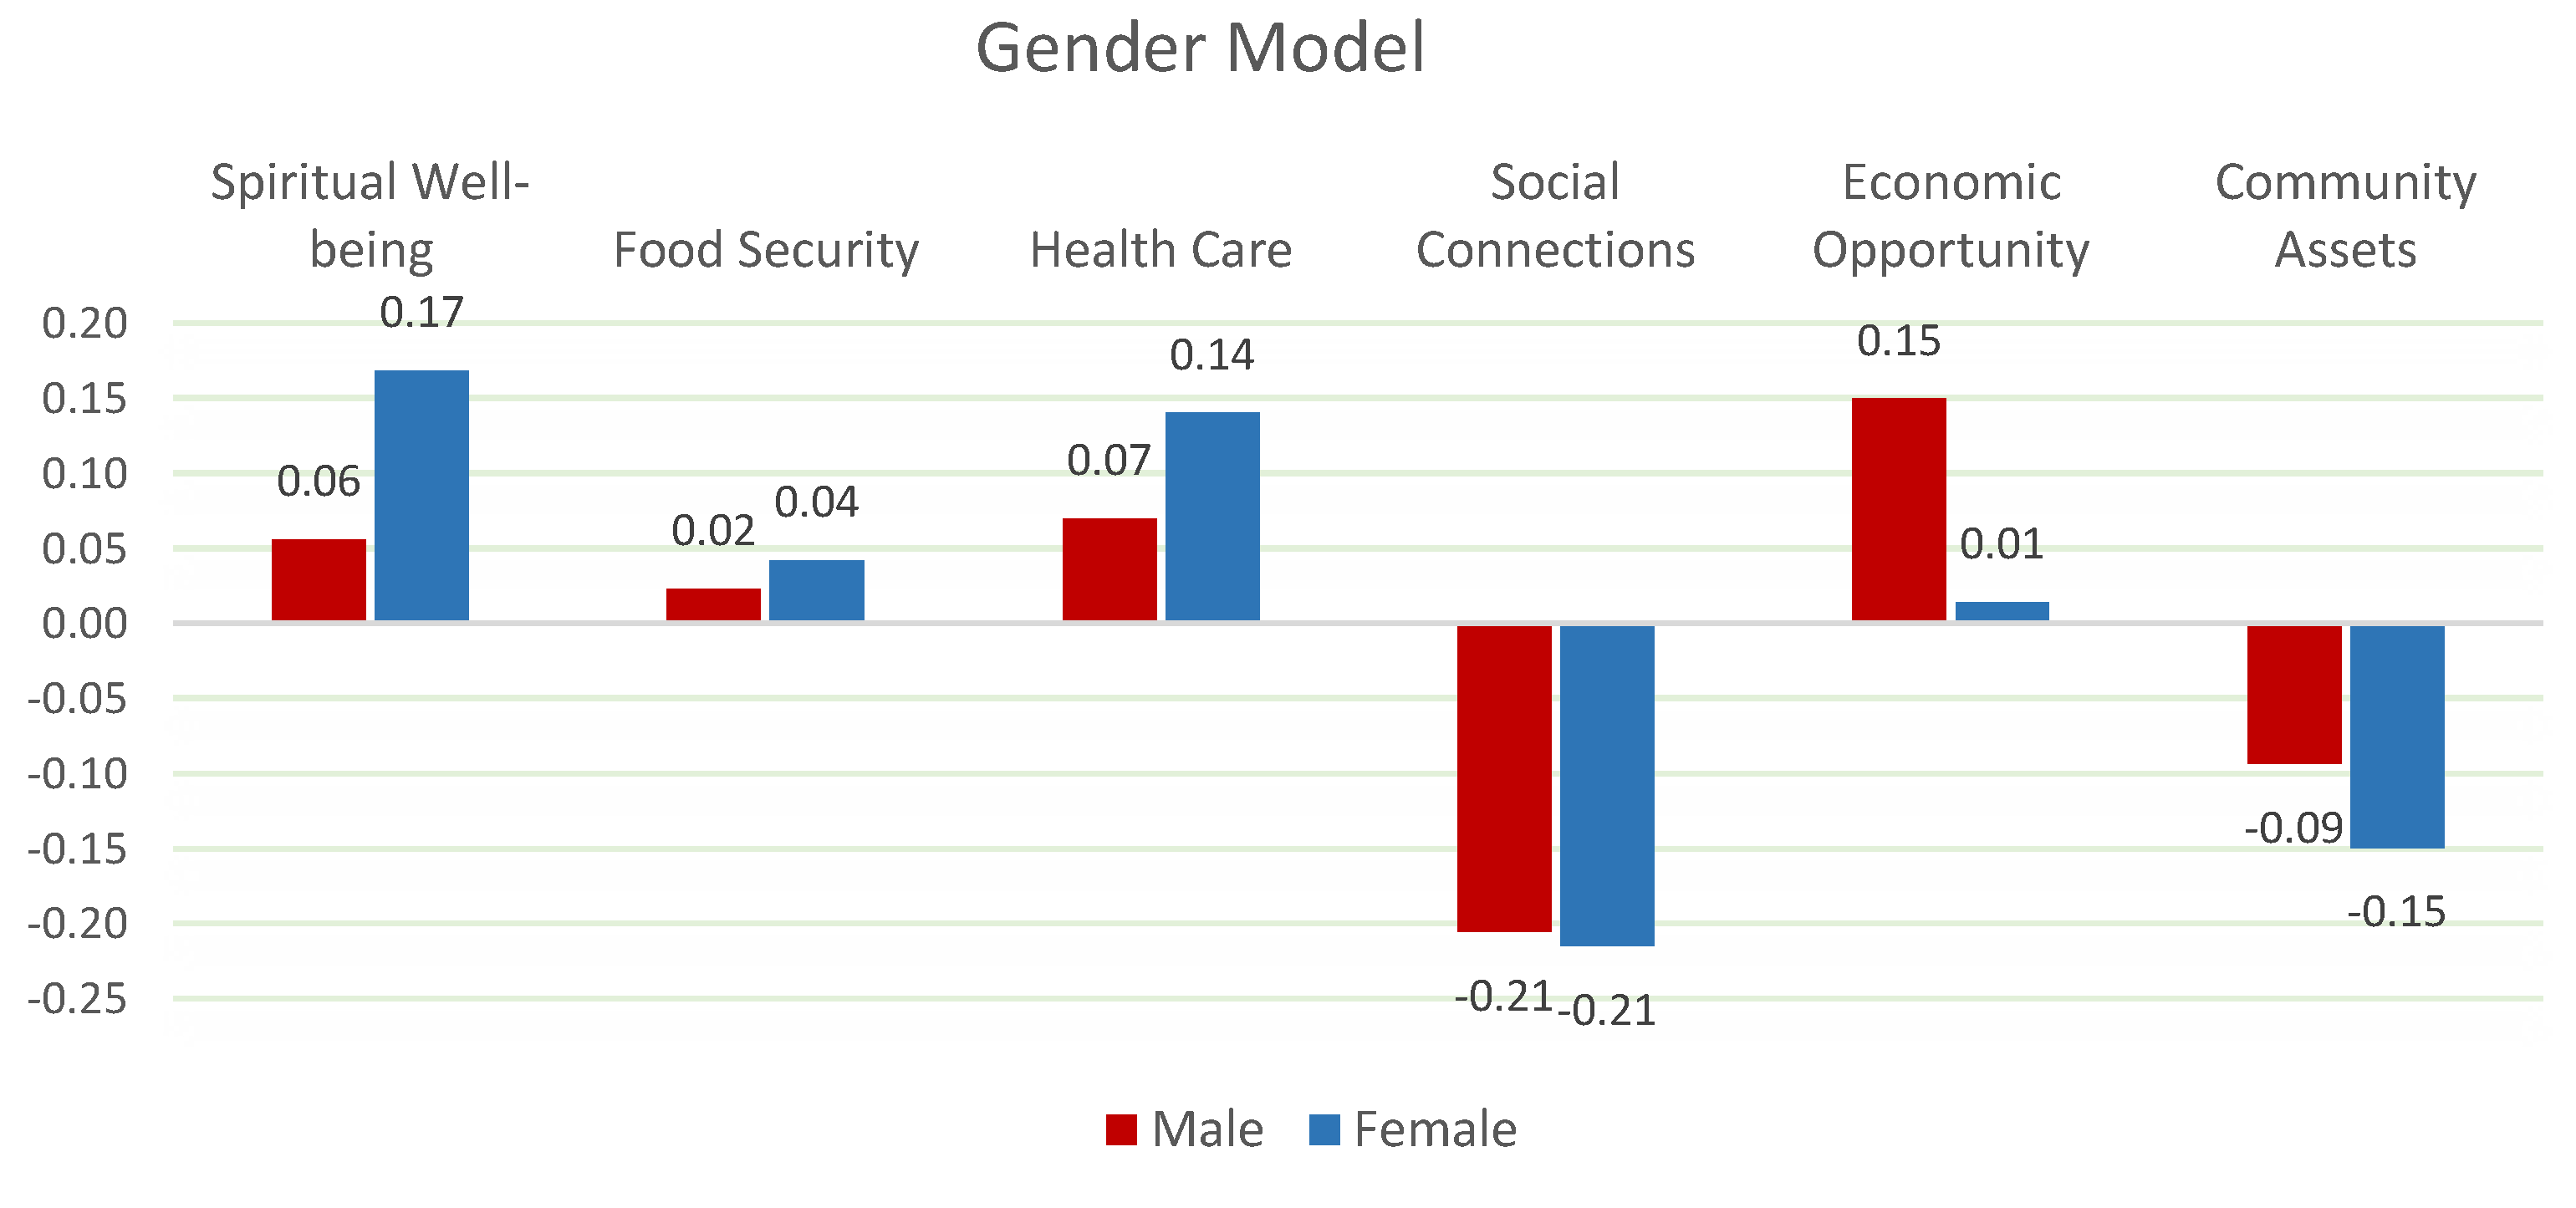
The analysis reveals clearly significant differences in the determinants of QOL between genders (
Chi-Square:16.925 p<0.01). Female participants prioritize spiritual well-being and health care, while male participants place more emphasis on economic opportunities. According to Koenig et al. (2012), spiritual satisfaction plays a greater role in enhancing emotional resilience and psychological stability for women [
45]. On the other hand, Case & Deaton (2015) argue that men often view economic security and opportunity as the primary drivers of life satisfaction [
47]. These findings suggest that policymakers should tailor their strategies to focus on health care and spiritual support for women, and economic insecurity for men (
Figure 3).
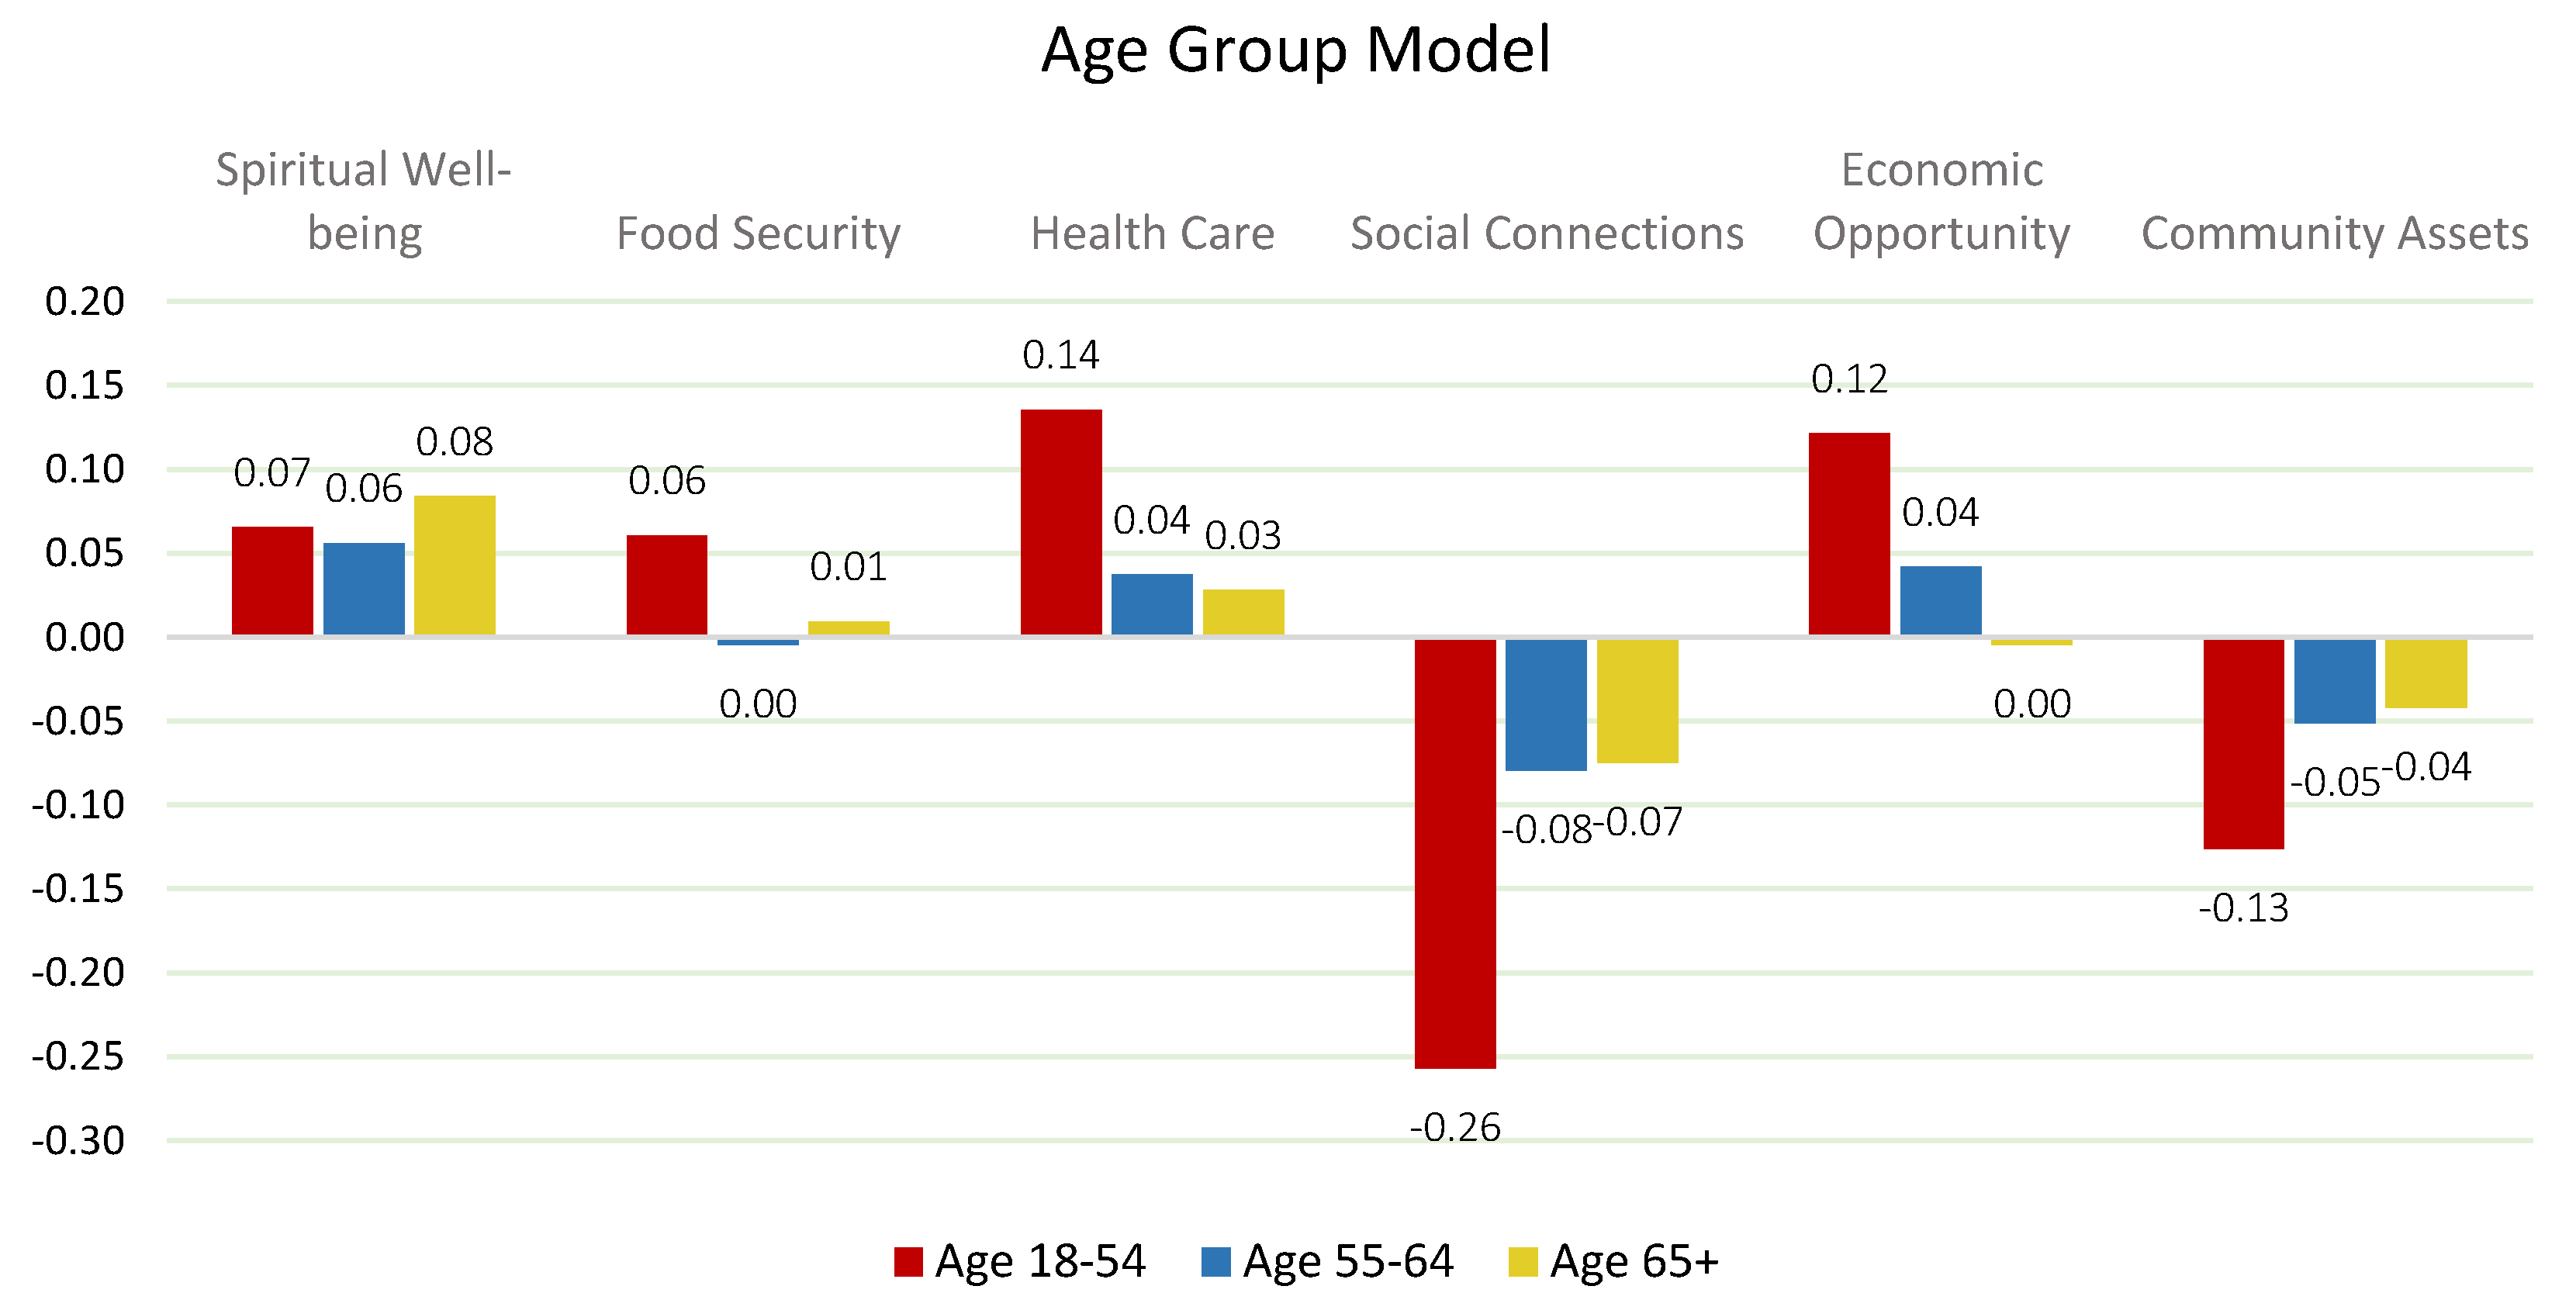
The analysis reveals acceptable differences between age groups (
Chi-square:2.74 p<0.10). Young adults (18-24) value economic opportunities and social connections, while adults (25-54) prioritize health care and economic opportunities. In contrast, early seniors (55-64) and seniors (65+) emphasize spiritual well-being and health care as primary factors. This is consistent with Holt-Lunstad et al., who suggest that social connections are critical to the emotional well-being of younger adults, and VanderWeele et al., who highlight the importance of spiritual well-being in supporting resilience in older populations [
46,
51]. These age-related differences highlight the need for age-specific interventions to effectively address quality of life (
Figure 4).
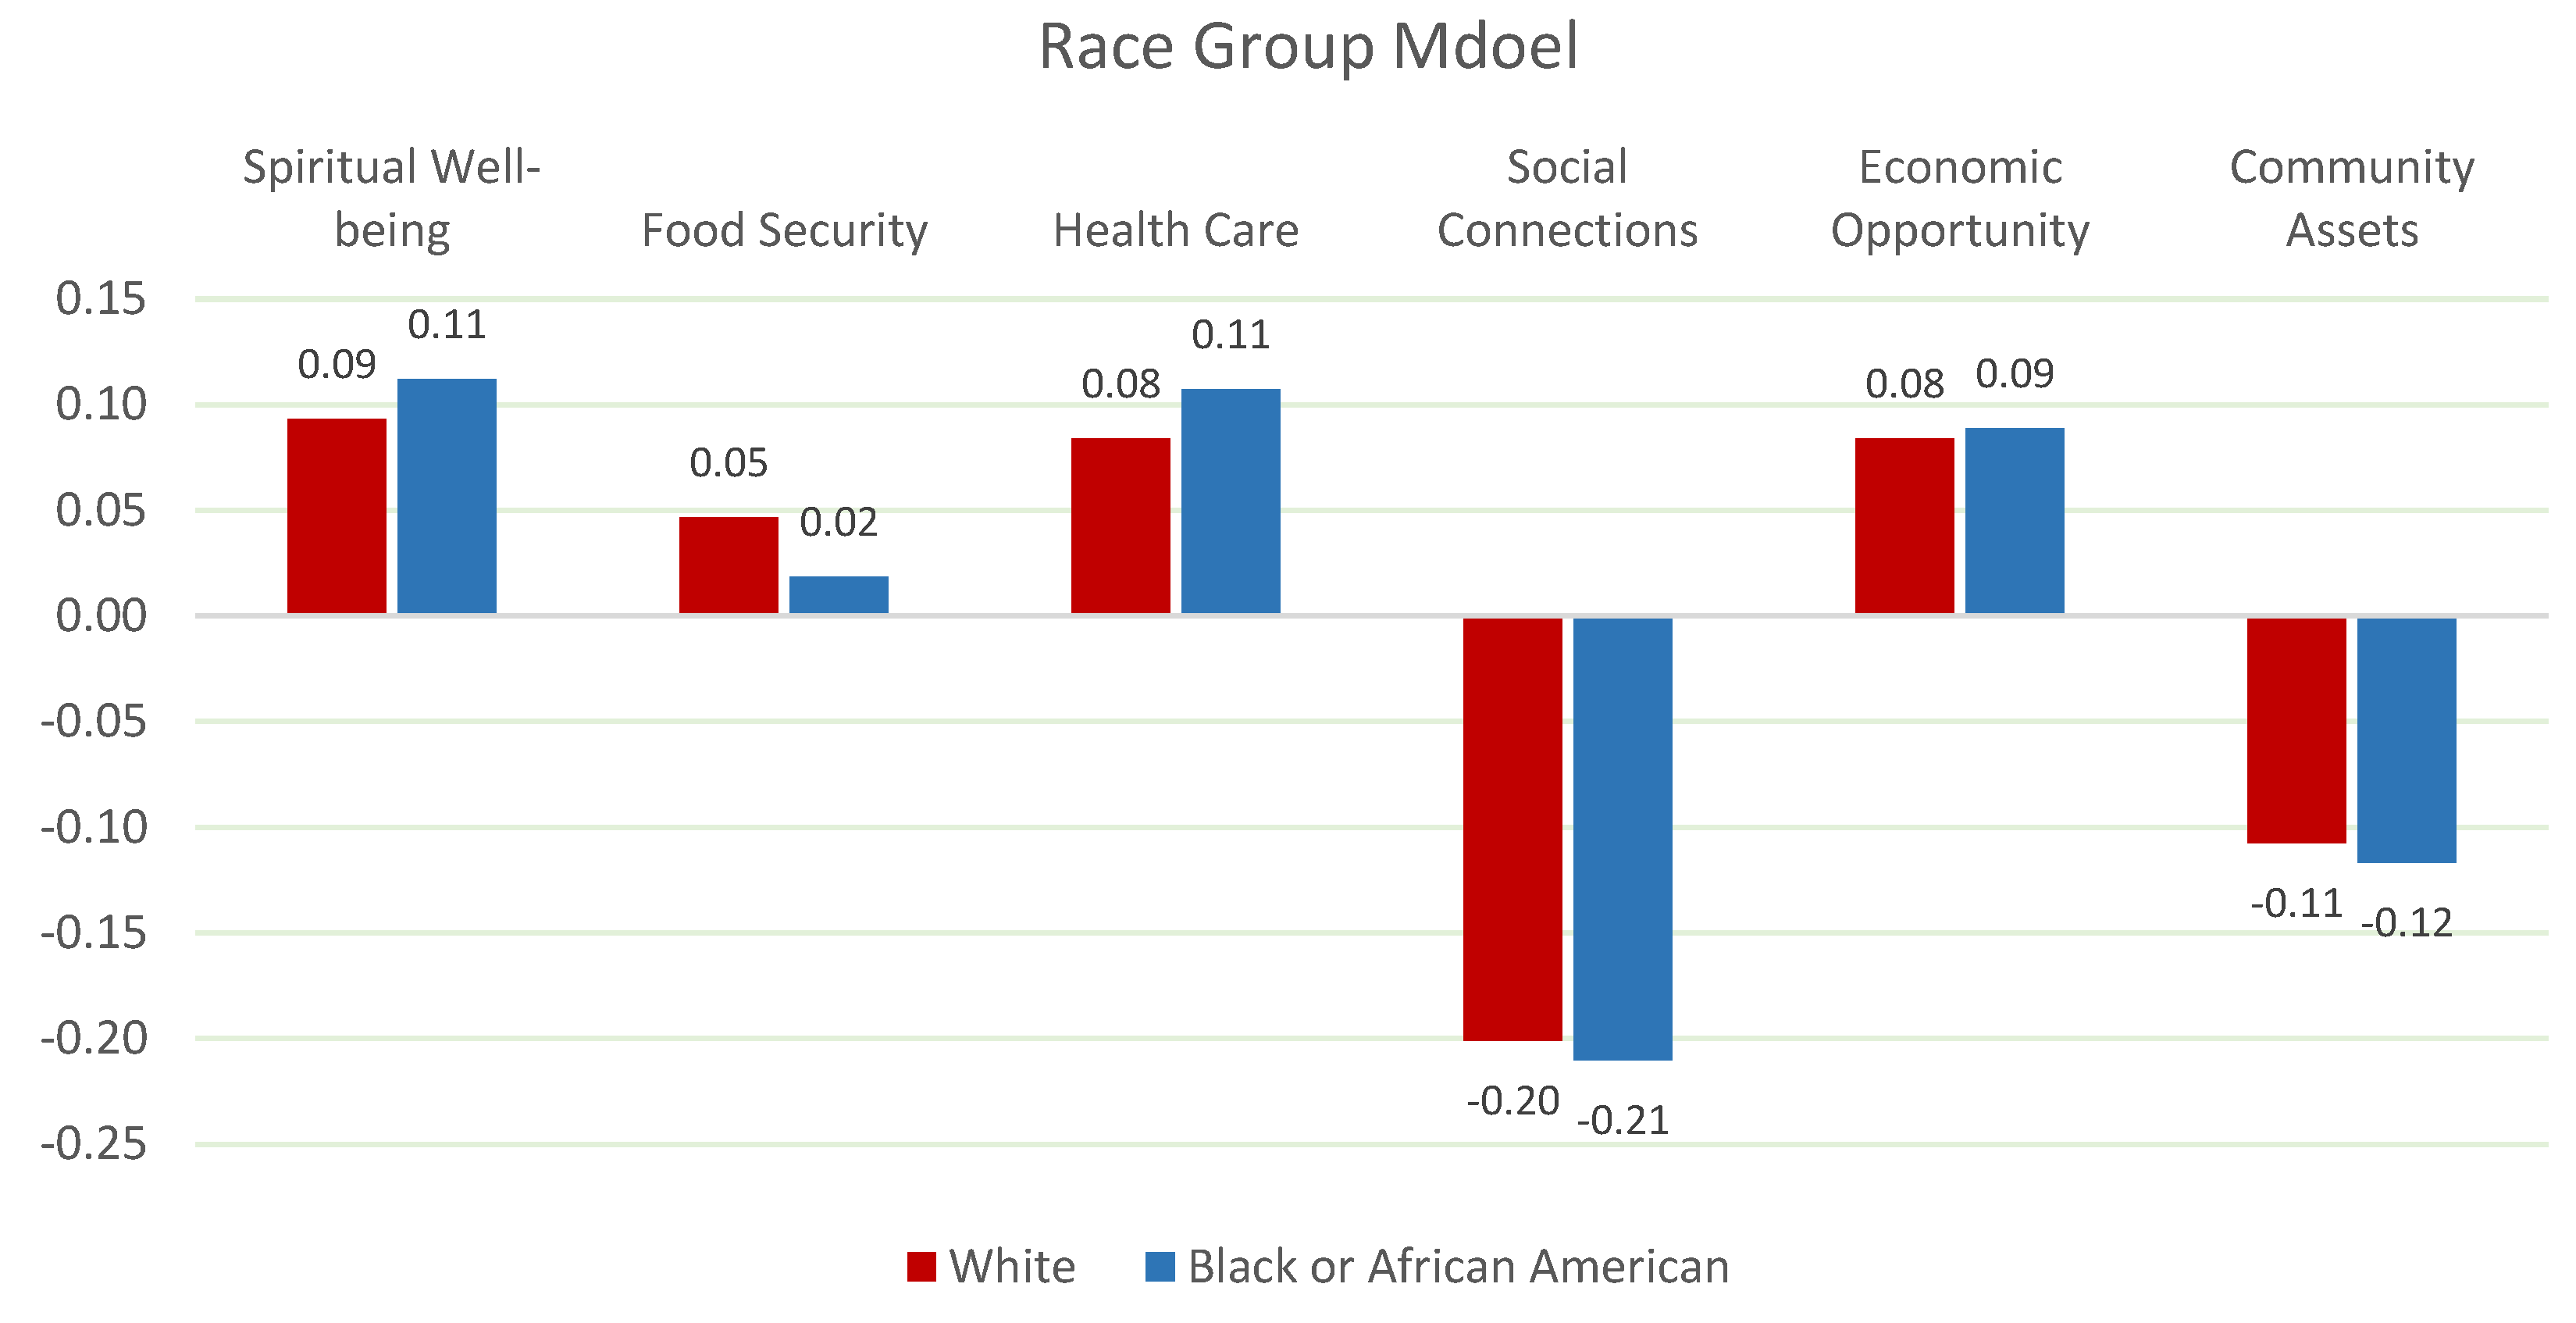
Racial differences significantly influence the determinants of QOL. White participants prioritize health care and economic opportunities, while African American participants place greater importance on spiritual well-being and food security. Smith & Haddad (2015) emphasize that food security plays a disproportionately important role in communities facing social and economic disparities [
56]. Similarly, Wilkinson & Pickett (2010) argue that unequal access to health care exacerbates existing inequalities in well-being [
55]. These findings suggest that policies must address structural disparities in health care and food security across racial groups (
Figure 5).
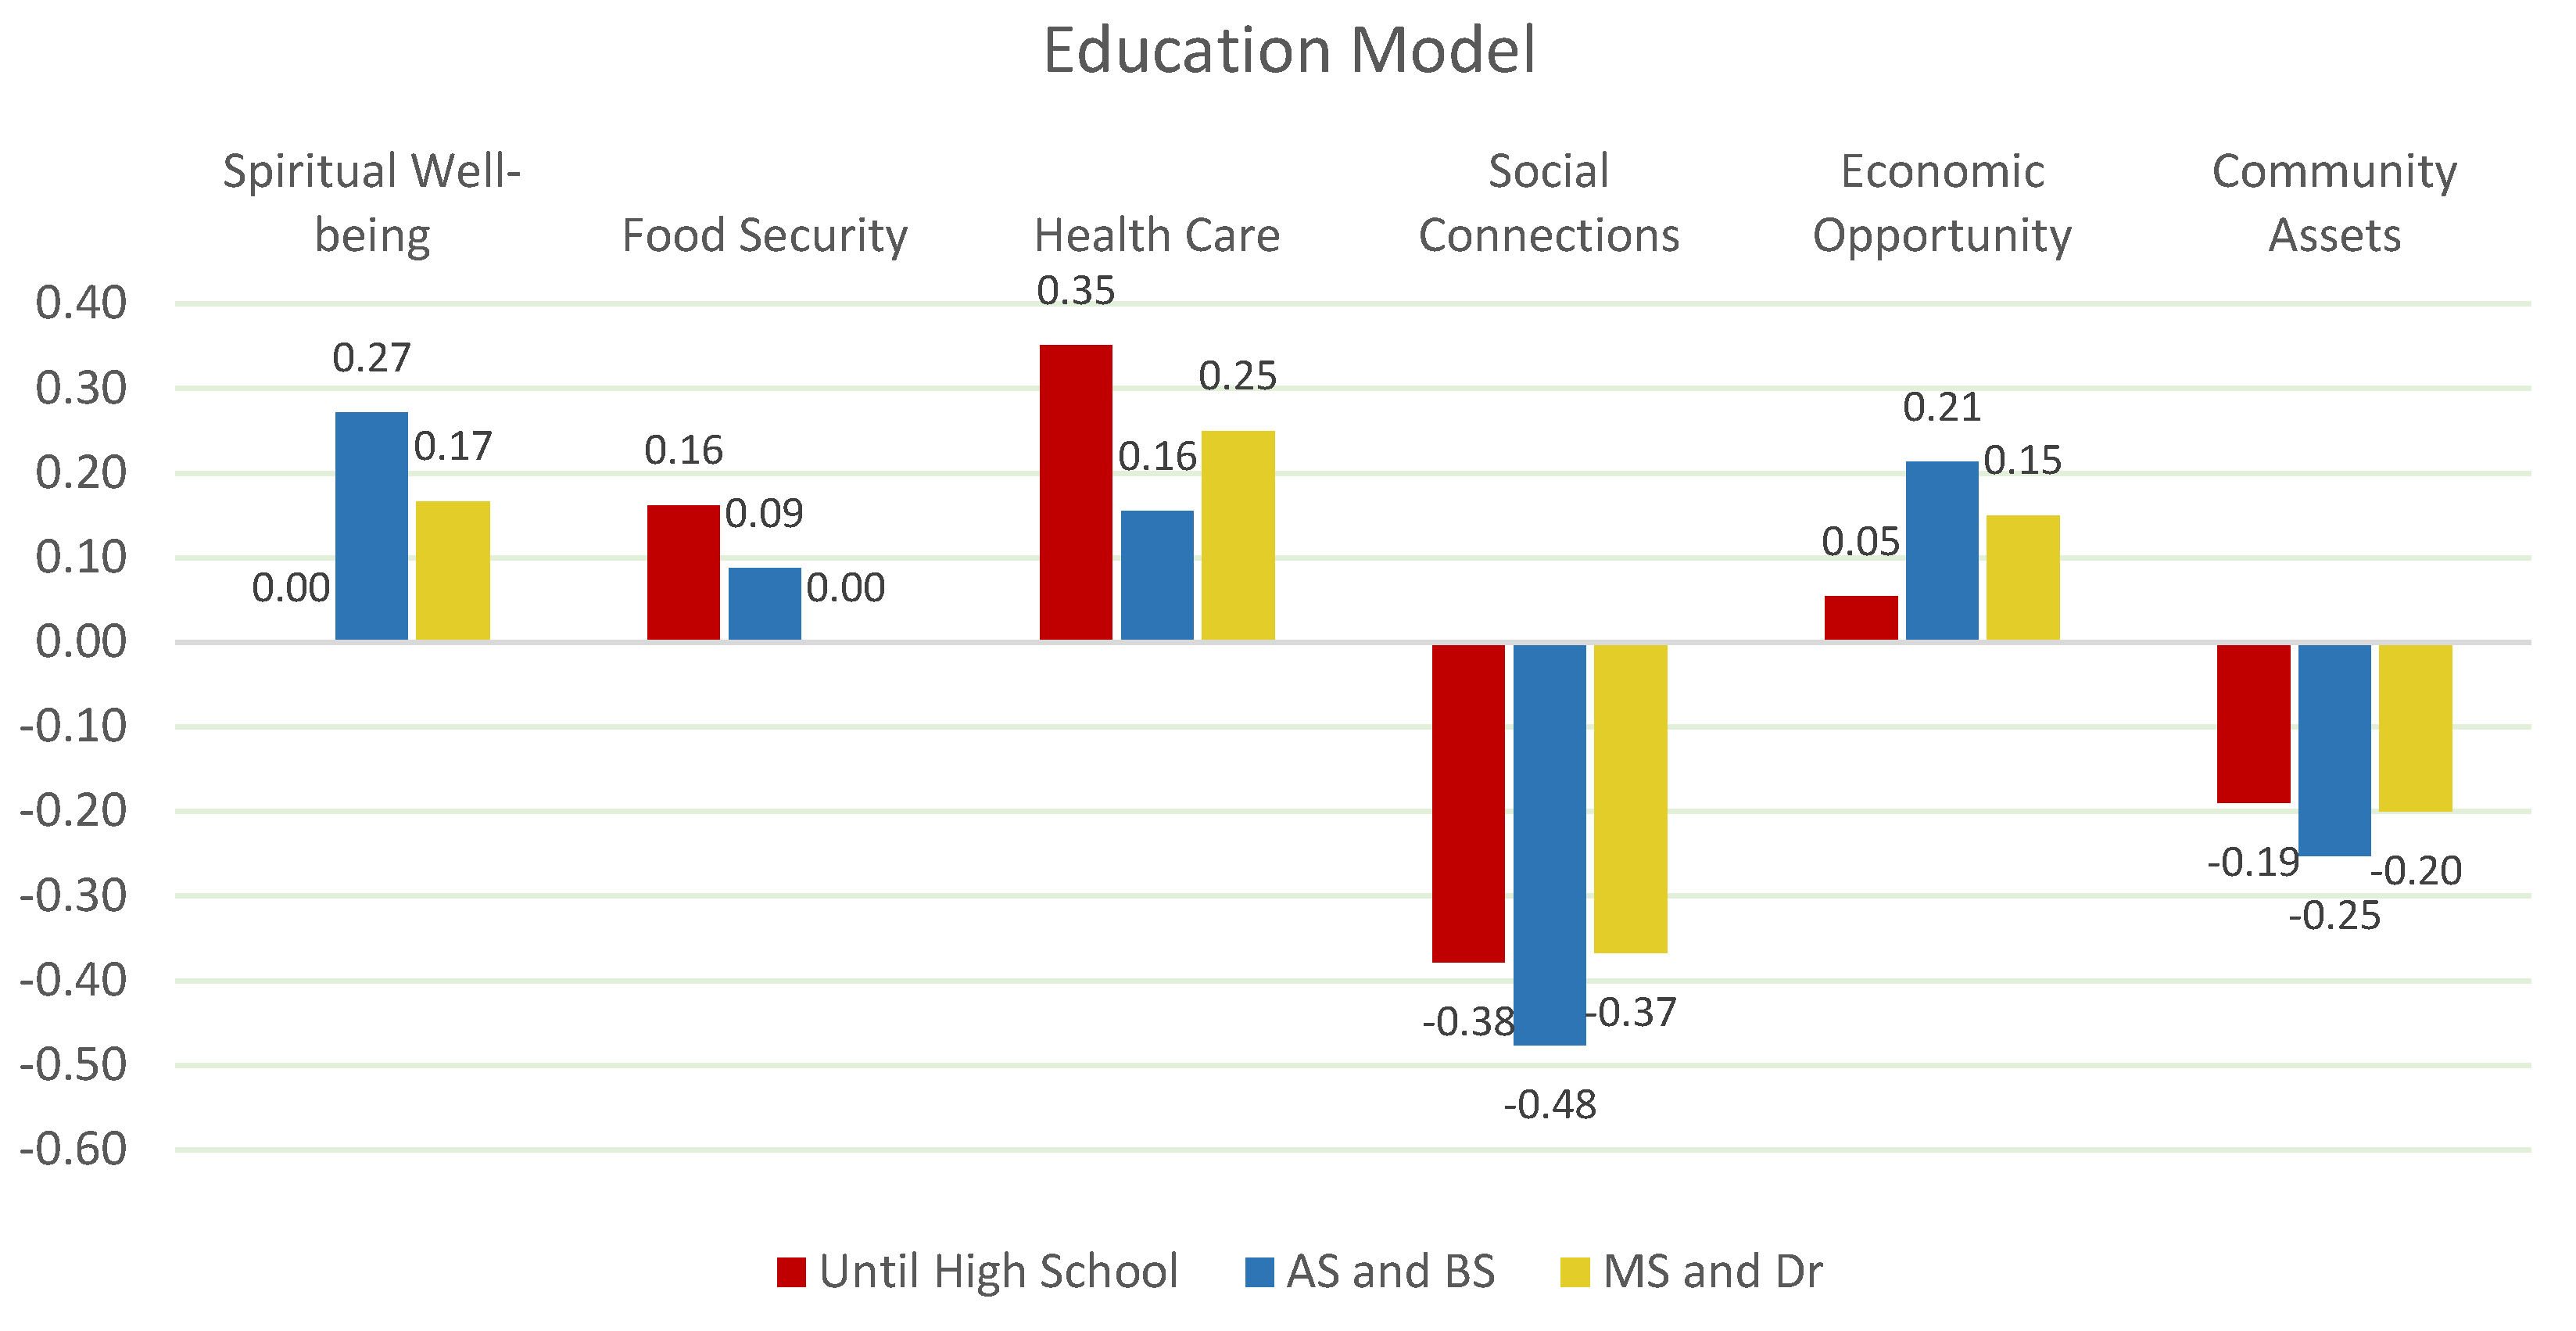
Education level also shapes QOL priorities. Participants with a bachelor's degree or higher prioritize economic opportunities and healthcare, while those with lower levels of education emphasize food security and community assets. According to Sen (2013), education serves as a key enabler for economic mobility and access to healthcare [
49]. Meanwhile, Gundersen & Ziliak (2015) highlight the relationship between lower educational attainment and increased vulnerability to food insecurity [
53]. This suggests that education-centered strategies can play a pivotal role in improving QOL outcomes across different segments (
Chi-square: 49.760 p<0.05) (
Figure 6).
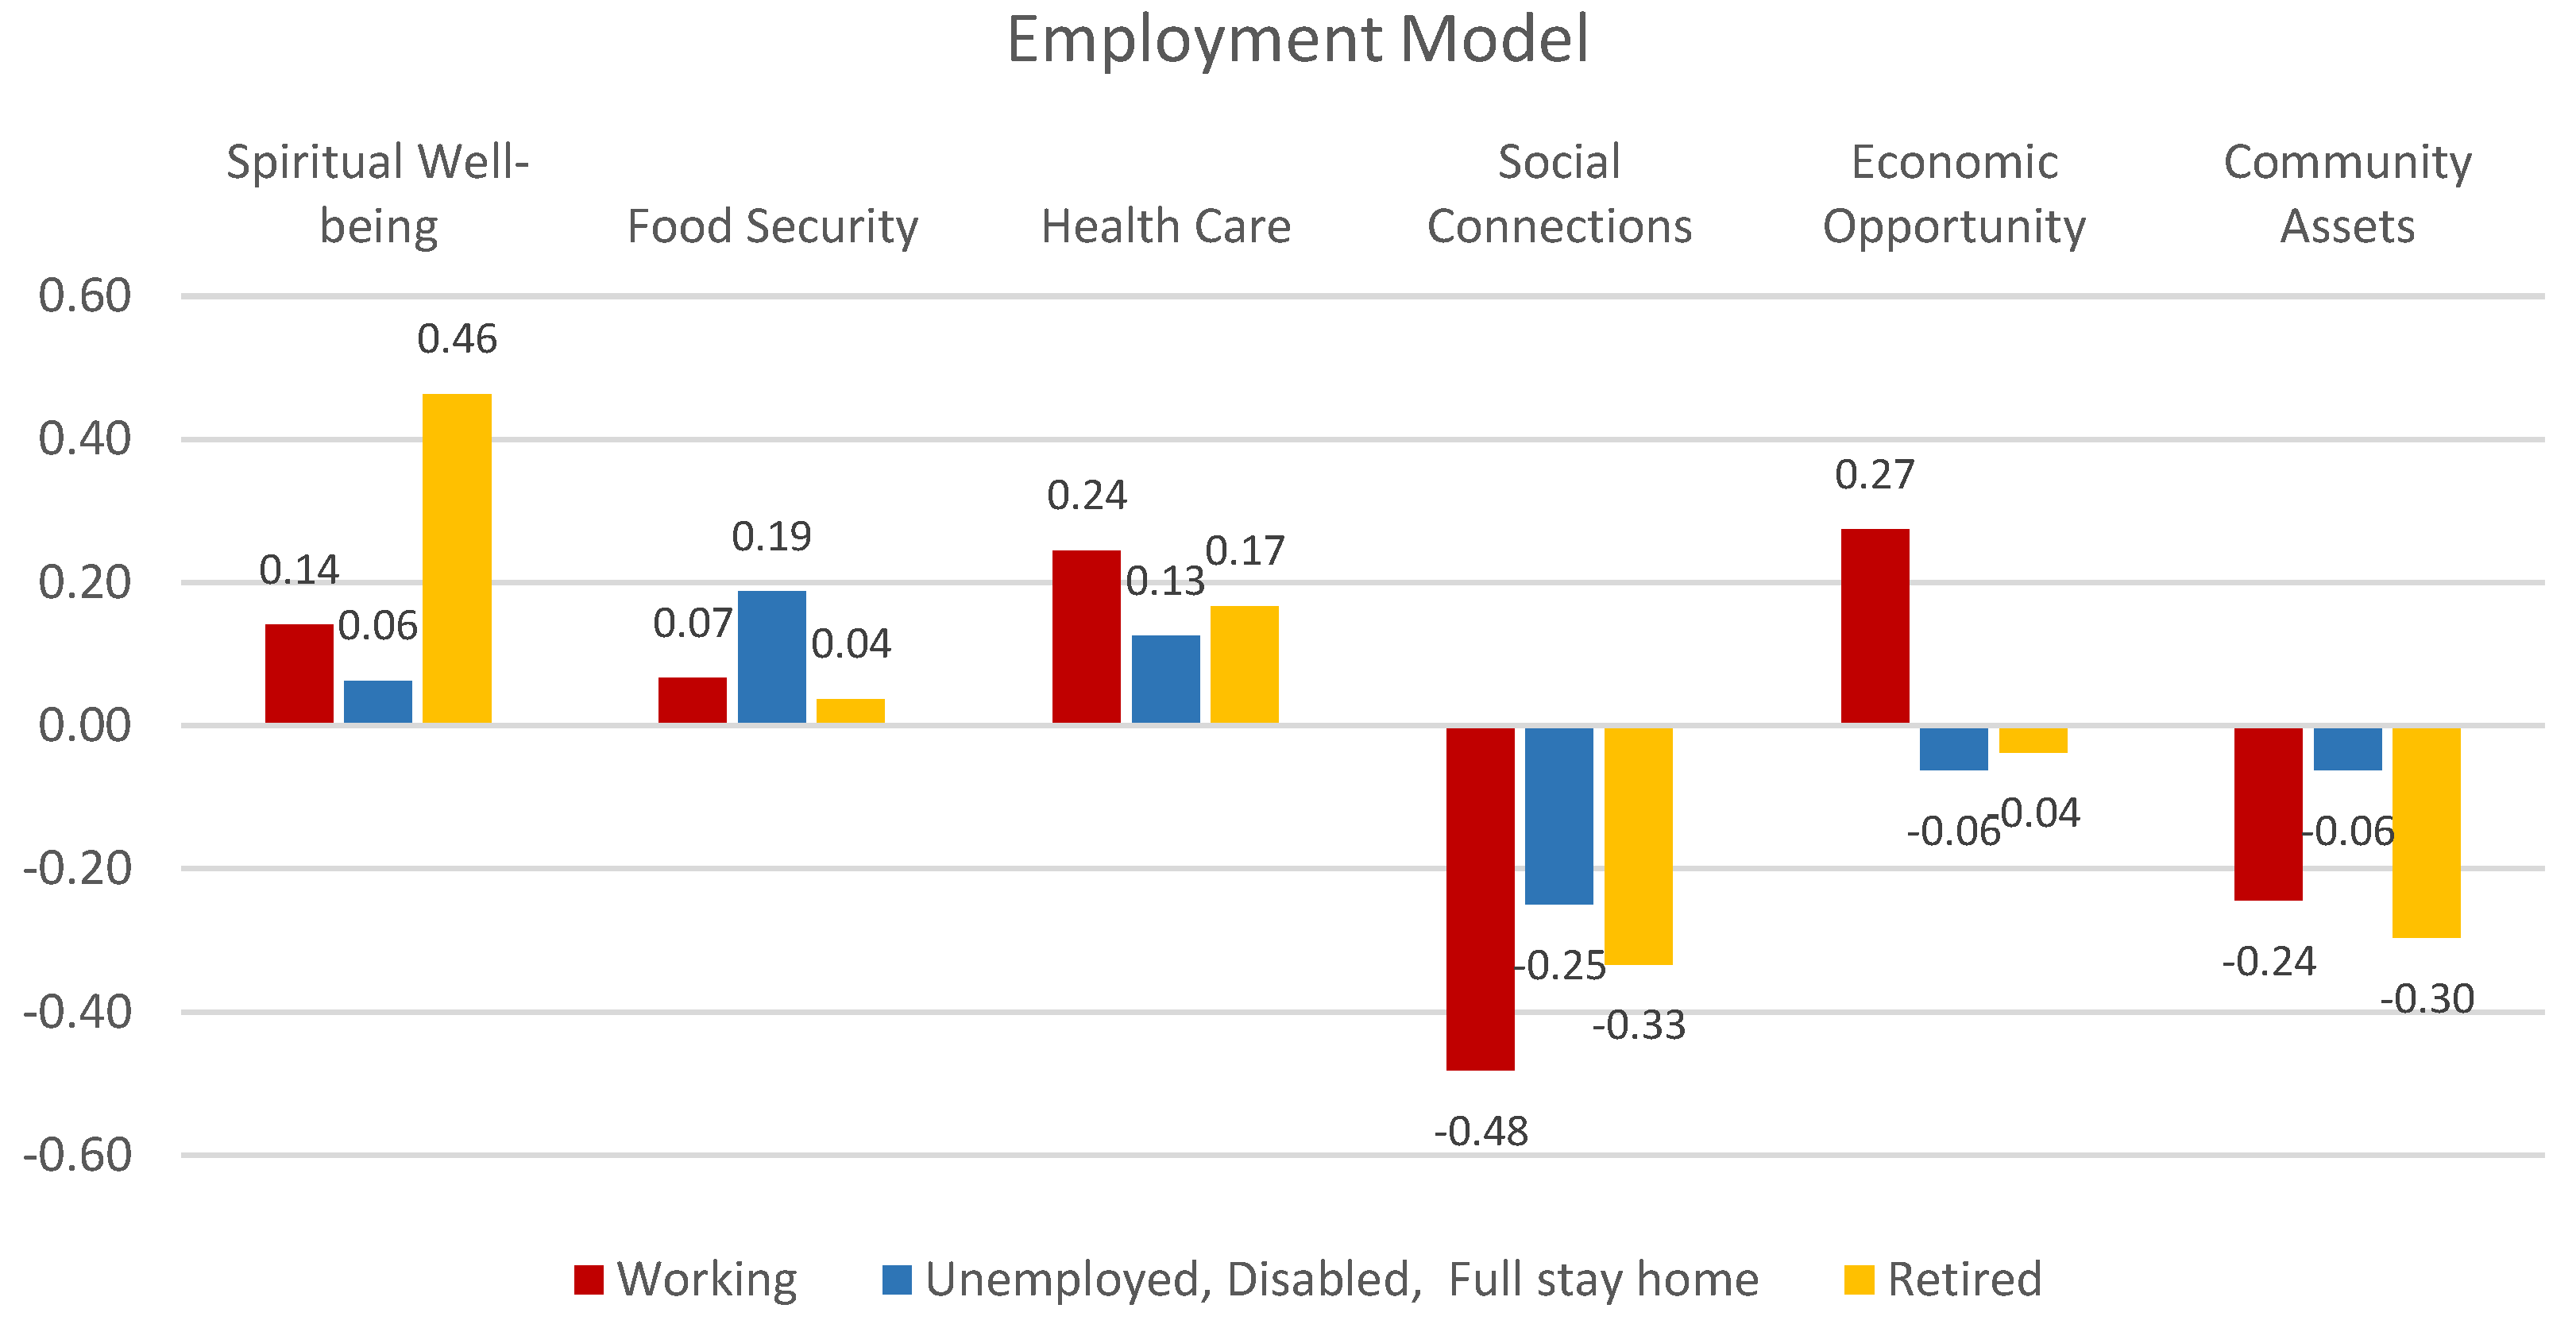
Employment status emerges as a key factor in QOL outcomes. Full-time employees prioritize Economic Opportunities and Healthcare, while Retirees focus on Spiritual Well-being and Healthcare (
Chi-square: 46.502 p<0.05). In contrast, Unemployed individuals place higher importance on Food Security and Community Assets. Case & Deaton (2015) argue that unemployment significantly reduces life satisfaction and overall well-being [
47]. Similarly, Seligman et al. (2010) emphasize the connection between unemployment and increased food insecurity risks [
52]. These findings suggest that employment-focused strategies should address both economic stability and basic needs like food security (
Figure 7).
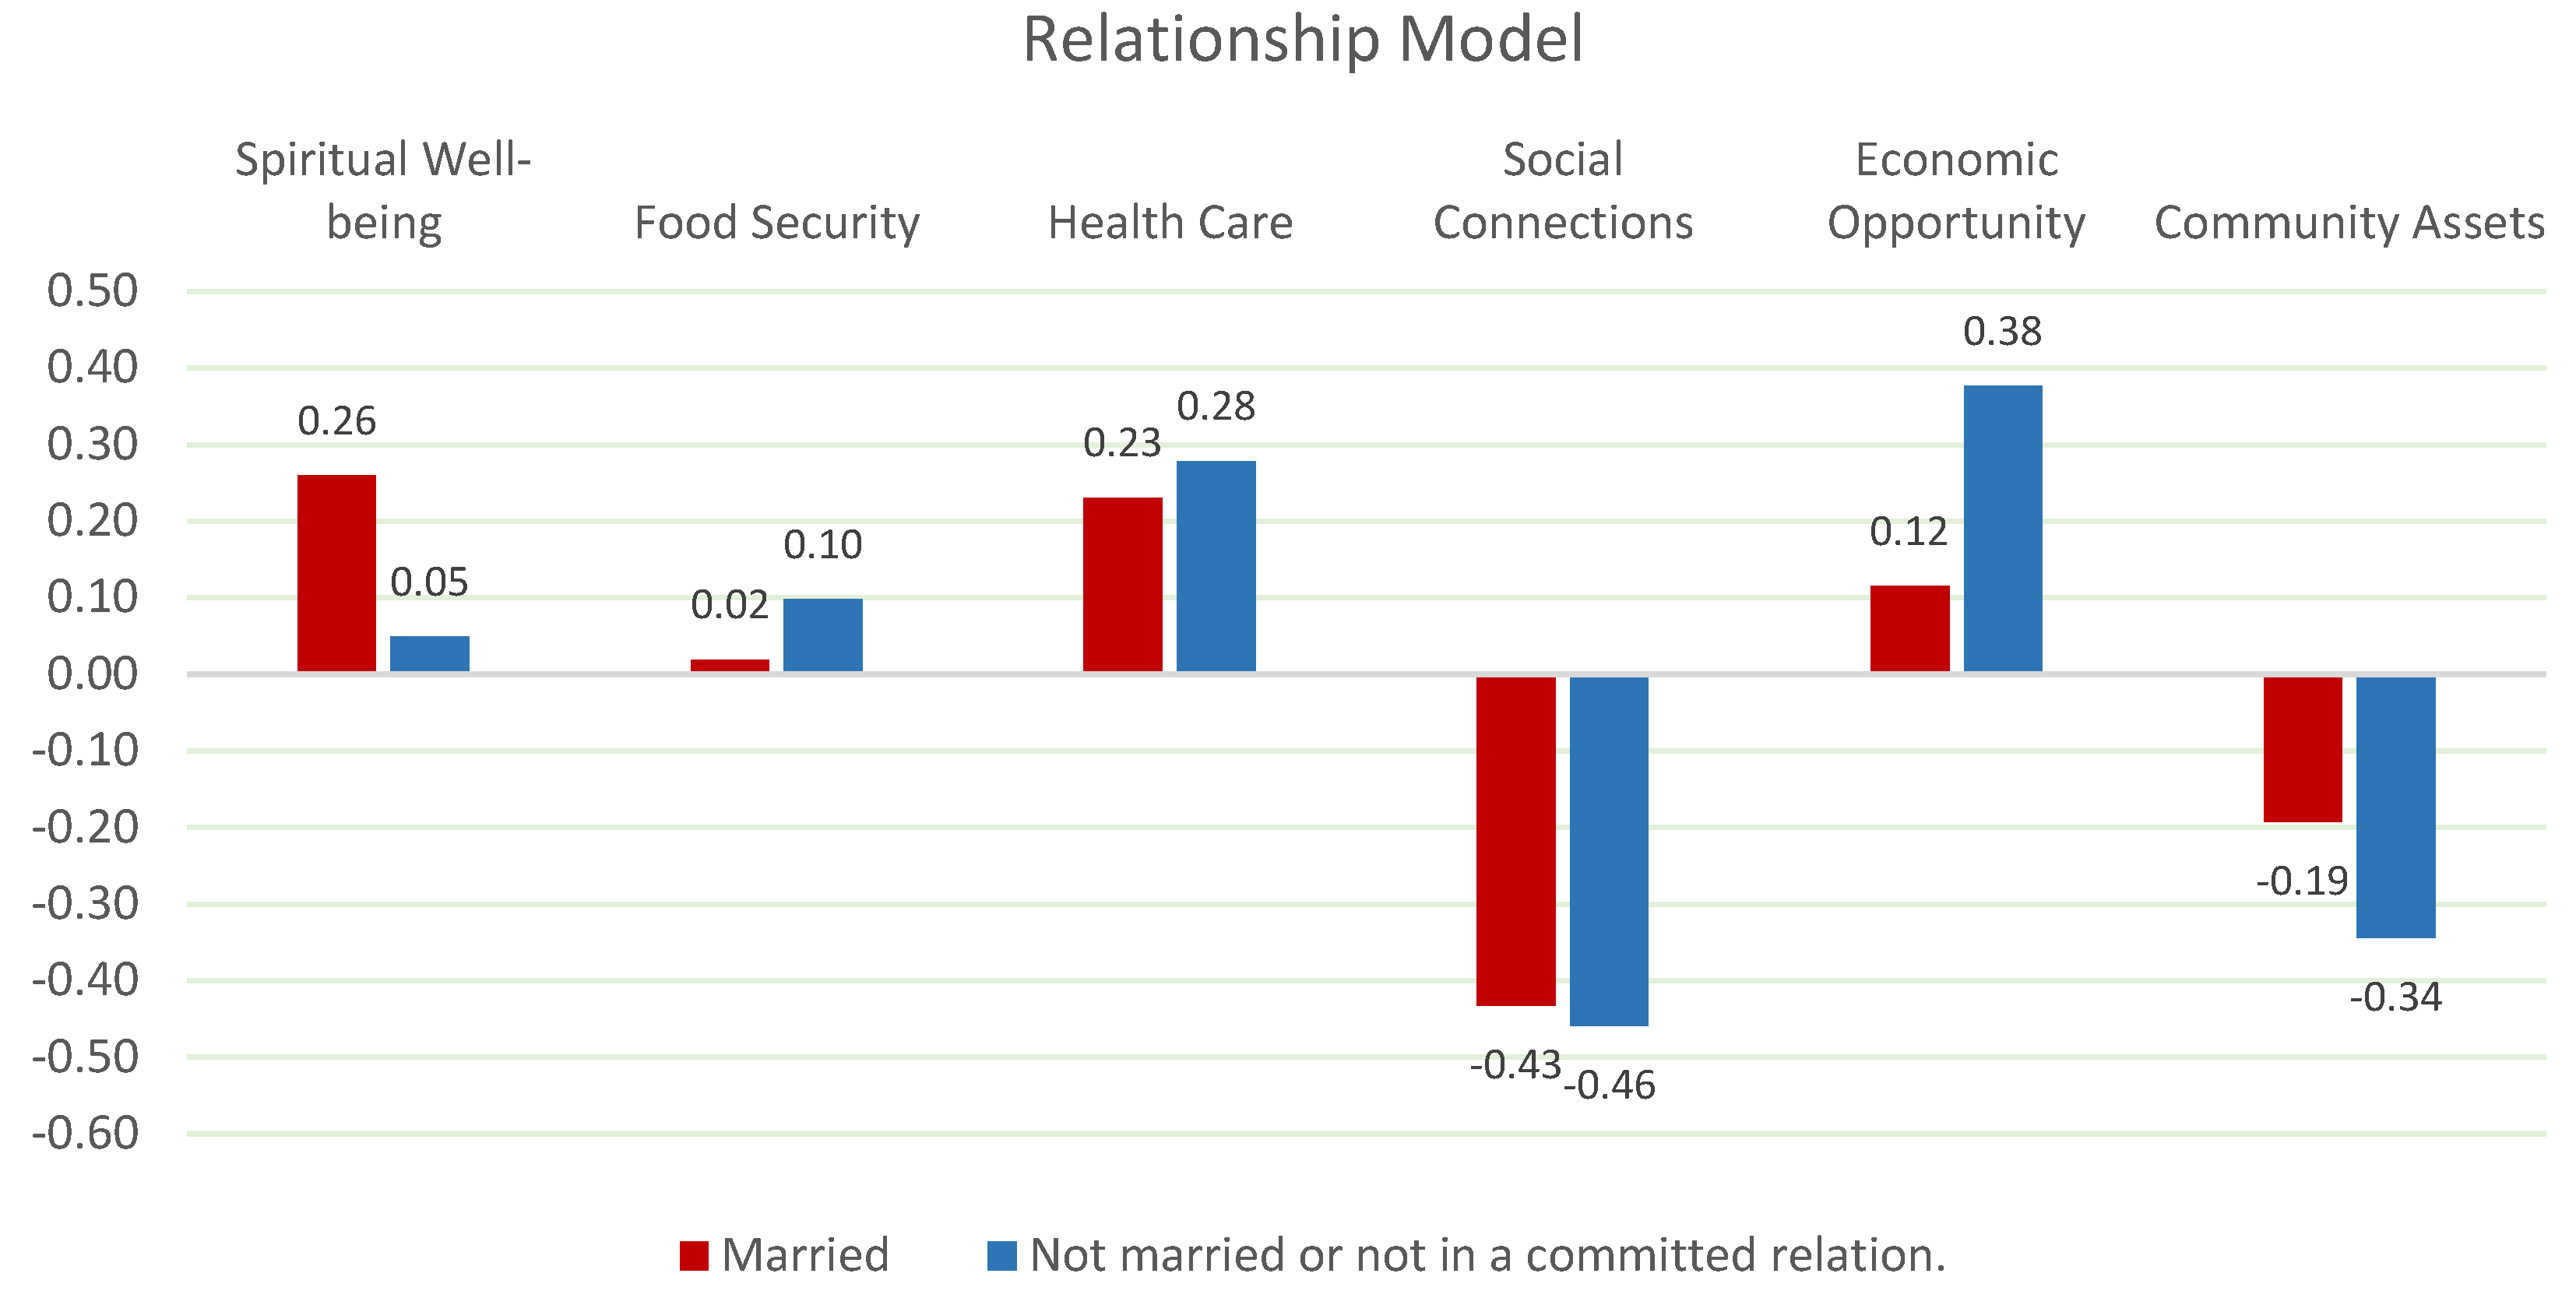
Relationship status has a significant impact on perceptions of QOL (
Chi-square: 48.478 p<0.05). Married individuals prioritize spiritual well-being and health care, while single individuals value economic opportunities and social connections. Research by Holt-Lunstad et al. (2015) suggests that married individuals often benefit from stronger emotional and spiritual support networks [
51]. Conversely, Putnam (2000) highlights the importance of social connections for single individuals in maintaining psychological well-being [
54]. These findings suggest that relationship-specific interventions are essential for improving QOL outcomes (
Figure 8).
Spiritual Wellbeing is the most critical factor for older and retired people. Spiritual support and fulfillment especially strengthens emotional resilience and improves quality of life. Health Care is priority for middle-aged individuals and female respondents. Access to health services has a major impact on quality of life, especially for working-age individuals. Economic opportunity is a key factor for young adults and full-time workers. Economic security and career opportunities have a direct impact on perceptions of quality of life. Food Security is an important factor for individuals with low levels of education and unemployed. Problems in food access negatively affect the quality of life of these segments. Social Assets means that accessing social resources is essential for those on low incomes and those who are unemployed. While social connections are an important factor for young adults, they are less of a priority for older adults and retirees.
The segmentation analysis reveals substantial differences in QOL priorities across demographic groups. Gender, age, race, education, relationship status, and employment status each influence how individuals perceive and prioritize factors contributing to their well-being. Policymakers should develop targeted strategies that address these unique needs, focusing on healthcare, spiritual well-being, economic opportunities, food security, and social connections. By adopting a more nuanced and segmented approach, interventions can be more effective in improving the overall Quality of Life across diverse communities.
3.3. Characterization
Following the segmentation analyses, based on the existing data, we generated persona groups based on different demographic groups' preferences among QOL factors (Spiritual Wellbeing, Food Security, Health Services, etc.). Different personas were revealed, shaped by the priorities they place on key quality of life (QOL) factors. This characterization analysis provides a clear picture of how factors affecting the quality of life of different demographic groups vary. Variables such as age, gender, education, employment status and marital status shape personal priorities and reveal different needs that policy makers need to address. The personas that are identified by the results of analysis are below.
Spiritual Well-being Focused Retired Female: The most important determinant of quality of life for educated, retired, married and female persona is spiritual well-being. While this group places spiritual support and peace of mind at the center of their quality of life, health care stands out as another important factor. Social connections and economic opportunities have a relatively lower priority for this group compared to other factors.
Economic Opportunity Seeking Working Single Male: Economic opportunities and career development are the most important factors determining quality of life for young and middle-aged, full-time employed, single males with a collage or bachelor's degree. While these individuals prioritize financial security and job opportunities, health services also stand out as an important element of support. Social connections and spiritual well-being are not prioritized in the QOL perceptions of this group.
Health Care Focused Middle-Aged and Young Women: For young and middle-aged, working, single, female individuals with a highschool diploma or less, health care is the most influential factor in quality of life. For this group, easy access to health services and quality health infrastructure make the biggest contribution to their quality of life. Social connections and economic opportunities take a back seat.
Food Security Focused Unemployed Singles: Food security is the most fundamental determinant of quality of life for people who are unemployed, single, and have low levels of education. Food security and meeting basic needs are critical for this group.
In sum, the personas derived from this segmentation highlight the multidimensional and context-specific nature of quality of life priorities. Effective policy interventions should consider these nuanced personas, such as addressing the mental and health needs of older adults, increasing food security for vulnerable groups, and promoting economic opportunities for younger and working-age adults. This personas-based approach ensures that resources are allocated efficiently and equitably to meet the most pressing needs in each demographic segment. Designing policies and programs that take into account the specific needs of these different persona groups will provide more effective and sustainable solutions to improve quality of life.
4. Conclusion
This study provides a detailed analysis of the factors affecting quality of life (QOL) and provides comprehensive findings for policy makers to use resources more effectively. Using the Best-Worst Scaling (BWS) methodology and the ISAC (Identification, Segmentation, and Characterization) analysis procedure, we assumed six key factors influencing QOL: Spiritual Well-being, Health Care, Food Security, Economic Opportunity, Community Assets, and Social Connections.
The study highlights the differences in the quality of life priorities of demographic groups and suggests that policy recommendations should be developed according to these differences. Spiritual Wellbeing, Health Services, Economic Opportunities and Food Security are the key factors highlighted in the study. Below, the persona-based policy recommendations identified by these findings are detailed.
For educated, married and retired women, spiritual well-being stands out as the most important determinant of quality of life. This group prioritizes spiritual support and peace of mind to improve quality of life. Access to health services is also a priority factor for this group. In line with these findings, it is important to establish spiritual support groups and encourage spiritual activities. In addition, solutions such as mobile health centers that facilitate access to health services for the elderly may also be among effective policies for this group. Such programs can reduce health expenditures and improve overall quality of life by reducing feelings of loneliness.
Economic opportunities are the most important determinant of quality of life for young and middle-aged working single men. These individuals prioritize economic security and career development. For this group, it is critical to scale up career development programs, increase entrepreneurship support funds and provide incentives that strengthen the local labor market. In addition, improving the skills of this group through technological and vocational training programs can increase job satisfaction and social inclusion.
Among young and middle-aged women, access to health care is one of the factors most affecting quality of life. Facilitating access to health care services for this group of low-educated, employed or unemployed women is of great importance. Expanding women-specific health programs, introducing mobile health centers and expanding health insurance are among the recommendations for this group. Such policies can support societal labor productivity while improving the quality of life of individuals.
Food security is a key determinant of quality of life for unemployed, low-educated and single individuals. To meet the basic needs of this group, there is a need to expand the reach and coverage of food assistance programs. Community gardens and cooperative projects can be implemented to support local food production. In addition, increasing the logistical capacity of food banks and facilitating the provision of low-cost or free food can also be among effective policies for this group.
Overall, the findings of this study demonstrate the effectiveness of segmentation and persona-based approaches in policymaking. Policymakers should develop solutions that take into account the different priorities and needs of each demographic group, act strategically in resource allocation and implement targeted programs at the local level, which will pave the way for sustainable and effective social policies. The study provides a roadmap for more efficient use of limited resources to meet the most critical needs. Accordingly, prioritizing factors such as spiritual well-being, economic opportunities, health care and food security will be an important step in increasing social welfare.
Author Contributions
Conceptualization, T.W.T.; Methodology, T.W.T. and M.C.; Software, M.C.; Validation, T.W.T.; Formal Analysis, M.C.; Investigation, T.W.T.; Resources, T.W.T.; Data Curation, M.C.; Writing—Original Draft Preparation, M.C. & T.W.T.; Writing—Review and Editing, T.W.T. and M.C.; Supervision, T.W.T.; Project Administration, T.W.T. All authors have read and agreed to the published version of the manuscript.
Funding
This work was supported by the USDA National Institute of Food and Agriculture, Ev-ans-Allen project, accession number 1013509. The determination was made that Study #18-0070 did not require IRB review; 06/18 2018.
Institutional Review Board Statement
This study was reviewed by the North Carolina A&T State University IRB and was determined to be exempt from further review according to the regulatory category cited above under 45 CFR 46.101(b).
Informed Consent Statement
Not applicable.
Data Availability Statement
The original contributions presented in the study are included in the article, further inquiries can be directed to the corresponding author.
Conflicts of Interest
The authors declare no conflicts of interest. The founders had no role in the study's design; in the collection, analyses, or interpretation of data; in the writing of the manuscript, or in the decision to publish the results.
References
- Food and Agriculture Organization (FAO). The State of Food Security and Nutrition in the World 2021. Rome, 2021, (archived on 13 Sep 2024). [CrossRef]
- Morse, S. Quality of Life, Well-Being and the Human Development Index: A Media Narrative for the Developed World? . Social Indicators Research, 2023, 170, 1035–1058. [Google Scholar] [CrossRef]
- Karimi, M.; Brazier, J. Health, Health-Related Quality of Life, and Quality of Life: What is the Difference? Pharmacoeconomics 2016, 34, 645–649. [Google Scholar] [CrossRef] [PubMed]
- Rejeski, W.J.; Mihalko, S.L. Physical Activity and Quality of Life in Older Adults. J. Gerontol. A Biol. Sci. Med. Sci. 2001, 56, 23–35. [Google Scholar] [CrossRef] [PubMed]
- Felce, D. Quality of Life: Its Definition and Measurement. Journal of Intellectual Disability Research, 1997, 41, 126–135. [Google Scholar] [CrossRef] [PubMed]
- WHOQOL Group. The World Health Organization Quality of Life Assessment (WHOQOL): Position Paper from the World Health Organization, 1994.
- Bottomley, A. The cancer patient and quality of life. The oncologist, 2002, 7, 120–5. [Google Scholar] [CrossRef] [PubMed]
- Pukelienė, V.; Starkauskienė, V. Quality of life: Factors determining its measurement complexity. Engineering Economics, 2011, 22, 147–156. [Google Scholar] [CrossRef]
- Delhey, J.; Böhnke, P.; Habich, R.; Zapf, W. Quality of life in a European perspective: The EUROMODULE as a new instrument for comparative welfare research. Social Indicators Research, 2002, 58, 161–175. [Google Scholar] [CrossRef]
- Veenhoven, R. The Four Qualities of Life: Ordering Concepts and Measures of the Good Life. Journal of Happiness Studies 2000, 1, 1–39. [Google Scholar] [CrossRef]
- Veenhoven, R. Apparent Quality-of-Life in Nations: How Long and Happy People Live, Social Indicators Research, 2005, 7 61-68.
- Veenhoven, R. Well-being in nations and well-being of nations: Is there a conflict between individuals and society? , Social Indicators Research, 2009, 9, 5–21. [Google Scholar] [CrossRef]
- Frey, B.S.; Stutzer, A. What Can Economists Learn from Happiness Research? . Journal of Economic Literature, 2002, 40, 402–435. [Google Scholar] [CrossRef]
- Raphael, D.; Renwick, R.; Brown, I.; et al. Quality of life indicators and health: Current status and emerging conceptions. Soc Indic Res, 1996, 39, 65–88. [Google Scholar] [CrossRef]
- Pukeliene, V.; Starkauskiene, V. 2011. Quality of Life: Factors Determining its Measurement Complexity. Retrieved from https://pdfs.semanticscholar.org/e294/055466e54714cb91a079fd5ee8a3240ca3a9.pdf.
- Stigler, G.T.; Becker, G.S. DeGustibus Non-Est Disputandum. American Economic Review, 1974, 67, 76–90. [Google Scholar]
- Banerjee, A.V.; Duflo, E. Poor Economics: A Radical Rethinking of The Way to Fight Poverty. Public Affairs, New York, 2011.
- Thomas, P. Systems thinking in public policy. University of Manitoba Press, 2020.
- Kania, J.; Kramer, M. Embracing emergence: How collective impact addresses complexity. Stanford Social Innovation Review, https://www.hbs.edu/faculty/Pages/item.aspx?num=51819.
- Lohr, S. Sampling: Design and Analysis. Nelson Education. 2019. [CrossRef]
- Cankurt, M. A Study on the Determination of Farmers’ Demand for Tractor Satisfaction of Tractor Use and Purchasing Attitudes Towards Tractor: The Case of Aydın. [Doctoral Thesis]. Ege University; 2009. https://tez.yok.gov.tr/UlusalTezMerkezi/tezDetay.jsp?
- Thompson, B. The future of test validity. Educ Res. 2009, 38, 545–556. [Google Scholar] [CrossRef]
- Thomas, T.W.; Cankurt, M. A multi-method Analysis of Food Desert Residents’ Lived Experience with Food. Medical Research Archives 2024, 12. [Google Scholar] [CrossRef]
- Cankurt, M., et al. Agricultural Report of T22 Region, South Marmara Development Agency, Turkey, 2013 https://www.gmka.gov.tr/dokumanlar/yayinlar/Tarim-Arastirma-Raporu.
- Louviere, J.J.; Flynn, T.N.; Marley, A.A.J. Best-Worst Scaling: Theory, Methods and Applications. Cambridge University Press, 2015.
- Mühlbacher, A.C.; Kaczynski, A.; Zweifel, P.; et al. Experimental measurement of preferences in health and healthcare using best-worst scaling: an overview. Health Econ Rev 2016, 6, 2. [Google Scholar] [CrossRef] [PubMed]
- Kiritchenko, S.; Mohammad, S. Best-Worst Scaling More Reliable than Rating Scales: A Case Study on Sentiment Intensity Annotation. In Proceedings of the 55th Annual Meeting of the Association for Computational Linguistics (Volume 2: Short Papers), 2017 pages 465–470, Vancouver, Canada. https://aclanthology.org/P17-2074/. [Google Scholar]
- Creswell, J.W. Research Design: Qualitative, Quantitative, and Mixed Methods Approaches. 4th ed. SAGE Publications; 2014.
- Kotler, P.; Keller, K.L. Marketing Management. 15th ed. Pearson, 2016.
- Solomon, M.R. Consumer Behavior: Buying, Having, and Being. 12th ed. Pearson, 2018.
- Wedel, M.; Kamakura, W.A. Market Segmentation: Conceptual and Methodological Foundations. Kluwer Academic Publishers, 2000.
- Dolnicar, S.; Grün, B. Challenging 'factor-cluster segmentation. ' J Travel Res. 2008, 47, 63–71. [Google Scholar] [CrossRef]
- Bhatnagar, A.; Gopalaswamy, A.K. A Persona-Based Approach for Customer Segmentation and Marketing. Int J Inf Manage. 2017, 37, 13–20. [Google Scholar]
- Saarijärvi, H.; Sutinen, U.M.; Harris, L.C. Uncovering Consumer Value Formation: A Study of Employee-Customer Interactions in Mobile Banking. Int J Bank Mark. 2017, 35, 90–102. [Google Scholar]
- Louviere, J.J.; Woodworth, G.G. Best Worst Scaling: A Model for Largest Difference Judgments; Working Paper; Faculty of Business, University of Alberta: Edmonton, AB, Canada 1990. [Google Scholar]
- Louviere, Finn, and Timmermans Retailing Research, forthcoming in McGraw-Hill Handbook of Marketing Research. New York: McGraw-Hill Book Company, 1992.
- Grebitus, C.; Hartmann, M. Consumer Preferences for Sustainability Labels in Food Production: Combining Best-Worst Scaling and Discrete Choice Experiments. Food Policy, 2020, 91, 101830. [Google Scholar]
- Flynn, T.N.; Louviere, J.J.; Peters, T.J.; Coast, J. Best-Worst Scaling: What It Can Do for Health Care Research and How to Do It. Journal of Health Economics, 2007, 26, 171–189. [Google Scholar] [CrossRef] [PubMed]
- Cankurt, M.; Thomas, T.; Gunden, C.; Miran, B. Consumer decision-making styles: Investigation of food shopping behavior. J Food Agric Environ. 2013, 11, 224–227. [Google Scholar]
- Marley, A.A.J.; Pihlens, D. Models of Best-Worst Choice. Journal of Mathematical Psychology, 2012, 56, 24–34. [Google Scholar] [CrossRef]
- U.S. Census Bureau. Demographic Characteristics in the United States. 2022. Available on www.census.gov date of reached: 11/01/2024.
- Data USA, North Carolina, Guilford County Statistics Data, 2022. URL https://datausa.io/profile/geo/guilford-county-nc (archived on 24). 20 September.
- Pew Research Center, National Statistics, 2022. URL https://www.pewresearch.org/publications/?_regions_countries=united-states (archived on 24). 20 September.
- Bureau of Labor Statistics. 2022. Employment Situation Summary. Available on www.bls.gov. 1: date of reached, 2024.
- Koenig, H.G.; King, D.E.; Carson, V.B. Handbook of Religion and Health. Oxford University Press, 2012.
- VanderWeele, T.J.; Balboni, T.A.; Koh, H.K. Health and spirituality. JAMA, 2017, 318, 519–520. [Google Scholar] [CrossRef]
- Case, A.; Deaton, A. Rising morbidity and mortality in midlife among white non-Hispanic Americans in the 21st century. Proceedings of the National Academy of Sciences, 2015, 112, 15078–15083. [Google Scholar] [CrossRef]
- Marmot, M. The health gap: The challenge of an unequal world. The Lancet, 2017, 386, 2442–2444. [Google Scholar] [CrossRef]
- Sen, A. Development as Freedom. Anchor Books, 2013.
- Banerjee, A.V.; Duflo, E. Good Economics for Hard Times: Better Answers to Our Biggest Problems. Public Affairs, New York, 2019.
- Holt-Lunstad, J.; Smith, T.B.; Layton, J.B. Social relationships and mortality risk: A meta-analytic review. PLOS Medicine, 2015, 7, e1000316. [Google Scholar] [CrossRef]
- Seligman, H.K.; Laraia, B.A.; Kushel, M.B. Food insecurity is associated with chronic disease among low-income NHANES participants. The Journal of Nutrition, 2010, 140, 304–310. [Google Scholar] [CrossRef]
- Gundersen, C.; Ziliak, J.P. Food insecurity and health outcomes. Health Affairs, 2015, 34, 1830–1839. [Google Scholar] [CrossRef]
- Putnam, R.D. Bowling Alone: The Collapse and Revival of American Community. Simon & Schuster, 2000.
- Wilkinson, R.G.; Pickett, K.E. The spirit level: Why greater equality makes societies stronger. Bloomsbury Publishing, 2010.
- Smith, L.C.; Haddad, L. Explaining Child Malnutrition in Developing Countries: A Cross-Country Analysis. International Food Policy Research Institute, 2015.
- Marmot, M.; Wilkinson, R.G. Social Determinants of Health. Oxford University Press, 2012.
- Rubin, D.B.; Little, R.J. Statistical Analysis with Missing Data. John Wiley & Sons; 2002.
- NC Office of State Budget and Management. North Carolina Demographic, 2022. Data. Available on www.osbm.nc.gov , date of reached: 11/01/2024.
|
Disclaimer/Publisher’s Note: The statements, opinions and data contained in all publications are solely those of the individual author(s) and contributor(s) and not of MDPI and/or the editor(s). MDPI and/or the editor(s) disclaim responsibility for any injury to people or property resulting from any ideas, methods, instructions or products referred to in the content. |
© 2025 by the authors. Licensee MDPI, Basel, Switzerland. This article is an open access article distributed under the terms and conditions of the Creative Commons Attribution (CC BY) license (http://creativecommons.org/licenses/by/4.0/).