Submitted:
23 January 2025
Posted:
24 January 2025
You are already at the latest version
Abstract
Gymnocalycium cv. Fancy is an ornamental cactus with a heterogeneous genetic background, which includes variegated variants whose in vitro culture response has not been studied. So plants exhibiting different degrees of variegation (from 0% to 100%) were also classified by their initial size and used to obtain different types of explants (apices, central discs, epicotyls and hypocotyls). The effects of three plant growth regulators (BAP at 8µM, KIN at 4µM and TDZ at 1µM) was evaluated. The response of explants was measured in the number of shoots, calluses and rhizogenesis events per explant; as well as the appearance of variegated shoots with specific color percentages. Central discs treated with 1 µM TDZ provided the best results in terms of shoot production. Additionally, a correlation was observed between the type of activated areole (green, mixed or fully colored) and the percentage of color of the obtained shoots, enabling precise explant selection based on desired morphological characteristics. Additionally, the appearance of shoots with different colors confirms the possibility of selecting new lines from this cultivar. These findings could be of great value not only for breeding and multiplication of ornamental cactaceae but also other edible species and relatives.
Keywords:
citokinins
; colored cactus
; organogenesis
; plant growth regulators
; cactus areolas
; explant
1. Introduction
Variegated plants represent a significant part of the ornamental plant market due to their aesthetic appearance [1]. This variegation results from a partial or total deficit of chlorophyll in certain regions of the plant, leading to colorations ranging from yellowish to whitish. The presence of leaves and/or stems with a different color or coloring patterns than those typical of the original species gives variegated plants a greater visual beauty and ornamental value, making them highly valued among both, amateur and professional gardeners or floriculturists [2,3]. Therefore, although these plants tend to be less vigorous than the non-variegated ones, due to their lower amount of chlorophyll, which affects their photosynthetic capacity [4], it is not surprising that commercial nurseries work intensively to obtain plants with new colorations or patterns to annually introduce into the market.
Nowadays, the presence of a wide range of variegated plants, including popular ones like pothos, alocasias and monsteras, reflects their significance in gardening and landscaping. Also, certain cactus cultivars developed from Gymnocalycium mihanovichii (Frič and Gürke) Britton and Rose, are commercially important due to their diverse coloration [5] (Figure 1). Many of these variants are clonally propagated through grafting [6,7], although the success of this process can be influenced by the ability of the parent plants to produce shoots with the expected patterns of coloration or color percentage.
The grafting technique is widely used in the mass propagation of cacti due to its advantages against plants grown from their roots [8]. Grafting allows: (i) enhanced plant development, (ii) increased shoot production, (iii) accelerate blooming, reducing the time between generations and (iv) intensify flowering (i.e. more flowers per season) [9]. Additionally, rootstocks are usually more vigorous and resistant to humidity, pests and diseases, minimizing losses from rot and simplifying their cultivation [8,9].
Nevertheless, grafting may alters the natural morphology of the plants, leading to an atypical appearance that may not appeal to collectors, who prefer visually natural plants capable of growing on their own roots. Completely achlorophyllous plants must remain grafted due to their inability to photosynthesize [4,10], so they are generally unpopular among collectors. This situation underscores the need for protocols to optimize the production processes of cacti with specific percentage of colorations that are able to develop on their own roots. Such protocols could significantly benefit large-scale cactus producers by improving efficiency and allowing for the selection of plants with desired variegation levels for the collector market.
In this context, in vitro cultivation can play a determinant role, since the regenerative capacity of different structures (mainly areoles) has been observed in a range of cacti species [7,11,12,13]. However, most of these studies have been focused on edible species that have interest on food industry, such as pitahaya and prickly pear [13,14,15,16,17,18,19,20]. Therefore, there is a lack of information regarding many ornamental species that could have a significant impact on the market, in particular when propagating variegated individuals or those with particular color patterns, as in most cases the cellular mechanisms that cause them are unknown [21].
Thus, the study focuses on the in vitro response of Gymnocalycium plants with varying degrees of variegation (Figure 2). Therefore, the objective of the experiment is to establish an efficient protocol for in vitro propagation of Gymnocalycium cv. Fancy plants with varying degrees of variegation. This will be achieved through evaluating the organogenic response and in vitro behavior of diverse explants (apical, central disc, hypocotyl, and epicotyl) from plants of different sizes (small, medium, and large) under three previously tested plant growth regulators (PGRs) used on chlorophyll-containing plants of the same cultivar [22].
The aim is to determine the effect of these plant growth regulators on variegated plants and the relationship between the initial plants' variegation proportion and the productivity of shoots with varying degrees of variegation. This information could be highly relevant in a commercial context, whether it improves graft propagation efficiency or optimizes the production of partially variegated plants for cactus collectors. Furthermore, the results could be applicable to other cactus species that may attract interest from consumers and collectors.
2. Results and Discussion
2.1. Explant Activation
The number of explants that resulted in some type of response (whether it be the formation of shoots, callus, or both), as well as their proportion relative to the total number of explants included for each factor and evaluated variable, are shown in Table 1. It is observed that the presence of TDZ1 in the medium significantly favored the activation of explants, with a response rate of 83.11%, while the other treatments (BAP8, 60.53%; KIN4, 50.67%) showed a lower activation efficiency, but slightly higher than those observed in the control group (46.77%) (Table 1). The high activation capacity of TDZ compared to other growth regulators, both in generating callus or forming shoots, has been reported in various studies with other cactus species [6,8], although it was particularly prominent in previous trials using similar Gymnocalycium cv. Fancy plants [22]. Thus, the repeatability of the response is confirmed in this trial.
On the other hand, there was no difference in the activation capacity of explants obtained from medium-sized plants (69%) or large plants (70%), although the explants from hypocotyl and epicotyl derived of smaller plants showed a lower response (37%) (Table 1). Furthermore, apical and central disc explants, which were obtained from longer plants, also showed high rates of activation (64-74%)(Table 1). These findings suggest that hypocotyl and epicotyl explants, composed of younger and less mature tissues, are not so efficient in activing their areoles with the only use of cytokinins, although specific combinations of auxins and cytokinins may increase efficiency, as it has been observed in other species [23,24,25]. In fact, some authors reported responses using different auxin/cytokinin ratios [26,27,28,29,30,31]
Considering the variegation percentage of the starting plants, it was found that the absence of chlorophyll was extremly limiting. Thus, fully variegated explants responded considerably worse (11% approximately) to treatments compared to plants with chlorophyll tissues (with a response rate > 60%), regardless of their color proportion (Table 1). This fact demonstrate that the total absence of chlorophyll hinders the normal development of plants on their own roots, due to the inability to carry out photosynthetic activity, which leads to their maintenance and propagation through grafting. This study has shown that fully variegated plants also exhibited very limited in vitro development, with many explants degenerating and others unable to grow beyond 8 mm. Probably, the inability to generate photo-assimilates might cause on these already delicate plants, a higher sensitivity to cuttings as it has been observed in Agave angustifolia Haw. albino variant somaclones [21].
2.1.1. Calli Production
The production of calli was found to be closely related to the presence of TDZ1 in the culture medium (Table 2), as have been reported in previous works [32,33,34]. From the beginning of the induction period, calli formation in explants grown under TDZ1 was higher than those observed in other PGRs and the control group (Table 2). Although activation in the presence of BAP8 was higher than that observed in the presence of KIN4 (with values very similar to the control group), the callus formation observed in these groups were minimal (Table 2). These results are in agreement with Giusti et al. [6], who reported a positive effect of TDZ on callus formation and shoot hyperhydration in Escobaria minima (Baird) D. Hunt, Mammillaria pectinifera and Pelecyphora aselliformis, while the presence of BAP and KIN favoured shoot formation.
During the development period in absence of PGRs, the number of observed calluses tended to decrease in all treatments (except those exposed to KIN4), with a considerably reduction in the case of TDZ1 (Table 2). This effect would be related to the removal of hormones after the induction period, since callus formation is usually favored by the presence of cytokinins in the medium [8,32,35]. Through subsequent subcultures, the callus response would gradually decrease, stimulating the structuring and organization of calluses into defined shoots, as observed in other works [22,32,33,34]. From the fourth month of the trial on, no variations were detected in the number of calluses present on the explants.
The process of callogenesis was significantly higher in explants from medium and larger plants than in epicotyl and hypocotyl explants (Table 2). These differences were mainly due to the higher response of apical explants compared to epicotyl explants, although comparatively, central disc explants also showed better responses than hypocotyls (Table 2). Moreover, apices from medium-sized plants provided better results than those from large plants. This fact is usual with cacti, where it has been observed that younger areoles are more sensitive to hormonal treatments than older ones [36]. In fact, most micropropagation protocols in Opuntia and Hylocereus are based on the use of young plants or cladodes [14,15,16,37].
Regarding to the production of callus based on the variegation percentage of the initial plants, the explants from the control group and the group with 25% variegation showed a higher average number of calluses at the end of the trial compared to the explants with a higher percentage of coloration (Table 2). Although statistically significant differences were not observed during the induction period, the development of the explants in the following months varied depending on their color percentage. In fact, plants with lower variegation (control group and 25% variegation) reduced the number of detectable calluses to a lesser extent (45%) than the other groups with higher degrees of variegation (50%, 75%, and 100%), resulting in a 94% reduction of callus presence. These results suggest that plants with a higher percentage of chlorophyll-containing tissue are more stable, and after a callogenic process, the possibility of reverting calluses to defined shoots is lower. Therefore, calluses obtained from explants with a higher degree of variegation would exhibit greater reversibility to shoots, presumably due to being more sensitive to cytokinins than calluses from chlorophyll-containing tissue. This fact was also observed by Rouinsard et al. [38], who reported different responses and behaviours when compared in vitro micropropagation of Yucca gloriosa ‘Variegata’, Phormium tenax ‘Jessie’ and Cordyline australis ‘Pink Passion’, three cultivars with variegated foliage. In this case, they confirmed that the variegation stability was genotype-dependent and highly related to the ability of the explants to be propagated by adventitius meristems [38].
2.1.2. Shoot production
The average of the monthly shoot production per explant for each evaluated factor was recorded in the Table 3. The results demonstrate a significant contribution of hormonal effect on explant activation, both during the induction period and the development period in the absence of regulators. In the first two months of cultivation, under hormone conditions, explants treated with TDZ1 showed a lower shoot production compared to other treatments and the control group. However, after subculturing in a medium without regulators, TDZ1-activated explants started responding positively and eventually showed the best average results at the end of the assay Table 3. This increase in shoot numbers is closely linked to the observed reduction in the number of calli.
Therefore, the total shoot count at the end of the trial is not only due to new areola activation in explants but also to callus structuring and differentiation into shoots. Similar results were obtained in the evaluation of chlorophyllous plants [22] and Rauvolfia serpentina (L.) Benth. ex Kurz plants [32], where the effect of TDZ1 agrees with out findings. In contrast, BAP8 and the control group resulted in very similar shoot productions, while KIN4 showed slightly lower values (Table 3). Considering that responses to exogenous hormones could differ depending on the species and explant source [8,39,40], TDZ1 treatment would be the most efficient for propagating this type of plant material. Probably, the ability of TDZ to alterate endogenous cytokinin metabolism [41,42,43,44,45] could explain its greater activation ability in explants compared to BAP8 or KIN4.
There were no statistically significant differences regarding the initial size of the plant material, although the average values obtained from small explants were slightly lower (Table 3). Therefore, even though the activation percentage of explants from small plants was noticeably lower compared to those from medium and large plants (Table 1), once activated they enabled a productivity similar to that observed in explants from larger plants (Table 3).
When comparing the different types of explants, the highest productivity was observed in apical explants (2.80) from the beginning of the trial. The productivity of epicotyls (2.30) and central discs (2.26) were very similar, while hypocotyls provided a slightly lower average (1.96) (Table 3). These results highlight the potential of epicotyl explants compared to apical and central disc explants, suggesting that they could be very interesting in commercial terms, with a more optimized protocol of activation. The ability to use small seedlings as source material for micropropagation could reduce considerably the time between in vitro cultivation cycles, making the process faster and more profitable.
Related to the influence of the color percentage of the starting material, no significant differences were observed between the various color groups and the control group (0% presence of color) (Table 3). This situation demonstrates that the presence of variegation in plants does not limit their areolar response capacity. Even fully variegated explants were able to activate an average of three areolas per explant by the end of the trial (Table 3). Therefore, the limitation lies in the activation capacity of the explants (Table 1), as once activated, they could potentially offer similar responses.
2.1.3. Efficiency Related to Areolar Activation
Since the number of areolas available on each type of explant is variable (Table 4), the theoretical response may also differ. In addition to evaluating productivity in number of calluses and number of shoots, the efficiency of the explants was also assessed on the percentage of activated areolas compared to the total number on each explant (Table 5). From this perspective, some of the results observed in the previous section were maintained, such as the higher efficiency of TDZ1 in areolar activation, the better response of medium and large-sized explants compared to small ones, and the activation ability regardless of the initial variegation degree (except for fully variegated plants) (Table 5). However, we found that the efficiency of central discs nearly doubled those of apical and hypocotyl explants, while epicotyls showed a significantly lower percentage of areolar activation compared to the rest (Table 5). Considering the contribution of the hormonal treatment and the type of explant, a graphical representation of productivity and efficiency results was conducted to show in a more detailed way the interaction of these main factors (Figure 3).
The combination of both factors showed that, in absence of PGRs, explants generally exhibited a lower shoot production compared to that observed after hormonal treatments. However, in the case of apical explants, the control group showed the best results (Figure 3a). This fact in apical explants could be attributed to changes in the endogenous concentration of phytohormones that naturally activate this tissue after damage to the apical bud, which is common in cacti [33,34]. Therefore, this response would be related to an intrinsic ability to activate dormant buds in that specific tissue fraction and not to the presence of a specific hormone in the medium.
In the evaluation of the average percentage of activated areolas, TDZ showed its greater ability to induce response in all types of explants. Furthermore, a higher efficiency was observed in central disc explants compared to the rest of the explants (Figure 3b), even in those from the control group. The similarity in results between central discs and apices from the control groups reinforces the hypothesis of natural activation of dormant buds in plants with damaged apical meristems [33,34]. However, a slightly more efficient response was evident in areolas from the central region of the plant (Figure 3b). These results are in agreement with previous trials conducted on chlorophyllous plants [22], although in this case, splitting the apices into two (thus eliminating apical dominance phenomena) allowed for a more comparable assessment of their efficiency compared to central discs.
Finally, the specific combination of TDZ1 and central discs resulted in the best trial results, with percentages nearly doubling those obtained using other types of explants (Table 5 and Figure 3b). Considering the significant activation capacity of central disc explants (Table 1), their high potential in activating their areolas in the presence of TDZ1 (Figure 3b), and thus their productivity in a strict sense (Figure 3a), the efficiency of this protocol would stand out above any other possible combination.
2.2. Root Emergence
Considering that the presence of roots could influence their response in generating shoots or calluses [46,47,48], the root emergence was recorded during the first three months of in vitro cultivation, and some of the explants showed rhizogenesis. In general terms, the presence of TDZ1 in the medium had a highly detrimental effect on root formation (with root emergence being minimal), while the lack of cytokinins favored root emission. In fact, the control group showed the highest values in the trial, followed by treatments with KIN4 and BAP8 (Table 6). TDZ is a synthetic hormone with both auxinic and cytokinin activity [49] that appears to have the ability to block or inhibit natural rooting mechanisms, as observed in previous studies [22]. From this perspective, the artificial origin of hormones could influence root emergence in the explants, as similar results have been obtained in other works with 2,4D [50]. However, the use of natural hormones like KIN or BAP seems to have a less negative impact, although they still provide lower rooting values compared to those observed in the control explants.
On the other hand, it was found that the rooting capacity of the explants was closely related to the type of explant used, as apical and epicotyl explants showed a much higher response percentage (around 50-52 %) compared to central disc (13%) and hypocotyl (22%) explants (Table 6). Rooting in epicotyl explants would be expected, as root emergence is a natural process that spontaneously occurs in many species of cacti in response to damage or loss in the basal section of plants or their roots [51]. In contrast, the lower average rooting of hypocotyl explants could be due to their unnatural position in the medium. By contrast, rooting in apical explants was significantly higher than that observed in central discs, despite being similar-sized explants placed in a natural position. This confirms that plant dissection often alters the proportion of endogenous hormones in these structures, favoring the establishment of high auxin/cytokinin ratios in apices and consequently promoting root production in these types of explants [52,53]. On the contrary, this hormonal alteration does not occur in central discs, leading to a significant reduction in rooting events (Table 6).
Furthermore, rooting ability also appears to be related to the percentage of coloration of the explants used. In fact, explants from fully chlorophyllous plants rooted in a higher proportion than variegated ones (Table 6). Once again, these results seem to be associated with the greater vigor of chlorophyllous plants compared to plants with different degree of variegation. Finally, when studying the rooting percentages in detail for each of the test groups, it could be determined that rooting events for Gymnocalycium occur more frequently in the absence of cytokinins and when using apices or epicotyls from fully chlorophyllous plants (Table 7). On the contrary, the presence of TDZ1 blocks root emergence and limits rhizogenesis (Table 7).
2.3. Color Evaluation
A comprehensive evaluation of each individually activated areola was conducted to determine the productive capacity of variegated shoots, taking into account both the percentage of variegation in the starting plants and the tissue coloration observed in the areola itself. The total count of shoots exhibiting varying degrees of coloration, categorized based on the color of the original plant, is presented in Table 8. As expected, plants from the 0% and 100% groups were only able of activating G and C areolas, respectively. However, explants from partially variegated plants (25%, 50%, and 75%) had the ability to activate areolas from all three groups previously defined (G, M, or C), with results included in Table 8. Therefore, it was essential to determine if there was any correlation between the initial variegation percentage of the plants, the type of areola activated, and the degree of coloration of the obtained shoots.
Canonical correlation analyses revealed a strong correlation between the initial percentage of plant coloration and the type of activated areola, as well as between the initial percentage of plant coloration and the degree of coloration of the obtained shoots (Table 9). Furthermore, a strong correlation was also observed between the type of activated areola and the final coloration degree of the shoots (Table 9). Conversely, no correlation was detected between the applied hormonal treatment and the type of activated areola or the coloration degree of the obtained shoots (Table 9), indicating that the hormonal treatment may not have a significant effect on obtaining shoots with different color gradients.
The table shows the estimated correlations between each set of canonical variables. P-values lower than p =0.05 evidence a statistically significant correlation with a 95.0% confidence level.
In Figure 4 it can be observed that, as the initial plants exhibit a higher degree of variegation, the number of colored areolas activated also increases. It appears that there is no limitation on the activation of M or C areolas compared to G ones. Therefore, the activation process seems to be affected by factors unrelated to the color of the areola, and the activation of a higher number of colored areolas in plants with a higher percentage of initial variegation may be just randomly. In this context, as the percentage of variegation in the initial plants increases, the likelihood of obtaining colored shoots also increases (Figure 5).
Since green areolas from the control group only resulted in chlorophyllous shoots and contributed to a remarkable percentage of the evaluated areolas (42%), an individualized evaluation of each type of independent areola and its corresponding generated shoot was conducted to avoid biases in the results, using only those areolas from plants with some initial coloration (Table 10). The representation of the results showed that the coloration of the shoot was determined by the presence of chlorophyllous or variegated tissue in the areola (Figure 6). Therefore, green areolas (regardless of the variegation proportion of the initial plant) produced 97% green shoots, while colored areolas led to 98% colored plants, and from mixed areolas, 41% shoots were green and 59% shoots showed a range of degrees of coloration (Figure 6).
These results may indicate the occurrence of somatic mosaicism in the areolar tissue. Therefore, at least two different cellular lines (chlorophyllous and variegated) would converge in the buds, being capable of generating shoots with varying degrees of variegation. The proportion of these cellular lines and their distribution in the bud would determine the greater or lesser variegation of the obtained shoots (Figure 7) [38,54,55]. These findings are highly interesting in a commercial context, as it could lead to selecting the type of areola to activate based on the coloration of shoots desired, optimizing large-scale production processes. Thus, the use of central discs would optimize propagation of colored Gymnocalycium, in comparison to apices, where selecting areolas would be more difficult due to their smaller size and less inter-areolar space.
Additionally, shoots with new different colorations and color patterns were obtained in this trial (Figure 8), demonstrating that it is possible to produce color variants from plants that appear to have similar variegation. This fact highlights the complexity of the underlying mechanisms involved in the structuring and development of new shoots in variegated plants. Therefore, having a deep understanding on how various cell lines related to the appearance of new shoots with different colorations or color patterns can be activated, would be essential to carry out breeding programs aimed at obtaining new cultivars with different colorations.
Moreover, fully or partially variegated variants can be of great commercial interest. In fact, many cultivars of Gymnocalycium with different colors (Hybotan, Seolhong, Damdan, Hwangweol, etc...), or the yellow peanut cactus (Chamaecereus silvestrii f. Lutea), have gained significant market relevance in recent decades [9]. According to the obtained results, propagation processes of forms or cultivars already in circulation could be optimized through the selection of explants with fully colored areolas. Furthermore, this protocol could be adapted for other variegated cactus species with potential in the wholesale market.
On the other hand, there is a significant market associated with cacti for hobbists, where customers are willing to pay higher prices for plants with distinctive and particular characteristics. Typically, variegations are among the aspects that collectors value. However, fully variegated plants (unable to survive on their own roots) usually do not appeal to this group, given the need for grafting to sustain them. The results obtained show that selecting mixed areolas as starting explants in a micropropagation protocol would allow for obtaining a very significant percentage of shoots with partial variegation (44% in this trial). These shoots could be isolated, rooted, and acclimatized, making their ex vitro development entirely viable. This would meet the expectations of collectors, opening up a new market niche associated with colored cacti.
3. Materials and Methods
3.1. Plant Material and Disinfection
Plants were obtained by in vitro sowing of Gymnocalycium cv. Fancy seeds, kindly donated by Cactusloft OE (Cullera, Valencia, Spain). This commercial hybrid developed by Cactusloft O.E. (Cullera, Valencia, Spain) originated from controlled crosses between Gymnocalycium mihanovichii and Gymnocalycium fiedrichi (Werdermann) Pažout, resulting in progenies with diverse morphologies and colorations due to their broad genetic background. This circumstance gives Gymnocalycium cv. Fancy an enormous potential from a commercial point of view, given that plants with different degrees of variegation can be obtained and selected, and color variants with different morphologies can also be identified [22] (Figure 2). For their disinfection, seeds were treated under aseptic conditions in a laminar flow cabinet (model AH-100, Telstar, Terrassa, Spain) for 1 min in 70% ethanol (v/v), continued by 25 min in 15% domestic bleach solution (v/v; 4% sodium hypochlorite) supplemented with 0.08% of the surfactant Tween-20 (v/v). Finally, seeds were rinsed 3 times in distilled sterilized water before sowing.
3.2. In Vitro Establishment and Culture Conditions
Murashige and Skoog (MS) basal media (Duchefa Biochemie, Haarlem, Netherlands)[56] at half strength (1/2MS, 2.2 g L-1) supplemented with 15 g L-1 of sucrose (Sigma-Aldrich, Missouri, USA) and 7 g L-1 of bacteriological agar (Duchefa Biochemie, Haarlem, Netherlands) was used as a sowing media. pH was adjusted to 5.7 before autoclaving at 120ºC for 20 min [57]. Disinfected seeds were sown into sterile plastic disposable Petri dishes containing 20 seeds each. Seedlings developed under in vitro conditions inside a growth room at 26±2ºC on shelves with a 16 h light / 8 h dark photoperiod and photosynthetic photon flux of 50 molm-2 s-1 for 8 months. Seedlings were subcultured monthly to a fresh media.
3.3. Induction and Tissue Culture Conditions
With the aim of assessing the morphogenic potential of variegated seedlings of Gymnocalycium cv. Fancy with different degree of coloration, three specific concentration of cytokinins (Duchefa Biochemie Company, RV Haarlem, The Netherlands) that generated responses in chlorophyllous plants in previous works [22] were studied: 6-Benzylaminopurine 8µM (BAP8), Kinetin 4 µM (KIN4) and Thidiazuron 1µM (TDZ1).
The explants were placed on a culture 1/2MS media (2.2 g L-1), supplemented with sucrose (15 g L-1), agar (7 g L-1) and each of the three cytokinins (BAP8, KIN4 and TDZ1), adjusting the pH to 5.7, to activate their induction. Besides, a control group in absence of PGRs was included for each plant size and each type of explant. Furthermore, the explants were placed maximizing the contact between the sectioned tissue and the culture medium. The culture in the induction medium lasted for two months. A subculture was performed after the first four weeks to ensure that the hormone concentration was constant throughout the induction period. After the induction period, explants were subcultured to the initial basal 1/2MS media at pH 5.7 in absence of PGRs.
3.4. Experimental Design
After an 8 month period of in vitro growth, a total of 180 plants were selected and classified depending on their initial size (Table 11). From medium and large-sized plants, two types of explants were obtained: apical and central disc, that were in turn sectioned into two halves, i.e. four explants were obtained for each medium or large-sized plant. From small-sized plants, epicotyl and hypocotyl were obtained, through cutting transversally the seedlings into two parts. Roots were completely removed in all cases. Therefore, four different types of explants were evaluated in this study: apical explants, central disc explants, epicotyls and hypocotyls (Table 11).
Plants were visually classified into four groups depending on the proportion of coloration observed (25%, 50%, 75% and 100%). Considering their initial sizes, plants were randomly distributed in each group before obtaining the explants (Table 11). Fully colored plants were only included in the small-sized group, as their lack of chlorophyll provoked sizes < 8 mm of diameter. Furthermore, plants fully covered by chlorophyll (i.e. 0% color) were also included as a different control groups (Figure 9): (a) on one hand, medium-sized plants subjected to the presence of PGRs and, (b) on the other hand, plants of all evaluated sizes (small, medium and large-sized) in absence of PGRs (Table 11).
A total of five 574 explants from plants with different color percentages, including 214 of each apical explants and central disc explants and 73 of each epicotyl and hipocotyl explants, were evaluated during the experiment (Table 11). The explants were analyzed considering the degree of variegation and size of the original plant for each of the hormonal treatments and the control group. They were distributed in groups of four explants per Petri dish for their evaluation.
The percentage of activated explants was calculated as the number of explants that showed some type of response during the assay, either organogenic or callogenic, relative to the total number of explants (Table 1). The appearance of shoots and the formation of calluses were noticed monthly for 5 months, only from those explants that responded to the treatments. Considering the different number of areolas present in each one of the starting explants (Table 4), the results were interpreted taking into account both: (i) productivity (i.e. total number of shoots per explant) and (ii) efficiency (i.e. ratio of the activated areoles with respect to the total of areoles of each explant). The emission of roots was also recorded in terms of percentage during the first three months.
3.4.1. Areole Evaluation
Using a magnifying glass (Kern OZO, 551), all activated areolas from colored plants were visually classified into three groups based on their coloration: green areolas "G" (where both the mamilla and areola were completely green), mixed areolas "M" (showing a combination of chlorophyllous and variegated tissue in both the mamilla and areola), and colored areolas "C" (where both the mamilla and areola were fully colored) (Figure 7). Chlorophyllous plants from the control groups were not included in this evaluation, since all the sprouts obtained in previous trials were totally green [22].
Subsequently, the obtained shoots were counted considering the percentage of coloration of the source plants and classified into four groups based on their final coloration: shoots completely green (without variegation, group "S0"), shoots with a coloration percentage below 50% (group "S1"), shoots with a coloration percentage above 50% (group "S2"), and completely colored shoots (without chlorophyllous tissue, group "S3") (Figure 10). The relationships between the percentage of coloration of the activated areolas and the coloration of the shoots obtained based on the percentage of color of the initial plants, as well as the coloration of the shoots obtained based on the coloration of the activated areolas, were evaluated.
3.5. Statistical Analysis
In order to analize our data sets, multivariate ANOVA analysis was performed to check the effect of the different factors at a level of p < 0.05. The software used for performing this ANOVA analysis was Statgraphics Centurion XVIII (Statgraphics Technologies Inc., The Plains, Virginia, USA). The presence of the three different hormones (BAP8, KIN4 and TDZ1) in the culture media, the relevance of the initial size (small, medium and large-sized plants), the presence of diverse degree of variegation in the initial plants and the activation capacity of the various explants (apical explants, central disc explants, epicotyls and hipocotyls) were analized only in those explants that responded to some treatment.
Means differing significantly were compared using the Student-Newman-Keuls test with a probability level of the 5%. Transformation of the data was previously made to normalize the dataset using the following formulas:
- -
- For numerical and absolute data, including shoot emission, callus production and averages.
- -
- For percentages and efficiency values, including rooting capacity.
The linear combinations between the initial color of the plants, the color of the activated areolas, the color of the shoots obtained and the hormones used in the trial were studied through canonical correlation analysis, establishing a confidence level of 95%. Statgraphics Centurion XVIII (Statgraphics Technologies Inc., The Plains, Virginia, USA) was also used for these analysis.
4. Conclusions
In this work, a specific micropropagation protocol focused on obtaining shoots with varying degrees of variegation in Gymnocalycium cv. Fancy plants has been successfully optimized. The use of central disc explants in the presence of TDZ1 in the culture medium yielded the best results in terms of initial explant activation, shoot productivity and efficiency related to areolar activation per explant. Furthermore, it was observed that the coloration percentage of the starting plants (excluding completely achlorophyllous plants) did not limit the response capacity of the evaluated explants. Hence, a strong correlation exists between the initial variegation percentage of the plants and the type of activated areola.
Additionally, the type of activated areola correlated with the color percentage of the obtained shoots, highlighting a situation of somatic mosaicism in the areolas that determines the variegation percentage of the final shoot. These results allow for adjusting and optimizing propagation protocols to obtain plants with different variegation proportions based on commercial objectives. So that, for obtaining fully variegated shoots, colored areolas would be selected, while for obtaining shoots with partial variegation, explants carrying mixed areolas would be chosen.
Therefore, this protocol is extremely valuable from a commercial standpoint as it enables control and prediction of the coloration of the obtained plants, thus allowing them to be directed towards high-impact markets (wholesale or collector). Consequently, achieving greater efficiency and resource optimization in commercial plant production processes would be possible.
Author Contributions
Conceptualization, B.P., C.C.-O., V.M.G.-S. and A.R.-B; methodology, C.C.-O., A.F. and A.R.-B; software, C.G.-R. and A.B.-G; validation, C.C.-O., A.F. and A.R.-B; formal analysis, C.C.-O. and C.G.-R.; investigation, C.C.-O., V.M.G.-S., A.B.-G. and A.R.-B; resources, A.F. and A.R.-B; data curation, C.C.-O., V.M.G.-S; writing—original draft preparation, C.C.-O., V.M.G.-S. and A.R.-B; writing—review and editing, C.C.-O., C.G.-R., A.F., B.P. and A.R.-B.; visualization, A.R.-B; supervision, A.R.-B; funding acquisition, A.F. and A.R.-B. All authors have read and agreed to the published version of the manuscript.
Funding
This research received no external funding.
Data Availability Statement
Data is contained within the article.
Acknowledgments
The authors thank to CactusLoft (https://www.cactusloft.com/) the availability of plantlets and seedlings from Gymnocalycium cv. Fancy used in this work.
Conflicts of Interest
The authors declare no conflicts of interest.
References
- Chen, J.; Henny, R.J. Somaclonal variation: an important source for cultivar development of floriculture crops. Floric. Ornam. plant Biotechnol. 2006, 2, 244–253. [Google Scholar]
- Dole, J.; Wilkins, H. Floriculture: principles and species; Prentice Hall, 1999; ISBN 0133747034. [Google Scholar]
- Chen, J.; McConnell, D.; Norman, D.; Henny, R. The foliage plant industry. Hortic. Rev. (Am. Soc. Hortic. Sci). 2005, 31, 47–112. [Google Scholar]
- Pilbeam, J. Gymnocalycium a collector’s guide; A.A. Balkema Publishers: Rotterdam, Netherlands, 1995. [Google Scholar]
- Kamalzade, N.; Miri, S.M.; Ghazijahani, N. Development of Graft Union Formation and Histological Observations in Cactus Influenced by Benzyladenine, Grafting Method and Rootstock. J. Ornam. Plants plants 2021, 1, 43–45. [Google Scholar] [CrossRef]
- Giusti, P.; Vitti, D.; Fiocchetti, F.; Colla, G.; Saccardo, F.; Tucci, M. In vitro propagation of three endangered cactus species. Sci. Hortic. (Amsterdam). 2002, 95, 319–332. [Google Scholar] [CrossRef]
- Torres-Silva, G.; Correia, L.N.F.; Koehler, A.D.; Batista, D.S.; Faria, D.V.; Resende, S.V.; Strickler, S.R.; Fouracre, J.; Romanel, E.; Specht, C.D.; et al. Expression of Melocactus glaucescens SERK1 sheds new light on the mechanism of areolar activation in cacti. Plant Cell. Tissue Organ Cult. 2021, 147, 437–451. [Google Scholar] [CrossRef]
- Pérez-Molphe-Balch, E.; Santos-Díaz, M.D.S.; Ramírez-Malagón, R.; Ochoa-Alejo, N. Tissue culture of ornamental cacti. Sci. Agric. 2015, 72, 540–561. [Google Scholar] [CrossRef]
- Jeong, M. Il; Cho, C.-H.; Lee, J.-M. Production and Breeding of Cacti for Grafting in Korea. Chron. Horticult. 2004, 44, 7–10. [Google Scholar]
- Vidican, I.T.; Lazar, A.N.; Iancu, C.V.; Carbunar, M.M.; Vidican, O.M. Comparative study on the regenerative and organogenic capacity of Echinocactus (Pfiff.) mihanovichii explants, in the presence in the culture medium of 2.5 mg/L of 3-indolylbutyric acid (AIB) and 2.5 mg/L of 2, 4-dichlorophenoxyacetic acid (2, 4D). Environ. Prot. 2022, 55–60. [Google Scholar]
- Thorpe, T.A. History of plant tissue culture. Mol. Biotechnol. 2007, 37, 169–180. [Google Scholar] [CrossRef] [PubMed]
- Bhatia, S. Plant Tissue Culture. Mod. Appl. Plant Biotechnol. Pharm. Sci. 2015, 31–107. [Google Scholar] [CrossRef]
- Bouzroud, S.; El Maaiden, E.; Sobeh, M.; Devkota, K.P.; Boukcim, H.; Kouisni, L.; El Kharrassi, Y. Micropropagation of Opuntia and other cacti species through axillary shoot proliferation: A Comprehensive Review. Front. Plant Sci. 2022, 13. [Google Scholar] [CrossRef]
- Mulas, M.; Spano, D.; Pellizzaro, G.; D'hallewin, G. Rooting of Opuntia ficus-indica Mill. young cladodes. Adv. Hortic. Sci. 1992, 6, 44–46. [Google Scholar] [CrossRef]
- Estrada-Luna, A.A.; Martínez-Hernández, J. de J.; Torres-Torres, M.E.; Chablé-Moreno, F. In vitro micropropagation of the ornamental prickly pear cactus Opuntia lanigera Salm–Dyck and effects of sprayed GA3 after transplantation to ex vitro conditions. Sci. Hortic. (Amsterdam). 2008, 117, 378–385. [Google Scholar] [CrossRef]
- Ghaffari, A.; Hasanloo, T.; Nekouei, M. Micropropagation of tuna (Opuntia ficus – indica ) and effect of medium composition on proliferation and rooting. Int. J. Biosci. 2013, 3, 129–139. [Google Scholar] [CrossRef]
- Radi, H.; Bouchiha, F.; El Maataoui, S.; Oubassou, E.Z.; Rham, I.; Alfeddy, M.N.; Aissam, S.; Mazri, M.A. Morphological and physio-biochemical responses of cactus pear (Opuntia ficus indica (L.) Mill.) organogenic cultures to salt and drought stresses induced in vitro. Plant Cell. Tissue Organ Cult. 2023, 154, 337–350. [Google Scholar] [CrossRef]
- Marhri, A.; Tikent, A.; Garros, L.; Merah, O.; Elamrani, A.; Hano, C.; Abid, M.; Addi, M. Rapid and Efficient In vitro Propagation Protocol of Endangered Wild Prickly Pear Growing in Eastern Morocco. Hortic. 2023, 9, 491. [Google Scholar] [CrossRef]
- Fan, Q.J.; Zheng, S.C.; Yan, F.X.; Zhang, B.X.; Qiao, G.; Wen, X.P. Efficient regeneration of dragon fruit (Hylocereus undatus) and an assessment of the genetic fidelity of in vitro-derived plants using ISSR markers. J. Hortic. Sci. Biotechnol. 2015, 88, 631–637. [Google Scholar] [CrossRef]
- Martínez-Arroyo, M.C.; Mancilla-Álvarez, E.; Spinoso-Castillo, J.L.; Bello-Bello, J.J. Evaluation of the effect of different culture systems on photomixotrophic capacity during in vitro multiplication of pitahaya (Hylocereus undatus). South African J. Bot. 2023, 159, 396–404. [Google Scholar] [CrossRef]
- Everani, M. The History of Research on White-Green Variegated Plants. Bot. Rev. 1989, 55, 106–139. [Google Scholar]
- Cortés-Olmos, C.; Guerra-Sandoval, V.M.; Blanca-Giménez, V.; Rodríguez-Burruezo, A. Micropropagation and Acclimatization of Gymnocalycium cv. Fancy (Cactaceae): Developmental Responses to Different Explant Types and Hormone Conditions. Plants 2023, 12, 3932. [Google Scholar] [CrossRef] [PubMed]
- Su, Y.H.; Zhang, X.S. The hormonal control of regeneration in plants. Curr. Top. Dev. Biol. 2014, 108, 35–69. [Google Scholar] [CrossRef]
- Hu, W.; Fagundez, S.; Katin-Grazzini, L.; Li, Y.; Li, W.; Chen, Y.; Wang, X.; Deng, Z.; Xie, S.; McAvoy, R.J.; et al. Endogenous auxin and its manipulation influence in vitro shoot organogenesis of citrus epicotyl explants. Hortic. Res. 2017, 4, 1–6. [Google Scholar] [CrossRef] [PubMed]
- Raspor, M.; Motyka, V.; Kaleri, A.R.; Ninković, S.; Tubić, L.; Cingel, A.; Ćosić, T. Integrating the roles for cytokinin and auxin in de Novo shoot organogenesis: From hormone uptake to signaling outputs. Int. J. Mol. Sci. 2021, 22, 8554. [Google Scholar] [CrossRef]
- Villavicencio Gutiérrez, E.E.; González Cortés, A.; Carranza Pérez, M.A. Micropropagation of Epithelantha micromeris (Engelm.) FAC Weber ex Britt. & Rose, an ornamental cactus and phytogenetic resource of the Chihuahuan Desert. Mex. J. For. Sci. 2012, 3, 83–102. [Google Scholar]
- Lin, R.-S. Studies on tissue culture of cactus (Gymnocalycium minansvichii Var.). Agric. Lab. 1982, 31, 220–224. [Google Scholar]
- Nitesh, K.; Vishal, S.; Satvaan, S.; Rohit, G.; Piyush, S.; Vinay, D.; Mohd, W.; Manoj, K.P. A Comprehensive Review on Role of Plant Tissue Culture in Ornamental Crops: Cultivation Factors, Applications and Future Aspects. Int. J. Environ. Clim. Chang. 2023, 13, 1802–1815. [Google Scholar] [CrossRef]
- Shahab, S.; Seied, M.M.; Noushin, G. Callus induction from in vitro cultured leaf, hypocotyl and root of Hyssopus officinalis. In 1st National Conference on the Application of Advancedchemical and Agricultural Research for Development of Medicinal Plants; MDPI, 2021. [Google Scholar]
- Dar, S.A.; Nawchoo, I.A.; Tyub, S.; Kamili, A.N. Effect of plant growth regulators on in vitro induction and maintenance of callus from leaf and root explants of Atropa acuminata Royal ex Lindl. Biotechnol. Reports 2021, 32, e00688. [Google Scholar] [CrossRef]
- Marasek-Ciolakowska, A.; Nishikawa, T.; Shea, D.J.; Okazaki, K. Breeding of lilies and tulips-Interspecific hybridization and genetic background. Breed. Sci. 2018, 68, 35–52. [Google Scholar] [CrossRef] [PubMed]
- Alatar, A.A. Thidiazuron induced efficient in vitro multiplication and ex vitro conservation of Rauvolfia serpentina - A potent antihypertensive drug producing plant. Biotechnol. Biotechnol. Equip. 2015, 29, 489–497. [Google Scholar] [CrossRef]
- Vyskot, B.; JáRa, Z. Clonal propagation of cacti through axillary buds in vitro. J. Hortic. Sci. 1984, 59, 449–452. [Google Scholar] [CrossRef]
- Martínez-Vázquez, O.; Rubluo, A. In-vitro mass propagation of the near-extinct Mammillaria san-angelensis Sánchez-Mejorada. J. Hortic. Sci. 1989, 64, 99–105. [Google Scholar] [CrossRef]
- Lema-Rumińska, J.; Kulus, D. Micropropagation of Cacti—a Review. Haseltonia 2014, 2014, 46–63. [Google Scholar] [CrossRef]
- Kaviani, B. Some Useful Information about Micropropagation. J. Ornam. Plants 2015, 5, 29–40. [Google Scholar]
- Mohamed-Yasseen, Y. Micropropagation of pitaya (Hylocereus undatus Britton et Rose). Vitr. Cell. Dev. Biol. - Plant 2002, 38, 427–429. [Google Scholar] [CrossRef]
- Rouinsard, A.; Hamama, L.; Hibrand-Saint Oyant, L.; Grapin, A. Effects of the in vitro behavior of micropropagated plants on the stability of variegation in Yucca gloriosa, Phormium tenax, and Cordyline australis cultivars. Sci. Hortic. (Amsterdam). 2021, 287, 110115. [Google Scholar] [CrossRef]
- Viñas, M.; Fernández-Brenes, M.; Azofeifa, A.; Jiménez, V.M. In vitro propagation of purple pitahaya (Hylocereus costaricensis [F.A.C. Weber] Britton & Rose) cv. Cebra. Vitr. Cell. Dev. Biol. - Plant 2012, 48, 469–477. [Google Scholar] [CrossRef]
- Lázaro-Castellanos, J.O.; Mata-Rosas, M.; González, D.; Arias, S.; Reverchon, F. In vitro propagation of endangered Mammillaria genus (Cactaceae) species and genetic stability assessment using SSR markers. Vitr. Cell. Dev. Biol. - Plant 2018, 54, 518–529. [Google Scholar] [CrossRef]
- Li, H.; Murch, S.J.; Saxena, P.K. Thidiazuron induced de novo shoot organogenesis on seedlings, etiolated hypocotyls and stem segments of Huang-qin. Plant Cell. Tissue Organ Cult. 2000, 62, 169–173. [Google Scholar] [CrossRef]
- Ahmad, N.; Siddique, I.; Anis, M. Improved plant regeneration in Capsicum annuum L. from nodal segments. Biol. Plant. 2006, 50, 701–704. [Google Scholar] [CrossRef]
- Guo, B.; Abbasi, B.H.; Zeb, A.; Xu, L.L.; Wei, Y.H. Thidiazuron: A multi-dimensional plant growth regulator. African J. Biotechnol. 2011, 10, 8984–9000. [Google Scholar] [CrossRef]
- Zhou, J.; Ma, H.; Guo, F.; Luo, X. Effect of thidiazuron on somatic embryogenesis of Cayratia japonica. Plant Cell. Tissue Organ Cult. 1994, 36, 73–79. [Google Scholar] [CrossRef]
- Sankhla, D.; Davis, T.D.; Sankhla, N. Thidiazuron-induced in vitro shoot formation from roots of intact seedlings of Albizzia julibrissin. Plant Growth Regul. 1994, 14, 267–272. [Google Scholar] [CrossRef]
- McClelland, M.T.; Smith, M.A.L.; Carothers, Z.B. The effects of in vitro and ex vitro root initiation on subsequent microcutting root quality in three woody plants. Plant Cell. Tissue Organ Cult. 1990, 23, 115–123. [Google Scholar] [CrossRef]
- Amghar, I.; Ibriz, M.; Ibrahimi, M.; Boudra, A.; Gaboun, F.; Meziani, R.; Iraqi, D.; Mazri, M.A.; Diria, G.; Abdelwahd, R. In vitro root induction from Argan (Argania spinosa (L.) Skeels) adventitious shoots: influence of ammonium nitrate, auxins, silver nitrate and putrescine, and evaluation of plantlet acclimatization. Plants 2021, 10, 1062. [Google Scholar] [CrossRef] [PubMed]
- Fenning, T.; O’Donnell, M.; Preedy, K.; Bézanger, A.; Kenyon, D.; Lopez, G. The rooting ability of in vitro shoot cultures established from a UK collection of the common ash (Fraxinus excelsior L.) and their ex vitro survival. Ann. For. Sci. 2022, 79, 1–16. [Google Scholar] [CrossRef]
- Pai, S.R.; Desai, N.S. Effect of TDZ on various plant cultures. Thidiazuron From Urea Deriv. to Plant Growth Regul. 2018, 439–454. [Google Scholar] [CrossRef]
- Rubluo, A.; Marín-Hernández, T.; Duval, K.; Vargas, A.; Márquez-Guzmán, J. Auxin induced morphogenetic responses in long-term in vitro subcultured Mammillaria san-angelensis Sánchez-Mejorada (Cactaceae). Sci. Hortic. (Amsterdam). 2002, 95, 341–349. [Google Scholar] [CrossRef]
- Retes-Pruneda, J.L.; Valadez-Aguilar, M. de L.; Pérez-Reyes, M.E.; Pérez-Molphe-Balch, E. In vitro propagation of Echinocereus, Escontria, Mammillaria, Melocactus and Polaskia species (Cactaceae). Bot. Sci. 2007, 9–16. [Google Scholar] [CrossRef]
- Su, Y.H.; Liu, Y.B.; Zhang, X.S. Auxin cytokinin interaction regulates meristem development. Mol. Plant 2011, 4, 616–625. [Google Scholar] [CrossRef] [PubMed]
- Otiende, M.A.; Fricke, K.; Nyabundi, J.O.; Ngamau, K.; Hajirezaei, M.R.; Druege, U. Involvement of the auxin-cytokinin homeostasis in adventitious root formation of rose cuttings as affected by their nodal position in the stock plant. Planta 2021, 254. [Google Scholar] [CrossRef] [PubMed]
- Duarte-Aké, F.; De-la-Peña, C. High cytokinin concentration and nutrient starvation trigger DNA methylation changes in somaclonal variants of Agave angustifolia Haw. Ind. Crops Prod. 2021, 172, 114046. [Google Scholar] [CrossRef]
- Duarte-Aké, F.; Castillo-Castro, E.; Pool, F.B.; Espadas, F.; Santamaría, J.M.; Robert, M.L.; De-La-peña, C. Physiological differences and changes in global DNA methylation levels in agave angustifolia haw. Albino variant somaclones during the micropropagation process. Plant Cell Rep. 2016, 35, 2489–2502. [Google Scholar] [CrossRef] [PubMed]
- Murashige, T.; Skoog, F. A revised medium for rapid growth and bio assays with tobacco tissue cultures. Physiol. Plant. 1962, 15, 473–497. [Google Scholar] [CrossRef]
- Teixeira, S.L.; Ribeiro, J.M.; Teixeira, M.T. Influence of NaClO on nutrient medium sterilization and on pineapple (Ananas comosus cv Smooth cayenne) behavior. Plant Cell. Tissue Organ Cult. 2006, 86, 375–378. [Google Scholar] [CrossRef]
Figure 1.
Commercial selections of Gymnocalycium mihanovichii with different colorations and color distribution patterns.
Figure 1.
Commercial selections of Gymnocalycium mihanovichii with different colorations and color distribution patterns.
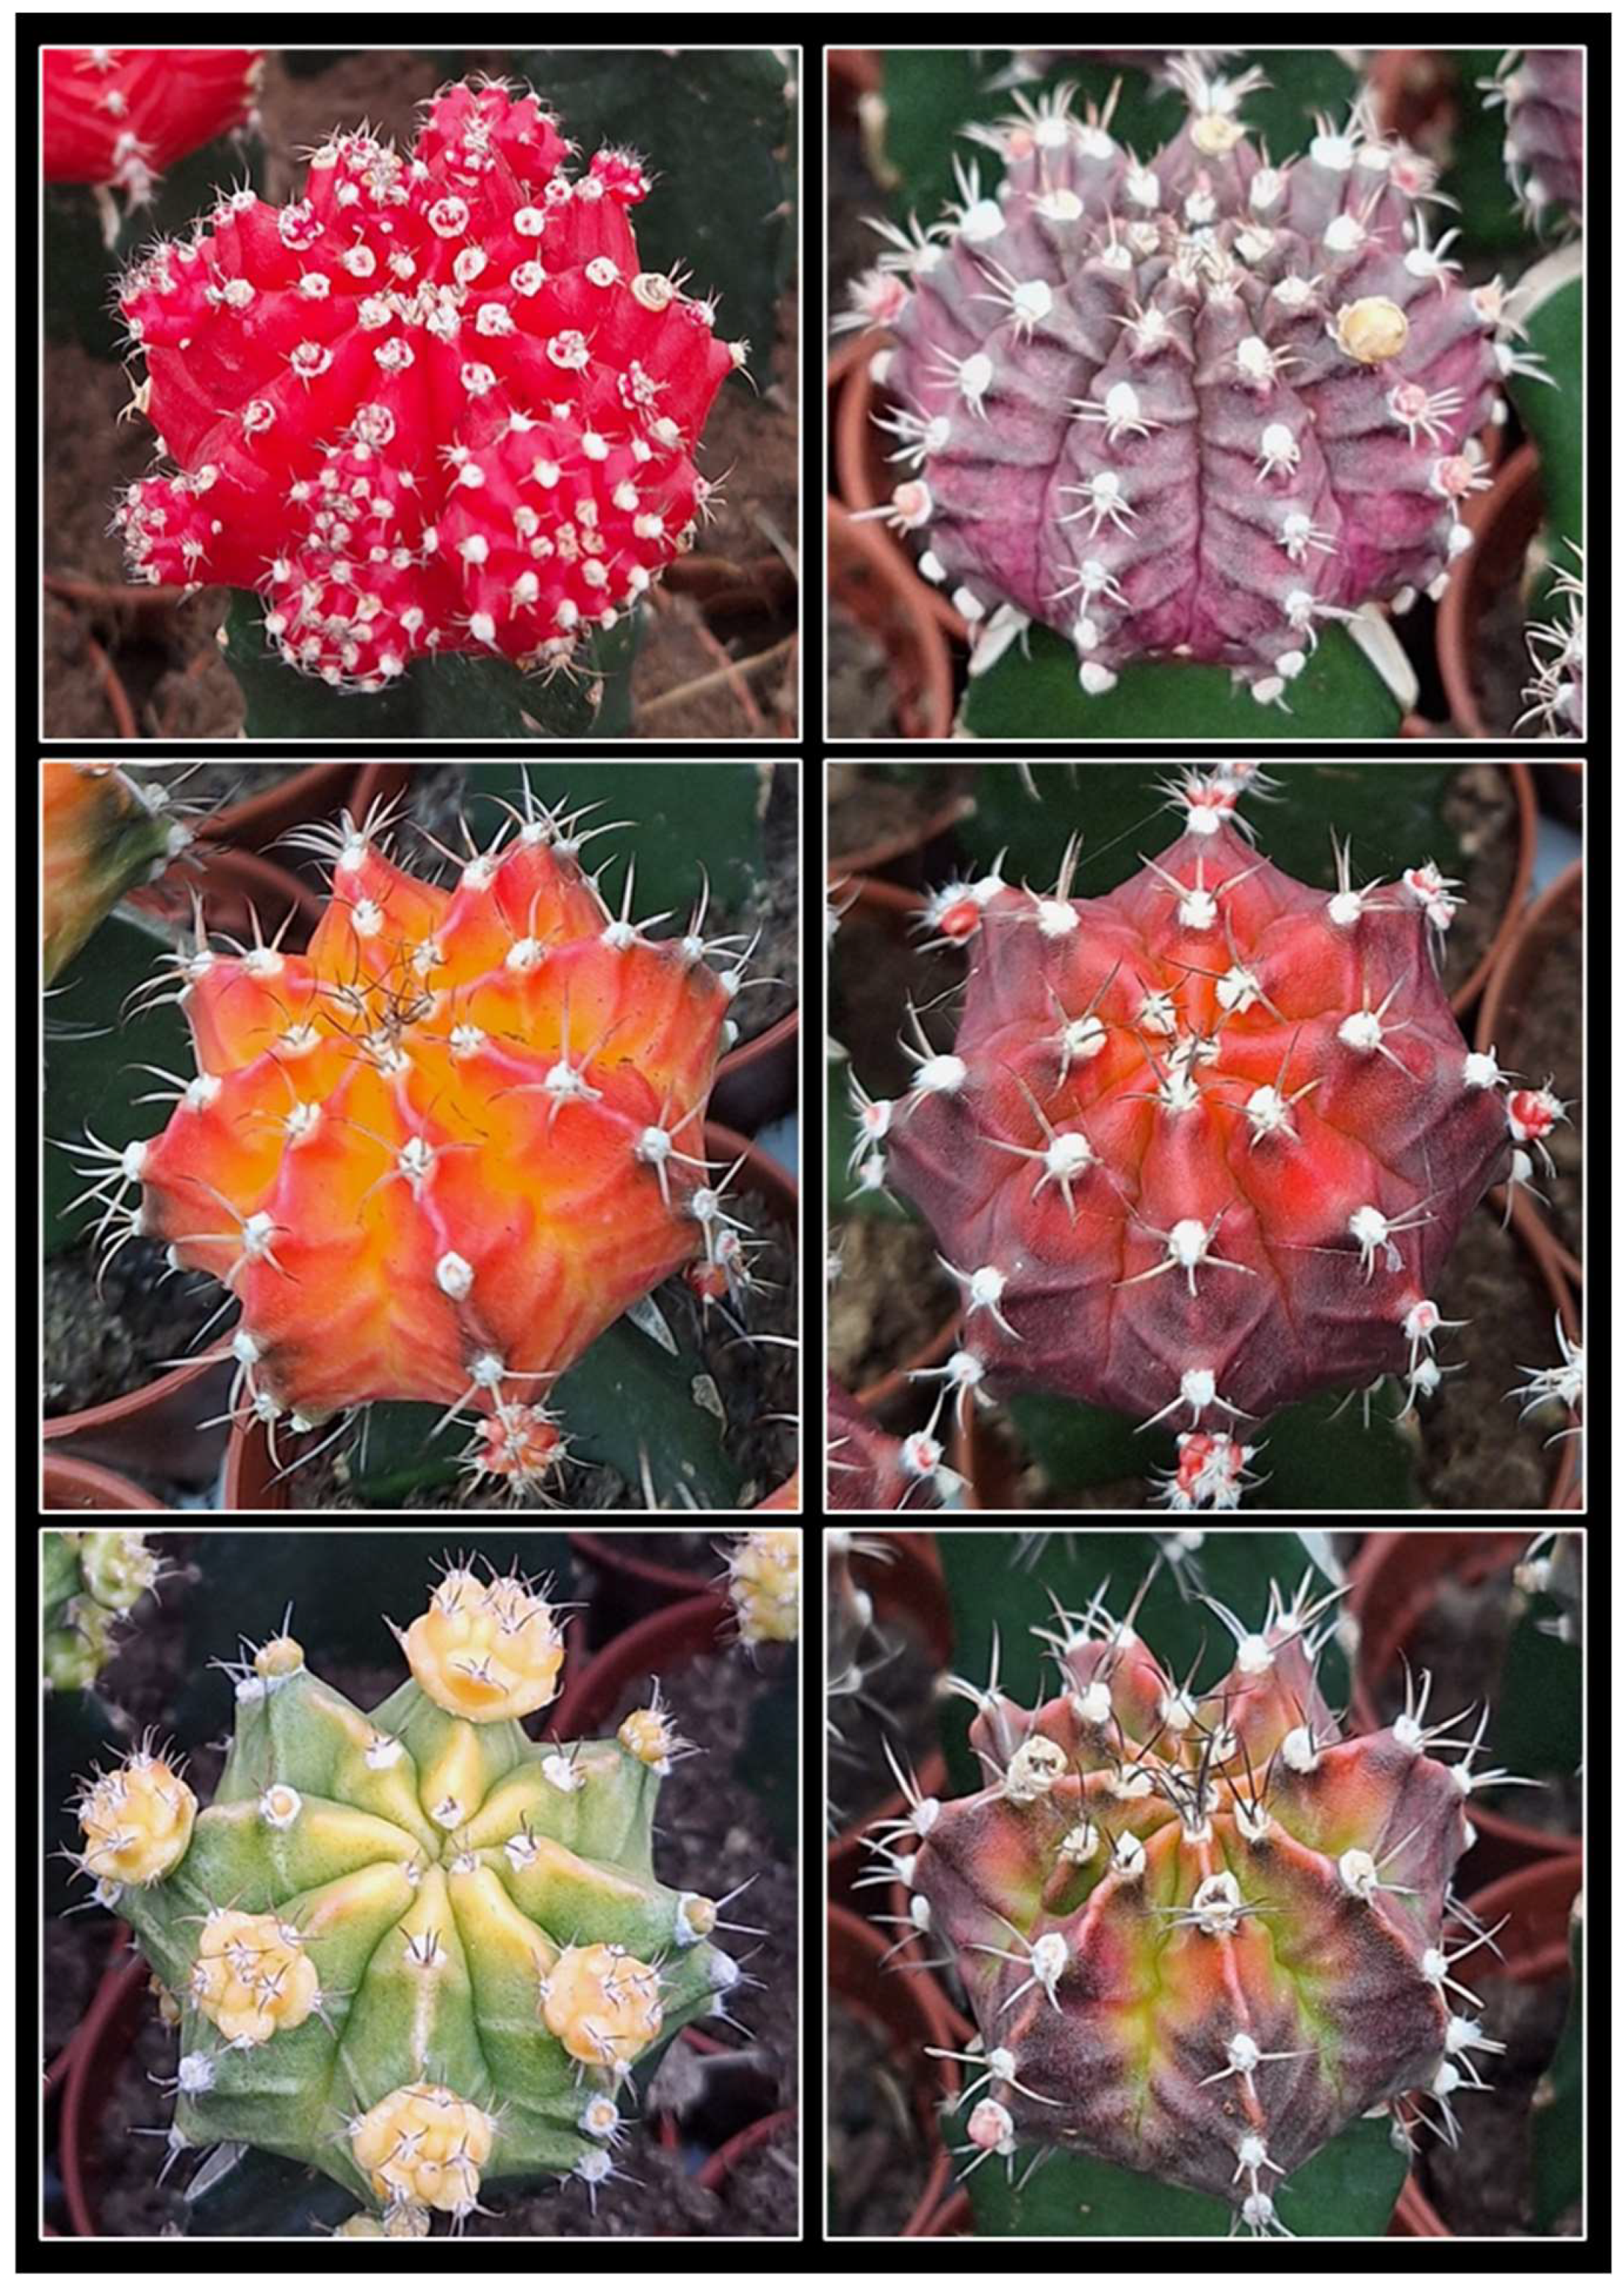
Figure 2.
Morphological heterogeneity observed in one-year-old Gymnocalycium cv. Fancy shoots obtained in vitro and subsequently acclimatized. (a, b) Expected morphologies within the usual range of variation of the cultivar. (c, d) Unexpected morphologies obtained, monstrous (c) and caespitose forms (d). (e) Variegated plants with different degrees of variegation.

Figure 3.
(a) Average number of shoots obtained for each "Hormone + Explant Type" combination during each month of cultivation. (b) Average percentage of areoles activated by each "Hormone + Explant Type" combination during each month of cultivation. Hormone: CONTROL (control group), BAP8 (6-Benzylaminopurine), KIN4 (Kinetin) and TDZ1 (Thidiazuron). Numbers following the conditions indicate the hormonal concentration (1, 4 or 8 µM). Capital letters indicate the explants used in each combination: A (apical), CD (central discs), EP (epicotyl) and HYP (hypocotyl). Letters (a, b, c, d, e, f) above the bars represent significant differences based on sample means at the fifth month of evaluation, for p = 0.05 according to the Student–Newman–Keuls test.
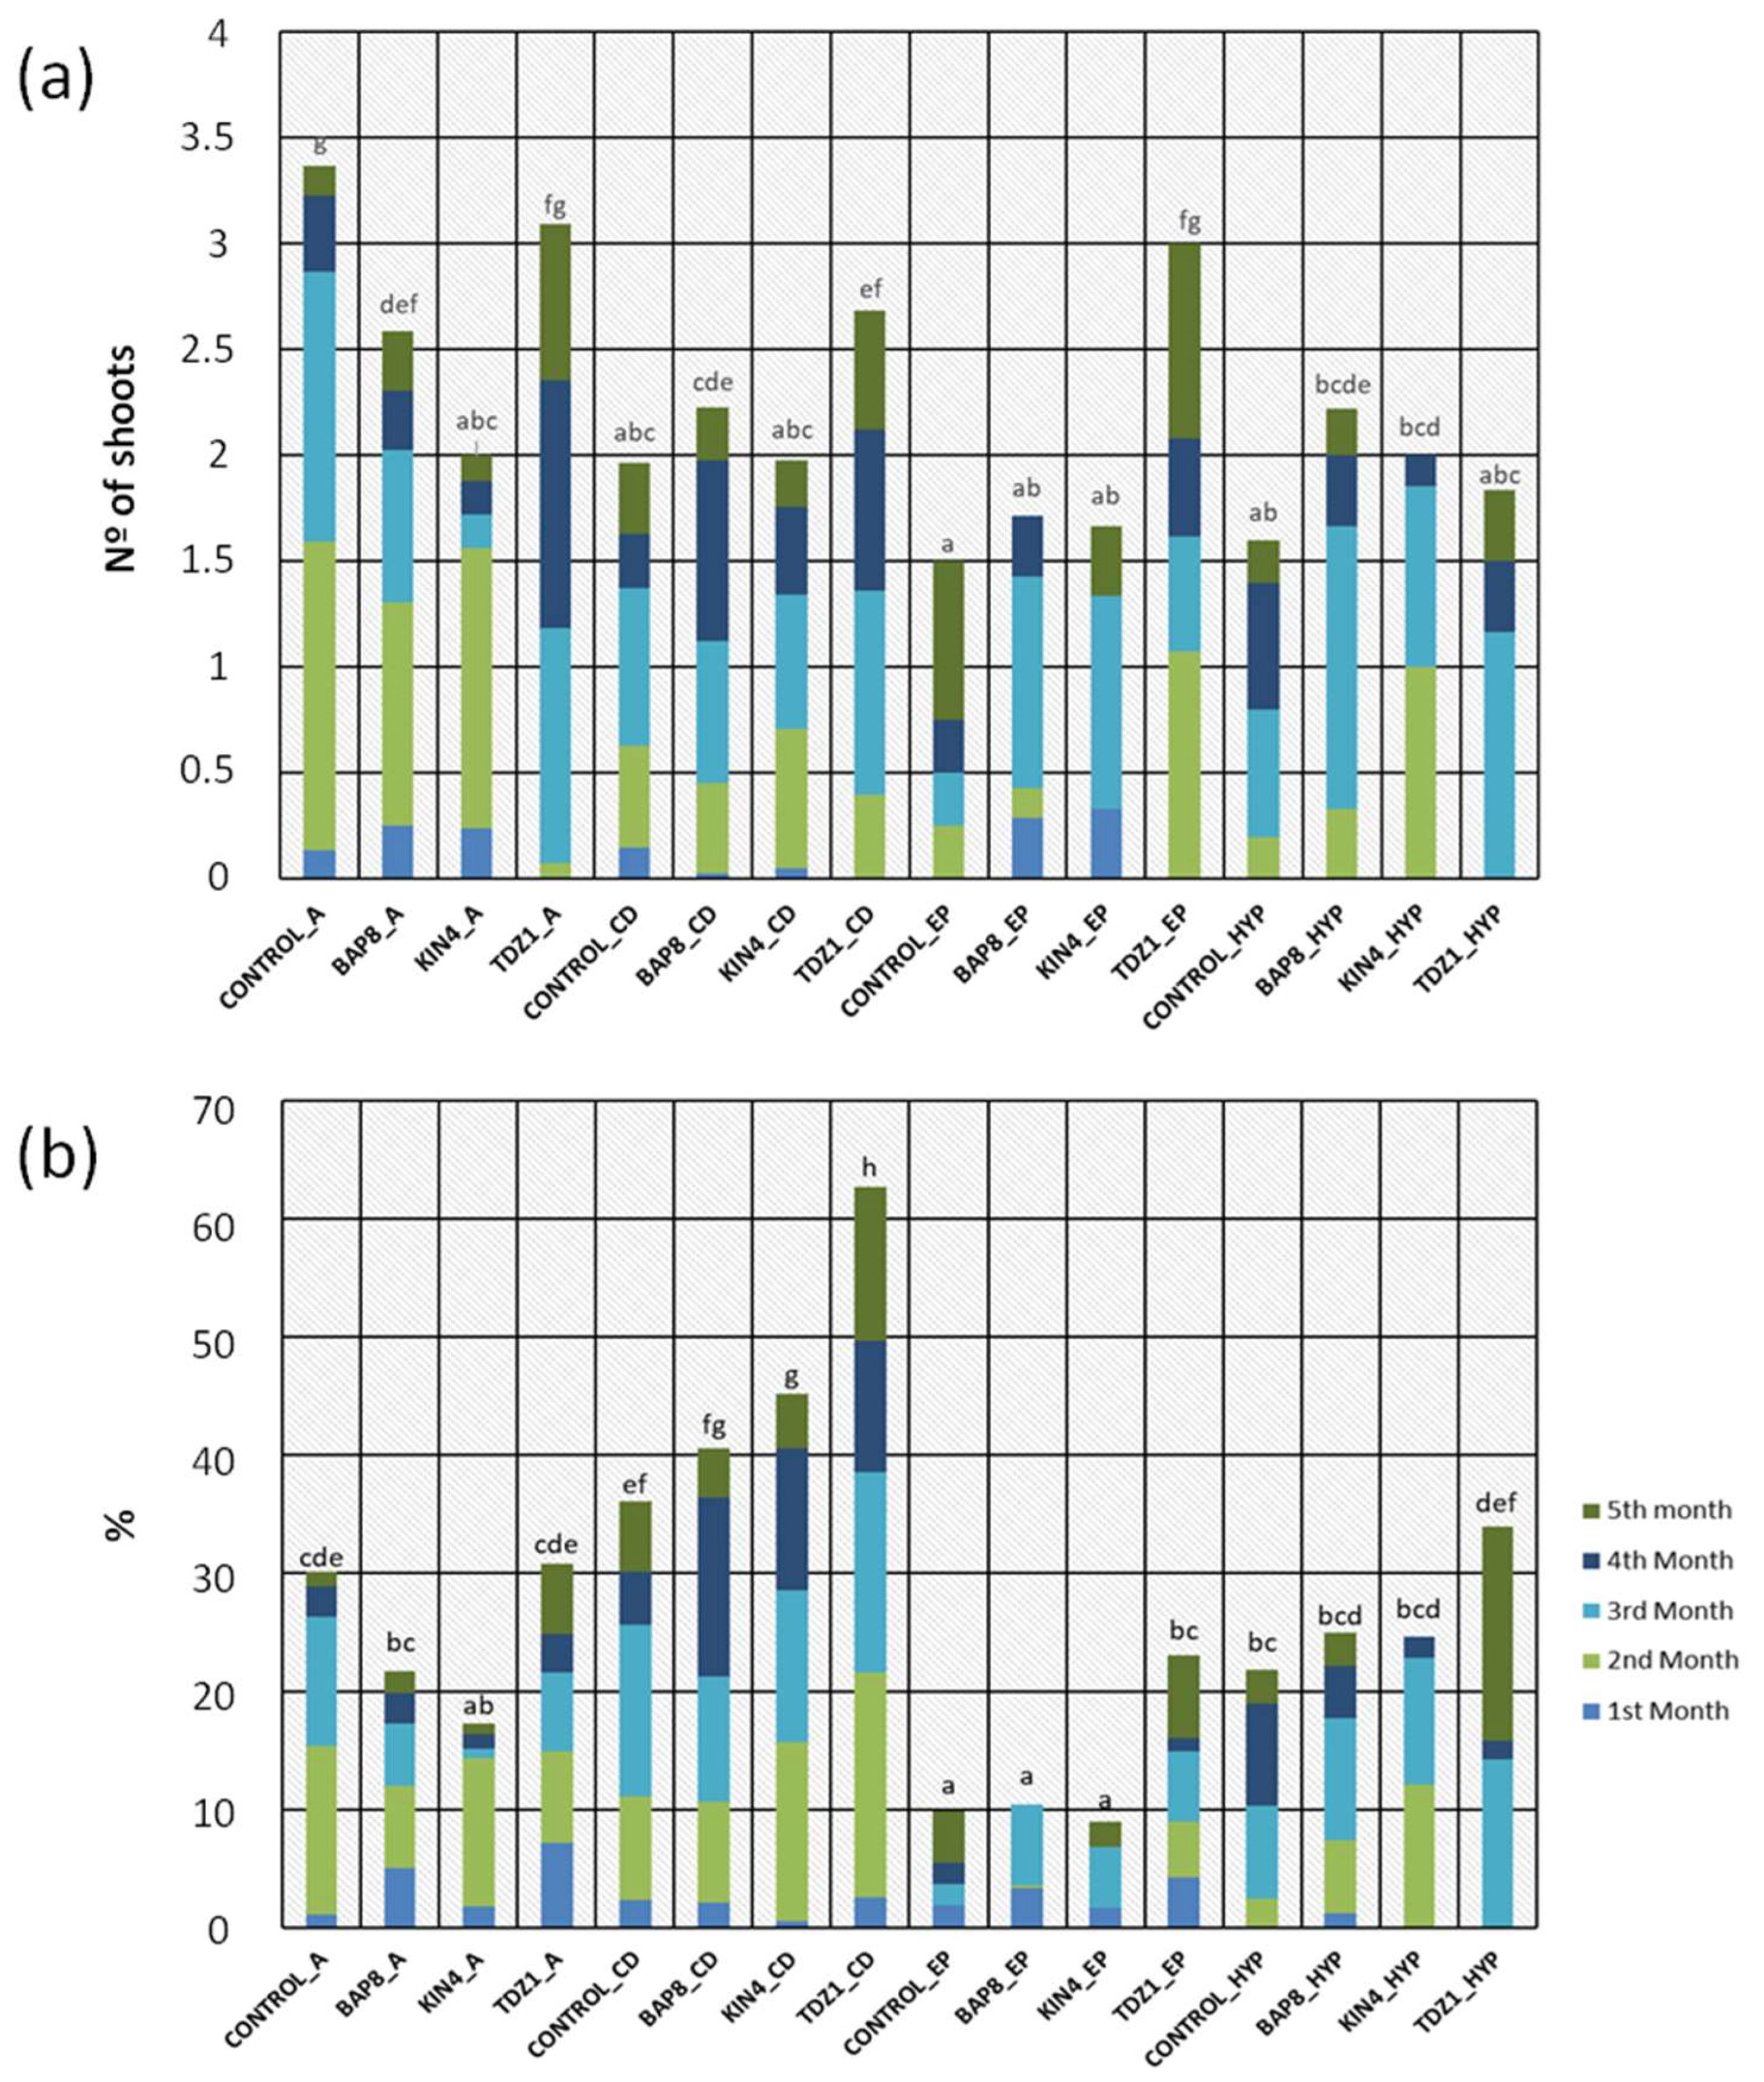
Figure 4.
Percentage of activated areoles of each type (green = G, mixed = M or color = C) as a function of the initial coloration of the plants. (a) Green plants without variegation; (b) plants with 25% of variegation (c) plants with 50% of variegation, (d) plants with 75% of variegation and (e) plants completely colored (100% variegation).
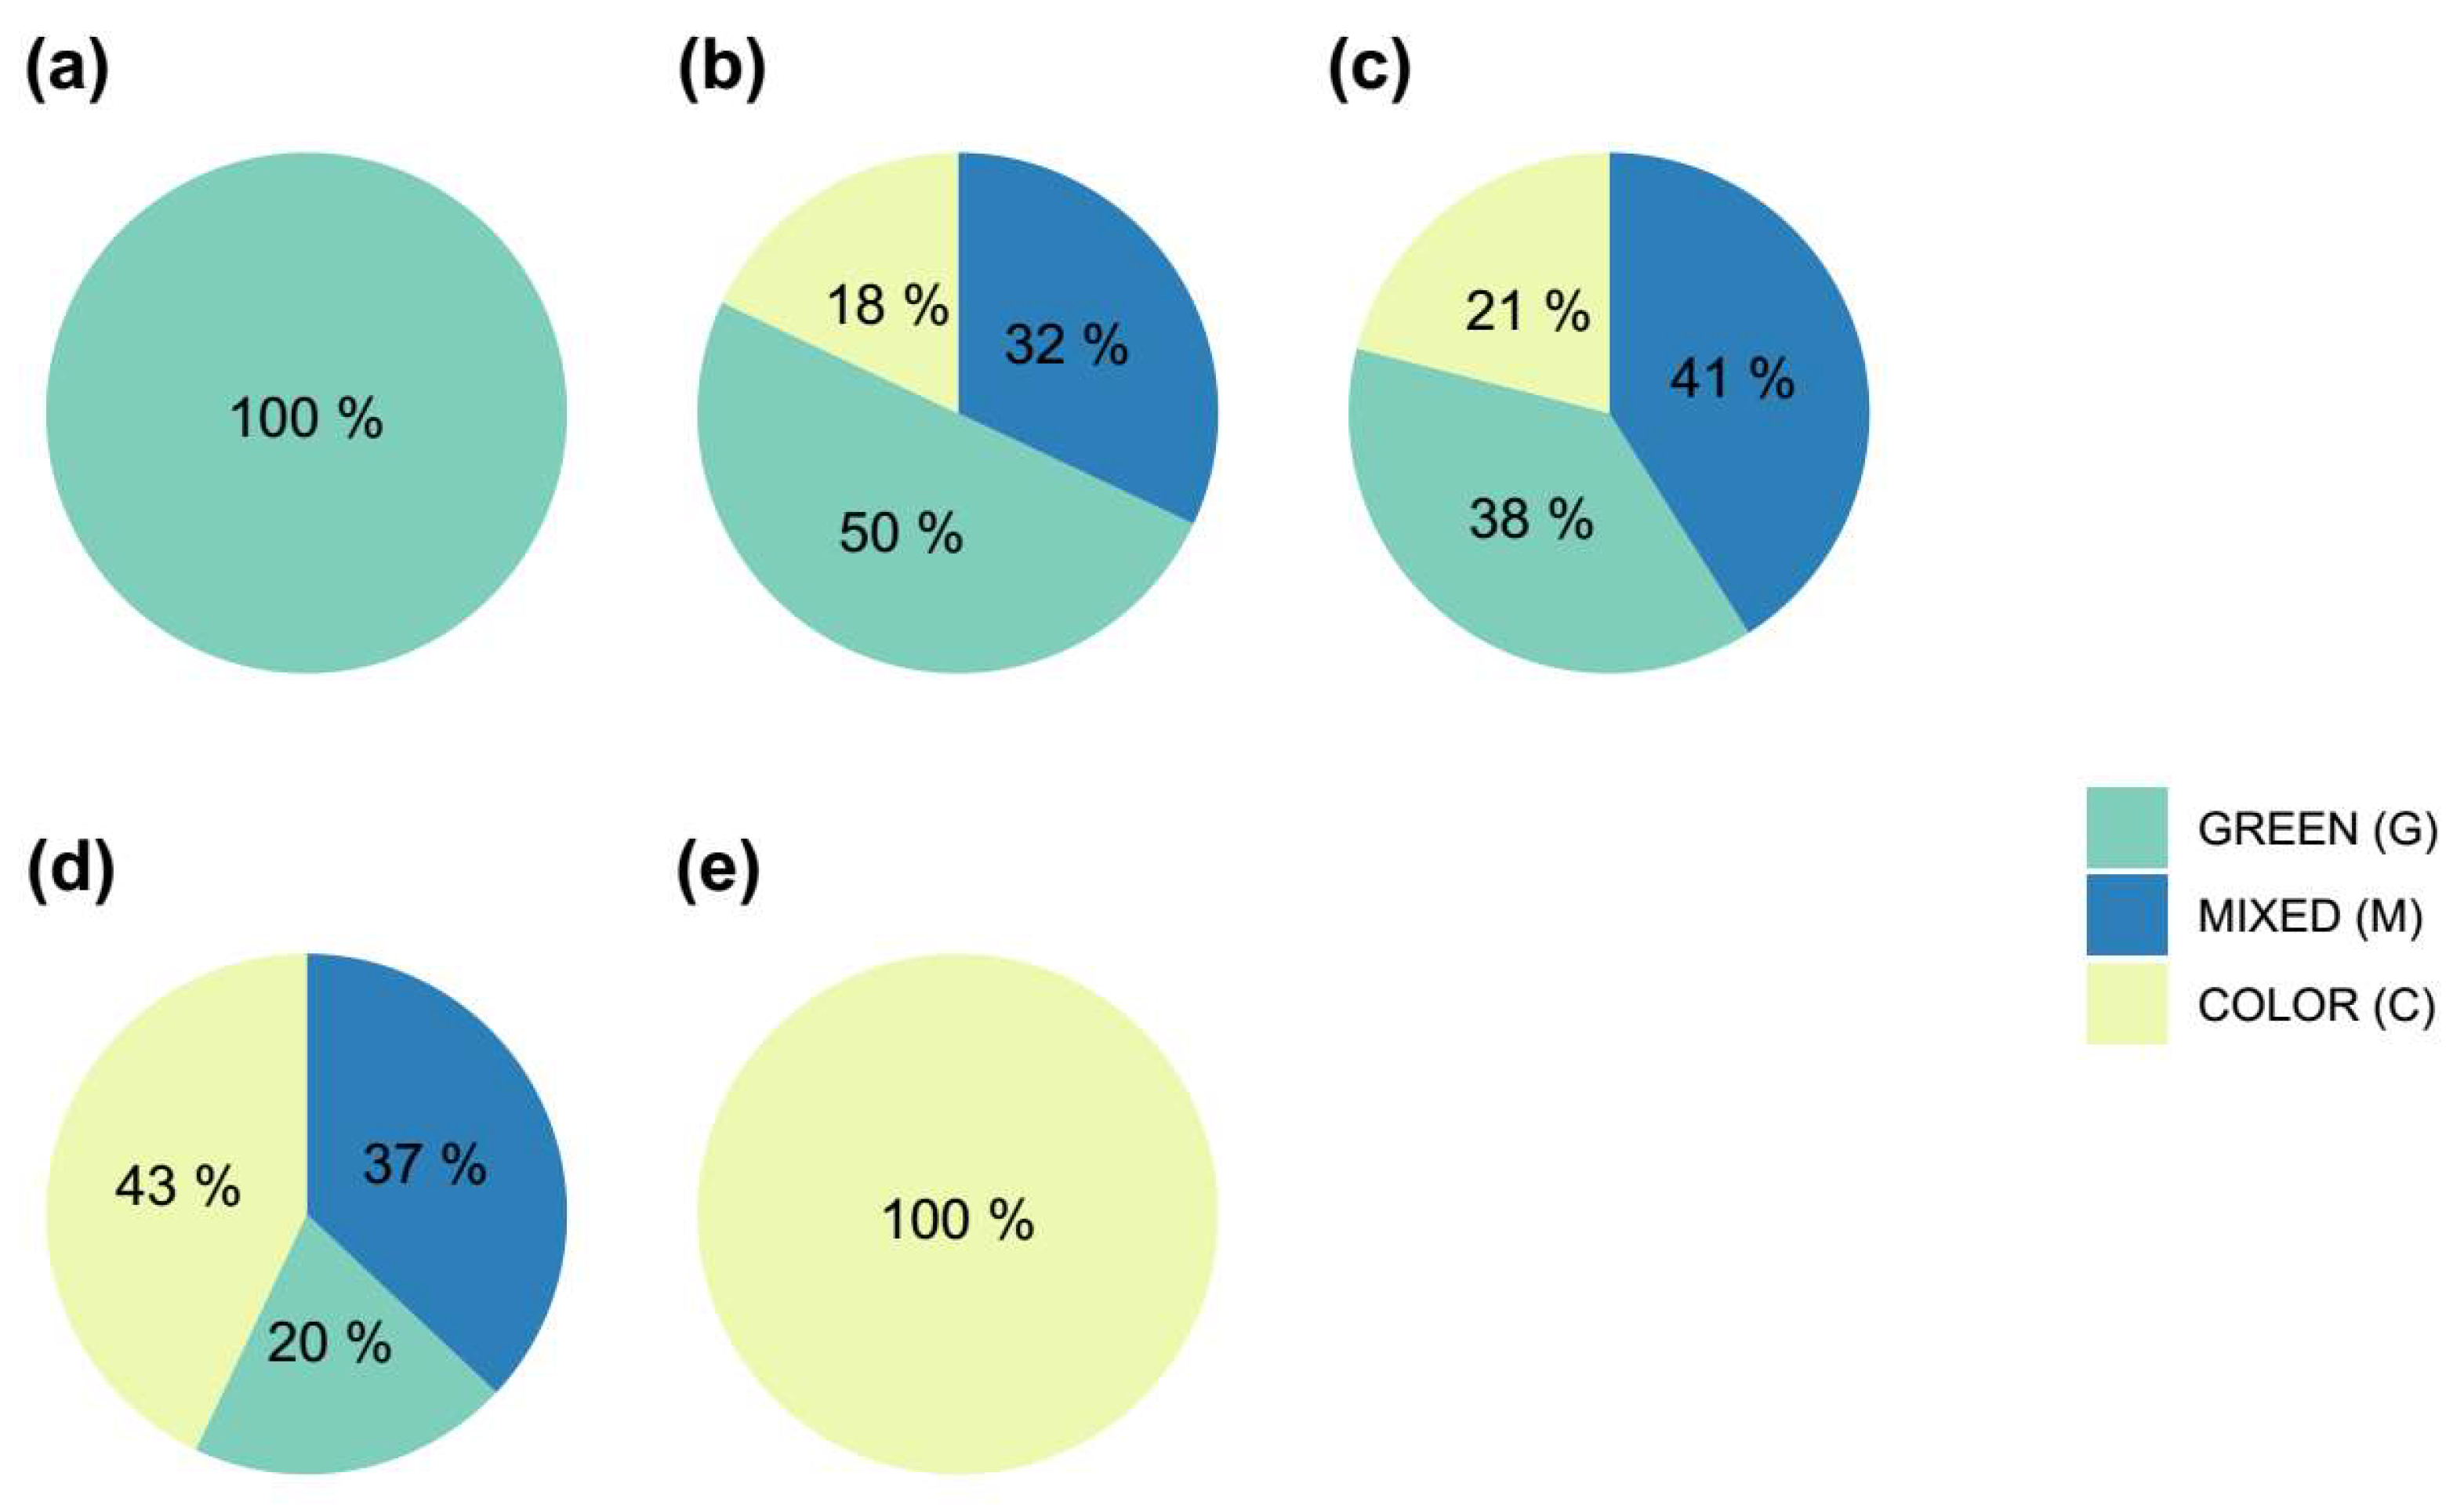
Figure 5.
Percentage of obtained shoots with different degrees of variegation (0%, less than 50%, more than 50% and totally variegated, 100%) with respect to the percentage of variegation of the initial plants. (a) Green plants without variegation; (b) plants with 25% of variegation (c) plants with 50% of variegation, (d) plants with 75% of variegation and (e) plants completely colored (100% variegation).
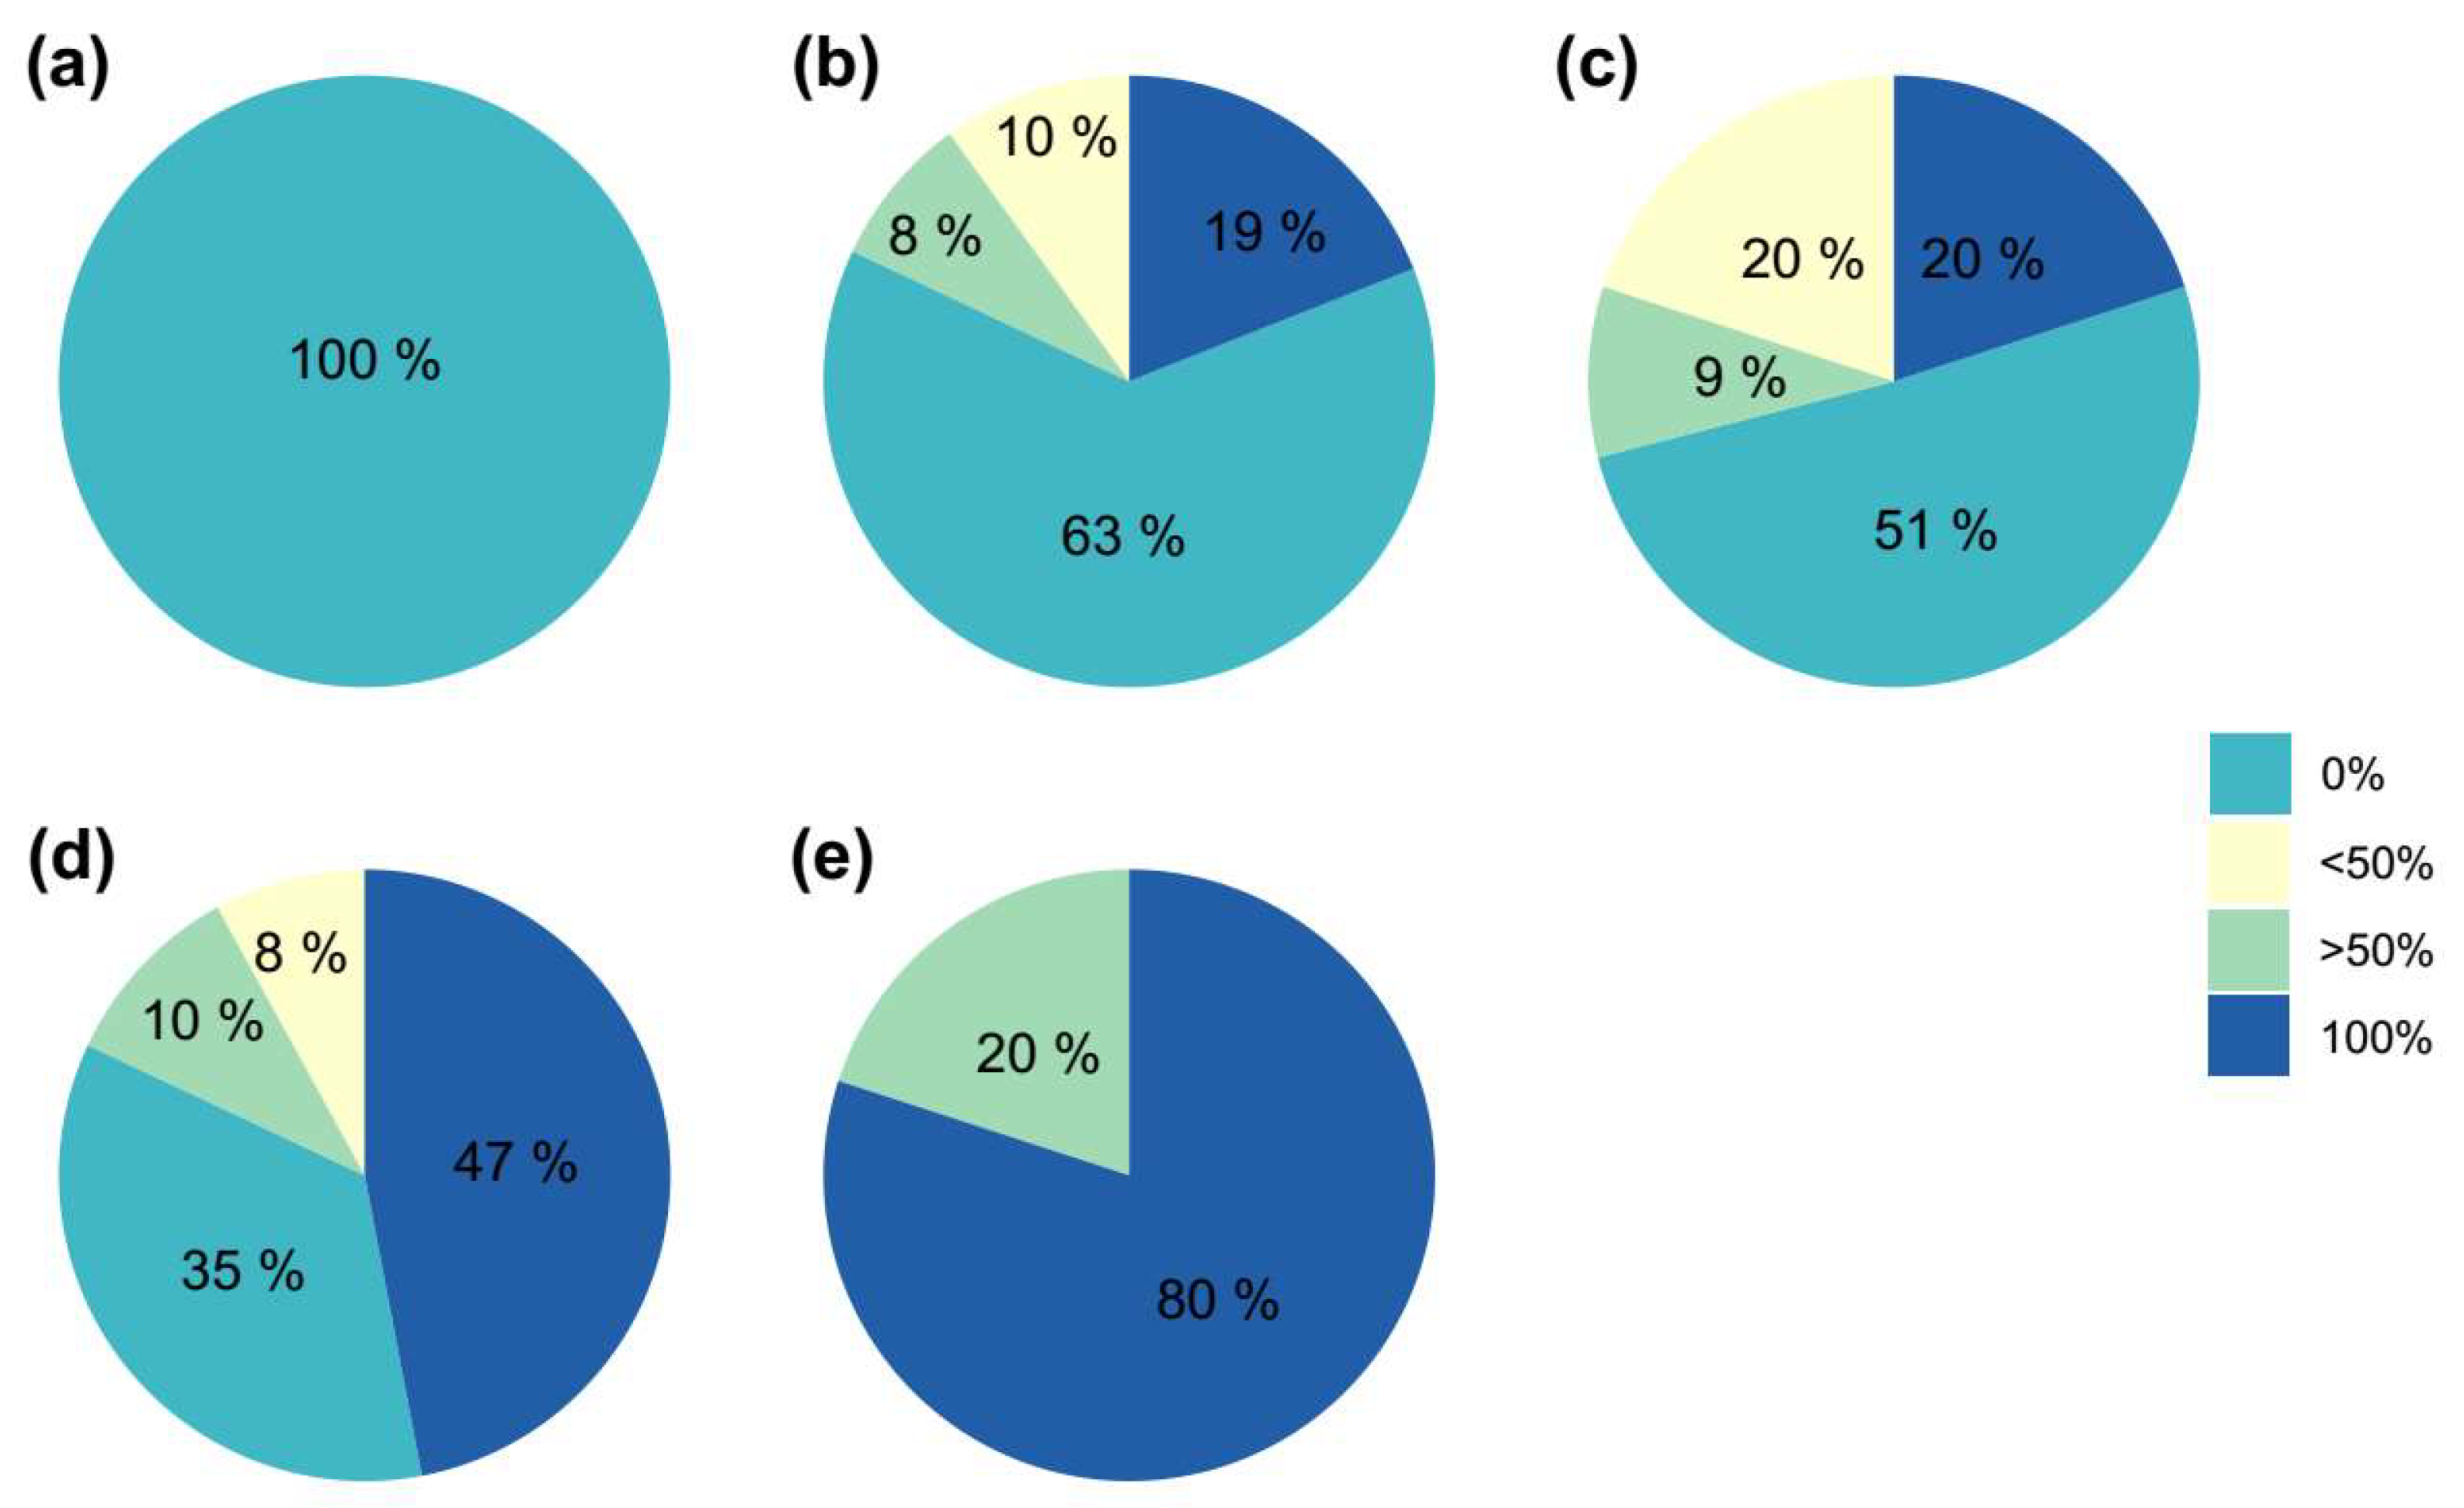
Figure 6.
Percentage of shoots obtained with different degrees of variegation (0%, less than 50%, more than 50% and totally variegated, 100%) with respect to the coloration of the starting areoles ((a) - Green; (b) - Mixed; (c) - Color).
Figure 6.
Percentage of shoots obtained with different degrees of variegation (0%, less than 50%, more than 50% and totally variegated, 100%) with respect to the coloration of the starting areoles ((a) - Green; (b) - Mixed; (c) - Color).
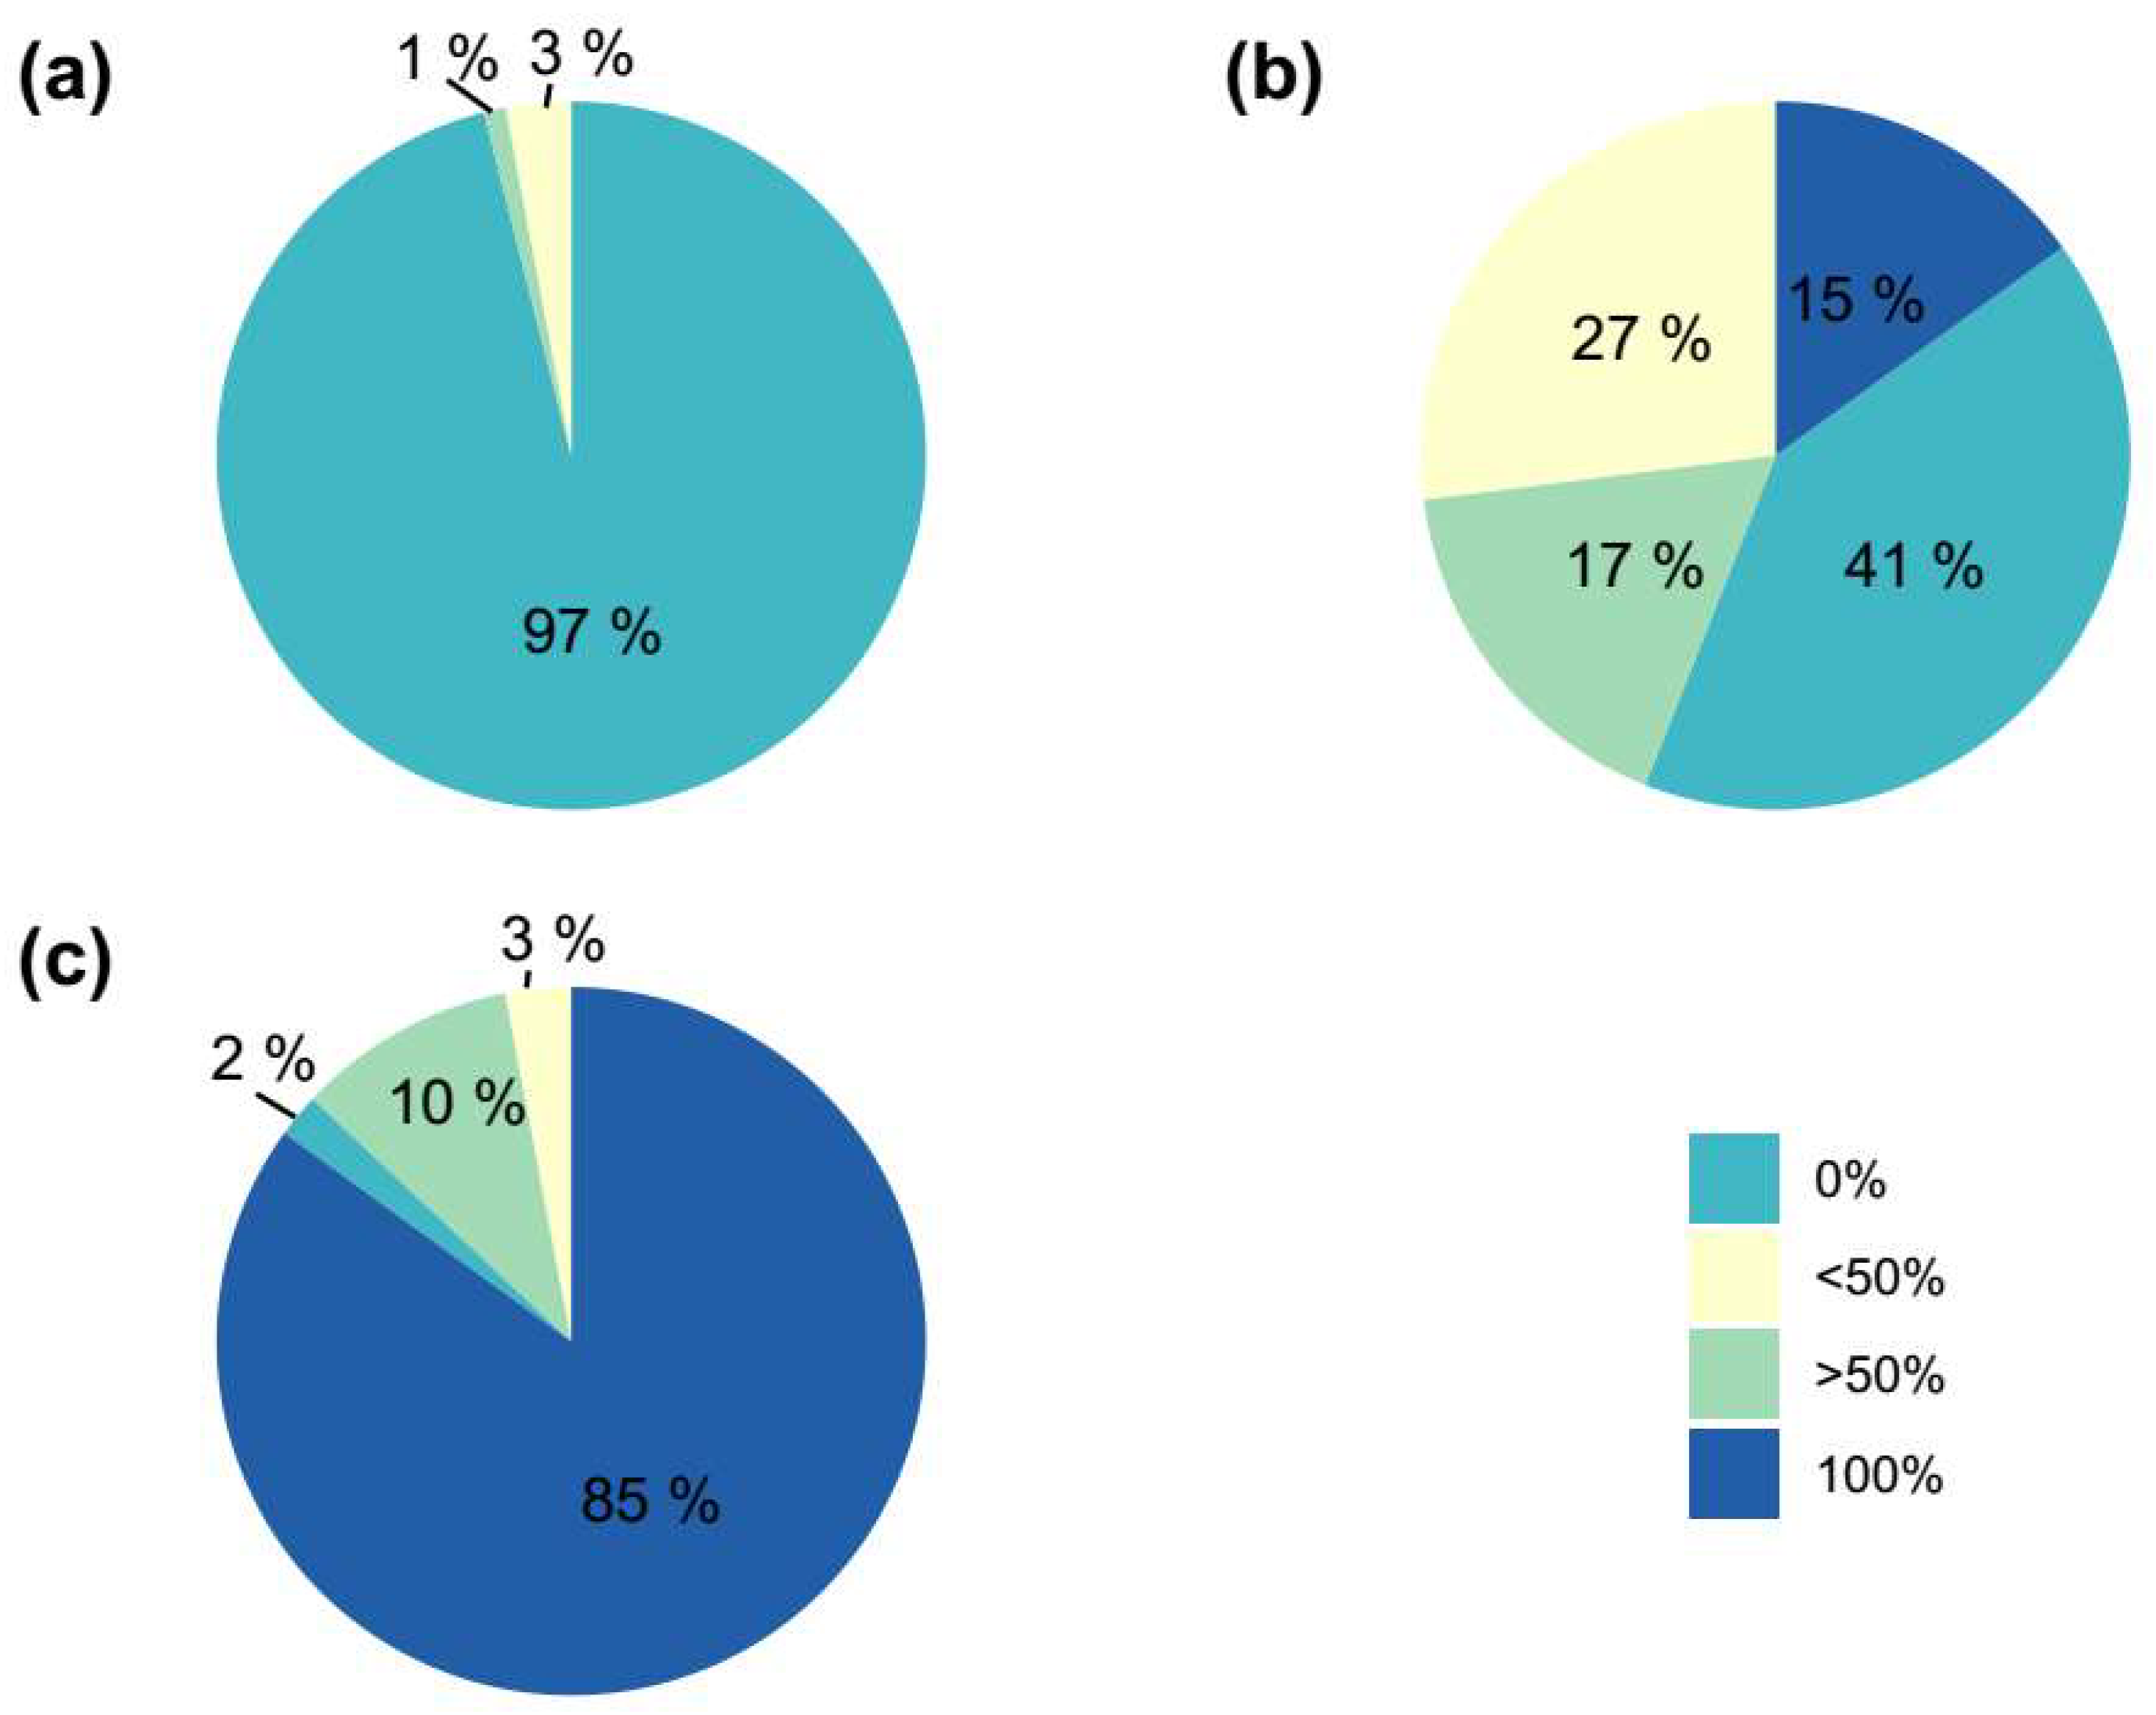
Figure 7.
Classification of the types of areolas according to their coloration. (a) View of the apical part of the plant. (b) Transverse section of a variegated plant. Letters indicates: “G”, green areolas (where both the mamilla and areola were completely green); “M”, mixed areolas (showing a combination of chlorophyllous and variegated tissue in both the mamilla and areola); and “C”, colored areolas (where both the mamilla and areola were fully colored).
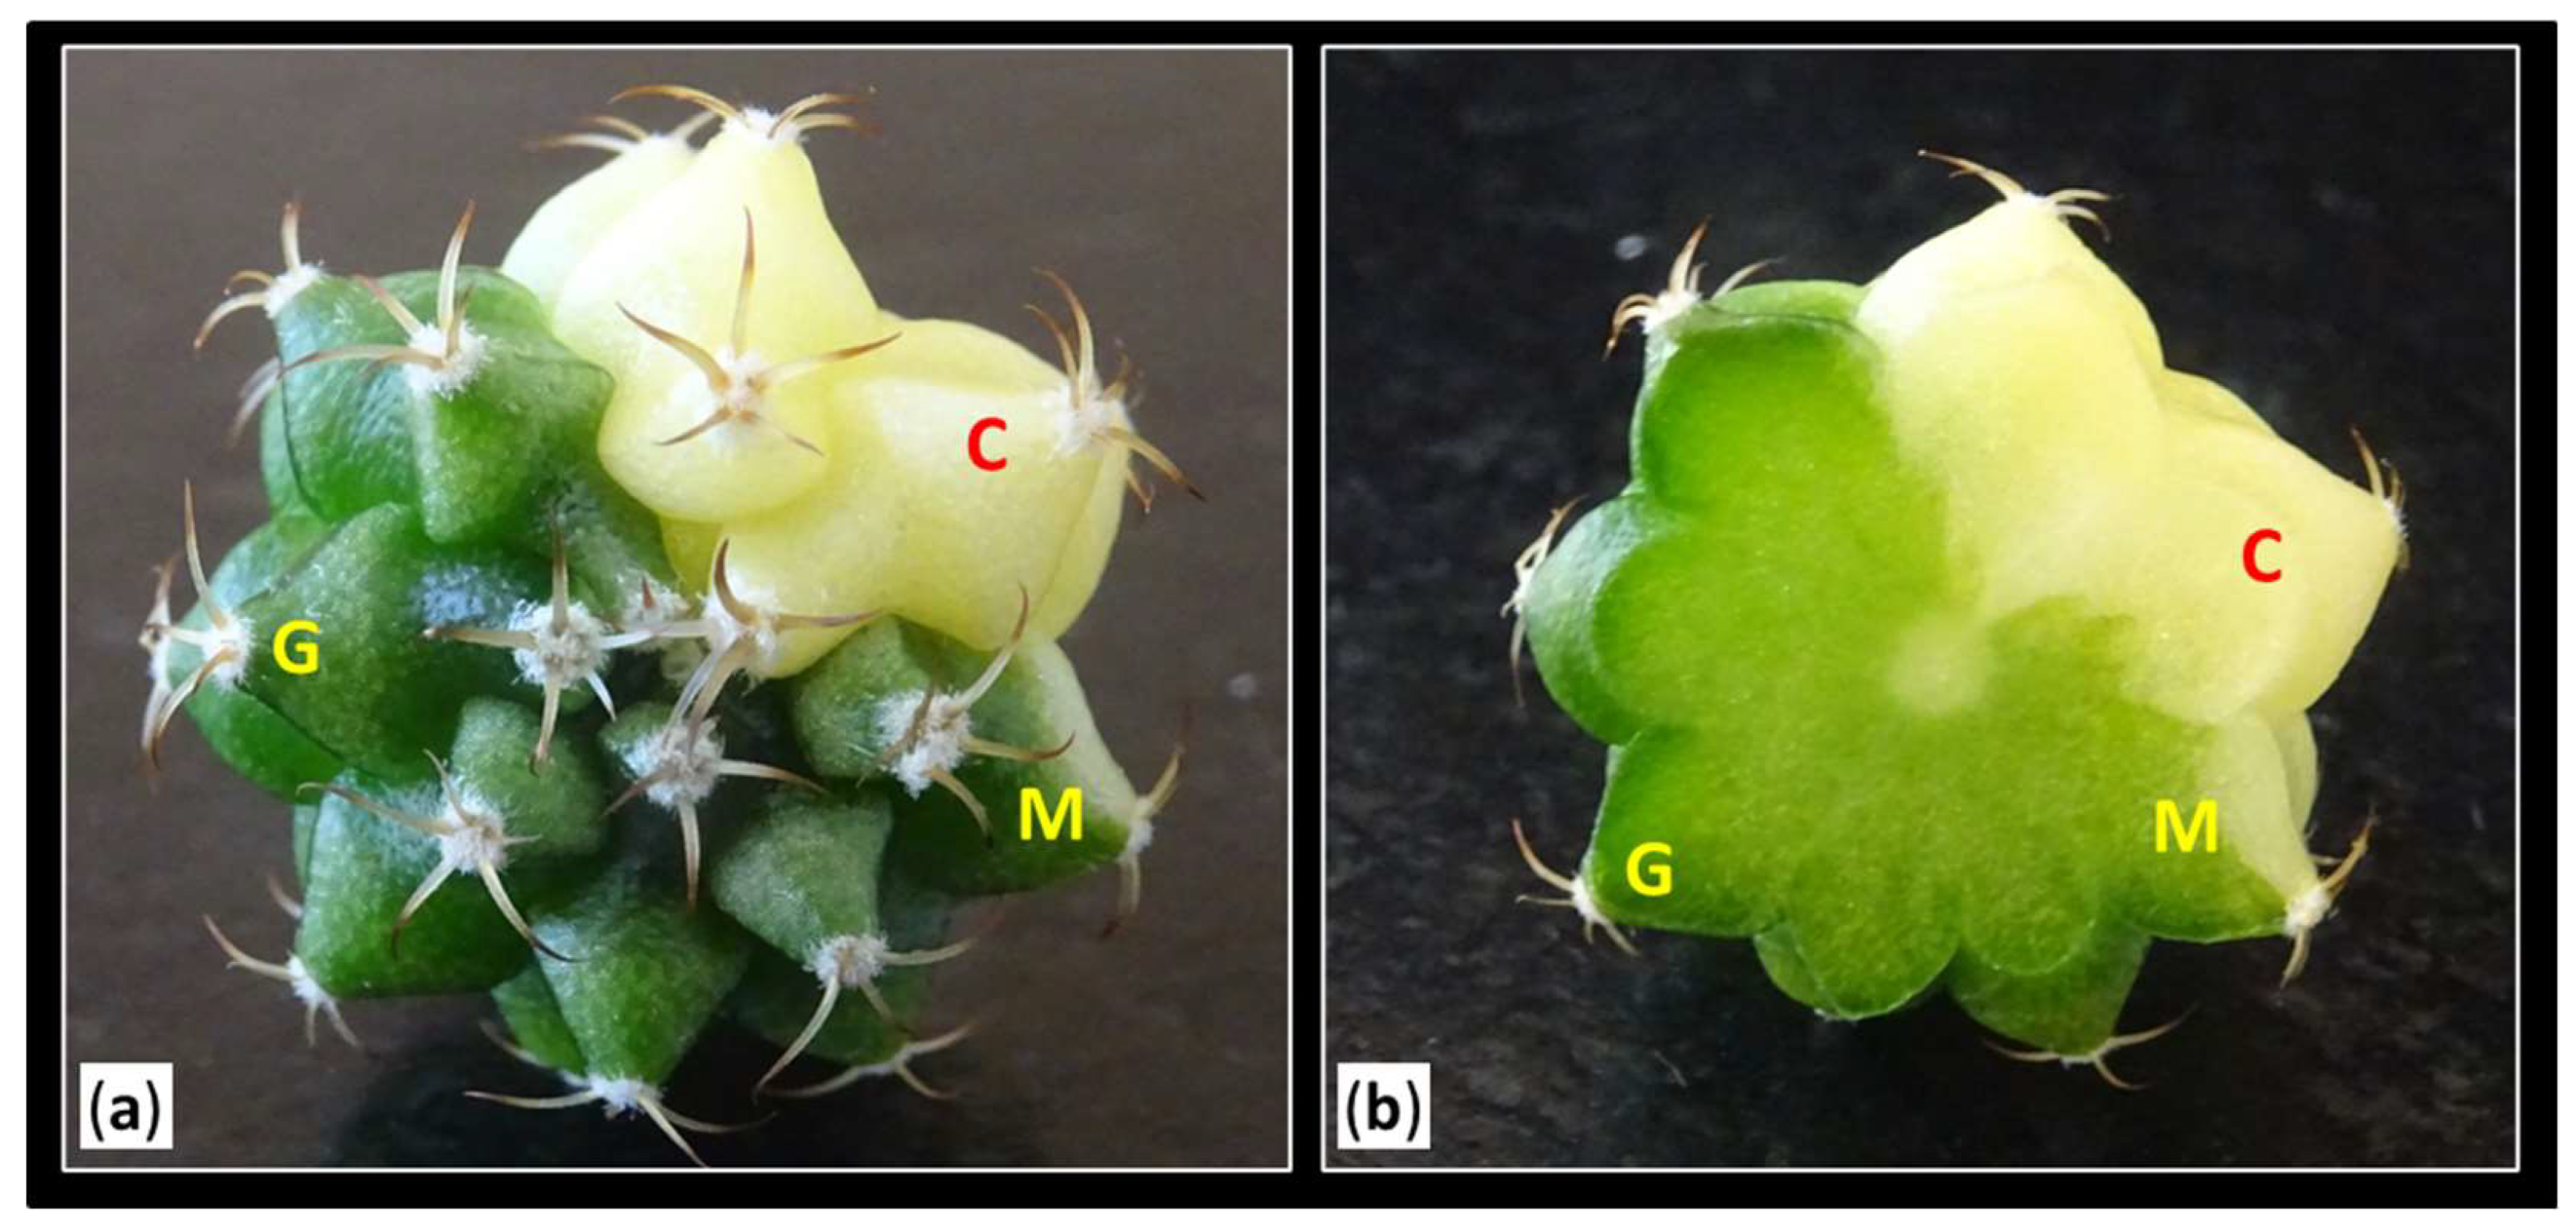
Figure 8.
Varied shoots with different colorations and different color patterns observed in the trial.
Figure 8.
Varied shoots with different colorations and different color patterns observed in the trial.
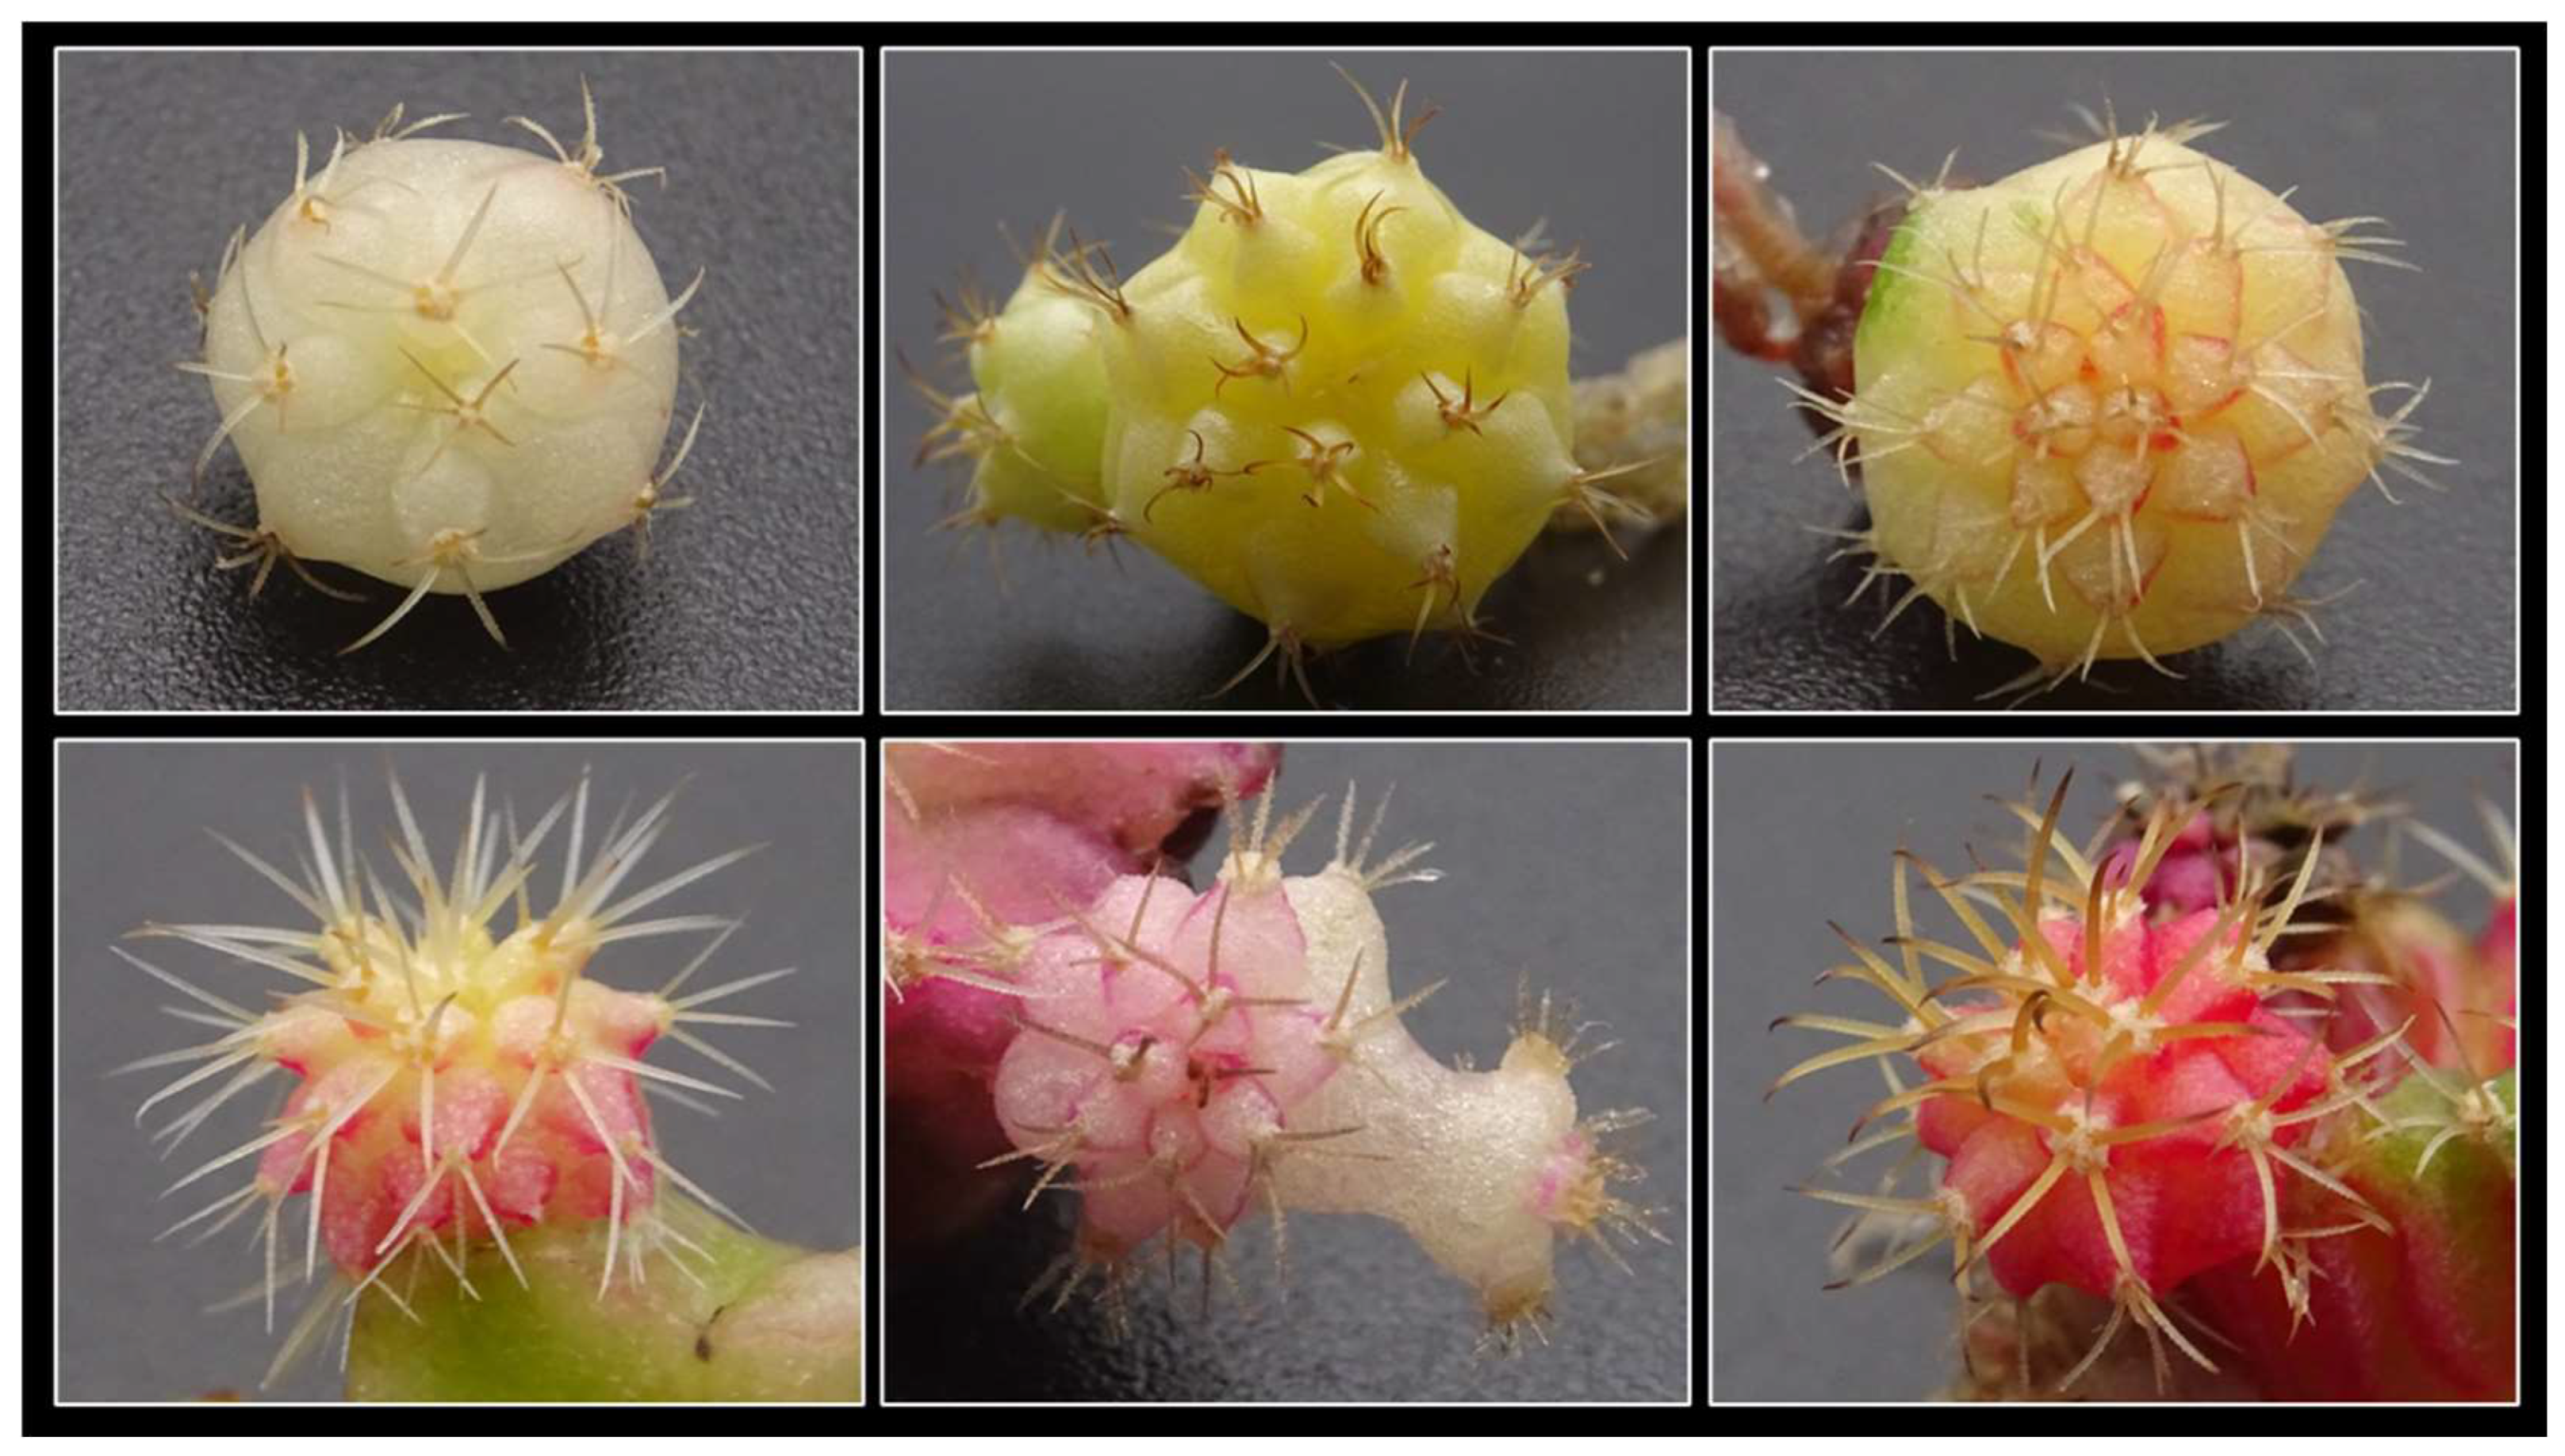
Figure 9.
Initial plant variegation percentage classification system: (a) completely chlorophyll plant (no variegation, 0%), (b) plants with more chlorophyll than nonchlorophyll tissue (25% variegation), (c) plants with equal proportion of chlorophyll and nonchlorophyll tissue (50% variegation), (d) plants with more than 50% nonchlorophyll tissue (75% variegation), and (e) plants with completely nonchlorophyll tissue (100% variegation). White bars = 10 mm.
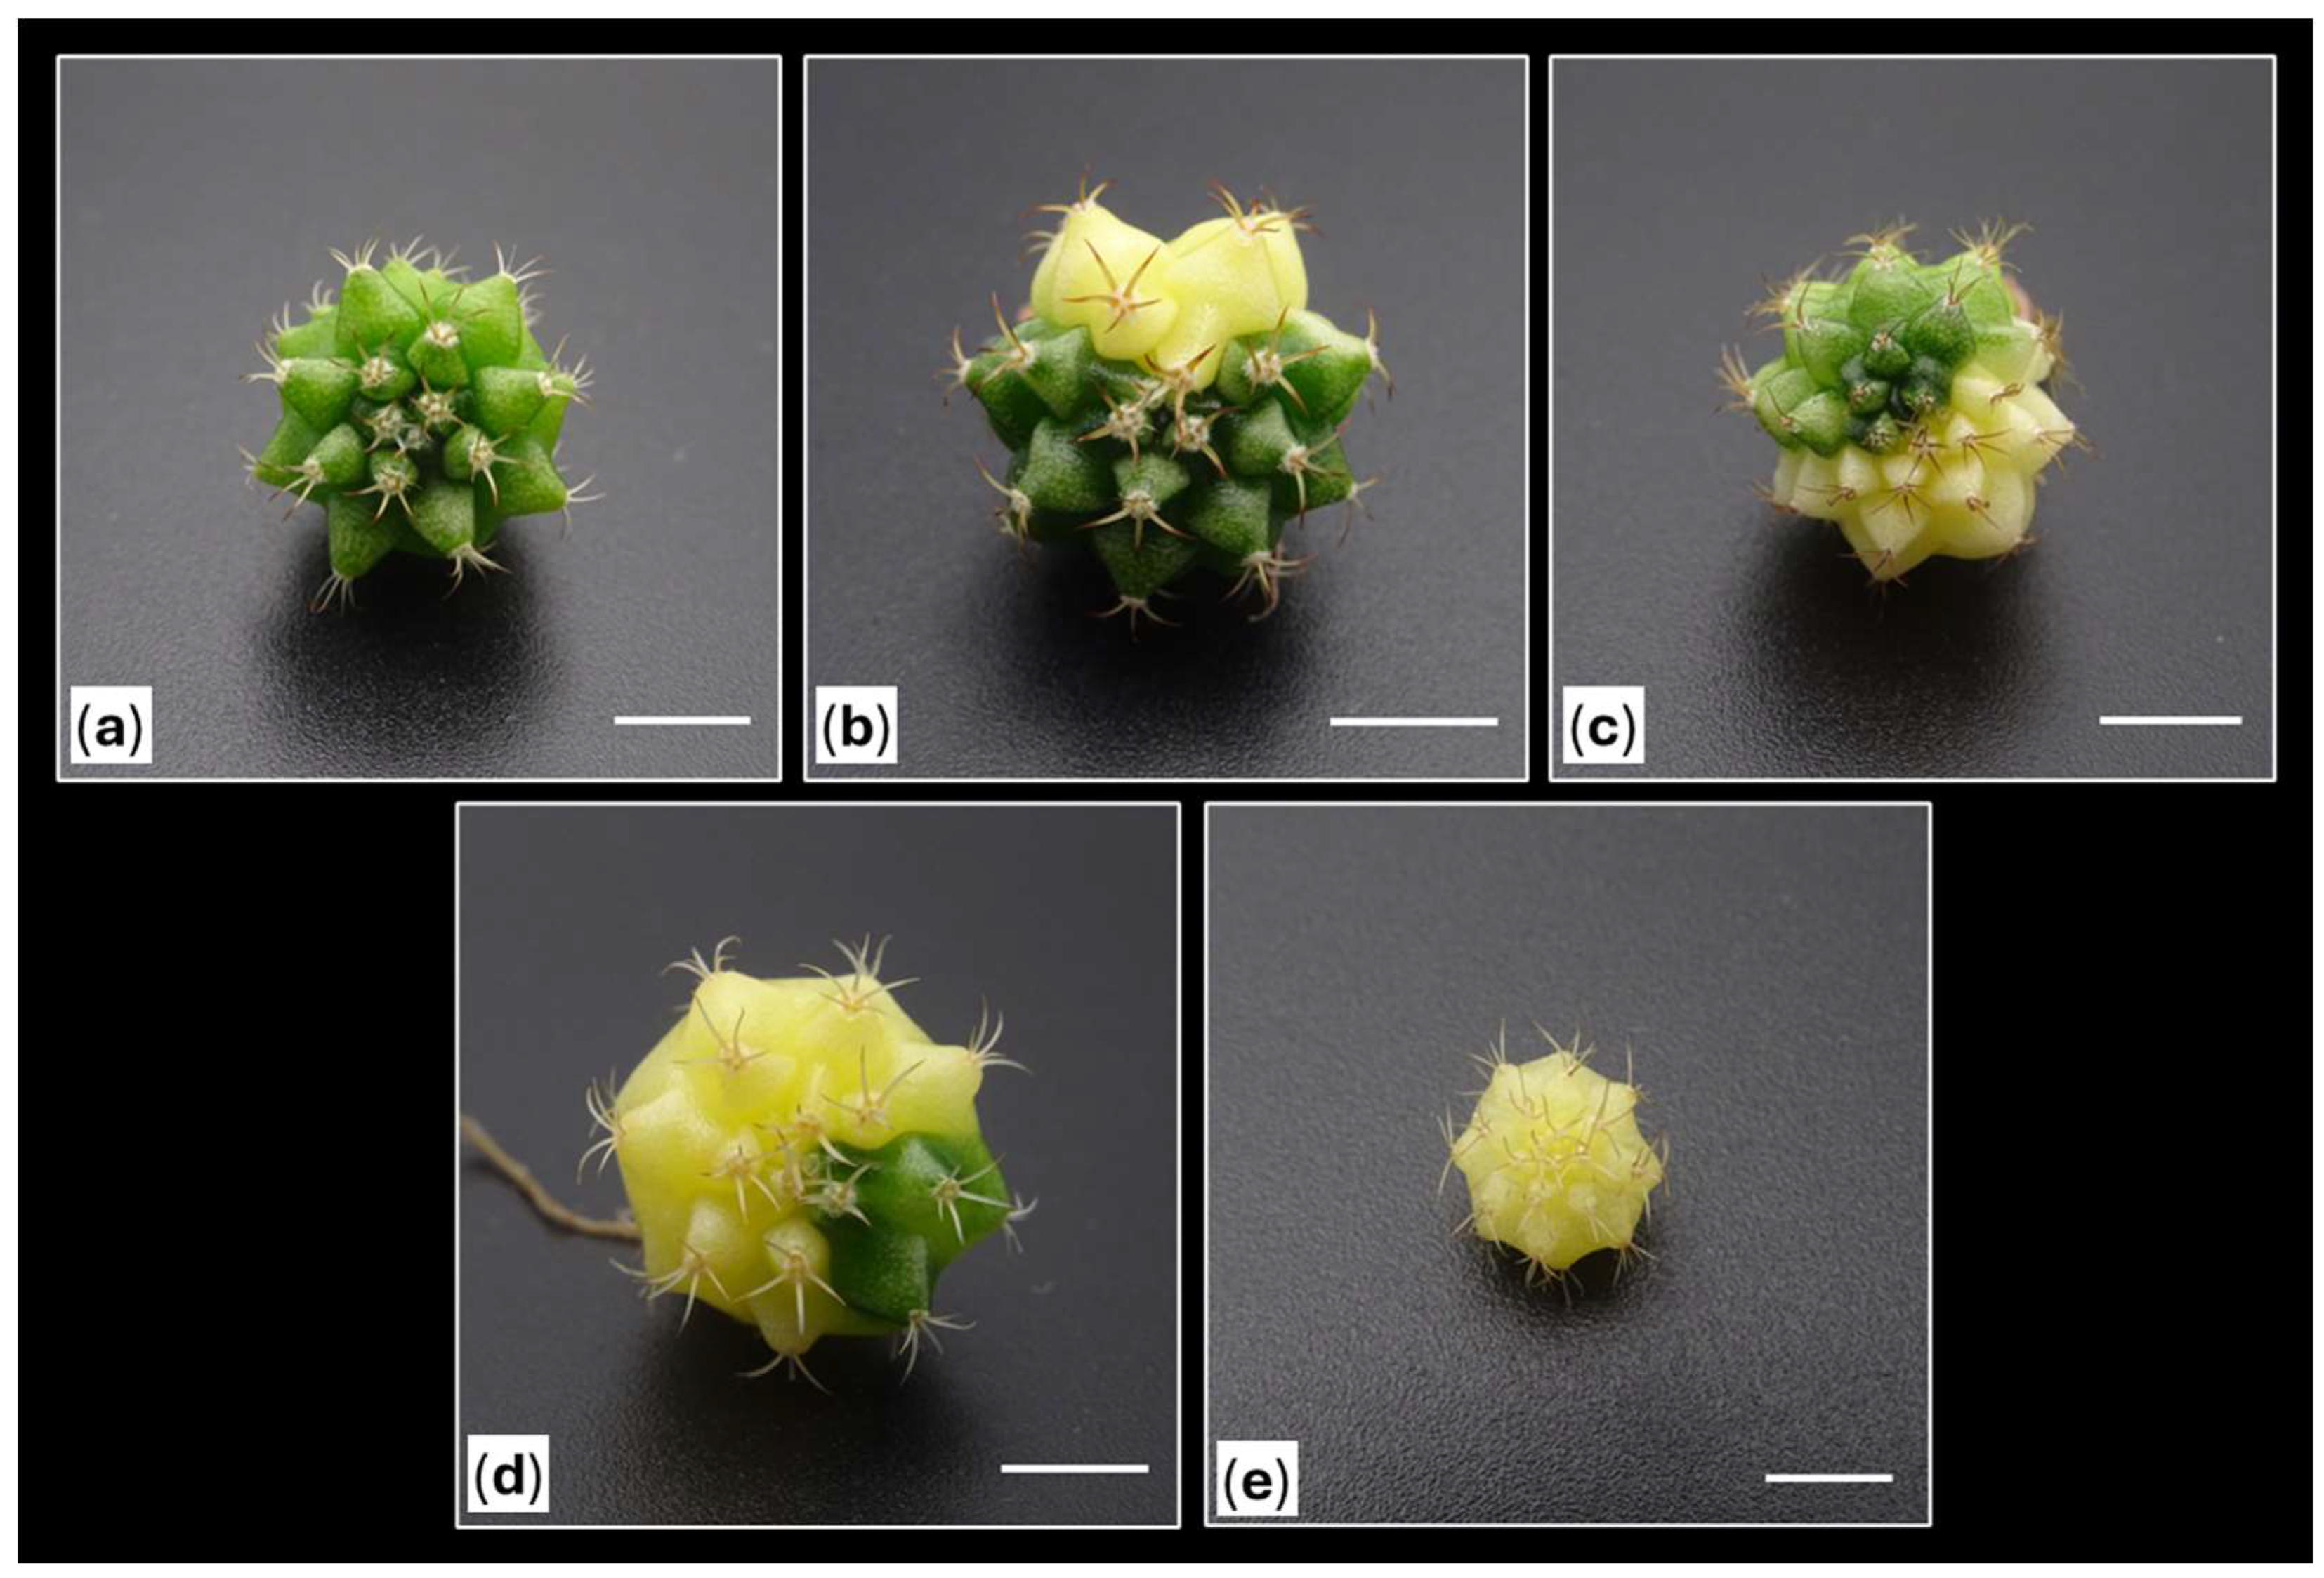
Figure 10.
Grading system of the obtained shoots according to their final coloration. (a) completely green shoots (without variegation, group "S0"); (b) shoots with a percentage of coloration lower than 50% (group "S1"); (c) shoots with a percentage of coloration higher than 50% (group "S2"), and (d) completely colored shoots (without chlorophyll tissue, group "S3").
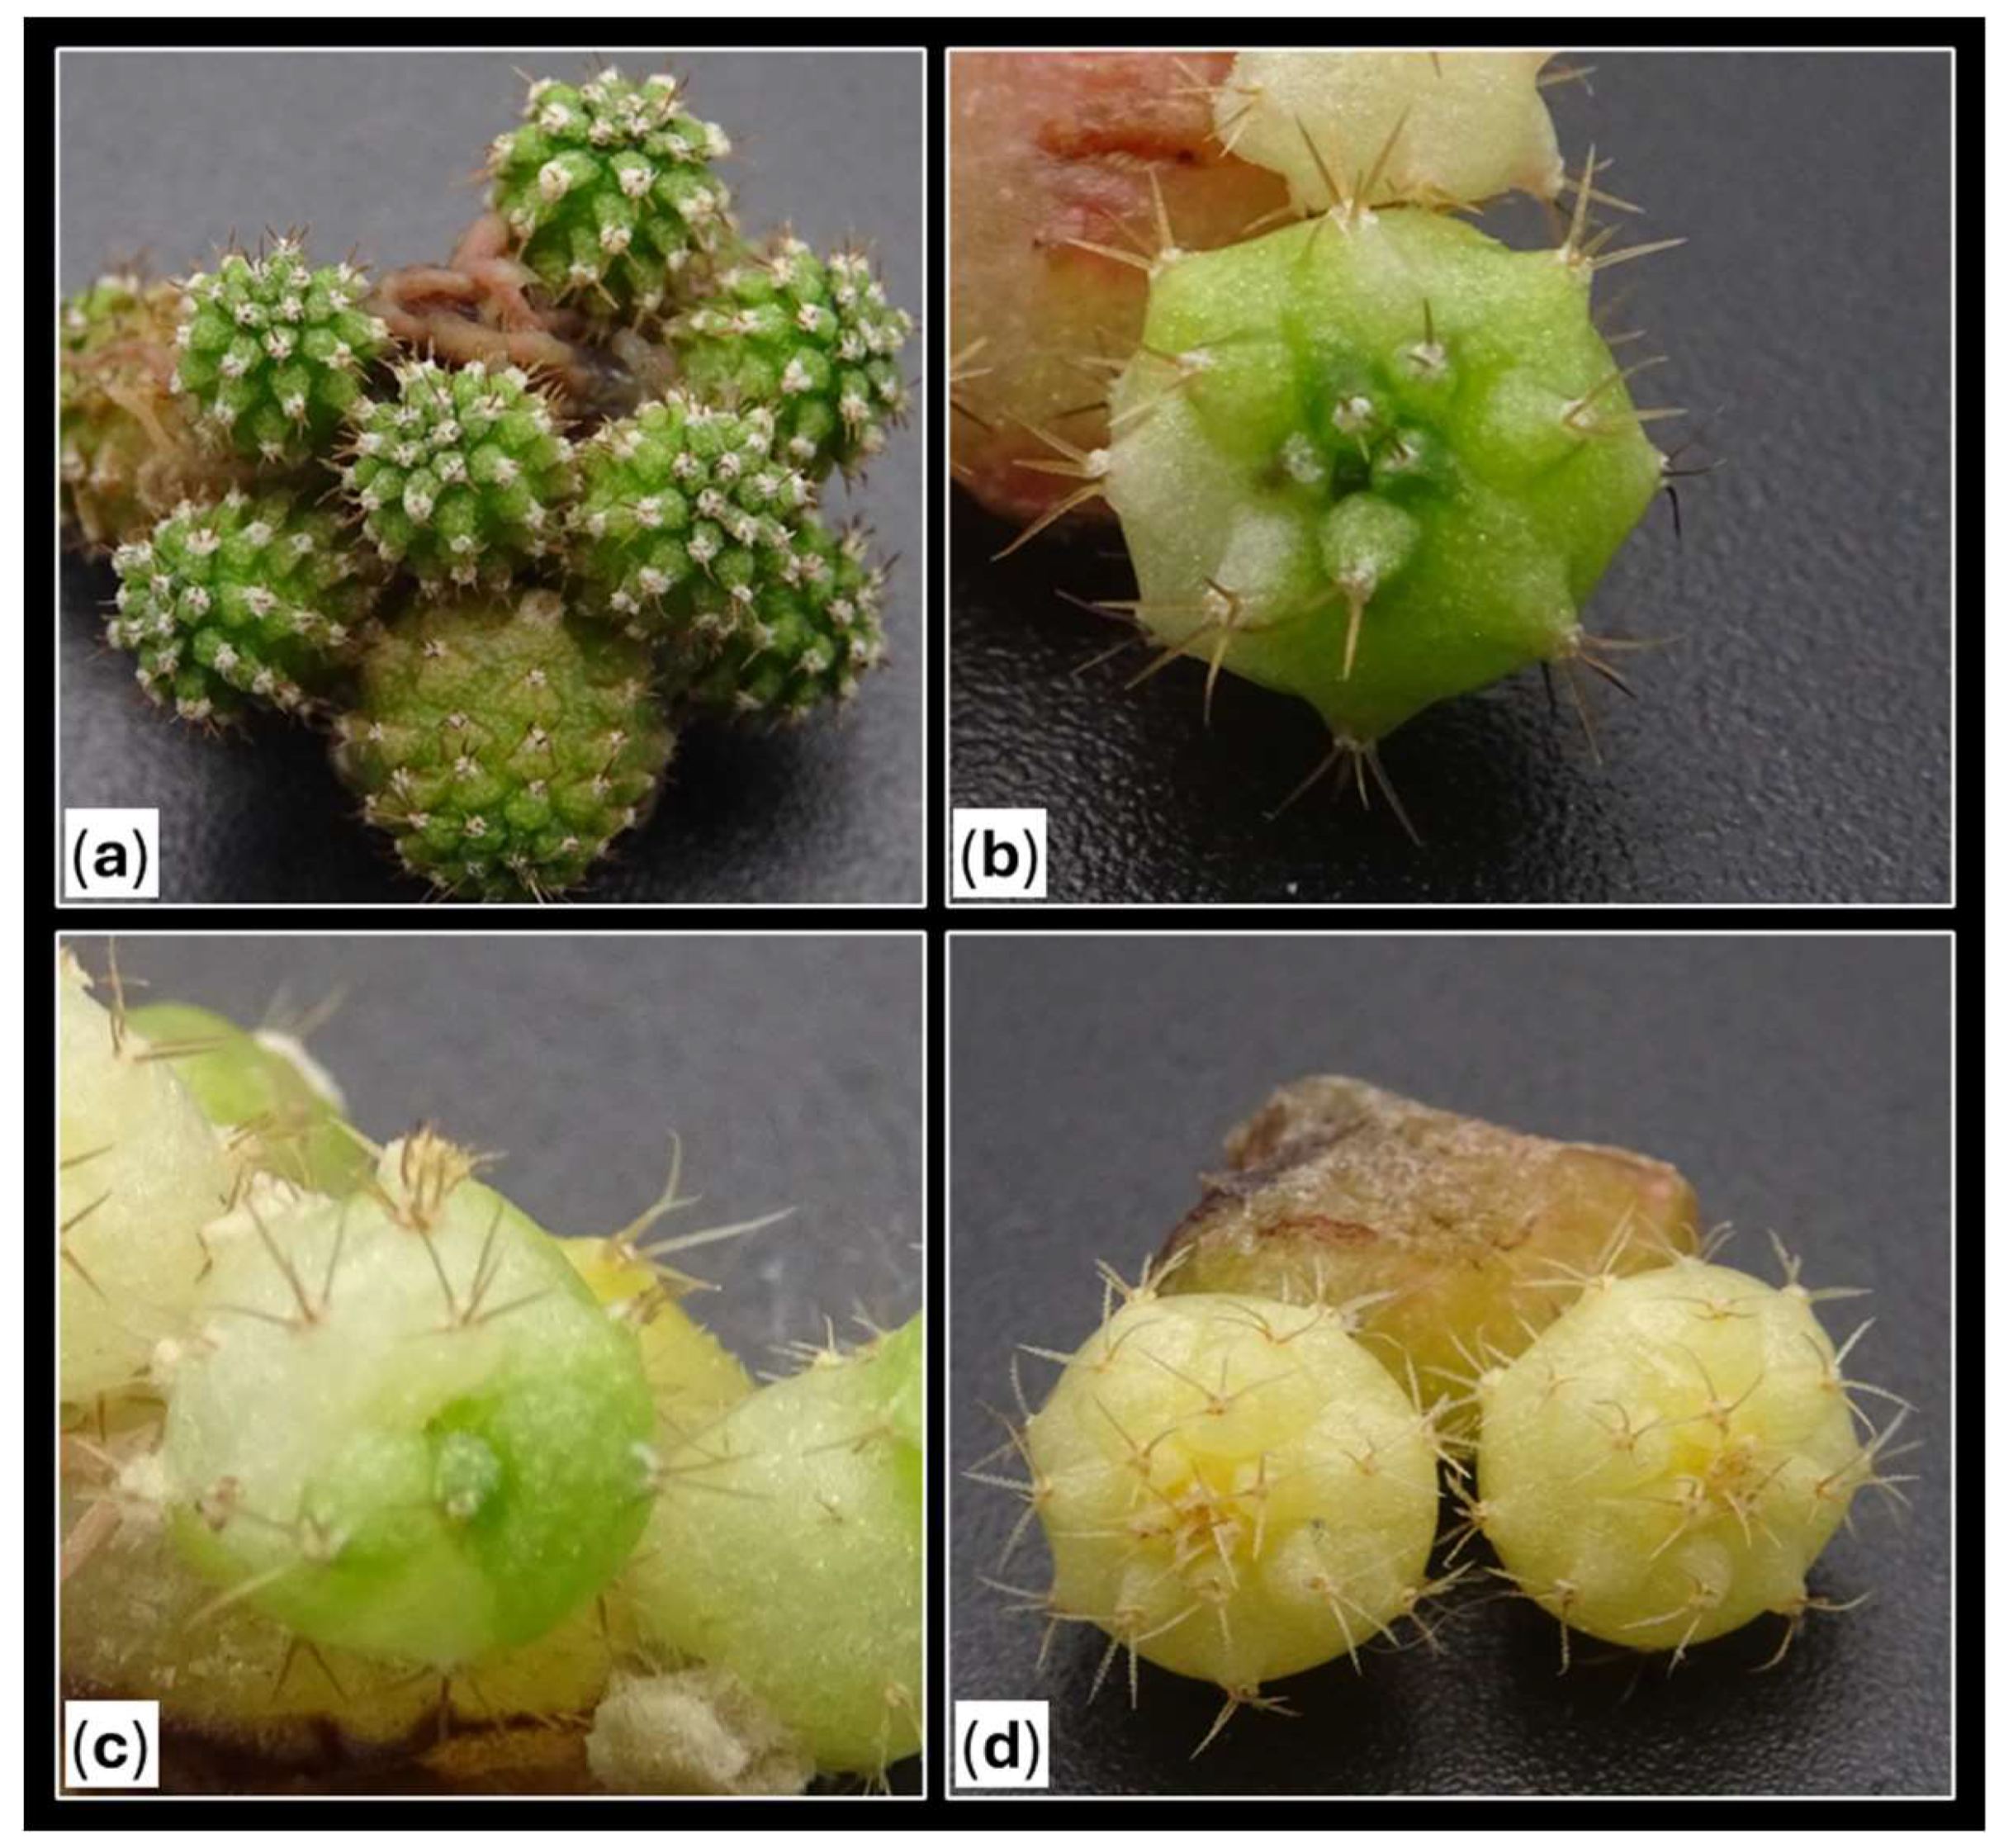

Table 1.
Percentage of activated explants as a function of evaluated factors at the 5th month.
| Factor | Total Number of Explants | Activated Explants | % of Response (1) |
|---|---|---|---|
| Treatment (2) | |||
| BAP8 | 152 | 92 | 60.53 a |
| KIN4 | 150 | 76 | 50.67 a |
| TDZ1 | 148 | 123 | 83.11 b |
| CONTROL | 124 | 58 | 46.77 a |
| Plant Size | |||
| Large | 96 | 67 | 69.79 b |
| Medium | 332 | 228 | 68.67 b |
| Small | 146 | 54 | 36.99 a |
| % of Color | |||
| 0 | 220 | 136 | 61.82 b |
| 25 | 110 | 74 | 67.27 b |
| 50 | 60 | 41 | 68.33 b |
| 75 | 156 | 95 | 60.90 b |
| 100 | 28 | 3 | 10.71 a |
| Type of Explant | |||
| Apical | 214 | 137 | 64.02 b |
| Central Disc | 214 | 158 | 73.83 c |
| Epicotyl | 73 | 27 | 36.99 a |
| Hypocotyl | 73 | 27 | 36.99 a |
| Total | 574 | 349 | 60.8 |
(1) Values followed by the same letter are not statistically different for p = 0.05 according to the Student–Newman–Keuls; (2) BAP8 = 6-Benzylaminopurine at 8 µM; KIN4 = Kinetin at 4 µM; TDZ1 = Thidiazuron at 1 µM; CONTROL = Control explants grown in absence of PGRs.
Table 2.
Average number of calli with their standard errors obtained monthly per factor and condition.
Table 2.
Average number of calli with their standard errors obtained monthly per factor and condition.
| Factors | Cases | Induction Period in Presence of PGRs (1) | Development Period in Absence of PGRs | ||||||
|---|---|---|---|---|---|---|---|---|---|
| 1st Month | 2nd Month | 3rd Month | 4th Month | ||||||
| p-Value | Average (4) | p-Value | Average | p-Value | Average | p-Value | Average | ||
| Treatment (2) | 0.000 * | 0.000 * | 0.000 * | 0.000 * | |||||
| BAP8 | 92 | 0.28±0.10 b | 0.17±0.06 a | 0.03±0.02 a | 0.00±0.00 a | ||||
| KIN4 | 76 | 0.01±0.01 a | 0.03±0.02 a | 0.00±0.00 a | 0.07±0.03 a | ||||
| TDZ1 | 123 | 0.55±0.09 c | 1.12±0.12 b | 0.89±0.12 b | 0.41±0.08 b | ||||
| CONTROL | 58 | 0.02±0.02 a | 0.00±0.00 a | 0.00±0.00 a | 0.00±0.00 a | ||||
| Plant Size (3) | 0.949 | 0.041 * | 0.504 | 0.37 | |||||
| Large | 67 | 0.36±0.13 a | 0.48±0.11 ab | 0.19±0.07 a | 0.17±0.05 b | ||||
| Medium | 228 | 0.25±0.05 a | 0.50±0.07 b | 0.39±0.07 a | 0.21±0.04 b | ||||
| Small | 54 | 0.26±0.08 a | 0.17±0.07 a | 0.20±0.09 a | 0.07±0.07 a | ||||
| % of Color | 0.12 | 0.045 * | 0.045 * | 0.049 * | |||||
| 0 | 136 | 0.23±0.06 a | 0.34±0.08 a | 0.33±0.08 ab | 0.24±0.06 b | ||||
| 25 | 74 | 0.26±0.07 ab | 0.69±0.12 b | 0.57±0.15 b | 0.22±0.08 ab | ||||
| 50 | 41 | 0.61±0.22 b | 0.51±0.15 ab | 0.07±0.04 a | 0.02±0.02 a | ||||
| 75 | 95 | 0.21±0.06 a | 0.39±0.09 a | 0.22±0.06 a | 0.05±0.04 a | ||||
| 100 | 3 | 0.33±0.33 ab | 0.33±0.33 ab | 0.33±0.33 ab | 0.00±0.00 a | ||||
| Type of Explant | 0.000 * | 0.000 * | 0.001 * | 0.043 * | |||||
| Apical | 137 | 0.55±0.09 b | 0.77±0.10 b | 0.55±0.10 b | 0.26±0.07 c | ||||
| Central Disc | 158 | 0.04±0.02 a | 0.26±0.05 a | 0.17±0.05 a | 0.10±0.03 a | ||||
| Epicotyl | 27 | 0.48±0.15 b | 0.19±0.08 a | 0.37±0.17 ab | 0.15±0.15 ab | ||||
| Hypocotyl | 27 | 0.04±0.04 a | 0.15±0.12 a | 0.04±0.04 a | 0.00±0.00 a | ||||
| Total | 349 | 0.28±0.04 | 0.45±0.05 | 0.32±0.05 | 0.16±0.03 | ||||
(1) PGRs: Plant Growth Regulators. (2) Treatments: BAP8 (6-Benzylaminopurine at 8 µM), KIN4 (Kinetin at 4 µM) and TDZ1 (Thidiazuron at 1 µM). (3) Plant sizes: Large (12-16 mm); Medium (8-12 mm); Small (4-8 mm). (4) Values followed by different letters are statistically different for p =0.05 according to Student-Newman-Keuls. * Significant results at p ≤ 0.05.
Table 3.
Average number of shoots (±SE) obtained monthly per factor and condition.
| Factors | Cases | Induction Period in Presence of PGRs (1) | Development Period in Absence of PGRs (1) | ||||||||
|---|---|---|---|---|---|---|---|---|---|---|---|
| 1st Month | 2nd Month | 3rd Month | 4th Month | 5th Month | |||||||
| p -Value (4) | Average | p-Value | Average | p-Value | Average | p-Value | Average | p-Value | Average | ||
| Treatment (2) | 0.015 * | 0.000 * | 0.142 | 0.433 | 0.000 * | ||||||
| BAP8 | 92 | 0.13±0.04 b | 0.77±0.13 b | 1.55±0.15 ab | 2.09±0.15 a | 2.33±0.15 a | |||||
| KIN4 | 76 | 0.12±0.06 b | 1.00±0.12 b | 1.51±0.12 ab | 1.80±0.12 a | 1.97±0.11 a | |||||
| TDZ1 | 123 | 0.00±0.00 a | 0.31±0.07 a | 1.30±0.11 a | 2.19±0.12 a | 2.85±0.13 b | |||||
| CONTROL | 58 | 0.12±0.07 b | 0.93±0.21 b | 1.83±0.26 b | 2.16±0.26 a | 2.43±0.25 a | |||||
| Explant Size (3) | 0.589 | 0.693 | 0.529 | 0.167 | 0.199 | ||||||
| Large | 67 | 0.13±0.06 a | 0.79±0.07 a | 1.69±0.21 a | 2.21±0.21 a | 2.58±0.20 a | |||||
| Medium | 228 | 0.07±0.02 a | 0.68±0.07 a | 1.47±0.09 a | 2.11±0.09 a | 2.49±0.10 a | |||||
| Small | 54 | 0.07±0.04 a | 0.56±0.12 a | 1.41±0.14 a | 1.74±0.16 a | 2.13±0.16 a | |||||
| % of Color | 0.196 | 0.149 | 0.042 * | 0.622 | 0.792 | ||||||
| 0 | 136 | 0.12±0.04 b | 0.73±0.10 a | 1.40±0.14 a | 2.14±0.14 a | 2.46±0.13 a | |||||
| 25 | 74 | 0.00±0.00 a | 0.57±0.13 a | 1.34±0.15 a | 2.04±0.15 a | 2.42±0.18 a | |||||
| 50 | 41 | 0.07±0.04 ab | 0.98±0.26 a | 2.05±0.25 b | 2.22±0.23 a | 2.66±0.25 a | |||||
| 75 | 95 | 0.10±0.05 ab | 0.56±0.09 a | 1.52±0.12 ab | 1.92±0.14 a | 2.36±0.12 a | |||||
| 100 | 3 | 0.00±0.00 ab | 1.67±0.88 a | 2.00±0.58 ab | 2.67±0.88 a | 3.00±1.00 a | |||||
| Type of Explant | 0.081 | 0.047 * | 0.086 | 0.013 * | 0.005 * | ||||||
| Apical | 137 | 0.13±0.04 b | 0.91±0.13 b | 1.77±0.15 b | 2.39±0.14 b | 2.80±0.15 b | |||||
| Central Disc | 158 | 0.04±0.02 a | 0.53±0.07 a | 1.30±0.10 a | 1.91±0.10 a | 2.26±0.10 a | |||||
| Epicotyl | 27 | 0.11±0.08 ab | 0.70±0.18 ab | 1.37±0.19 ab | 1.70±0.24 a | 2.30±0.27 ab | |||||
| Hypocotyl | 27 | 0.00±0.00 ab | 0.41±0.15 a | 1.44±0.22 ab | 1.78±0.22 ab | 1.96±0.19 a | |||||
| TOTAL | 349 | 0.08±0.02 | 0.69±0.06 | 1.50±0.08 | 2.07±0.08 | 2.45±0.08 | |||||
(1) PGRs: Plant Growth Regulators. (2) Treatments: BAP8 (6-Benzylaminopurine at 8 µM), KIN4 (Kinetin at 4 µM) and TDZ1 (Thidiazuron at 1 µM). (3) Plant sizes: Large (12-16 mm); Medium (8-12 mm); Small (4-8 mm). (4) Values followed by different letters are statistically different for p =0.05 according to Student-Newman-Keuls. * Significant results at p ≤ 0.05.
Table 4.
Average number of areoles per explant according to initial plant size and explant type.
| Factor | Cases | Average (1) |
|---|---|---|
| Plant Size | ||
| Large | 96 | 9.30 ± 0.43 a |
| Medium | 332 | 9.37 ± 0.27 a |
| Small | 146 | 10.21 ± 0.54 a |
| Type of Explant | ||
| Apical | 214 | 13.15 ± 0.25 b |
| Central Disc | 214 | 5.51 ± 0.13 a |
| Epicotyl | 73 | 15.30 ± 0.51 b |
| Hypocotyl | 73 | 5.12 ± 0.43 a |
(1) Values followed by the same letter are not statistically different for p = 0.05 according to the Student–Newman–Keuls.
Table 5.
Average number of the percentage of activated areoles with their standard errors obtained monthly by factor and condition.
Table 5.
Average number of the percentage of activated areoles with their standard errors obtained monthly by factor and condition.
| Factors | Cases | Induction Period in Presence of PGRs (1) | Development Period in Absence of PGRs | |||||||||
|---|---|---|---|---|---|---|---|---|---|---|---|---|
| 1st Month | 2nd Month | 3rd Month | 4th Month | 5th Month | ||||||||
| p-Value | Average (4) | p-Value | Average | p-Value | Average | p-Value | Average | p-Value | Average | |||
| Treatment (2) | 0.000 | 0.006 | 0.015 | 0.207 | 0.006 | |||||||
| BAP8 | 92 | 3.263±0.765 bc | 10.291±1.572 a | 18.488±1.897 a | 26.509±2.364 a | 29.313±2.188 a | ||||||
| KIN4 | 76 | 0.961±0.475 a | 14.414±1.968 ab | 22.767±2.491 ab | 29.755±3.065 a | 32.667±3.151 a | ||||||
| TDZ1 | 123 | 4.629±0.718 c | 16.293±1.559 b | 27.384±1.854 b | 33.533±2.474 a | 43.107±3.222 b | ||||||
| CONTROL | 58 | 1.629±0.931 ab | 11.336±2.336 a | 22.995±3.162 ab | 26.996±3.164 a | 30.727±3.040 a | ||||||
| Explant size | 0.707 | 0.002 | 0.009 | 0.000 | 0.000 | |||||||
| Large | 67 | 4.071±1.152 a | 14.692±2.102 b | 22.715±2.375 b | 27.452±2.607 b | 32.699±2.463 b | ||||||
| Medium | 228 | 2.899±0.458 a | 14.929±1.184 b | 25.679±1.508 b | 33.634±1.850 b | 39.160±2.155 b | ||||||
| Small | 54 | 1.914±0.491 a | 5.845±1.129 a | 14.006±1.424 a | 16.344±1.651 a | 21.191±2.186 a | ||||||
| % of Color | 0.742 | 0.379 | 0.849 | 0.003 | 0.136 | |||||||
| 0 | 136 | 3.298±0.704 a | 13.574±1.599 a | 24.742±2.113 a | 35.214±2.553 b | 39.862±2.770 b | ||||||
| 25 | 74 | 2.250±0.579 a | 15.962±2.002 a | 23.722±2.116 a | 28.844±2.056 b | 33.596±2.282 b | ||||||
| 50 | 41 | 4.058±1.209 a | 14.706±2.380 a | 22.836±2.850 a | 24.828±2.959 ab | 28.937±2.981 b | ||||||
| 75 | 95 | 2.604±0.677 a | 10.880±1.503 a | 21.378±1.946 a | 25.246±2.675 ab | 32.749±3.437 b | ||||||
| 100 | 3 | 2.778±2.778 a | 13.333±7.265 a | 15.185±5.614 a | 16.852±5.830 a | 19.630±8.021 a | ||||||
| Type of explant | 0.000 | 0.003 | 0.001 | 0.000 | 0.000 | |||||||
| Apical | 137 | 4.670±0.641 b | 14.150±1.118 b | 20.025±1.416 b | 22.614±1.407 b | 25.824±1.545 b | ||||||
| Central Disc | 158 | 1.861±0.587 a | 15.504±1.664 b | 29.325±2.001 c | 40.568±2.448 c | 47.984±2.760 c | ||||||
| Epicotyl | 27 | 3.416±0.800 b | 5.605±1.296 a | 11.105±1.559 a | 11.926±1.780 a | 16.124±2.286 a | ||||||
| Hypocotyl | 27 | 0.412±0.412 a | 6.085±1.874 a | 16.906±2.278 ab | 20.763±2.538 ab | 26.258±3.504 ab | ||||||
| Total | 349 | 2.972±0.380 | 13.478±0.905 | 23.304±1.127 | 29.772±1.371 | 35.140±1.560 | ||||||
(1) PGRs: Plant Growth Regulators. (2) Treatments: BAP8 (6-Benzylaminopurine at 8 µM), KIN4 (Kinetin at 4 µM) and TDZ1 (Thidiazuron at 1 µM). (3) Plant sizes: Large (12-16 mm); Medium (8-12 mm); Small (4-8 mm). (4) Values followed by different letters are statistically different for p =0.05 according to Student-Newman-Keuls.
Table 6.
Average and standard error of root emission frequency (calculated as number of rooted explants based on the total number of explants) obtained monthly by factor and condition.
Table 6.
Average and standard error of root emission frequency (calculated as number of rooted explants based on the total number of explants) obtained monthly by factor and condition.
| Factors | Cases | Induction Period in Presence of PGRs(1) | Development Period in Absence of PGRs | ||||
|---|---|---|---|---|---|---|---|
| 1st Month | 2nd Month | 3rd Month | |||||
| p-Value | Average (5) | p-Value | Average | p-Value | Average | ||
| Treatment (2) | 0.000 | 0.000 | 0 | ||||
| BAP8 | 92 | 0.228±0.044 b | 0.348±0.050 b | 0.413±0.052 b | |||
| KIN4 | 76 | 0.368±0.056 c | 0.461±0.058 bc | 0.487±0.058 bc | |||
| TDZ1 | 123 | 0.008±0.008 a | 0.008±0.008 a | 0.024±0.014 a | |||
| CONTROL | 58 | 0.517±0.066 d | 0.569±0.066 c | 0.552±0.066 c | |||
| Explant size (3) | 0.1329 | 0.2903 | 0.5802 | ||||
| Large | 67 | 0.298±0.056 ab | 0.343±0.058 a | 0.343±0.058 a | |||
| Medium | 228 | 0.232±0.028 b | 0.294±0.030 a | 0.294±0.030 a | |||
| Small | 54 | 0.130±0.046 a | 0.204±0.055 a | 0.370±0.066 a | |||
| % of Color | 0.0006 | 0.0008 | 0.0165 | ||||
| 0 | 136 | 0.346±0.041 b | 0.412±0.042 b | 0.404±0.042 c | |||
| 25 | 74 | 0.189±0.046 a | 0.257±0.051 a | 0.270±0.052 a | |||
| 50 | 41 | 0.195±0.063 a | 0.244±0.068 a | 0.366±0.076 b | |||
| 75 | 95 | 0.116±0.033 a | 0.168±0.039 a | 0.200±0.041 a | |||
| 100 | 3 | 0.000±0.000 ab | 0.000±0.000 ab | 0.333±0.333 ab | |||
| TE(4) | 0 | 0 | 0 | ||||
| Apical | 137 | 0.431±0.042 b | 0.511±0.043 b | 0.504±0.043 b | |||
| Central Disc | 158 | 0.089±0.023 a | 0.127±0.027 a | 0.133±0.027 a | |||
| Epicotyl | 27 | 0.222±0.082 a | 0.296±0.090 a | 0.519±0.098 b | |||
| Hypocotyl | 27 | 0.037±0.037 a | 0.111±0.062 a | 0.222±0.082 a | |||
| Total | 349 | 0.229±0.022 | 0.289±0.024 | 0.315±0.025 | |||
(1) PGRs: Plant Growth Regulators. (2) Treatments: BAP8 (6-Benzylaminopurine at 8 µM), KIN4 (Kinetin at 4 µM) and TDZ1 (Thidiazuron at 1 µM). (3) Plant sizes: Large (12-16 mm); Medium (8-12 mm); Small (4-8 mm). (4) TE= Type of explant. (5)Values followed by different letters are statistically different for p =0.05 according to Student-Newman-Keuls.
Table 7.
Percentage of rooting during the first three months per combination of factors.
| Plant size(1) | Type of explant | % Color | TREATMENT (2) | |||||||||||
|---|---|---|---|---|---|---|---|---|---|---|---|---|---|---|
| BAP8 | KIN4 | TDZ1 | CONTROL | |||||||||||
| 1st Month | 2nd Month | 3rd Month | 1st Month | 2nd Month | 3rd Month | 1st Month | 2nd Month | 3rd Month | 1st Month | 2nd Month | 3rd Month | |||
| Large | Apical | 0 | - | - | - | - | - | - | - | - | - | 100.00 | 100.00 | 100.00 |
| 25 | 16.67 | 66.67 | 66.67 | 66.67 | 66.67 | 66.67 | 0.00 | 0.00 | 0.00 | - | - | - | ||
| 50 | 100.00 | 100.00 | 100.00 | 100.00 | 100.00 | 100.00 | - | - | - | - | - | - | ||
| 75 | 50.00 | 50.00 | 50.00 | 50.00 | 100.00 | 100.00 | 0.00 | 0.00 | 0.00 | - | - | - | ||
| Central Disc | 0 | - | - | - | - | - | - | 0.00 | 0.00 | 0.00 | 14.29 | 28.57 | 50.00 | |
| 25 | 0.00 | 0.00 | 0.00 | 16.67 | 16.67 | 16.67 | 0.00 | 0.00 | 0.00 | - | - | - | ||
| 50 | 0.00 | 0.00 | 0.00 | 50.00 | 50.00 | 50.00 | 0.00 | 0.00 | 0.00 | - | - | - | ||
| 75 | 25.00 | 25.00 | 25.00 | 0.00 | 0.00 | 0.00 | 0.00 | 0.00 | 0.00 | - | - | - | ||
| Medium | Apical | 0 | 50.00 | 93.75 | 93.75 | 87.50 | 93.75 | 93.75 | 0.00 | 0.00 | 0.00 | 84.38 | 96.88 | 96.88 |
| 25 | 50.00 | 80.00 | 80.00 | 90.00 | 90.00 | 90.00 | 10.00 | 10.00 | 10.00 | - | - | - | ||
| 50 | 50.00 | 75.00 | 75.00 | 100.00 | 100.00 | 100.00 | 0.00 | 0.00 | 0.00 | - | - | - | ||
| 75 | 28.57 | 28.57 | 28.57 | 42.86 | 42.86 | 42.86 | 0.00 | 0.00 | 0.00 | - | - | - | ||
| Central Disc | 0 | 12.50 | 12.50 | 12.50 | 18.75 | 31.25 | 31.25 | 0.00 | 0.00 | 0.00 | 6.25 | 12.50 | 21.88 | |
| 25 | 10.00 | 10.00 | 10.00 | 20.00 | 20.00 | 20.00 | 0.00 | 0.00 | 0.00 | - | - | - | ||
| 50 | 0.00 | 0.00 | 0.00 | 25.00 | 50.00 | 50.00 | 0.00 | 0.00 | 0.00 | - | - | - | ||
| 75 | 0.00 | 0.00 | 0.00 | 0.00 | 21.43 | 21.43 | 0.00 | 0.00 | 0.00 | - | - | - | ||
| Small | Epicotyl | 0 | - | - | - | - | - | - | - | - | - | 93.75 | 93.75 | 100.00 |
| 25 | 100.00 | 100.00 | 100.00 | 0.00 | 100.00 | 100.00 | 0.00 | 0.00 | 0.00 | - | - | - | ||
| 50 | 25.00 | 50.00 | 100.00 | 25.00 | 50.00 | 50.00 | 0.00 | 0.00 | 0.00 | - | - | - | ||
| 75 | 12.50 | 50.00 | 87.50 | 62.50 | 75.00 | 87.50 | 0.00 | 0.00 | 0.00 | - | - | - | ||
| 100 | 0.00 | 0.00 | 0.00 | 0.00 | 0.00 | 0.00 | 0.00 | 0.00 | 0.00 | - | - | - | ||
| Hypocotyl | 0 | - | - | - | - | - | - | - | - | - | 6.25 | 6.25 | 6.25 | |
| 25 | 0.00 | 0.00 | 33.33 | 0.00 | 100.00 | 100.00 | 0.00 | 0.00 | 0.00 | - | - | - | ||
| 50 | 0.00 | 0.00 | 50.00 | 0.00 | 0.00 | 25.00 | 0.00 | 0.00 | 0.00 | - | - | - | ||
| 75 | 0.00 | 0.00 | 0.00 | 0.00 | 0.00 | 0.00 | 0.00 | 0.00 | 0.00 | - | - | - | ||
| 100 | 0.00 | 0.00 | 0.00 | 0.00 | 0.00 | 0.00 | 0.00 | 0.00 | 0.00 | - | - | - | ||
| Total for treatment | 21.71 | 33.55 | 38.82 | 36.67 | 46.67 | 48.00 | 0.68 | 0.68 | 0.68 | 49.19 | 55.65 | 61.29 | ||
(1) Plant sizes: Large (12-16 mm); Medium (8-12 mm); Small (4-8 mm). (2) Treatments: BAP8 (6-Benzylaminopurine at 8 µM), KIN4 (Kinetin at 4 µM) and TDZ1 (Thidiazuron at 1 µM).
Table 8.
Number and type of the activated areolas and the percentage of coloration of the obtained shoots in relation to the percentage of coloration of the initial plants.
Table 8.
Number and type of the activated areolas and the percentage of coloration of the obtained shoots in relation to the percentage of coloration of the initial plants.
| % color of the original plant | Nº of activated areolas | Color of activated areola(1) | Percentage of shoot coloration | |||||
|---|---|---|---|---|---|---|---|---|
| C | M | G | 0% | <50% | >50% | 100% | ||
| 0 | 368 | 0 | 0 | 368 | 368 | 0 | 0 | 0 |
| 25 | 177 | 31 | 57 | 89 | 112 | 18 | 14 | 33 |
| 50 | 107 | 22 | 44 | 41 | 55 | 21 | 10 | 21 |
| 75 | 217 | 94 | 79 | 44 | 77 | 18 | 21 | 101 |
| 100 | 5 | 3 | 2 | 0 | 0 | 2 | 1 | 2 |
| Total | 874 | 150 | 182 | 542 | 612 | 59 | 46 | 157 |
(1)Color of activated areola: “G”, green areolas; “M”, mixed areolas; and “C”, colored areolas.
Table 9.
Canonical correlation between evaluated factors and their corresponding significance values (p-value) for each combination.
Table 9.
Canonical correlation between evaluated factors and their corresponding significance values (p-value) for each combination.
| Interactions | p-Value |
|---|---|
| Color percentage of the initial plant * Color of the activated areolas | 0.000 |
| Color percentage of the initial plant * Color percentage of the obtained shoots | 0.000 |
| Color of the activated areolas * Color percentage of the obtained shoots | 0.000 |
| Hormonal treatment * Color of the activated areolas | 0.133 |
| Hormonal treatment * Color percentage of the obtained shoots | 0.766 |
Table 10.
Number of shoots obtained from the initial variegated plants as a function of the type of activated areola. Number of shoots obtained from areoles derived from the initial variegated plants classified according to the type of areola (shoots from the activated areoles of the initial chlorophyllic plants are not included).
| Type of areola | Coloration of shoots (1) | |||
|---|---|---|---|---|
| S0 | S1 | S2 | S3 | |
| Color (C) | 3 | 4 | 15 | 129 |
| Mixed (M) | 74 | 48 | 31 | 28 |
| Green (G) | 166 | 5 | 1 | 0 |
| Total | 243 | 57 | 47 | 157 |
| Total of shoots | 504 | |||
(1) Coloring percentage of shoots: group S0 = green shots without variegation; group S1 = shoots with a color percentage below 50%; group S2 = shoots with a color percentage above 50%; and group S3 = completely colored, without chlorophyllous tissue.
Table 11.
Experimental design of the trial.
| Plant size | % Color | Nº plants | N° of explants evaluated (1) | Treatment (2) | ||||||
|---|---|---|---|---|---|---|---|---|---|---|
| A | CD | EP | HYP | BAP8 | KIN4 | TDZ1 | CONTROL | |||
| 0 | 7 | 14 | 14 | - | - | - | - | - | 28 | |
| Large | 25 | 9 | 18 | 18 | - | - | 12 | 12 | 12 | - |
| (12-16 mm) | 50 | 2 | 4 | 4 | - | - | 4 | 4 | - | - |
| 75 | 6 | 12 | 12 | - | - | 8 | 8 | 8 | - | |
| 0 | 40 | 80 | 80 | - | - | 32 | 32 | 32 | 64 | |
| Medium | 25 | 15 | 30 | 30 | - | - | 20 | 20 | 20 | - |
| (8-12 mm) | 50 | 7 | 14 | 14 | - | - | 8 | 8 | 12 | - |
| 75 | 21 | 42 | 42 | - | - | 28 | 28 | 28 | - | |
|
Small (4-12 mm) |
0 | 16 | - | - | 16 | 16 | - | - | - | 32 |
| 25 | 7 | - | - | 7 | 7 | 6 | 4 | 4 | - | |
| 50 | 12 | - | - | 12 | 12 | 8 | 8 | 8 | - | |
| 75 | 24 | - | - | 24 | 24 | 16 | 16 | 16 | - | |
| 100 | 14 | - | - | 14 | 42 | 10 | 10 | 8 | - | |
| Total for condition | 214 | 214 | 73 | 73 | 152 | 150 | 148 | 124 | ||
| Total trial | 180 | 574 | 574 | |||||||
(1) Type of explant: A (apical), CD (central disc), EP (epicotyl), HYP (hypocoty) . (2) Treatments: BAP8 (6-Benzylaminopurine at 8 µM), KIN4 (Kinetin at 4 µM) and TDZ1 (Thidiazuron at 1 µM).
Disclaimer/Publisher’s Note: The statements, opinions and data contained in all publications are solely those of the individual author(s) and contributor(s) and not of MDPI and/or the editor(s). MDPI and/or the editor(s) disclaim responsibility for any injury to people or property resulting from any ideas, methods, instructions or products referred to in the content. |
© 2025 by the authors. Licensee MDPI, Basel, Switzerland. This article is an open access article distributed under the terms and conditions of the Creative Commons Attribution (CC BY) license (http://creativecommons.org/licenses/by/4.0/).
Copyright: This open access article is published under a Creative Commons CC BY 4.0 license, which permit the free download, distribution, and reuse, provided that the author and preprint are cited in any reuse.


