Submitted:
23 January 2025
Posted:
24 January 2025
You are already at the latest version
Abstract
Synergistic active-passive utilization of solar energy in buildings plays an important role in achieving nearly zero energy buildings. Building-integrated photovoltaic (BIPV) is a crucial initiative to reduce heating energy consumption, especially in cold climate zones with abundant solar radiation. However, few studies have examined the impact of design parameter of photovoltaic combined vacuum glazing (PVCVG) on building energy efficiency. This study assessed the energy performance of Several typical Win-dows and PVCVG with various Window-to-Wall Ratio (WWR) design conditions in residential buildings in Lhasa, and investigated how the WWR and orientation of PVCVG influence energy consumption by DesignBuilder software. The findings indi-cate that PVCVG exhibits great energy-saving potential in Lhasa, with both orientation and WWR of PVCVG substantially affecting energy consumption. Specifically, When the south-facing WWR > 40%, the energy generated by the three kinds of PV Windows can meet the building's requirements. the optimal orientation for PVCVG is southward, followed by east and west orientations. PVCVG reaches optimal energy satisfaction when the South WWR is 85%. This study is expected to provide useful information for improving the energy use efficiency in cold climate zones with abundant solar radiation and promoting sustainable building development.
Keywords:
Photovoltaic window
; Window-to-Wall Ratio (WWR)
; Orientation
; Power generation
; Energy performance
1. Introduction
Energy serves as the foundation for human survival and development, with energy consumption serving as a reflection of economic and social progress. In 2018, during construction operations, building energy consumption constituted 21.7% of China’s total energy consumption. However, windows exhibit the poorest thermal performance, accounting for approximately 60% of the energy loss within the building envelope [1]. The challenge is especially obvious in Lhasa. The cold climate leads to high heating demands. The shortage of conventional energy sources forces reliance on external energy supplies to meet regional needs. Faced with the double pressures of energy supply and demand, solar power becomes a feasible alternative to traditional fuels. The integration of solar technology into architectural designs is a crucial trend in the future development of Tibet because of its great advantages in improving energy efficiency and facilitating practical use.
Building-integrated photovoltaic (BIPV) technology involves incorporating photovoltaic components into the building’s exterior, creating a synergy between architectural design, structural integrity, and the multifunctional attributes of building materials, while also facilitating renewable energy production [2]. PV modules can be integrated into various building surfaces and are classified into four main categories: BIPV-roofs (including flat roofs, sloped roofs, skylights, etc.), BIPV facades, BIPV windows, and BIPV shadings [3]. As shown in Figure 1.
Photovoltaic (PV) glazing is manufactured by embedding photovoltaic cells within glass, significantly affecting a building’s energy performance through its optical, thermal, and electrical properties [4]. Figure 2 shows how the PV glazing module impacts the energy consumption of the structure. Photovoltaic glass effectively captures solar radiation while minimizing the amount of radiation that penetrates into interior spaces, thereby influencing both the solar heat gain coefficient (SHGC) and the U-value of the window. SHGC and U-value are critical in determining a room’s thermal gain or loss, rendering them essential factors for evaluating a building’s energy performance [5]. The thermal performance of a window is defined by its U-value, which measures heat loss due to temperature differences between indoor and outdoor environments, along with the SHGC, which quantifies incoming solar energy through glazing [6]. The electrical performance is evaluated based on power generation efficiency and total energy output from photovoltaic glazing [7]. The transmittance of visible light (TVIS) through photovoltaic glass significantly impacts energy consumption in building lighting systems. A comprehensive set of parameters, including glare, illuminance levels, uniformity of illuminance, and color rendering index, was utilized to evaluate the indoor lighting conditions [8].
Previous studies on the thermal performance of photovoltaic (PV) windows have demonstrated that these windows offer significant advantages in cooling-dominated regions [9]. In the heating season, the heating load may increase because incoming solar heat gain is low with PV glazing. Additionally, the thermal insulation of the PV glazing is poor for the heating-dominated regions [10]. Regarding the abovementioned matter, a novel PVCVG (photovoltaic combined vacuum glazing) is proposed to improve the thermal performance of the conventional PV glazing [11]. The thermal and electrical performances of the PVCVG have been assessed through laboratory experiments and field tests [12]. The overall annual energy performance of the PVCVG in Hong Kong was examined [13]. It was suggested that the PVCVG could enhance the thermal performance and overcome the deficiency of the PV glazing.
The substitution of conventional transparent glass with photovoltaic glass significantly enhances solar power generation. However, it may also result in a reduction of passive solar thermal gain and an increase in energy consumption for artificial lighting. Furthermore, alterations in electricity production and energy utilization for heating, cooling, and illumination do not necessarily yield a positive effect on the overall energy consumption of the building, which is profoundly influenced by window orientation and the Window-to-Wall Ratio (WWR). Shen et al. [14] examines the optimal PV cell coverage ratio regarding the energy consumption of office buildings in central China where PV façades have been adopted, considering various combinations of architectural variables such as room depth, WWR, and orientation. Liao et al. [15] used EnergyPlus to simulate and compare the energy consumption of photovoltaic glass with three conventional glass types in power generation, lighting, cooling, and heating. They considered five building factors: room depth, height, width, window height, and WWR. Results indicate that photovoltaic glass outperforms single and double glazing in energy performance. It is particularly advantageous in shallow rooms with large windows or high ceilings compared to traditional glass. Poh Khai Ng et al. [16] performed an energy analysis of PV glazing in Singapore, highlighting the potential of PV glazing in various orientations within tropical regions. And this study specifically highlighted the necessity of optimizing the WWR through diverse design strategies to maximize energy benefits. Chow et al. [17] conducted an investigation into the performance of translucent amorphous silicon windows in an office building located in Hong Kong. Their findings indicate that at a WWR of 0.33, a visible transmittance range of 0.45 to 0.55 achieves optimal energy-saving performance. Miyazaki et al. [18] employed EnergyPlus to investigate the impact of PV window transmittance and WWR on heating and cooling loads, daylighting, and power generation in office buildings. The findings indicate that a solar cell transmission rate of 40%, when combined with a WWR of 50 percent, effectively reduces energy consumption. Kapsis et al. [19] employed DAYSIM to investigate the annual daylight performance of various PV window configurations within a cooling-dominated continental climate. The study examined the effects of WWR, orientation, and lighting design on the selection of optimal optical properties for PV glazing. Zhang et al. [20] compared the energy performance of PV windows to that of commonly used energy-saving windows. The results indicate that PV glazing can achieve a reduction in total electricity consumption of up to 18% and 16% per year, respectively, when compared to clear single-pane and double-pane glazing in cooling-dominated regions such Hong Kong. Olivieri et al. [21] investigated four transparent photovoltaic modules with varying transmittance levels in Madrid. The study revealed that the solar protection and insulating properties of a-Si photovoltaic modules are less effective than those offered by traditional glazing.
Variations in the WWR have a complex and multifaceted impact on building energy consumption [22]. On the one hand, enlarging the window area can enhance natural illumination and augment the quantity of solar radiation penetrating the indoor environment, thereby contributing to a reduction in winter heating energy requirements. On the other hand, this modification may also result in elevated cooling energy demands during summer months [23]. Additionally, the WWR impact both the indoor lighting environment and associated lighting energy consumption [24]. The intensity of solar radiation received by windows with varying orientations significantly influences the available solar radiation within interior spaces [25]. Consequently, it is essential to investigate the impact of PVCVG orientation and WWR on the heating, cooling, and overall annual energy consumption in residential buildings located in Lhasa. At present, scholars have carried out a number of research activities on the energy consumption of photovoltaic glass in different climate zones, but the examination of the PVCVG system in Lhasa, a region distinguished by its cold climate and substantial solar radiation potential, remains insufficiently explored. Therefore, this study focuses on two aspects: On the one hand, the energy performance of PVCVG and several typical windows utilized in residential buildings in the Lhasa area was compared. On the other hand, we explore how the design parameters of PVCVG, such as the WWR and orientation, influence its energy performance.
This study aims to provide guidance on the WWR decision-making process for PVCVG and other types of windows for residents in cold climate zones. Furthermore, the optimization of WWR discussed in this paper contributes to reducing the operational demands of active systems and facilitates energy savings [26]. Therefore, exploring the optimal WWR may provide valuable insights for future research on the relationship between building energy consumption and window systems.
2. Research Methodology
2.1. Research Framework
To investigate the overall energy performance of the PVCVG, this study utilized DesignBuilder to develop a comprehensive model of a typical residential building featuring this PVCVG window. The energy simulation process consists of three stages: (1) the parameters of window units, (2) residential prototype modeling and weather data invoking, (3) simulations of window units under different design parameters. As shown in Figure 3.
In the first stage, the optical and thermal properties of various glazing systems were assessed using the Berkley Lab WINDOW software [27]. The Berkeley Lab WINDOW offers a comprehensive library of glazing systems designed to aid users in creating more intricate window configurations. Vacuum glass and PV glass were identified as suitable materials for window applications in the Berkley Lab WINDOW. Subsequently, multi-layer models of PVCVG, along with several representative glass configurations, were developed to evaluate their performance characteristics. The measured properties of the window units were employed to calculate key metrics, including U-value, solar heat gain coefficient (SHGC), and visible light transmittance (TVIS). These parameters can subsequently be imported into DesignBuilder for further analysis.
In the second stage, a three-dimensional model representing a typical small residential building was developed, featuring dimensions of 3 meters in width, 3 meters in depth, and 3.3 meters in height. The only external wall is equipped with a window. Subsequently, the facade view of the window was established, simulation parameters regarding room energy consumption were inputted, and weather data specific to Lhasa was utilized.
In the third stage, several representative window units were selected as competitors to vacuum photovoltaic glass in order to evaluate the energy performance of different windows in Lhasa. To gain a comprehensive understanding of the energy performance of PVCVG, the orientation of the windows and their WWR were adjusted to analyze the impact of various architectural design factors on different energy consumption aspects, including lighting, cooling, heating, power generation, and net energy consumption.
2.2. Window Units
Flexible cadmium telluride (CdTe) thin-film solar cells offer the advantages of lightweight construction and customizable shapes [28]. CdTe can be fabricated into millimeter-wide strips that are uniformly arranged on the glass surface, facilitating even natural light transmission without casting shadows [29]. CdTe PV glazing allows for the adjustment of cell coverage ratio (CCR), achieving a transmittance range from 10% to 90%, with most applications typically utilizing a transmittance between 30% and 60%. This technology enables energy savings in buildings while also enhancing indoor lighting quality [30].
Vacuum glass utilizes a specialized structure within the vacuum layer, which eliminates thermal conductivity and convective heat transfer, effectively obstructing heat conduction between indoor and outdoor environments [31]. This significantly reduces the heat transfer coefficient (U-value), making it particularly advantageous in cold regions due to its superior thermal insulation performance and energy-saving effects. Consequently, it serves as an optimal complementary technology for photovoltaic glass by substantially minimizing heat loss and reducing the heating consumption [32].
In this study, PVCVG, which integrates CdTe thin-film photovoltaic glass with vacuum glazing technology, is selected as a representative approach. A fundamental model of the vacuum photovoltaic window is developed using photovoltaic glass with 40% light transmittance and vacuum glazing based on the most widely adopted parameters for the vacuum layer. As shown in Table 1.
To analyze the energy consumption associated with various window types employed in residential buildings in Lhasa, we selected representative categories of traditional and Photovoltaic windows. The traditional window types include Single Glazing (SG), Double Glazing (DG), Vacuum Glazing (VG), and Photovoltaic windows include Single PV Glazing (S-PV), Double PV Glazing (D-PV), and PV Combined Vacuum Glazing (PVCVG). Performance parameters for photovoltaic glass were provided by manufacturers and subsequently imported into WINDOW software. The thermal and optical properties of standard glass were obtained from the IGDB international glass database. this data was then integrated into WINDOW thermal calculation software to evaluate the thermal performance of different window configurations. The structural characteristics and thermal parameters of these diverse window types are summarized in Table 2.
2.3. Residential Prototype Modeling
2.3.1. Residential Prototype Geometry and Parameters
The widely adopted building energy simulation software encompasses EnergyPlus, DOE2 and DesignBuilder. By capitalizing on the friendly interface, comprehensive database, and sophisticated energy consumption simulation capabilities of DesignBuilder. Numerous scholars have utilized this tool to conduct a variety of energy consumption studies while concurrently validating the accuracy of its simulations.
The established standard living unit measures 3m in length, 3m in width, and 3.3m in height. Given that the simulated building type is a residential building, the family mode ’Domestic Circulation’ has been selected from the Activity Template. The model incorporates factors pertinent to building energy consumption, including occupant activity levels, calculated indoor temperatures for winter and summer, indoor illumination levels, and fresh air conditions. Based on the actual circumstances of the simulated building, the average occupancy is set at 3 individuals per 100 m2. The human metabolic rate is defined as 0.90. Indoor lighting is configured to achieve an illumination level of 100 lux while maintaining indoor temperatures of 18℃ during winter and 26℃ during summer. The Performance model of Photovoltaic panel adopts the simple power generation mode, and the Cell efficiency value is set to 15%. And its Fraction of surface with active solar cells is set to 0.6. The heat transfer coefficient for external walls is specified as 0.35 W/(m2·K), whereas that for roofs is designated at 0.25 W/( m2·K).
2.3.2. Scenarios of Window Proportion Design
The WWR represents the ratio of the window area to the façade area. This metric is a crucial factor in façade design, as it significantly influences the energy efficiency of a building [33]. The general guideline in architectural design posits that a small to moderate window-to-wall ratio (WWR) is regarded as the most energy-efficient façade configuration. Although current regulations stipulate that the WWR limit for windows in cold climate zones of China is set at 50%, this standard primarily applies to traditional window designs. To evaluate the optimal WWR for various types of photovoltaic windows, this research project determined that the appropriate simulation range for WWR should encompass values from 10% to 90%.
The effective lighting area is not computed for window openings that are less than 0.8m from the ground. Consequently, the opening windows of the building should preferably be positioned above 0.8m. The facade design of different WWR is depicted in Figure 4.
2.3.3. Weather Data in Building Simulation
When engaging in building-related practices and research, the utilization of local weather data is essential. Building performance simulations were conducted using hourly time steps over an entire year, employing the ASHRAE weather data of Lhasa. Figure 5 shows the temperature and solar radiation circumstances in a typical year in Lhasa. The diurnal temperature variation can surpass 20℃, with a maximum wet bulb temperature of 12℃ and a minimum of -14℃. The total hourly horizontal solar radiation in this region can reach up to 850 W/m2, while the direct solar radiation may attain levels of up to 760 W/m2.
2.4. Simulation Method
In this study, the energy-saving performance of typical window types was evaluated with DesignBuilder based on Lhasa’s typical climate data. The six exterior window types mentioned earlier are considered variables, and the residential prototype specifies the south-facing window unit, with the WWR increasing from 10% to 90% in 10% increments, to analyze the energy consumption changes of typical windows with different WWR.
Furthermore, the architectural design parameters of residential units utilizing PVCVG are simulated to analyze the impact of water level differences and orientation on energy consumption. To evaluate the performance of PVCVGs accurately, the residential prototype treats orientation and WWR as variables, with a minimum WWR established at 10%, incrementally increased to 90% in 5% increments. This study investigates the effects of varying orientations and WWR on heating, cooling, lighting, overall energy consumption, and net energy consumption in residential buildings.
3. Results
3.1. Energy Performance of Typical Window Units
Figure 6 illustrates the energy performance of six kinds of representative windows with different WWR. Lighting energy consumption slightly decreases as WWR increases, remaining between 50 and 60 kwh. Regardless of the type of window, the influence of lighting energy consumption on the annual energy consumption is very limited, accounting for approximately 10% to 20% of the annual overall energy consumption.
When the WWR≤20%, there is no cooling energy consumption for the six window types. When the WWR>30%, the cooling energy consumption rises along with the increase of WWR. When the WWR varies from 10% to 90%, the cooling energy consumption of S-PV, D-PV and PVCVG windows is still lower than the heating energy consumption. Meanwhile, the cooling energy consumption of SG, DG, and VG windows is significantly higher than that of S-PV, D-PV, and PVCVG windows. When the WWR>40%, the cooling energy consumption of SG, DG and VG windows surpasses the heating energy consumption and even becomes a major component of the annual energy.
When the WWR varies from 10% to 90%, the heating energy consumption of S-PV, D-PV, and PVCVG windows is significantly higher than that of SG, DG, and VG windows. When the WWR is 50%, the heating energy consumption of the SG window is 29.7% of the S-PV window, the DG window is 9.99% of the D-PV window, and the VG window is 6.9% of the PVCVG window.
The annual energy consumption of several types of windows is significantly influenced by WWR. Heating energy consumption constitutes the main part with the small WWR. In the large WWR condition, the primary overall energy consumption of SG, DG, and VG windows is cooling energy consumption, while for S-PV, D-PV, and PVCVG windows, the primary overall energy consumption is heating energy consumption. When the WWR is 50%, the main energy consumption of the VG window is cooling energy consumption, accounting for approximately 73.08% of the annual energy consumption. However, the main energy consumption of the PVCVG window is heating energy consumption, accounting for about 74.4% of the overall energy consumption. Additionally, when the WWR varies from 10% to 50%, the overall energy consumption of S-PV, D-PV, and PVCVG windows is higher than that of SG, DG, and VG windows. When the WWR changes from 60% to 90%, the overall energy consumption of the PV windows is lower than that of the traditional windows. Even when the WWR is 90%, the overall energy consumption of the PVCVG window is merely 28.4% of the VG window.
The power generation of S-PV, D-PV and PVCVG windows significantly increases along with the rise of WWR. When the WWR varies from 10% to 90%, the generation of the PV window rises from 77.99 kWh to 854.5 kWh.
When the WWR≤20%, the net energy consumption of SG, DG, and VG windows is lower than that of S-PV, D-PV, and PVCVG windows. When the WWR is 30%, the energy performance of S-PV, D-PV, and PVCVG begins to demonstrate an advantage. When the WWR is 40%, the net energy consumption of the S-PV, D-PV, and PVCVG windows starts to become negative. When the WWR continues to increase to 90%, the net energy consumption of S-PV, D-PV, and PVCVG windows is -451.54 kWh, -584.33 kWh, and -628.26 kWh respectively, generating more surplus electric energy. The surplus power generated by PVCVG is significantly higher than that produced by other types of windows.
3.2. PVCVG Energy Performance with Different Orientation and WWR
3.2.1. Lighting Energy Consumption
The lighting energy consumption of the residential prototype is influenced by variations in orientation and WWR, as shown in Figure 7. The lighting energy consumption across all operational conditions ranges from 50 to 60 kWh. In the simulations conducted for this study, alterations in orientation do not result in significant variations in lighting energy consumption. however, rooms with north-facing windows exhibit the highest lighting energy usage, followed by those with south-facing windows, while west-facing and east-facing windows show slightly lower levels of energy consumption. When the WWR is between 10% and 50%, an increase in WWR correlates with a decrease in lighting energy consumption. When WWR rises to between 50% and 90%, there are no substantial changes observed in lighting consumption, which indicating that the WWR exceeding 50% for any direction can adequately fulfill daytime lighting requirements for the room.
3.2.2. Heating Energy Consumption
The heating energy consumption of the residential prototype is illustrated in Figure 8. The heating consumption of rooms with varying orientations exhibits a decreasing trend from north to west, east, and south. The heating energy consumption of this room consistently ranges between 670.51 kWh and 739.87 kWh, and there is no significant variation in the heating energy consumption of the north-facing room with windows relative to its WWR. In contrast, the heating energy consumption of east-facing oriented and west-facing rooms decreases with an increase in WWR, exhibiting more significant variations in the energy consumption of east-facing rooms. Specifically, as the WWR ascended from 10% to 90%, the heating energy consumption of the south-facing room declined from 619.52 kWh to 41.06 kWh, constituting merely 6.63% of the original.
3.2.3. Cooling Energy Consumption
The residential prototype with PVCVG in Lhasa generates only minimal cooling energy consumption, as shown in Figure 9. When the WWR≤25%, negligible cooling energy consumption is observed in rooms with north-facing and south-facing windows. However, surpassing this threshold leads to a modest increase in cooling energy consumption. A positive correlation exists between WWR and cooling energy consumption. The correlation between energy consumption and WWR is more pronounced in rooms facing west and east, while the correlation between energy consumption and WWR is insignificant in rooms facing south or north. For example, when the WWR varies from 10% to 90%, the cooling energy consumption of the east-facing PVCVG rises from 0 to 150.83 kWh, while that of the north-facing room with windows increases from 0 to 27.41 kWh. Importantly, this cooling energy expenditure constitutes merely 5% to 10% of overall annual energy consumption. Therefore, it is crucial to incorporate additional categories of energy consumption for a more comprehensive assessment of WWR and orientation.
3.2.4. Overall Energy Consumption
Annual overall energy consumption includes the total energy used for lighting, heating, and cooling in a room over one year, as shown in Figure 10. The trend of overall energy consumption closely resembles that of heating energy consumption. This indicates that annual energy consumption is mainly driven by heating demands, while the contributions from cooling and lighting remain relatively minimal.
The overall energy consumption of south-facing rooms shows a significant correlation with WWR, followed by that of east-facing rooms, and finally that of west-facing rooms. However, WWR has a negligible effect on north-facing rooms. With the WWR of 70%, the south-facing, east-facing and north-facing residential prototypes could respectively attain the lowest annual energy consumption of 190.42 kWh, 465.67 kWh and 745.08 kWh. When the WWR is 60%, the west-facing rooms can achieve the lowest energy consumption of 570.72 kWh. Compared to rooms with the WWR of 10%, overall energy consumption in rooms with PVCVG decreased by 71.9%, 36.5%, 24.0%, and 7.0% for the south, east, west, and north directions, respectively.
3.2.5. Electrical Power Generation
The photovoltaic power generation examined in this section does not account for the influence of temperature on efficiency. consequently, it is exclusively reliant on the solar radiation incident upon the PV glazing. As shown in Figure 11. Electricity production is optimized when oriented towards the south, while east and west orientations yield moderate outputs, with north-facing installations generating only 50% of the electricity produced by their south-facing counterparts. For example, a PVCVG with a 50% WWR and facing south can generate 463.87 kWh of electricity, whereas a PVCVG facing north can generate only 210.42 kWh. Furthermore, windows oriented towards the east and west can yield approximately 390.89 kWh and 362.09 kWh respectively. The energy output from north-facing installations constitutes only 45.3% of that generated by southern installations. Therefore, it is advisable to prioritize the installation of photovoltaic glass on southern facades, followed by those oriented east and west to maximize energy generation.
3.2.6. Net Energy Consumption
Figure 12 illustrates the influence of WWR and orientations on net energy consumption. The annual net energy consumption is predominantly associated with photovoltaic power generation and heating energy requirements. When the WWR of the south-facing windows exceeds 40%, the electricity generated by these photovoltaic installations is required to fully meet the energy requirements of a standard residential prototype. The WWR of the east-facing window should be above 60%, and that of the west-facing window should be above 80%, while the net energy consumption should be less than zero. When the WWR is 90%, the south-facing windows can generate 628.26 kWh of surplus electricity, and the east-facing windows can generate 238.36 kWh of surplus electricity. The west-facing windows can produce a maximum of 60.66 kWh of surplus electricity, which is only 9.6% of the surplus electricity from the south-facing windows.
3.3. Energy Satisfaction Ratio
Considering that passive energy consumption and photovoltaic power generation are influenced by varying orientations and WWR, the Energy Satisfaction Ratio (Rs) is ultimately utilized to evaluate the comprehensive energy-saving performance of different windows. Rs represents the ratio of electrical power generation to overall energy consumption, reflecting the degree to which the generated energy satisfies the building’s energy consumption requirements. A higher Rs value indicates superior comprehensive energy-saving performance of the window system. Specifically, when Rs>1, it signifies that the annual power generation from window is sufficient to meet the annual energy consumption of the residential prototype. Conversely, when Rs<1, it indicates that the power generation of window is insufficient to meet the energy demands of the residential prototype.
3.3.1. Energy Satisfaction Ratio of Typical PV Windows
Figure 13 illustrates the energy satisfaction rates of S-PV, D-PV, and PVCVG windows under different WWRs. When the WWR<30%, S-PV has the highest Rs. However, when the WWR≥30%, PVCVG holds the highest Rs. The Rs of S-PV and D-PV increase along with WWR, reaching up to 2.12 and 3.16 respectively. At a WWR of 80%, PVCVG demonstrates the best energy performance with the Rs of 3.8. For PV windows, when the WWR changes from 10% to 70%, the influence of WWR on Rs is relatively significant, and when the WWR varies from 70% to 90%, the impact on Rs is relatively minor. The average Rs of S-PV is 1.27, the average Rs of D-PV is 1.67, and the average Rs of PVCVG is 2.00. Generally speaking, the adoption of PVCVG in Lhasa will have a better energy-saving effect.
3.3.2. Energy Satisfaction Ratio of PVCVG
For specific WWR, the Rs of PVCVG exhibits a tendency where south-facing installations are considerably superior to those facing east, west, and north. As shown in Figure 14. At 50% WWR, Rs reaches 1.92, indicating that the power generation is nearly twice the annual overall energy consumption. Under the same direction, Rs displayed an evident upward trend along with the increase of WWR. For instance, in a south-facing PVCVG, Rs rises from 0.11 to 3.82 as WWR changes, and selecting the appropriate WWR can expand Rs by 33.3 times. The optimal Rs is achieved when the WWR of PVCVG facing south is 85%. At 85% WWR, Rs for east-facing, west-facing, and north-facing rooms are approximately 37.4%, 27.6%, and 12.7% of those for south-facing rooms.
4. Discussion
The results presented in this paper demonstrate that it is feasible to identify an optimal WWR value that minimizes the total energy consumption for heating, cooling, lighting, and even generates excess electricity. Each type and orientation of the window requires a specific optimum WWR.
Regarding the influence of WWR on the energy consumption of typical windows, it is revealed that WWR exerts a certain impact on the composition of the annual energy consumption. When the WWR changes from 10% to 90%, the lighting energy consumption of all window types is stable at around 50-60 kWh. This might be because of the strong solar radiation in Lhasa and the low lighting demand of the residential prototype. The visible light transmittance of the window affects the lighting energy consumption of the building. The low visible light transmittance of the PV window makes its lighting energy consumption slightly higher than that of ordinary windows without PV installation. Traditional windows like SG, DG, and VG have high solar radiation transmittance, leading to higher cooling energy consumption for traditional windows than PV windows. While the heating energy consumption of traditional windows is much lower than that of PV windows. Additionally, the results of this study show that the traditional window type generates more cooling energy consumption when WWR≥40%. This may be because the residential room in this study is only used during the day. However, for the PV windows S-PV, D-PV, and PVCVG, regardless of the WWR conditions, the heating energy consumption is the main part of the annual energy consumption.
Annual overall energy consumption varies greatly with WWR. When the WWR≤50%, the overall annual energy consumption of traditional windows is lower. When WWR> 50%, the overall energy consumption of PV windows is lower. Specifically, when the 30%<WWR<40%, the traditional windows without PV module have the lowest overall energy consumption, suggesting that the most suitable WWR for the three window types in Lhasa is within 30% to 40%. For windows with PV module, the effect of S-PV, D-PV, and PVCVG on the passive energy consumption of the room can be seen through the annual energy consumption. When WWR is 60%, S-PV has the lowest annual energy consumption of 320.95 kWh. When WWR is 70%, D-PV and PVCVG have the lowest annual energy consumption of 240.08 kWh and 190.42 kWh respectively. Similarly, Musameh et al. also demonstrated that transparent double-glazed systems typically exhibit lower energy consumption compared to photovoltaic glass when the WWR<30%, and PV glazing would be more efficient when the glazing cover more than 70% of the wall area in cold climate conditions [34].
By analyzing the net energy consumption of the window type, it is discovered that the annual energy-saving effect of the six windows varies. The integration of photovoltaic glass can significantly reduce the net energy consumption of the building, and the surplus electricity of PV windows increases along with the growth of WWR. When the WWR is 90%, S-PV, D-PV, and PVCVG can obtain the maximum surplus power. PVCVG demonstrates the highest energy-saving potential, followed by S-PV and D-PV. Among traditional windows, VG is more appropriate for Lhasa than DG and SG. Cheng et al. [35] also demonstrated the PVCVG also has superior performance than other competitors, including the double-pane window with low-e coating, the double PV glazing and the vacuum glazing.
This study further deliberates on the most appropriate window types for residential buildings in Lhasa under different WWR: When WWR<30%, the VG window has the lowest net energy consumption, indicating better energy conservation. When WWR≥30%, the PVCVG window has the lowest net energy consumption compared to other windows. Moreover, as the WWR increases, PVCVG shows more significant advantages. Therefore, when WWR<30%, VG windows should be adopted, and when WWR≥30%, PVCVG can reduce the net energy consumption of buildings.
The optimal WWR of traditional windows should be evaluated based on annual energy consumption, while that of PV windows should be determined by energy consumption satisfaction rate. The Rs of the four orientations showed an obvious increase trend with the rise of WWR. The Rs of S-PV and D-PV both reach the optimal Rs when the southbound WWR is 90%, which are 2.12 and 3.16 respectively. Meanwhile, PVCVG attains the optimal Rs when the southbound WWR is 85%. As for orientation, giving priority to the south-facing design is suggested, followed by the east-facing and west-facing design. Despite the superior performance of PVCVG, it remains inadvisable to install windows facing north.
It’s notable that in cold areas of China, the WWR limit for south-facing windows is 50% [36]. Actually, this limit only applies to traditional ones like SG, DG and VG. In contrast, photovoltaic windows have a lower SHGC, reducing the penetration of solar radiation into the living space. Consequently, the pertinent specifications ought to take into account the features of photovoltaic windows and elevate the WWR limit for photovoltaic windows in cold areas.
5. Conclusions
This study assessed the energy performance of Several typical windows and PVCVG with various Window-to-Wall Ratio (WWR) design conditions in residential buildings in Lhasa, and investigated how the WWR and orientation of PVCVG influence energy consumption by DesignBuilder software. The following conclusions may be drawn from the data analysis:
- When the WWR≥30%,compared to traditional windows(e.g., Vacuum glazing, Single PV glazing and Double PV glazing),Photovoltaic windows(e.g., Single PV glazing, Double PV glazing and PV combined vacuum glazing)greatly reduce the net energy consumption of residential buildings. However, when the south-facing WWR<30%, adopting VG windows is more energy-efficient than the three photovoltaic windows.
- The correlation between the net energy consumption and lighting energy consumption is insignificant. The annual energy consumption of traditional windows mainly consists of heating consumption and cooling energy consumption, while the net energy consumption of PV windows is mainly related to heating energy consumption and energy production. When the south-facing WWR≥40%, the energy generated by the three PV windows can meet the building’s requirements.
- The optimal WWR range for the three traditional windows in Lhasa is 30% to 40%. When the WWR is 60%, S-PV achieves its minimum energy consumption. When it’s 70% for D-PV, the lowest energy consumption is reached. However, When the WWR amounts to 90%, the abundant energy generated by S-PV and D-PV leads to the lowest net zero energy consumption.
- PVCVG exhibits significant advantages in energy performance when compared among several window types. The best orientation of PVCVG is south, with the lowest annual energy consumption, followed by east and west. PVCVG reaches optimal energy satisfaction when the south-facing WWR is 85%. In the design of PVCVG, the WWR of the east-facing window should be at least 60%, and that of the west-facing window should be at least 80% to meet the building’s energy requirements.
In conclusion, the type, orientation, and WWR of windows all exert a significant influence on building energy consumption, and the adoption of reasonable design can notably enhance the energy performance of windows. Our study provides a first step in developing design strategies that seek to Minimize the net energy consumption of the residence. This study is expected to provide valuable information for improving energy efficiency in cold areas abundant solar radiation and promoting sustainable building development.
The research presented in this paper possesses certain limitations, which can serve as a reference for the advancement of future research endeavors. Firstly, the results of the study are more relevant to daytime rooms like living rooms, chosen for simulation due to their larger WWR compared to bedrooms. Simulations in bedrooms may produce different outcomes. Secondly, it assumes an "ideal" user who does not interact with set parameters (temperature, ventilation rate), and the occupancy schedule is predetermined during optimization. Thirdly, while examining orientation and WWR in this paper, costs and economic benefits associated with actual photovoltaic module installations are not addressed.
In future studies, more detailed glass parameters of PVCVG could be taken into account. Additionally, the energy consumption of PVCVG applied to various residential rooms might be analyzed. Also, the economic analysis of PVCVG with different WWR could be conducted, and configuration suggestions of PVCVG more suitable for practical applications could be put forward.
Author Contributions
Conceptualization, Y.Z. and D.W.; methodology, L.Z.; software, L.Z.; formal analysis, B.Z. and L.Z.; investigation, L.C.; resources, B.Z. and L.C.; data curation, L.Z.; writing—original draft preparation, L.Z.; writing—review and editing, Y.X. and X.L.; visualization, L.Z.; supervision, B.Z.; project administration, D.W.; funding acquisition, Y.Z. All authors have read and agreed to the published version of the manuscript.
Funding
This research was funded by National Key Research and Development Program (grant number 2022YFC3802702); Soft science research project of Science and Technology Department of Sichuan Province (grant number 2021JDR0246); The Sichuan Regional Innovation Cooperation Project (grant number 2023YFQ0048) and Science and Technology Major Project of Xizang Autonomous Region of China (grant number XZ202201ZD0003G).
Data Availability Statement
The data presented in this study are available upon request from the First author.
Conflicts of Interest
The authors declare no conflicts of interest.
References
- Fang, Y.; Hyde, T.J.; Arya, F.; Hewitt, N.; Eames, P.C.; Norton, B.; Miller, S. Indium Alloy-Sealed Vacuum Glazing Development and Context. Renewable Sustainable Energy Rev. 2014, 37, 480–501. [Google Scholar] [CrossRef]
- Shukla, A.K.; Sudhakar, K.; Baredar, P. Recent Advancement in BIPV Product Technologies: A Review. Energy Build. 2017, 140, 188–195. [Google Scholar] [CrossRef]
- Shukla, A.K.; Sudhakar, K.; Baredar, P. A Comprehensive Review on Design of Building Integrated Photovoltaic System. Energy Build. 2016, 128, 99–110. [Google Scholar] [CrossRef]
- Ng, P.K.; Mithraratne, N. Lifetime Performance of Semi-Transparent Building-Integrated Photovoltaic (BIPV) Glazing Systems in the Tropics. Renewable Sustainable Energy Rev. 2014, 31, 736–745. [Google Scholar] [CrossRef]
- Lam, T.C.; Ge, H.; Fazio, P. Energy Positive Curtain Wall Configurations for a Cold Climate Using the Analysis of Variance (ANOVA) Approach. Build. Simul. 2016, 9, 297–310. [Google Scholar] [CrossRef]
- Ghosh, A.; Norton, B.; Duffy, A. Measured Thermal Performance of a Combined Suspended Particle Switchable Device Evacuated Glazing. Appl. Energy 2016, 169, 469–480. [Google Scholar] [CrossRef]
- Meral, M.E.; Dinçer, F. A Review of the Factors Affecting Operation and Efficiency of Photovoltaic Based Electricity Generation Systems. Renewable Sustainable Energy Rev. 2011, 15, 2176–2184. [Google Scholar] [CrossRef]
- Karlsson, J.; Roos, A. Annual Energy Window Performance vs. Glazing Thermal Emittance — the Relevance of Very Low Emittance Values. Thin Solid Films 2001, 392, 345–348.
- Hee, W.J.; Alghoul, M.A.; Bakhtyar, B.; Elayeb, O.; Shameri, M.A.; Alrubaih, M.S.; Sopian, K. The Role of Window Glazing on Daylighting and Energy Saving in Buildings. Renewable Sustainable Energy Rev. 2015, 42, 323–343. [Google Scholar] [CrossRef]
- Skandalos, N.; Karamanis, D. Investigation of Thermal Performance of Semi-Transparent PV Technologies. Energy Build. 2016, 124, 19–34. [Google Scholar] [CrossRef]
- Qiu, C.; Yang, H.; Sun, H. Investigation on the Thermal Performance of a Novel Vacuum PV Glazing in Different Climates. Energy Procedia 2019, 158, 706–711. [Google Scholar] [CrossRef]
- Zhang, W.; Lu, L.; Chen, X. Performance Evaluation of Vacuum Photovoltaic Insulated Glass Unit. Energy Procedia 2017, 105, 322–326. [Google Scholar] [CrossRef]
- Qiu, C.; Yang, H.; Zhang, W. Investigation on the Energy Performance of a Novel Semi-Transparent BIPV System Integrated with Vacuum Glazing. Build. Simul. 2019, 12, 29–39. [Google Scholar] [CrossRef]
- Xu, S.; Liao, W.; Huang, J.; Kang, J. Optimal PV Cell Coverage Ratio for Semi-Transparent Photovoltaics on Office Building Façades in Central China. Energy Build. 2014, 77, 130–138. [Google Scholar] [CrossRef]
- Liao, W.; Xu, S. Energy Performance Comparison among See-through Amorphous-Silicon PV (Photovoltaic) Glazings and Traditional Glazings under Different Architectural Conditions in China. Energy 2015, 83, 267–275. [Google Scholar] [CrossRef]
- Ng, P.; Mithraratne, N.; Kua, H. Energy Analysis of Semi-Transparent BIPV in Singapore Buildings. Energy and Buildings 2013, 66, 274–281. [Google Scholar] [CrossRef]
- Chow, T.T.; Fong, K.F.; He, W.; Lin, Z.; Chan, A.L.S. Performance Evaluation of a PV Ventilated Window Applying to Office Building of Hong Kong. Energy Build. 2007, 39, 643–650. [Google Scholar] [CrossRef]
- Miyazaki, T.; Akisawa, A.; Kashiwagi, T. Energy Savings of Office Buildings by the Use of Semi-Transparent Solar Cells for Windows. Renewable Energy 2005, 30, 281–304. [Google Scholar] [CrossRef]
- Kapsis, K.; Athienitis, A.K. A Study of the Potential Benefits of Semi-Transparent Photovoltaics in Commercial Buildings. Sol. Energy 2015, 115, 120–132. [Google Scholar] [CrossRef]
- Zhang, W.; Lu, L.; Peng, J.; Song, A. Comparison of the Overall Energy Performance of Semi-Transparent Photovoltaic Windows and Common Energy-Efficient Windows in Hong Kong. Energy Build. 2016, 128, 511–518. [Google Scholar] [CrossRef]
- Olivieri, L.; Caamaño-Martin, E.; Olivieri, F.; Neila, J. Integral Energy Performance Characterization of Semi-Transparent Photovoltaic Elements for Building Integration under Real Operation Conditions. Energy and Buildings 2014, 68, 280–291. [Google Scholar] [CrossRef]
- Ma, R.; Ma, R.; Long, E. Analysis of the Rule of Window-to-Wall Ratio on Energy Demand of Residential Buildings in Different Locations in China. Heliyon 2023, 9, e12803. [Google Scholar] [CrossRef] [PubMed]
- Alghoul, S.K.; Rijabo, H.G.; Mashena, M.E. Energy Consumption in Buildings: A Correlation for the Influence of Window to Wall Ratio and Window Orientation in Tripoli, Libya. J. Build. Eng. 2017, 11, 82–86. [Google Scholar] [CrossRef]
- Mangkuto, R.A.; Rohmah, M.; Asri, A.D. Design Optimisation for Window Size, Orientation, and Wall Reflectance with Regard to Various Daylight Metrics and Lighting Energy Demand: A Case Study of Buildings in the Tropics. Appl. Energy 2016, 164, 211–219. [Google Scholar] [CrossRef]
- Huang, J.; Lv, H.; Gao, T.; Feng, W.; Chen, Y.; Zhou, T. Thermal Properties Optimization of Envelope in Energy-Saving Renovation of Existing Public Buildings. Energy Build. 2014, 75, 504–510. [Google Scholar] [CrossRef]
- Singh, R.; Lazarus, I.J.; Kishore, V.V.N. Effect of Internal Woven Roller Shade and Glazing on the Energy and Daylighting Performances of an Office Building in the Cold Climate of Shillong. Appl. Energy 2015, 159, 317–333. [Google Scholar] [CrossRef]
- WINDOW | Download | Windows & Daylighting Available online: https://windows.lbl.gov/window-download.
- Alrashidi, H.; Issa, W.; Sellami, N.; Sundaram, S.; Mallick, T. Thermal Performance Evaluation and Energy Saving Potential of Semi-Transparent CdTe in Façade BIPV. Sol. Energy 2022, 232, 84–91. [Google Scholar] [CrossRef]
- Barman, S.; Chowdhury, A.; Mathur, S.; Mathur, J. Assessment of the Efficiency of Window Integrated CdTe Based Semi-Transparent Photovoltaic Module. Sustainable Cities Soc. 2018, 37, 250–262. [Google Scholar] [CrossRef]
- Meng, W.; Jinqing, P.; Hongxing, Y.; Yimo, L. Performance Evaluation of Semi-Transparent CdTe Thin Film PV Window Applying on Commercial Buildings in Hong Kong. Energy Procedia 2018, 152, 1091–1096. [Google Scholar] [CrossRef]
- Ghosh, A.; Norton, B.; Duffy, A. Measured Thermal & Daylight Performance of an Evacuated Glazing Using an Outdoor Test Cell. Appl. Energy 2016, 177, 196–203. [Google Scholar]
- Ghosh, A.; Sundaram, S.; Mallick, T.K. Investigation of Thermal and Electrical Performances of a Combined Semi-Transparent PV-Vacuum Glazing. Applied Energy 2018, 228, 1591–1600. [Google Scholar] [CrossRef]
- Sun, Y.; Shanks, K.; Baig, H.; Zhang, W.; Hao, X.; Li, Y.; He, B.; Wilson, R.; Liu, H.; Sundaram, S.; et al. Integrated Semi-Transparent Cadmium Telluride Photovoltaic Glazing into Windows: Energy and Daylight Performance for Different Architecture Designs. Appl. Energy 2018, 231, 972–984. [Google Scholar] [CrossRef]
- Musameh, H.; Alrashidi, H.; Al-Neami, F.; Issa, W. Energy Performance Analytical Review of Semi-Transparent Photovoltaics Glazing in the United Kingdom. J. Build. Eng. 2022, 54, 104686. [Google Scholar] [CrossRef]
- Liu, X.; Shen, C.; Bo, R.; Wang, J.; Ardabili, N.G. Experimental Investigation on the Operation Performance of Photovoltaic Double Skin Façade in Winter. Energy 2023, 283, 129040. [Google Scholar] [CrossRef]
- Liu, R.; Wang, G.; Deng, Q. Multi-Objective Optimization of Rural Residential Envelopes in Cold Regions of China Based on Performance and Economic Efficiency. Case Stud. Therm. Eng. 2024, 61, 104937. [Google Scholar] [CrossRef]
Figure 1.
Classification of the BIPV system. Sources: [3].
Figure 1.
Classification of the BIPV system. Sources: [3].
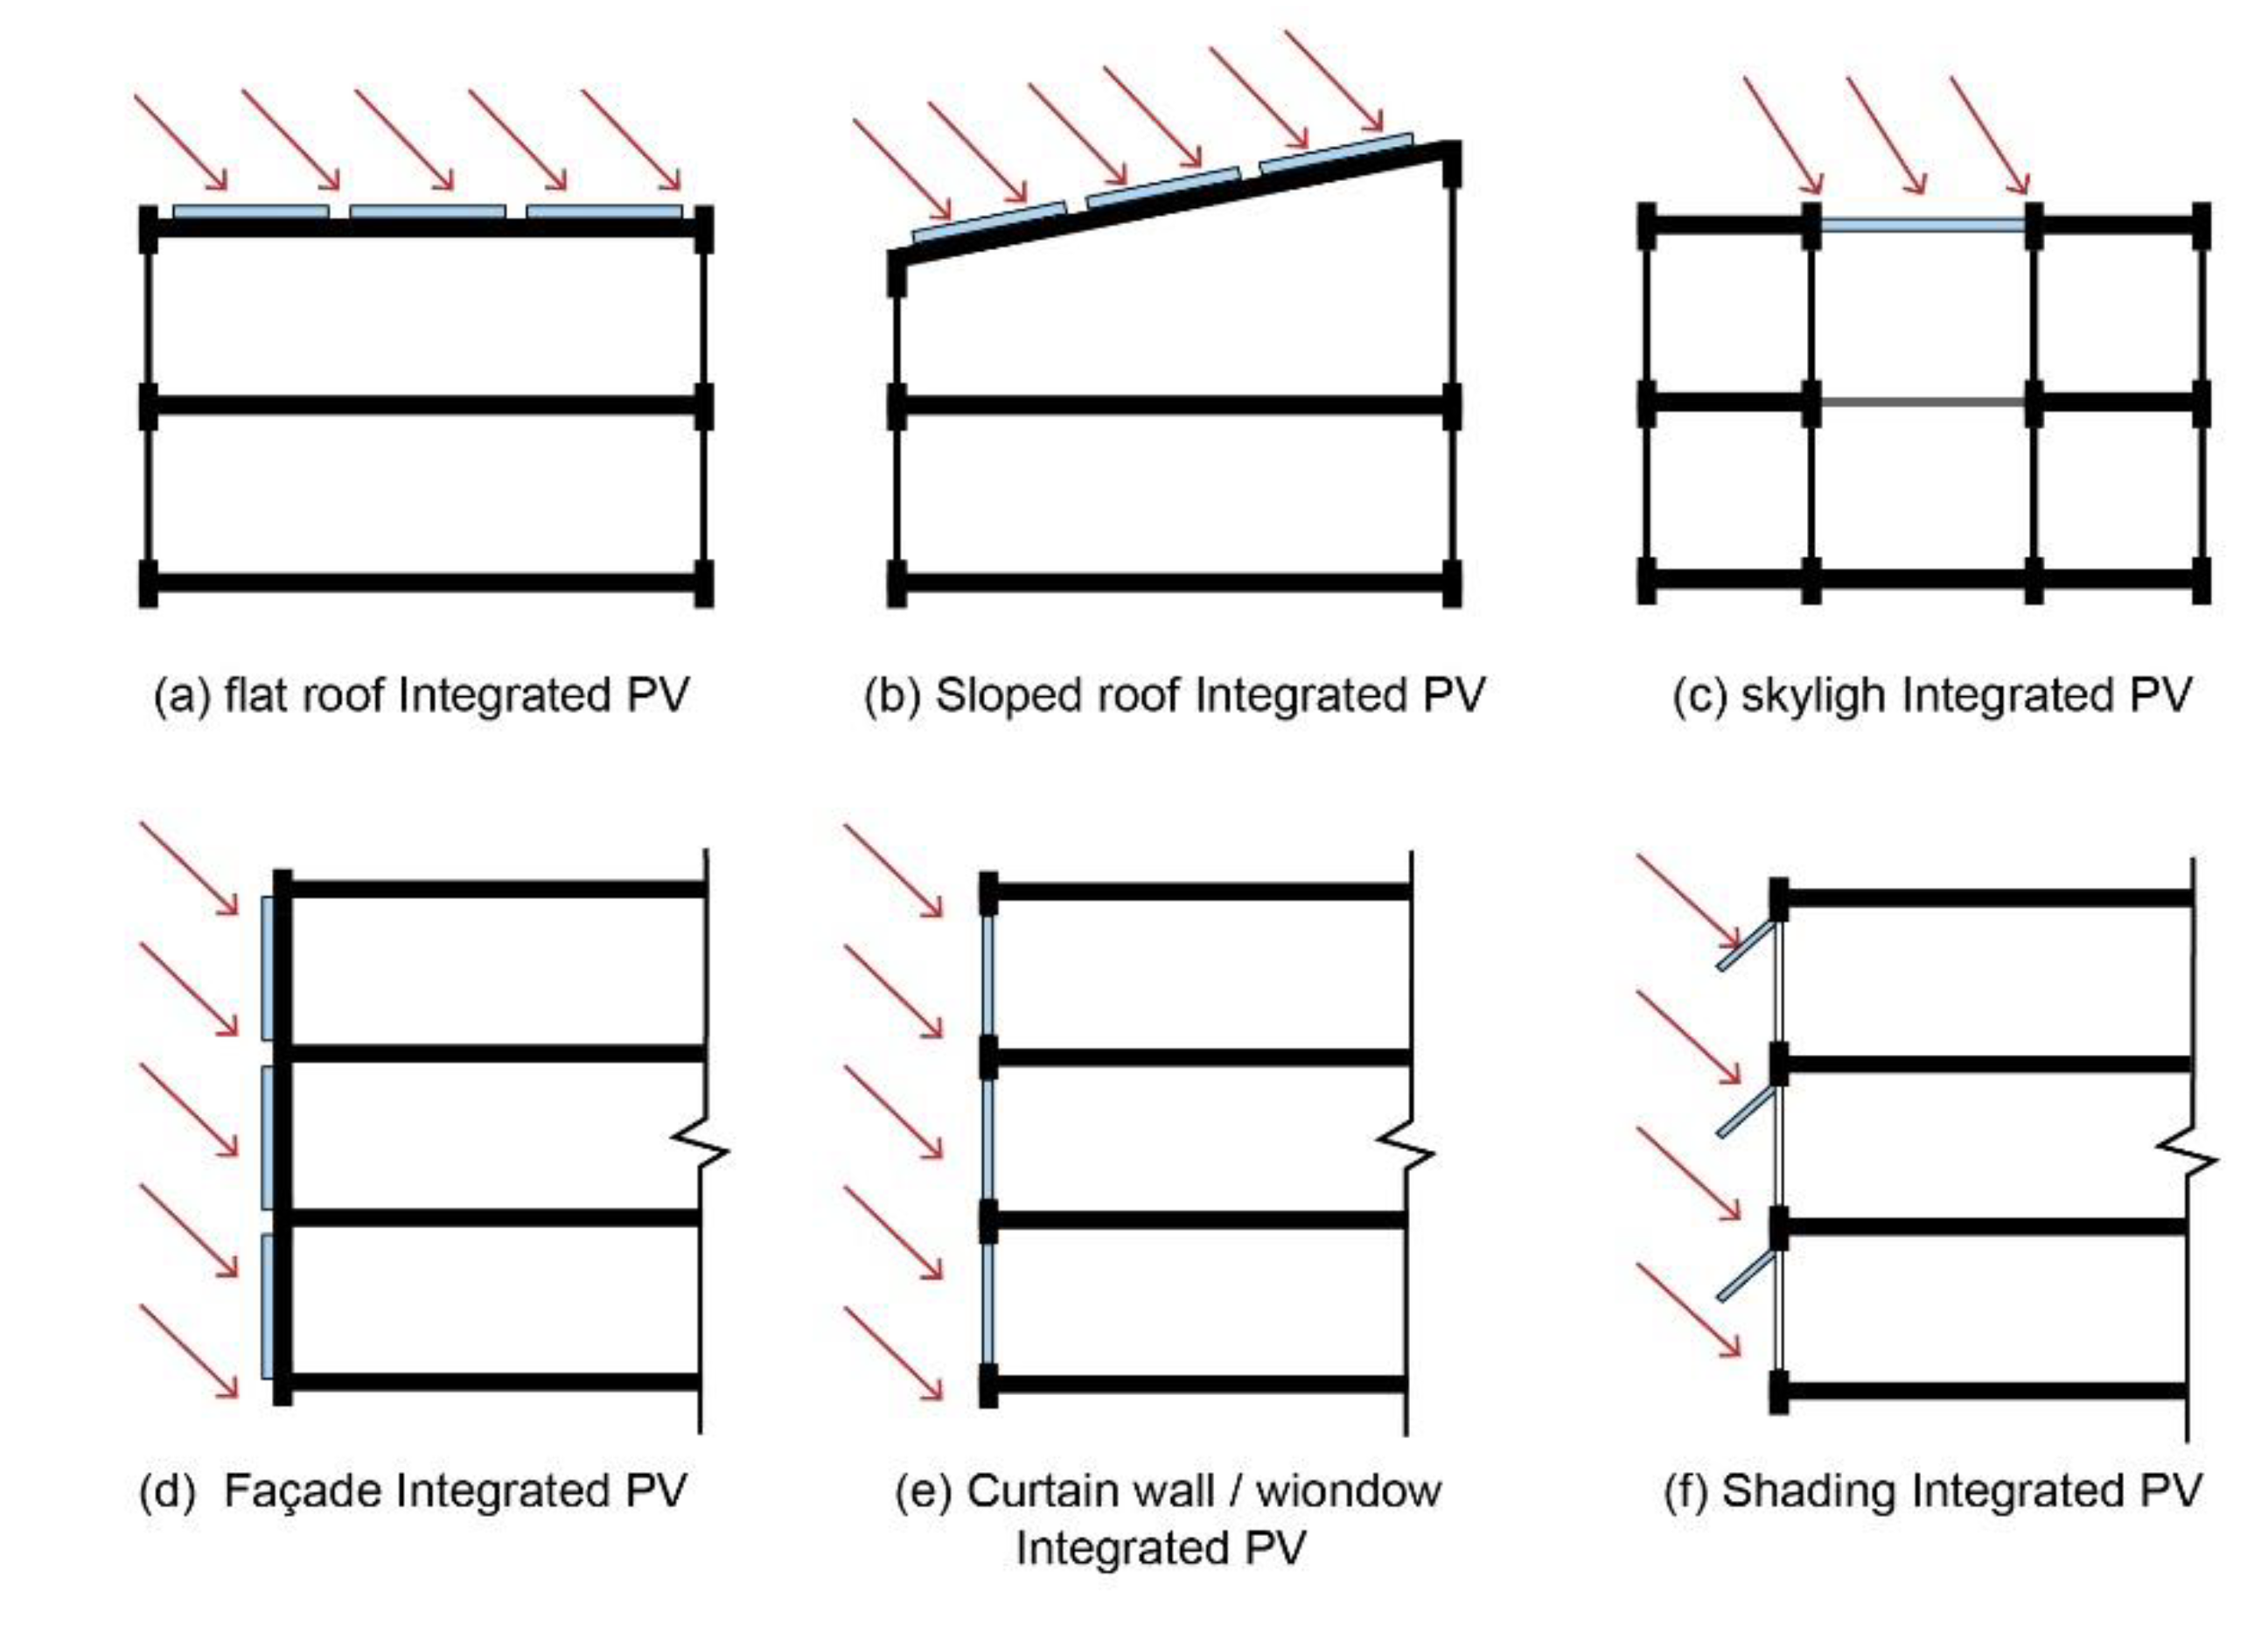
Figure 2.
The process of PV glazing influence on building energy consumption.
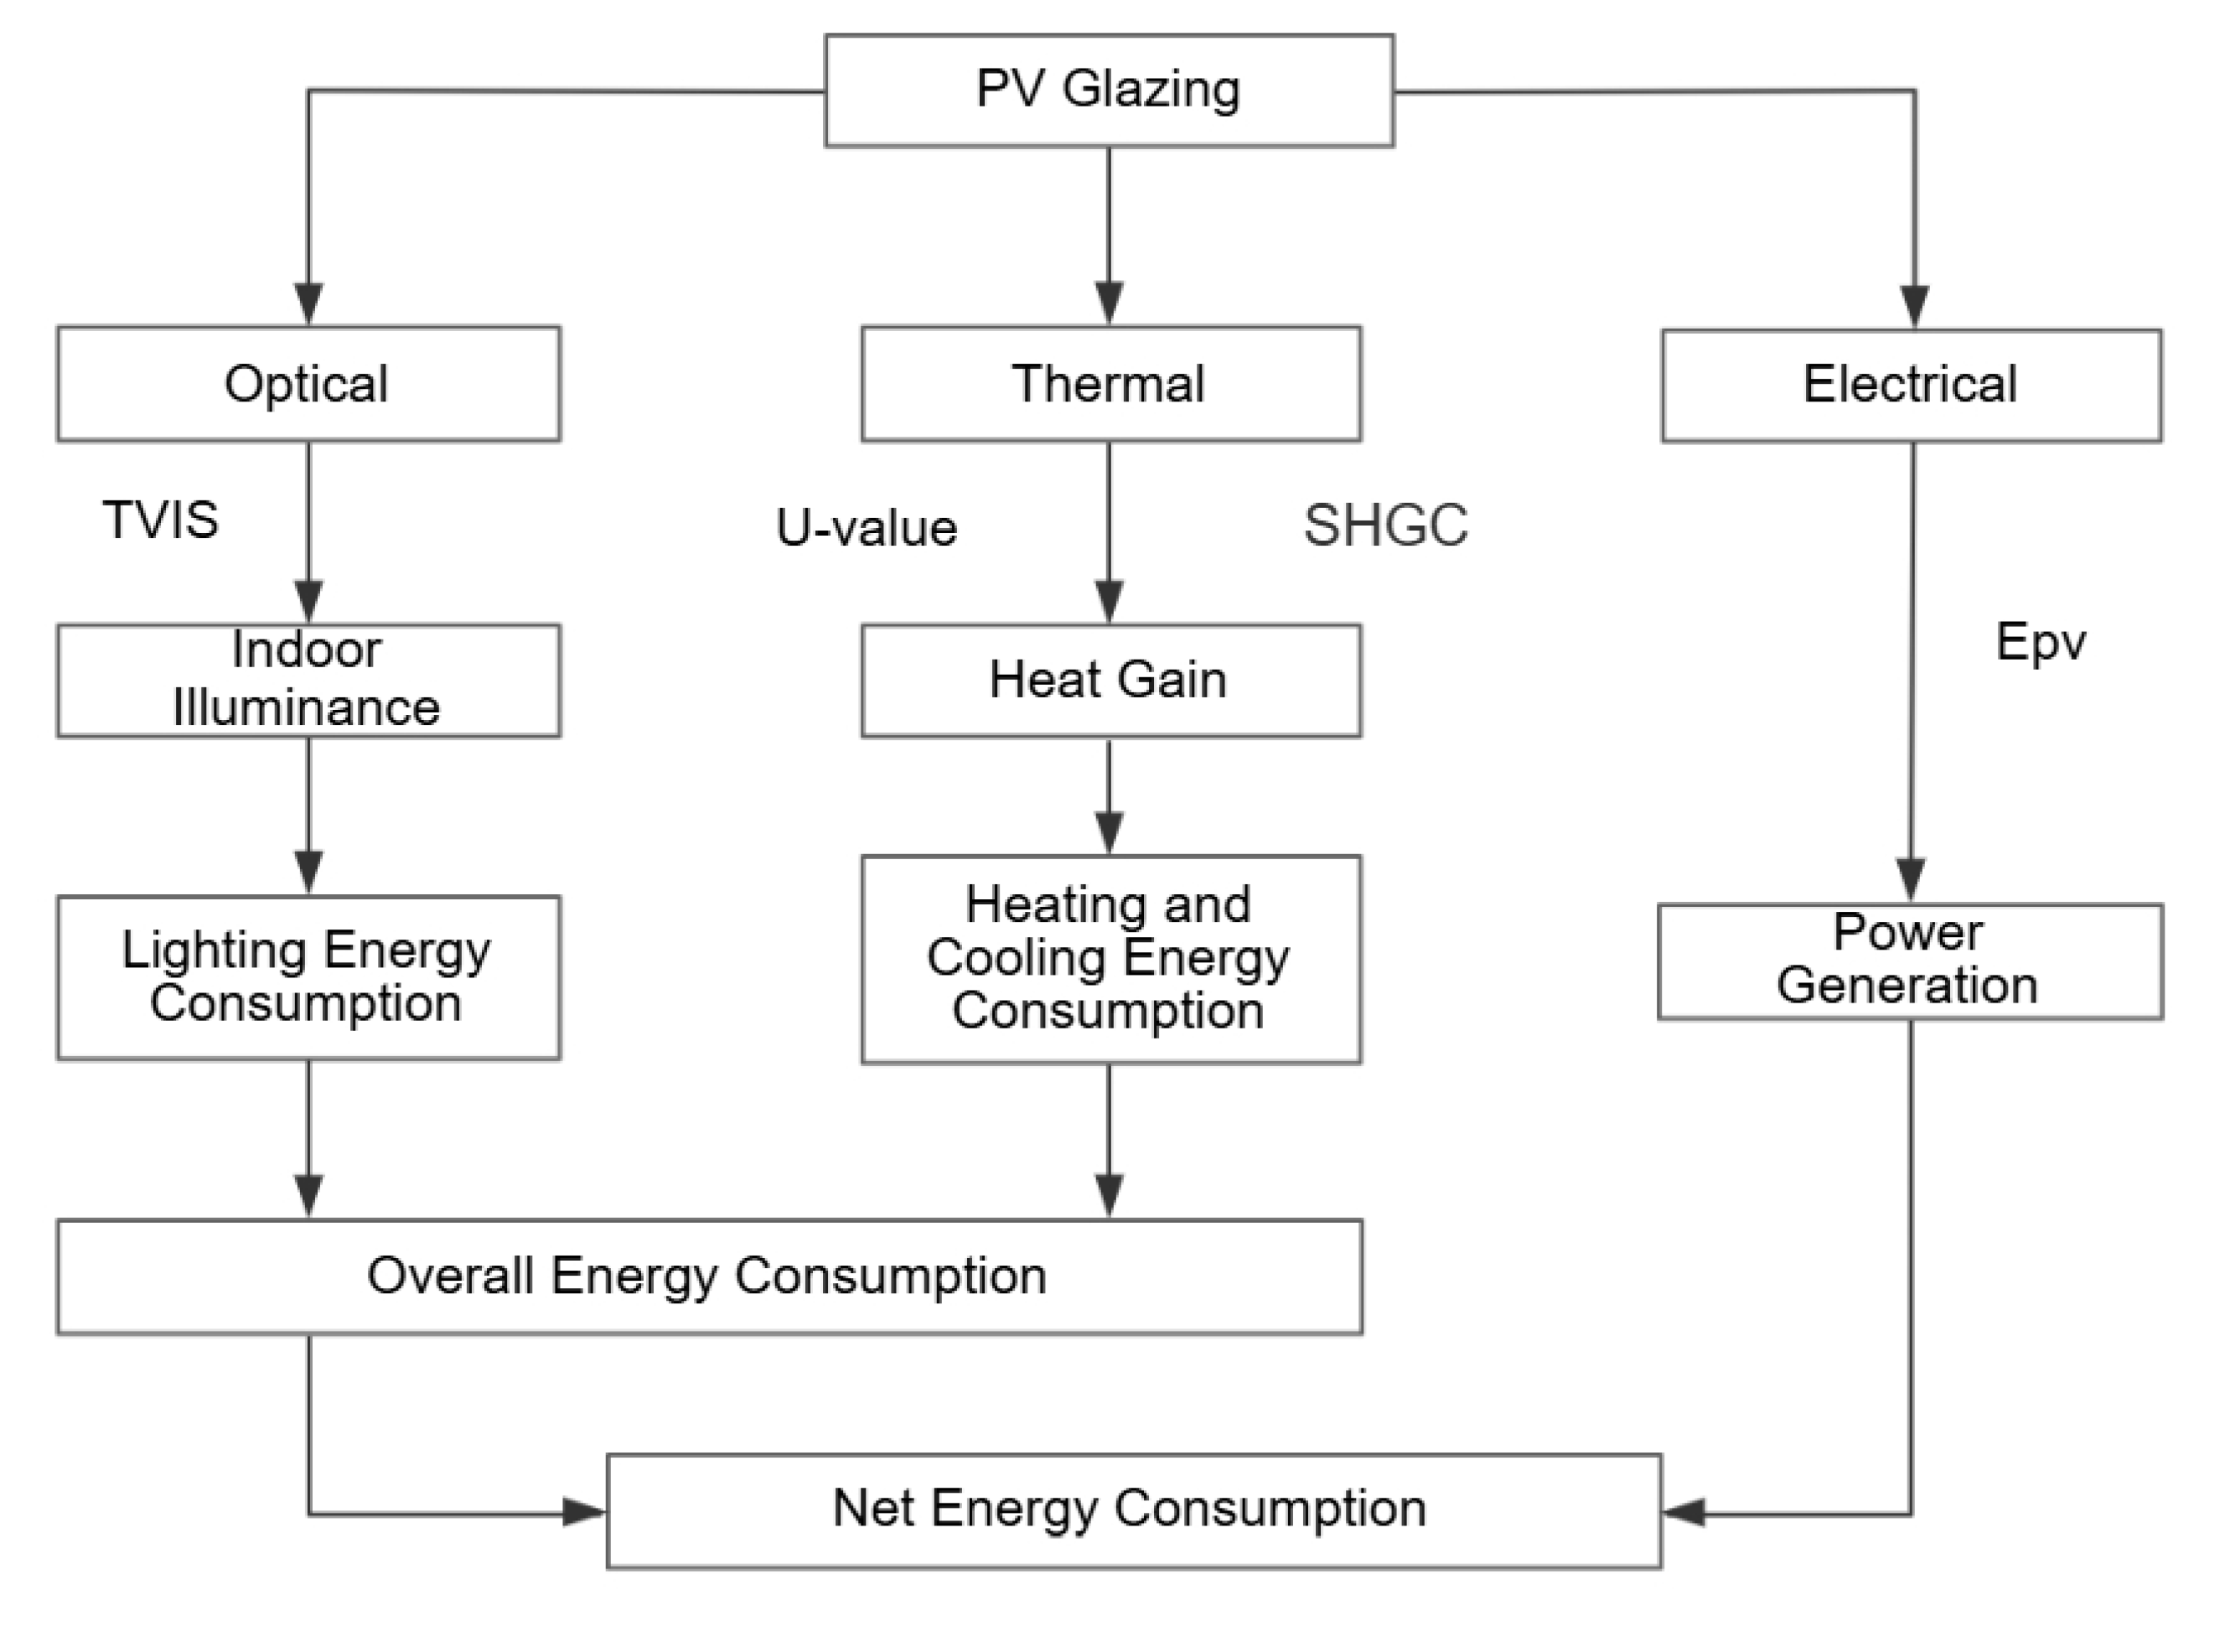
Figure 3.
Framework of simulating the energy consumption.
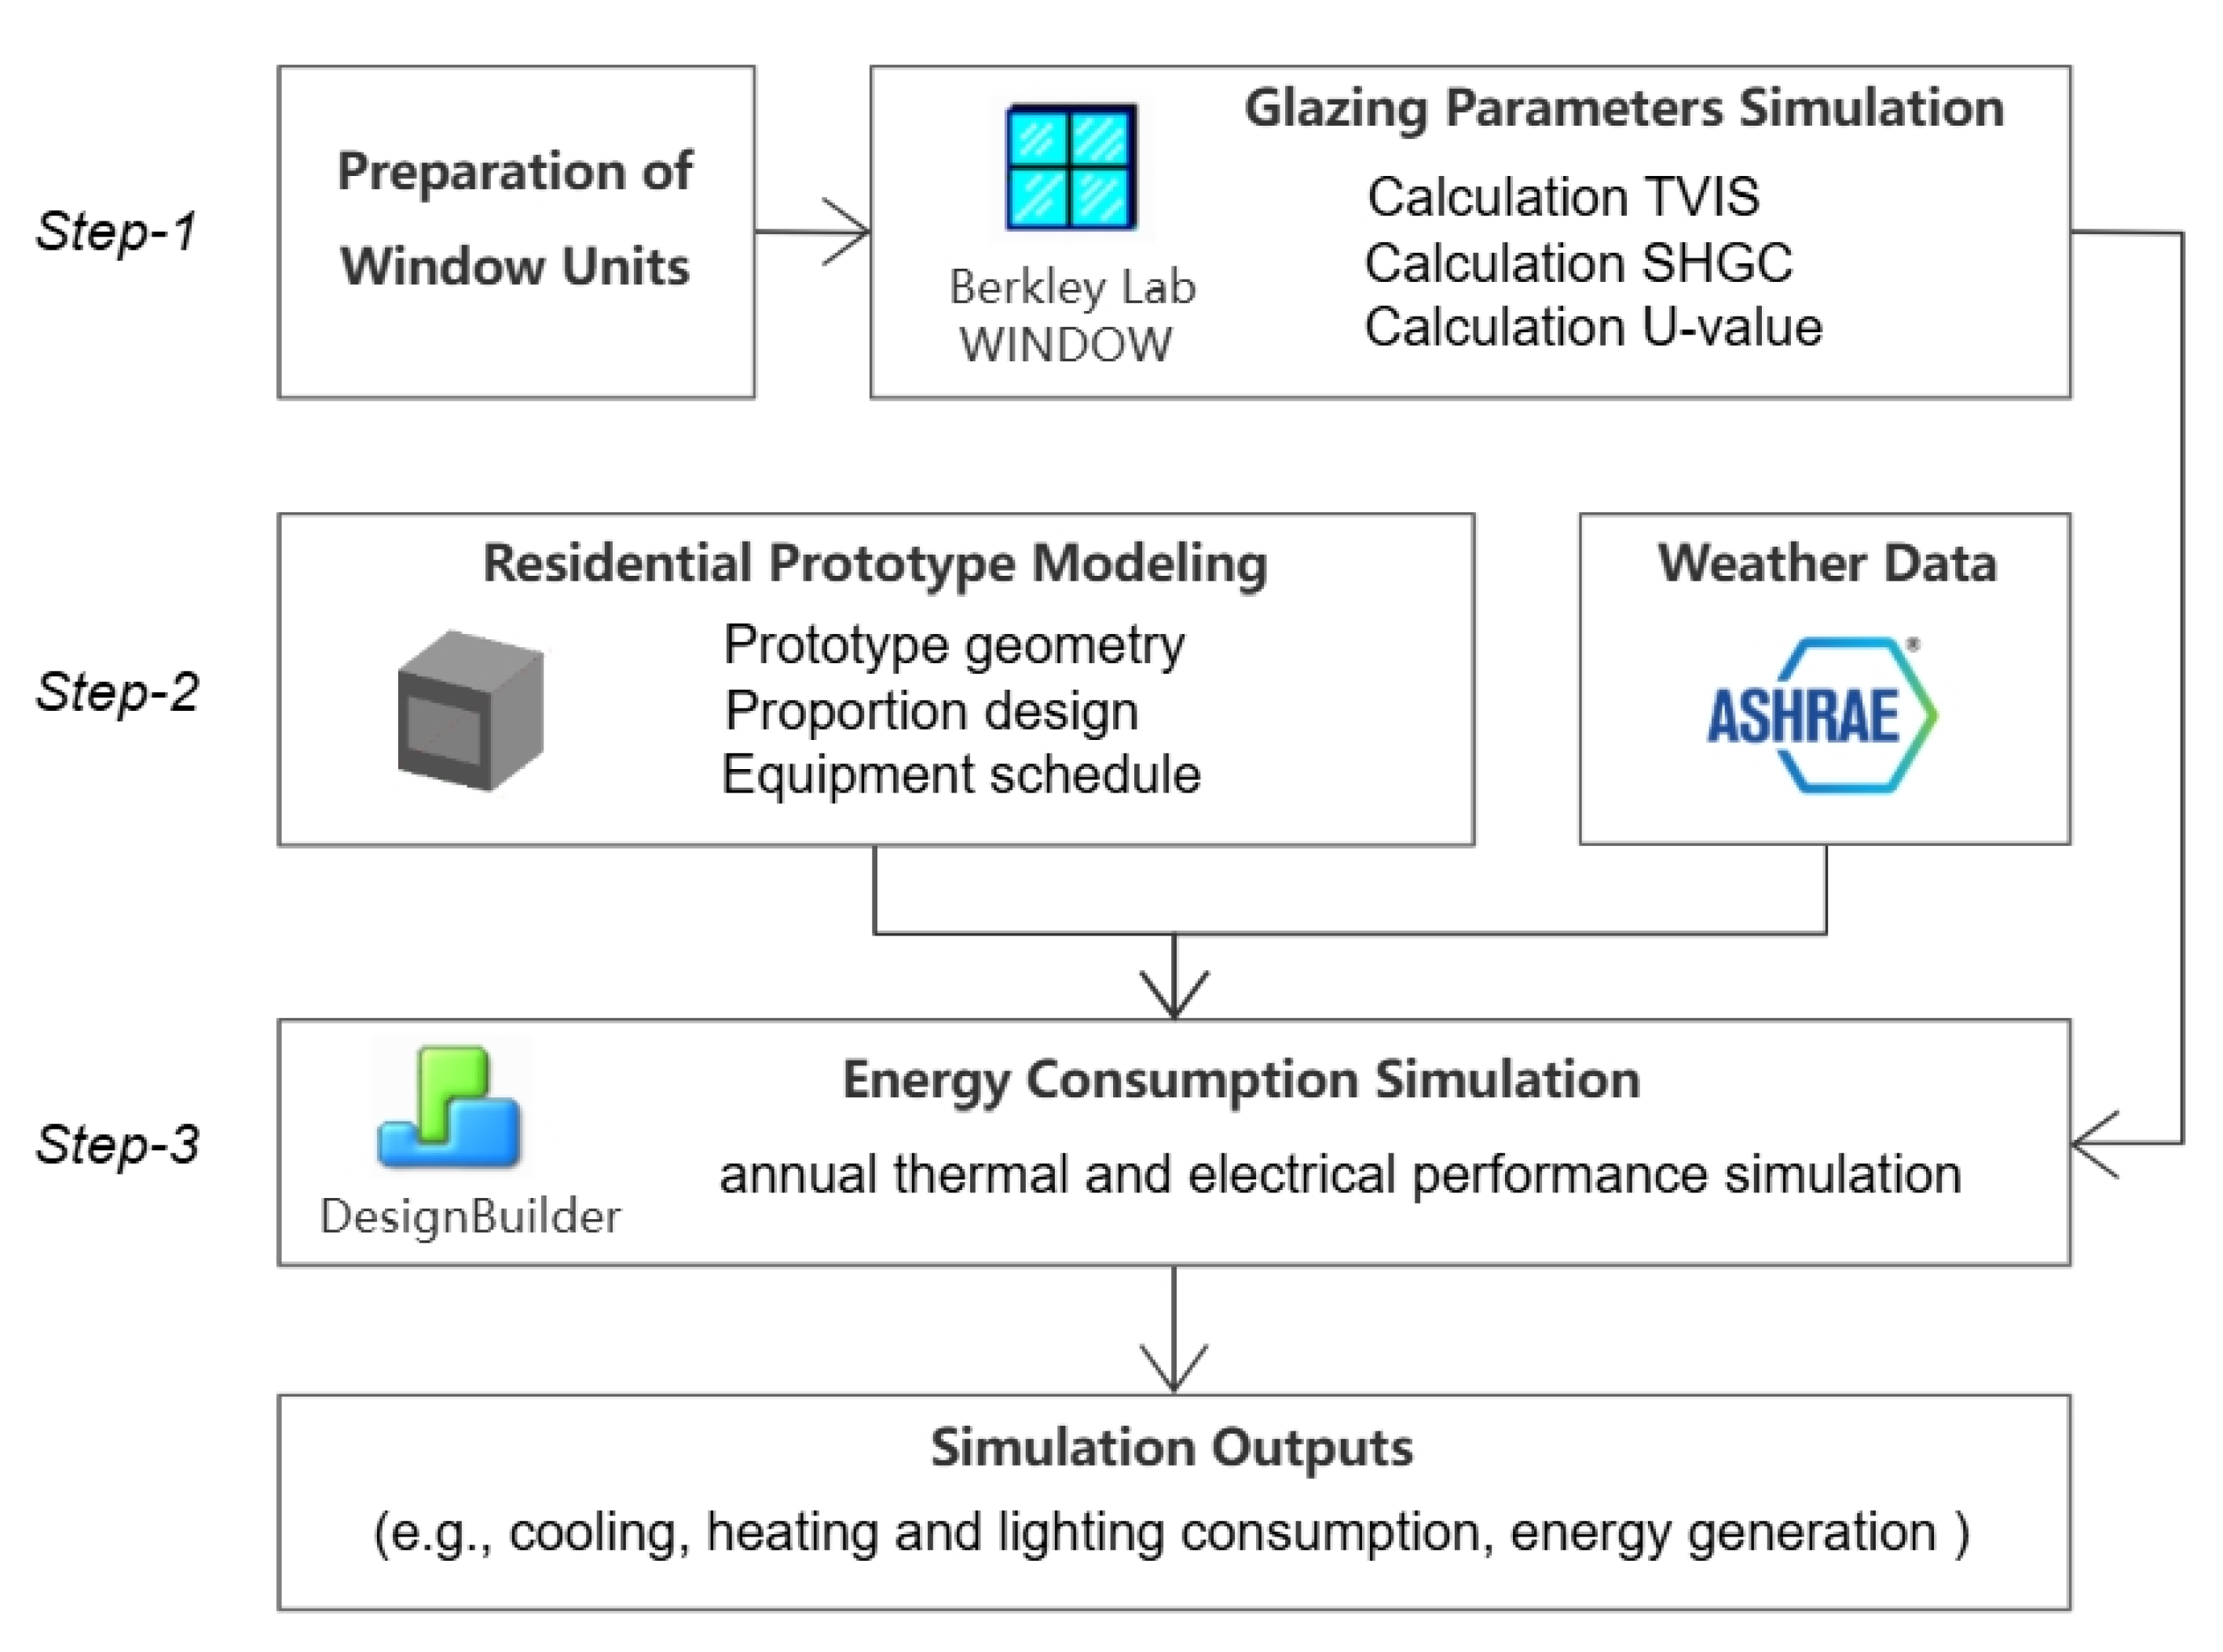
Figure 4.
Scenarios of window proportion design.
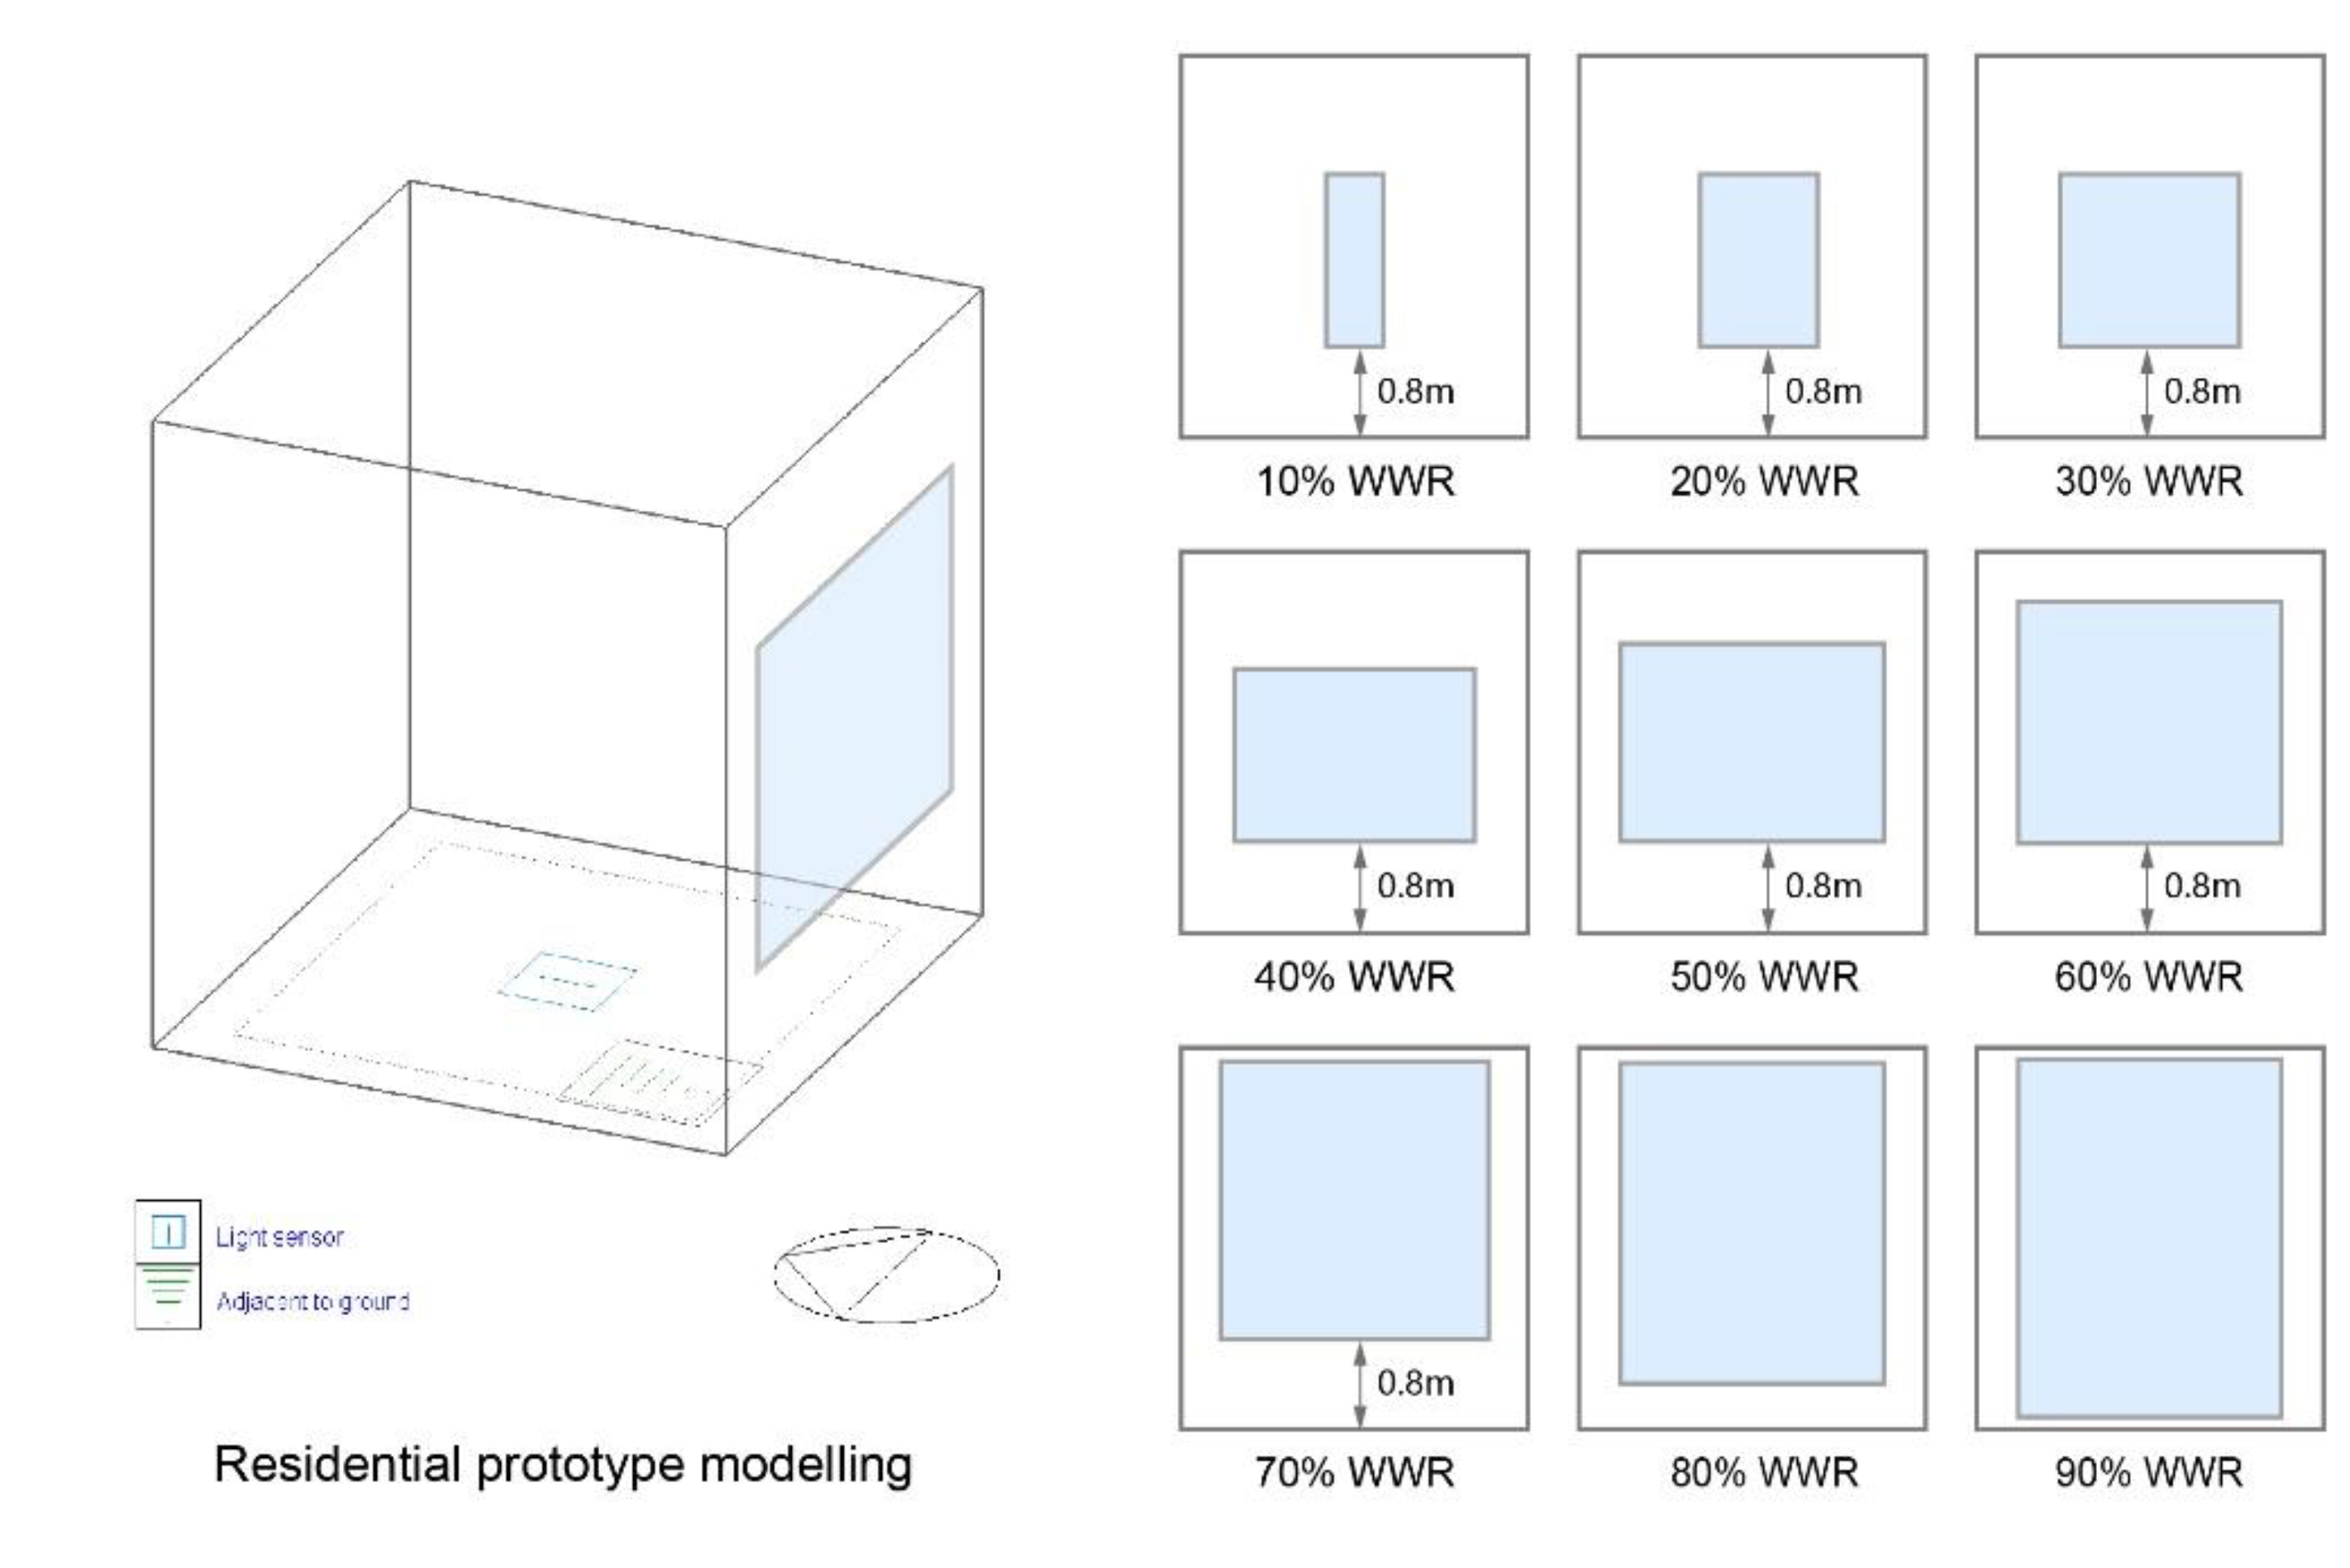
Figure 5.
Weather data for Lhasa.
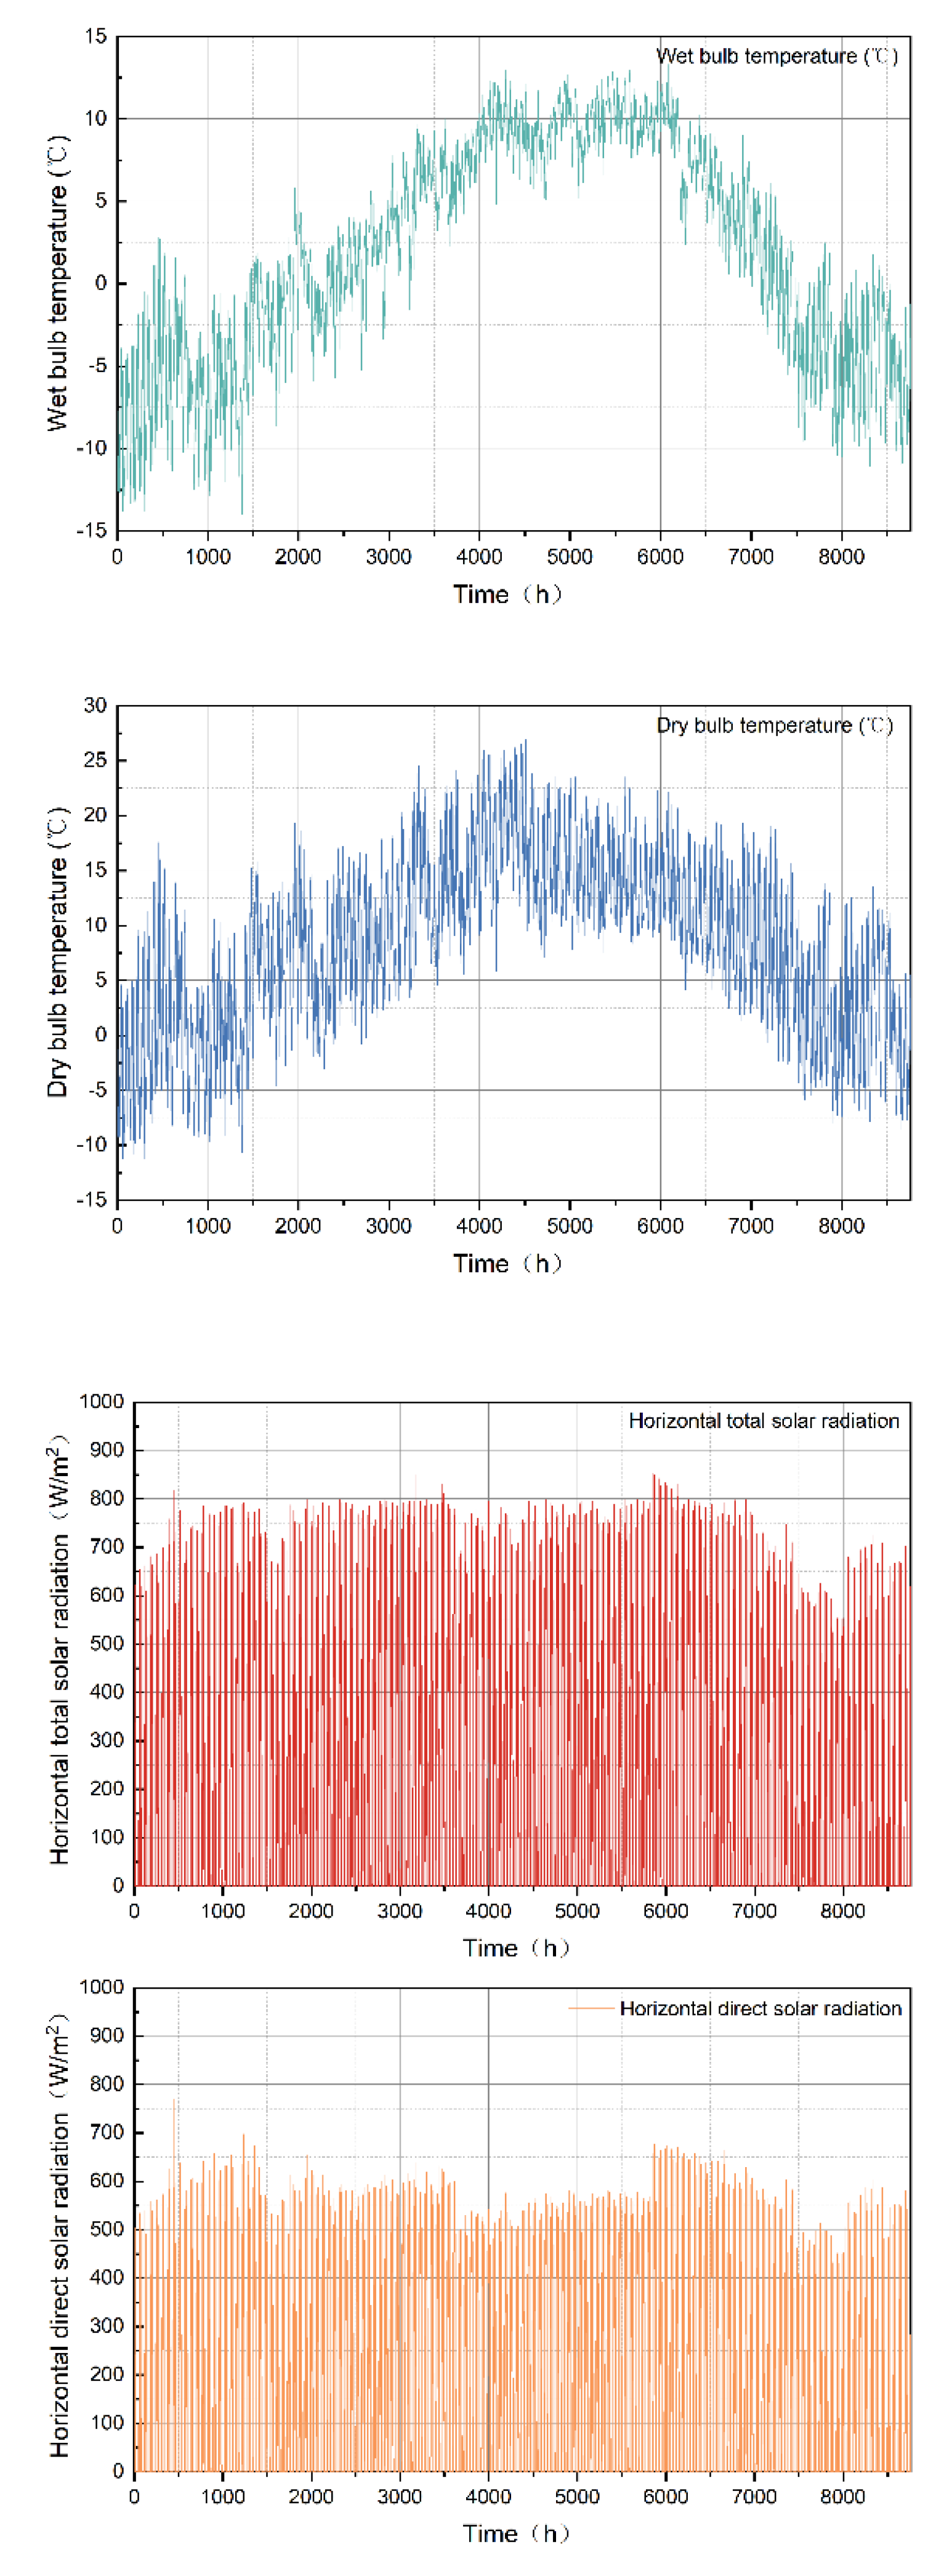
Figure 6.
Energy performance of typical windows.
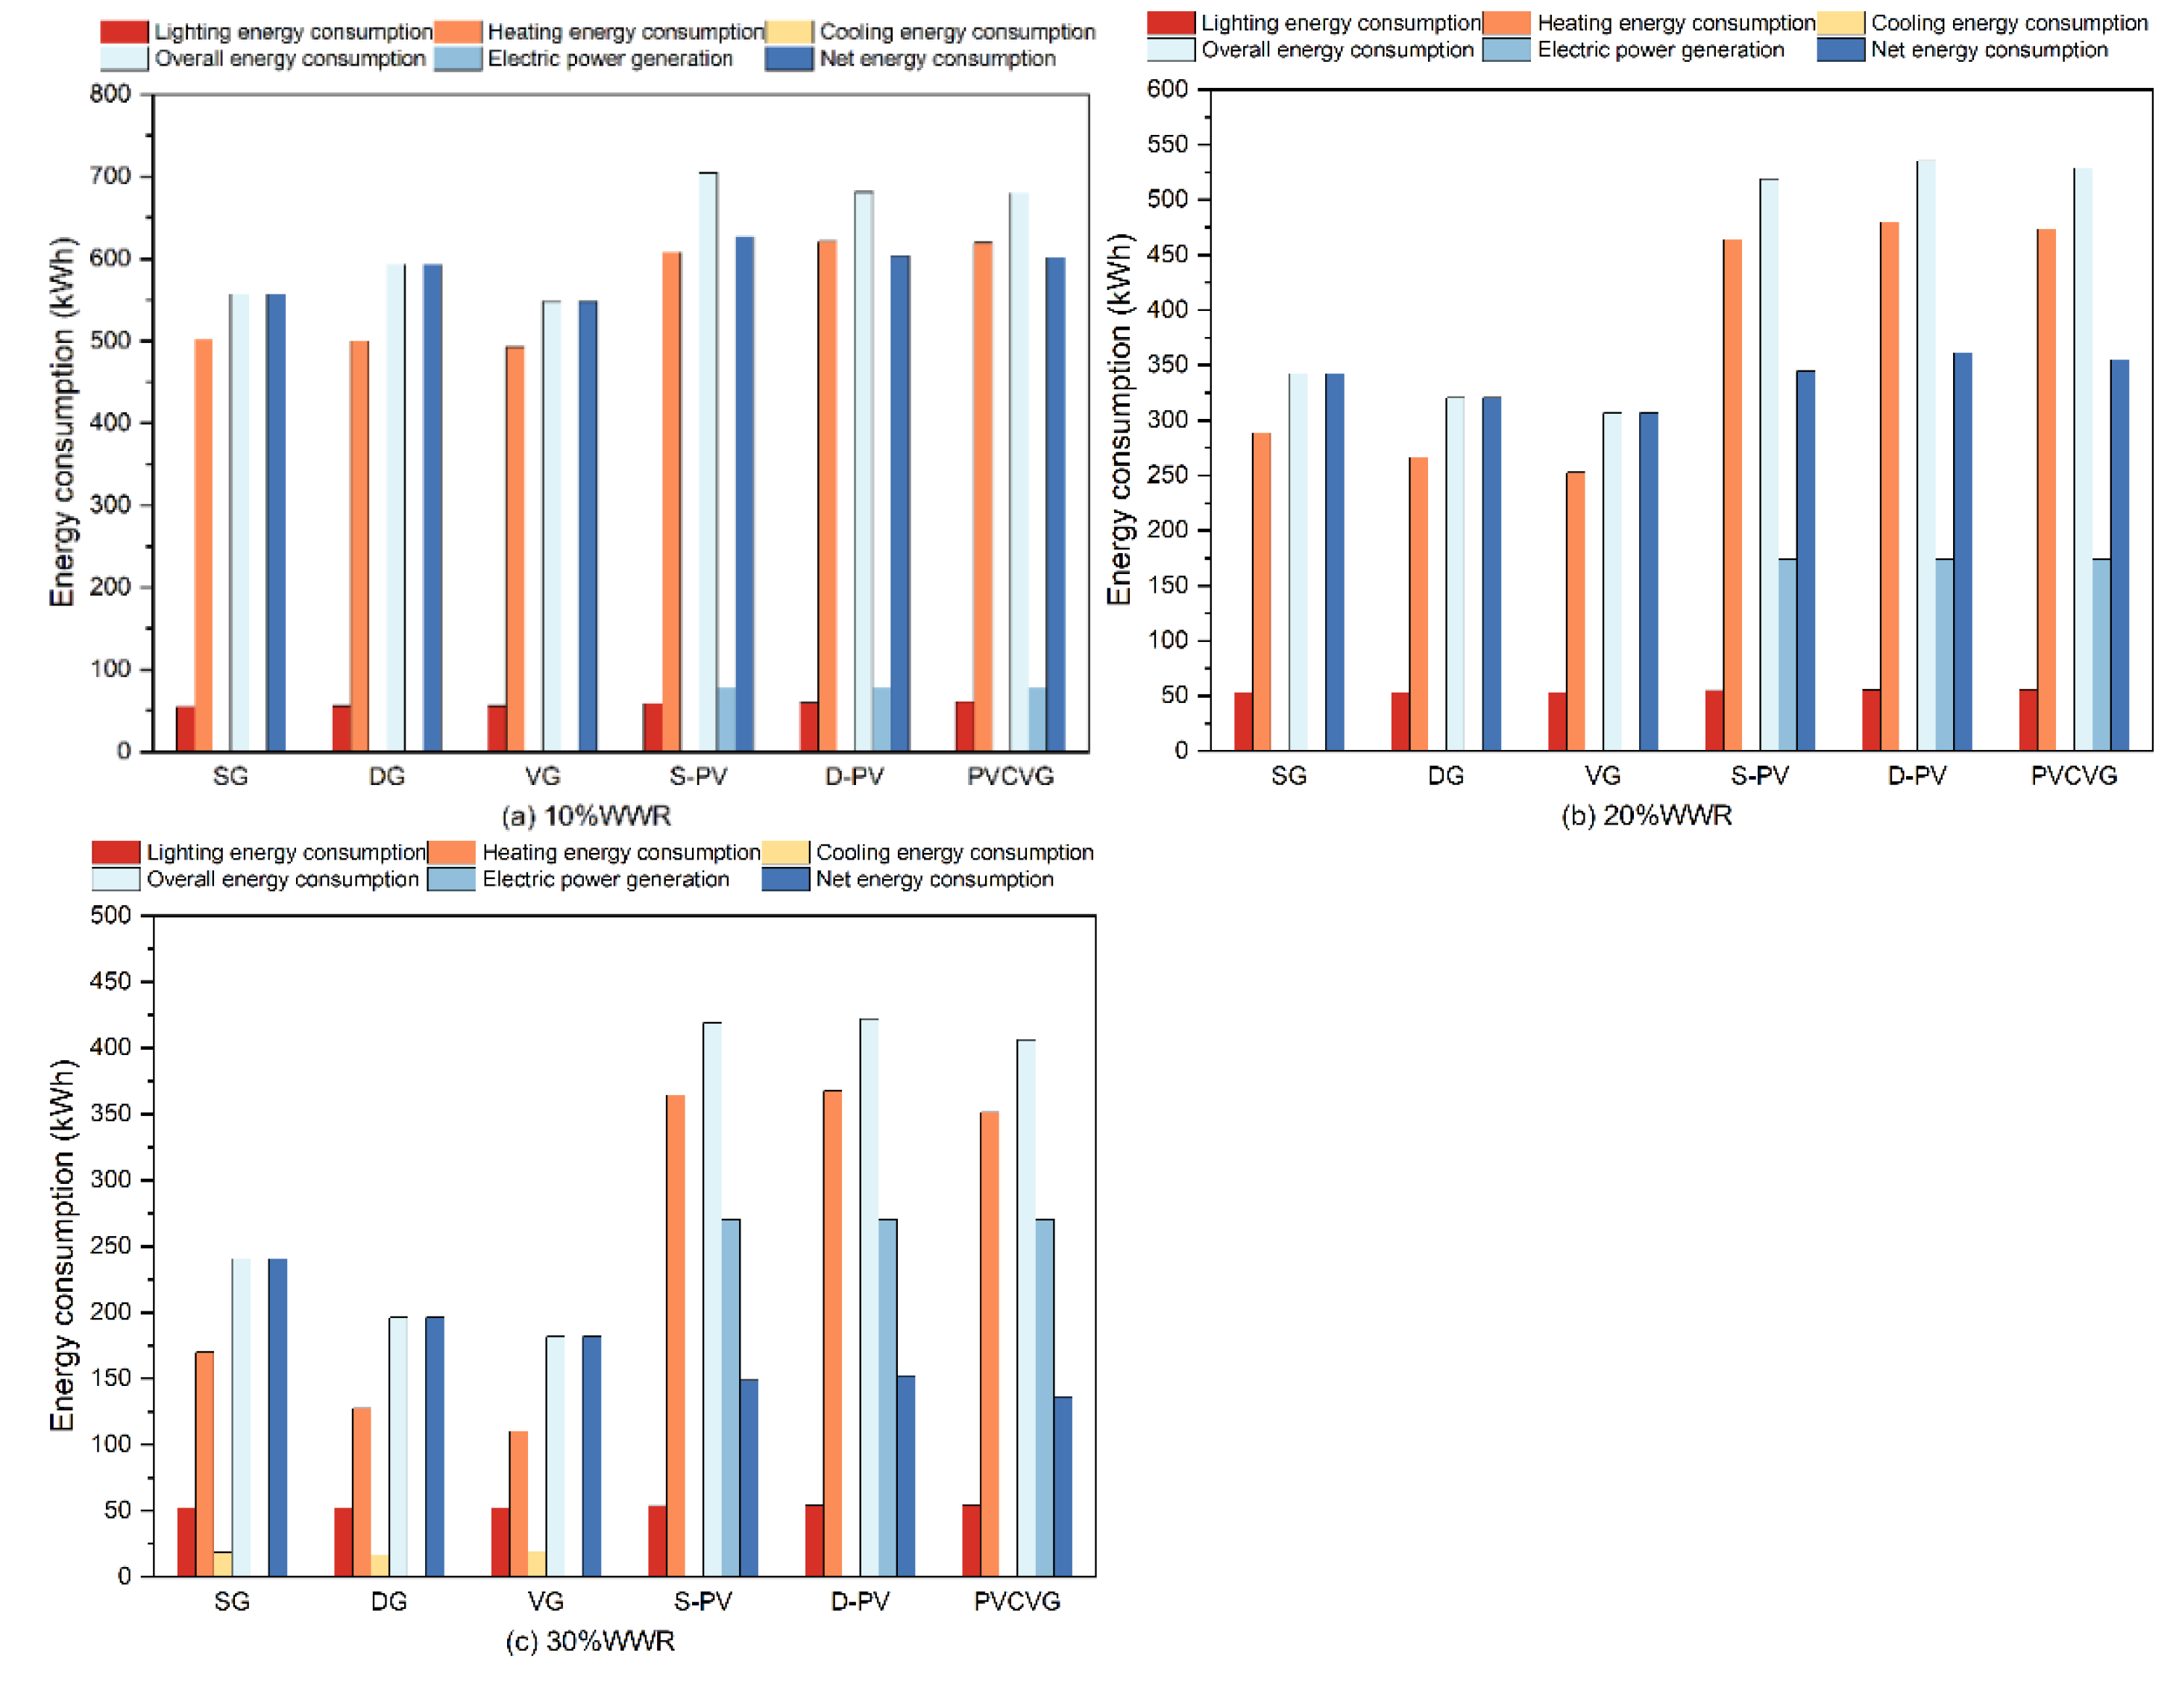
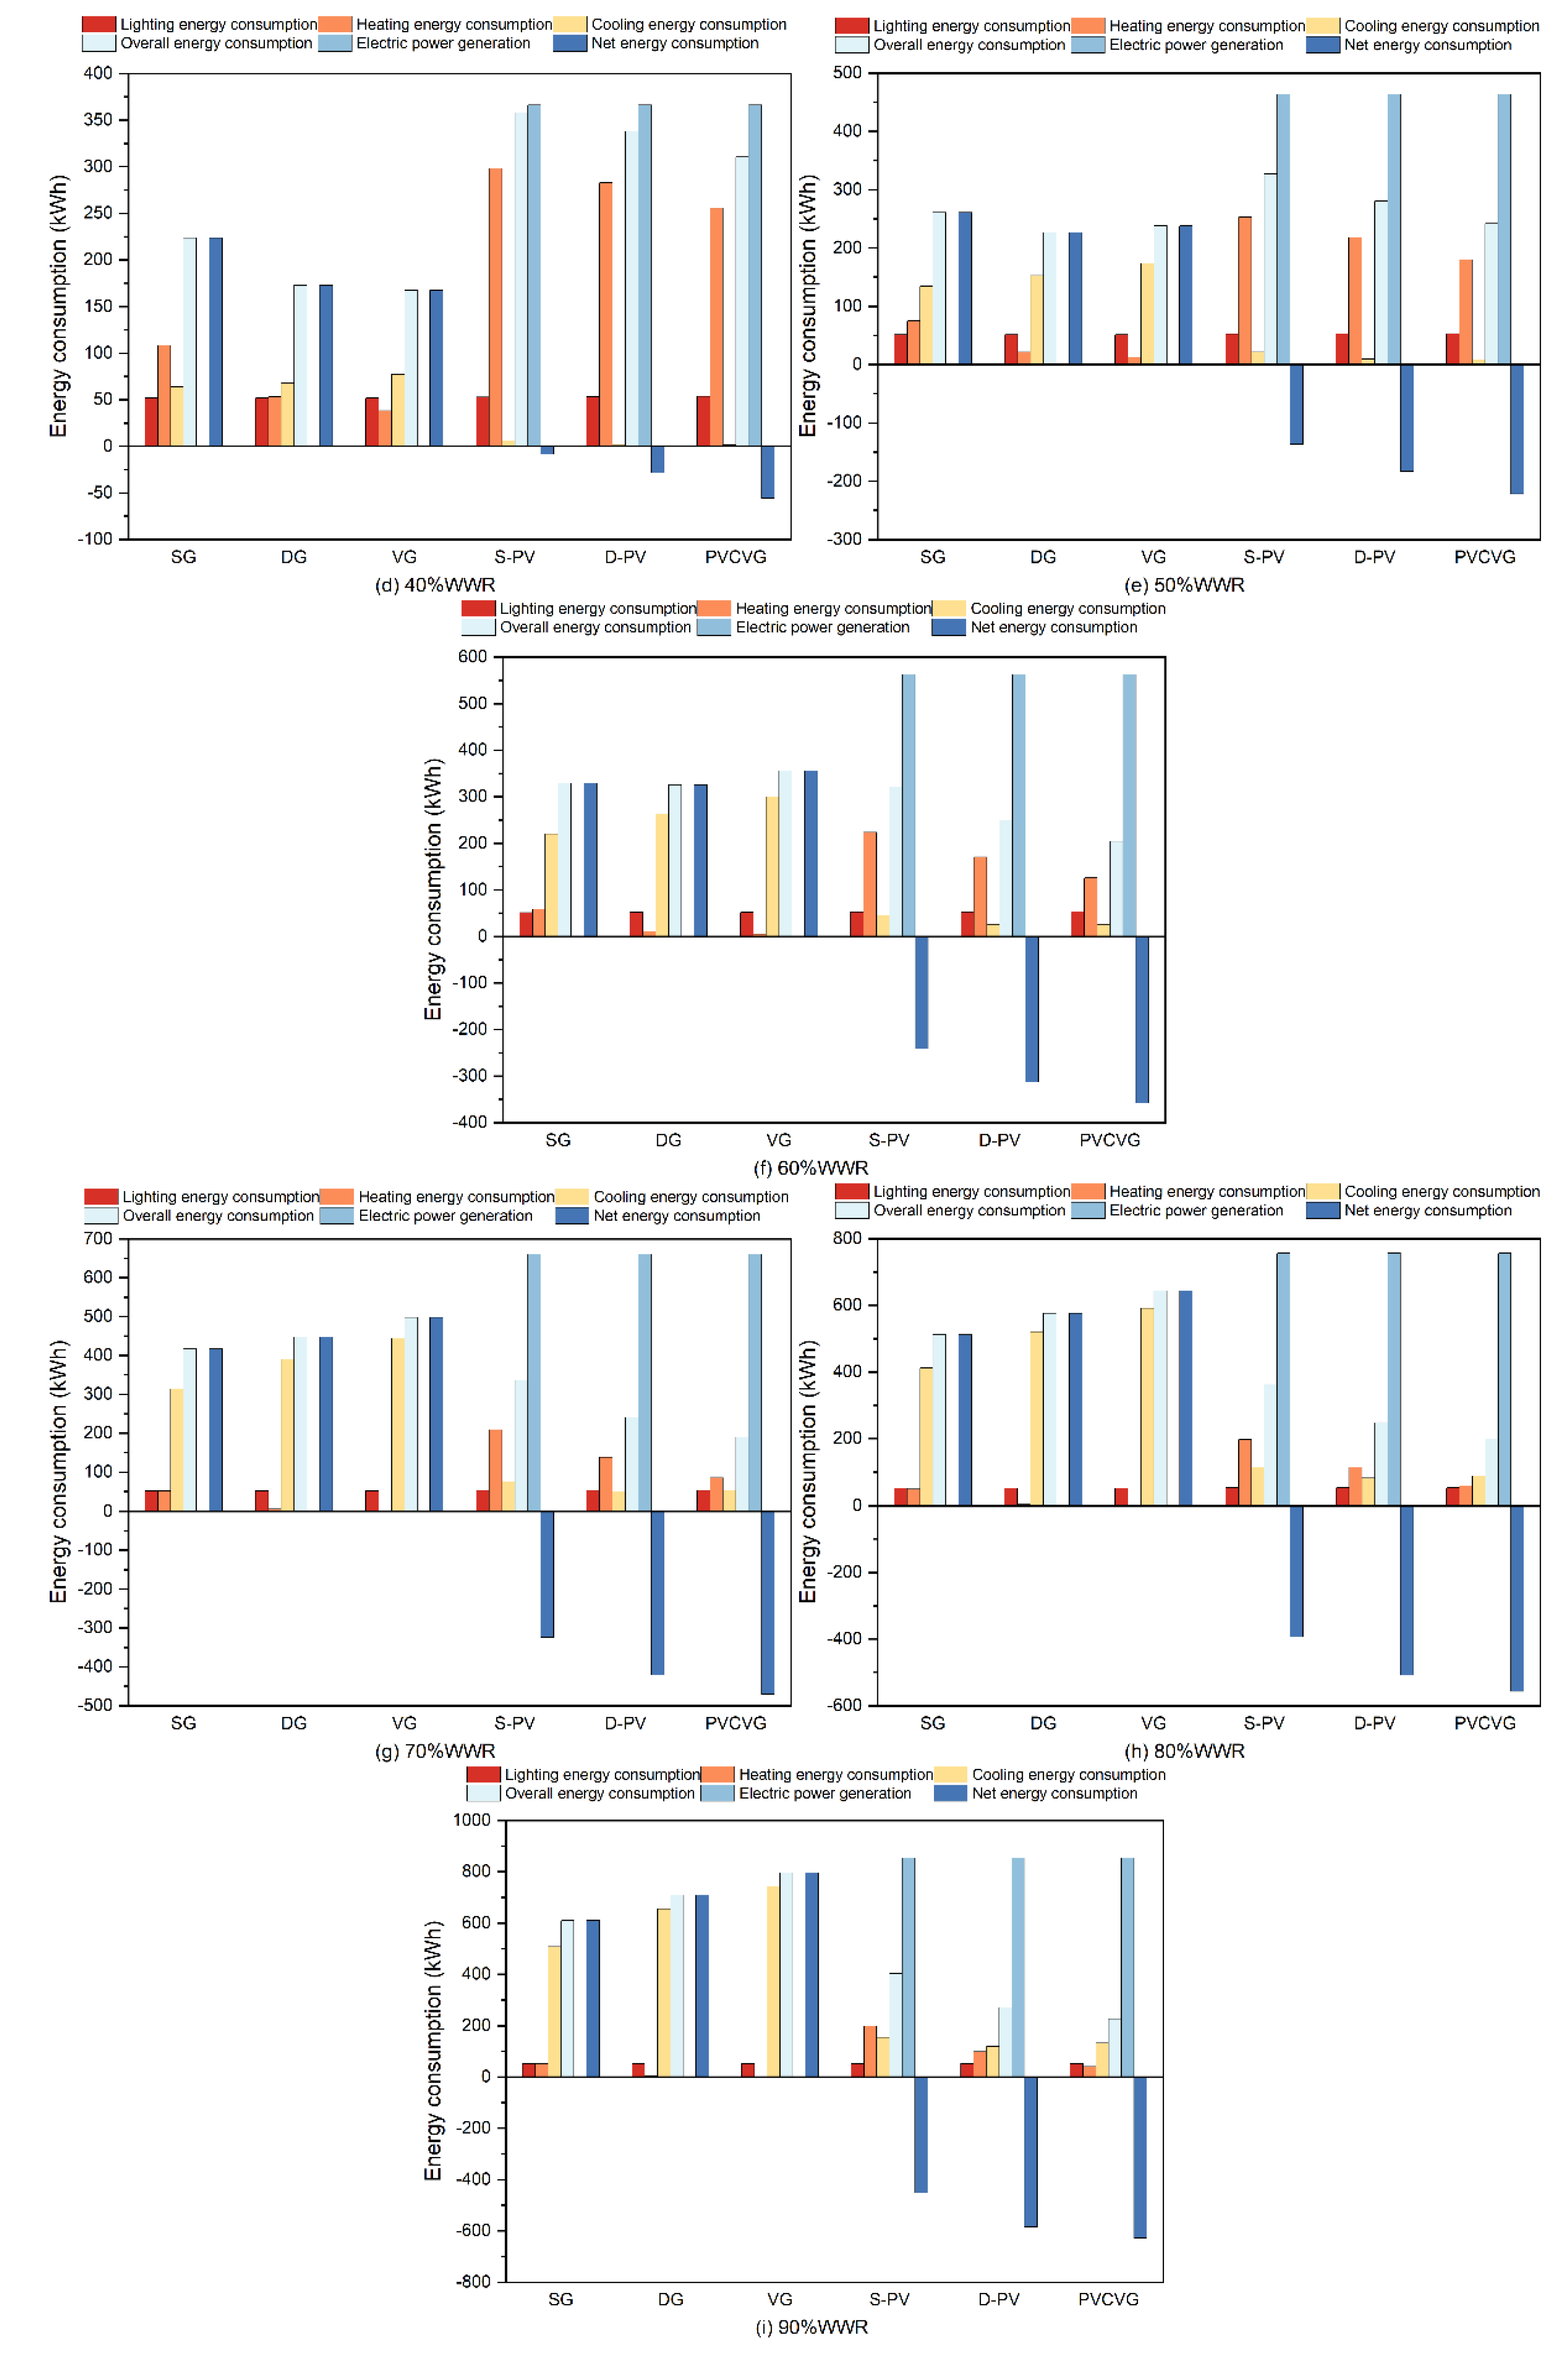
Figure 7.
lighting energy consumption of PVCVG.
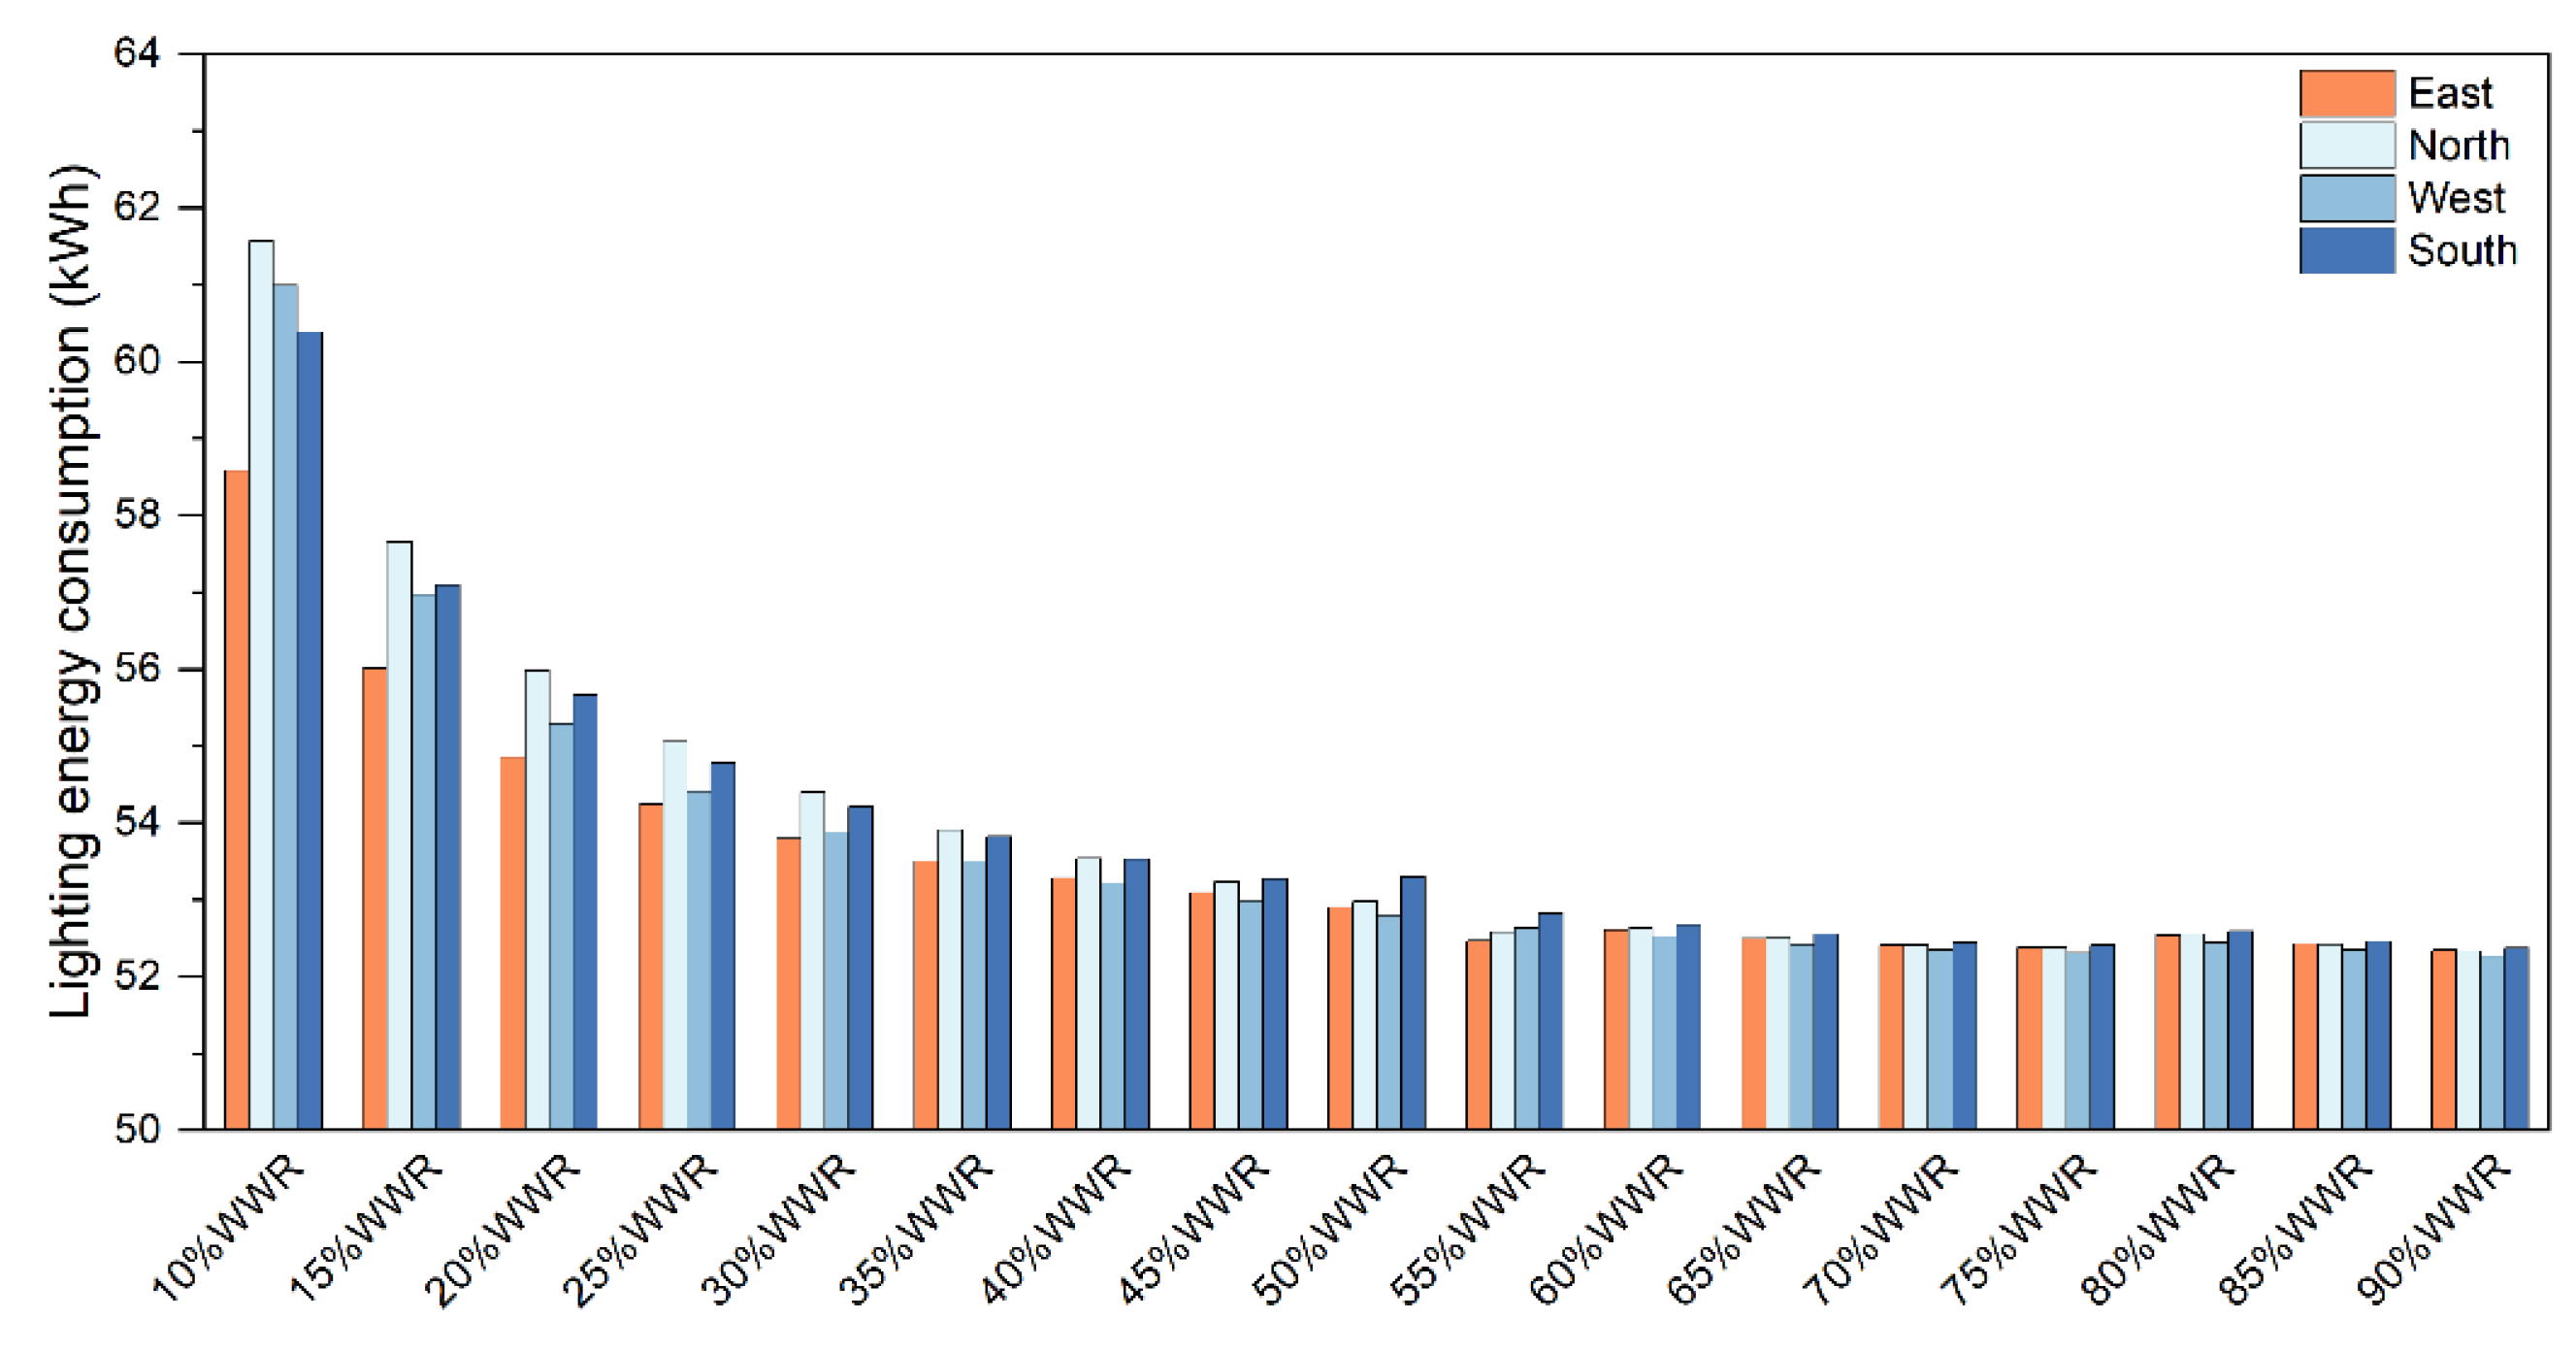
Figure 8.
Heating energy consumption of PVCVG.
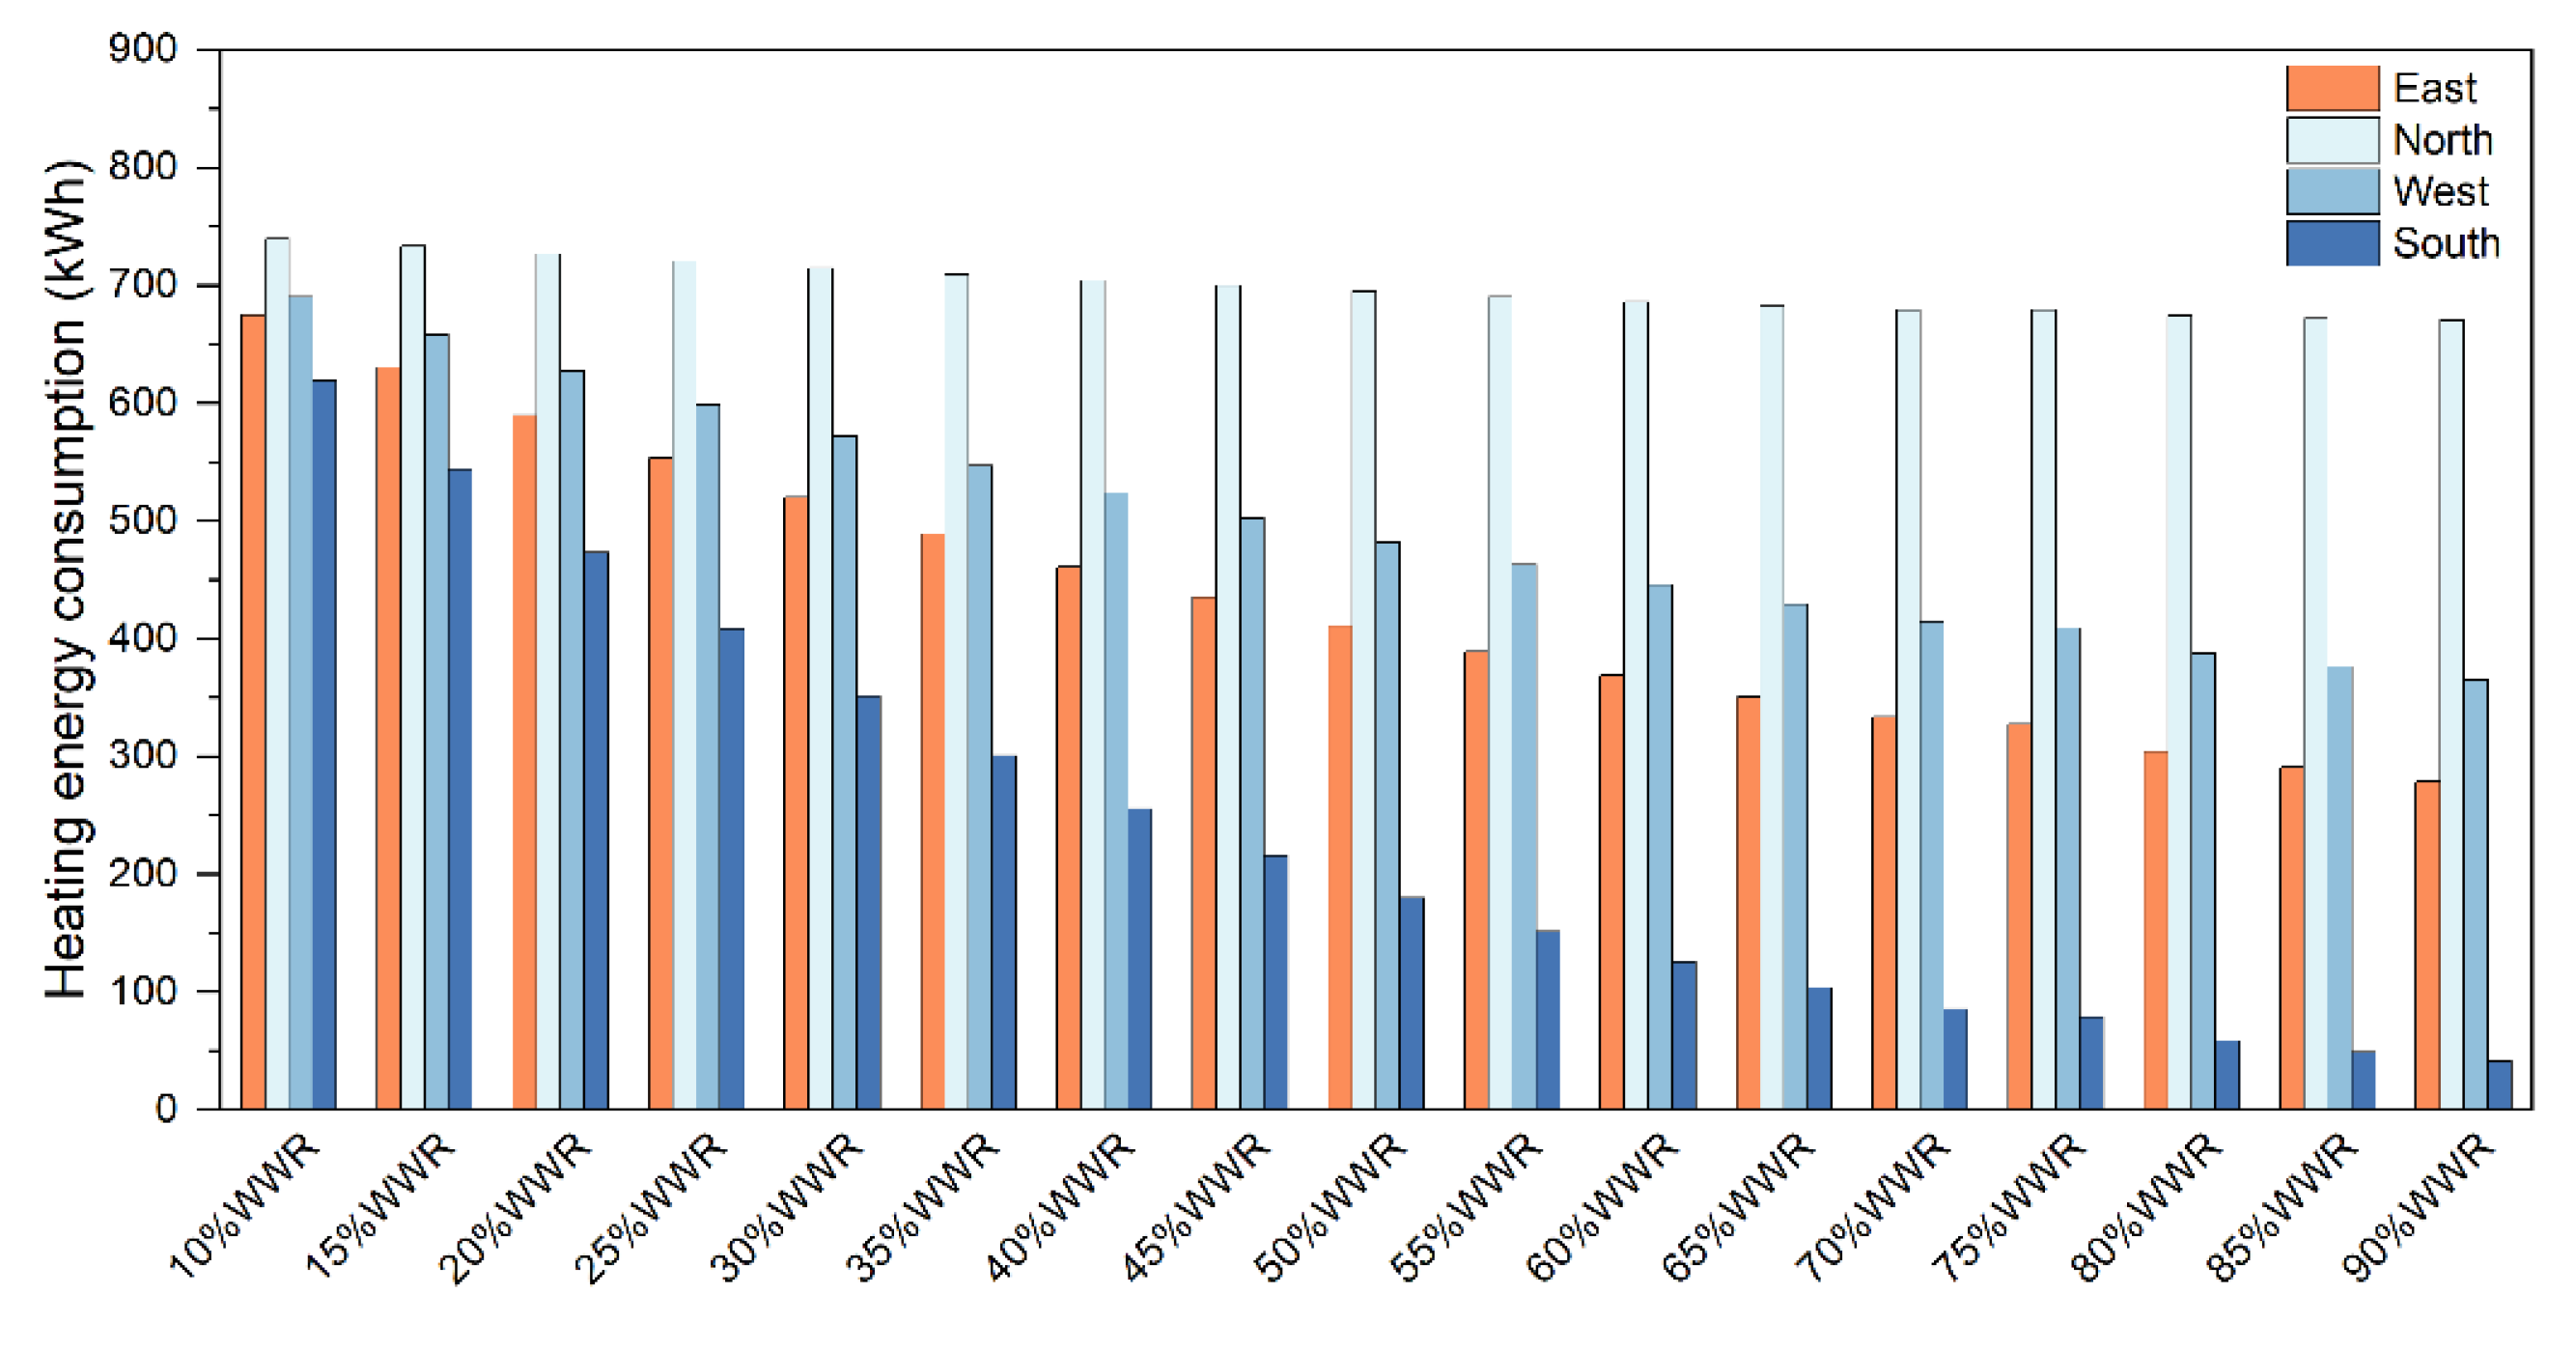
Figure 9.
Cooling energy consumption of PVCVG.
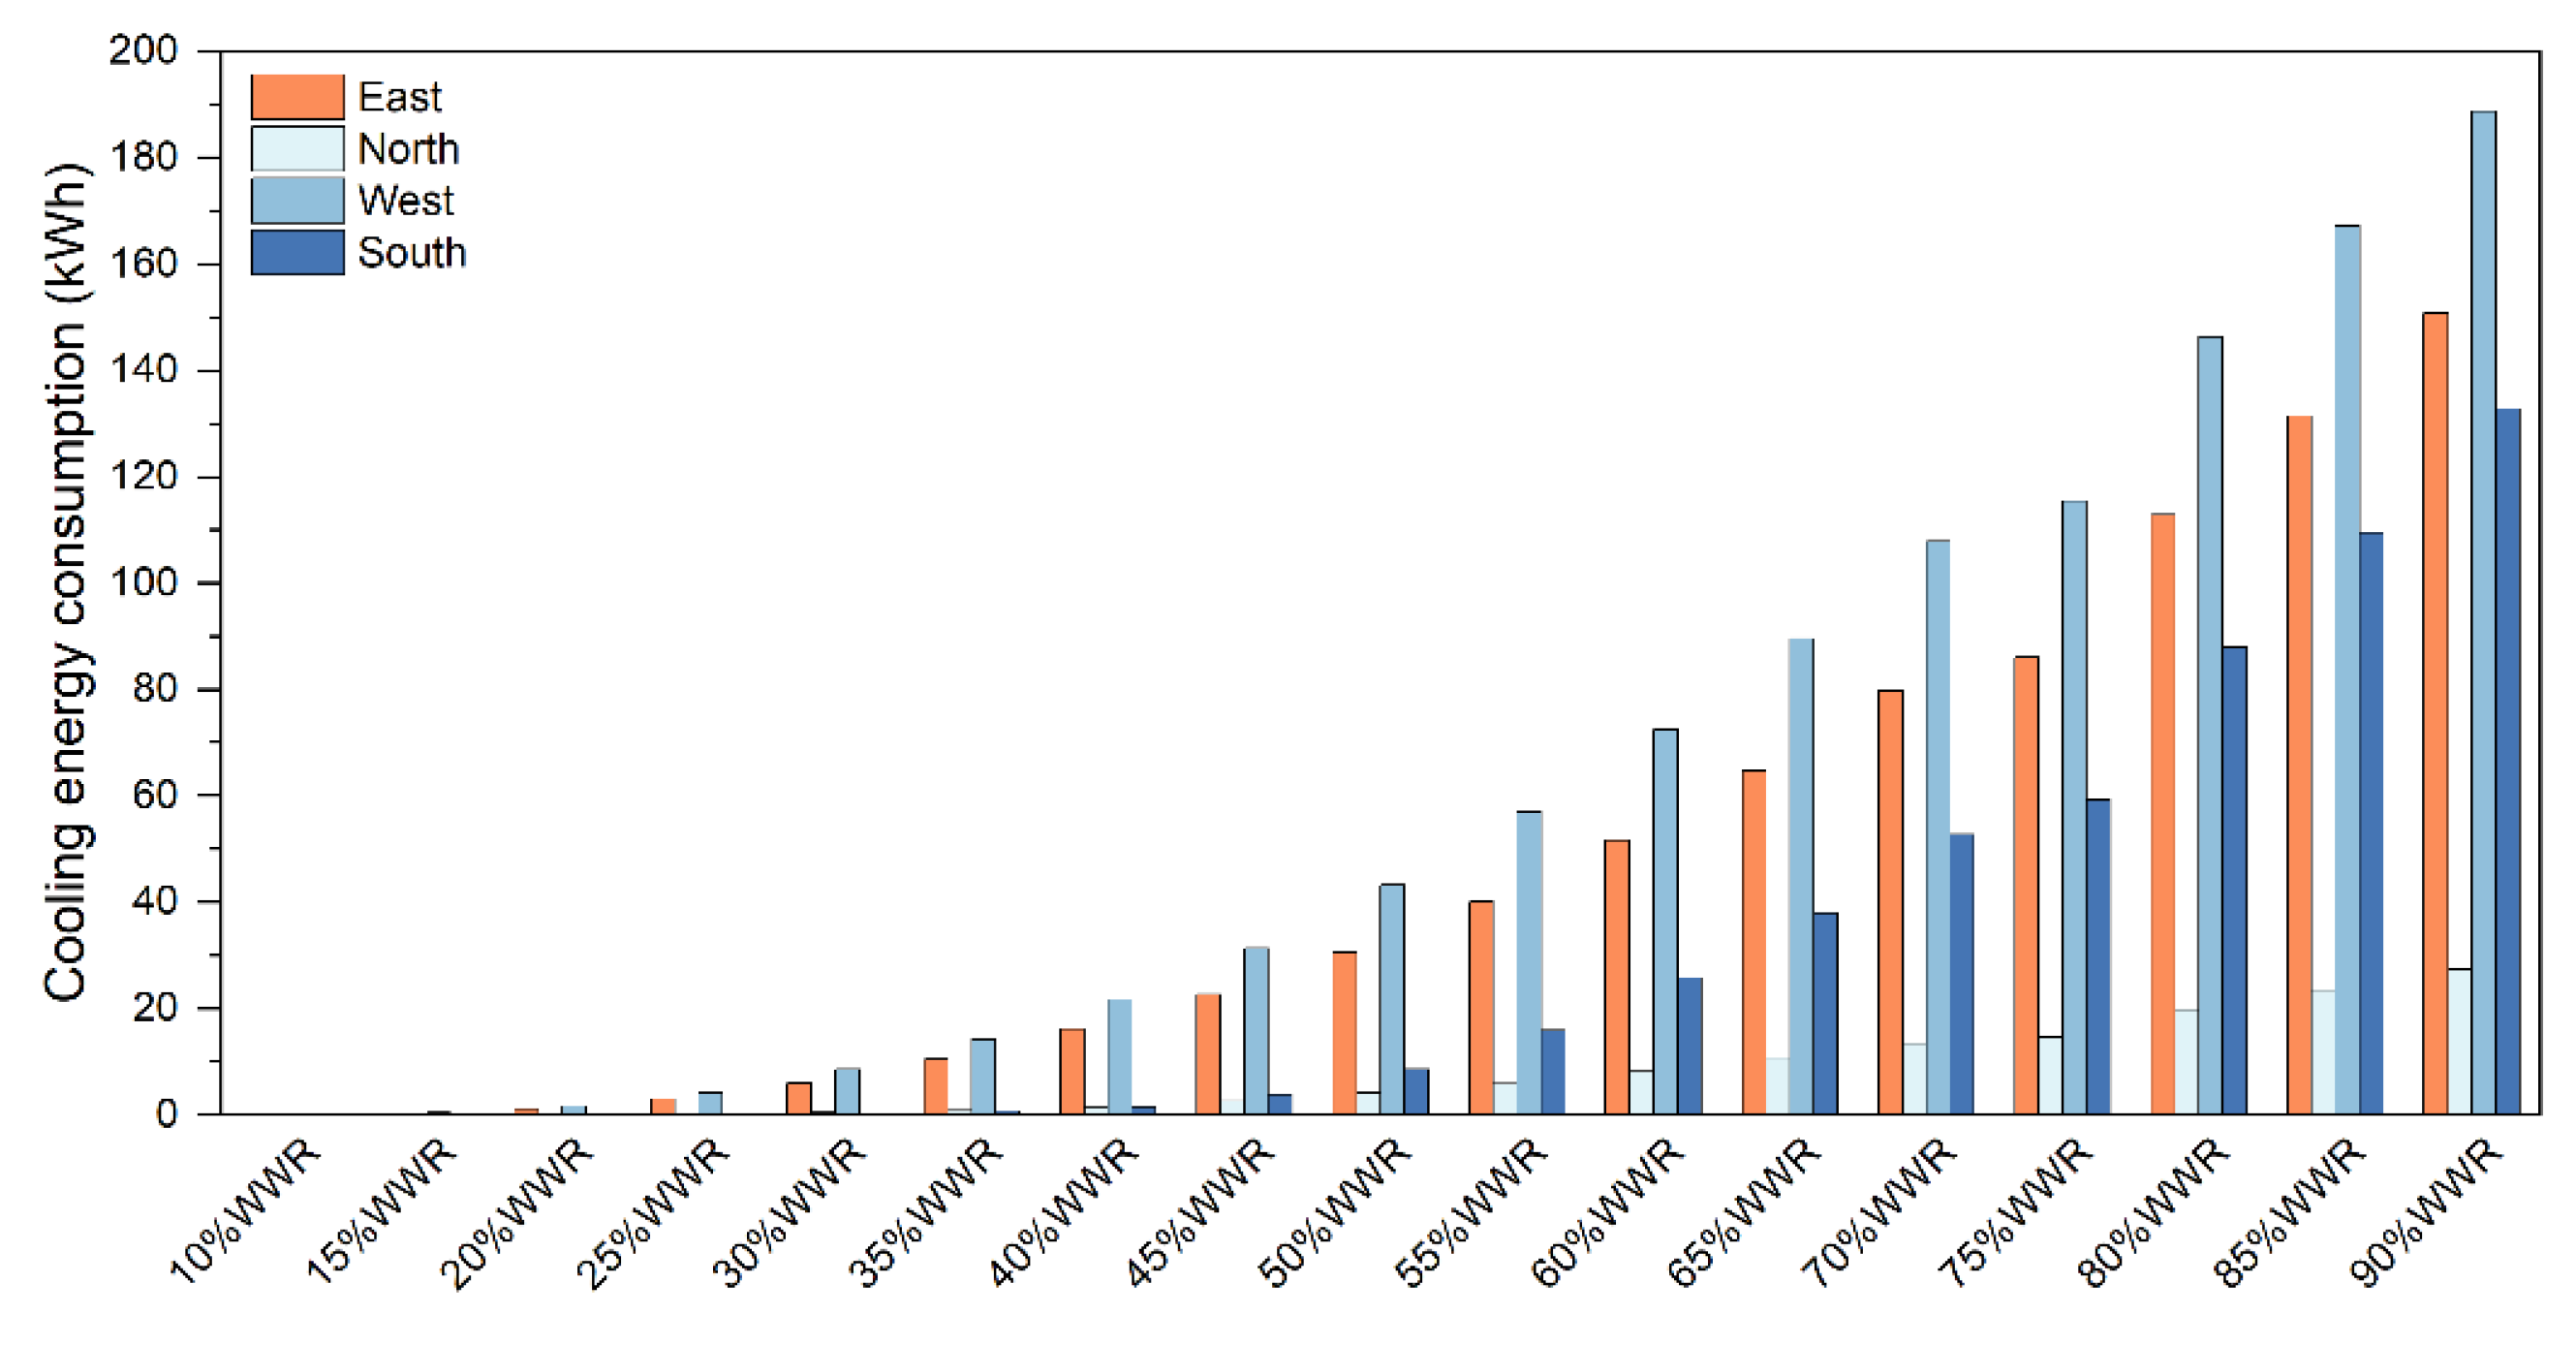
Figure 10.
Overall energy consumption of PVCVG.
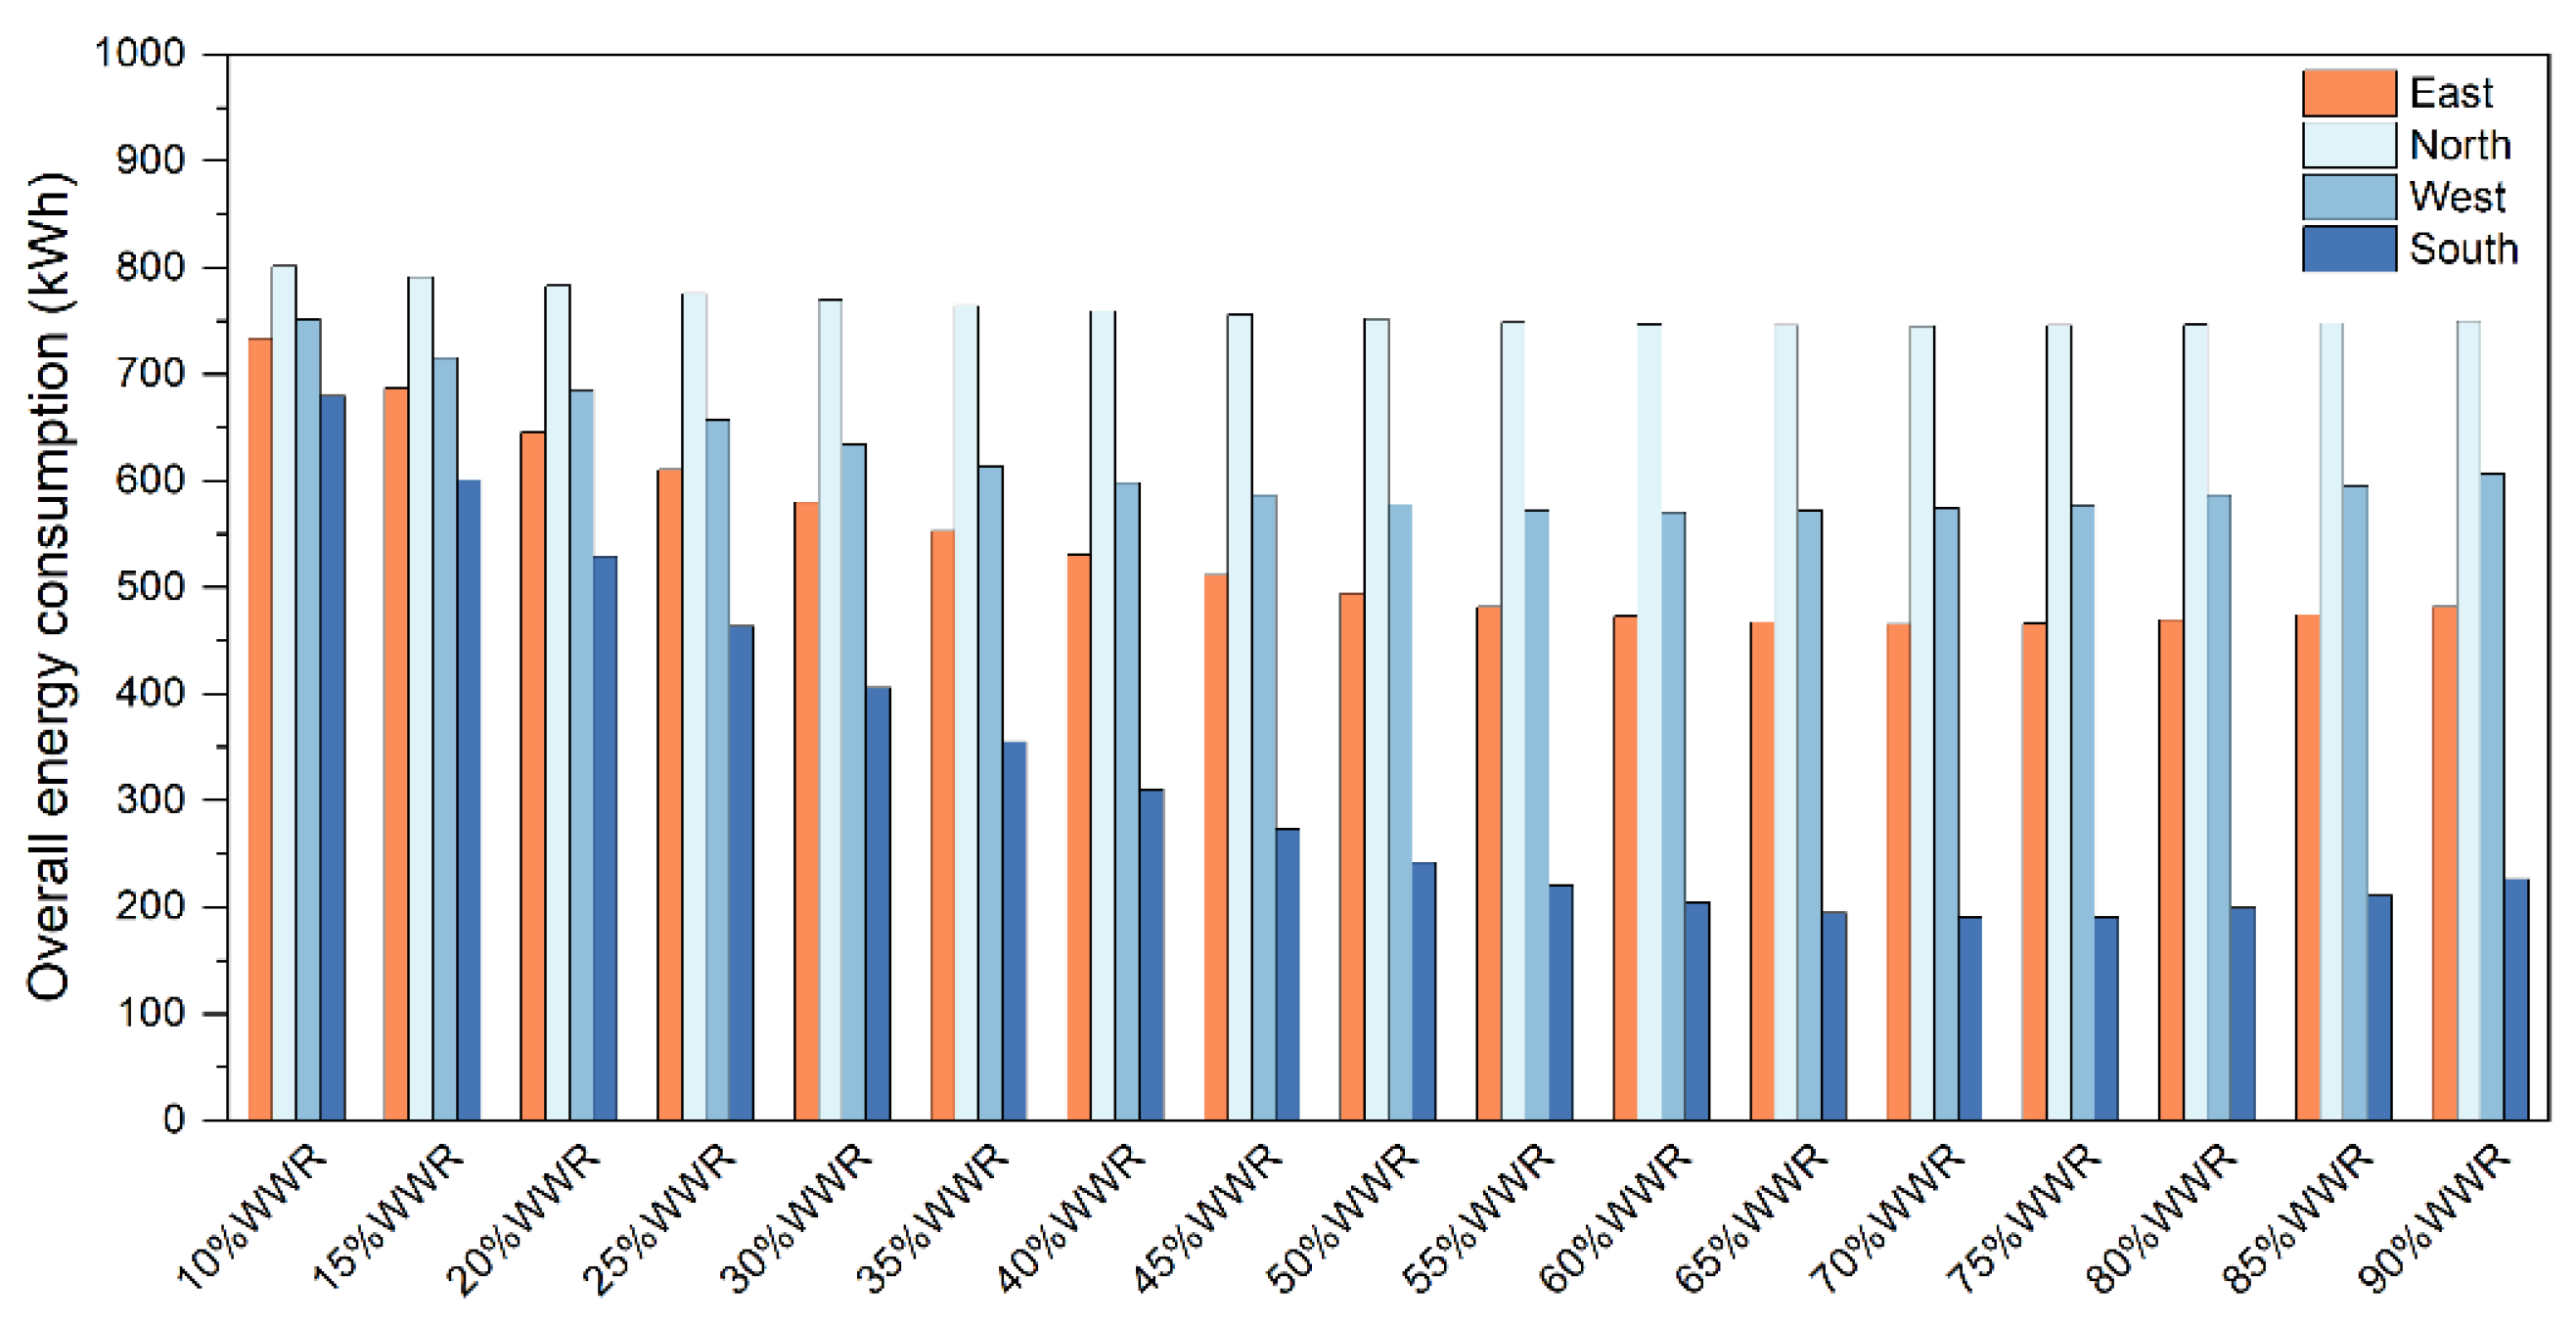
Figure 11.
Electrical power generation of PVCVG.
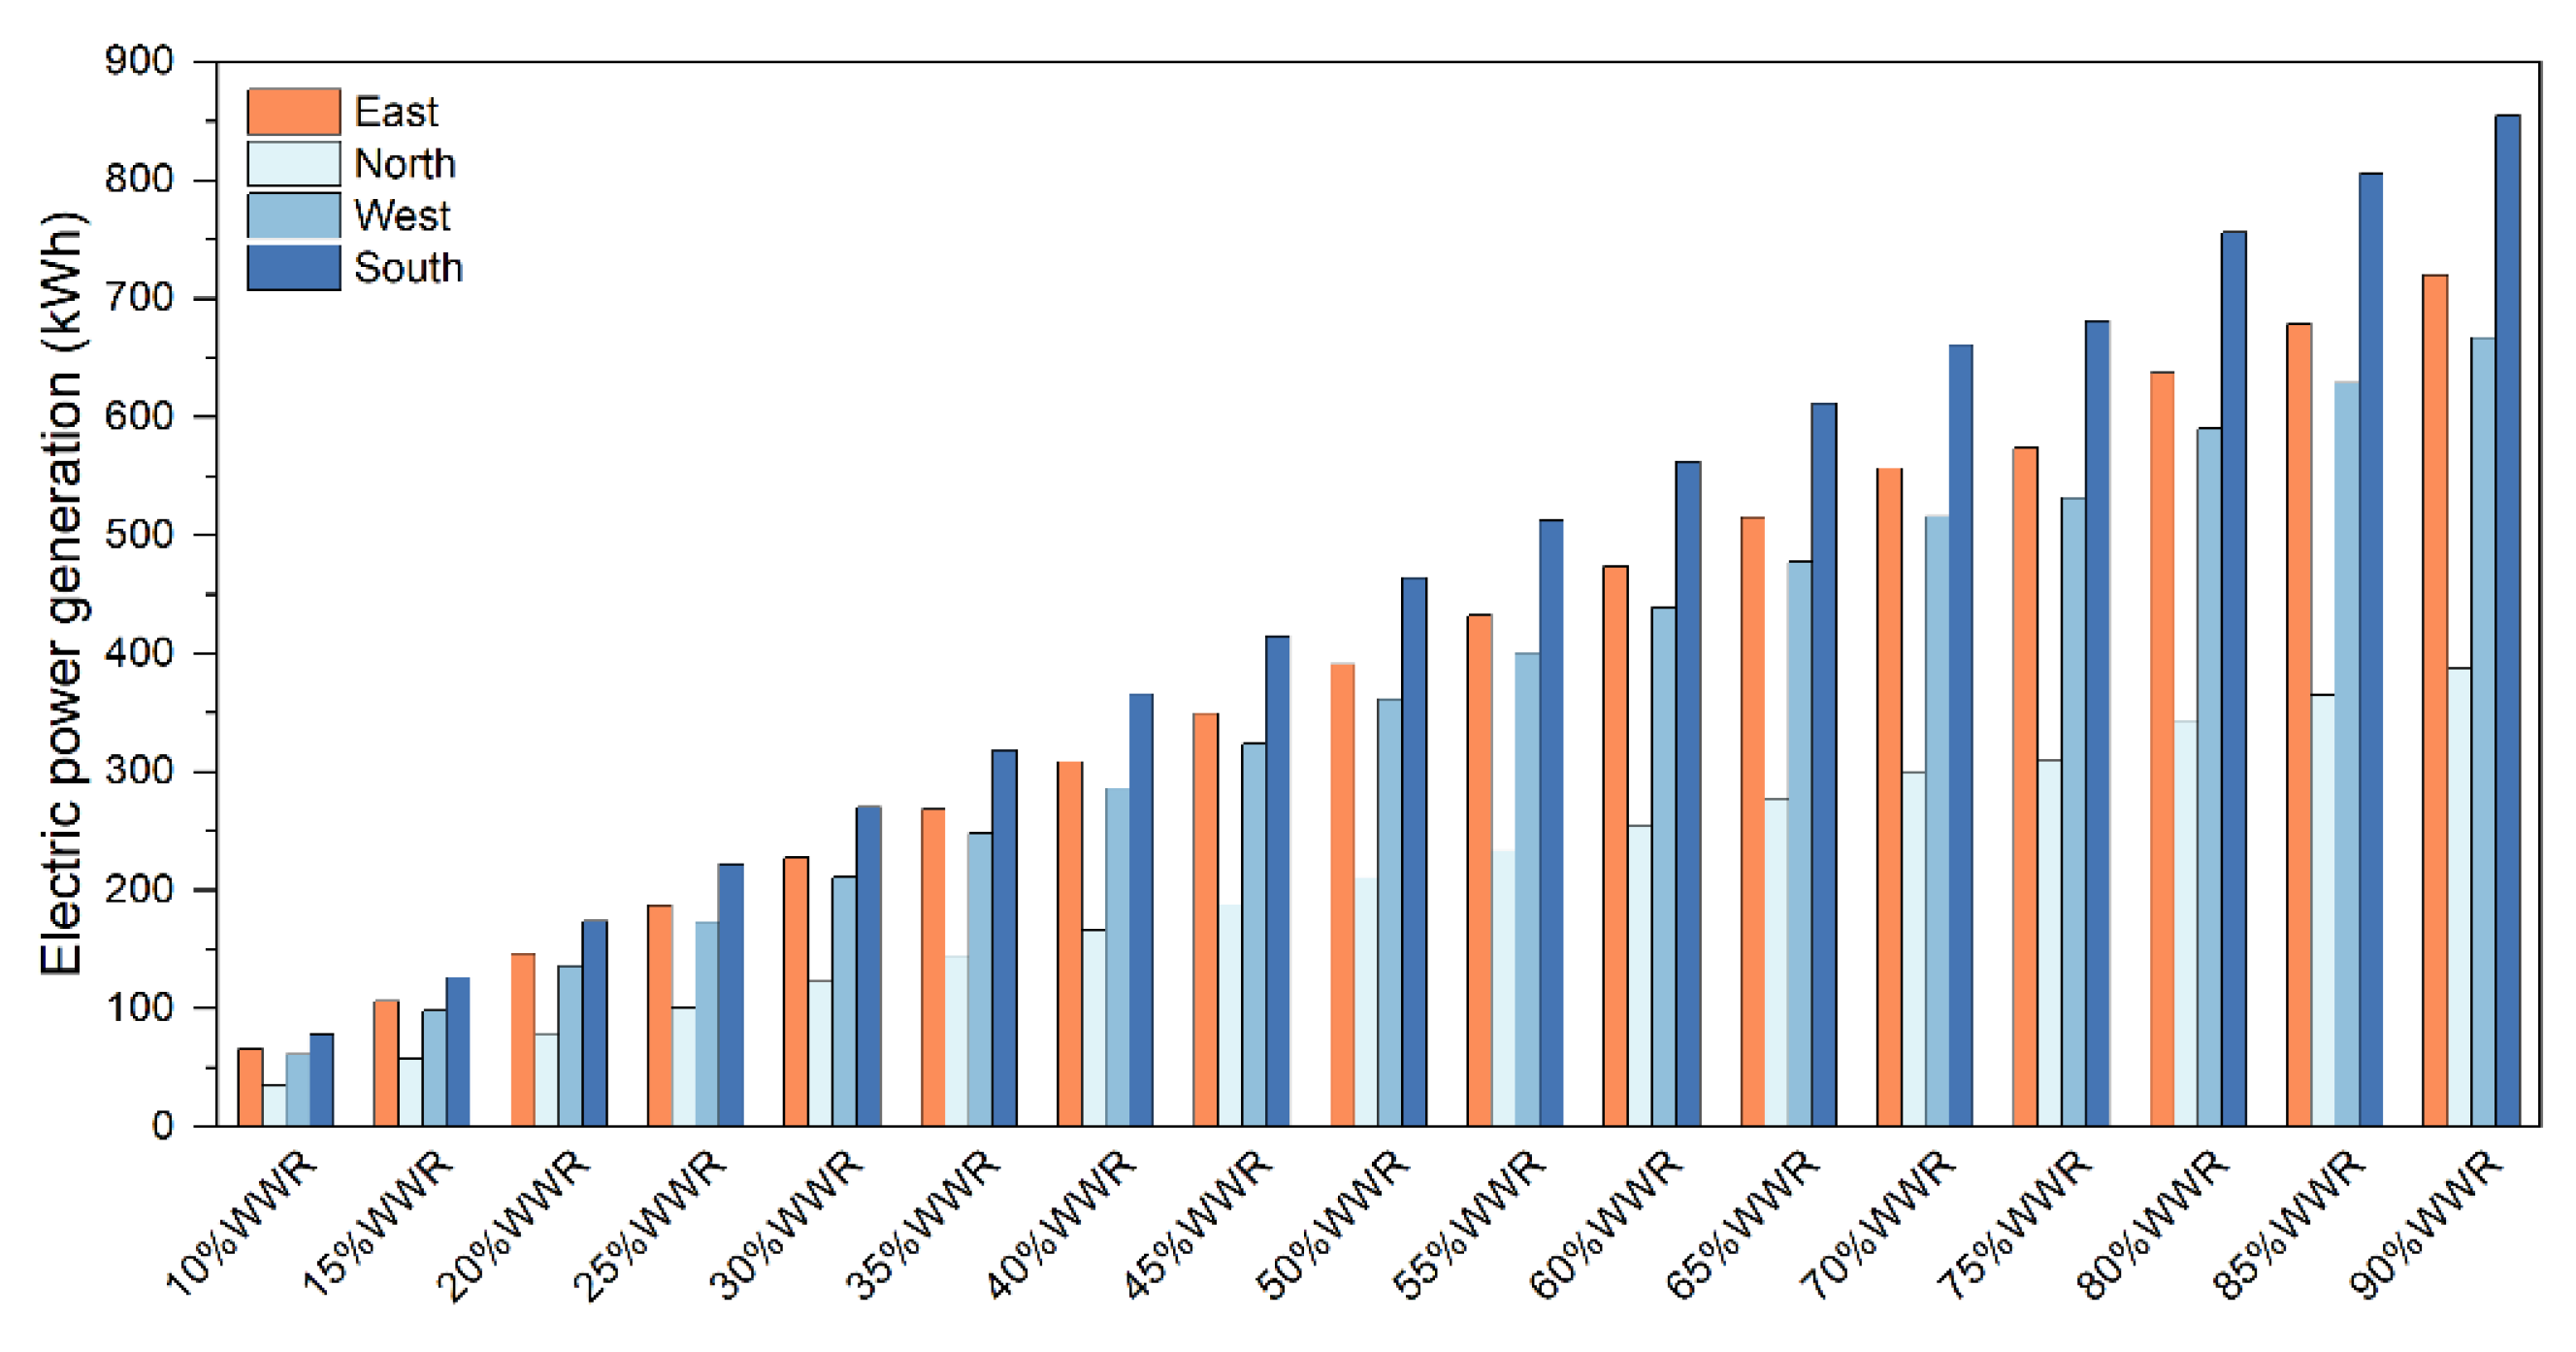
Figure 12.
Net energy consumption of PVCVG.
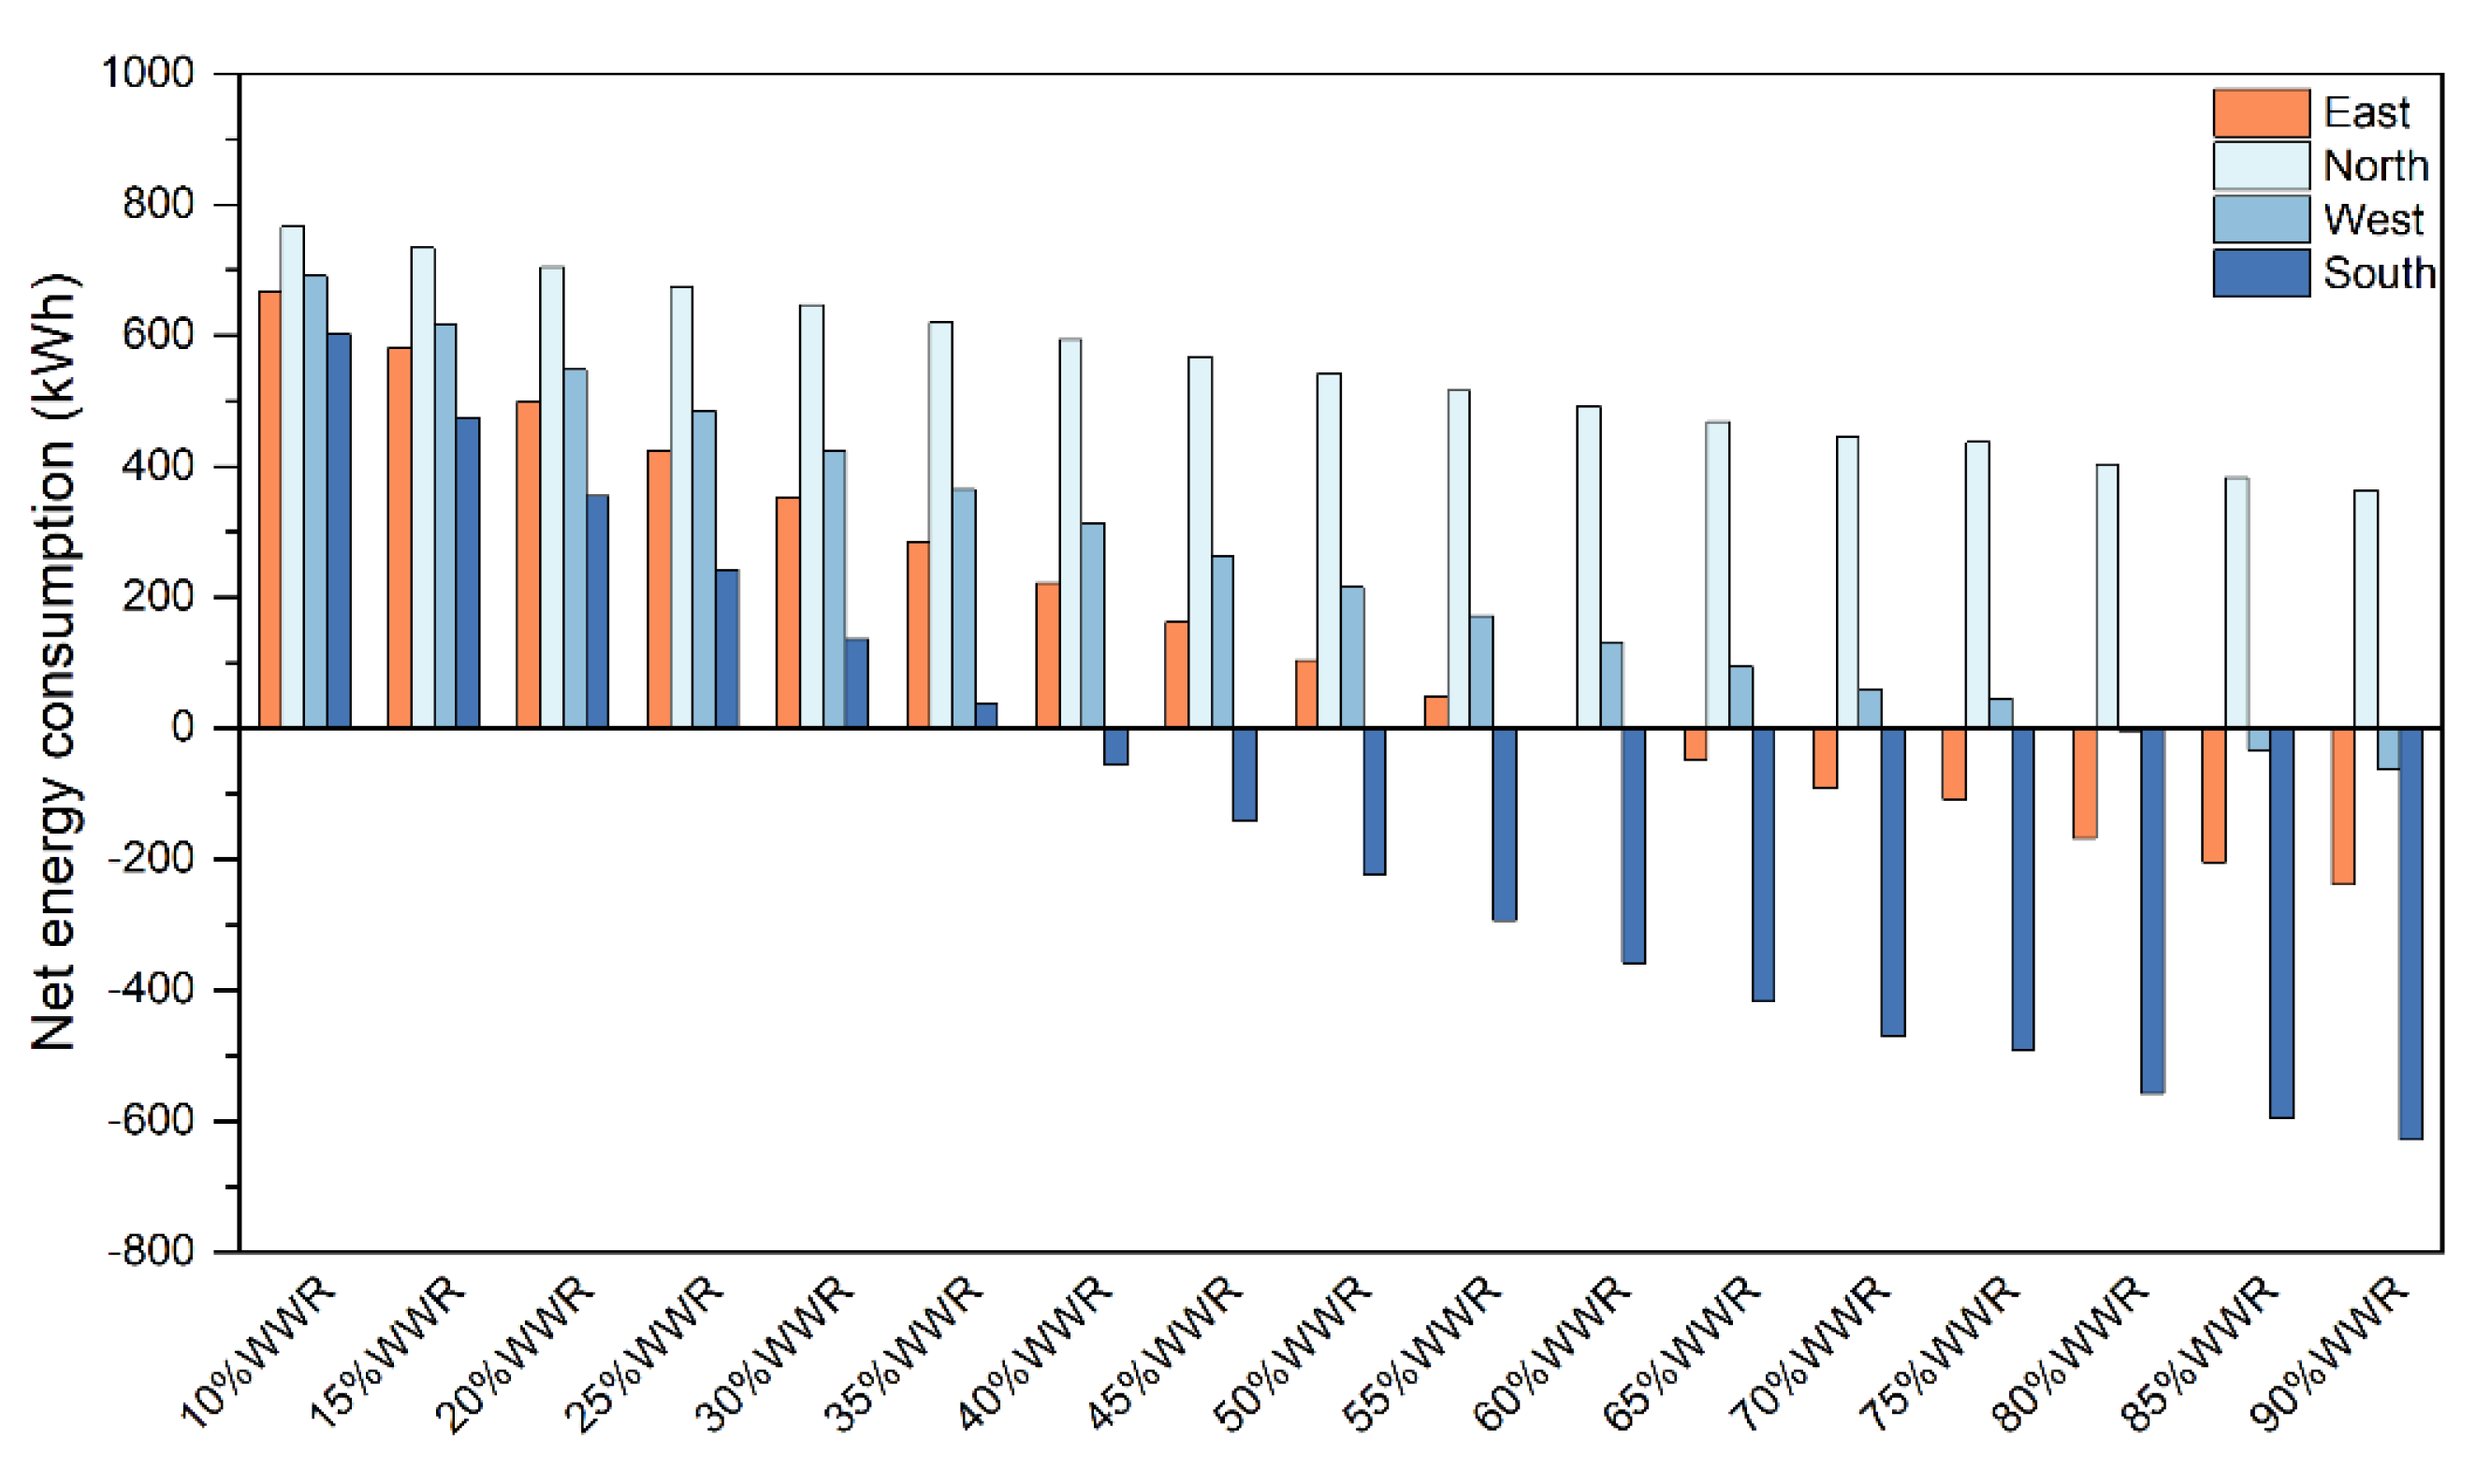
Figure 13.
Energy Satisfaction Ratio of typical PV windows.
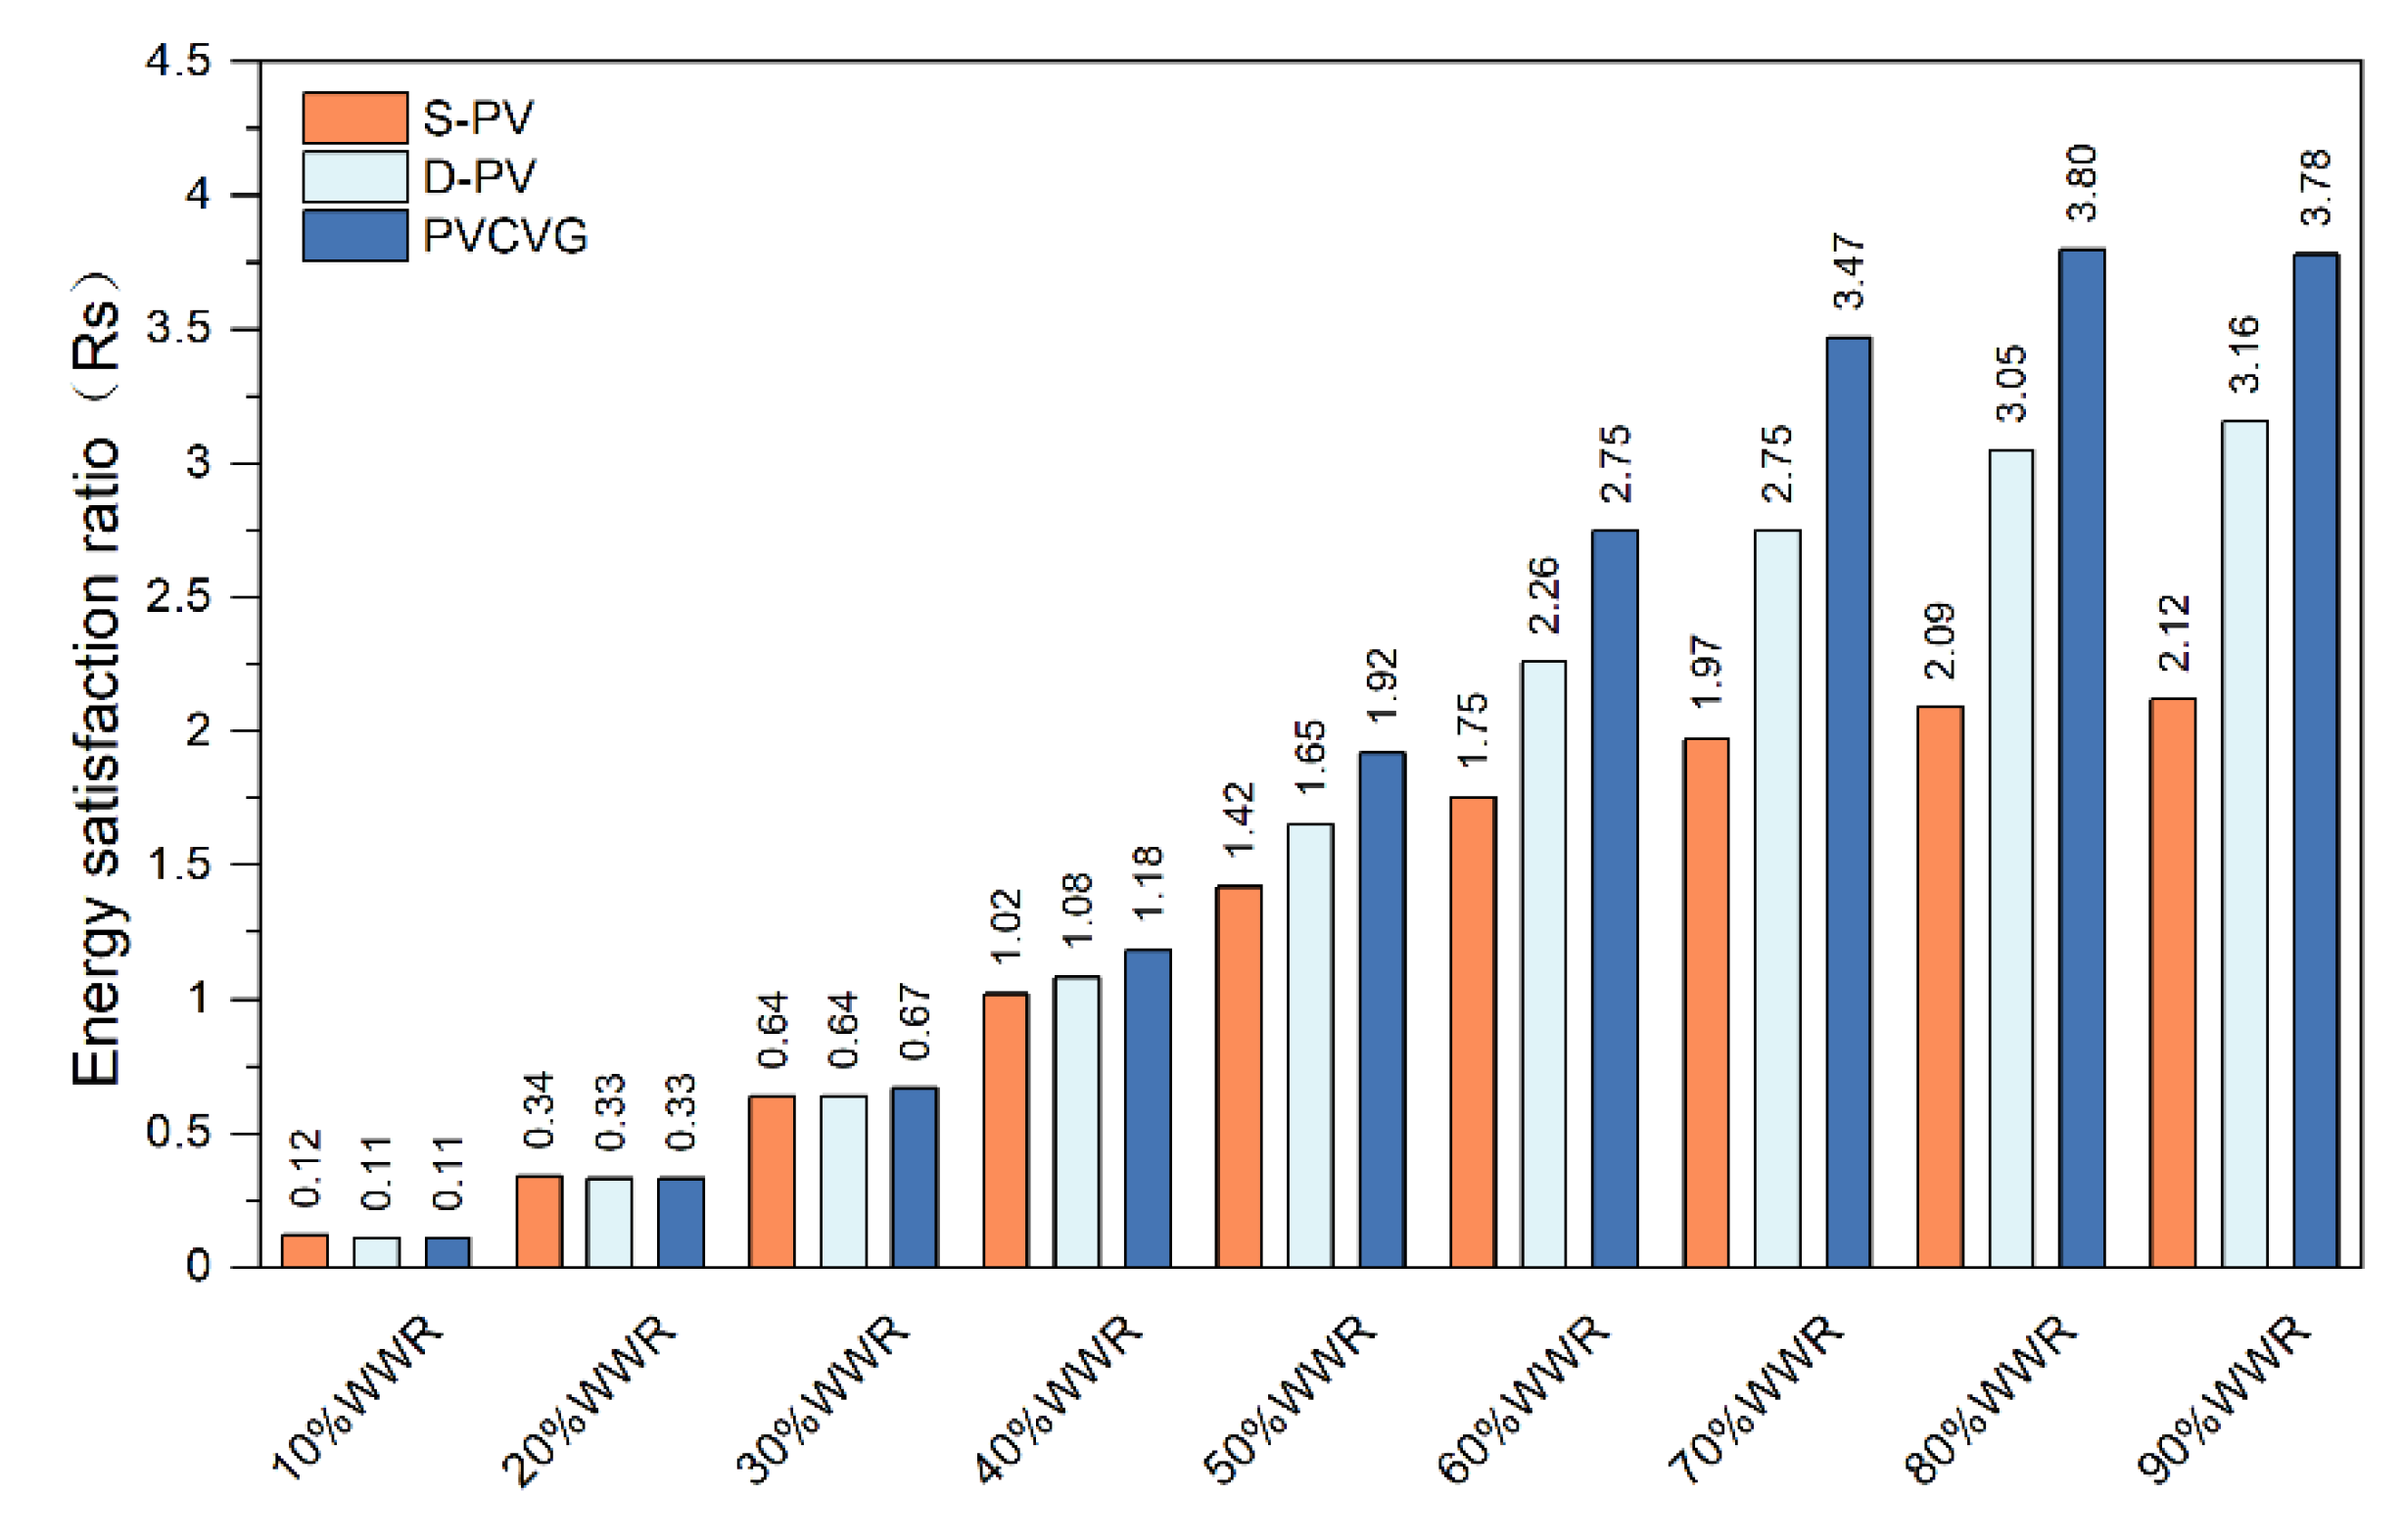
Figure 14.
Energy Satisfaction Ratio of PVCVG.
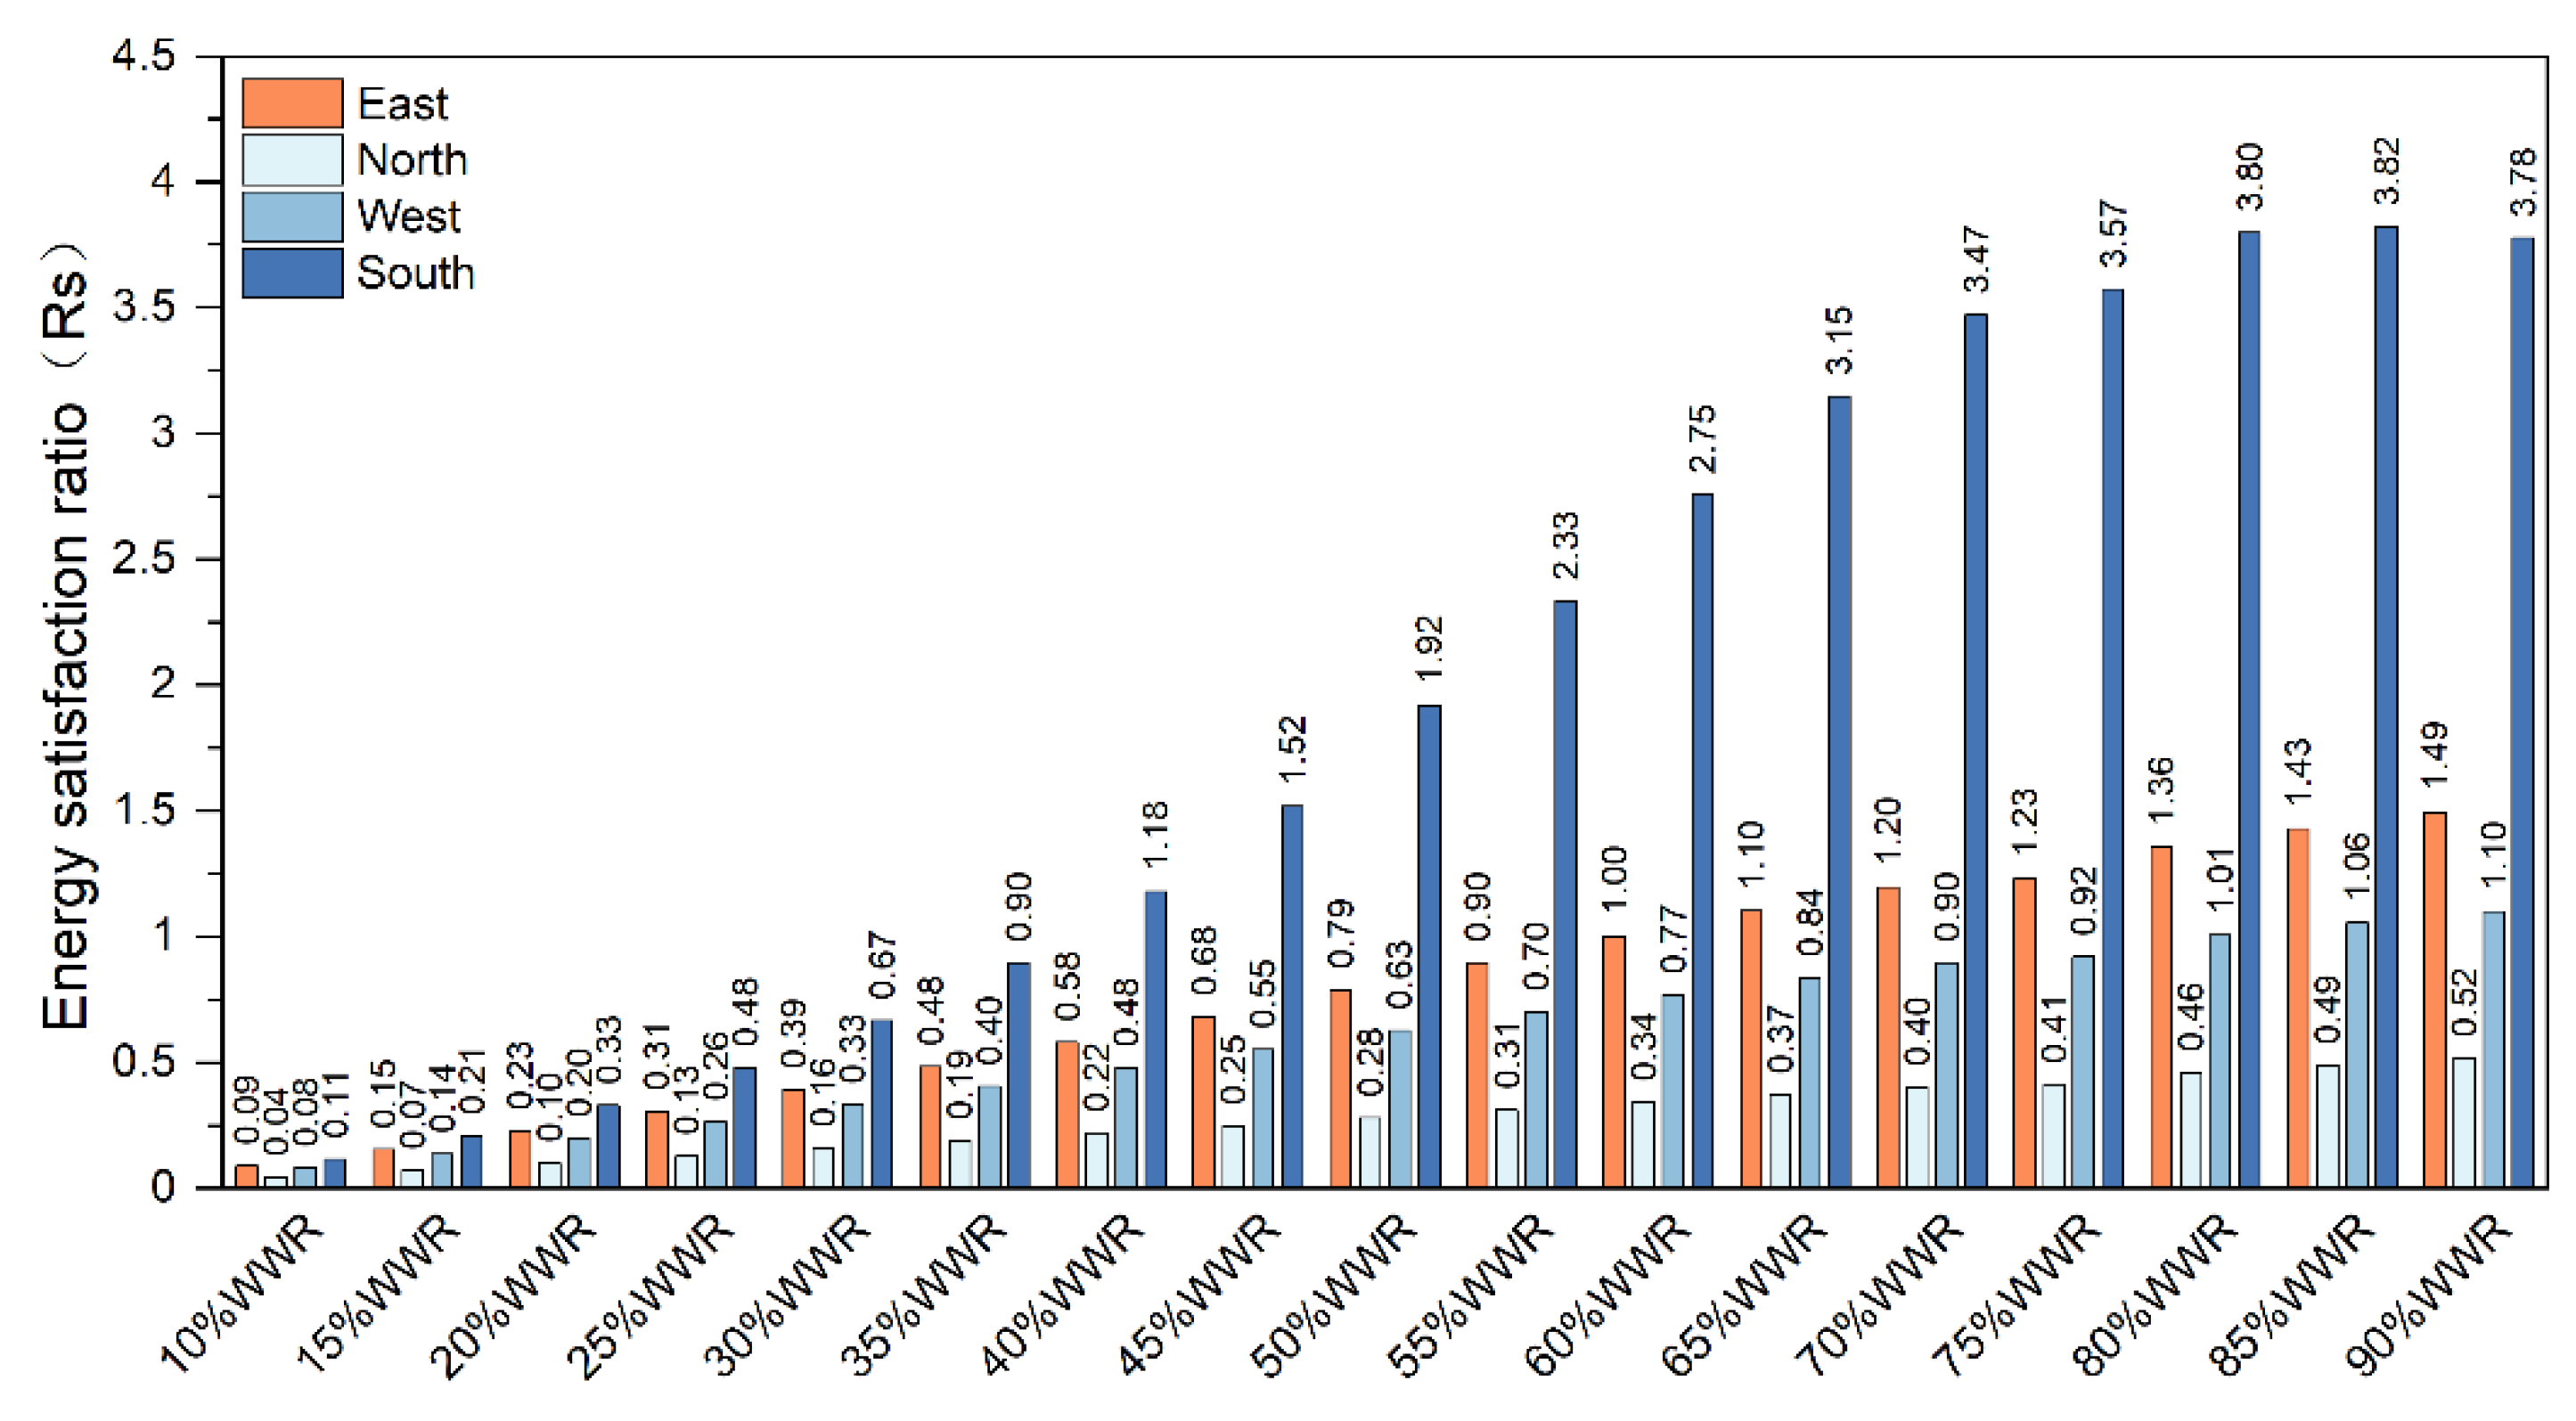

Table 1.
Parameters and structure of PVCVG.
| PVCVG parameters | PVCVG structure | ||
|---|---|---|---|
| PV glazing type | Structure | 3.2 mm cover plate + Thin-film PV Cell + 3.2 mm substrate | 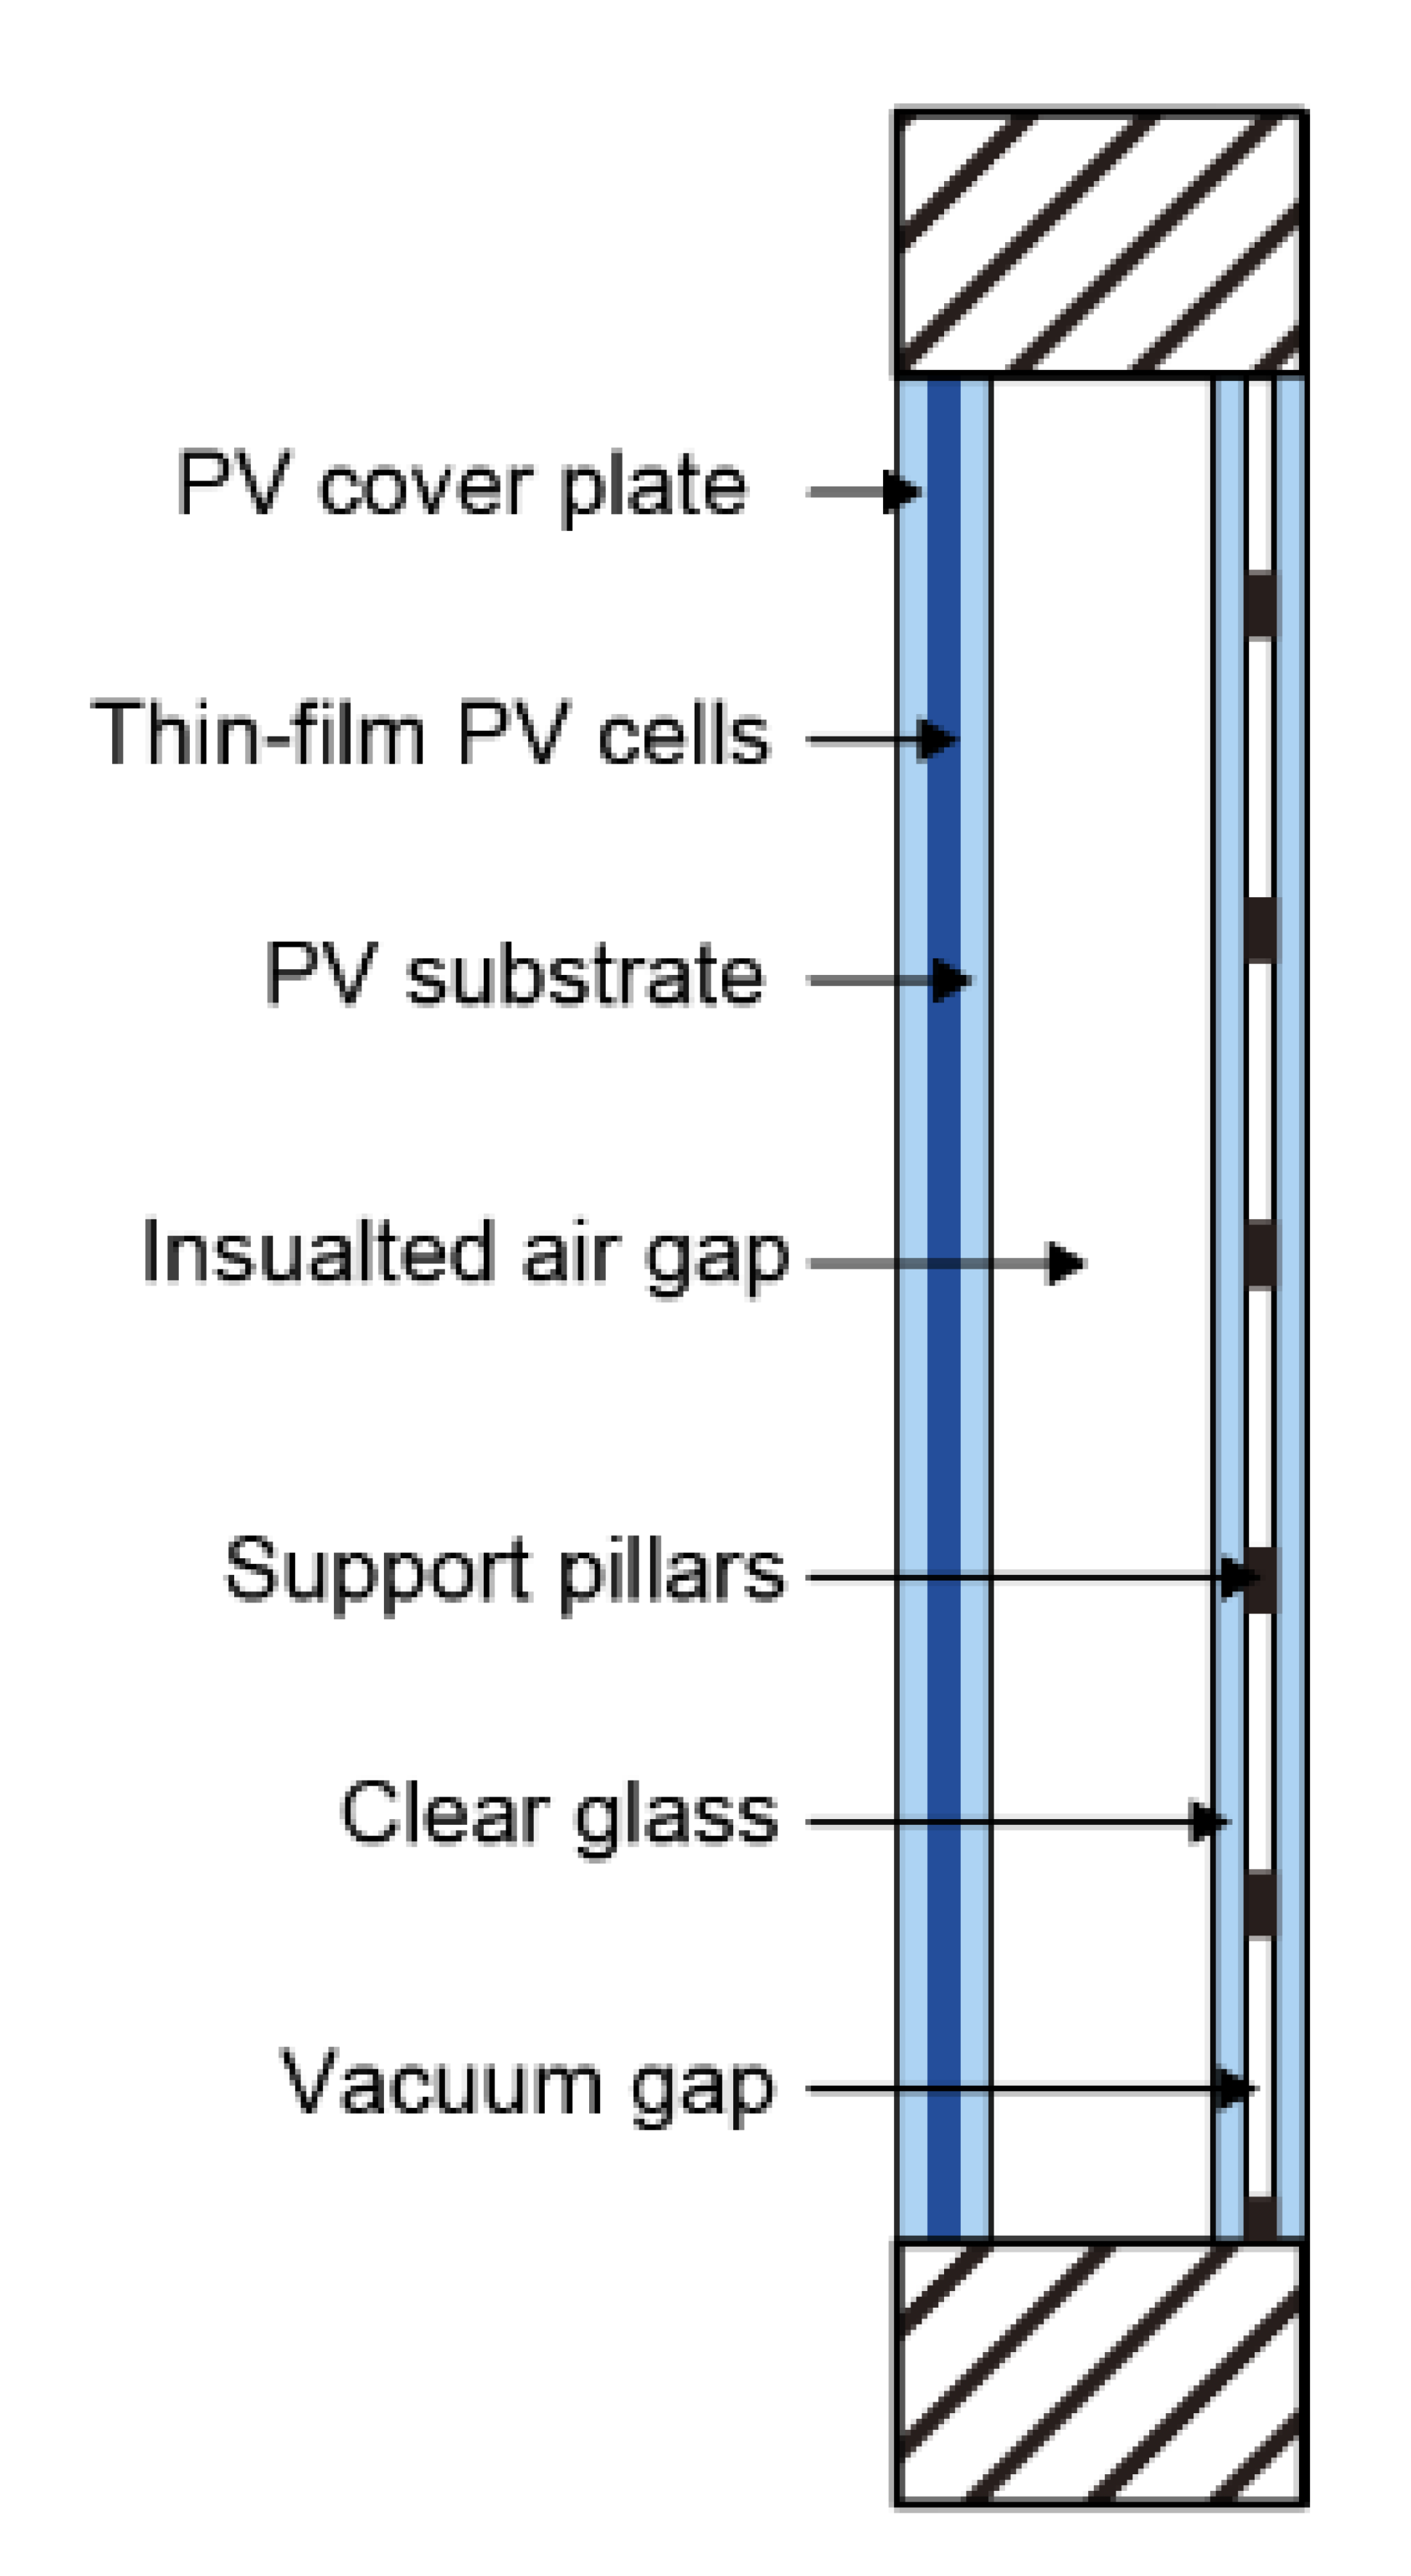 |
| Light transmittance | 40% | ||
| Thin-film Cell | CdTe | ||
| Air gap | Thickness | 15mm | |
| Vacuum glass type | Structure | 5mm Clear glass + 0.2mm air gap + 5mm Clear glass | |
| Height of pillars | 0.2mm | ||
| Diameter of pillars | 0.3mm | ||
| Array spacing | 30mm | ||
| Pressure | 0.001pa | ||
Table 2.
Typical window units and parameters.
| Window units | Structure | U-value | SHGC | TVIS |
|---|---|---|---|---|
| Single glazing (SG) | 5mm clear glass | 5.913 | 0.864 | 0.899 |
| Double glazing (DG) | 5mm clear glass+15mm air gap+5mm clear glass | 2.730 | 0.768 | 0.814 |
| Vacuum glazing (VG) | 5mm clear glass +0.2mm Vacuum gap +5mm clear glass | 2.228 | 0.756 | 0.814 |
| Single PV glazing (S-PV) | 7mm PV glazing | 5.261 | 0.571 | 0.435 |
| Double PV glazing (D-PV) |
7mm PV glazing +15mm air gap +5mm clear glass | 2.657 | 0.470 | 0.398 |
| PV combined vacuum glazing (PVCVG) |
7mm PV glazing +15mm air gap +5mm clear glass +0.2mm vacuum gap +5mm clear glass | 1.574 | 0.410 | 0.366 |
Disclaimer/Publisher’s Note: The statements, opinions and data contained in all publications are solely those of the individual author(s) and contributor(s) and not of MDPI and/or the editor(s). MDPI and/or the editor(s) disclaim responsibility for any injury to people or property resulting from any ideas, methods, instructions or products referred to in the content. |
© 2025 by the authors. Licensee MDPI, Basel, Switzerland. This article is an open access article distributed under the terms and conditions of the Creative Commons Attribution (CC BY) license (http://creativecommons.org/licenses/by/4.0/).
Copyright: This open access article is published under a Creative Commons CC BY 4.0 license, which permit the free download, distribution, and reuse, provided that the author and preprint are cited in any reuse.


