
Submitted:
23 January 2025
Posted:
24 January 2025
You are already at the latest version
Abstract
The 29th Conference of the Parties (COP 29) occurred in Baku, Azerbaijan, in November 2024. A central topic, but not the only one, was linked to Sustainable Development Goal 13 (Climate Action). It has been said that COP 29 developed into a ‘climate finance COP’ to have wealthier countries finance actions in the poorer countries to remedy damages from the effect of the increasing emissions of greenhouse gases. The final agreement was far from as ambitious as hoped for. In this study, the discrepancies between the fourteen regions of the countries of the world have been analyzed with a focus on Sustainable Development Goals 9 (Industry, Innovation, and Infrastructure), 12 (Responsible Consumption and Production ), and 13 (Climate Action). The discrepancies between high-income countries (HIC) and OECD countries, on the one hand, and low-income countries (LIC) and Africa are presented. Where LIC and Africa, over the last 24-year period, virtually complied with the climate action goals (SDG 13), the HIC and OECD countries were far behind. A similar discrepancy is noted in sustainable production and consumption (SDG 12). The data shows no indication that the increasing innovation in the HIC and OECD countries is reflected in an increase in sustainable production and consumption or increased compliance with the climate action goals. One of the outcomes of the Baku COP 29 meeting was that wealthier countries should finance the remediation of the increasing effects of global temperature increase on the poorer countries and thus be able to continue without changing their habits.
Keywords:
COP 29
; Climate change
; Sustainable Development Goals
; Global Goals
; Partial ordering
Introduction
The 29th session of the Conference of the Parties to the United Nations Framework Convention on Climate Change (COP 29) occurred from November 11 to 22 in Baku, Azerbaijan [1]. As the name indicates, this meeting was the latest in a long series of COPs [2], a central topic but not the only one that has been linked to Sustainable Development Goal 13 (Climate Action) [2]. In this respect, probably, the Paris Climate Change Conference - November 2015 (COP21) [3] is one of the most famous due to the decision to keep the global temperature increase of 1.5 degrees, which apparently, up to now, has been a limited success. Thus, “according to WMO’s State of the Climate Update, 2024 is on track to be the hottest on record and temporarily hit 1.5°C. Greenhouse gas levels are at record observed levels. Sea level rise is accelerating, glacier retreat is unprecedented, and extreme weather events have caused major loss of life and livelihoods around the world.” [4].
The sustainability policy for Azerbaijan, as stated as an entry to COP 29, was a “dedication to creating a climate-neutral event that adheres to the highest standards of environmental responsibility by minimizing carbon emissions, maximizing resource efficiency, promoting renewable energy, and fostering sustainable practices across all operations” and to “achieve carbon neutrality by reducing greenhouse gas (GHG) emissions through renewable energy use, energy efficiency, and offsetting unavoidable emissions” [5]. Thus, the choice of Baku in Azerbaijan (Eastern Europe and Central Asia) indicates a paradox. Azerbaijan is a country whose survival virtually depends on oil and natural gas extraction and has no wish to fight for a fossil-free future. Hence, by the end of the day, the Azerbaijan presidency declined to include the reduction of fossil fuels to reduce CO2 emissions, which should probably be seen in the light that the country produces roughly 850.000 barrels of oil per year, of which approximately 80% are exported, which with the current production rate leave oil for the next 200 years [6]. In other words, Azerbaijan's dependency on oil is crucial as its economy is anchored in oil and gas production, accounting for roughly 47.8 % of the country’s GDP and over 92.5 % of export revenue in 2022 [7]. However, for the sake of completeness, it should be noted that over the last two decades, Azerbaijan’s index of climate action (SDG 13) has constantly been around eighty [8,9].
As stated by the World Meteorological Organization (WMO), the “summit had been dubbed the ‘climate finance COP,’ and representatives from all countries were seeking to establish a new, higher climate finance goal” [10], which in practice sought for a solution with the wealthier countries should finance actions in the poorer nations to remedy or even prevent damages from the effect of the increasing emissions of greenhouse gasses and thus the temperature rise. Although fair, it does look like a treatment of symptoms instead of causes. Eventually, the final agreement from COP 29 was far from as ambitious as hoped and needed, as stated by the UN Secretary-General António Guterres: “I had hoped for a more ambitious outcome – on both finance and mitigation – to meet the great challenge we face.” [10]. It is beyond the scope of the present study to discuss, e.g., the financial outcomes in detail.
In this study, partial order methodology has been applied to study and illustrate the discrepancies between the fourteen regions mentioned above based on the indexes for Sustainable Development Goals 11 (Industry, Innovation, and Infrastructure), 12 (Responsible Consumption and Production ), and 13 (Climate Action), respectively [8,9] applying the data available, i.e., SDG indexes, for the fourteen different regions covering 193 countries as given in the most recent Sustainable Development report [8,9], i.e., HIC (High-Income Countries), LAC (Latin America and the Caribbean), LIC (Low-income Countries), LMIC (Lower-middle-income Countries), MENA (Middle East and North Africa), OECD (OECD members), Oceania (Oceania), SIDS (Small Island Developing States), UMIC (Upper-middle-income Countries) Africa (Sub-Saharan Africa), BRICS (BRICS members), BRICSplus (BRICS members), and E-Euro_Asia (Eastern Europe and Central Asia), and E_S_Asia (East and South Asia).
Methodology
Data
The analysis data were retrieved from the Sustainable Development Report 2024 Dashboard [9]. The data retrieved for the different studied SDGs are given in Appendix A (Global index), B (SDG 13 index), C (SDG 9 index), and D (SDG 12 index), respectively. The data were used to graphically represent the development throughout the 2000-2023 period, whereas the partially ordered rankings were obtained using the transformed data matrices, i.e., the years were the indicators. It should be noted that the values in the four appendices are all given with two decimals only.
Partial Order Methodology
Partial-order methodology is a technique for analyzing relations, e.g., ranking between a group of elements. Here, regions are characterized by a series of indicators, SDG indexes for 2000 to 2023, without data pretreatment, like aggregating the indicators into one single indicator. This allows for disclosing the specific roles of the single indicators and avoiding compensation effects [11].
The basics of partial order methodology have been described in several papers [see, e.g., 12,13] and are, from a mathematical point of view, only related to the ≥ function. Thus, if one element x is higher for at least one indicator and higher or equal for all other indicators, x > y [12,13]. The graphical illustration is given by the so-called Hasse diagrams [12,13]. A specialized application of partial order methodology, average ranking [14,15], has been applied. Average ranking leads to a weak order, i.e., an order in which several elements may have identical orders.
Results and Discussion
Global goal 13, Climate action, has, over the years, been the main topic of the COPs. The focus has primarily been to set limits for the emissions of greenhouse gases to reduce and eventually stop the global increase in temperature. As mentioned in the introduction, the most famous was COP 21 in Paris, where the Paris Agreement, which “is a legally binding international treaty on climate change,” was adopted by 196 Parties on 12 December 2015 [3]. Unfortunately, the agreement entered into force in November 2016, retrospectively seen with limited success, potentially devastating some countries. Thus, for COP 29, the possible financial support to remedy the effect of the lack of climate action for these countries came into focus.
The analyses in the present study are based on the data for seventeen SDGs from 2000 to 2023, as given by Sachs et al. [9]. It should be noted that the data cover the period 15 years before the adoption of the SDGs in 2015, thus covering 24 years in total. In Figure 1, the Hasse diagram, as well as the derived average ranking based on the combined, i.e., global SDG index of the fourteen regions plus the world, including all seventeen SDGs (ref), is displayed.
Not surprisingly, the world index has an average rank virtually in the middle (Figure 1). The top regions are the high-income countries (HIC) and OECD. In contrast, the lowest-ranked region is the Low-income countries (LIC).
Turning attention to climate action, i.e., SDG 13, a virtual reversed picture develops. Figure 2 displays the mutual ranking of the fourteen regions plus the world based on the SDG 13 indexes given for the 2000 to 2023 period, together with the derived average ranks.
The above rankings are based on data originating from 24 years. Thus, it is interesting to visualize the actual development over the years for the regions. In Figure 3, the development of the SDG 13 indexes for the regions and the world is depicted. In this connection, it should be stressed that significant variations may prevail with the single regions. This applies to all analyses presented in the present study. However, for SDG 13, only limited variations are noted for the 2000 to 2023 period.
The two above figures perfectly illustrate those countries, e.g., the HIC and OECD groups, which are both far away from complying with the SDG 13 goals, unambiguously are under a moral obligation to help remedy the effects of climate change, which for a significant part is imposed by them, for countries that by themselves comply well with the SDG 13 goals. The minor apparent increase in compliance for HIC and OECD in 2020 (Figure 3) can be associated with a reduced activity level during COVID-19.
The intercorrelation between the seventeen SDGs has been discussed previously [16]. However, in the present study, only the relation to Sustainable Development Goals 11 (Industry, Innovation, and Infrastructure) and 12 (Responsible Consumption and Production ) will be discussed, both appearing as mandatory effectively to fight greenhouse gas emissions and thus climate change. Hence, where SDG 9 focuses on building “resilient infrastructure, promote inclusive and sustainable industrialization and foster innovation” [17], the goal of SDG 12 is to “ensure sustainable consumption and production patterns” [18].
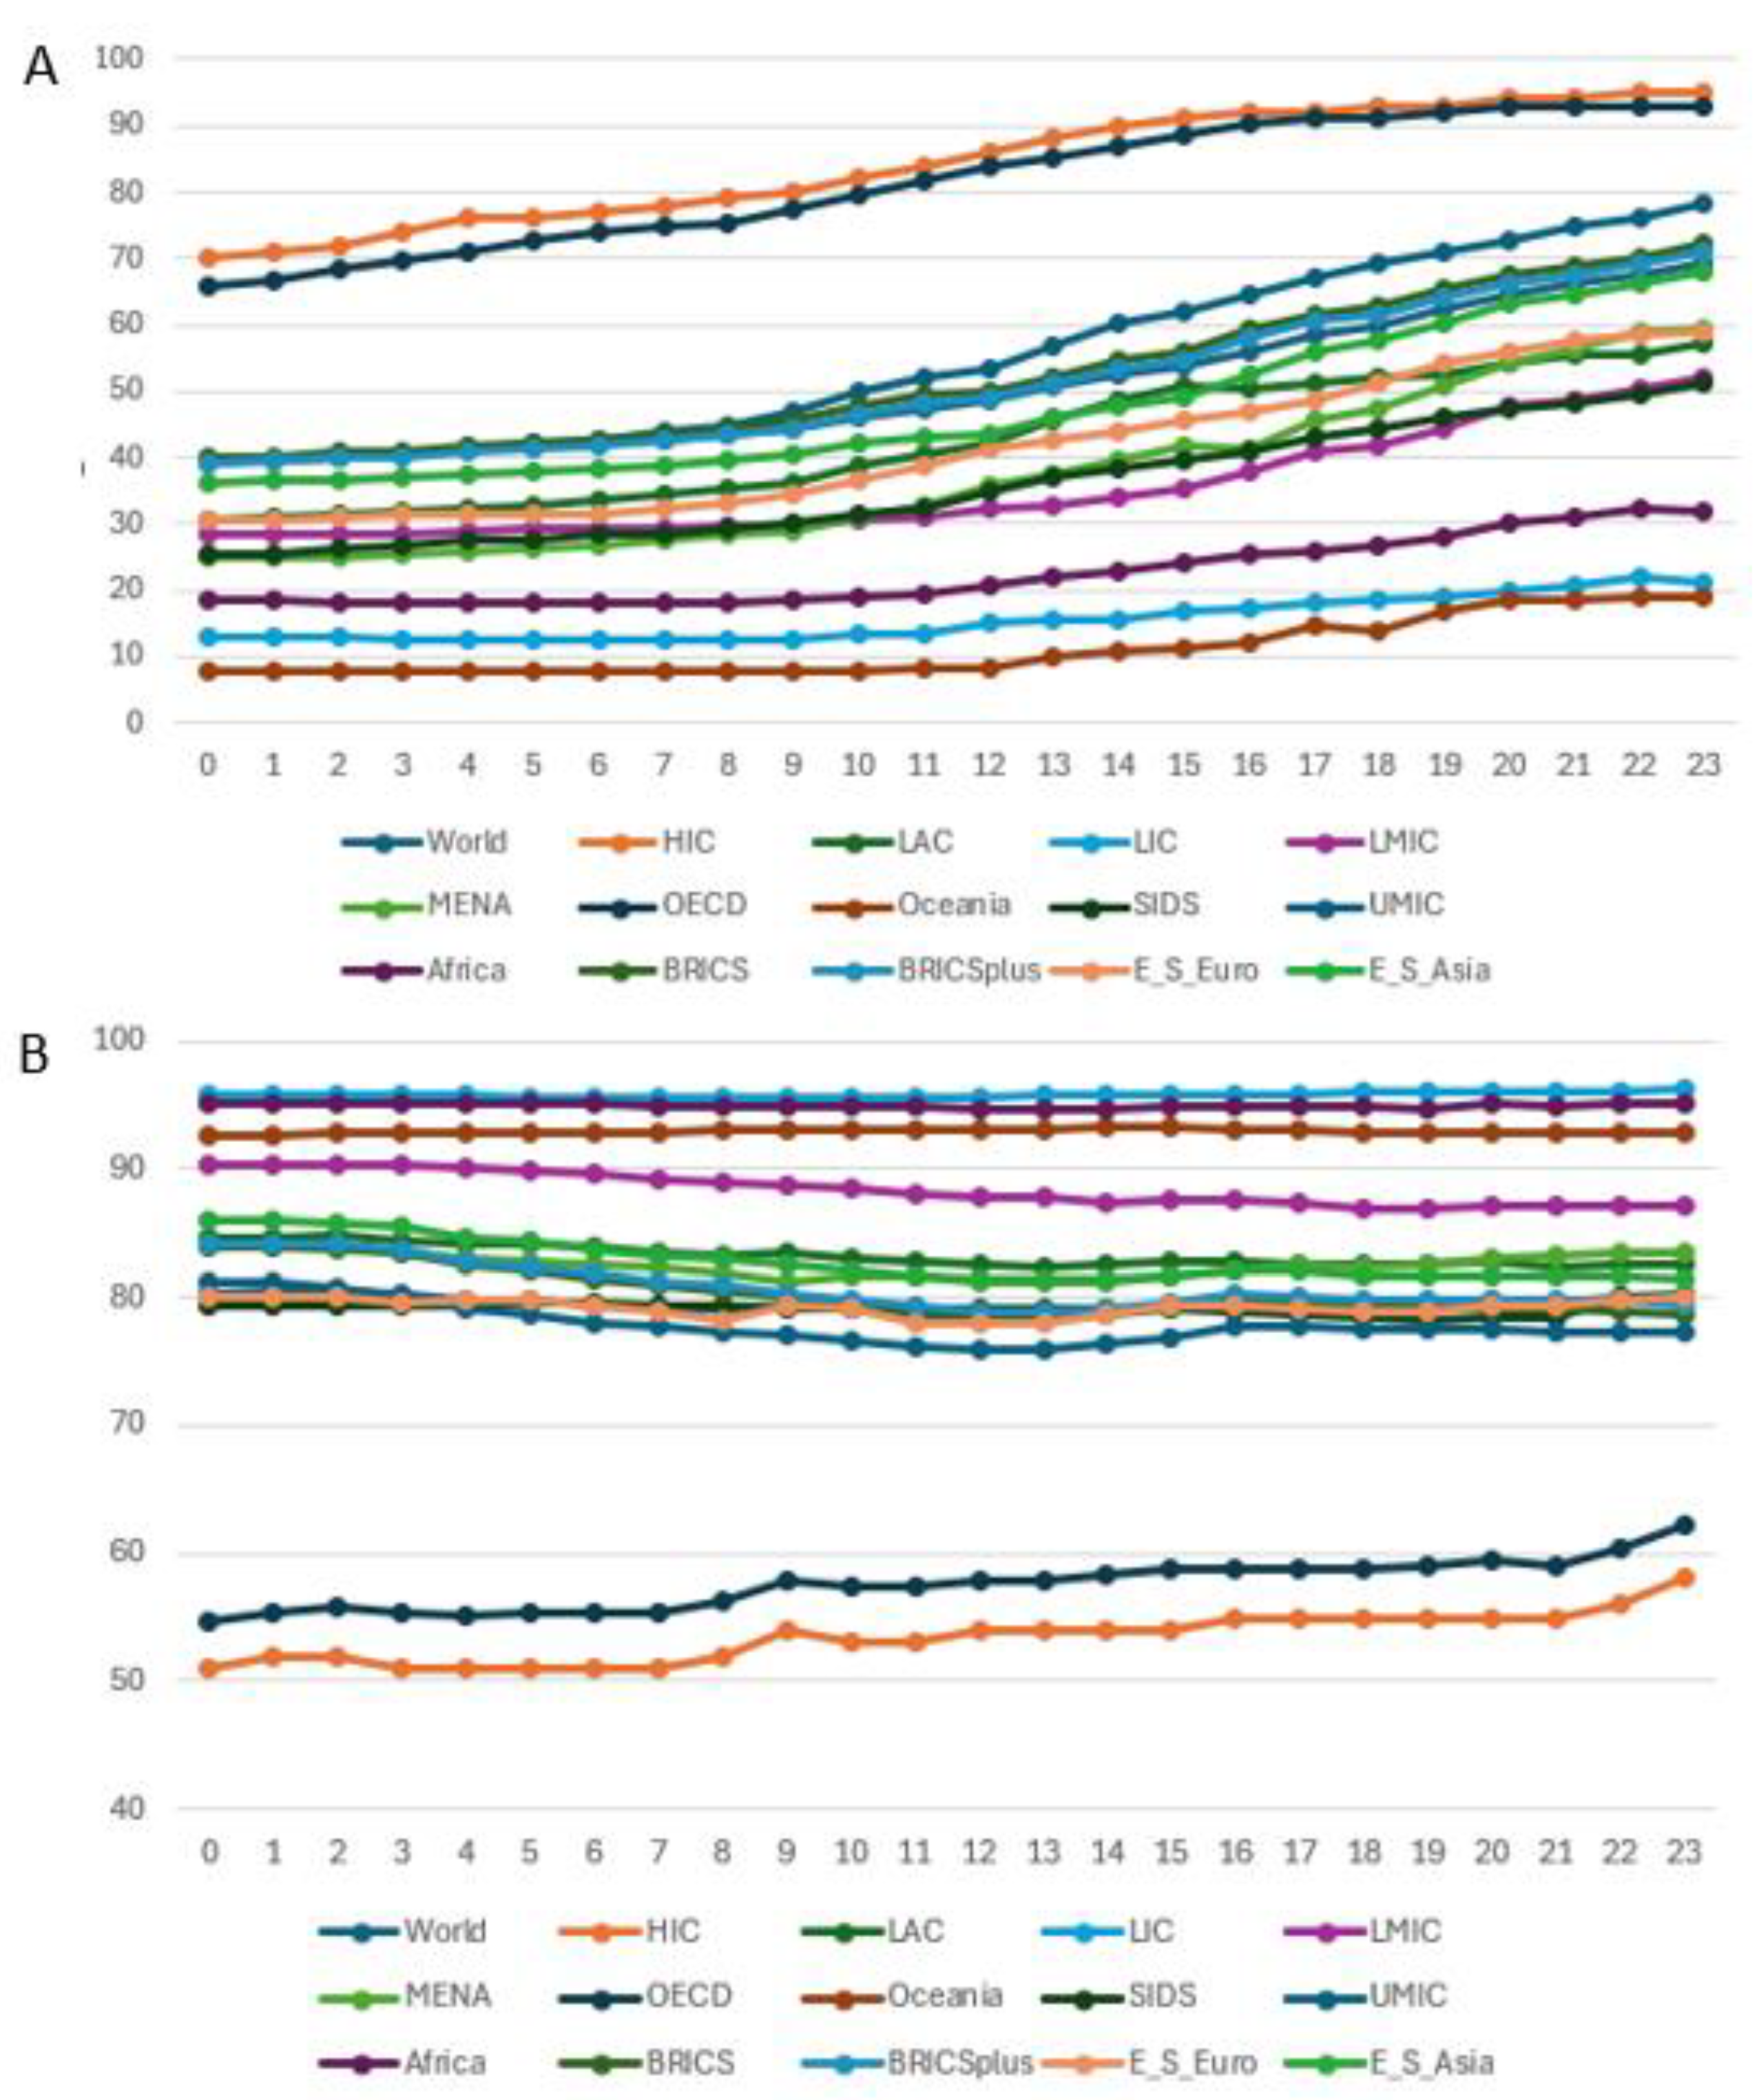
Innovation is necessary to develop sustainable industries. This means focusing on sustainable production methods, which should be accompanied by a sustainable consumption pattern, e.g., reducing the consumption of red meat and other CO2-heavy products. Thus, one kilogram of beef emits nearly 100 kg of CO2 equivalents [19]. Looking at the data for these two SDGs [9] reveals a picture quite like the above-discussed analysis of SDG 13. In Figure 4, the mutual ranking of the regions and the world is depicted for the two SDGs based on the data from 2000 to 2023, and in Figure 4, the yearly development over the period is shown.
First, the graphs depicted in Figure 5A and 5B visualize a positive development in the SDG 9 goals for all regions. It is further pointed out that the countries in the HIC and PECD groups by 2020 are close to fully complying with the SDG 9 goals, whereas Africa, LIC, and Oceania apparently are far behind. Turning the focus towards SDG 12 (Figure 4B and 5B), it is clear that the degree of compliance with SDG 9 is not reflected in sustainable production and consumption, i.e., SDG 12. Thus, whereas LIC, Africa, and Oceania comply with SDG 12 goals on sustainable production and consumption close to 95 % degrees throughout the 24 years, HIC and OECD are below 60 %. However, some improvement can be noted in the later years of the period. This supports the conclusion that the innovations for HIC and OECD are not specifically, or at least not sufficiently, focused on developing sustainable industries, which is supported by the low ranking of these regions on sustainable production and consumption (SDG 12).
Conclusions and Outlook
Based on the figures for compliance with the Sustainable Development Goals as given in the Sustainable Development Report for 2024, the discrepancies between high-income countries (HIC) and OECD countries on the one hand and, e.g., low-income countries (LIC) Africa and the other are apparent. Thus, when LIC and Africa, over the last 24-year period, virtually complied with the climate action goals (SDG 13), the HIC and OECD countries were far behind. A similar discrepancy is noted in sustainable production and consumption (SDG 12). At the same time, there is no indication that the increasing innovation in the HIC and OECD countries is reflected in an increase in sustainable production and consumption or increased compliance with the climate action goals.
As a consequence of these discrepancies, one of the outcomes of the Baku COP 29 meeting was that the rich countries should finance the remediation of the increasing effects of global temperature increase on the poorer countries. In other words, the ‘bad guys’ should pay the ‘good guys’ to be able to continuously be the ‘bad guys’ by, to some extent, remedying the effects of their actions for the ‘good guys’ without changing their habits. However, the eventual compromise showed they were not ready to pay their debts by the end of the day. Just a paradox - does the old Roman-Catholic system of getting indulgence ring a bell?
There is no such thing as a free lunch.
Appendix A. Global SDG Index for 2000–2023 [9].
| year | World | HIC | LAC | LIC | LMIC | MENA | OECD |
Oce- ania |
SIDS | UMIC | Africa | BRICS |
BRICS plus |
E_S_ Euro |
E_S_ Asia |
| 2000 | 57.77 | 72.80 | 63.52 | 43.84 | 53.19 | 59.44 | 71.75 | 51.36 | 58.87 | 60.88 | 45.10 | 56.58 | 56.06 | 64.67 | 55.50 |
| 2001 | 58.04 | 73.10 | 63.75 | 44.08 | 53.45 | 59.60 | 72.10 | 51.19 | 59.25 | 61.22 | 45.36 | 56.84 | 56.30 | 65.18 | 55.71 |
| 2002 | 58.25 | 73.20 | 63.79 | 44.36 | 53.61 | 59.75 | 72.38 | 51.20 | 59.32 | 61.60 | 45.75 | 56.86 | 56.34 | 65.78 | 55.77 |
| 2003 | 58.47 | 73.30 | 64.16 | 44.69 | 53.98 | 60.05 | 72.41 | 51.12 | 58.89 | 61.79 | 46.03 | 57.11 | 56.59 | 65.51 | 56.03 |
| 2004 | 58.75 | 73.60 | 64.68 | 44.92 | 54.15 | 60.33 | 72.73 | 50.90 | 59.31 | 62.27 | 46.33 | 57.41 | 56.88 | 65.66 | 56.25 |
| 2005 | 59.20 | 73.70 | 65.09 | 45.52 | 54.56 | 60.41 | 73.04 | 51.13 | 59.77 | 62.96 | 46.74 | 58.07 | 57.52 | 65.69 | 56.89 |
| 2006 | 59.49 | 73.70 | 65.56 | 46.08 | 54.85 | 60.58 | 73.19 | 51.26 | 59.63 | 63.39 | 47.25 | 58.42 | 57.86 | 65.78 | 57.25 |
| 2007 | 59.95 | 73.80 | 65.92 | 46.46 | 55.28 | 60.76 | 73.38 | 51.26 | 60.43 | 64.06 | 47.64 | 59.14 | 58.55 | 66.08 | 57.90 |
| 2008 | 60.20 | 74.00 | 66.49 | 46.92 | 55.56 | 60.77 | 73.65 | 51.26 | 60.62 | 64.41 | 48.21 | 59.36 | 58.75 | 66.54 | 58.10 |
| 2009 | 60.55 | 74.60 | 66.96 | 47.33 | 55.71 | 61.27 | 74.25 | 51.26 | 60.93 | 64.88 | 48.53 | 59.52 | 58.90 | 66.97 | 58.31 |
| 2010 | 61.12 | 74.70 | 67.27 | 47.60 | 56.55 | 61.77 | 74.52 | 50.95 | 61.04 | 65.40 | 49.10 | 60.29 | 59.64 | 67.13 | 59.11 |
| 2011 | 61.54 | 75.00 | 67.49 | 47.99 | 56.98 | 62.41 | 74.71 | 51.01 | 61.47 | 65.99 | 49.60 | 61.08 | 60.42 | 67.31 | 59.81 |
| 2012 | 61.96 | 75.30 | 67.84 | 48.58 | 57.49 | 62.84 | 75.07 | 51.26 | 61.86 | 66.45 | 49.94 | 61.57 | 60.88 | 67.54 | 60.35 |
| 2013 | 62.35 | 75.30 | 68.23 | 48.74 | 57.86 | 62.93 | 75.14 | 51.66 | 62.01 | 67.06 | 50.23 | 62.15 | 61.43 | 67.86 | 60.92 |
| 2014 | 63.14 | 75.80 | 68.81 | 49.15 | 58.91 | 63.23 | 75.61 | 51.70 | 62.63 | 67.86 | 50.94 | 63.32 | 62.58 | 68.44 | 61.97 |
| 2015 | 63.51 | 76.00 | 69.23 | 49.16 | 59.26 | 63.21 | 75.81 | 51.54 | 62.66 | 68.50 | 51.22 | 63.92 | 63.13 | 68.86 | 62.48 |
| 2016 | 63.82 | 76.20 | 69.09 | 49.64 | 59.64 | 63.31 | 76.09 | 51.48 | 62.73 | 68.88 | 51.62 | 64.30 | 63.52 | 69.59 | 62.91 |
| 2017 | 64.35 | 76.30 | 69.15 | 50.07 | 60.46 | 63.61 | 76.24 | 52.01 | 63.50 | 69.23 | 52.08 | 64.90 | 64.13 | 70.03 | 63.70 |
| 2018 | 64.77 | 76.30 | 69.29 | 50.42 | 61.09 | 63.96 | 76.34 | 52.03 | 63.83 | 69.61 | 52.43 | 65.45 | 64.64 | 70.26 | 64.34 |
| 2019 | 65.30 | 76.70 | 69.55 | 50.79 | 61.81 | 64.48 | 76.58 | 52.52 | 64.14 | 70.05 | 52.74 | 66.15 | 65.36 | 70.59 | 65.08 |
| 2020 | 65.69 | 77.30 | 69.84 | 50.88 | 62.25 | 65.01 | 77.08 | 52.38 | 64.19 | 70.40 | 53.07 | 66.68 | 65.88 | 71.04 | 65.54 |
| 2021 | 65.87 | 77.30 | 69.72 | 51.27 | 62.51 | 65.30 | 76.91 | 52.14 | 64.08 | 70.59 | 53.49 | 67.08 | 66.28 | 70.96 | 65.77 |
| 2022 | 66.15 | 77.40 | 69.95 | 51.38 | 62.98 | 65.52 | 77.13 | 52.28 | 64.54 | 70.84 | 53.68 | 67.62 | 66.76 | 70.82 | 66.29 |
| 2023 | 66.30 | 77.60 | 70.15 | 51.02 | 63.18 | 65.60 | 77.25 | 52.50 | 64.62 | 71.04 | 53.73 | 67.89 | 67.01 | 70.56 | 66.53 |
Appendix B. SDG 13 Index for 2000–2023 [9].
| year | World | HIC | LAC | LIC | LMIC | MENA | OECD |
Oce- ania |
SIDS | UMIC | Africa | BRICS |
BRICS plus |
E_S_ Euro |
E_S_ Asia |
| 2000 | 88.41 | 63.00 | 93.86 | 98.62 | 96.50 | 83.74 | 67.77 | 96.21 | 90.49 | 90.02 | 97.33 | 91.78 | 91.45 | 81.94 | 95.06 |
| 2001 | 88.47 | 63.00 | 93.96 | 98.63 | 96.48 | 83.74 | 67.98 | 96.04 | 90.62 | 90.00 | 97.38 | 91.78 | 91.45 | 81.63 | 95.02 |
| 2002 | 88.43 | 63.00 | 93.87 | 98.70 | 96.49 | 83.74 | 68.00 | 96.02 | 90.63 | 89.74 | 97.48 | 91.62 | 91.29 | 81.59 | 94.84 |
| 2003 | 88.02 | 62.00 | 94.00 | 98.64 | 96.43 | 83.26 | 67.17 | 95.89 | 90.32 | 89.02 | 97.28 | 91.13 | 90.81 | 81.05 | 94.43 |
| 2004 | 87.70 | 61.00 | 93.82 | 98.63 | 96.33 | 82.36 | 66.57 | 95.65 | 90.65 | 88.50 | 97.21 | 90.80 | 90.44 | 80.66 | 94.14 |
| 2005 | 87.43 | 61.00 | 93.63 | 98.56 | 96.22 | 81.69 | 66.29 | 95.69 | 90.61 | 87.88 | 97.23 | 90.40 | 90.03 | 80.29 | 93.76 |
| 2006 | 87.14 | 61.00 | 93.31 | 98.55 | 96.10 | 81.35 | 66.08 | 95.68 | 90.35 | 87.25 | 97.17 | 89.91 | 89.49 | 79.34 | 93.40 |
| 2007 | 86.93 | 61.00 | 92.95 | 98.52 | 95.93 | 81.07 | 66.05 | 95.29 | 90.49 | 86.79 | 97.05 | 89.55 | 89.11 | 78.80 | 93.10 |
| 2008 | 86.86 | 62.00 | 92.46 | 98.44 | 95.82 | 79.93 | 67.16 | 95.73 | 89.80 | 86.18 | 96.98 | 89.09 | 88.58 | 78.21 | 92.75 |
| 2009 | 87.43 | 65.00 | 92.89 | 98.49 | 95.76 | 79.38 | 70.07 | 95.85 | 90.19 | 86.27 | 97.03 | 88.96 | 88.40 | 80.32 | 92.51 |
| 2010 | 86.90 | 64.00 | 92.12 | 98.38 | 95.62 | 79.24 | 69.04 | 95.94 | 89.98 | 85.38 | 97.00 | 88.34 | 87.79 | 79.15 | 92.02 |
| 2011 | 86.61 | 64.00 | 91.94 | 98.62 | 95.45 | 79.38 | 69.09 | 95.84 | 90.58 | 84.48 | 96.95 | 87.63 | 87.15 | 78.71 | 91.43 |
| 2012 | 86.55 | 64.00 | 91.54 | 98.64 | 95.31 | 78.41 | 69.65 | 95.95 | 90.12 | 84.16 | 97.01 | 87.40 | 86.85 | 78.55 | 91.21 |
| 2013 | 86.61 | 64.00 | 91.16 | 98.73 | 95.35 | 78.96 | 69.89 | 95.85 | 89.90 | 83.98 | 97.04 | 87.32 | 86.84 | 78.99 | 91.11 |
| 2014 | 86.69 | 65.00 | 91.29 | 98.70 | 95.29 | 78.59 | 70.30 | 95.56 | 90.05 | 84.03 | 97.05 | 87.28 | 86.76 | 79.61 | 91.02 |
| 2015 | 86.89 | 65.00 | 91.39 | 98.82 | 95.22 | 78.49 | 70.89 | 95.60 | 89.63 | 84.36 | 97.20 | 87.50 | 86.93 | 80.42 | 91.02 |
| 2016 | 87.04 | 65.00 | 92.31 | 98.83 | 95.13 | 78.95 | 71.02 | 95.56 | 90.77 | 84.68 | 97.27 | 87.60 | 87.08 | 80.45 | 91.03 |
| 2017 | 86.96 | 65.00 | 92.37 | 98.78 | 95.01 | 78.86 | 71.07 | 95.65 | 90.97 | 84.43 | 97.34 | 87.38 | 86.88 | 80.05 | 90.81 |
| 2018 | 86.78 | 65.00 | 92.81 | 98.80 | 94.79 | 78.62 | 70.84 | 95.47 | 90.63 | 84.17 | 97.36 | 87.08 | 86.59 | 79.70 | 90.47 |
| 2019 | 86.82 | 66.00 | 92.86 | 98.79 | 94.72 | 78.44 | 71.62 | 95.45 | 90.98 | 83.90 | 97.32 | 86.90 | 86.42 | 80.00 | 90.22 |
| 2020 | 87.79 | 69.00 | 93.90 | 98.97 | 95.10 | 80.05 | 74.53 | 95.58 | 90.88 | 84.47 | 97.62 | 87.27 | 86.85 | 81.17 | 90.55 |
| 2021 | 87.19 | 67.00 | 93.13 | 98.91 | 94.89 | 80.11 | 72.90 | 95.55 | 90.79 | 83.63 | 97.60 | 86.60 | 86.30 | 80.45 | 90.01 |
| 2022 | 87.24 | 67.00 | 93.16 | 98.92 | 94.84 | 80.09 | 72.97 | 95.62 | 91.02 | 83.62 | 97.66 | 86.58 | 86.28 | 80.98 | 89.92 |
| 2023 | 87.35 | 67.00 | 93.16 | 98.92 | 94.87 | 80.17 | 72.96 | 95.62 | 91.06 | 83.65 | 97.69 | 86.65 | 86.36 | 81.04 | 89.97 |
Appendix C. SDG 9 Index for 2000–2023 [9].
| year | World | HIC | LAC | LIC | LMIC | MENA | OECD | Oce-ania | SIDS | UMIC | Africa | BRICS |
BRICS plus |
E_S_ Euro |
E_S_ Asia |
| 2000 | 39.51 | 70.00 | 30.59 | 12.80 | 28.58 | 24.87 | 65.83 | 7.92 | 25.33 | 39.05 | 18.39 | 40.10 | 39.30 | 30.38 | 36.36 |
| 2001 | 39.75 | 71.00 | 30.89 | 12.81 | 28.55 | 24.89 | 66.72 | 7.83 | 25.58 | 39.45 | 18.34 | 40.25 | 39.43 | 30.79 | 36.42 |
| 2002 | 40.24 | 72.00 | 31.28 | 12.81 | 28.56 | 25.14 | 68.35 | 7.68 | 26.08 | 40.12 | 18.31 | 40.70 | 39.85 | 31.03 | 36.75 |
| 2003 | 40.63 | 74.00 | 31.72 | 12.75 | 28.59 | 25.50 | 69.72 | 7.75 | 26.56 | 40.65 | 18.28 | 41.06 | 40.21 | 31.32 | 37.00 |
| 2004 | 41.13 | 76.00 | 32.30 | 12.70 | 28.79 | 26.06 | 71.15 | 7.74 | 27.36 | 41.32 | 18.25 | 41.61 | 40.74 | 31.41 | 37.42 |
| 2005 | 41.76 | 76.00 | 32.78 | 12.58 | 29.11 | 26.37 | 72.91 | 7.76 | 27.76 | 42.10 | 18.15 | 42.27 | 41.36 | 31.63 | 38.01 |
| 2006 | 42.15 | 77.00 | 33.72 | 12.59 | 29.22 | 26.80 | 73.84 | 7.86 | 28.24 | 42.80 | 18.21 | 42.73 | 41.80 | 31.65 | 38.35 |
| 2007 | 42.68 | 78.00 | 34.40 | 12.63 | 29.48 | 27.42 | 74.77 | 7.90 | 28.61 | 43.72 | 18.32 | 43.39 | 42.43 | 32.32 | 38.88 |
| 2008 | 43.32 | 79.00 | 35.16 | 12.64 | 29.78 | 28.30 | 75.46 | 7.69 | 29.28 | 44.92 | 18.33 | 44.33 | 43.34 | 33.07 | 39.62 |
| 2009 | 44.40 | 80.00 | 36.22 | 12.71 | 29.90 | 28.94 | 77.28 | 7.77 | 30.26 | 46.75 | 18.40 | 45.61 | 44.53 | 34.55 | 40.47 |
| 2010 | 46.24 | 82.00 | 38.71 | 13.36 | 30.60 | 31.09 | 79.76 | 7.77 | 31.32 | 49.91 | 19.07 | 47.79 | 46.63 | 36.75 | 42.14 |
| 2011 | 47.54 | 84.00 | 40.43 | 13.48 | 31.15 | 32.61 | 81.74 | 8.06 | 32.49 | 51.98 | 19.51 | 49.29 | 48.13 | 38.74 | 43.22 |
| 2012 | 48.65 | 86.00 | 42.36 | 14.93 | 32.15 | 35.73 | 83.82 | 8.37 | 34.67 | 53.54 | 20.86 | 50.01 | 48.87 | 41.21 | 43.55 |
| 2013 | 50.75 | 88.00 | 45.65 | 15.51 | 32.78 | 37.66 | 85.10 | 10.05 | 37.07 | 56.91 | 22.00 | 52.21 | 51.31 | 42.65 | 46.02 |
| 2014 | 52.41 | 90.00 | 48.52 | 15.74 | 34.22 | 39.68 | 87.00 | 10.67 | 38.14 | 60.27 | 22.83 | 54.57 | 53.57 | 44.10 | 47.90 |
| 2015 | 53.67 | 91.00 | 50.95 | 16.70 | 35.51 | 41.95 | 88.45 | 11.12 | 39.49 | 61.86 | 24.15 | 55.74 | 54.54 | 45.49 | 48.89 |
| 2016 | 55.94 | 92.00 | 50.30 | 17.42 | 37.93 | 41.40 | 90.27 | 12.26 | 41.07 | 64.69 | 25.44 | 59.58 | 57.89 | 47.03 | 52.46 |
| 2017 | 58.40 | 92.00 | 51.05 | 18.05 | 40.70 | 45.66 | 90.99 | 14.56 | 43.13 | 67.05 | 26.00 | 61.64 | 60.58 | 48.43 | 55.86 |
| 2018 | 59.88 | 93.00 | 51.96 | 18.38 | 41.60 | 47.42 | 91.29 | 13.89 | 44.41 | 69.08 | 26.81 | 62.72 | 61.61 | 51.32 | 57.60 |
| 2019 | 62.19 | 93.00 | 52.69 | 18.93 | 44.38 | 50.87 | 91.85 | 16.71 | 46.19 | 71.16 | 28.14 | 65.19 | 64.02 | 54.19 | 60.39 |
| 2020 | 64.62 | 94.00 | 54.02 | 19.74 | 47.61 | 54.15 | 92.76 | 18.62 | 47.43 | 72.80 | 30.19 | 67.35 | 66.18 | 55.92 | 63.12 |
| 2021 | 66.26 | 94.00 | 55.44 | 20.75 | 48.80 | 56.52 | 92.85 | 18.60 | 48.28 | 74.78 | 31.19 | 68.69 | 67.52 | 57.69 | 64.63 |
| 2022 | 67.68 | 95.00 | 55.38 | 21.79 | 50.52 | 58.76 | 93.00 | 19.05 | 49.58 | 76.30 | 32.37 | 70.22 | 69.06 | 58.31 | 66.22 |
| 2023 | 69.15 | 95.00 | 57.34 | 21.32 | 51.88 | 59.29 | 92.98 | 18.96 | 51.10 | 78.24 | 31.77 | 72.24 | 70.87 | 59.01 | 68.00 |
Appendix D. SDG 12 Index for 2000–2023 [9].
| year | World | HIC | LAC | LIC | LMIC | MENA | OECD |
Oce_ ania |
SIDS | UMIC | Africa | BRICS |
BRICS plus |
E_S_ Euro |
E_S_ Asia |
| 2000 | 80.27 | 51.00 | 84.60 | 95.83 | 90.25 | 84.10 | 54.58 | 92.67 | 79.31 | 81.07 | 95.15 | 84.00 | 84.20 | 80.09 | 85.90 |
| 2001 | 80.49 | 52.00 | 84.62 | 95.79 | 90.27 | 83.88 | 55.45 | 92.71 | 79.33 | 81.08 | 95.12 | 84.01 | 84.21 | 79.95 | 85.92 |
| 2002 | 80.55 | 52.00 | 84.73 | 95.78 | 90.36 | 83.67 | 55.75 | 92.75 | 79.37 | 80.81 | 95.16 | 83.87 | 84.08 | 79.94 | 85.83 |
| 2003 | 80.27 | 51.00 | 84.46 | 95.77 | 90.33 | 83.57 | 55.34 | 92.79 | 79.42 | 80.11 | 95.07 | 83.36 | 83.59 | 79.64 | 85.44 |
| 2004 | 79.85 | 51.00 | 84.16 | 95.75 | 90.08 | 83.05 | 55.19 | 92.83 | 79.46 | 79.15 | 95.06 | 82.50 | 82.77 | 79.72 | 84.68 |
| 2005 | 79.71 | 51.00 | 84.10 | 95.64 | 89.92 | 82.81 | 55.33 | 92.86 | 79.50 | 78.73 | 95.03 | 82.09 | 82.39 | 79.80 | 84.31 |
| 2006 | 79.42 | 51.00 | 83.84 | 95.67 | 89.71 | 82.56 | 55.27 | 92.90 | 79.47 | 78.03 | 95.02 | 81.45 | 81.76 | 79.35 | 83.78 |
| 2007 | 79.14 | 51.00 | 83.42 | 95.64 | 89.21 | 82.23 | 55.29 | 92.94 | 79.37 | 77.70 | 94.89 | 80.93 | 81.26 | 78.87 | 83.32 |
| 2008 | 79.12 | 52.00 | 83.13 | 95.58 | 88.97 | 81.86 | 56.16 | 92.97 | 79.28 | 77.39 | 94.84 | 80.52 | 80.86 | 78.15 | 83.02 |
| 2009 | 79.27 | 54.00 | 83.56 | 95.64 | 88.74 | 81.25 | 57.88 | 93.01 | 79.19 | 77.02 | 94.92 | 79.97 | 80.32 | 79.34 | 82.47 |
| 2010 | 79.03 | 53.00 | 83.07 | 95.66 | 88.50 | 81.74 | 57.47 | 93.05 | 79.11 | 76.62 | 94.83 | 79.47 | 79.90 | 79.17 | 82.11 |
| 2011 | 78.74 | 53.00 | 82.70 | 95.67 | 88.13 | 81.58 | 57.48 | 93.09 | 79.10 | 76.08 | 94.80 | 78.83 | 79.30 | 78.08 | 81.63 |
| 2012 | 78.68 | 54.00 | 82.52 | 95.66 | 87.82 | 81.07 | 57.81 | 93.12 | 79.12 | 75.92 | 94.78 | 78.51 | 78.98 | 77.87 | 81.39 |
| 2013 | 78.72 | 54.00 | 82.43 | 95.77 | 87.73 | 81.08 | 57.98 | 93.15 | 79.13 | 75.87 | 94.70 | 78.47 | 78.96 | 78.04 | 81.32 |
| 2014 | 78.86 | 54.00 | 82.44 | 95.75 | 87.40 | 81.19 | 58.29 | 93.18 | 79.14 | 76.42 | 94.65 | 78.57 | 79.07 | 78.71 | 81.32 |
| 2015 | 79.28 | 54.00 | 82.71 | 95.88 | 87.64 | 81.75 | 58.81 | 93.21 | 79.14 | 76.94 | 94.82 | 79.10 | 79.59 | 79.41 | 81.66 |
| 2016 | 79.61 | 55.00 | 82.84 | 95.86 | 87.64 | 82.13 | 58.86 | 93.10 | 78.94 | 77.66 | 94.81 | 79.73 | 80.21 | 79.29 | 82.12 |
| 2017 | 79.57 | 55.00 | 82.66 | 95.88 | 87.40 | 82.47 | 58.72 | 92.98 | 78.70 | 77.72 | 94.81 | 79.60 | 80.12 | 79.23 | 81.98 |
| 2018 | 79.40 | 55.00 | 82.61 | 95.93 | 86.99 | 82.44 | 58.69 | 92.87 | 78.50 | 77.58 | 94.79 | 79.26 | 79.83 | 78.99 | 81.60 |
| 2019 | 79.46 | 55.00 | 82.49 | 95.96 | 87.00 | 82.54 | 58.91 | 92.78 | 78.31 | 77.44 | 94.76 | 79.19 | 79.78 | 79.01 | 81.56 |
| 2020 | 79.74 | 55.00 | 82.70 | 96.07 | 87.22 | 83.04 | 59.38 | 92.80 | 78.37 | 77.53 | 95.03 | 79.23 | 79.86 | 79.30 | 81.66 |
| 2021 | 79.65 | 55.00 | 82.39 | 96.11 | 87.15 | 83.28 | 58.99 | 92.82 | 78.45 | 77.33 | 95.00 | 79.11 | 79.79 | 79.27 | 81.53 |
| 2022 | 80.01 | 56.00 | 82.61 | 96.14 | 87.23 | 83.51 | 60.34 | 92.83 | 79.96 | 77.40 | 95.03 | 79.00 | 79.72 | 79.74 | 81.57 |
| 2023 | 80.30 | 58.00 | 82.56 | 96.20 | 87.09 | 83.53 | 62.21 | 92.86 | 80.09 | 77.21 | 95.08 | 78.62 | 79.40 | 79.94 | 81.31 |
References
- In Solidarity for a Green World, COP 29, Baku. https://cop29.az/en/home (accessed Jan. 2025).
- Conference of the Parties (COP). https://unfccc.int/process/bodies/supreme-bodies/conference-of-the-parties-cop (accessed Jan 2025).
- The Paris Agreement. https://unfccc.int/process-and-meetings/the-paris-agreement (accessed 2025).
- 2024 is on track to be the hottest year on record as warming temporarily hits 1.5°C on Nov. 11, 2024. https://wmo.int/news/media-centre/2024-track-be-hottest-year-record-warming-temporarily-hits-15degc (accessed Jan 2025).
- Sustainability. https://cop29.az/en/policies/sustainability-policy (accessed Jan 2025).
- Azerbaijan Oil. https://www.worldometers.info/oil/azerbaijan-oil/#oil-production (accessed Jan 2025).
- Azerbaijan - Country Commercial Guide, 2023-11-21. https://www.trade.gov/country-commercial-guides/azerbaijan-market-overview (accessed Jan 2025).
- Sachs, J.D., Lafortune, G., Fuller, G. (2024). The SDGs and the UN Summit of the Future. Sustainable Development Report 2024. Paris: SDSN, Dublin: Dublin University Press. [CrossRef]
- Sustainable Development Report 2024, Dashboard, https://dashboards.sdgindex.org/explorer (accessed Jan 2025).
- COP29 ends with a compromise on climate financing (Nov. 25, 2024). https://wmo.int/media/news/cop29-ends-compromise-climate-financing (accessed Jan 2025).
- Munda, G. (2008). Social Multi-Criteria Evaluation for a Sustainable Economy. Springer-Verlag, Berlin. https://www.springer.com/la/book/9783540737025.
- Bruggemann, R. and Patil, G.P. (2011). Ranking and Prioritization for Multi-indicator Systems - Introduction to Partial Order Applications. Springer, New York; https//www.springer.com/gp/book/9781441984760.
- Bruggemann, R. and Carlsen, L. (2006). Introduction to partial order theory exemplified by evaluating sampling sites, In: R. Bruggemann and L. Carlsen (Eds.), Partial Order in Environmental Sciences and Chemistry, Springer, Berlin, 61–110. Available from: https://www.springer.com/gp/book/9783540339687.
- Bruggemann, R.; Annoni, P. (2014). Average Heights in Partially Ordered Sets, MATCH Commun. Math. Comput. Chem. 71, 117–142.Available online: http://match.pmf.kg.ac.rs/electronic_versions/Match71/n1/match71n1_117-142.pdf.
- De Loof, K., De Meyer, H. & De Baets, B. (2006). Exploiting the lattice of ideals representation of a poset . Fundamenta Informaticae, 71, 309–321; https://dl.acm.org/doi/abs/10.5555/1227505.1227514.
- Carlsen, L. (2024) Sustainability: An ethical challenge: The overexploitation of the planet as an exemplary case. Sustainability 16, 3390. [CrossRef]
- Build resilient infrastructure, promote inclusive and sustainable industrialization and foster innovation. https://sdgs.un.org/goals/goal9 (accessed Jan 2025).
- Ensure sustainable consumption and production patterns (accessed Jan 2025). https://sdgs.un.org/goals/goal12.
- Average greenhouse gas emissions per kilogram of major food products worldwide. https://www.statista.com/statistics/1201677/greenhouse-gas-emissions-of-major-food-products/.
Figure 1.
Mutal ranking of the fourteen regions and the world based on the total SDG indexes.
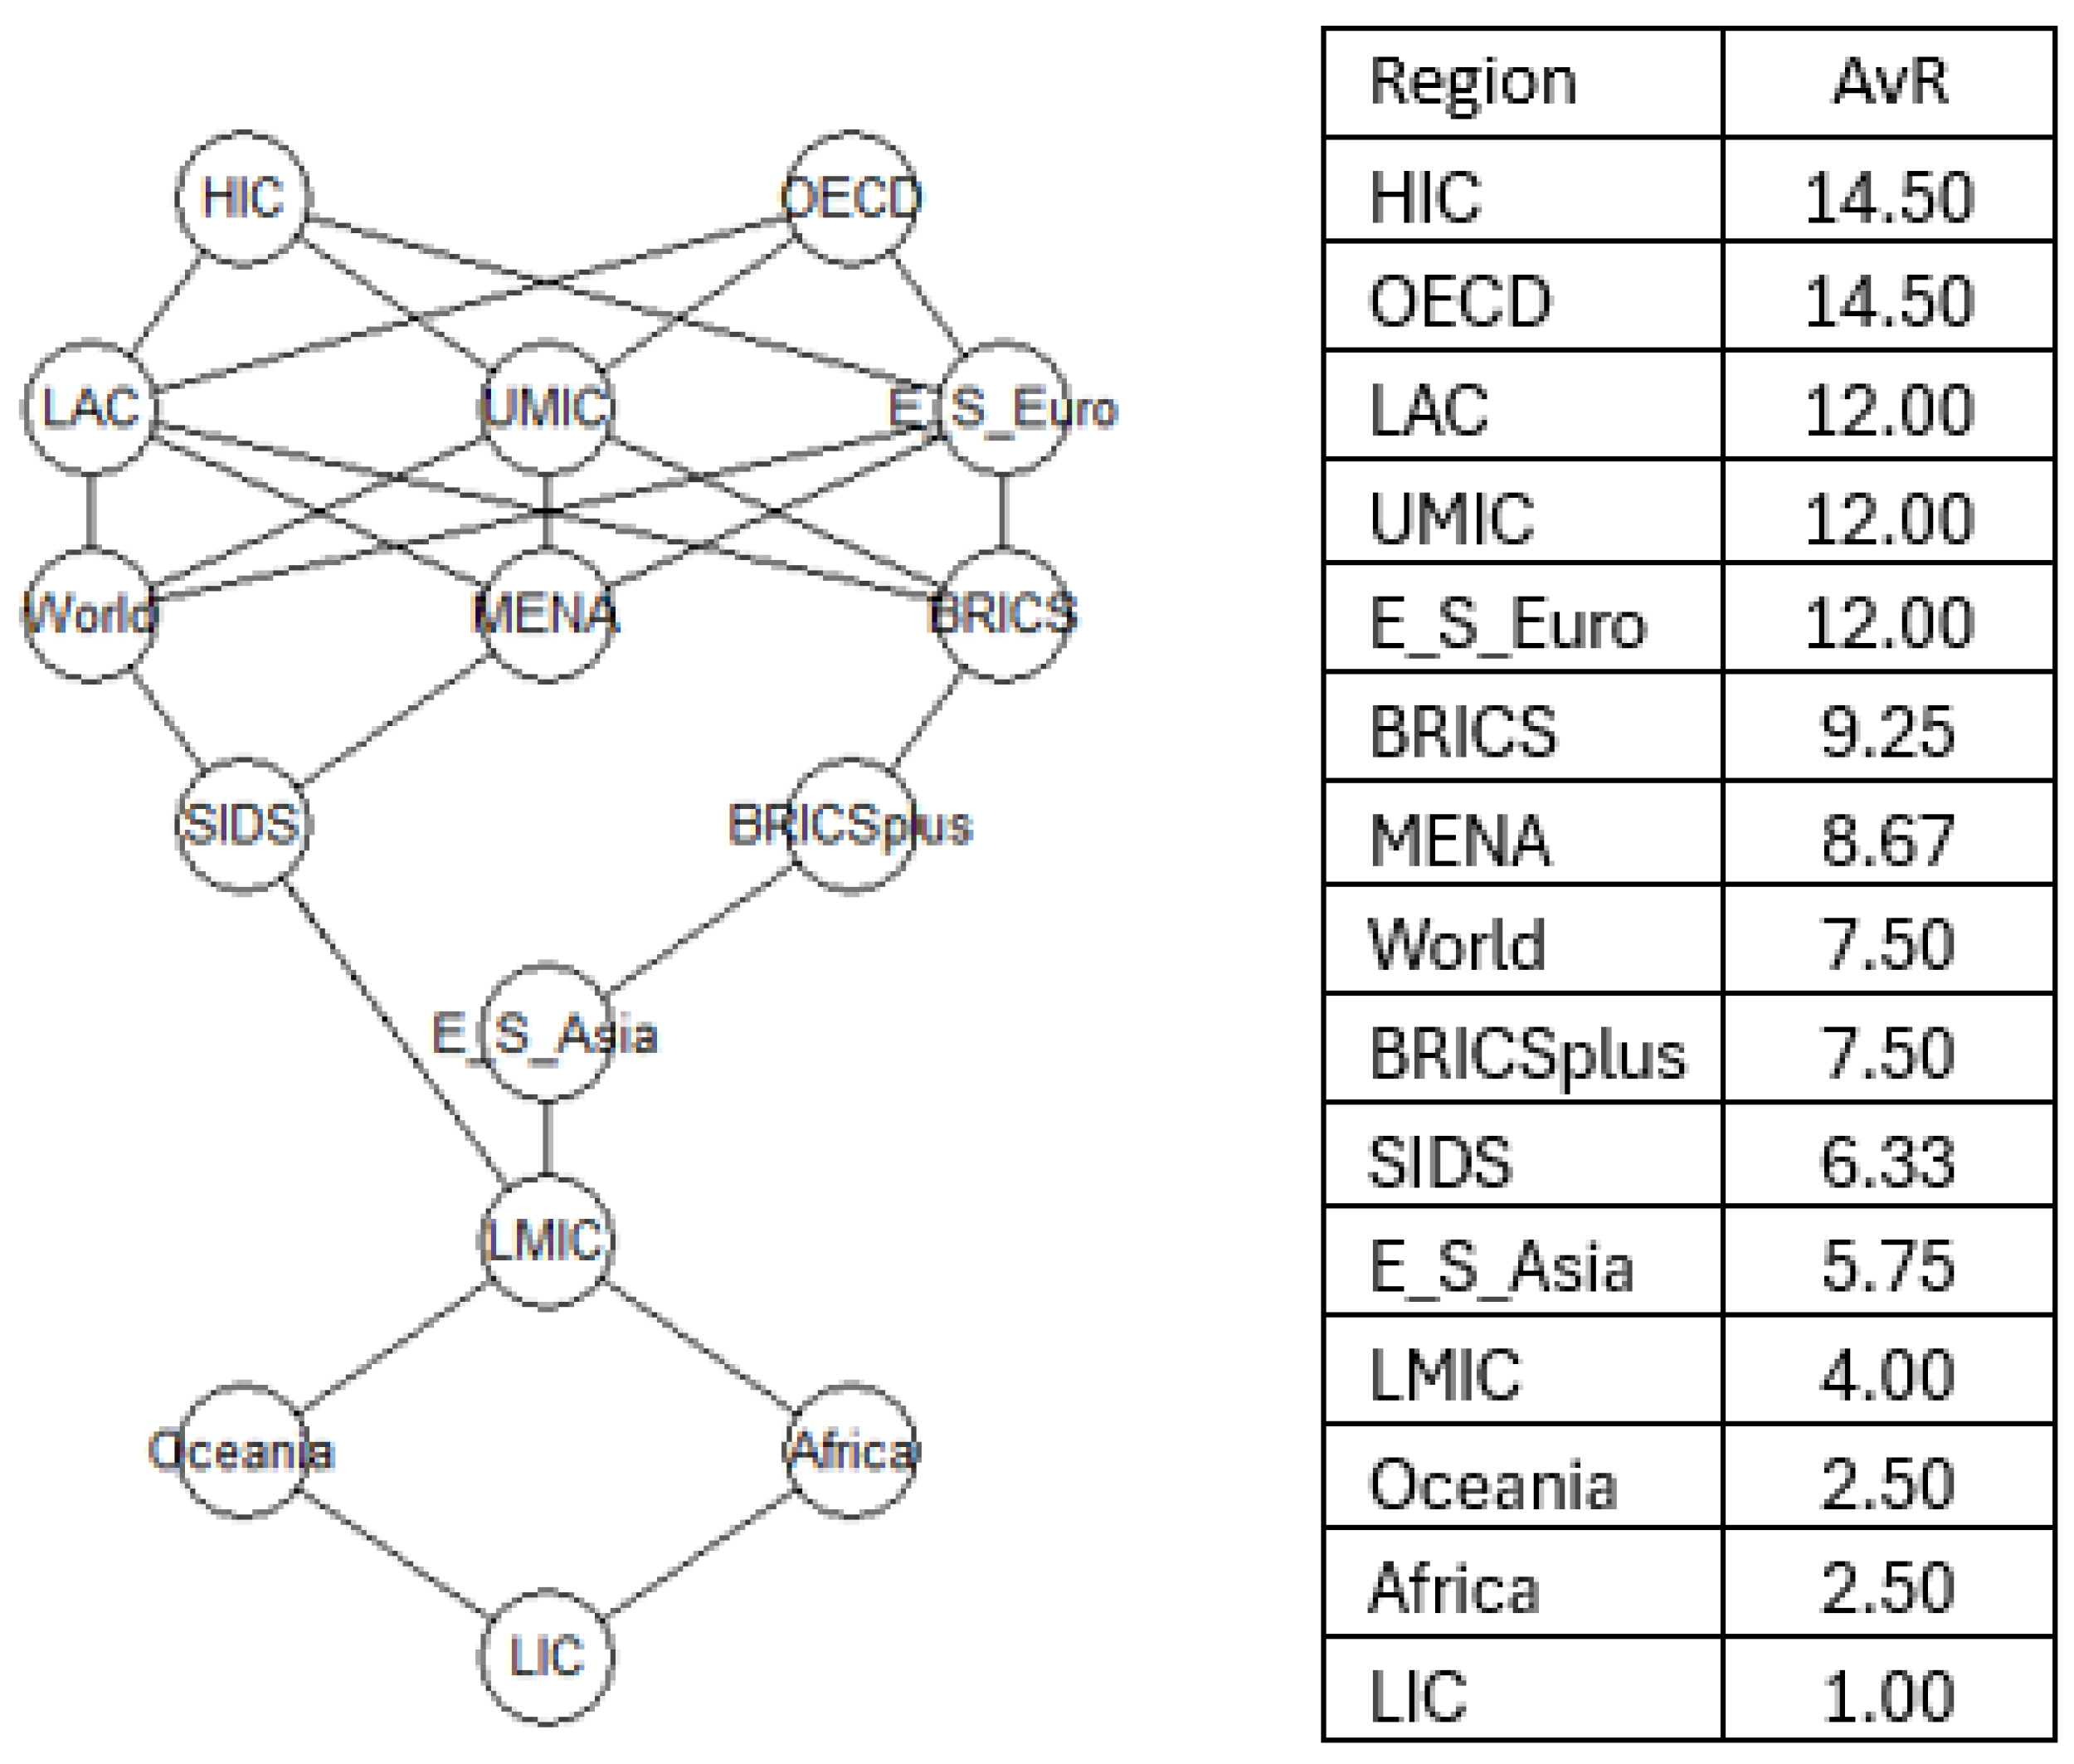
Figure 2.
Mutal ranking of the fourteen regions and the world based on the SDG 13 indexes.
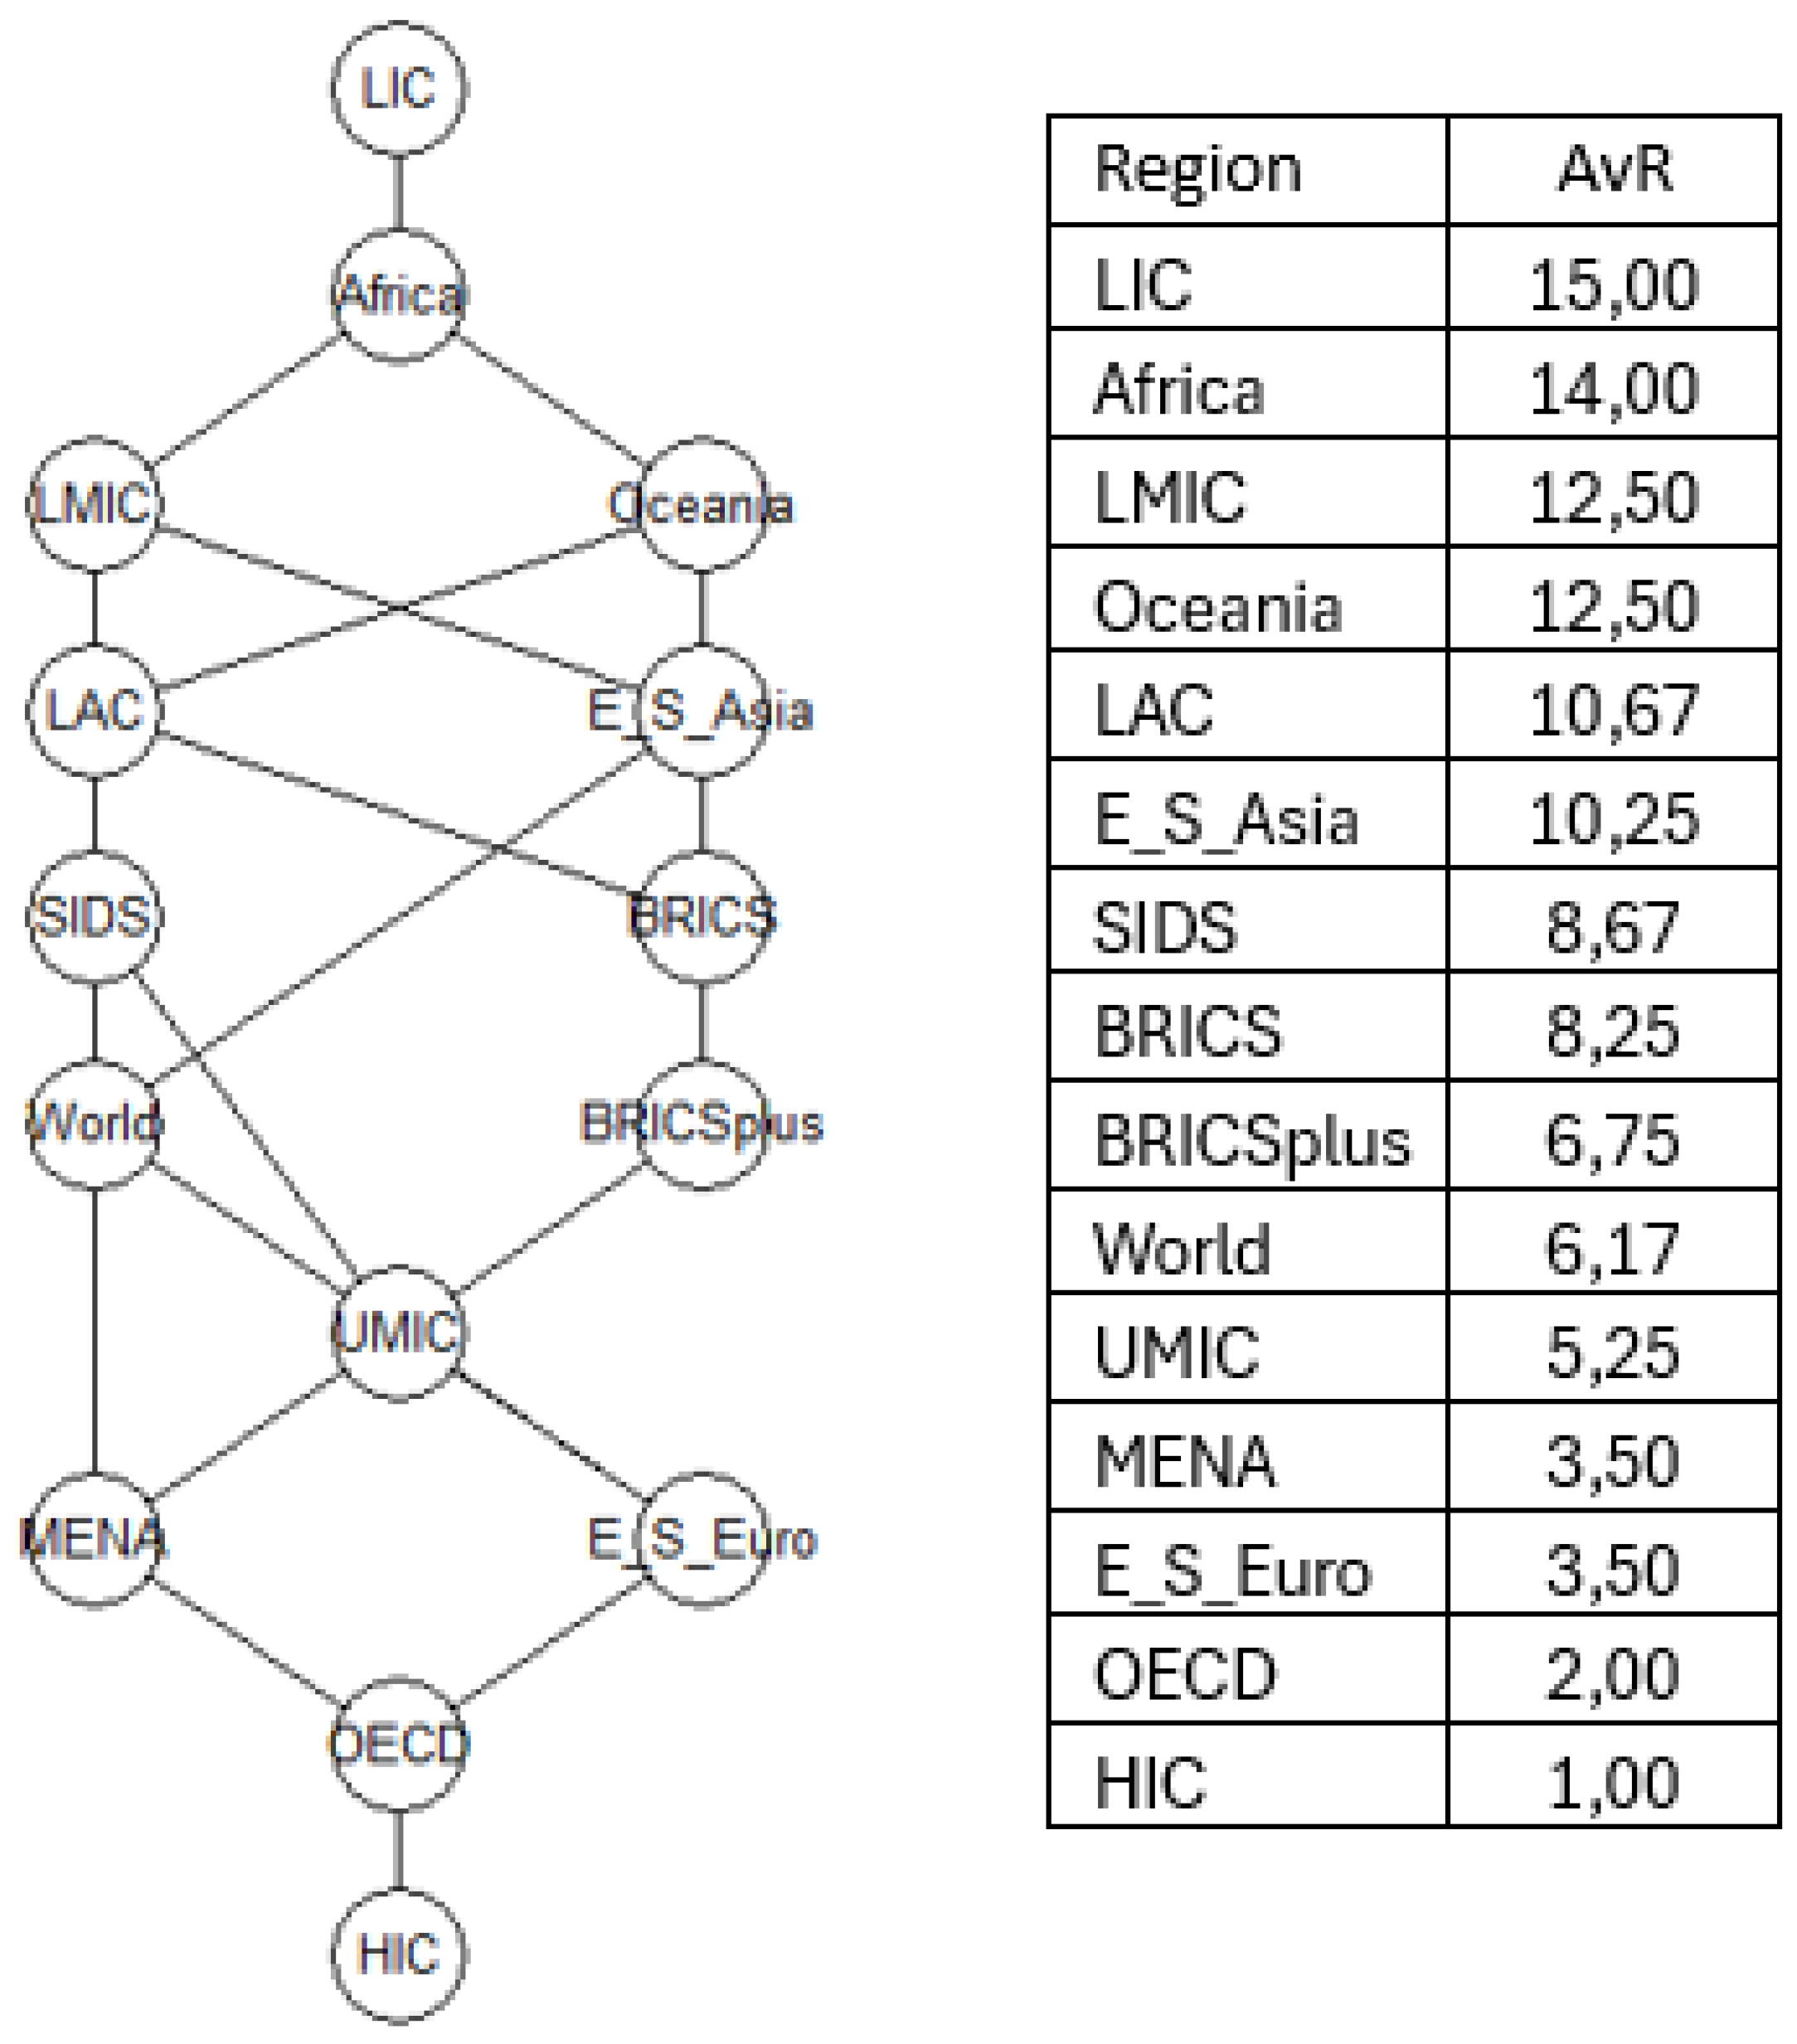
Figure 3.
Development in the SDG 13 index for the fourteen regions and the world for the 2000 – 2023 years period.
Figure 3.
Development in the SDG 13 index for the fourteen regions and the world for the 2000 – 2023 years period.
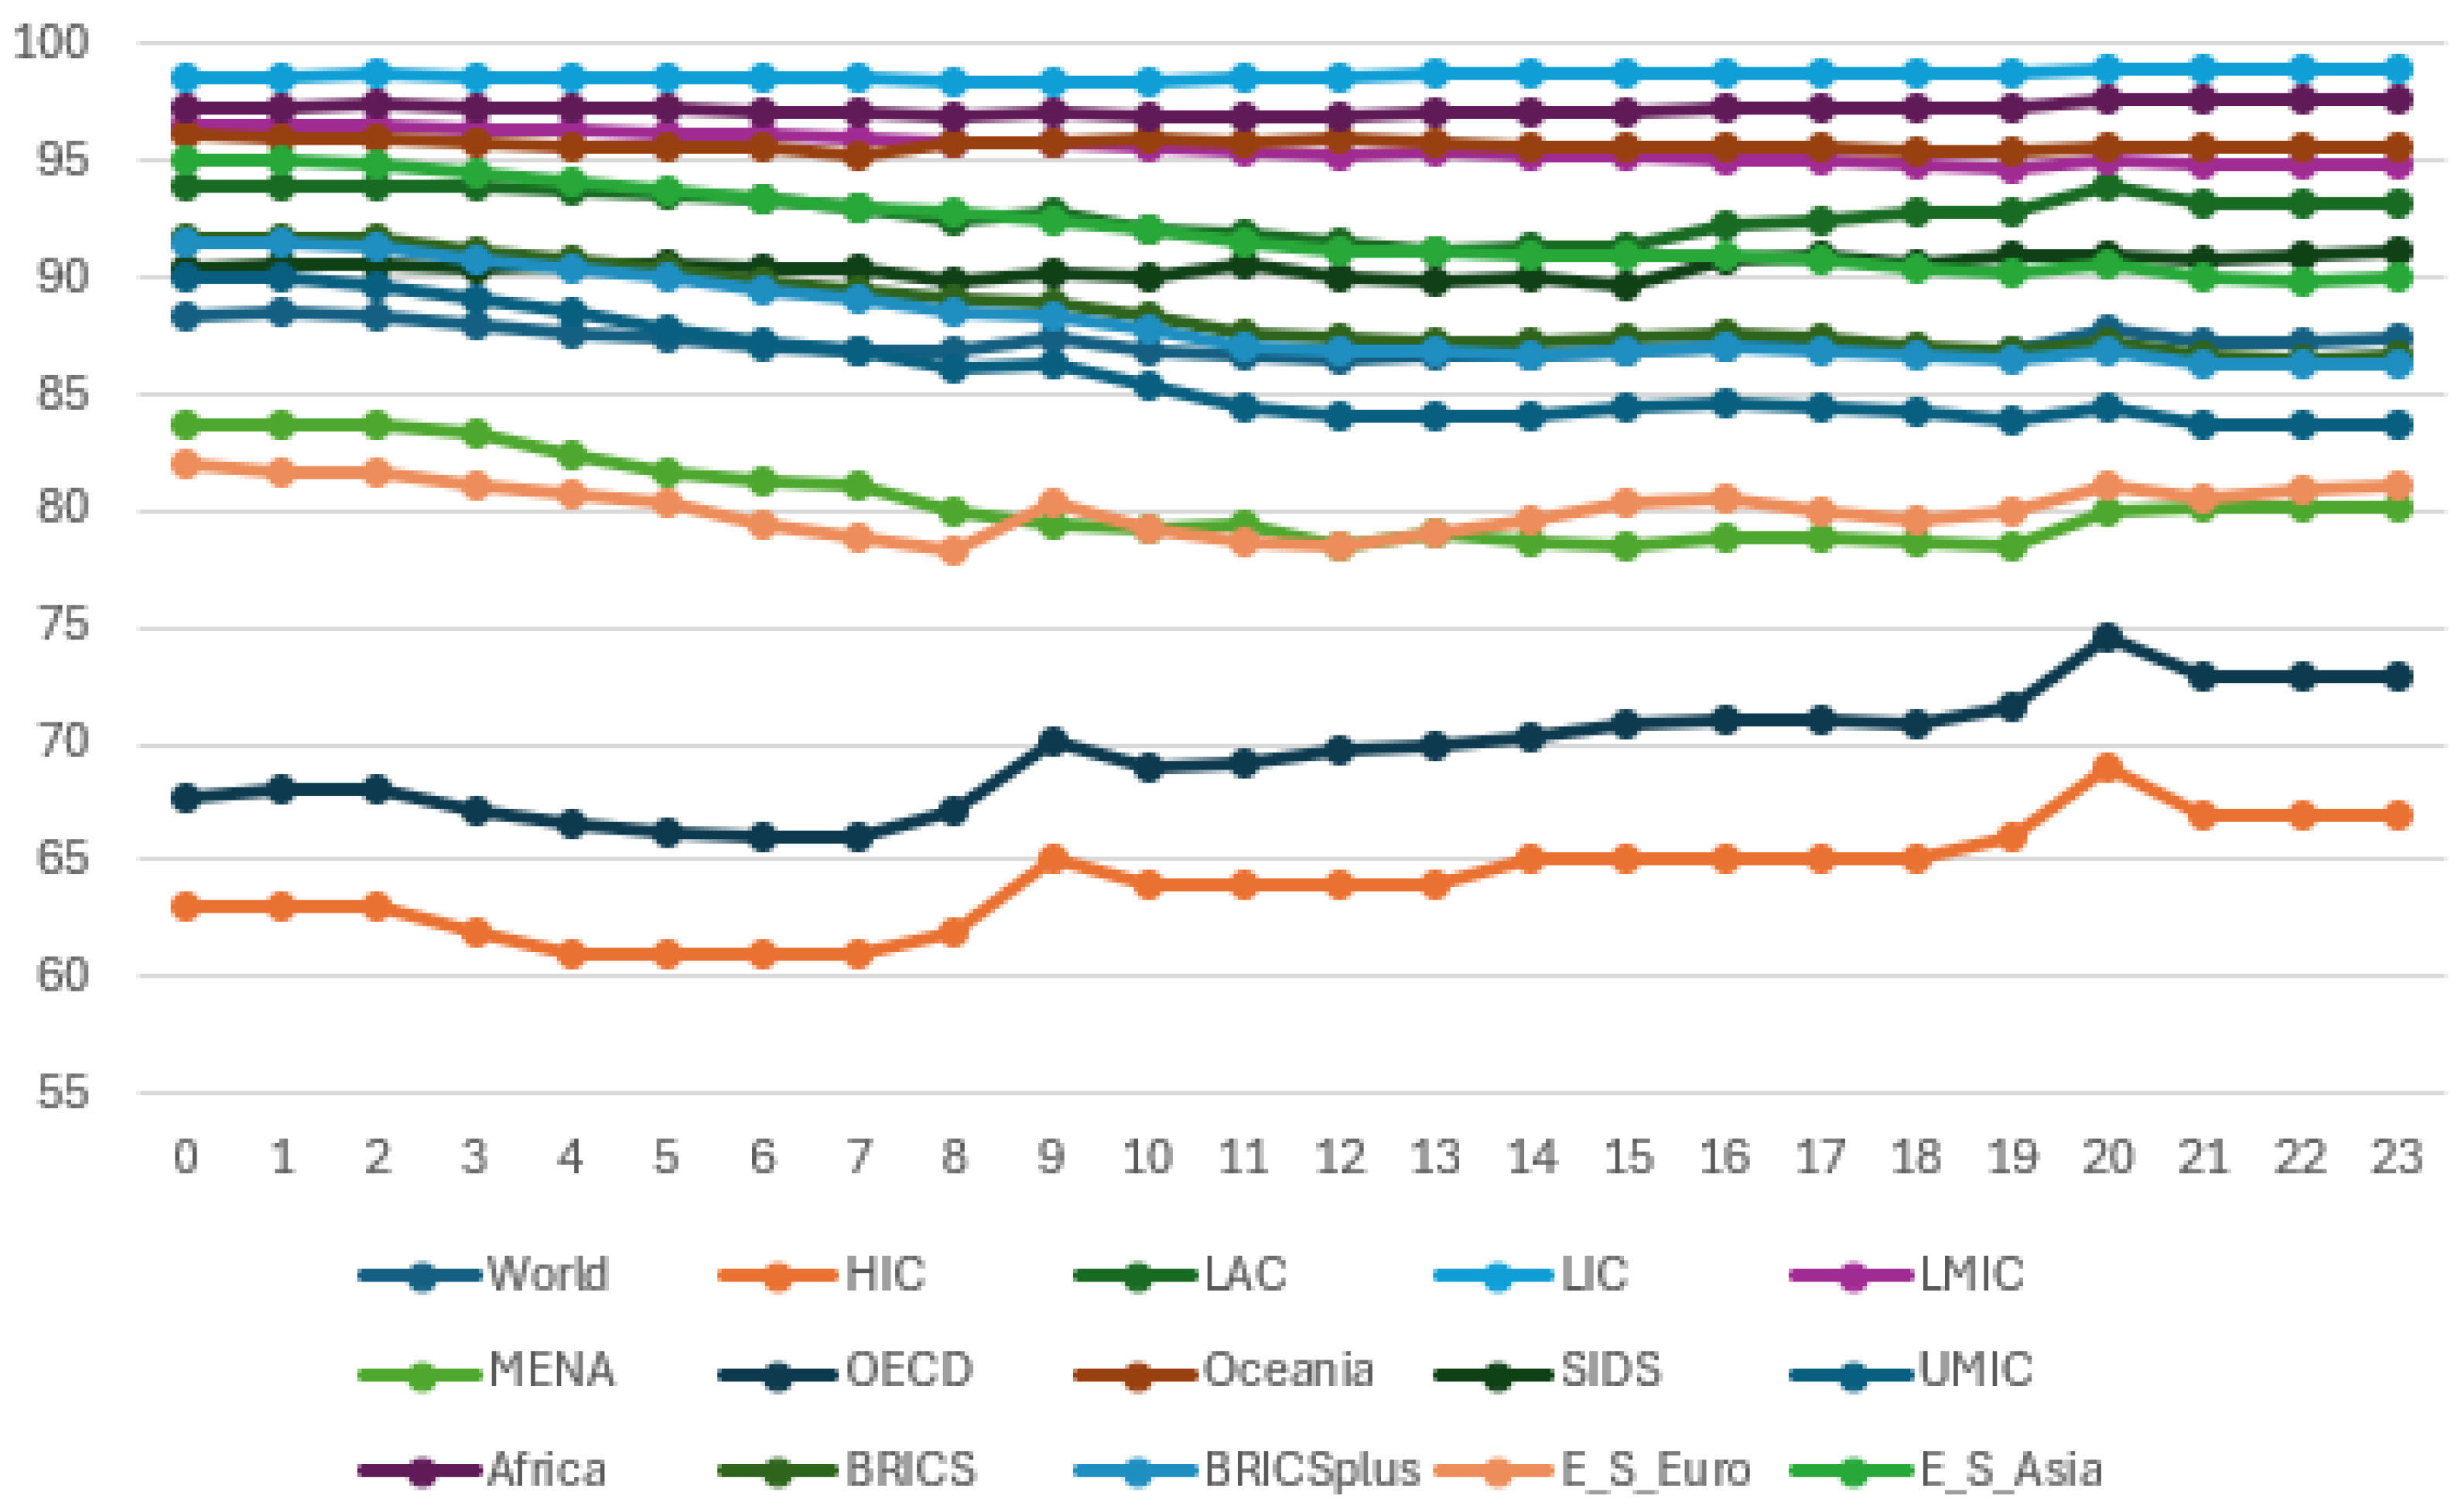
Figure 4.
Mutal ranking of the fourteen regions and the world based on the SDG 9 and 12 indexes.
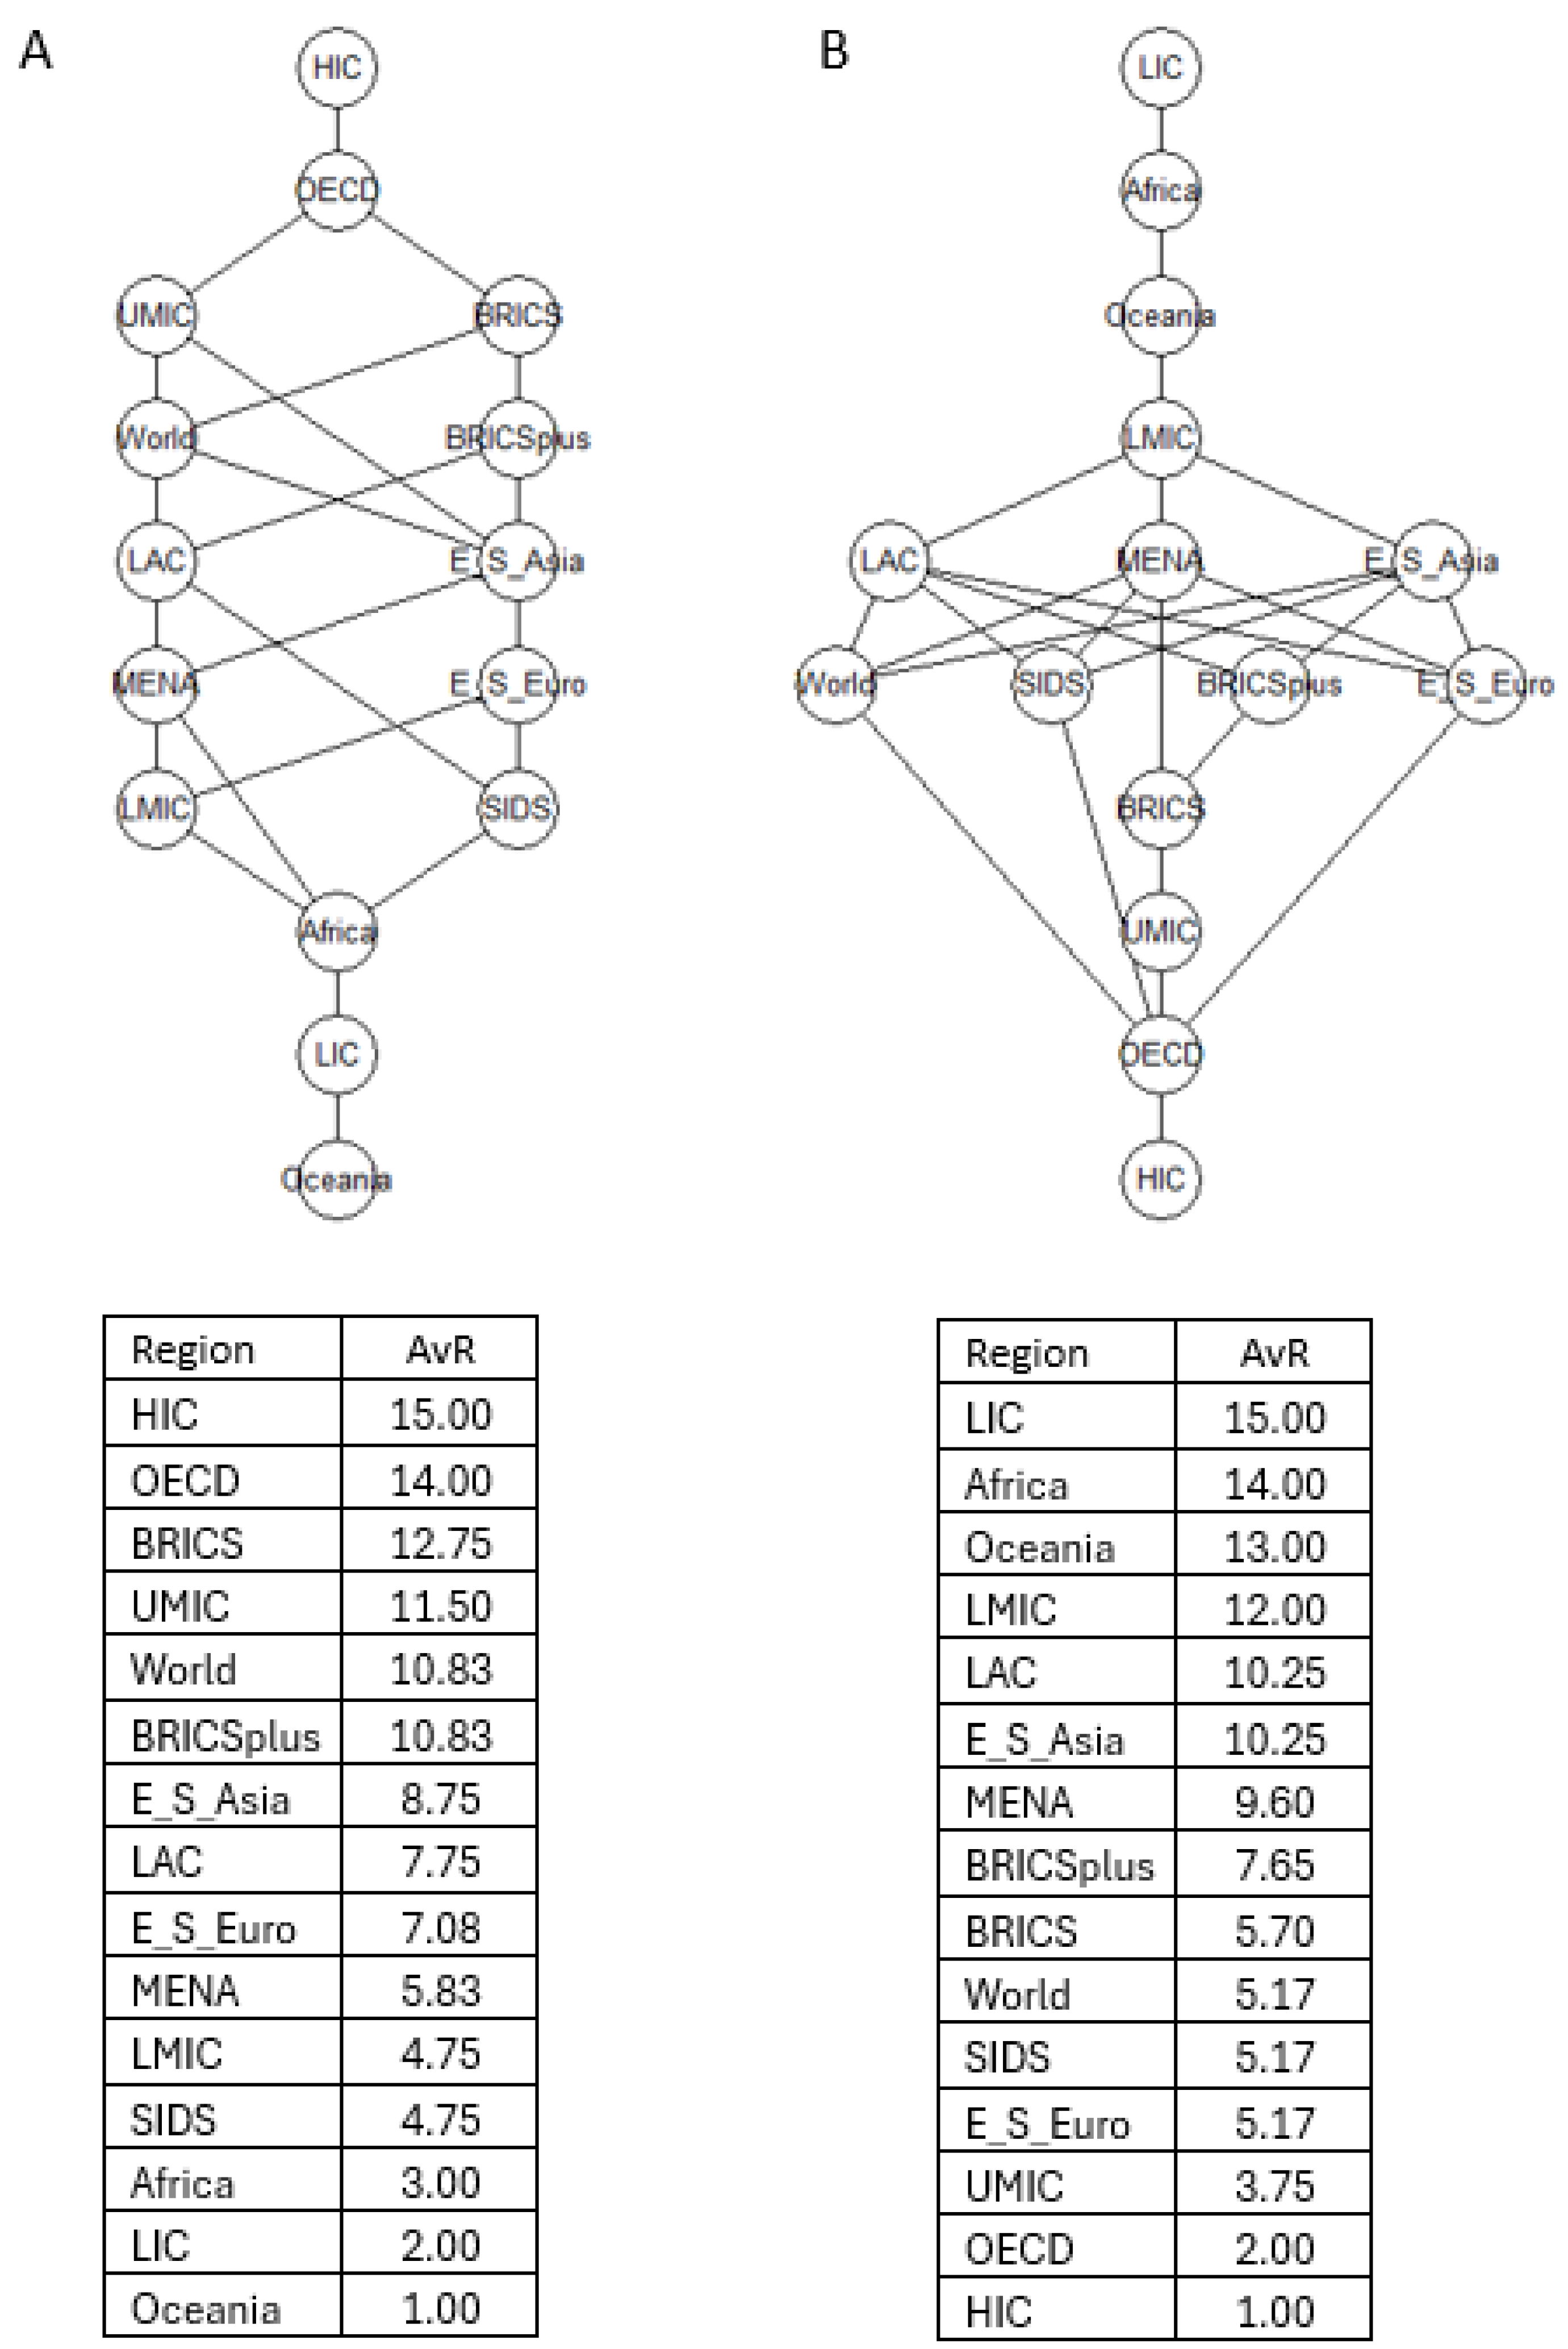
Figure 5.
Development in the A: SDG 9 and B: SDG 12 indexes for the fourteen regions and the worldfor the 2000 – 2023 years period.
Figure 5.
Development in the A: SDG 9 and B: SDG 12 indexes for the fourteen regions and the worldfor the 2000 – 2023 years period.
Disclaimer/Publisher’s Note: The statements, opinions and data contained in all publications are solely those of the individual author(s) and contributor(s) and not of MDPI and/or the editor(s). MDPI and/or the editor(s) disclaim responsibility for any injury to people or property resulting from any ideas, methods, instructions or products referred to in the content. |
© 2025 by the authors. Licensee MDPI, Basel, Switzerland. This article is an open access article distributed under the terms and conditions of the Creative Commons Attribution (CC BY) license (http://creativecommons.org/licenses/by/4.0/).
Copyright: This open access article is published under a Creative Commons CC BY 4.0 license, which permit the free download, distribution, and reuse, provided that the author and preprint are cited in any reuse.


