
Submitted:
23 January 2025
Posted:
23 January 2025
You are already at the latest version
Preprints on COVID-19 and SARS-CoV-2
Abstract
Liver transplant recipients (LTR) have been considered a population group vulnerable to COVID-19 disease as they are chronically immunosuppressed patients with frequent comorbidities. This study describes the course of SARS-CoV-2 disease from February 2020 to December 2023 along seven pandemic “waves". We carried out an observational study on a 307 COVID-19 cases cohort in LTR with the aim of evaluating the changes in the disease characteristics over time and determining the risk factors for severe COVID-19. Older age and serum creatinine ≥ 2 mg/dL were found to be risk factors for hospital admission and respiratory failure. Calcineurin inhibitors was a protective factor for death from COVID-19, hospitalization and respiratory failure. 100% of patients who died (N = 12) were on mycophenolate mofetil, which was a determinant for respiratory failure. Azathioprine was associated with admission to the Intensive Care Unit (ICU) and with invasive mechanical ventilation (IMV). Vaccination was a protective factor for hospitalization, respiratory failure and mortality. Severe COVID-19 rate was higher during the first five waves, with a peak of 57.14% and the highest mortality rate (21.43%), in the 4th wave. IMV and ICU admission rates did not show significant differences across the periods.
Keywords:
SARS-CoV-2
; liver transplant recipients
; liver transplantation
; COVID-19 disease
; COVID-19 waves
; immunosuppression
; epidemiology
; vaccination
1. Introduction
Since the outbreak of the coronavirus disease 2019 (COVID-19) pandemic caused by Severe Acute Respiratory Syndrome Coronavirus 2 (SARS-CoV-2), the number of cases registered by the WHO amounts to 776 million worldwide, with more than 7 million deaths [1]. Spain was the European country that suffered the fastest spread during the first months of the COVID-19 pandemic [2], which resulted in the temporary suspension of transplantation activity in multiple centers [3,4,5].
Solid organ transplant recipients have been considered a population group particularly vulnerable to COVID-19 disease as they are chronically immunosuppressed patients with frequent comorbidities [6,7,8,9]. The cumulative incidence of COVID-19 cases in liver transplant recipients (LTR) has been approximately twice as high as in the non-transplanted population [7]. During the first months of the pandemic, the frequency of organ rejection and the overall in-hospital mortality increased in this group of patients [10].
The development and wide distribution of the different vaccines led to a change in the course of COVID-19 disease. In LTR it has shown to reduce infection rates, symptomatic disease [11], hospitalization [12], need for admission to the ICU or mechanical ventilation [13] and mortality, especially in fully vaccinated patients [11,12,13].
The 12 de Octubre University Hospital is one of the 26 centers that carry out adult liver transplantation in Spain [14,15]. Since the beginning of the SARS-CoV2 pandemic, the consequences of the COVID-19 disease on our solid organ transplant recipients have been studied [8,16,17,18,19].
The present study describes the course of SARS-CoV-2 disease from February 2020 to December 2023, along successive pandemic periods or “waves".
2. Patients and Methods
- 1.
- Aims and objectives
This study aims to describe the characteristics of COVID-19 diagnosed LTR throughout the successive pandemic stages or "waves", evaluating the particularities and changes over the course of the disease and its management over time, determining the risk factors for severe COVID-19 disease in LTR and assessing the previously described in literature.
- 2.
- Study design
A single-center observational descriptive study was carried out on a 307 COVID-19 cases cohort at the 12 de Octubre University Hospital in Madrid, from February 2020 to December 2023, in LTR.
A case-registry database was created. The patients were recruited through communications to the transplant clinic, whether they required or not admission due to the infection, plus those who were admitted to the hospital due to COVID-19 disease. Data were obtained by conducting a survey during the follow-up consultation in person or by telephone, completing the information with the hospital electronic medical record and medical reports from other centers.
- 3.
- Data collection
Epidemiological data (sex, age), comorbidities (history of obesity, hypertension, chronic obstructive pulmonary disease, asthma, chronic and/or acute kidney disease, smoking), transplant-related data (indication and date of transplantation, immunosuppression), COVID-19-related data (symptoms, technique and date of diagnosis, treatment received, vaccination, association with altered liver enzymes), survival data (death due to COVID or other causes, overall survival) and follow-up data were collected.
The development of thrombotic events such as infarction, pulmonary thromboembolism or deep vein thrombosis [20] in the context of COVID-19 disease was also investigated and/or questioned.
- 4.
- Definitions
Comorbidities. The following comorbidities were considered independently:
- (1)
- Obesity (Body mass index ≥ 30 kg/m 2).
- (2)
- Acute or chronic kidney disease (presence at diagnosis of plasma creatinine ≥ 2 mg/dL due to acute kidney injure, or as the baseline creatinine in patients with chronic kidney disease).
- (3)
- Chronic obstructive pulmonary disease.
- (4)
- Bronchial asthma.
- (5)
- Hypertension (HTN).
- (6)
- Type 2 diabetes mellitus (T2D).
- (7)
- Cardiovascular events or cardiovascular risk factors: arrhythmia, infarction, cardiomyopathy, heart failure or coronary artery disease or the combination of HTN, T2D and dyslipidemia as cardiovascular risk factors.
- (8)
- Altered liver enzymes (elevation of liver enzyme (aminotransferase) above the upper limit of normal).
Diagnostic criteria for COVID-19. The following have been considered diagnostic for COVID-19:
- (1)
- A positive real-time polymerase chain reaction (RT-PCR) test for SARS-CoV-2.
- (2)
- A positive antigen detection test [21].
- (3)
- Patients with compatible symptoms and radiological findings suggestive of COVID-19, during the first weeks of the study, prior to the establishment of diagnostic tests [22].
- (4)
Severe COVID-19 disease. Five scenarios were described [9]:
- (1)
- Required hospitalization.
- (2)
- Required admission to the Intensive Care Unit (ICU).
- (3)
- Associated respiratory failure: baseline oxygen saturation ≤ 93%, partial blood pressure of oxygen (PaO2) / oxygen concentration (FiO2) ≤ 30 mmHg [25]. Need for non-invasive ventilatory support.
- (4)
- Required invasive mechanical ventilation (IMV).
- (5)
- Died from COVID-19 disease.
3. Study Time
To assess the evolution of the characteristics of the disease throughout the pandemic, patients have been grouped into seven periods or "waves" taking as a reference the periods published by the Carlos III Institute [26] and extending the first and last period to include all patients diagnosed with SARS-CoV-2 during the study.
- -
- First period: From March 1st, 2020, to June 21st, 2020, the date on which the state of alarm in Spain ended once the first epidemic wave of COVID-19 ended.
- -
- Second period: From June 22nd to December 6th, 2020.
- -
- Third period: From December 7th, 2020, to March 14th, 2021.
- -
- Fourth period: From March 15th, 2021, to June 19th, 2021.
- -
- Fifth period: From June 20th, 2021, to October 13rd, 2021.
- -
- Sixth period: From October 14th, 2021, to March 27 th, 2022.
- -
- Seventh period: From March 28th, 2022, to December 31st, 2023.
4. Inclusion Criteria
Patients with a history of liver transplantation for any indication, aged ≥ 18 years, who meet diagnostic criteria for COVID-19.
5. Exclusion Criteria
Patients with a history of transplantation of other solid organs or with multi-organ transplantation.
< 18 years of age.
Insufficient data were provided.
6. Statistital Analysis
The data set of the study was summarized with descriptive statistical analysis. Quantitative variables were expressed as mean and standard deviation (SD) or median (p50) and interquartile range (IQR, p25-p75). Normality of the distributions was tested with Saphiro-Wilk. Qualitative variables were expressed in absolute numbers (number of cases) and relative frequencies (percentage).
Relationships and comparison between groups [1] patients hospitalized vs. COVID-19 disease outpatient management, [2] admitted or not to the ICU; [3] with or without respiratory failure; [4] patients who required or did not require invasive mechanical ventilation; [5] patients who did or did not die from COVID-19 and [6] differences between the waves] were evaluated using the chi-square test (χ2) or Fisher's exact test, Student's t test, Mann-Whitney U test, ANOVA or Kustal-Wallis test, as appropriate.
Binary logistic regression was used to analyze the risk factors associated with each one of the severe COVID-19 scenarios. The results were expressed as odds ratio (OR) with a 95% confidence interval (CI). Subsequent multivariate analysis was performed in those severe COVID-19 scenarios groups with a N ≥ 30 (respiratory failure group and hospital admission group), considering risk factors that were found to be statistically significant in the univariate analysis and those considered relevant within the study objectives, using the stepwise regression method.
Survival analysis was performed using the Kaplan-Meier method. Log rank test was used to statistically compare the curves. Multivariable Cox regression analysis was used to explore predictors of death related to COVID-19.
The statistical software used was Stata for Windows version 16 (StataCorp. 2019. Stata Statistical Software: Release 16. College Station, TX: StataCorp LLC). All analyses were conducted using an alpha significance level of 5% for a two-tailed p-value.
Ethical and Regulatory Approval
The local Clinical Research Ethics Committee approved the study protocol (ref. no. 20/151) and granted a waiver of informed consent due to its retrospective observational design.
Results
- 1.
- Characteristics of the study population
542 patients who attended follow-up consultations or were admitted to hospital during the study period were contacted in person and/or by telephone. Of these, 281 patients were identified as having been diagnosed with COVID-19. A total of 307 cases of COVID-19 disease were diagnosed, as 1 patient suffered 2 reinfections, and 24 patients had 1 reinfection. 24, 40, 21, 14, 10, 63 and 135 cases of disease were diagnosed in each period, respectively.
Of the 281 patients, 194 (69.04%) were male. The median age at diagnosis was 61 years (IQR 55 - 69). Regarding medical history, 13 (4.64%) had a history of COPD, 6 (2.14%) were asthmatic, 109 (38.93%) had hypertension and 115 (41.07%) had T2D. Obesity was reported in 57 patients (20.73%), and 46 (16.85%) were smokers.
171 patients (61.29%) had a history of cardiovascular events or a combination of multiple cardiovascular risk factors. In 23 cases (7.52%) the creatinine at diagnosis was greater than 2 mg/dl.
The main indications for liver transplantation were alcoholic cirrhosis in 99 patients (35.23%), followed by HCV cirrhosis in 94 patients (33.45%) and hepatocellular carcinoma in 82 (29.18%).
- 2.
- Symptoms
The median time from transplantation to diagnosis was 94.46 months (IQR 41.44 - 185.21).
Symptons at diagnosis are given in Table 1A. The main symptoms were cough in 120 cases (39.74%), asthenia in 98 (32.45%), fever in 77 cases (25.50%) and myalgia in 73 cases (24.17%). In 60 cases (19.87%) the disease was asymptomatic.
In this study, there were two thrombotic events associated with COVID-19 disease: one patient was diagnosed with a partial thrombosis of the inferior vena cava and another patient was diagnosed with an asymptomatic pulmonary thromboemnolism. No cases of acute graft dysfunction associated with COVID-19 disease were identified.
- 3.
- Immunosupression
At the time of diagnosis, 189 patients (61.76%) were receiving calcineurin inhibitors (CNIs), 184 (60.13%) mycophenolate mofetil (MMF), 40 (13.07%) mTOR inhibitors (mTORi), 17 (5.56%) were on corticosteroid treatment and 3 (0.98%) were receiving azathioprine (AZT).
- 4.
- Diagnosis of COVID-19 disease
The diagnosis was established by antigen detection testing in 186 cases (60.59%), by RT-PCR in 110 (35.83%), was serological in 6 cases (1.95%), and clinical in 5 cases (1.63%). In asymptomatic patients, diagnosis was carried out by performing a PCR prior to a scheduled admission or test or by obtaining a positive RT-PCR test after having been in close contact of confirmed COVID-19 cases.
A chest X-ray was performed in 84 cases, with a diagnosis of lobar pneumonia in 10 cases (3.64%) and bilateral pneumonia in 46 cases (16.73%). Radiological findings throughout the waves are given in Table 1B.
- 5.
- Treatment for COVID-19 disease
Treatment for COVID-19 disease is given in Table 2. 64 cases (20.84%) required antibiotics. Administered antibiotics included beta-lactams, macrolides, quinolones or oxazolidinones. Corticosteroids were administered in 45 cases (14.66%). Patients received prophylactic anticoagulation in 38 cases (12.38%). 27 patients received Remdesivir 27 (8.79%), 13 patients received hydroxychloroquine (4.23%), 3 patients received Kaletra (0.98%), and 3 patients received Paxlovid (0.98%).
- 6.
- Vaccination
The median time from vaccination to onset of symptoms was 5.87 months (IQR 3.23 - 9.03). In 211 cases (68.95%) patients had received at least one dose of the vaccine at diagnosis, in 93 cases (30.39%) they had not received any dose. Table 3 shows the number of doses administered at diagnosis along the periods.
- 7.
- Severe COVID-19 disease
34 patients (11.07%) had respiratory failure, 5 (1.63%) required IMV, 72 (23.45%) were admitted to the hospital and 12 of them (3.91%) were admitted to the ICU. 12 patients (3.91%) died from COVID-19.
Characteristics of patients who suffered respiratory failure, required mechanical ventilation, were hospitalized, were admitted to the ICU and died from COVID-19 are given in Table 4, Table 5, Table 6, Table 7 and Table 9 respectively.

Table 4.
Respiratory failure in LTR diagnosed with COVID-19.
| Table 4. Respiratory failure in LTR diagnosed with COVID-19 | Logistic Regression Analysis | |||||
| Respiratory failure | ||||||
| Total (N = 307) | No (N = 273) | Yes (N = 34) | p-value | OR (p-value) | 95%CI | |
| Age (years), median (IQR) | 61 (54 – 68) | 61 (53 – 68) | 68 (59 – 73) | 0.002 | 1.05 (0.002) | 1.02 - 1.09 |
| IMC (kg/m2), median (IQR) | 26.3 (23 – 29) | 26.05 (22.7 – 29) | 28 (25.5 – 29.7) | 0.026 | OR 1.09 (0.017) | 1.017 - 1.18 |
| Male sex, N (%) | 209 (68.08%) | 180 (65.93%) | 29 (85.29%) | 0.022 | ||
| Female sex, N (%) | 98 (31.92%) | 93 (34.07%) | 5 (14.71%) | 0.33 (0.028) | 0.12 - 0.89 | |
| Number of vaccines at diagnosis | 3 (0 – 3) | 3 (0 – 3) | 0 (0 – 2) | < 0.001 | 0.52 (< 0.001) | 0.39 - 0. 69 |
| Vaccination N (%) | 211 (68.95%) | 199 (73.16%) | 12 (35.29%) | < 0.001 | 0.2 (< 0.001) | 0.094 - 0.42 |
| Time (months) from vaccination to the onset of symptoms, median (IQR) | 5.87 (3.23 – 9.03) | 6.46 (3.31-9.11) | 2.89 (0.62-4.36) | 0.003 | 0.7 (0.011) | 0.54 - 0.92 |
| Time (months) from vaccination to the onset of symptoms, median (IQR) | 94.46 (41.44-185.21) | 94.46 (41.44-184.49) | 95.08 (51.28-188.75) | 0.79 | ||
| Kidney failure(Creatinine≥ 2 mg/dL) | 23 (7.52%) | 16 (5.88%) | 7 (20.59%) | 0.002 | 4.12 (0.004) | 1.57 - 10.97 |
| COPD, N (%) | 13 (4.25%) | 10 (3.68%) | 3 (8.82%) | 0.16 | ||
| Asthma, N (%) | 6 (1.96%) | 6 (2.21%) | 0 | 0.38 | ||
| HTN, N (%) | 117 (38.24%) | 94 (34.56%) | 23 (67.65%) | < 0.001 | 3.96 (< 0.001) | 1.85 - 8.47 |
| Cardiovascular events and / or risk factors | 181 (59.34%) | 152 (56.09%) | 29 (85.29%) | 0.001 | 4.54 (0.002) | 1.7 - 12 |
| T2D, N (%) | 125 (40.85%) | 102 (37.50%) | 23 (67.65%) | < 0.001 | 3.48 (< 0.001) | 1.63 - 7.45 |
| Altered liver enzymes, N (%) | 20 (6.54%) | 16 (6.81%) | 4 (5.63%) | 0.73 | ||
| Smokers, N (%) | 50 (16.72%) | 44 (16.54%) | 6 (18.18%) | 0.53 | ||
| Asthenia, N (%) | 98 (32.45%) | 81 (30.22%) | 17 (50.00%) | 0.02 | 2.31 (0.023) | 1.12 - 4.75 |
| Dyspnea, N (%) | 45 (14.9 %) | 25 (9.33%) | 20 (58.82%) | < 0.001 | 13.88 (< 0.001) | 6.25 - 30.82 |
| Fever, N (%) | 77 (25.5 %) | 59 (22.01%) | 18 (52.94%) | < 0.001 | 3.98 (< 0.001) | 1.92 - 8.29 |
| Cough, N (%) | 120 (39.74%) | 103 (38.43%) | 17 (50 %) | 0.19 | ||
| Chest pain, N (%) | 12 (3.97%) | 9 (3.36%) | 3 (8.82%) | 0.12 | ||
| Diarrhoea, N (%) | 32 (10.6 %) | 27 (10.07%) | 5 (14.71%) | 0.41 | ||
| Anorexia, N (%) | 14 (4.64%) | 10 (3.73%) | 4 (11.76%) | 0.036 | 3.44 (0.047) | 1.02 - 11.65 |
| Chest X-ray findings,N (%) | <0.001 | |||||
| Not performed | 191 (69.45%) | 189 (77.78%) | 2 (6.25%) | |||
| Normal | 28 (10.18%) | 27 (11.11%) | 1 (3.13%) | |||
| Bilateral pneumonia | 46 (16.73%) | 21 (8.64%) | 25 (78.13%) | 112.5 (< 0.001) | 24.87 – 508.84 | |
| Lobar pneumonia | 10 (3.64%) | 6 (2.47%) | 4 (12.50%) | 63 (< 0.001) | 9.59 – 413.67 | |
| Azathioprine, N (%) | 3 (0.98%) | 2 (0.74%) | 1 (2.94%) | 0.22 | ||
| Corticosteroids, N (%) | 17 (5.56%) | 17 (6.25%) | 0 | 0.13 | ||
| mTORi, N (%) | 40 (13.07%) | 35 (12.87%) | 5 (14.71%) | 0.76 | ||
| MMF, N (%) | 184 (60.13%) | 154 (56.62%) | 30 (88.24%) | < 0.001 | 5.74 (< 0.001) | 1.97 - 16.76 |
| CNIs, N (%) | 189 (61.76%) | 177 (65.07%) | 12 (35.29%) | < 0.001 | 0.29 (< 0.001) | 0.14 - 0.62 |
Table 5.
IMV in LTR diagnosed with COVID-19.
| Table 5. IMV in LTR diagnosed with COVID-19 | Logistic Regression Analysis | |||||
| Mechanical ventilation | ||||||
| Total (N = 306, 1 lost case) | No (N = 301) | Yes (N = 5) | p-value | OR (p-value) | 95%CI | |
| Age (years), median (IQR) | 61 (54 – 68) | 61 (53 – 68) | 68 (62 – 74) | 0.1 | ||
| IMC (kg/m2), median (IQR) | 26.3 (23 – 29) | 26.3 (22.7 – 29) | 28 (25.5 – 29.7) | 0.21 | ||
| Male sex, N (%) | 208 (67.97%) | 203 (67.44%) | 5 (100 %) | 0.12 | ||
| Female sex, N (%) | 98 (32.03%) | 98 (32.56%) | 0 | |||
| Number of vaccines at diagnosis | 3 (0 – 3) | 3 (0 – 3) | 0 (0 – 2) | 0.2 | ||
| Vaccination N (%) | 211 (69.18%) | 209 (69.67%) | 2 (40.00%) | 0.15 | ||
| Time (months) from vaccination to the onset of symptoms, median (IQR) | 5.87 (3.23 - 9.03) | 5.87 (3.25 - 9.02) | 4.61 (0.1 – 9.11) | 0.56 | ||
| Time (months) from vaccination to the onset of symptoms, median (IQR) | 94.72 (43.31-185.21) | 94.46 (43.31-184.49) | 134.75 (78.23-191.93) | 0.48 | ||
| Kidney failure (Creatinine≥ 2 mg/dL) | 23 (7.54%) | 23 (7.67%) | 0 | 0.52 | ||
| COPD, N (%) | 13 (4.26%) | 13 (4.33%) | 0 | 0.63 | ||
| Asthma, N (%) | 6 (1.97%) | 6 (2 %) | 0 | 0.75 | ||
| HTN, N (%) | 117 (38.36%) | 114 (38.00%) | 3 (60 %) | 0.32 | ||
| Cardiovascular events and / or risk factors | 180 (59.21%) | 176 (58.86%) | 4 (80 %) | 0.34 | ||
| T2D, N (%) | 124 (40.66%) | 119 (39.67%) | 5 (100 %) | 0.006 | ||
| Altered liver enzymes, N (%) | 20 (6.56%) | 20 (6.67%) | 0 | 0.55 | ||
| Smokers, N (%) | 50 (16.78%) | 49 (16.72%) | 1 (20 %) | 0.94 | ||
| Asthenia, N (%) | 98 (32.56%) | 96 (32.43%) | 2 (40 %) | 0.72 | ||
| Dyspnea, N (%) | 45 (14.95%) | 41 (13.85%) | 4 (80 %) | < 0.001 | 24.87 (0.004) | 2.71 – 228.14 |
| Fever, N (%) | 77 (25.58%) | 74 (25.00%) | 3 (60 %) | 0.075 | ||
| Cough, N (%) | 120 (39.87%) | 119 (40.20%) | 1 (20 %) | 0.36 | ||
| Chest pain, N (%) | 12 (3.99%) | 12 (4.05%) | 0 | 0.65 | ||
| Diarrhoea, N (%) | 32 (10.63%) | 31 (10.47%) | 1 (20 %) | 0.49 | ||
| Anorexia, N (%) | 14 (4.65%) | 14 (4.73%) | 0 | 0.62 | ||
| Chest X-ray findings,N (%) | 0.008 | |||||
| Not performed | 191 (69.71%) | 190 (70.63%) | 1 (20%) | |||
| Normal | 28 (10.22%) | 28 (10.41%) | 0 | |||
| Bilateral pneumonia | 45 (16.42%) | 42 (15.61%) | 3 (60%) | 13.57 (0.025) | 1.37 – 133.71 | |
| Lobar pneumonia | 10 (3.65%) | 9 (3.35%) | 1 (20%) | 21.11 (0.036) | 1.22 – 365.44 | |
| Azathioprine, N (%) | 3 (0.98%) | 2 (0.67%) | 1 (20%) | < 0.001 | 37.25 (0.006) | 2.78 – 499.16 |
| Corticosteroids, N (%) | 17 (5.57%) | 17 (5.67%) | 0 ( | 0.58 | ||
| mTORi, N (%) | 40 (13.11%) | 40 (13.33%) | 0 | 0.38 | ||
| MMF, N (%) | 183 (60%) | 179 (59.67%) | 4 (80%) | 0.36 | ||
| CNIs, N (%) | 188 (61.64%) | 186 (62%) | 2 (40%) | 0.32 | ||
Table 6.
Hospital admission in LTR diagnosed with COVID-19.
| Table 6. Hospital admission in LTR diagnosed with COVID-19 | Logistic Regression Analysis | |||||
| Hospital admission | ||||||
| Total (N = 307) | No (N = 235) | Yes (N = 72) | p-value | OR (p-value) | 95%CI | |
| Age (years), median (IQR) | 61 (54 – 68) | 60 (52 – 67) | 64.5 (56 – 71.5) | 0.002 | 1.04 (p = 0.001) | 1.02 – 1-07 |
| IMC (kg/m2), median (IQR) | 26.3 (23 – 29) | 26.1 (22.5 – 29) | 27.32 (24.2 – 29.7) | 0.009 | 1.08 (p = 0.011) | 1.02 – 1.15 |
| Male sex, N (%) | 209 (68.08%) | 156 (66.38%) | 53 (73.61%) | 0.25 | ||
| Female sex, N (%) | 98 (31.92%) | 79 (33.62%) | 19 (26.39%) | |||
| Number of vaccines at diagnosis | 3 (0 – 3) | 3 (1 – 4) | 0 (0 – 3) | < 0.001 | 0.63 (p < 0.001) | 0.53 – 0.75 |
| Vaccination N (%) | 211 (68.95%) | 178 (76.07%) | 33 (45.83%) | < 0.001 | 0.23 (p < 0.001) | 0.15 – 0.46 |
| Time (months) from vaccination to the onset of symptoms, median (IQR) | 5.87 (3.23 – 9.03) | 6.26 (3.28 – 9.18) | 3.61 (2.2 – 6.79) | 0.073 | ||
| Time (months) from vaccination to the onset of symptoms, median (IQR) | 94.46 (41.44-185.21) | 93.05 (40.85-177.64) | 101.98 (43.74-192.44) | 0.26 | ||
| Kidney failure (Creatinine≥ 2 mg/dL) | 23 (7.52%) | 12 (5.13%) | 11 (15.28%) | 0.004 | 3.33 (p = 0.006) | 1.4 – 7.93 |
| COPD, N (%) | 13 (4.25%) | 7 (2.98%) | 6 (8.45%) | 0.0.45 | 3 (p = 0.055) | 0.97 – 9.26 |
| Asthma, N (%) | 6 (1.96%) | 6 (2.55%) | 0 | 0.17 | ||
| HTN, N (%) | 117 (38.24%) | 78 (33.19%) | 39 (54.93%) | < 0.001 | 2.45 (p = 0.001) | 1.43 – 4.21 |
| Cardiovascular events and / or risk factors | 181 (59.34%) | 127 (54.27%) | 54 (76.06%) | 0.001 | 2.67 (p = 0.001) | 1.46 – 4. 89 |
| T2D, N (%) | 125 (40.85%) | 85 (36.17%) | 40 (56.34%) | 0.002 | 2.28 (p = 0.003) | 1.33 – 3.9 |
| Altered liver enzymes, N (%) | 20 (6.54%) | 16 (6.81%) | 4 (5.63%) | 0.73 | ||
| Smokers, N (%) | 50 (16.72%) | 41 (17.75%) | 9 (13.24%) | 0.14 | ||
| Asthenia, N (%) | 98 (32.45%) | 70 (30.43%) | 28 (38.89%) | 0.18 | ||
| Dyspnea, N (%) | 73 (24.17%) | 62 (26.96%) | 11 (15.28%) | 0.043 | 24.56 (p < 0.001) | 10.91 – 55.25 |
| Fever, N (%) | 77 (25.50%) | 41 (17.83%) | 36 (50.00%) | < 0.001 | 4.61 (p < 0.001) | 2.6 – 8.17 |
| Cough, N (%) | 120 (39.74%) | 80 (34.78%) | 40 (55.56%) | 0.002 | 2.34 (p = 0.002) | 1.37 – 4.01 |
| Chest pain, N (%) | 12 (3.97%) | 3 (1.30%) | 9 (12.50%) | < 0.001 | 10.81 (p < 0.001) | 2.84 – 41.12 |
| Diarrhoea, N (%) | 32 (10.60%) | 15 (6.52%) | 17 (23.61%) | < 0.001 | 4.43 (p < 0.001) | 2.08 – 9.42 |
| Anorexia, N (%) | 14 (4.64%) | 8 (3.48%) | 6 (8.33%) | 0.087 | ||
| Chest X-ray findings,N (%) | <0.001 | |||||
| Not performed | 191 (69.45%) | 182 (87.92%) | 9 (13.24%) | |||
| Normal | 28 (10.18%) | 19 (9.18%) | 9 (13.24%) | |||
| Bilateral pneumonia | 46 (16.73%) | 4 (1.93%) | 42 (61.76%) | 212.33 (p < 0.001) | 3.39 – 27.04 | |
| Lobar pneumonia | 10 (3.64%) | 2 (0.97%) | 8 (11.76%) | 80.89 (p < 0.001) | 14.96 – 437.44 | |
| Azathioprine, N (%) | 3 (0.98%) | 1 (0.43%) | 2 (2.78%) | 0.077 | ||
| Corticosteroids, N (%) | 17 (5.56%) | 14 (5.98%) | 3 (4.17%) | 0.56 | ||
| mTORi, N (%) | 40 (13.07%) | 23 (9.83%) | 17 (23.61%) | 0.002 | 2.84 (p = 0.003) | 1.42 – 5.67 |
| MMF, N (%) | 184 (60.13%) | 132 (56.41%) | 52 (72.22%) | 0.017 | 2.01 (p = 0.018) | 1.13 – 3.58 |
| CNIs, N (%) | 189 (61.76%) | 155 (66.24%) | 34 (47.22%) | 0.004 | 0.46 (p = 0.004) | 0.27 – 0.78 |
Table 7.
ICU admission in LTR diagnosed with COVID-19.
| Table 7.ICU admission in LTR diagnosed with COVID-19 | Logistic Regression Analysis | |||||
| Total (N = 306, 1 lost case) | Admission to the ICU | |||||
| No (N = 301) | Yes (N = 5) | p-value | OR (p-value) | 95%CI | ||
| Age (years), median (IQR) | 61 (54 – 68) | 61 (53 – 68) | 60 (62 – 74) | 0.1 | ||
| IMC (kg/m2), median (IQR) | 26.3 (23 – 29) | 26.3 (23 – 29) | 29 (25.5 – 34.4) | 0.21 | ||
| Male sex, N (%) | 208 (67.97%) | 203 (67.44%) | 5 (100%) | 0.12 | ||
| Female sex, N (%) | 98 (32.03%) | 98 (32.56%) | 0 | |||
| Number of vaccines at diagnosis | 3 (0 – 3) | 3 (0 – 3) | 0 (0 – 3) | 0.2 | ||
| Vaccination N (%) | 211 (69.18%) | 209 (69.67%) | 2 (40%) | < 0.001 | ||
| Time (months) from vaccination to the onset of symptoms, median (IQR) | 5.87 (3.23 - 9.03) | 5.87 (3.25-9.02) | 4.61 (0.10-9.11) | 0.56 | ||
| Time (months) from vaccination to the onset of symptoms, median (IQR) | 94.46 (41.44-185.21) | 95.28 (45.51-185.31) | 46.26 (24.16-137.70) | 0.12 | ||
| Kidney failure (Creatinine≥ 2 mg/dL) | 23 (7.54%) | 23 (7.67%) | 0 | 0.52 | ||
| COPD, N (%) | 13 (4.26%) | 13 (4.33%) | 0 | 0.63 | ||
| Asthma, N (%) | 6 (1.97%) | 6 (2.00%) | 0 | 0.75 | ||
| HTN, N (%) | 117 (38.36%) | 114 (38%) | 3 (60%) | 0.32 | ||
| Cardiovascular events and / or risk factors | 180 (59.21%) | 176 (58.86%) | 4 (80.00%) | 0.34 | ||
| T2D, N (%) | 124 (40.66%) | 119 (39.67%) | 5 (100%) | 0.006 | ||
| Altered liver enzymes, N (%) | 20 (6.54%) | 19 (6.44%) | 1 (9.09%) | 0.73 | ||
| Smokers, N (%) | 50 (16.78%) | 49 (16.72%) | 1 (20%) | 0.94 | ||
| Asthenia, N (%) | 98 (32.56%) | 96 (32.43%) | 2 (40%) | 0.72 | ||
| Dyspnea, N (%) | 45 (14.95%) | 41 (13.85%) | 4 (80.00%) | < 0.001 | 21.17 (< 0.001) | 5.47 – 81.85 |
| Fever, N (%) | 77 (25.58%) | 74 (25.00%) | 3 (60.00%) | 0.075 | 4.4 (0.014) | 1.35 – 14.3 |
| Cough, N (%) | 120 (39.87%) | 119 (40.2%) | 1 (20%) | 0.36 | ||
| Chest pain, N (%) | 12 (3.99%) | 12 (4.05%) | 0 | 0.65 | ||
| Diarrhoea, N (%) | 32 (10.63%) | 31 (10.47%) | 1 (20%) | 0.49 | ||
| Anorexia, N (%) | 14 (4.65%) | 14 (4.73%) | 0 | 0.62 | ||
| Chest X-ray findings,N (%) | 0.008 | |||||
| Not performed | 191 (69.71%) | 190 (70.63%) | 1 (20%) | |||
| Normal | 28 (10.22%) | 28 (10.41%) | 0 | |||
| Bilateral pneumonia | 45 (16.42%) | 42 (15.61%) | 3 (60%) | 28.5 (0.002) | 3.34 – 243.27 | |
| Lobar pneumonia | 10 (3.65%) | 9 (3.35%) | 1 (20%) | 21.11 (0.036) | 1.22 – 365.44) | |
| Azathioprine, N (%) | 3 (0.98%) | 2 (0.67%) | 1 (20%) | < 0.001 | 13.27 (0.041) | 1.12 – 157.67 |
| Corticosteroids, N (%) | 17 (5.57%) | 17 (5.67%) | 0 | 0.58 | ||
| mTORi, N (%) | 40 (13.11%) | 40 (13.33%) | 0 | 0.38 | ||
| MMF, N (%) | 183 (60%) | 179 (59.67%) | 4 (80%) | 0.36 | ||
| CNIs, N (%) | 188 (61.64%) | 186 (62%) | 2 (40%) | 0.32 | ||
Table 8.
Multivariate analysis of respiratory failure and hospital admission.
| Table 8. Multivariate analysis | ||||
| Respiratory failure | Hospital admission | |||
| Area under ROC curve = 0.851 | Area under ROC curve = 0.896 | |||
| OR (p-value) | 95%CI | OR (p-value) | 95%CI | |
| Age | 1.056 (0.045) | 1 – 1.1 | ||
| Vaccination | 0.16 (< 0.001) | 0.072 – 0.37 | 0.2 (< 0.001) | 0.09 – 0.44 |
| Kidney injury | 5.33 (0.006) | 1.62 – 17.52 | 4.29 (0.013) | 1.35 – 13.58 |
| HTN | 3.69 (0.002) | 1.61 – 8.45 | 3.25 (0.002) | 1.54 – 6.89 |
| Dyspnea at diagnosis | 18.83 (< 0.001) | 7.61 – 46.56 | ||
| Fever at diagnosis | 4.08 (< 0.001) | 1.9 – 8.74 | ||
| mTORi | 2.8 (0.036) | 1.07 – 7.32 | ||
| MMF | 2.73 (0.008) | 1.49 – 14.71 | ||
Table 9.
Death from COVID-19.
| Table 9. Death from COVID-19 | ||||||
| Death due to COVID-19 | Univariant survival analysis | |||||
| Total (N=307) | No (N = 295) | Yes (N = 12) | p-value | Hazard ratio (p-value) | 95% CI | |
| Age (years), median (IQR) | 61 (54.00-68.00) | 61(53-68) | 68 (61.5-71.5) | 0.034 | ||
| Age (years), mean (SD) | 59.03 (14.03) | 58.72 (14.16) | 66.50 (7.24) | 0.06 | ||
| IMC (kg/m2), median (IQR) | 26.30 (23 – 29) | 26.10(22.9 - 29) | 29.05 (26.8 - 35.25) | 0.008 | ||
| IMC (kg/m2), mean (SD) | 26.35 (4.68) | 26.17 (4.56) | 30.54 (5.59) | 0.001 | ||
| Obesity, N (%) | 62 (20.67%) | 56 (19.44%) | 6 (50.00%) | 0.01 | 3.94 (0.002) | 1.27 - 12.22 |
| Male sex, N (%) | 209 (68.08%) | 199 (67.46%) | 10 (83.33%) | 0.25 | ||
| Doses of vaccination at diagnosis | 3 (0 – 3) | 3 (0 – 3) | 0 (0 – 1.5) | 0.002 | 0.56 (0.006) | 0.32 - 0.83 |
| Vaccine (doses) | 0.062 | |||||
| 0 | 93 (30.39%) | 85 (28.91%) | 8 (66.67%) | |||
| 1 | 16 (5.23%) | 15 (5.1%) | 1 (8.33%) | |||
| 2 | 38 (12.42%) | 36 (12.24%) | 2 (16.67%) | |||
| 3 | 92 (30.07%) | 91 (30.95%) | 1 (8.33%) | |||
| 4 | 54 (17.65%) | 54 (18.37%) | 0 | |||
| 5 | 13 (4.25%) | 13 (4.42%) | 0 | |||
| Kidney injury (creatinine ≥ 2 mg/dL) | 23 (7.52%) | 19 (6.46%) | 4 (33.33%) | <0.001 | 6.9 (0.002) | 2.08 - 23.02 |
| COPD, N (%) | 13 (4.25%) | 11 (3.74%) | 2 (16.67%) | 0.030 | 4.64 (0.047) | 1.02 - 21.22 |
| Asthma, N (%) | 6 (1.96%) | 6 (2.04%) | 0 (0.00%) | 0.62 | ||
| HTN, N (%) | 117 (38.24%) | 109 (37.07%) | 8 (66.67%) | 0.039 | ||
| Cardiovascular events and / or risk factors | 181 (59.34%) | 170 (58.02%) | 11 (91.67%) | 0.020 | ||
| T2D, N (%) | 125 (40.85%) | 115 (39.12%) | 10 (83.33%) | 0.002 | 7.39 (0.01) | 1.62 - 33.76 |
| Altered liver enzymes, N (%) | 20 (6.54%) | 19 (6.46%) | 1 (8.33%) | 0.80 | ||
| Smokers | 50 (16.72%) | 48 (16.72%) | 2 (16.67%) | 0.14 | ||
| Azathioprine, N (%) | 3 (0.98%) | 3 (1.02%) | 0 | 0.73 | ||
| Corticosteroids, N (%) | 17 (5.56%) | 16 (5.44%) | 1 (8.33%) | 0.67 | ||
| mTORi, N (%) | 40 (13.07%) | 39 (13.27%) | 1 (8.33%) | 0.62 | ||
| MMF, N (%) | 184 (60.13%) | 172 (58.5%) | 12 (100%) | 0.004 | ||
| CNIs, N (%) | 189 (61.76%) | 187 (63.61%) | 2 (16.67%) | 0.001 | 0.12 (0.006) | 0.026 - 0.55 |
| Period | <0.001 | |||||
| 1th wave | 24 (7.82%) | 23 (7.80%) | 1 (8.33%) | |||
| 2nd wave | 40 (13.03%) | 36 (12.20%) | 4 (33.33%) | |||
| 3rd wave | 21 (6.84%) | 20 (6.78%) | 1 (8.33%) | |||
| 4th wave | 14 (4.56%) | 11 (3.73%) | 3 (25.00%) | |||
| 5th wave | 10 (3.26%) | 8 (2.71%) | 2 (16.67%) | |||
| 6th wave | 63 (20.52%) | 62 (21.02%) | 1 (8.33%) | |||
| 7th wave | 135 (43.97%) | 135 (45.76%) | 0 (0.00%) | |||
7.1. Respiratory failure
Patients with respiratory failure were significantly older, with a median age of 68 years (59 – 73) and had a higher median BMI, of 28 (IQR 25.5 – 29.7), with an obesity rate of 50% (N = 6). HTN (67.65%, N = 23), a history of cardiovascular events or risk factors (85.29%, N = 29) and D2T (67.65%, N = 23) were more frequent. The number of vaccinations was lower in this group with a median of 0 doses (IQR 0 – 2). In 22 cases, patients (64.70%) had not received any dose of the vaccine.
30 patients (88.24%) were on MMF and only 12 (35.29%) were on CNIs.
Univariate regression logistic analysis revealed that older age (OR = 1.05, 95%CI: 1.02 - 1.09), BMI (OR = 1.09, 95%CI 1.017 - 1.18), creatinine ≥ 2 mg/dL (OR = 4.12, 95%CI: 1.57 - 10.97), a history of cardiovascular events or risk factors (OR = 4.54, 95%CI: 1.7 - 12), T2D (OR = 3.48, 95%CI: 1.63 - 7.45), MMF (OR = 5.74, 95%CI: 1.97 - 16.76), bilateral pneumonia (OR = 112.5, 95%CI: 24.87 – 508.84) or lobar pneumonia (OR = 63, 95%CI 9.59 – 413.67) were risk factors for developing respiratory failure. Female sex (OR = 0.33, 95%CI: 0.12 – 0.89), CNIs (OR = 0.29, 95%CI: 0.14 - 0.62) and vaccination were protective factors (OR = 0.7, 95%CI: 0.54 – 0.92), as well as the months from vaccination to the onset of symptoms (OR = 0.7, 95%CI: 0.54 – 0.92).
7.2. Invasive mechanical ventilation
100% of patients that needed IMV (N = 5) had a history of D2T and 20% (N = 1) were on AZT. Univariate regression logistic analysis showed that dyspnea (OR = 24.87, 95%CI: 2.71 – 228.14), AZT (OR = 37.35, 95%CI: 2.77 - 499.16), bilateral pneumonia (OR = 13.57, 95%CI: 1.37 – 133.71) and lobar pneumonia (OR = 37.25, 95%CI: 2.78 – 499.16) were risk factors for requiring IMV.
7.3. Hospital admission
Patients requiring hospital admission were significantly older, with a median age of 64.5 years (IQR 56 – 71.5), and a higher median BMI of 27.32 (IQR 24 – 29.7). The median length of hospital stay was 18 days (IQR 13 – 26). Significantly more frequent comorbidities in this group were kidney disease with creatinine ≥ 2 mg/dL (15.28%, N = 11), COPD (8.45%, N = 6), HTN (54.93%, N = 39), T2D (56.34%, N = 40) and a history of cardiovascular events or risk factors (76.06%, N = 54).
23.61% (N = 17) were on mTORi and 47.22% (N = 34) were on CNI.
The number of vaccinations was lower with a median of 0 doses (IQR 0 – 3). 54.17% of patients that were hospitalized (N = 39) had not received any dose of the vaccine. Univariate regression logistic analysis showed that vaccination was a protective factor for hospital admission (OR 0.23, 95%CI: 0.15 – 0.46).
Risk factors for hospital admission were age (OR = 1.04, 95%CI: 1.01 – 1.07), BMI (OR = 1.08, 95%CI: 1.02 – 1.15), creatinine ≥ 2 mg/dL (OR = 3.33, 95%CI 1.4 – 7.93), HTN (OR = 2.45, 95%CI 1.43 – 4.21), a history of cardiovascular events or risk factors (OR = 2.67, 95%CI: 1.46 – 4.89), T2D (OR = 2.28, 95%CI: 1.33 – 3.9). mTORi and MMF were risks factors for admission (OR = 2.84, 95%CI: 1.42 – 5.67 and OR = 2.01, 95%CI 1.13 – 3.58, respectively) while CNI was a protective factor (OR = 0.46, 95%CI: 0.27 - 0.78).
7.4. Admission to the ICU
The 5 patients admitted to the ICU were male and one of them (20%) was in AZT, which resulted a risk factor of admission to the ICU in the univariable regression logistic analysis (OR = 13.27, 95%CI: 1.12 – 157.67). Dyspnea and fever were the only symptoms related to ICU admission (OR = 21.17, 95%CI: 5.47 – 81.85 and OR = 4.4, 95%CI 1.35 – 14.3), as were the radiological findings of bilateral pneumonia (OR = 28.5, 95%CI 3.34 – 243.27) and lobar pneumonia (OR = 21.11, 95%CI 1.22 – 365.44).
7.5. Multivariate analysis of respiratory failure and hospital admission
Multiple models were evaluated to carry out a multivariate analysis considering risk factors described in the univariate analysis. Results are shown in Table 8.
For respiratory failure (N = 34), the model with the largest area under the ROC curve (0.851) included: age (OR = 1.06, 95%CI: 1 – 1.1), HTN (OR = 3.69, 95%CI: 1.61 – 8.45), creatinine ≥ 2 mg/dL (OR = 5.54, 95%CI: 1.62 – 17.52), immunosuppression with MMF (OR = 2.73, 95%CI: 1.93 – 14.71) and vaccination (OR = 0.16, 95%CI 0.072 – 0.37).
For hospital admission (n = 72) the model with the largest area under the ROC curve (0.896) included: creatinine ≥ 2 mg/dL (OR = 4.29, 95%CI 1.35 – 13.58), HTN (OR = 3.25, 95%CI: 1.54 – 6.89), dyspnea (OR = 18.83, 95%CI: 7.61 – 46.56), fever (OR = 2.8, 95%CI: 1.9 – 8.74), immunosuppression with mTOR inhibitors (OR = 2.8, 95%CI: 1.07 – 7.32) and vaccination (OR 0.2, 95%CI 0.09 – 0.44).
8. COVID-19 mortality
12 patients died due to COVID-19 infection. Characteristics and univariant survival analysis of these patients are given in Table 10. These were significantly older, with a median age of 68 years (IQR 61.5 – 71.5). History of COPD, HTN, cardiovascular events or risk factors, T2D and kidney injury were significantly higher, with a rate of 16.67% (N = 2), 66.67% (N = 8), 91.67% (N = 11), 83.33% (N = 10) and 33.33% (N = 4), respectively.
The number of doses of the vaccine at diagnosis was lower in the patients that died from COVID-19, with a median of 0 (IQR 0 – 1.5).
100% of patients who died due to COVID-19 were on MMF, and only 16.67% (N = 2) were on CNIs. Variables related to mortality from COVID-19 in univariate survival analysis were obesity (HR = 3.94, 95%CI: 1.27 – 12.22), creatinine ≥ 2 mg/dL (HR = 6.9, 95%CI: 2.08 – 23.02), COPD (HR = 4.64, 95%CI: 1.02 – 21.22), T2D (HR = 7.39, 95%CI: 1.62 – 33.76). CNIs (HR = 0.12, 95%CI: 0.026 – 0.55) and vaccination (HR = 0.56, 95%CI 0.32 – 0.83) were protective factors.
9. Evolution of severe disease throughout the COVID-19 waves
Differences in the incidence of severe COVID-19 scenarios along the waves were analyzed. Results are shown in Table 10. Globally, severe COVID-19 rate was higher during the first 5 waves, with a peak of 57.14% (N = 8) in the 4th, period and a great decrease in the 6th and 7th periods. Vaccination programs began in the 3rd wave, with a progressive increase in the number of vaccinated patients and the doses administered.
Vaccinated patients, diagnosed cases by date and deaths from COVID-19 are illustrated in Figure 1. In the 6th and 7th waves, we observed a significant reduction in the rates of respiratory failure, 6.35% (N = 4) and 1.48% (N = 2) respectively; and in the rates of hospitalization, 17.46% (N = 11) and 9.63% (N = 13) respectively.
This contrasts with the incidence observed in the 4th and 5th waves, reaching 42.86% (N = 6) of patients with respiratory failure and 64.29% (N = 9) of hospitalized patients, similarly to mortality, which reached the highest rate in the 4th wave, 21.43% (N =3). Kaplan-Meier curves for survival across waves are illustrated in Figure 2.
Surprisingly, VMI and ICU admission rates did not show significant differences across the periods, although they remained below 15% during the pandemic.
7. Discussion
Repercussions of the pandemic on liver transplant activity. The COVID-19 pandemic has repercussed on liver transplantation activity with a decrease in the number of organ donors and even in the temporary suspension of the activity in several centers [3,4]. A study which analyzed the data base from the Global Observatory for Organ Donation and Transplantation between 2019 and 2020 observed a global decrease of 17.5% in the number of donors, with a 11.3% decrease in liver transplants [27]. In an observational study which analyzed the transplant activity over 22 countries during the same period showed a global decrease of 16% [5]; more notable during the first months of the pandemic.
Inayat F et al. [28] studied retrospectively a cohort of over 15,000 liver transplant patients hospitalized between 2019 and 2020. They found that the COVID-19pandemic did not translate into an increase in the risk of hospitalization in these patients. It did however show to have an effect in the increased in intrahospital mortality and in organ rejection among the patients hospitalized during said period.
In Spain a study was conducted on organ donation among patients with a positive CRP for SARS-CoV-2 in 69 organ receptors with negative CRPs. The CRP resulted positive in 4 of the receptors (5.8%) with 20 days of transplantation without it being able to be attributed to the transplant. Noe among the 18 receptors of a liver transplant suffered mayor complications that could be linked to infection in the donor [29]. Another multicentric study evaluated viral RNA in the liver biopsy of 10 grafts, with negative results in all of them [30].
Characteristics of the transplanted patients. Kulkarni et al. conducted in 2021 the only meta-analysis published to date [1], including 18 observational studies with a total of 1522 patients. According to this study, the most common etiologies for transplant were viral (38%), alcohol (22.23%), NASH (2.5%), autoimmune (7.4%) and hepatocarcinoma (5.26%). In our study viral liver disease, alcoholic liver disease and hepatocellular carcinoma were the primordial reasons for transplantation. The comorbidities more frequently registered were hypertension (44.3%), diabetes (39.4%), cardiovascular disease (16.43%), renal failure (13,7%), pulmonary disease (9%) and obesity (23.6%) [9]. In our study the frequency of diabetes mellitus, hypertension and obesity is similar, with a frequency of 41.07%, 38.93%v and 20.73%, respectively. The frequency of pulmonary disease (COPD or bronchial asthma) is 6.78%, while the frequency of cardiovascular events or a combination of multiple cardiovascular risk factors goes up to 61.29%.
COVID-19 in orthotopic liver transplant. It was during the first wave of the disease that large series of cases of adult liver transplant patients infected with COVID-19 were published contributing greatly to the current knowledge of the particularities of the disease in this subgroup of patients. [8,19,20,31,32,33].
The most common symptoms described in LT are fever (49.7%), cough (43.79%) and dyspnea (29.7%); with a 27.26% of gastrointestinal symptoms [9], myalgia or asthenia (36.66%), anosmia (36.66%) or dysgeusia (33.33%) [7].
In our cohort, the predominant symptoms have not been severe, cough, asthenia and myalgias encompassing the majority. Gastrointestinal symptoms (nausea, vomiting and diarrhea) were only alluded to by 14.9% of patients. Among our patients 25.5% referred fever and 14.9% dyspnea with an observed progressive decrease of this latter symptom in the subsequent waves. Presenting at the time of diagnosis with asthenia, dyspnea, fever or anorexia has proven to be a risk factor for developing respiratory insufficiency in this study, being dyspnea the only symptom that proved to be a risk factor for the need of mechanical ventilation. The presence of fever and dyspnea were the only symptoms at the time of diagnosis that resulted in a higher risk of requiring intensive care.
The median time between receiving the transplant and COVID-19 diagnosis is variable, from 5.7 to 13.1 years [7,9,34]. Guarino M et al. observed it was significantly shorter in patients with asymptomatic COVID-19 [2]. These, however, did not show any differences in regard to comorbidities or immunosuppressive treatment. In a 16-patient series Eren-Kutsoylu et al. [34] found a correlation between respiratory symptoms or fever and the need for hospitalization. In this series, 14 patients remained asymptomatic (46.67%), in contrast with the series by Colmenero et al., with 7/111 asymptomatic patients (6.3%) [8]. In this study we find 19.87% of asymptomatic patients, with a variable frequency among different waves, higher in the third and sixth (25.81% - 33.33%) versus the first and second (16.67% - 19.87%), and the last one (14.50%).
Kulkarni et al describe a 72% rate of admissions, higher than in non-transplanted patients and three times higher than the one observed in our study; and a cumulative incidence of intensive care unit admissions of 16%, compared to the 3.9% in our study [9].
A mean hospital stay In LT between 8-11 days was reported [7,32,35] similar to the non- transplanted controls [35], and shorter to that found in our study which was 18 days. The incidence of invasive mechanical ventilation described in the above-mentioned meta-analysis was 21.1%, again higher in LT than in the non-transplanted controls [9]. In our study only 5 patients (1.63%) required intubation.
The lower rate of severe COVID-19 in this study is justified by the inclusion in the same of a higher number of patients towards the end of the pandemic. As can be observed in Table 10, the rate of severe COVID-19 decreases towards the sixth and seventh waves, at which time over 60% of the cases were diagnosed. It draws attention however that the rate of Intensive care unit admissions and need for mechanical ventilation have shown no statistically significant differences during these periods.
In regard to thrombotic complications, the incidence among transplanted patients lies around 6% [9]. Mansoor et al [20] found no differences when comparing them to the thrombotic rate of the general public.
The median age at the time of diagnosis is lower (59.55 years) in transplanted patients compared to their controls (63.2 years). The median age at the time of diagnosis was similar in our study; 61 years. Colmenero et al. and Belli et al. Describe that patients with less severe symptoms form COVID-19 were younger, had fewer comorbidities and received more frequently immunosuppressive therapy with tacrolimus [8,19]. When compared to the general public, the course of the disease hasn’t shown more severity in LT patients [7,32].
In this cohort, the median age and BMI were significantly higher in patients who suffered respiratory insufficiency or required a longer hospital stay. In the logistic regression analysis, older patients, high BMI, renal failure with creatinine
over 2 mg/dL, history of cardiovascular events or risk factors, HTN, and T2D have been shown to be risk factors for respiratory insufficiency or hospital admission while female sex proved to be a protective factor.
History of COPD was a risk factor for hospital admission, as well as mTORi immunosuppressive therapy, while the number of vaccinations before diagnosis proved to be a protective factor for hospital admission and development of respiratory insufficiency.
Time between vaccination and the start of symptoms was significantly shorter in patients who later developed respiratory insufficiency, but no significant differences were observed for hospital admission, admission in the ICU or need for intubation.
Altered x-rays were observed to be a significant risk factor for severe COVID-19 (Hospital admission, intensive care unit admission, respiratory insufficiency or need for mechanical ventilation).
COVID-19 related mortality in orthotopic liver transplant. The factors related to death from COVID-19 have been exhaustively studied. The results in mortality in LT are heterogenous in the published series [9], with a 16.5% incidence and similar when compared to non-transplanted patients. Webb et al, in a multicentric study with 151 LT among 18 countries described a significantly lower mortality rate in LT (19% versus 27% in non-LT; p = 0.046). The main causes of death described are COVID-19 related complications (62.54%) and respiratory failure (29.88%) [8,9,19].
Increased levels of transaminases during COVID-19 infection have been documented [9]. Rabiee et al. described the association between changes in hepatic biochemistry and increase in mortality in a series of 112 LT patients [33]. Despite this no differences were apparent in this study when analyzing alterations y hepatic biochemistry and death by COVID-19.
Concerning acute renal failure, a 33.22% incidence was reported in LT patients with COVID-19 [9], considering the increase in basal serum creatinine concentration a risk factor for severe COVID-19 and mortality [31,36].
Other contributing factors to COVID-19 mortality are the presence of malignant extrahepatic neoplasia [31], advanced age [8,19,31], dyspnea at the time of diagnosis [8], male sex, D- dimer or ferritin levels elevation and lymphopenia [8,32,37].
In our study, the variable related to death by COVID-19 were obesity, renal failure, COPD, and DM2 while vaccination and immunosuppressive therapy with CNIs were protective factors.
Immunosuppression. Immunosuppression schemes in previously published studies are based in CNIs, cyclosporine, MMF or mTORi in monotherapy or in combination. [8,9,19,31,32]. Colmenero et al. showed the prejudicial and dose-dependent effect of MMF immunosuppression [8] possibly in relation to a synergic mechanism in cytotoxicity on CD8+ with the COVID-19 virus. They didn’t find worse results in terms of severity in immunosuppressed patients with CNIs or mTORi. Belli et al did prove an association between CNIs and reduced mortality which could be related to an inhibitory mechanism of viral replication [19]. mTOR inhibitors, AZT, and MMF can induce cytopenia which could worsen the course of infection since lymphopenia isa parameter associated with severe COVID-19 [38,39].
A change in immunosuppressive therapy has not shown to have an impact on mortality [19,31,34,37,40].
The consensus among the AASLD and the EASL is an individualized evaluation of each case of COVID-19 infection, preferably reducing the dosage of mycophenolate in patients in higher risk of developing severe forms of the disease [41,42].
Vaccination against COVID-19. LTR have shown a lower prevalence of anti-SARS-CoV-2 antibodies long term when compared to the general public, with higher levels of antibodies in vaccinated patients [43,44,45] and in patients with a longer period between receiving the transplant and being infected by COVID-19 [43].
Currently, 12 vaccinations comprise the Emergency Use Listing of the WHO, including inactivated viral vaccines, protein-based and DNA or RNA viral vector- based vaccines [46,47]. The development and prompt distribution of the different vaccines has meant a change in the course of the COVID-19 disease, protecting against more severe forms and death. In LTR it has proved to reduce the rate of infection, symptomatic disease [48], hospitalization [49], need for intensive care and mechanical ventilation [13] and mortality, particularly in patients with a complete course [13,48,49]. The associations for the study of liver disease recommend a complete vaccination, as well as a booster dose to achieve or maintain immunity in LTR [50,51]. This subgroup reaches a lower immunological response than the general public, due to immunosuppressive therapy -particularly with MMF-, achieving a higher seroconversion dose in dose patients with repeated doses [44,52,53,54]. Long term LT patients show a better immunological response than recent recipients [55].
This study shows a lower prevalence of severe COVID-19 in vaccinated patients, with a higher number of doses in those patients who did not present with complications.
Treatment for COVID-19 infection in LT patients. Together with general measures such as hand washing, use of facemasks and social distancing, multiple drugs have been evaluated as potential treatments for COVID-19, including
hydroxychloroquine, antibiotics, antivirals, steroids, immunomodulators, anticoagulants or plasma [9].
Antimalarials such as hydroxychloroquine were considered during the first stages of the pandemic for their immunomodulator and antiviral effects, but their efficacy hasn’t been clearly proven [17,56]. Remdervir, a SARS-CoV-2 RNA polimerase inhibitor has been widely used since it is a medication with an acceptable safety level, but it has not shown strong benefits in patients with a solid organ transplant [57,58] which induce the WHO to discontinue its use in hospitalized patients [57]. Nonetheless, it´s still recommended for outpatient treatment in those with high risk of hospitalization [59]. Favipiravir [60] and Lopinavir/Ritonavir which showed in vitro activity against SARS-CoV-2 [56,61] were discouraged. Dexamethasone has proved to reduce mortality in those who require mechanical ventilation [62]. Tocilizumab, an IL-6 receptor inhibitor, is considered a safe medication in transplanted patients, even though it must be used carefully owing to its hepatotoxicity [56,61]. Other monoclonal antibodies such as bamlanivimab, casirivimab and imdevimab have proven to reduce viral load in patients with non-severe COVID-19 [57].
In our study we observed that antimalarials, interferon and kaletra were used during the first period in selected cases. When bacterial superinfection was suspected empiric antibiotics were prescribed and later adjusted to antibiogram. Prophylactic anticoagulation was prescribed in 50% of the patients up to the fifth wave, with a decrease in the last to waves, following the same tendency as corticoid treatment.
Tocilizumab and remdesivir were used in 2.61% (N = 8) and 8.79% (N = 27) of the patients respectively. The use of Paxlovid requires careful monitorization in immunosuppressive therapy therefore its use is limited transplant patients [63]. In our study, it has been only used in 1.02 % of patients (N = 3).
Author Contributions
Conceptualization, Carmelo Loinaz Segurola; Data curation, Alberto Marcacuzco Quinto and Carmelo Loinaz Segurola; Formal analysis, Cristina Martín-Arriscado Arroba; Investigation, Clara Fernández Fernández, Blanca Otero Torrón, Iago Justo Alonso, Alberto Marcacuzco Quinto, Óscar Caso Maestro, Félix Cambra Molero, Oana Anisa Nutu, Jorge Calvo Pulido, Alejandro Manrique Municio and Álvaro García-Sesma Pérez-Fuentes; Methodology, Clara Fernández Fernández and Carmelo Loinaz Segurola; Resources, Clara Fernández Fernández, Blanca Otero Torrón, Iago Justo Alonso, Alberto Marcacuzco Quinto, Óscar Caso Maestro, Félix Cambra Molero, Oana Anisa Nutu, Jorge Calvo Pulido, Alejandro Manrique Municio and Álvaro García-Sesma Pérez-Fuentes; Supervision, Rafael San Juan Garrido and Carmelo Loinaz Segurola; Writing – original draft, Clara Fernández Fernández, Blanca Otero Torrón and Mercedes Bernaldo de Quirós Fernández; Writing – review & editing, Clara Fernández Fernández, Blanca Otero Torrón, Rafael San Juan Garrido and Carmelo Loinaz Segurola.
Conflicts of Interest
The authors declare no conflicts of interest.
References
- World Health Organization. WHO COVID-19 Dashboard [Internet]. Geneva: WHO. Available at: https://data.who.int/dashboards/covid19/cases.
- Domínguez-Gil B, Coll E, Fernández-Ruiz M, Corral E, Del Río F, Zaragoza R, et al. COVID-19 in Spain: Transplantation in the midst of the pandemic. Am J Transplant. 2020 Sep;20(9):2593-2598. doi: 10.1111/ajt.15983. Epub 2020 May 27. PMID: 32359194; PMCID: PMC7267131. Available at: https://www.ncbi.nlm.nih.gov/pmc/articles/PMC7267131/.
- De Carlis R, Vella I, Incarbone N, Centonze L, Buscemi V, Lauterio A, et al. Impact of the COVID-19 pandemic on liver donation and transplantation: A review of the literature. World J Gastroenterol. 2021 Mar 14;27(10):928-938. doi: 10.3748/wjg.v27.i10.928. PMID: 33776364. Available at: https://www.wjgnet.com/1007-9327/full/v27/i10/928.htm. [CrossRef]
- Theocharidou E, Adebayo D. Challenges in liver transplantation in the context of a major pandemic. World J Transplant. 2022 Nov;12(11):347-358. doi: 10.5500/wjt.v12.i11.347. PMID: 36437846. Available at: https://www.wjgnet.com/2220-3230/full/v12/i11/347.htm. [CrossRef]
- Aubert O, Yoo D, Zielinski D, Cozzi E, Cardillo M, Dürr M, et al. COVID-19 pandemic and worldwide organ transplantation: a population-based study. Lancet Public Health.2021;6:e709–e719.
- Michaels MG, La Hoz RM, Danziger-Isakov L, Blumberg EA, Kumar D, Green M, et al. Coronavirus disease 2019: Implications of emerging infections for transplantation. Am J Transplant. 2020 Jul;20(7):1768-1772. doi: 10.1111/ajt.15832. Epub 2020 Mar 16. PMID: 32090448; PMCID: PMC9800450. Available at: https://www.ncbi.nlm.nih.gov/pmc/articles/PMC9800450/. [CrossRef]
- Guarino M, Cossiga V, Loperto I, Esposito I, Ortolani R, Fiorentino A, et al. COVID-19 in liver transplant recipients: incidence, hospitalization and outcome in an Italian prospective double-centre study. Sci Rep. 2022 Mar 22;12(1):4831. doi: 10.1038/s41598-022-08947-x. PMID: 35318432; PMCID: PMC8940902. Available at:https://pubmed.ncbi.nlm.nih.gov/35318432/. [CrossRef]
- Colmenero J, Rodríguez-Perálvarez M, Salcedo M, Arias-Milla A, Muñoz-Serrano A, Graus J, et al. Epidemiological pattern, incidence, and outcomes of COVID-19 in liver transplant patients. J Hepatol. 2021 Jan;74(1):148-155. doi: 10.1016/j.jhep.2020.07.040. Epub 2020 Aug 1. PMID: 32750442; PMCID: PMC7395653. Available at:https://pubmed.ncbi.nlm.nih.gov/32750442/. [CrossRef]
- Kulkarni AV, Tevethia HV, Premkumar M, Arab JP, Candia R, Kumar K, et al. Impact of COVID-19 on liver transplant recipients-A systematic review and meta-analysis.EClinicalMedicine. 2021 Aug;38:101025. doi: 10.1016/j.eclinm.2021.101025. Epub 2021 Jul 13. PMID: 34278287; PMCID: PMC8276632. [CrossRef]
- Inayat F, Patel P, Ali H, Afzal A, Tahir H, Chaudhry A, et al. Impact of COVID-19 on liver transplant recipients: A nationwide cohort study evaluating hospitalization, transplant rejection, and inpatient mortality. World J Transplant. 2024 Jun 18;14(2):90866. doi: 10.5500/wjt.v14.i2.90866. PMID: 38947960; PMCID: PMC11212588. [CrossRef]
- John BV, Deng Y, Khakoo NS, Taddei TH, Kaplan DE, Dahman B. Coronavirus disease 2019 vaccination is associated with reduced severe acute respiratory syndrome coronavirus 2 infection and death in liver transplant recipients. Gastroenterology. 2022;162:645-647.e2.
- Hamm SR, Rezahosseini O, Møller DL, Loft JA, Poulsen JR, Knudsen JD, et al. Incidence and severity of SARS-CoV-2 infections in liver and kidney transplant recipients in the post-vaccination era: real-life data from Denmark. Am J Transplant. 2022;22:2637-2650.
- Moon AM, Webb GJ, García-Juárez I, Kulkarni AV, Adali G, Wong DK, et al. SARS-CoV-2 infections among patients with liver disease and liver transplantation who received COVID-19 vaccination. Hepatol Commun. 2022 Apr;6(4):889-897. doi: 10.1002/hep4.1853. Epub 2021 Nov 9. PMID: 34708575; PMCID: PMC8652790. [CrossRef]
- Organización Nacional de Trasplantes (ONT). Centros autorizados de obtención y trasplante de órganos, tejidos y células [Internet]. Madrid: ONT. Available at:https://www.ont.es/red-espanola-de-donacion-y-trasplante/centros-autorizados-de-obtencion-trasplante-de-organos-tejidos-y-celulas-2-2-2/.
- Organización Nacional de Trasplantes (ONT). Balance 2023 [Internet]. Madrid: ONT; 2024 Jan 17. Available at: https://www.ont.es/wp-content/uploads/2024/01/BALANCE_2023_ONT_17012024.pdf.
- Loinaz C, Marcacuzco A, Fernández-Ruiz M, Caso O, Cambra F, San Juan R, et al. Varied clinical presentation and outcome of SARS-CoV-2 infection in liver transplant recipients: Initial experience at a single center in Madrid, Spain. Transpl Infect Dis. 2020 Oct;22(5):e13372. doi: 10.1111/tid.13372. Epub 2020 Jul 1. PMID: 32562561; PMCID: PMC7323090. [CrossRef]
- Coll E, Fernández-Ruiz M, Sánchez-Álvarez JE, Martínez-Fernández JR, Crespo M, Gayoso J, et al. COVID-19 in transplant recipients: The Spanish experience. Am J Transplant. 2021 May;21(5):1825-1837. doi: 10.1111/ajt.16369. Epub 2020 Nov 10. PMID: 33098200; PMCID: PMC9906239. [CrossRef]
- Coll E, Fernández-Ruiz M, Padilla M, Moreso F, Hernández-Vicente A, Yañez I, et al. COVID-19 in Solid Organ Transplant Recipients in Spain Throughout 2020: Catching the Wave? Transplantation. 2021 Oct 1;105(10):2146-2155. doi: 10.1097/TP.0000000000003873. PMID: 34241988; PMCID: PMC8487705. [CrossRef]
- Belli LS, Duvoux C, Cortesi PA, Facchetti R, Iacob S, Perricone G, et al. COVID-19 in liver transplant candidates: pretransplant and post-transplant outcomes - an ELITA/ELTR multicentre cohort study. Gut. 2021 Oct;70(10):1914-1924. doi: 10.1136/gutjnl-2021-324879. Epub 2021 Jul 19. PMID: 34281984. [CrossRef]
- Mansoor E, Perez A, Abou-Saleh M, et al. Clinical characteristics, hospitalization, and mortality rates of coronavirus disease 2019 among liver transplant patients in the United States: a multicenter research network study. Gastroenterology. 2021;160(1):459-462.e1.
- Yüce M, Filiztekin E, Özkaya KG. COVID-19 diagnosis - A review of current methods. Biosens Bioelectron. 2021 Jan 15;172:112752. doi: 10.1016/j.bios.2020.112752. Epub 2020 Oct 24. PMID: 33126180; PMCID: PMC7584564. [CrossRef]
- Vieceli T, Oliveira Filho CM, Berger M, Saadi MP, Salvador PA, Anizelli LB, et al. A predictive score for COVID-19 diagnosis using clinical, laboratory and chest image data. Braz J Infect Dis. 2020 Jul-Aug;24(4):343-348. doi: 10.1016/j.bjid.2020.06.009. Epub 2020 Jul 25. PMID: 32721387; PMCID: PMC7381934. [CrossRef]
- Vengesai A, Midzi H, Kasambala M, Mutandadzi H, Mduluza-Jokonya TL, Rusakaniko S, et al. A systematic and meta-analysis review on the diagnostic accuracy of antibodies in the serological diagnosis of COVID-19. Syst Rev. 2021 May 26;10(1):155. doi: 10.1186/s13643-021-01689-3. PMID: 34039423; PMCID: PMC8152206. [CrossRef]
- Sharma A, Balda S, Apreja M, Kataria K, Capalash N, Sharma P. COVID-19 Diagnosis: Current and Future Techniques. Int J Biol Macromol. 2021 Dec 15;193(Pt B):1835-1844. doi: 10.1016/j.ijbiomac.2021.11.016. Epub 2021 Nov 12. PMID: 34774862; PMCID: PMC8585557. [CrossRef]
- Diagnosis and treatment protocol for novel coronavirus pneumonia (Trial Version 7). Chin Med J (Engl). 2020;133(9):1087-1095.
- Informe n° 182. Situación de COVID-19 en España. Informe COVID-19. [Internet]. 2021 . Available at: https://www.isciii.es/QueHacemos/Servicios/VigilanciaSaludPublicaRENAVE/EnfermedadesTransmisibles/Paginas/InformesCOVID-19.aspx.
- Kute VB, Tullius SG, Rane H, Chauhan S, Mishra V, Meshram HS. Global Impact of the COVID-19 Pandemic on Solid Organ Transplant. Transplant Proc. 2022 Jul-Aug;54(6):1412-1416. doi: 10.1016/j.transproceed.2022.02.009. Epub 2022 Feb 10. PMID: 35337665; PMCID: PMC8828418. [CrossRef]
- Inayat F, Patel P, Ali H, Afzal A, Tahir H, Chaudhry A, Ishtiaq R, Rehman AU, Darji K, Afzal MS, Nawaz G, Giammarino A, Satapathy SK. Impact of COVID-19 on liver transplant recipients: A nationwide cohort study evaluating hospitalization, transplant rejection, and inpatient mortality. World J Transplant. 2024 Jun 18;14(2):90866. doi: 10.5500/wjt.v14.i2.90866. PMID: 38947960; PMCID: PMC11212588. [CrossRef] [PubMed]
- Montiel Villalonga P, Martínez-Alpuente I, Fernández-Ruiz M, Len Ó, Bodro M, Los-Arcos I, et al. Transplantation of organs from SARS-CoV-2-positive donors: Preliminary experience from Spain. Transpl Infect Dis. 2023 Feb;25(1):e14008. doi: 10.1111/tid.14008. Epub 2023 Jan 19. PMID: 36659870. [CrossRef]
- Romagnoli R, Gruttadauria S, Tisone G, Ettorre GM, De Carlis L, Martini S, et al. Liver transplantation from active COVID-19 donors: A lifesaving opportunity worth grasping? Am J Transplant. 2021 Dec;21(12):3919-3925. doi: 10.1111/ajt.16823. Epub 2021 Sep 13. PMID: 34467627; PMCID: PMC8653300. [CrossRef]
- Webb GJ, Marjot T, Cook JA, Aloman C, Armstrong MJ, Brenner EJ, et al. Outcomes following SARS-CoV-2 infection in liver transplant recipients: an international registry study.Lancet Gastroenterol Hepatol. 2020 Nov;5(11):1008-1016. doi: 10.1016/S2468-1253(20)30271-5. Epub 2020 Aug 28. PMID: 32866433; PMCID: PMC7455160. [CrossRef]
- Becchetti C, Zambelli MF, Pasulo L, et al; COVID-LT group. COVID-19 in an international European liver transplant recipient cohort. Gut. 2020;69:1832–1840.
- Rabiee A, Sadowski B, Adeniji N, Perumalswami PV, Nguyen V, Moghe A, et al; COLD Consortium. Liver Injury in Liver Transplant Recipients With Coronavirus Disease 2019 (COVID-19): U.S. Multicenter Experience. Hepatology. 2020 Dec;72(6):1900-1911. doi: 10.1002/hep.31574. Epub 2020 Dec 9. PMID: 32964510; PMCID: PMC7537191. [CrossRef]
- Eren-Kutsoylu OO, Egeli T, Agalar C, Ozbilgin M, Ozgen-Alpaydin A, Unek T, et al. COVID-19 in Liver Transplant Patients: A University Hospital Experience. Transplant Proc. 2023 Jun;55(5):1223-1225. doi: 10.1016/j.transproceed.2023.01.032. Epub 2023 Mar 21. PMID: 37087296; PMCID: PMC10027957. [CrossRef]
- Shafiq M, Gibson C. Clinical outcomes of coronavirus disease 2019 in liver transplant recipients. World J Hepatol. 2022 Jun 27;14(6):1142-1149. doi: 10.4254/wjh.v14.i6.1142. PMID: 35978674; PMCID: PMC9258250. [CrossRef]
- Fu S, Chen D, Zhang Y, Wu M. Clinical characteristics of liver transplant recipients with COVID-19 and analysis of risk factors for the severe disease. J Infect Dev Ctries. 2024 Apr 30;18(4):542-549. doi: 10.3855/jidc.18764. PMID: 38728648. [CrossRef]
- Lee BT, Perumalswami PV, Im GY, et al; COBE Study Group. COVID-19 in liver transplant recipients: An initial experience from the US epicenter. Gastroenterology. 2020;159:1176–1178.e2.
- Forns X, Navasa M. Inmunosupresión en el trasplante hepático en la era COVID-19. Rev Esp Enferm Dig. 2020;112(10):758-764.
- Parente A, Manzia TM, Angelico R, Tirotta F, Muiesan P, Tisone G, et al. COVID-19, liver transplant, and immunosuppression: Allies or foes? Liver Transpl. 2020;26(12):1562-1564. doi: 10.1002/lt.26028. [CrossRef]
- Karruli A, Spiezia S, Boccia F, Gagliardi M, Patauner F, Salemme A, et al. Effect of immunosuppression maintenance in solid organ transplant recipients with COVID-19: Systematic review and meta-analysis. Transpl Infect Dis. 2021 Aug;23(4):e13595. doi: 10.1111/tid.13595. Epub 2021 Mar 18. PMID: 33641202; PMCID: PMC7995235. [CrossRef]
- Fix OK, Hameed B, Fontana RJ, Kwok RM, McGuire BM, Mulligan DC, et al. Clinical Best Practice Advice for Hepatology and Liver Transplant Providers During the COVID-19 Pandemic: AASLD Expert Panel Consensus Statement. Hepatology. 2020;72:287-304. doi: 10.1002/hep.31281. PMID: 32298473. [CrossRef]
- Marjot T, Eberhardt CS, Boettler T, Belli LS, Berenguer M, Buti M, et al. Impact of COVID-19 on the liver and on the care of patients with chronic liver disease, hepatobiliary cancer, and liver transplantation: An updated EASL position paper. J Hepatol. 2022;77:1161-1197. doi: 10.1016/j.jhep.2022.07.008. PMID: 35868584. [CrossRef]
- Caballero-Marcos A, Citores MJ, Alonso-Fernández R, Rodríguez-Perálvarez M, Valerio M, Graus Morales J, et al. Decreased Long-Term Severe Acute Respiratory Syndrome Coronavirus 2-Specific Humoral Immunity in Liver Transplantation Recipients 12 Months After Coronavirus Disease 2019. Liver Transpl. 2022 Jun;28(6):1039-1050. doi: 10.1002/lt.26389. Epub 2022 Jan 17. PMID: 34919762. [CrossRef]
- Liu FC, Xie M, Rao W. Clinical application of COVID-19 vaccine in liver transplant recipients. Hepatobiliary Pancreat Dis Int. 2024 Aug;23(4):339-343. doi: 10.1016/j.hbpd.2023.08.010. Epub 2023 Aug 12. PMID: 37620225. [CrossRef]
- Rabinowich L, Grupper A, Baruch R, Ben-Yehoyada M, Halperin T, Turner D, et al. Low immunogenicity to SARS-CoV-2 vaccination among liver transplant recipients. J Hepatol. 2021 Aug;75(2):435-438. doi: 10.1016/j.jhep.2021.04.020. Epub 2021 Apr 21. PMID: 33892006; PMCID: PMC8058047. [CrossRef]
- World Health Organization. Coronavirus disease (COVID-19) vaccines. [Internet]. [cited 2024 Jan 7]. Available at: https://www.who.int/es/emergencies/diseases/novel-coronavirus-2019/question-and-answers-hub/q-a-detail/coronavirus-disease-(covid-19)-vaccines.
- World Health Organization. Coronavirus disease (COVID-19): vaccines. Available at: https://extranet.who.int/prequal/vaccines/covid-19-vaccines-who-emergency-use-listing.
- John BV, Deng Y, Khakoo NS, Taddei TH, Kaplan DE, Dahman B. Coronavirus disease 2019 vaccination is associated with reduced severe acute respiratory syndrome coronavirus 2 infection and death in liver transplant recipients. Gastroenterology. 2022;162:645–647 e2.
- Hamm SR, Rezahosseini O, Møller DL, Loft JA, Poulsen JR, Knudsen JD, et al. Incidence and severity of SARS-CoV-2 infections in liver and kidney transplant recipients in the post-vaccination era: real-life data from Denmark. Am J Transplant. 2022;22:2637–2650.
- Cornberg M, Buti M, Eberhardt CS, Grossi PA, Shouval D. EASL position paper on the use of COVID-19 vaccines in patients with chronic liver diseases, hepatobiliary cancer and liver transplant recipients. J Hepatol. 2021;74:944-951.
- Fix OK, Blumberg EA, Chang KM, Chu J, Chung RT, Goacher EK, Hameed B, Kaul DR, Kulik LM, Kwok RM, McGuire BM, Mulligan DC, Price JC, Reau NS, Reddy KR, Reynolds A, Rosen HR, Russo MW, Schilsky ML, Verna EC, Ward JW, Fontana RJ; AASLD COVID-19 Vaccine Working Group. American Association for the Study of Liver Diseases Expert Panel Consensus Statement: Vaccines to Prevent Coronavirus Disease 2019 Infection in Patients With Liver Disease. Hepatology. 2021 Aug;74(2):1049-1064. doi: 10.1002/hep.31751. PMID: 33577086; PMCID: PMC8014184. Available at: https://www.aasld.org/sites/default/files/2022-10/AASLD%20COVID-19%20Guidance%20Document%2010.06.2022F.pdf. [CrossRef]
- Gkoufa A, Saridaki M, Georgakopoulou VE, Spandidos DA, Cholongitas E. COVID-19 vaccination in liver transplant recipients (Review). Exp Ther Med. 2023 May 3;25(6):291. doi: 10.3892/etm.2023.11990. PMID: 37206557; PMCID: PMC10189597. [CrossRef]
- Nimmo A, Gardiner D, Ushiro-Lumb I, Ravanan R, Forsythe JLR. The Global Impact of COVID-19 on Solid Organ Transplantation: Two Years Into a Pandemic. Transplantation. 2022 Jul 1;106(7):1312-1329. doi: 10.1097/TP.0000000000004151. Epub 2022 Apr 11. PMID: 35404911; PMCID: PMC9213067. [CrossRef]
- Chen X, Luo D, Mei B, et al. Immunogenicity of COVID-19 vaccines in solid organ transplant recipients: a systematic review and metaanalysis. Clin Microbiol Infect. 2023;29:441–456.
- Herrera S, Colmenero J, Pascal M, Escobedo M, Castel MA, Sole-González E, Palou E, Egri N, Ruiz P, Mosquera M, Moreno A, Juan M, Vilella A, Soriano A, Farrero M, Bodro M. Cellular and humoral immune response after mRNA-1273 SARS-CoV-2 vaccine in liver and heart transplant recipients. Am J Transplant. 2021 Dec;21(12):3971-3979. doi: 10.1111/ajt.16768. Epub 2021 Aug 4. PMID: 34291552; PMCID: PMC9800111. [CrossRef]
- Kabaçam G, Dayangaç M, Üçbilek E, Erçin CN, Günsar F, Akyıldız M, Akarsu M, Demir M, Kaymakoğlu S, Karasu Z, İdilman R. The COVID-19 pandemic: Clinical practice advice for gastroenterologists, hepatologists, and liver transplant specialists. Turk J Gastroenterol. 2020; 31(11): 841-852.
- Buehrle DJ, Sutton RR, McCann EL, Lucas AE. A review of treatment and prevention of coronavirus disease 2019 among solid organ transplant recipients. Viruses. 2021;13(9):1706.
- Navidi Z, Pakzad Moghadam SH, Iravani MM, Orandi A, Orandi A, Ghazi SF, Fallah E, Malekabad ES, Khorramnia S. Remdesivir in solid organ transplant recipients with COVID-19: a systematic review and meta-analysis. Clin Transplant Res. 2024 Sep 30;38(3):212-221. doi: 10.4285/ctr.24.0031. PMID: 39344698; PMCID: PMC11464156. [CrossRef]
- World Health Organization. WHO recommends highly successful COVID-19 therapy and calls for wide geographical distribution and transparency from originator. WHO; 2022 Apr 22. Available from: https://www.who.int/news/item/22-04-2022-who-recommends-highly-successful-covid-19-therapy-and-calls-for-wide-geographical-distribution-and-transparency-from-originator.
- Korula P, Alexander H, John JS, Kirubakaran R, Singh B, Tharyan P, Rupali P. Favipiravir for treating COVID-19. Cochrane Database Syst Rev. 2024 Feb 5;2(2):CD015219. doi: 10.1002/14651858.CD015219.pub2. PMID: 38314855; PMCID: PMC10840071. [CrossRef]
- Sanders JM, Monogue ML, Jodlowski TZ, Cutrell JB. Pharmacologic treatments for Coronavirus disease 2019 (COVID-19). A review. JAMA. Apr 13; doi: 10.1001/jama.2020.6019. [CrossRef]
- Asselah T, Durantel D, Pasmant E, Lau G, Schinazi RF. COVID-19: Discovery, diagnostics and drug development. J Hepatol. 2020;73(1):1-12.
- Fishbane S, Hirsch JS, Nair V. Special Considerations for Paxlovid Treatment Among Transplant Recipients With SARS-CoV-2 Infection. Am J Kidney Dis. 2022 Apr;79(4):480-482. doi: 10.1053/j.ajkd.2022.01.001. Epub 2022 Jan 12. PMID: 35032591; PMCID: PMC8754454. [CrossRef]
Figure 1.
Vaccinated patients, diagnosed cases by date and deaths from COVID-19.

Figure 2.
Kaplan-Meier curves for survival across COVID-19 waves.
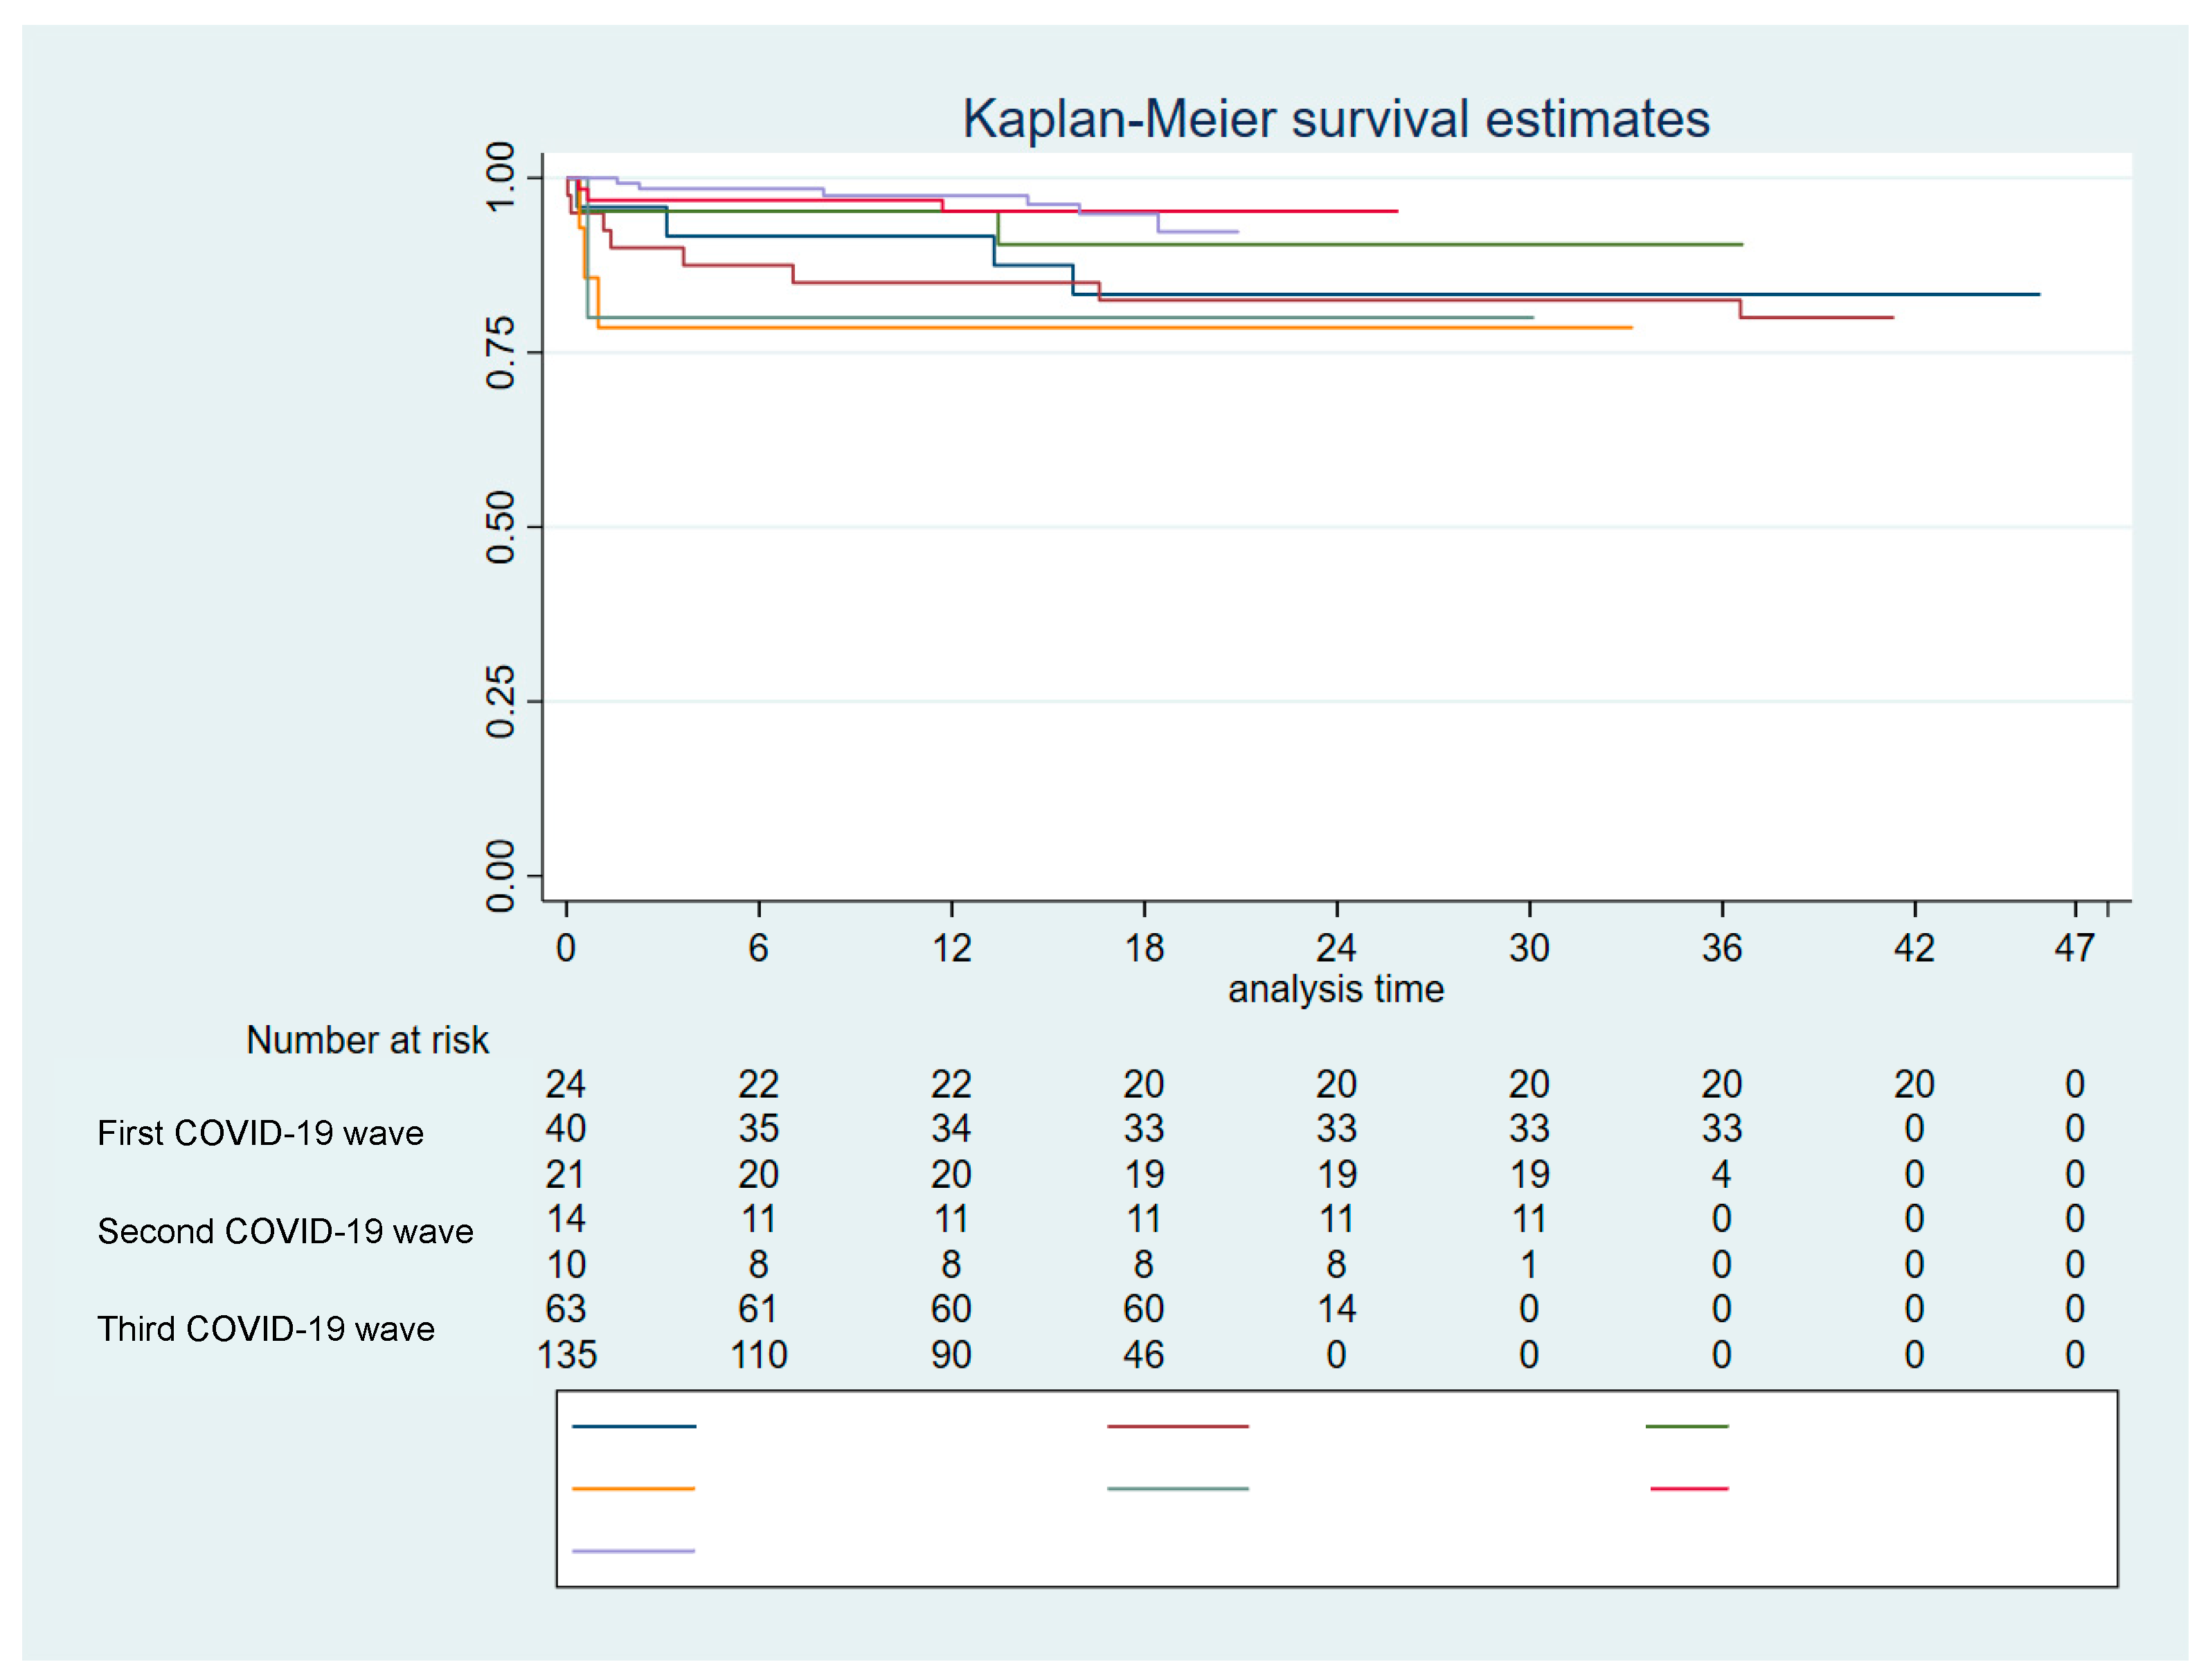
Table 1.
Symptoms at diagnosis and chest X-ray findings.
| Table 1. A. Symptoms at diagnosis | p-value | ||||||||
| Period | 1st wave | 2nd wave | 3rd wave | 4th wave | 5th wave | 6th wave | 7th wave | ||
| Number of cases | N = 302(5 lost cases) | 24 | 40 | 21 | 14 | 10 | 63 | 135 | |
| Odynophagia | 30 (9.93%) | 1 (4.17%) | 0 | 1 (4.76%) | 1 (7.14%) | 1 (10%) | 5 (8.06%) | 21 (16.03%) | 0.068 |
| Rhinorrhoea | 46 (15.23%) | 0 | 1 (2.5%) | 2 (9.52%) | 0 | 1 (10%) | 14 (22.58%) | 28 (21.37%) | 0.004 |
| Nausea or vomiting | 13 (4.30%) | 1 (4.17%) | 4 (10%) | 2 (9.52%) | 0 | 0 | 2 (3.23%) | 4 (3.05%) | 0.39 |
| Asthenia | 98 (32.45%) | 5 (20.83%) | 8 (20%) | 5 (23.81%) | 4 (28.57%) | 4 (40%) | 14 (22.58%) | 58 (44.27%) | 0.011 |
| Myalgias | 73 (24.17%) | 2 (8.33%) | 12 (30%) | 4 (19.05%) | 2 (14.29%) | 2 (20%) | 11 (17.74%) | 40 (30.53%) | 0.15 |
| Dyspnea | 45 (14.90%) | 7 (29.17%) | 10 (25%) | 2 (9.52%) | 3 (21.43%) | 1 (10%) | 11 (17.74%) | 11 (8.40%) | 0.043 |
| Ageusia | 11 (3.64%) | 0 | 2 (5%) | 0 | 0 | 3 (30%) | 3 (4.84%) | 3 (2.29%) | <0.001 |
| Anosmia | 15 (4.97%) | 0 | 4 (10%) | 1 (4.76%) | 0 | 4 (40%) | 2 (3.23%) | 4 (3.05%) | <0.001 |
| Chest pain | 12 (3.97%) | 2 (8.33%) | 1 (2.5%) | 1 (4.76%) | 1 (7.14%) | 0 | 4 (6.45%) | 3 (2.29%) | 0.65 |
| Diarrhoea | 32 (10.60%) | 7 (29.17%) | 7 (17.5%) | 2 (9.52%) | 1 (7.14%) | 1 (10%) | 4 (6.45%) | 10 (7.63%) | 0.039 |
| Febricle | 58 (19.21%) | 2 (8.33%) | 0 | 2 (9.52%) | 1 (7.14%) | 3 (30%) | 13 (20.97%) | 37 (28.24%) | 0.001 |
| Fever | 77 (25.50%) | 6 (25.00%) | 16 (40%) | 7 (33.33%) | 1 (7.14%) | 2 (20%) | 15 (24.19%) | 30 (22.9%) | 0.22 |
| Anorexia | 14 (4.64%) | 0 | 3 (7.5%) | 2 (9.52%) | 0 | 0 | 3 (4.84%) | 6 (4.58%) | 0.65 |
| Headache | 33 (10.93%) | 1 (4.17%) | 1 (2.5%) | 2 (9.52%) | 1 (7.14%) | 0 | 10 (16.13%) | 18 (13.74%) | 0.22 |
| Conjunctivitis | 1 (0.33%) | 0 | 1 (2.5%) | 0 | 0 | 0 | 0 | 0 | 0.36 |
| Expectoration | 26 (8.61%) | 1 (4.17%) | 1 (2.5%) | 1 (4.76%) | 2 (14.29%) | 0 | 6 (9.68%) | 15 (11.45%) | 0.44 |
| Cough | 120 (39.74%) | 14 (58.33%) | 16 (40%) | 4 (19.05%) | 2 (14.29%) | 3 (30%) | 18 (29.03%) | 63 (48.09%) | 0.006 |
| Asymptomatic | 60 (19.87%) | 4 (16.67%) | 7 (17.50%) | 7 (33.33%) | 4 (28.57%) | 3 (30%) | 16 (25.81%) | 19 (14.50%) | 0.26 |
| B. Chest X-ray findings | p-value | ||||||||
| Period | 1st wave | 2nd wave | 3rd wave | 4th wave | 5th wave | 6th wave | 7th wave | < 0.001 | |
| Number of cases | N = 275 (32 lost cases) | 24 | 40 | 21 | 14 | 10 | 63 | 135 | |
| Not performed | 191 (69.45%) | 7 (30.43%) | 24 (61.54%) | 11 (57.89%) | 4 (30.77%) | 4 (57.14%) | 42 (77.78%) | 99 (82.5%) | |
| Normal | 28 (10.18%) | 5 (21.74%) | 0 | 1 (5.26%) | 2 (15.38%) | 0 | 4 (7.41%) | 16 (13.33%) | |
| Bilateral pneumonia | 46 (16.73%) | 9 (39.13%) | 13 (33.33%) | 7 (36.84%) | 6 (46.15%) | 3 (42.86%) | 6 (11.11%) | 2 (1.67%) | |
| Lobar pneumonia | 10 (3.64%) | 2 (8.70%) | 2 (5.13%) | 0 | 1 (7.69%) | 0 | 2 (3.70%) | 3 (2.50%) | |
Table 2.
Drugs administered in each period.
| Table 2. Treatment received in each period | ||||||||
| Period | 1st wave | 2nd wave | 3rd wave | 4th wave | 5th wave | 6th wave | 7th wave | |
| Number of cases | N = 307 | 24 | 40 | 21 | 14 | 10 | 63 | 135 |
| Antibiotics | 50 (16.29%) | 11 (45.83%) | 13 (32.50%) | 2 (9.52%) | 5 (35.71%) | 2 (20.00%) | 7 (11.11%) | 10 (7.41%) |
| Anticoagulation | 38 (12.38%) | 5 (20.83%) | 12 (30.00%) | 4 (19.05%) | 6 (42.86%) | 5 (50.00%) | 5 (7.94%) | 1 (0.74%) |
| Antimalarials | 13 (4.23%) | 12 (50.00%) | 1 (2.50%) | 0 | 0 | 0 | 0 | 0 |
| Corticosteroids | 45 (14.66%) | 3 (12.50%) | 13 (32.50%) | 4 (19.05%) | 5 (35.71%) | 5 (50.00%) | 10 (15.87%) | 5 (3.70%) |
| Interferon | 2 (0.65%) | 2 (8.33%) | 0 | 0 | 0 | 0 | 0 | 0 |
| Kaletra | 3 (0.98%) | 3 (12.50%) | 0 | 0 | 0 | 0 | 0 | 0 |
| Tocilizumab | 8 (2.61%) | 2 (8.33%) | 0 | 1 (4.76%) | 3 (21.43%) | 1 (10.00%) | 1 (1.59%) | 0 |
| Remdesivir | 27 (8.79%) | 0 | 3 (7.50%) | 0 | 1 (7.14%) | 1 (10.00%) | 4 (6.35%) | 18 (13.33%) |
| Paxlovid | 3 (1.02%) | 0 | 0 | 0 | 0 | 0 | 0 | 3 (2.46%) |
Table 3.
Vaccination throughout COVID-19 waves.
| Table 3. Vaccination | |||||||||
| Period | 1st wave | 2nd wave | 3rd wave | 4th wave | 5th wave | 6th wave | 7th wave | ||
| Number of cases | 24 | 40 | 21 | 14 | 10 | 63 | 135 | ||
| Number of vaccines at diagnosis | |||||||||
| 0 | 93 (30.39%) | 24 (100%) | 40 (100%) | 21 (100%) | 8 (57.14%) | 0 | 0 | 0 | |
| 1 | 16 (5.23%) | 0 | 0 | 0 | 5 (35.71%) | 1 (10%) | 5 (8.06%) | 5 (3.70%) | |
| 2 | 38 (12.42%) | 0 | 0 | 0 | 1 (7.14%) | 9 (90%) | 17 (27.42%) | 11 (8.15%) | |
| 3 | 92 (30.07%) | 0 | 0 | 0 | 0 | 0 | 38 (61.29%) | 54 (40%) | |
| 4 | 54 (17.65%) | 0 | 0 | 0 | 0 | 0 | 2 (3.23%) | 52 (38.52%) | |
| 5 | 13 (4.25%) | 0 | 0 | 0 | 0 | 0 | 0 | 13 (9.63%) | |
| Number of vaccines at diagnosis: median (IQR) | 3 (0 – 3) | 0 | 0 | 0 | 0 (0 – 1) | 2 (2 – 2) | 3 (2 – 3) | 3 (3 – 4) | |
| Time from vaccine to diagnosis (months) | 5.87 (3.23-9.03) | 0.49 (0.3 - 0.52) | 2.89 (1.77-3.28) | 3.61 (3.11-4.98) | 7.34 (4.23-10.62) | ||||
Table 10.
Evolution of severe disease throughout the COVID-19 waves.
| Table 10. Evolution of severe disease throughout the COVID-19 waves | p | ||||||||
| Period | 1st wave | 2nd wave | 3rd wave | 4th wave | 5th wave | 6th wave | 7th wave | ||
| Number of cases | 24/307 (7.82%) | 40/307 (13.03%) | 21/307 (6.84%) | 14/307(4.56%) | 10/307 (3.25%) | 63/307 (20.52%) | 135/307 (43.97%) | ||
| Respiratory failure | 34/307 (11.07%) | 3 (12.50%) | 12 (30%) | 3 (14.29%) | 6 (42.86%) | 4 (40%) | 4 (6.35%) | 2 (1.48%) | <0.001 |
| IMV | 5/307 (1.63%) | 0 | 2 (5%) | 0 | 1 (7.69%) | 0 | 1 (1.59%) | 1 (0.74%) | 0.29 |
| Admission to the ICU | 12/307 (3.91%) | 1 (4.17%) | 2 (5%) | 0 | 2 (14.29%) | 0 | 5 (7.94%) | 2 (1.48%) | 0.11 |
| Hospitalization | 72/307 (23.45%) | 11 (45.83%) | 16 (40%) | 7 (33.33%) | 9 (64.29%) | 5 (50%) | 11 (17.46%) | 13 (9.63%) | <0.001 |
| Death due to COVID-19 | 12/307 (3.91%) | 1 (4.17%) | 4 (10%) | 1 (4.76%) | 3 (21.43%) | 2 (20%) | 1 (1.59%) | 0 (0.00%) | <0.001 |
| Severity | <0.001 | ||||||||
| Not severe COVID-19 disease | 243/307 (79.15%) | 15 (62.50%) | 24 (60%) | 15 (71.43%) | 6 (42.86%) | 6 (60) | 52 (82.54%) | 125 (92.59%) | |
| Severe COVID-19 disease | 64/307 (20.85%) | 9 (37.50%) | 16 (40%) | 6 (28.57%) | 8 (57.14%) | 4 (40%) | 11 (17.46%) | 10 (7.41%) | |
Disclaimer/Publisher’s Note: The statements, opinions and data contained in all publications are solely those of the individual author(s) and contributor(s) and not of MDPI and/or the editor(s). MDPI and/or the editor(s) disclaim responsibility for any injury to people or property resulting from any ideas, methods, instructions or products referred to in the content. |
© 2025 by the authors. Licensee MDPI, Basel, Switzerland. This article is an open access article distributed under the terms and conditions of the Creative Commons Attribution (CC BY) license (http://creativecommons.org/licenses/by/4.0/).
Copyright: This open access article is published under a Creative Commons CC BY 4.0 license, which permit the free download, distribution, and reuse, provided that the author and preprint are cited in any reuse.


