Preprint
Article

This version is not peer-reviewed.

Associations Between P300 Latency and Reaction Time on Event-Related Potentials in Children with Varying Levels of Fluid Intelligence

A peer-reviewed article of this preprint also exists.

Submitted:

10 March 2025

Posted:

11 March 2025

You are already at the latest version

Abstract

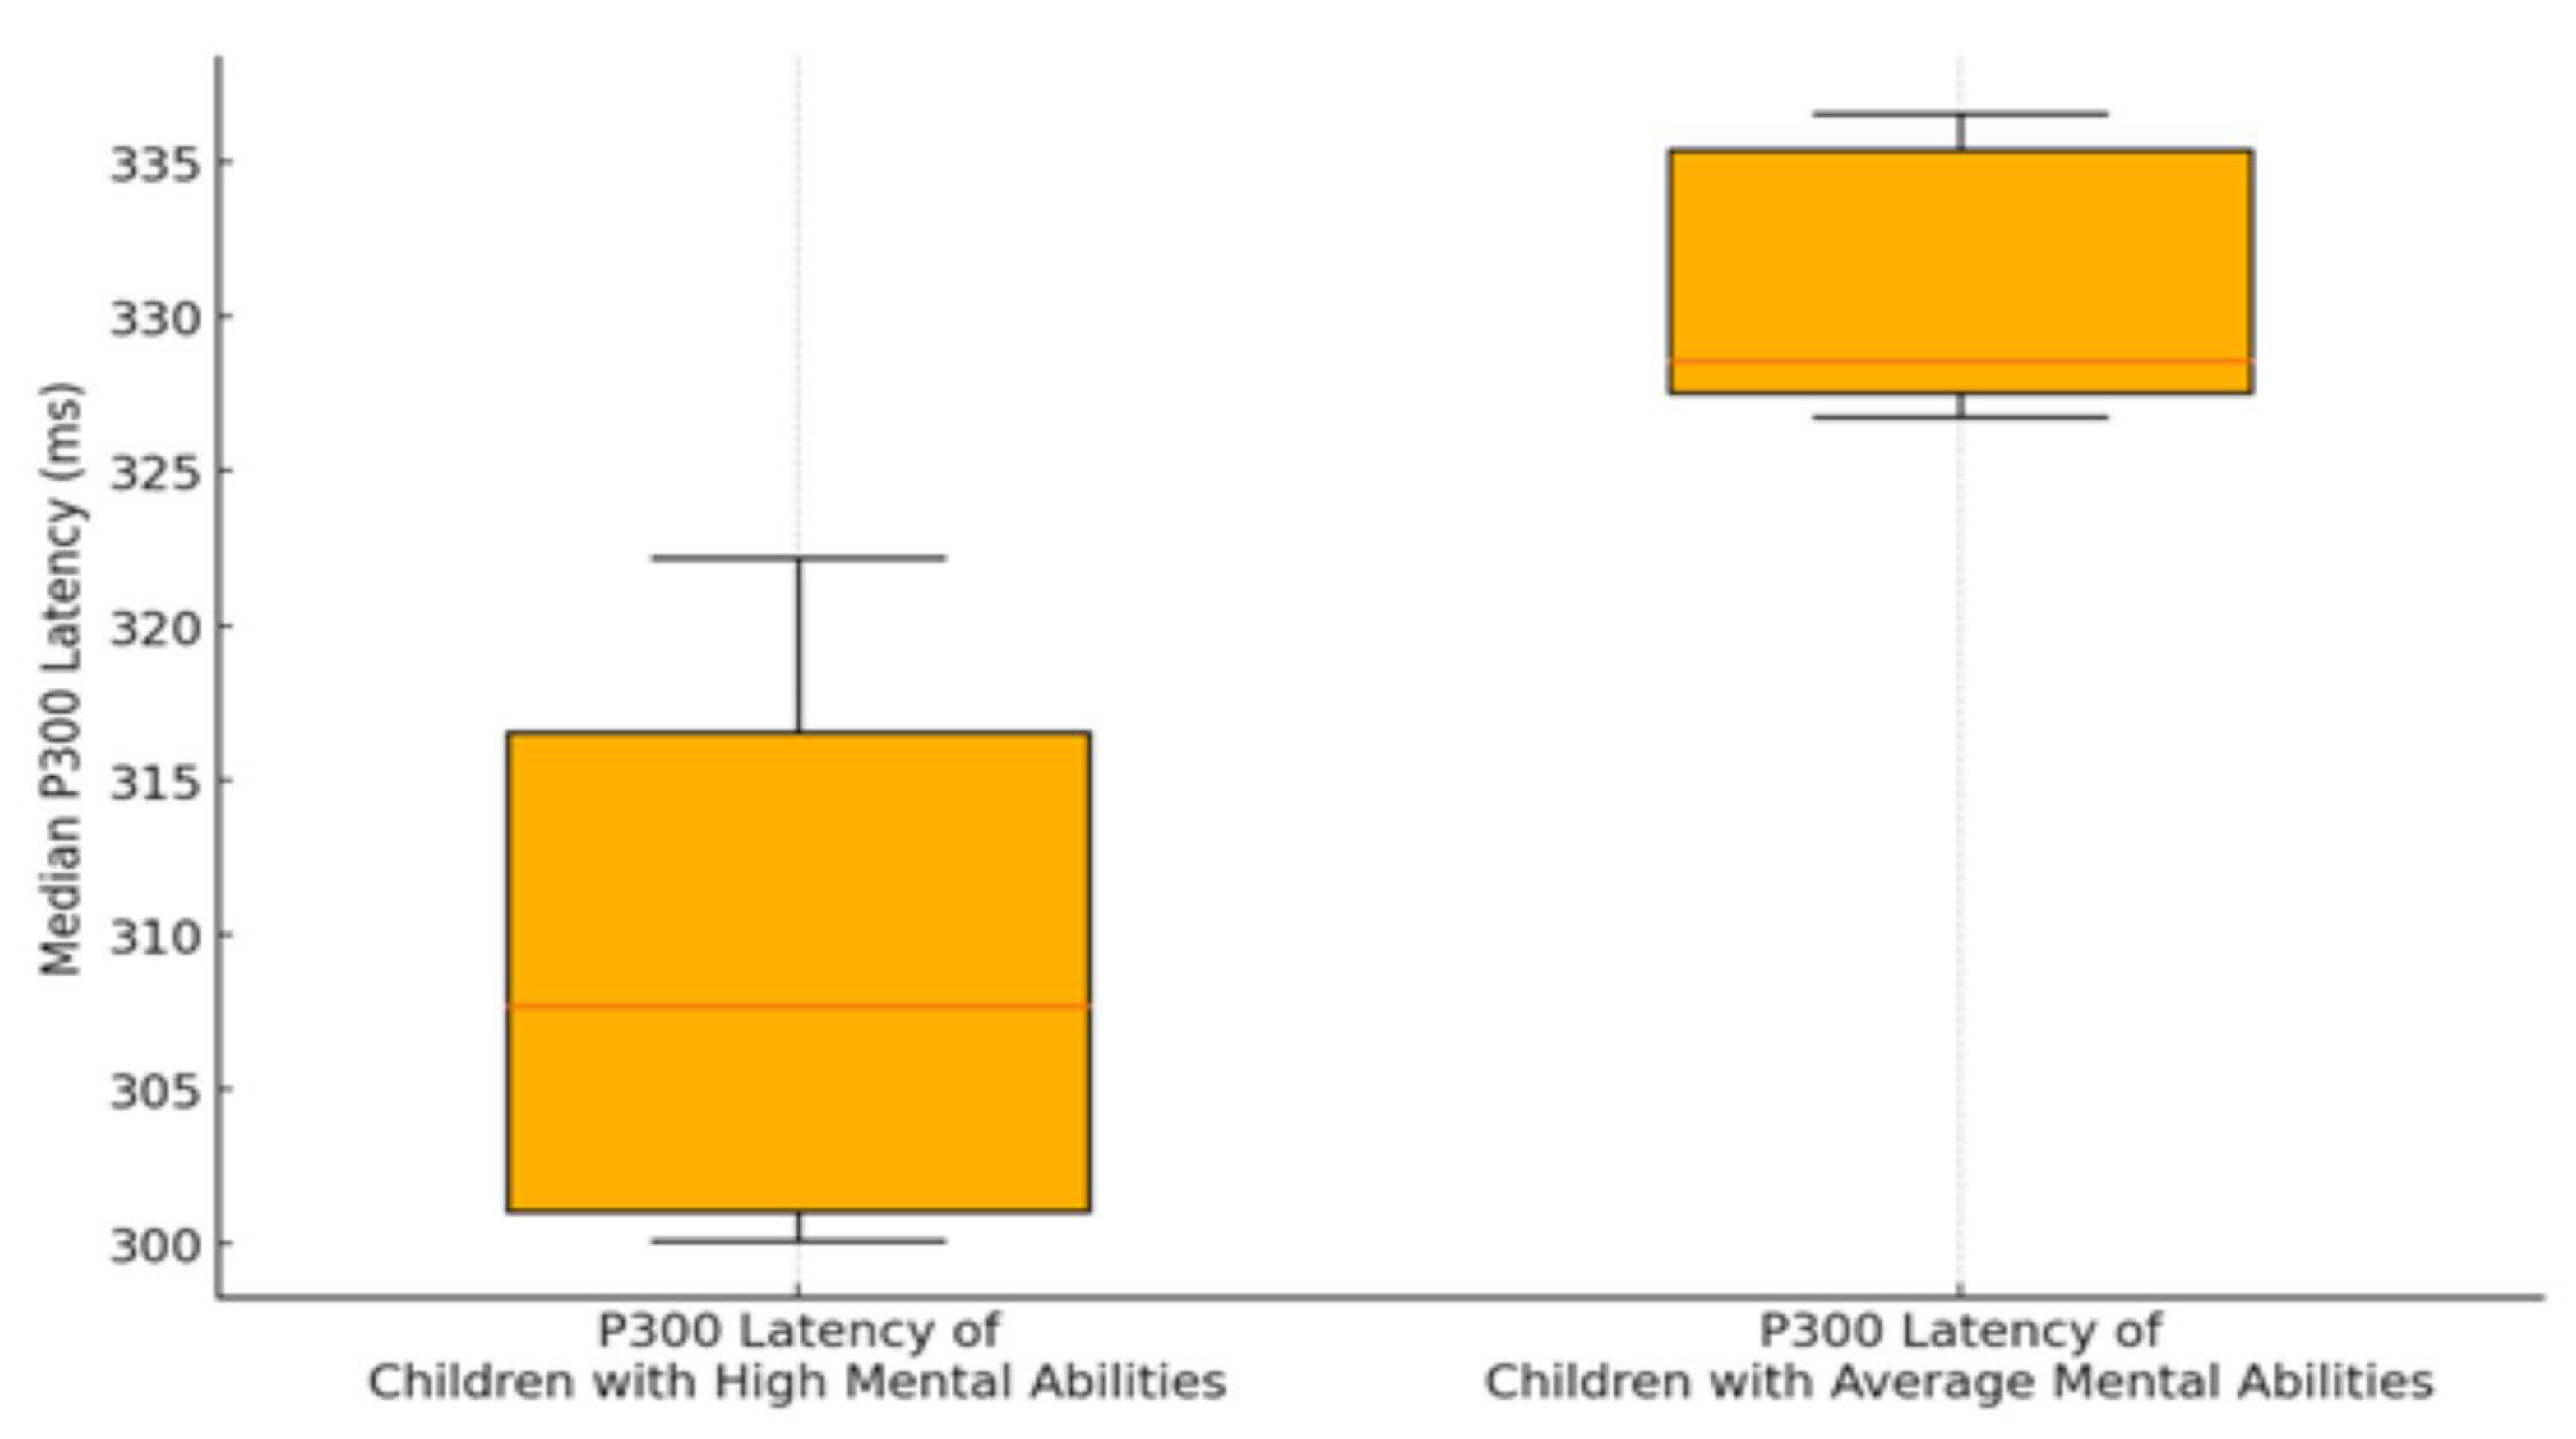
Exploring cognitive abilities is necessary in educational contexts, where such insights shape decisions about student placement and teaching methods. Traditionally, educational assessments have been leaned on academic performance to guide decisions related to grading and student placement. This study examines the relationships among specific neuropsychological measures, namely the Event Related Potentials (ERPs), P300 waveform, reaction time, and fluid intelligence in children. Raven’s Standard Progressive Matrices (RSPM) was utilized to assess intelligence levels. Based on their RSPM scores, participants were grouped into two categories: those with "high mental abilities" and those with "average mental abilities." It was hypothesized that children with higher RSPM scores might display reduced P300 latencies and quicker reaction times, potentially reflecting greater neural efficiency. Electrophysiological data collected using ERPs, focusing on the P300 component. The results suggest a possible association between higher intelligence scores and shorter P300 latencies and quicker reaction times, which could support the concept of neural efficiency and the significance of cognitive speed in understanding intelligence. This investigation into the neuropsychological foundations of cognitive ability in children is in the same line with studies supporting how brain activity, connectivity, and processing efficiency vary. These differences could help develop educational strategies that are more tailored to individual cognitive processing styles.

Keywords: 
;  ;  ;  ;  ;  
Subject: 
Social Sciences  -   Psychology

1. Introduction

Fluid intelligence, which enables thinking abstractly, reason rapidly, and solve new problems independently of learned knowledge, generally peaks in early adulthood and might decline as we age. This decline is linked to changes in brain areas critical for attention and short-term memory, such as the dorsolateral prefrontal cortex and the anterior cingulate cortex [1]. In contrast, crystallized intelligence, encompassing accumulated knowledge and skills, tends to stay stable or may increase as we grow older. The interaction between fluid and crystallized intelligence is essential for effective problem-solving and continuous learning throughout life [2].
Fluid intelligence is commonly used to predict a child’s potential and likelihood of academic success [3]. Assessing this type of intelligence involves complex mental tasks designed to solve problems that go beyond rote memorization. Additionally, the relationship between fluid intelligence and learning abilities suggests that it could influence educational practices [4]. Children who are intellectually gifted typically show more efficient neural functioning, allowing them to perform better than their peers on basic cognitive tasks and on tasks requiring cognitive control, such as those involving executive functions and inhibitory control [5]. Thus, intelligence assessments can predict children's performance in cognitive control tasks [6].
The Raven’s Standard Progressive Matrices (RSPM) is a non-verbal test that measures fluid intelligence by evaluating the ability to break down complex problems into smaller, manageable parts and to think abstractly [7,8]. The RSPM test challenges participants to identify the correct piece to complete a visual pattern, focusing on at-tributes like sameness, symmetry, and analogy, as well as form, color, and linear arrangement. Its language-free format helps reduce cultural and linguistic biases, making it a valuable tool for assessing intelligence across different cultural backgrounds [8].
This test is reliant on the visual processing abilities mediated by the occipital cortex, particularly Brodmann areas 18 and 19. These areas are crucial for processing complex visual stimuli through two distinct pathways: the ventral stream, which runs from the occipital cortex to the temporal lobe and is mainly involved in object recognition, and the dorsal stream, which extends to the parietal lobe and handles the processing of spatial relationships and motion [9]. The performance on the RSPM likely depends on the functionality and efficiency of these visual processing areas, as the test requires both abstract pattern recognition and spatial reasoning skills [10,11].
Neuroimaging research has revealed two primary models that describe the neuroanatomical and functional foundations of human fluid intelligence. The Parie-to-Frontal Integration Theory (P-FIT), as described by Jung and Haier [12], suggests that general intelligence arises from coordinated activity across distributed cortical networks. This theory highlights the importance of integrative processing across several brain regions, beginning with the initial sensory inputs processed in the occipital and temporal cortices, which handle basic perceptual and semantic tasks. This sensory data is then forwarded to the parietal cortex, which plays a role in abstracting and integrating this information into higher-order cognitive representations. The dorsolateral prefrontal cortex is thought to manage complex problem-solving, working memory, and executive functions that are critical for fluid reasoning. Additionally, the anterior cingulate cortex is believed to aid cognitive control by regulating response se-lection and conflict monitoring [13].
An alternate model, the Neural Efficiency Hypothesis, is primarily supported by findings from Positron Emission Tomography (PET) studies. This hypothesis, as evi-denced by the work of Haier et al. [14], indicates that repeated exposure to a task leads to a decrease in regional cerebral glucose metabolism, suggesting a more efficient neural function. This reduction in metabolic activity implies that individuals with higher intelligence may utilize more focused and task-specific neural activations, thereby optimizing the allocation of cognitive resources by only activating the essential brain regions for task performance. Conversely, those with lower intelligence may engage broader and less efficient networks, possibly as a compensatory or less specialized processing approach. This hypothesis is further supported by neurophysiological methods like electroencephalography (EEG), which assesses patterns of cortical activation. Studies analyzing event-related synchronization (ERS) and desynchronization (ERD) in EEG data have shown that individuals with higher intelligence levels display distinct patterns of neural oscillatory activity, aligning with efficient cognitive processing and resource utilization [15].
Event-related potentials (ERPs) are a non-invasive electrophysiological tool for examining brain activity related to cognitive information processing. ERPs measure the average electrophysiological response to a stimulus, with a significant P300 com-ponent emerging as the third positive deflection when stimuli are attentively processed, and a specific target is consciously identified [16]. This method is considered highly effective for exploring the correlations between brain electrical activity and the dynamic processes involved in handling cognitive stimuli [17]. The P300 component is particularly notable for its association with higher-level cognitive processing and the attentional mechanisms that are crucial for evaluating the context when focusing on specific stimuli [18].
The latency of the P300 component is thought to mirror complex cognitive functions such as categorization and sensory evaluation, acting as a temporal marker of brain activity that facilitates more efficient allocation of attention and refreshes working memory processes [4]. Longer P300 latencies often suggest slower cognitive processing and are commonly associated with cognitive impairments [4,19]. Additionally, the P300 component has shown relevance to learning and memory, as studies involving memory recall and new learning tasks have found notable correlations be-tween P300 responses and performance [20].
In educational settings, the relationship between P300 latencies and intelligence is particularly significant because these latencies can reflect the efficiency of cognitive processing, which correlates closely with intelligence and, by extension, academic performance [21]. By linking P300 latencies with intelligence metrics, educators and psychologists can better understand a student's cognitive strengths or challenges, paving the way for tailored educational support and interventions [22,23]. Research by Walhovd and Fjell [24] suggests that individuals with higher cognitive capabilities tend to have shorter P300 latencies, reinforcing the notion that rapid neural processing is associated with greater intelligence and learning capacity. Polich [25] also supports this, highlighting that the P300 component is indicative of cognitive capacity, with shorter latencies associated with higher cognitive functions, thus presenting a potential objective measure of intellectual capacity that aligns with educational achievements.
Furthermore, understanding cognitive processes such as attention and decision-making, which can be evaluated through reaction time measures, is crucial. Reaction time is closely linked to intelligence. It is suggested that reaction time can be a predictor of academic success that may vary in impact at different educational levels [26]. P300 latency and reaction time are vital neurophysiological markers for defining students' cognitive profiles, offering essential insights for crafting interventions to enhance learning and memory in environments that demand rapid cognitive processing and strong attentional control. Although systematic reviews indicate that the correlation between intelligence and academic achievement tends to decrease as students’ progress in their education [27], integrating core cognitive metrics with intelligence assessments provides a robust framework for educational psychologists and neuroeducators to examine cognitive dynamics within learning environments [27,28]. This approach aids in refining teaching strategies to better match individual neural and cognitive profiles, enhancing neural efficiency and optimizing educational outcomes. Leveraging intelligence research and cognitive assessments can help educators devise precise interventions tailored to diverse cognitive processing needs, supporting more effective neuroeducational practices [28].
Several studies have employed P300 latency within the oddball paradigm to explore the dynamics of intelligence [eg. 28,30-33]. It is suggested that individuals with higher cognitive capabilities tend to have shorter P300 latency compared to those with standard cognitive function, aligning with the mental speed theory that posits quicker intellectual processing and better attentional control in those with greater intellectual abilities [25,28,34,35,36]. However, this association between intelligence and P300 latency does not consistently extend to other cognitive tasks. For instance, conflicting results have emerged from studies employing the Sternberg memory scanning task and response-conflict paradigms [37,38].
In contrast, the linkage between intelligence scores and reaction time when responding to oddball target stimuli appears more stable. Consistently, research indicates that individuals with higher intelligence levels process information more swiftly, as evidenced by shorter reaction times during straightforward cognitive tasks—a conclusion supported by meta-analytic findings [39]. Additionally, these individuals often show faster reaction times than control groups, reflecting their superior attentional mechanisms, working memory capacity, and engagement with tasks [37].
While previous research has often focused on P300 latency or reaction time separately in relation to intelligence (e.g., [23,33] for P300 latency; [40,41] for reaction time), no studies to date have concurrently examined these metrics within the context of intelligence categorization. This combined approach could provide a more comprehensive view of cognitive processing speed and attentional dynamics. Furthermore, while existing studies on P300 latency and reaction time have primarily targeted adult or mixed-age populations (e.g., [33,35]), the current study is different in its focus on children. This emphasis on a developmental group allows for an analysis of cognitive profiles during pivotal educational phases. Additionally, this research aims to establish a direct correlation between scores on Raven’s Standard Progressive Matrices (RSPM) and both P300 latency and reaction times. Previous studies generally analyzed these variables separately or linked them to broader intelligence measures (e.g., [11,29]). The present study seeks to bridge this gap by associating specific fluid intelligence scores with both electrophysiological and behavioral indicators.
The present study aims to examine variations in electrophysiological brain activity, measured by ERPs, among children categorized by cognitive abilities into groups labeled as possessing "high mental abilities" or "average mental abilities" based on RSPM performance. Building on earlier neuropsychological investigations into electrophysiological markers across varying intelligence levels [24,40,41], the first hypothesis of this study expects significant differences in P300 latency between the groups, reflecting variations in cognitive processing speed and efficiency. The second hypothesis assumes these groups show different reaction times, indicative of differences in attentional and executive functions. Lastly, the third hypothesis suggests that both P300 latency and reaction time will correlate with RSPM scores across groups, proposing these measures as potential indicators of fluid intelligence in the developing brain.

2. Materials and Methods

2.1. Participants

Twenty-four male students aged between 10 and 12 years (mean age = 11.33, SD = 1.03) participated in this study. The cohort was divided into two groups based on their scores on the Raven's Standard Progressive Matrices (RSPM). The first group consisted of twelve right-handed children who scored highly on the RSPM (M = 137.33, SD = 11.65), and the second group also included twelve right-handed children but with average RSPM scores (M = 100.33, SD = 3.50). Selection for each group was strictly based on these RSPM performance metrics. It is important to note that none of the participants had undergone prior assessments of mental ability or electrophysiological evaluations. Additionally, all participants were screened to ensure they had no psycho-pathological disorders, learning difficulties, developmental disorders, or significant visual or hearing impairments, verified through detailed interviews with both the children and their parents.
Recruitment for the study occurred in primary schools, starting with interviews with teachers to confirm good academic performance among potential participants. The RSPM tests were then administered by a licensed psychologist [39], while another psychologist conducted interviews with the children’s parents to gather further developmental and health-related information. Based on the outcomes of the RSPM, the children were assigned to their respective groups. Subsequently, EEG recordings were administered to explore electrophysiological correlations of cognitive functioning.
Participation in the study required informed consent from all participants' parents or guardians, in line with ethical standards. All human data included in this manuscript were collected in compliance with the Helsinki Declaration and the guidelines established by the Internal Research Ethics Committee (EHDE) under protocol code 227092023. Lastly, this study employed the use of ChatGPT [48] to enhance the clarity and quality of the English writing in the manuscript.
Table 1. Procedural Flow of Study Implementation.
Step Procedure Description
Step 1: Informed Consent 1.1 Ethical Briefing Parents/guardians receive a detailed explanation of the study’s aims, procedures, and potential risks.
1.2 Consent Form Signing Written informed consent is obtained from parents/guardians in accordance with ethical guidelines.
2.3 Clinical interview Children, parents/guardians and educators
Step 2: Cognitive Assessment 2.1 Instruction Phase Children are given instructions and sample items to familiarize them with RSPM format.
2.2 RSPM Test Completion Children complete the RSPM to assess fluid intelligence and abstract reasoning.
2.3 Break (if needed) A short break is provided to ensure sustained attention and optimal performance.
Step 3: EEG Data Acquisition 3.1 EEG Preparation Electrode placement, impedance checks, and EEG system calibration are conducted.
3.2 Auditory Oddball Paradigm (ERP Task) Children perform an auditory oddball task to elicit the P300 component while EEG data are recorded.
3.3 Reaction Time Recording Behavioral responses (button presses) are recorded concurrently with EEG to measure reaction time.
3.4 Data Quality Check EEG data undergoes visual inspection to ensure artifact-free, high-quality recordings.

2.2. Implementation

All children participating in the study were assessed using Raven’s Standard Progressive Matrices (RSPM) to evaluate their nonverbal IQ. The RSPM comprises 36 items divided into three sets—A, Ab, and B—with each set containing 12 matrices that increase progressively in complexity. In each matrix, participants encounter an in-complete visual pattern and must choose the correct piece from six options to logically complete the pattern.
Set A introduces participants to basic principles of pattern recognition and visual-spatial reasoning, featuring simple and easily discernible designs. Moving to Set Ab, the complexity escalates, bridging the gap between Sets A and B by demanding greater attention to detail and enhanced relational reasoning. Set B challenges participants with intricate visual relationships and abstract patterns, requiring advanced cognitive processing and sophisticated problem-solving strategies.
Participants were instructed to select the option that logically completes each pattern. Scoring is based on the total number of correct responses, which are then compared to age-specific normative data to gauge the child’s cognitive performance relative to their peers. High scores on this scale are indicative of robust abstract reasoning abilities and cognitive flexibility, whereas lower scores may suggest difficulties in visual-spatial processing or problem-solving capabilities.
The assessment was carried out at the Digital Neuropsychological Assessment Laboratory of the University of Thessaly, within a specially designated research space. A psychologist was present throughout the session to provide instructions and ensure adherence to the timing specifications outlined in the test manual [7,8,42], ensuring a standardized testing environment conducive to accurate measurement of cognitive abilities.

2.3. Electrophysiological Assessment

2.3.1. Electrode Placement and Data Recording

ERPs were measured using a Medtronic device (710 Medtronic Parkway, Minneapolis, MN, USA. Ag-AgCl electrodes were placed at 15 sites (FP1, FPz, FP2, F3, Fz, F4, T3, T4, C3, Cz, C4, P3, Pz, P4, and Oz) in accordance with the 10-20 International System [43]. The ground electrode was placed at the nasion, and all channels were referenced to linked mastoids. Also, EOG electrodes were placed below the eye (for vertical movements) and the other at the outer canthi (for horizontal movements). Electrode impedance was maintained at <5 kΩ. Recordings were made at a sampling rate of 256 Hz, with a bandpass filter set between 0.16 Hz and 70 Hz. EEG data were segmented into epochs spanning 200 ms pre-stimulus to 800 ms post-stimulus

2.3.2. P300 Component Detection

The P300 component latency was measured for both target and non-target stimuli across all channels. The P300 waveform, identified by its long positive peak occurring 250-500 ms after the N200 waveform, was visually inspected for accurate detection. It is noteworthy that the researchers did not employ algorithmic approaches for the identification of P300 latencies. While automated methods offer certain advantages, such as increased efficiency, they also present limitations that can be influenced by factors including data quality, signal filtering parameters, the nature of the cognitive task, and the specific research objectives. To address potential shortcomings associated with automated detection, the researchers conducted visual inspections of the electrophysiological data and implemented manual adjustments to ensure the accuracy and reliability of P300 latency measurements. If a reliable P300 peak was not observed, the data for that ERP were marked invalid [44]. Participants were seated comfortably with their eyes closed to minimize visual distractions and reduce ocular artifacts during EEG recording.

2.3.3. Auditory Stimuli

A passive auditory oddball paradigm was employed to generate the P300 component of ERPs. Auditory stimuli were delivered binaurally through headphones, featuring 200 auditory tones at 85 dB SPL. Each tone lasted for 40 ms with 10 ms rise and fall times, aimed at reducing sudden auditory shifts. The stimuli were distributed with a fixed interstimulus interval (ISI) of 1500 ms, enhancing the time frame for cognitive processing and minimizing the overlap of neural responses. The standard (non-target) stimuli were tones at 1000 Hz, occurring with an 80% probability, while the oddball stimuli were 2000 Hz tones, occurring less frequently (20%) to elicit the P300 response. Participants were instructed to sit comfortably and respond to the target tones by pressing a button with their right hand quickly and accurately upon recognition. The response times were recorded with high precision using a response box, which was synchronized with the stimulus presentation software, ensuring millisecond precision in capturing both stimulus onset and response timing within the EEG data stream. Following EEG data collection, reaction times were obtained from the event markers and assessed together with P300 latencies. Software designed to identify correct and erroneous responses (provided by Medtronic) was used to selectively remove epochs associated with incorrect responses from the analysis dataset.

2.3.4. Data Preprocessing and Artifact Removal

To ensure high-quality data, trials were excluded if the voltage exceeded 70 μV in any of the 15 channels (excluding EOG) or if participants provided incorrect responses. A notch filter was applied at 50 Hz to remove power line artifacts, as recommended in EEG processing guidelines [44]. Baseline correction was performed using the 200 ms pre-stimulus period, and epochs were averaged separately for target and non-target stimuli [45,46]. Only children with at least 30 artifact-free trials for both conditions were included in the analysis [47]. Recordings took place in a soundproof room to prevent external interruptions. This methodology ensured reliable electrophysiological measurements and established correlations between cognitive ability and P300 latency [45].

2.4. Statistical Analysis

Initially, descriptive statistics were conducted to outline the demographic and clinical characteristics of the participants. The Kolmogorov-Smirnov test was then utilized to check the distribution of the data, confirming its conformity to a normal distribution. Following this, a t-test was employed to explore the differences in P300 latency between groups of children categorized as having high versus average mental abilities. The Benjamini-Hochberg (BH) procedure was calculated to manage the False Discovery Rate (FDR), which measures the expected rate of incorrect rejections of the null hypothesis among all the hypotheses tested. This approach was used in the present study as it involved multiple comparisons. Additionally, reaction times were compared between the two groups using another t-test. To quantify the size of the observed differences, effect sizes were calculated using Cohen’s d [49]. This measure provides a standardized method of assessing the practical significance of the findings, offering a clearer understanding of the impact of cognitive abilities on these neurophysiological responses. Finally, correlation analyses were conducted to examine the relationships between P300 latency and the children’s scores on Raven’s Standard Progressive Matrices (RSPM). Given that RSPM scores might exhibit non-normal distribution due to developmental variability and the relatively small sample sizes typical in such studies, these analyses were crucial for understanding how these scores related to neurophysiological measurements. This approach aimed to elucidate further the interplay between standardized intelligence measures and underlying brain activities.

3. Results

In assessing cognitive processing through electrophysiological metrics, a T-test was employed to elucidate differences between cohorts of children exhibiting high mental abilities and those demonstrating average mental abilities according to RSPM. The analytic focus included mean scores and variability, expressed as standard deviations, of P300 latency across 15 electroencephalographic sites. Additionally, the magnitude of observed differences was quantified using Cohen’s d to present effect sizes. Table 2 details these findings, presenting mean scores, standard deviations, levels of statistical significance, and effect sizes pertaining to P300 latency for each site.
P300 latency exhibited statistically significant variations correlating with scores on RSPM. Specifically, children characterized by higher mental abilities demonstrated shorter P300 latencies compared to their peers with average mental abilities. The negative values observed, ranging from -9.49 to -5.89, consistently indicated longer mean P300 latencies for children with average mental abilities across all electroencephalographic recording sites. Moreover, Cohen's d values, ranging from 3.88 to 2.05, present the differences in cognitive response times between the two cohorts.
For a comprehensive visual representation, median P300 latencies were calculated for each child across all 15 electrodes, providing a measure of cognitive response time. The resulting boxplots in Figure 1 effectively illustrate the median, interquartile range, and variability within each group, enhancing the interpretability of how cognitive processing speeds differ between children with high and average mental abilities.
The findings facilitate an examination of neural processing speeds, revealing that children with high mental abilities typically demonstrate faster and more equal neural responses. This is reflected in shorter P300 latencies along with reduced variability in these measurements, suggesting enhanced efficiency in cognitive processing.
To ensure the findings of these observations, the Benjamini-Hochberg procedure was employed to control the False Discovery Rate (FDR) among multiple comparisons across various EEG recording sites. This statistical approach aids in observing the true differences in P300 latencies between groups, categorized by differing mental abilities, minimizing the risk of Type I errors in the analysis. Table 3 encapsulates the outcomes of applying this procedure, offering a detailed account of the controlled FDR values across the multiple EEG sites involved in the study.
Each of the 15 EEG sites demonstrated statistically significant differences in P300 latency, indicating consistent differences in neural processing speeds across the complete spectrum of measured sites between the two groups. The low p-values observed offer substantive evidence against the null hypothesis, which posits no difference in latencies between the groups. Further examination through comparison of these p-values against the Benjamini-Hochberg (BH) values confirms that the observed differences are indeed statistically significant, even after adjusting for multiple comparisons. This methodology confirms that the conclusions are not merely the result of random chance, thereby supporting the reliability of the findings.
Next, the analysis focused on examining the reaction times of children with high mental abilities compared to those with average mental abilities. It's important to remember that all participants were asked to press a button as quickly and accurately as possible when they detected the target stimulus (oddball). Table 4 displays the mean scores, standard deviations, statistical significance, and effect sizes for the reaction times from both groups of participants.
As shown in Table 4, children with high mental abilities demonstrated shorter reaction times than their peers with average mental abilities, with statistical significance differences. Additionally, the negative t-value presents that the average reaction times for children with average mental abilities were generally longer than those for children with higher mental abilities. Furthermore, a high Cohen's D value suggests a significant effect size in these differences.
To further explore the relationship between cognitive metrics, a Spearman's ρ correlation analysis was conducted. This analysis assessed the associations between the latency of the P300 waveform and the RSPM scores of children, covering all 15 topographic brain areas. The findings from this correlation analysis are detailed in Table 5.
The results showed a range of findings, with correlations varying from ρ = -0.742 at the FP2 electrode site to ρ = -0.893 at the T4 electrode site. The analysis highlighted a strong negative correlation, suggesting that higher RSPM scores are associated with shorter P300 latencies.
Following the same statistical approach, the correlation between reaction time and RSPM scores was also examined. A significant negative correlation (ρ = -0.877) was observed, indicating that higher RSPM scores tend to correlate with quicker reaction times.

4. Discussion

In this study, we aimed to explore differences in electrophysiological brain activity between children classified by Raven's Standard Progressive Matrices as having "high mental abilities" and those with "average mental abilities." Our first hypothesis, in the same line of earlier research (e.g., [23,24,30,31,32,33]), examined whether P300 latency differs between these two groups. Our findings confirmed this, showing that children with high mental abilities consistently had shorter P300 latencies across various electroencephalographic sites compared to their peers with average abilities.
This pattern of shorter P300 latencies in children with higher cognitive abilities, consistent with results from other studies (e.g., [30,31,32,33]), might explain their superior performance on the RSPM. A shorter P300 latency suggests better memory and attentional functions [50], reflecting quicker stimulus assessment and more efficient cognitive processing. This efficiency is significant as studies have found that individuals with better memory capabilities often exhibit shorter auditory P300 latencies [52,53], while a longer P300 latency might indicate attentional disorders [53].
Overall, longer P300 latencies are generally associated with lower cognitive performance [47]. These results not only support our hypothesis but also align with the neural efficiency model, which suggests that cognitive efficiency varies with task complexity. This model is further supported by our use of the auditory oddball paradigm, a task that requires selective attention and swift decision-making. This task seems particularly effective at highlighting cognitive differences, supporting the suggestions that brain efficiency is task-dependent and varies between individuals with different levels of cognitive abilities [5].
The Benjamini-Hochberg (BH) correction was used to minimize the likelihood of Type I statistical errors that could arise from the multiple comparisons across 15 EEG sites. This adjustment of the significance threshold helps ensure the reliability and validity of the study's results, given the extensive number of statistical tests performed. Significant differences in P300 latency between children with high and average mental abilities were noted at all EEG sites, with p-values falling well below the adjusted threshold. These results highlight notable differences in cognitive processing speed and efficiency between the two groups, providing further evidence in support of the neural efficiency theory. Additionally, these findings emphasize the value of P300 latency as a neurophysiological marker for discerning and understanding variations in cognitive abilities, reinforcing its practical importance in educational and developmental settings.
The second hypothesis of this study was encouraged by prior research suggesting that individuals with higher mental abilities often exhibit shorter reaction times [18,52,53,55,56,57]. Consistent with these findings, our study observed that children with higher mental abilities demonstrated statistically significant shorter reaction times compared to their peers with average abilities.
This reduction in reaction time may reflect superior memory and attentional functions, as it has been proposed that children and adolescents with higher mental abilities are better at inhibiting premature responses, allowing them to answer with greater confidence [58]. Additionally, shorter reaction times are thought to be indicative of enhanced self-regulation capabilities, suggesting that highly intelligent children may possess more effective self-regulation strategies [6].
By integrating both electrophysiological and behavioral data, as it is suggested, children with higher intelligence levels display more mature and efficient neural functioning in cognitive tasks [15,56]. The ability for rapid stimulus detection and response proposes improved sensory processing and motor execution, facilitated by reduced neural "noise" and more optimized cortical activation patterns in those with elevated cognitive abilities [60]. These observations align with neuroscientific research indicating that as intelligence increases, reaction time variability decreases, pointing to more stable and efficient cognitive processing across various tasks [38].
The considerable Cohen’s d values reported for both P300 latency and reaction time not only reinforce the statistical significance of these findings but also their practical relevance. These large effect sizes illuminate the profound impact of cognitive differences on neural processing speeds and serve as crucial metrics in this study, highlighting the practical implications of our findings, particularly in the contexts of cognitive and educational development.
The third hypothesis anticipated a correlation between P300 latency and reaction time with RSPM scores, based on other studies that noted a positive correlation between P300 amplitude and RSPM scores, and a negative correlation between P300 latency and RSPM scores [31,69]. Our analysis suggested negative correlations between both P300 latency and reaction time with RSPM scores across the two groups, linking higher intelligence scores to shorter P300 latencies and reaction times.

4.1. Psychoeducational implications of the study using ERPs and RSPM results in identifying children’s mental abilities.

The combination of P300 and RSPM in cognitive classification has meaningful applications in psychoeducational contexts. By considering both P300 latency and RSPM scores, it becomes possible to identify gifted individuals at an early stage, which can support timely educational interventions [61]. Distinguishing between children with high and average mental abilities allows educators to develop personalized learning strategies that cater to their cognitive profiles [62]. For instance, children with shorter P300 latencies may benefit from accelerated learning programs, while those with average latencies might need more structured, scaffolded instruction to optimize their learning experience [63,64].
Additionally, longitudinal research that incorporates both P300 waveforms and RSPM scores provides a valuable framework for monitoring cognitive development over time. These studies contribute to understanding neurodevelopmental trajectories by examining how cognitive processing and executive functioning mature across different age groups [24]. The integration of electrophysiological markers such as P300 latency with behavioral assessments from the RSPM facilitates an evaluation of how educational interventions impact attentional control, working memory, and fluid intelligence at various developmental stages [65]. This approach provides insights into the ways in which cognitive functions influence learning, ultimately guiding evidence-based teaching practices. By classifying children based on cognitive abilities, such methodologies help acknowledge the diversity of intelligence and inform educational policies that support the development of all learners [66,67]. In this way, neuroscience contributes to practical solutions in education, bridging the gap between research and real-world applications [68].

4.2. Limitations

There are several methodological considerations to consider when interpreting the findings of this study. One limitation is the relatively small sample size, which resulted from the challenges of recruiting children with high RSPM scores. Additionally, the average participant age remained low due to strict exclusion criteria. A larger sample could have provided stronger statistical power, but even within this limited group, the study yielded meaningful insights. Another consideration is the reliance on the RSPM as the sole measure of intelligence, which does not assess verbal abilities. Future research could incorporate additional cognitive assessments to provide a more comprehensive understanding. Lastly, the study focused specifically on the P300 waveform, even though other ERPs waveforms have been explored in cognitive research. The decision to emphasize P300 was based on its well-documented relevance to studies on cognitive abilities and higher-order cognitive functions.

5. Conclusions

In summary, while this study has certain limitations, its findings align with previous research showing that children with high intelligence tend to have shorter P300 latencies and faster reaction times. These results point to an association between higher cognitive abilities and more efficient neural processing, suggesting advantages in attention, memory, and inhibitory control. These cognitive strengths likely contribute to better academic performance and overall cognitive efficiency. The observed links between P300 latency, reaction time, and RSPM scores further support trends related in earlier studies. By categorizing participants based on fluid intelligence, this study highlights the developmental processes in children aged 10 to 12, offering valuable insights into cognitive functioning at a critical stage of learning.
Moreover, these findings provide empirical support for the neural efficiency theory, which helps explain cognitive differences among children. The combination of P300 latency and reaction time as indicators of neural efficiency presents a useful framework for understanding the neurophysiological mechanisms underlying intelligence. Future research could build on these insights by exploring these relationships over longer periods and within more diverse populations to gain a deeper understanding of how developmental and environmental factors shape cognitive efficiency.

Author Contributions

Data curation, Irini Dermitzaki , Panayiotis Patrikelis, Lambros Messinis and Eugenia Toki; Formal analysis, Nikolaos C. Zygouris and Irini Dermitzaki ; Investigation, Nikolaos C. Zygouris; Methodology, Nikolaos C. Zygouris and Eugenia Toki; Visualization, Nikolaos C. Zygouris; Writing – original draft, Nikolaos C. Zygouris and Irini Dermitzaki ; Writing – review & editing, Panayiotis Patrikelis, Lambros Messinis and Eugenia Toki.

Funding

This research received no external funding.

Institutional Review Board Statement

All participants' parents/guardians were required to sign the consent form allowing their child to participate in the research. Finally, all human data included in this manuscript were obtained in compliance with the Helsinki Declaration and the guidelines of the University of Thessaly Internal Research Ethics Committee (EHDE) protocol (code 227092023).

Informed Consent Statement

Informed consent was obtained from the parents or guardians of all children involved in the study.

Data Availability Statement

The original contributions presented in the study are included in the article, further inquiries can be directed to the corresponding author.

Acknowledgments

The authors acknowledge the use of ChatGPT [48], an AI-powered language model, for leveraging advanced natural language processing (NLP) techniques to enhance English writing. ChatGPT assisted in refining grammar, sentence structure, and overall coherence, benefiting both native and non-native speakers. Its application contributed to improving the clarity of the manuscript.

Conflicts of Interest

The authors declare no conflicts of interest.

References

  1. Mitchell, D.J.; Mousley, A.L.; Shafto, M.A.; Duncan, J. Neural contributions to reduced fluid intelligence across the adult lifespan. Journal of Neuroscience 2023, 43, 293–307. [Google Scholar] [PubMed]
  2. Scherrer, V.; Breit, M.; Preckel, F. Crystallized Intelligence, Fluid Intelligence, and Need for Cognition: Their Longi-tudinal Relations in Adolescence. Journal of Intelligence 2024, 12, 104. [Google Scholar] [PubMed]
  3. Wang, T.; Ren, X.; Altmeyer, M.; Schweizer, K. An account of the relationship between fluid intelligence and complex learning in considering storage capacity and executive attention. Intelligence 2013, 41, 537–545. [Google Scholar]
  4. Amin, H.U.; Malik, A.S.; Kamel, N.; Chooi, W.T.; Hussain, M. P300 correlates with learning & memory abilities and fluid intelligence. Journal of neuroengineering and rehabilitation 2015, 12, 1–14. [Google Scholar]
  5. Neubauer, A.C.; Fink, A. Intelligence and neural efficiency. Neuroscience & Biobehavioral Reviews 2009, 33, 1004–1023. [Google Scholar]
  6. Liu, T.; Xiao, T.; Shi, J.; Zhao, D.; Liu, J. Conflict control of children with different intellectual levels: an ERP study. Neuroscience Letters 2011, 490, 101–106. [Google Scholar]
  7. Raven, J.C. (1938). Raven standard progressive matrices. Journal of Cognition and Development.
  8. Raven, J. (2008). The Raven progressive matrices tests: their theoretical basis and measurement model. Uses and abuses of Intelligence. Studies advancing Spearman and Raven’s quest for non-arbitrary metrics, (Part I).
  9. Zurrin, R.; Wong, S.T. S.; Roes, M.M.; Percival, C.M.; Chinchani, A.; et al. , Functional brain networks involved in the Raven's standard progressive matrices task and their relation to theories of fluid intelligence. Intelligence 2024, 103, 101807. [Google Scholar]
  10. Duncan, J.; Chylinski, D.; Mitchell, D.J.; Bhandari, A. Complexity and compositionality in fluid intelligence. Pro-ceedings of the National Academy of Sciences 2017, 114, 5295–5299. [Google Scholar] [CrossRef]
  11. Tanaka, F.; Kachi, T.; Yamada, T.; Sobue, G. Auditory and visual event-related potentials and flash visual evoked potentials in Alzheimer's disease: correlations with Mini-Mental State Examination and Raven's Coloured Progressive Matrices. Journal of the neurological sciences 1998, 156, 83–88. [Google Scholar]
  12. Jung, R.E.; Haier, R.J. The Parieto-Frontal Integration Theory (P-FIT) of intelligence: converging neuroimaging evidence. Behavioral and brain sciences 2007, 30, 135–154. [Google Scholar]
  13. Zacks, J.M. Neuroimaging studies of mental rotation: a meta-analysis and review. Journal of cognitive neuroscience 2008, 20, 1–19. [Google Scholar] [PubMed]
  14. Haier, R.J.; Siegel, B.; Tang, C.; Abel, L.; Buchsbaum, M.S. Intelligence and changes in regional cerebral glucose metabolic rate following learning. Intelligence 1992, 16, 415–426. [Google Scholar] [CrossRef]
  15. Neubauer, A.C.; Grabner, R.H.; Fink, A.; Neuper, C. Intelligence and neural efficiency: Further evidence of the influence of task content and sex on the brain–IQ relationship. Cognitive Brain Research 2005, 25, 217–225. [Google Scholar]
  16. Zygouris, N.C. Differences in children and adolescents with depression before and after a remediation program: an event-related potential study. Brain sciences 2024, 14, 660. [Google Scholar]
  17. Karapetsas, A.V.; Zygouris, N.C. Event Related Potentials (ERPs) in prognosis, diagnosis and rehabilitation of children with dyslexia. Encephalos 2011, 48, 118–127. [Google Scholar]
  18. Howe, A.S.; Bani-Fatemi, A.; De Luca, V. The clinical utility of the auditory P300 latency subcomponent event-related potential in preclinical diagnosis of patients with mild cognitive impairment and Alzheimer’s disease. Brain and cognition 2014, 86, 64–74. [Google Scholar]
  19. Demirayak, P.; Kıyı, İ.; İşbitiren, Y.Ö.; Yener, G. Cognitive load associates prolonged P300 latency during target stimulus processing in individuals with mild cognitive impairment. Scientific Reports 2023, 13, 15956. [Google Scholar]
  20. Zhong, R.; Li, M.; Chen, Q.; Li, J.; Li, G.; Lin, W. The P300 event-related potential component and cognitive im-pairment in epilepsy: a systematic review and meta-analysis. Frontiers in neurology 2019, 10, 943. [Google Scholar]
  21. Sternberg, R.J. (Ed.). (2020). The Cambridge handbook of intelligence. Cambridge University Press.
  22. Walhovd, K.B.; Nyberg, L.; Lindenberger, U.; Amlien, I.K.; Sørensen, Ø.; et al. Brain aging differs with cognitive ability regardless of education. Scientific reports 2022, 12, 13886. [Google Scholar] [CrossRef]
  23. Warchoł, Ł.; Zając-Lamparska, L. The Relationship of N200 and P300 Amplitudes With Intelligence, Working Memory, and Attentional Control Behavioral Measures In Young Healthy Individuals. Advances in Cognitive Psychology 2023, 19. [Google Scholar]
  24. Walhovd, K.B.; Fjell, A.M. One-year test–retest reliability of auditory ERPs in young and old adults. International Journal of Psychophysiology 2002, 46, 29–40. [Google Scholar] [PubMed]
  25. Polich, J. (2011). Neuropsychology of P300. In E. S. Kappenman & S. J. Luck (Eds.), The Oxford handbook of event-related potential components (pp. 160–188). Oxford University Press.
  26. Sternberg, R.J. A theory of adaptive intelligence and its relation to general intelligence. Journal of Intelligence 2019, 7, 23. [Google Scholar] [PubMed]
  27. Lozano-Blasco, R.; Quílez-Robres, A.; Usán, P.; Salavera, C.; Casanovas-López, R. Types of intelligence and academic performance: A systematic review and meta-analysis. Journal of Intelligence 2022, 10, 123. [Google Scholar]
  28. Ren, X.; Schweizer, K.; Wang, T.; Chu, P.; Gong, Q. On the relationship between executive functions of working memory and components derived from fluid intelligence measures. Acta Psychologica 2017, 180, 79–87. [Google Scholar]
  29. Ren, X.; Wang, T.; Sun, S.; Deng, M.; Schweizer, K. Speeded testing in the assessment of intelligence gives rise to a speed factor. Intelligence 2018, 66, 64–71. [Google Scholar]
  30. Bazana, P.G.; Stelmack, R.M. Intelligence and information processing during an auditory discrimination task with backward masking: an event-related potential analysis. Journal of personality and social psychology 2002, 83, 998. [Google Scholar]
  31. De Pascalis, V.A.; Varriale, V.; Matteoli, A. Intelligence and P3 components of the event-related potential elicited during an auditory discrimination task with masking. Intelligence 2008, 36, 35–47. [Google Scholar]
  32. Troche, S.J.; Houlihan, M.E.; Stelmack, R.M.; Rammsayer, T.H. Mental ability, P300, and mismatch negativity: Analysis of frequency and duration discrimination. Intelligence 2009, 37, 365–373. [Google Scholar] [CrossRef]
  33. Teixeira-Santos, A.C.; Pinal, D.; Pereira, D.R.; Leite, J.; Carvalho, S.; Sampaio, A. Probing the relationship between late endogenous ERP components with fluid intelligence in healthy older adults. Scientific Reports 2020, 10, 11167. [Google Scholar]
  34. Polich, J. Updating P300: an integrative theory of P3a and P3b. Clinical neurophysiology 2007, 118, 2128–2148. [Google Scholar]
  35. Der, G.; Deary, I.J. The relationship between intelligence and reaction time varies with age: Results from three rep-resentative narrow-age age cohorts at 30, 50 and 69 years. Intelligence 2017, 64, 89–97. [Google Scholar] [PubMed]
  36. Kannen, K.; Aslan, B.; Boetzel, C.; Herrmann, C.S.; Lux, S.; et al. P300 modulation via transcranial alternating current stimulation in adult attention-deficit/hyperactivity disorder: a crossover study. Frontiers in Psychiatry 2022, 13, 928145. [Google Scholar] [PubMed]
  37. Jungeblut, H.M.; Hagemann, D.; Löffler, C.; Schubert, A.L. An investigation of the slope parameters of reaction times and P3 latencies in the Sternberg memory scanning task–A fixed-links model approach. Journal of Cognition 2021, 4. [Google Scholar]
  38. Schubert, A.L.; Löffler, C.; Hagemann, D.; Sadus, K. How robust is the relationship between neural processing speed and cognitive abilities? Psychophysiology 2023, 60, e14165. [Google Scholar]
  39. Schubert, A.L. A meta-analysis of the worst performance rule. Intelligence 2019, 73, 88–100. [Google Scholar]
  40. Regel, S.; Meyer, L.; Gunter, T.C. Distinguishing neurocognitive processes reflected by P600 effects: Evidence from ERPs and neural oscillations. PloS one 2014, 9, e96840. [Google Scholar]
  41. Beldzik, E.; Ullsperger, M. A thin line between conflict and reaction time effects on EEG and fMRI brain signals. Imaging Neuroscience 2024, 2, 1–17. [Google Scholar]
  42. Raven, J. (2003). Raven progressive matrices. In Handbook of nonverbal assessment (pp. 223–237). Boston, MA: Springer US.
  43. Jasper, H.H. Ten-twenty electrode system of the international federation. Electroencephalogr Clin Neurophysiol 1958, 10, 371–375. [Google Scholar]
  44. Sadus, K.; Schubert, A.L.; Löffler, C.; Hagemann, D. An explorative multiverse study for extracting differences in P3 latencies between young and old adults. Psychophysiology 2024, 61, e14459. [Google Scholar]
  45. Picton, T.W.; Bentin, S.; Berg, P.; Donchin, E.; Hillyard, S.A.; Johnson, R.; et al. , Guidelines for using human event-related potentials to study cognition: recording standards and publication criteria. Psychophysiology 2000, 37, 127–152. [Google Scholar]
  46. Zygouris, N.C.; Avramidis, E.; Karapetsas, A.V.; Stamoulis, G.I. Differences in dyslexic students before and after a remediation program: A clinical neuropsychological and event related potential study. Applied Neuropsychology: Child 2018, 7, 235–244. [Google Scholar] [CrossRef] [PubMed]
  47. Zygouris, N.C.; Vlachos, F.; Stamoulis, G.I. ERPs in Children and Adolescents with Generalized Anxiety Disorder: Before and after an Intervention Program. Brain Sciences 2022, 12, 1174. [Google Scholar] [CrossRef] [PubMed]
  48. OpenAI. (2024). ChatGPT [Large Language Model]. Retrieved from https://openai.com.
  49. Cohen, J. Set correlation and contingency tables. Applied psychological measurement 1988, 12, 425–434. [Google Scholar] [CrossRef]
  50. Beauchamp, C.M.; Stelmack, R.M. The chronometry of mental ability: An event-related potential analysis of an auditory oddball discrimination task. Intelligence 2006, 34, 571–586. [Google Scholar] [CrossRef]
  51. Wongupparaj, P.; Sumich, A.; Wickens, M.; Kumari, V.; Morris, R.G. Individual differences in working memory and general intelligence indexed by P200 and P300: A latent variable model. Biological psychology 2018, 139, 96–105. [Google Scholar] [CrossRef]
  52. McGarry-Roberts, P.A.; Stelmack, R.M.; Campbell, K.B. Intelligence, reaction time, and event-related potentials. Intelligence 1992, 16, 289–313. [Google Scholar] [CrossRef]
  53. Sur, S.; Sinha, V.K. Event-related potential: An overview. Industrial psychiatry journal 2009, 18, 70–73. [Google Scholar] [CrossRef]
  54. Gmaj, B.; Januszko, P.; Kamiński, J.; Drozdowicz, E.; Kopera, M.; Wołyńczyk-Gmaj, D.; Wojnar, M. EEG source activity during processing of neutral stimuli in subjects with anxiety disorders. Acta Neurobiologiae Experimentalis 2016, 76, 75–85. [Google Scholar] [CrossRef]
  55. Doebler, P.; Scheffler, B. The relationship of choice reaction time variability and intelligence: A meta-analysis. Learning and Individual Differences 2016, 52, 157–166. [Google Scholar] [CrossRef]
  56. Tsai, Y.C.; Lu, H.J.; Chang, C.F.; Liang, W.K.; Muggleton, N.G.; Juan, C.H. Electrophysiological and behavioral evidence reveals the effects of trait anxiety on contingent attentional capture. Cognitive, Affective, & Behavioral Neuroscience 2017, 17, 973–983. [Google Scholar]
  57. Jensen, A.R. (1998). The factor. Westport, CT: Prager.
  58. Sanz, M.; Molina, V.; Martin-Loeches, M.; Calcedo, A.; Rubia, F.J. Auditory P300 event related potential and sero-tonin reuptake inhibitor treatment in obsessive-compulsive disorder patients. Psychiatry research 2001, 101, 75–81. [Google Scholar] [CrossRef] [PubMed]
  59. Deary, I.J.; Cox, S.R.; Okely, J.A. Inspection time and intelligence: A five-wave longitudinal study from age 70 to age 82 in the Lothian Birth Cohort 1936. Intelligence 2024, 105, 101844. [Google Scholar] [CrossRef]
  60. Coles, M.G. H.; Smid, H.G. O. M.; Scheffers, M.K.; Otten, L.J. (1995). Mental Chronometry and the study of human in-formation processing. In Electrophysiology of Mind. (pp. 86–127). Oxford University Press.
  61. Shaw, P.; Greenstein, D.; Lerch, J.; Clasen, L.; Lenroot, R.; et al. Intellectual ability and cortical development in children and adolescents. Nature 2006, 440, 676–679. [Google Scholar] [CrossRef]
  62. Kutas, M.; Federmeier, K.D. Thirty years and counting: finding meaning in the N400 component of the event-related brain potential (ERP). Annual review of psychology 2011, 62, 621–647. [Google Scholar] [CrossRef]
  63. Wronka, E.; Kaiser, J.; Coenen, A.M. Psychometric intelligence and P3 of the event-related potentials studied with a 3-stimulus auditory oddball task. Neuroscience Letters 2013, 535, 110–115. [Google Scholar] [CrossRef]
  64. Luck, S.J. (2014). An introduction to the event-related potential technique. MIT press.
  65. Zygouris, N.C.; Dermitzaki, I.; Karapetsas, A.V. Differences in brain activity of children with higher mental abilities. An Event Related Potentials study using the latency of P300 and N100 waveforms. International Journal of Developmental Neuroscience 2015, 118–119. [Google Scholar] [CrossRef]
  66. Gagné, F. (2005). From gifts to talents: The DMGT as a devalopmental model. U: RJ Sternberg & JE Davidson (Eds.), Concep-tions of giftedness (str. 98-120).
  67. Greer, K. Neural Assemblies as Precursors for Brain Function. NeuroSci 2022, 3, 645–655. [Google Scholar] [CrossRef]
  68. Liu, X.; Yang, S.; Liu, Z. Predicting Fluid Intelligence via Naturalistic Functional Connectivity Using Weighted En-semble Model and Network Analysis. NeuroSci 2021, 2, 427–442. [Google Scholar] [CrossRef]
  69. Merks, S. (2016). Elucidating different aspects of speed of information processing: comparison of behavioral response latency and P300 latency in a modified Hick reaction time task (Doctoral dissertation, Universität Bern).
Figure 1. Comparison of P300 latency of children with high and average mental abilities.
Preprints 151950 g001
Table 2. Descriptive Statistics, T-test Results, and Effect Sizes for P300 Latencies Between Children with High and Average Mental Abilities.
Electro/Encephalographic Sites P300 Latency ofChildren with high mental abilities SD P300 Latency ofChildren with average mental abilities SD t p Cohen's d
Fp1 304.48 6.21 316.58 3.46 -5.89 <0.001 2.41
FPz 305.44 7.64 318.41 4.63 -5.89 <0.001 2.05
Fp2 307.55 6.33 320.53 5.92 -5.03 <0.001 2.12
F3 307.00 7.14 326.65 7.56 -5.03 <0.001 2.67
Fz 307.87 6.05 325.53 2.21 -5.18 <0.001 3.88
F4 313.15 10.31 336.38 1.99 -5.18 <0.001 3.13
T3 306.28 10.03 329.00 4.82 -6.54 <0.001 2.89
T4 308.32 11.85 325.85 2.45 -6.54 <0.001 2.05
C3 306.78 13.10 330.45 6.37 -9.49 <0.001 2.30
Cz 311.69 15.84 337.53 3.22 -9.49 <0.001 2.26
C4 317.77 9.41 338.19 2.89 -7.66 <0.001 2.93
P3 309.51 10.04 329.96 5.21 -7.66 <0.001 2.56
Pz 311.98 14.98 336.37 5.45 -7.07 <0.001 2.16
P4 313.39 17.56 339.68 3.67 -7.07 <0.001 2.07
Oz 316.91 10.38 337.87 5.71 -5.01 <0.001 2.50
Table 3. Summary of 15 EEG Site Analysis Using the Benjamini-Hochberg test.
Electro/Encephalographic Sites P-Value BH Critical Value
Fp1 <0.05 0.02
FPz <0.05 0.01
Fp2 <0.05 0.03
F3 <0.05 0.01
Fz <0.05 0.01
F4 <0.05 0.01
T3 <0.05 0.01
T4 <0.05 0.05
C3 <0.05 0.03
Cz <0.05 0.04
C4 <0.05 0.01
P3 <0.05 0.02
Pz <0.05 0.04
P4 <0.05 0.04
Oz <0.05 0.02
Table 4. Mean scores, standard deviations, t-test results, significance and Cohen’s d of reaction time for children that participated in each group of mental abilities.
Reaction Time High Mental Abilities Average Mental Abilities
M SD M SD t p Cohen’s d
319.70 6.54 352.30 11.76 -8.39 <0.001 3.43
Table 5. Correlation analysis between P300 latency and RSPM scores.
Electro/encephalographic sites Correlation ρ Sign
FP1 -0.844 0.001
FPZ -0.804 0.001
FP2 -0.742 0.001
F3 -0.862 0.001
FZ -0.889 0.001
F4 -0.813 0.001
T3 -0.818 0.001
T4 -0.893 0.001
C3 -0.844 0.001
CZ -0.865 0.001
C4 -0.770 0.001
P3 -0.853 0.001
PZ -0.803 0.001
P4 -0.790 0.001
OZ -0.781 0.001
Disclaimer/Publisher’s Note: The statements, opinions and data contained in all publications are solely those of the individual author(s) and contributor(s) and not of MDPI and/or the editor(s). MDPI and/or the editor(s) disclaim responsibility for any injury to people or property resulting from any ideas, methods, instructions or products referred to in the content.
Copyright: This open access article is published under a Creative Commons CC BY 4.0 license, which permit the free download, distribution, and reuse, provided that the author and preprint are cited in any reuse.
Prerpints.org logo

Preprints.org is a free preprint server supported by MDPI in Basel, Switzerland.

Subscribe

Disclaimer

Terms of Use

Privacy Policy

Privacy Settings

© 2025 MDPI (Basel, Switzerland) unless otherwise stated