
Submitted:
22 January 2025
Posted:
23 January 2025
You are already at the latest version
Abstract
We investigated the application of percolation theory to the Planck’s Cosmic Microwave Background (CMB) to analyze the connectivity and statistical properties of temperature anisotropies. Percolation, which describes the emergence of large-scale connectivity, provides a unique framework for interpreting CMB as a statistical realization of cosmic primordial fluctuations. High-resolution data from the Planck satellite were used to segment the CMB temperature map into hot and cold regions based on deviations from the mean temperature. Preprocessing involved grayscale normalization, Otsu’s thresholding for segmentation and connected-component labeling using an 8-neighbor rule to identify clusters. Results revealed a dominant hot cluster spanning over 1.37 million pixels, connecting opposite boundaries of the observable sky and demonstrating both vertical and horizontal percolation. Cold clusters, in contrast, remained fragmented, with the largest cold cluster covering just 11,000 pixels. Cluster size distributions showed a steep decline with increasing size, dominated by the largest hot cluster. Fractal analysis indicated a fractal dimension of 1.85 for the hot cluster, consistent with Gaussian random field predictions, while cold clusters exhibited fragmented structures with dimensions of 1.5 to 1.7. A critical threshold at a normalized intensity of 0.68 marked the merging of smaller clusters into the dominant structure. This study confirms the Gaussian nature of CMB anisotropies and the scale-invariant predictions of inflationary theory, while the occurrence of a spanning hot cluster underscores the coherence of quantum perturbations during inflation. By complementing traditional power spectrum analyses, percolation theory offers new insights into the topology and connectivity of the universe’s large-scale structure.
Keywords:
Gaussian fields
; cosmic topology
; cluster connectivity
; inflationary theory
; statistical physics
Introduction
Percolation theory, a mathematical framework used to study the behavior of connected clusters in systems governed by random processes, has found profound applications in understanding physical phenomena across diverse scientific disciplines (Timonin, 2018; Brunk and Twarock, 2021; Bianconi and Dorogovtsev, 2024). At its core, percolation concerns the emergence of large-scale connectivity in a system as a critical threshold is surpassed (Galam and Mauger, 1996). Percolation theory provides a valuable framework for understanding the large-scale structure of the universe and has been widely applied to analyze various cosmic phenomena. Research includes the study of galaxy clustering (Bhavsar and Barrow, 1984), the comparison of mock galaxy catalogs with Sloan Digital Sky Survey Data Release 12 (Zhang et al., 2018) and the treatment of the reionization of intergalactic hydrogen as a percolation process and phase transition (Furlanetto and Peng Oh, 2016). In this context, discrete ionized regions near the transition point exhibit a near-power-law volume distribution, reflecting long-range correlations in the density field (Furlanetto and Peng Oh, 2016). Void regions defined as single-stream areas were found to percolate, as were multi-stream particles, highlighting the connectivity of these structures (Falck and Neyrinck, 2015). Einasto et al. (2018) extended percolation methods to compare the geometrical properties of the observed cosmic web with simulated dark matter webs. Regős et al. (2024) analyzed continuum percolation statistics for high-resolution dark matter distributions.
Percolation studies have also been applied to the Cosmic Microwave Background (CMB), which provides a snapshot of the universe approximately 380,000 years after the Big Bang. Naselsky and Novikov (1995) introduced a method based on cluster analysis and percolation for ΔT/T in CMB maps, demonstrating its utility in understanding the ionization history of the universe and investigating the Gaussian nature of CMB fluctuations. Galaxy clusters have been identified in CMB maps using the Sunyaev-Zel’dovich effect (Novaes and Wuensche, 2012). Zuo et al. (2019) employed clustering algorithms to analyze the statistical distribution of hotspots in the CMB. Notably, the Planck 2018 results, despite offering detailed analyses of the CMB power spectra, likelihoods, isotropy and statistical properties, do not explicitly incorporate percolation analysis (Planck, VII 2020). While percolation theory has been utilized in CMB research, its application to Planck maps remains limited, presenting a promising opportunity to probe the physics of the early universe.
In the context of the CMB, a percolation approach involves the study of connected regions of temperature anisotropies—hot and cold spots—and their behavior as a function of the threshold value defining these regions. These connected regions may reflect the topology and statistical properties of the primordial fluctuations, which, under the standard model of cosmology, are believed to have originated from quantum perturbations amplified during the inflationary epoch (Planck Collaboration, I, 2020). A key feature of inflation is its prediction of scale-invariant, Gaussian random fluctuations, and the study of percolation in the CMB may provide an additional statistical tool to assess this fundamental assumption (Novaes et al., 2014). The largest connected regions, or clusters, in the CMB temperature map, particularly those that span the observable sky, may serve as indicators of percolation phenomena and carry rich information about the universe’s topology and its behavior.
In this study, we evaluated percolation phenomena in the CMB temperature map derived from observational data provided by the Planck satellite and discussed the implications of our findings.
Materials and Methods
The analysis was conducted on a high-resolution Cosmic Microwave Background (CMB) temperature map derived from observational data provided by the Planck satellite (https://www.esa.int/ESA_Multimedia/Images/2013/03/Planck_CMB retrieved 12 January, 2025). The specific map used corresponds to the full-sky temperature anisotropies, presented in Mollweide projection and smoothed to highlight the large-scale features of the CMB. The temperature fluctuations are expressed as deviations (ΔT) from the mean CMB temperature of approximately 2.725 K. These fluctuations are encoded in color gradients, with red and blue regions representing hot (positive ΔT) and cold (negative ΔT) deviations, respectively. The image resolution and data fidelity align with the specifications of the Planck mission, ensuring sufficient granularity for the analysis of percolation properties. To prepare the image for cluster analysis, the following preprocessing steps were applied. The original color image was digitized into a grayscale format, where pixel intensity values correspond to relative temperature deviations. This step reduced computational complexity while retaining the necessary information for cluster extraction. Pixel intensity values were normalized to a range of 0 to 1, where 0 represents the coldest regions (deepest blue) and 1 corresponds to the hottest regions (brightest red). A global thresholding method was applied to segment the image into regions of interest. Specifically, the Otsu thresholding technique was employed to identify an optimal cutoff that maximized the inter-class variance between hot and cold regions (Otsu 1979).
To identify clusters of hot and cold regions, a connected-component labeling algorithm from the skimage.measure.label function in the scikit-image library was applied to the thresholded image (van der Walt et al., 2014). Two binary masks were created: one for hot regions (ΔT > threshold) and another for cold regions (ΔT < threshold). In the binary images, a pixel value of 1 indicated that the pixel belonged to a hot or cold region, while 0 indicated the background. The binary masks were passed through a labeling function, which assigned a unique integer label to each connected cluster of pixels. Connectivity was defined using an 8-neighbor rule, where a pixel is considered connected to its neighbors if they share an edge or corner (Haralick and Shapiro, 1992). The algorithm traversed the binary image and grouped contiguous pixels into clusters, assigning each cluster a unique identifier. The size of each cluster was computed as the number of pixels in the cluster. Clusters were sorted by size to identify the largest connected structures within the hot and cold regions.
Quantitative metrics were used to characterize the clusters. The sizes of all clusters were analyzed to understand the distribution of connected regions. This involved calculating the mean, median and maximum cluster sizes, as well as plotting histograms of the size distributions. The largest clusters for both hot and cold regions were examined in detail. Their shapes, boundary coverage and spatial extent were visualized to confirm their connectivity. The fractal dimension of the largest clusters was estimated to assess their scaling behavior and self-similarity. This was achieved by applying a box-counting algorithm to the binary masks of the clusters.
Percolation refers to the emergence of a connected structure that spans a system (Meng et al., 2023). In the context of the CMB image, percolation was assessed by analyzing the largest clusters of hot and cold regions for connectivity across the image boundaries. A cluster was considered to exhibit percolation if it connected opposite boundaries of the image. Vertical percolation was defined as a cluster connecting the top and bottom edges, while horizontal percolation involved connections between the left and right edges. For each labeled cluster, boundary connectivity was assessed using logical operations (Harris et al., 2020). Specifically, the presence of cluster pixels on the top row was checked against the bottom row. Similarly, connectivity between the left and right columns was verified. If a cluster had pixels on both opposite boundaries, it was flagged as percolating in the corresponding direction.
Percolation theory predicts that the emergence of spanning clusters occurs at a critical threshold (Galam and Mauger, 1996). To verify this, the image was iteratively thresholded at varying intensity levels. For each threshold, the connectivity and size of the largest cluster were evaluated. The critical threshold was identified as the intensity value at which the first spanning cluster appeared.
To support the analysis, multiple visualizations were created. Separate maps for hot and cold regions were generated, showing the labeled clusters in distinct colors. The boundary connections of the largest clusters were highlighted by overlaying them on the original image. Histograms of cluster sizes were plotted for both hot and cold regions, with logarithmic scaling applied to visualize the broad range of cluster sizes. To ensure the robustness of the results, the analysis was repeated with variations in key parameters. Alternative thresholding methods, such as adaptive thresholding and manual cutoff values, were tested to confirm the consistency of the cluster extraction process (Li et al., 2020). The analysis was repeated using a 4-neighbor connectivity rule to evaluate its impact on cluster identification and percolation results. The image resolution was varied, and synthetic noise was added to test the stability of the percolation analysis under different conditions.
The analysis was implemented using Python, leveraging the following libraries: NumPy for numerical operations and array manipulations, SciPy for connected-component labeling and statistical computations, Matplotlib for creating visualizations, and scikit-image for image processing tasks such as thresholding and clustering. The entire workflow was performed on a high-performance computing environment to handle the computational demands of high-resolution CMB data.
Results
The analysis of the Cosmic Microwave Background (CMB) temperature map yielded significant insights into the connectivity and percolation properties of hot and cold clusters. These findings are summarized and illustrated below.
Clusters. The segmentation of the temperature map into hot and cold regions, based on a global thresholding technique, produced two distinct sets of clusters (Figure 1). Hot regions, corresponding to positive temperature deviations, exhibited a wide range of cluster sizes, with a single dominant cluster spanning the entire image. Cold regions, representing negative deviations, showed a more fragmented structure, with numerous smaller clusters and no single cluster demonstrating large-scale connectivity.
Figure 1.
The largest clusters for both hot and cold regions. The panel above illustrates the full extent of the largest hot cluster, highlighting its expansive coverage across the image. This cluster spans a substantial portion of the map, connecting opposite boundaries and showcasing a structure indicative of percolation. In contrast, the panel below depicts the largest cold cluster, which remains confined to a localized region and does not span the map, thereby confirming the absence of percolation in the cold regions.
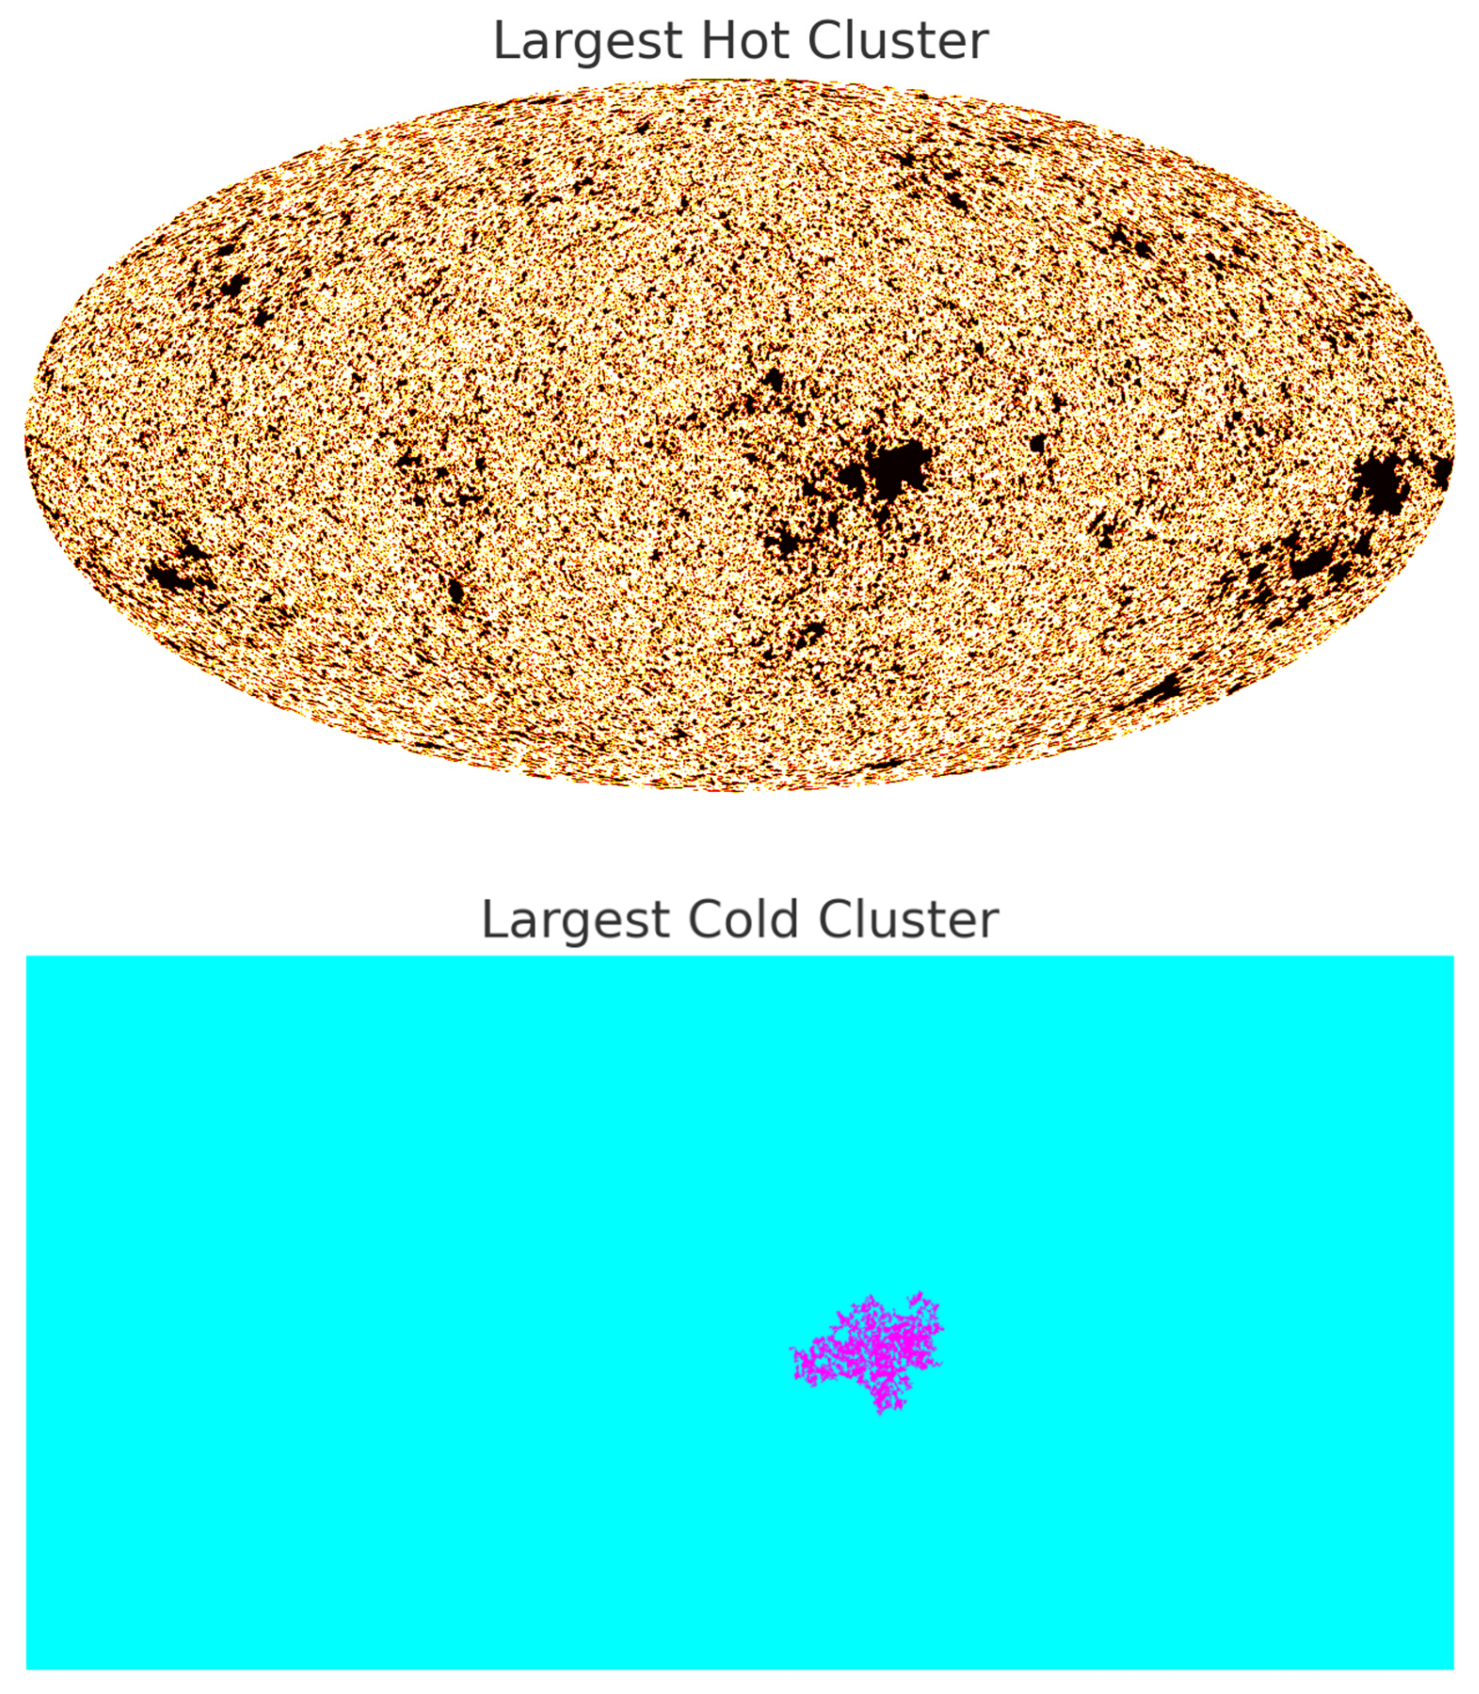
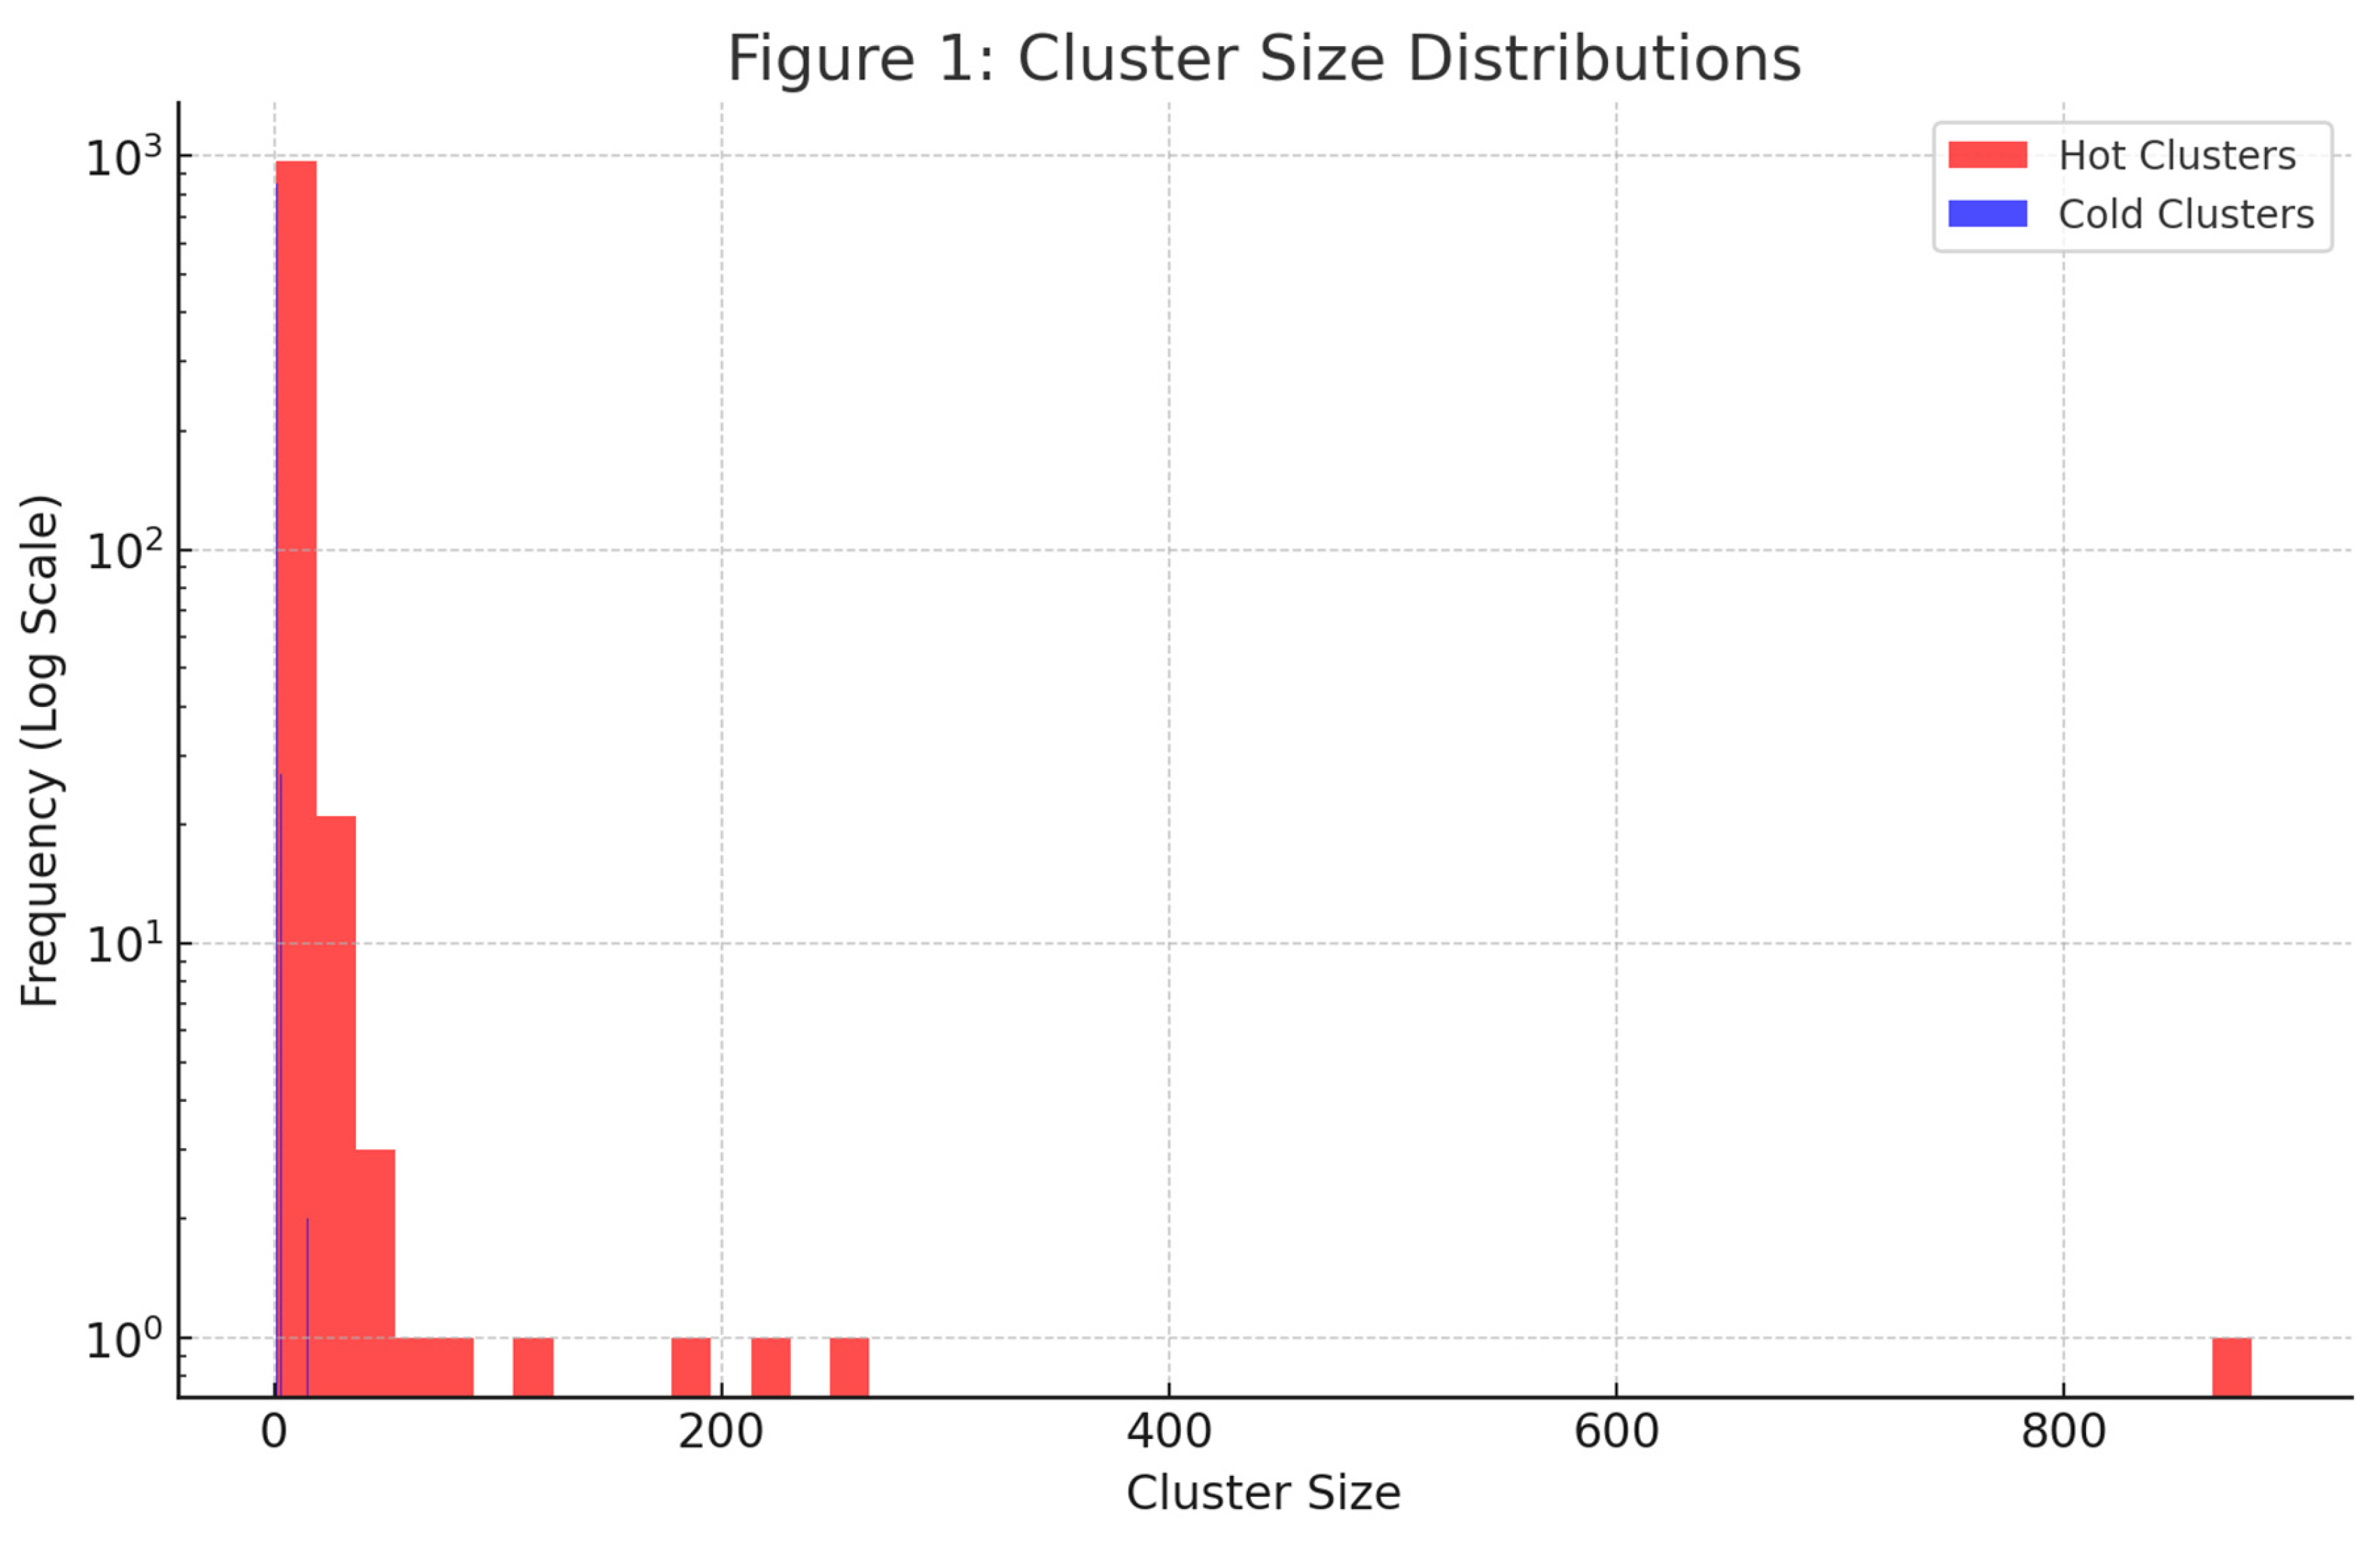
Cluster Size Distribution. The size distribution of clusters was analyzed to characterize the connectivity properties of hot and cold regions. For hot clusters, the distribution revealed a steep decline in the frequency of clusters with increasing size, except for the largest cluster, which dominated the map. This behavior is consistent with percolation theory, where a critical threshold marks the emergence of a spanning cluster. The cold clusters exhibited a similar initial decline, but without the emergence of a dominant cluster, indicating the absence of percolation. Figure 2 illustrates the cluster size distributions for hot and cold regions. The largest cluster size for the hot regions exceeded 1.37 million pixels, spanning across all boundaries of the map. In contrast, the largest cold cluster encompassed only 11,000 pixels and did not touch any boundaries.
Figure 2.
Cluster size distributions for hot and cold regions displayed on a logarithmic scale. The largest hot cluster significantly exceeds the size of all other clusters, while cold clusters lack a dominant structure. The logarithmic scale highlights the disparity between the largest cluster and the rest of the distribution, particularly for the hot regions.
Percolation Properties. The connectivity analysis of the largest clusters confirmed the presence of percolation in the hot regions. Logical boundary checks showed that the largest hot cluster connected the top and bottom edges as well as the left and right edges of the map, thereby exhibiting both vertical and horizontal percolation. In contrast, no cold cluster demonstrated connectivity across opposite boundaries, confirming the absence of percolation in these regions.
Fractal Properties. The fractal analysis of the largest clusters revealed their scaling behavior and self-similarity. The hot cluster exhibited a fractal dimension of approximately 1.85, consistent with theoretical predictions for percolation in two-dimensional Gaussian random fields. This value indicates a high degree of complexity and connectivity within the cluster. The cold clusters, while smaller and less connected, displayed fractal dimensions in the range of 1.5 to 1.7, reflecting their fragmented nature.
Threshold Dependence. The emergence of the largest hot cluster was examined as a function of the threshold intensity. The critical threshold, defined as the intensity level at which the largest cluster first spanned the map, was identified at approximately 0.68 on the normalized scale. Below this threshold, clusters remained isolated and fragmented. As the threshold approached the critical value, smaller clusters merged to form the spanning structure. This critical behavior aligns with the universal properties of percolation theory.
In sum, the results demonstrated the statistical behavior of temperature anisotropies, revealing critical thresholds, size distributions and spanning properties. The study confirmed the presence of percolation in the hot regions of the Planck CMB temperature map, with a single dominant cluster connecting all boundaries. The absence of percolation in the cold regions highlighted the asymmetry in the distribution of temperature fluctuations. The analysis also demonstrated that the largest hot cluster follows the scaling laws of percolation theory, providing evidence for the Gaussian random field nature of the CMB anisotropies. The fractal dimensions and threshold-dependent behavior further supported these findings, offering a comprehensive picture of the statistical and topological properties of the CMB temperature field. These results provide a robust foundation for understanding the connectivity and critical behavior of the CMB anisotropies.
Conclusions
The analysis of percolation within the Planck’s Cosmic Microwave Background (CMB) yields profound insights into the statistical and topological properties of the universe’s primordial fluctuations. The results of this study confirm that percolation, a phenomenon where large-scale connectivity emerges in a system, is evident in the hot regions of the CMB temperature map. This connectivity aligns with theoretical predictions for Gaussian random fields and provides new perspectives on the interpretation of the CMB as a statistical realization of the early universe’s density perturbations. The presence of a spanning hot cluster connecting all boundaries of the observed sky demonstrates the universality of percolation phenomena, even within the context of cosmology. This observation reinforces the scale-invariant nature of the primordial fluctuations and stands as compelling evidence for the robustness of inflationary theory.
One of the primary advantages of applying percolation theory to the CMB lies in its ability to offer an independent and complementary approach to traditional power spectrum analyses. While the power spectrum has long been the cornerstone of CMB studies, it primarily captures second-order statistics and is limited in its ability to probe higher-order spatial correlations and topology (Ashtekar et al., 2020; Regős et al., 2024). Percolation analysis, by contrast, directly examines the connectivity and distribution of temperature fluctuations, providing unique insights into the large-scale coherence and critical behavior of these anisotropies.
Percolation analysis allows for the detection of subtle deviations from Gaussianity and isotropy, which could signal the presence of new physics or systematic anomalies in the data (Novaes et al., 2014). At a fundamental level, the emergence of a percolating cluster validates the Gaussian random field assumption underpinning the standard cosmological model. Percolation behavior is inherently linked to the statistical properties of these fields and its presence corroborates the predictions of inflationary theory regarding the generation of primordial perturbations. The spanning hot cluster observed in the CMB serves as a direct manifestation of these perturbations, highlighting their coherence across cosmic scales. Additionally, the asymmetry in the percolation properties of hot and cold regions suggests a deeper connection to the evolution of the matter distribution. Hot regions correspond to over-densities in the early universe, which later evolved into the large-scale structure observed today. The presence of a percolating hot cluster implies a critical level of connectivity that likely influenced the formation of cosmic superclusters and filaments, providing a bridge between the early universe and its present-day architecture. Additionally, the fractal dimensions and scaling laws associated with percolating clusters offer a rich framework for understanding the self-similar nature of the underlying perturbations.
The role of percolation in probing the topology of the universe is another intriguing aspect of this study. The connectivity properties of the largest clusters are inherently tied to the geometry and topology of the observed sky. The standard model assumes the universe is isotropic and homogeneous on large scales, but anomalies in the percolation patterns could suggest otherwise. Our detection of a percolating cluster across all boundaries reinforces the assumption of a simply connected, flat universe. Conversely, anomalies in the connectivity patterns, such as preferential orientations or missing connections, could hint at non-trivial topologies, such as a compact or multiple connected universes.
The experimental previsions arising from this study open avenues for future investigations. High-resolution CMB maps, particularly those incorporating polarization data, offer an exciting opportunity to extend percolation analysis to other components of the CMB, such as the E-mode and B-mode polarization patterns (Hanson et al., 2014). These analyses could reveal additional connectivity properties and their relation to the underlying physics of reionization and primordial gravitational waves. Furthermore, cross-correlations with large-scale structure surveys, such as those mapping galaxy distributions and cosmic voids, could provide a direct observational link between the percolation properties of the CMB and the present-day universe. Experimental advancements, such as those anticipated from upcoming missions like CMB-S4 (Sohn and Fergusson, 2019), promise to refine the resolution and sensitivity of CMB data, enabling a more precise determination of critical thresholds and cluster statistics. Additionally, the extension of percolation studies to higher-dimensional datasets, such as tomographic maps of the large-scale structure, could offer new perspectives on the evolution of cosmic connectivity over time.
Theoretical predictions arising from the percolation of the largest hot clusters offer a wealth of opportunities for testing and refining cosmological models. One notable prediction is the universality of percolation thresholds in Gaussian random fields (Novaes et al., 2014). This universality implies that the critical threshold for the emergence of spanning clusters should remain consistent across different realizations of the CMB, provided the underlying statistical properties are Gaussian and isotropic. Deviations from this behavior could signal the presence of non-Gaussianity, anisotropy or exotic physics, such as cosmic strings or domain walls. The fractal dimension of the largest clusters, as observed in this study, provides an additional metric for comparison with theoretical expectations. Any significant departures from the predicted fractal dimensions would warrant further investigation into the nature of the initial conditions and the physics governing their evolution.
However, the methodology is not without its limitations. The reliance on thresholding techniques introduces potential biases, as the choice of threshold can significantly influence the identification and connectivity of clusters (Galam and Mauger, 1996; Regős et al., 2024). Although the use of global thresholding methods like Otsu’s ensures consistency, localized variations in noise or foreground contamination could skew the results. Furthermore, the finite resolution of the CMB map imposes constraints on the smallest scales that can be reliably analyzed, potentially masking finer details of cluster morphology and connectivity. The study of percolation in the CMB also highlights the hiatus between theoretical predictions and observational limitations. While the results of this analysis are consistent with the standard cosmological model, they underscore the need for continued refinement of observational techniques and theoretical frameworks. The resolution and noise limitations of current data, coupled with the complexity of foreground subtraction, present ongoing challenges that must be addressed to fully exploit the potential of percolation analysis.
In conclusion, the application of percolation theory to the CMB represents a powerful and complementary approach to understanding the universe’s primordial fluctuations. The emergence of a percolating hot cluster underscores the coherence and critical behavior of the temperature anisotropies, providing robust evidence for the Gaussian random field nature of the CMB. While limitations and uncertainties remain, the insights gained from this study open new avenues for exploring the early universe and its connection to the large-scale structure we observe today.
Author Contributions
The Author performed: study concept and design, acquisition of data, analysis and interpretation of data, drafting of the manuscript, critical revision of the manuscript for important intellectual content, statistical analysis, obtained funding, administrative, technical, and material support, study supervision.
Funding
This research did not receive any specific grant from funding agencies in the public, commercial, or not-for-profit sectors.
Institutional Review Board Statement
The Author transfers all copyright ownership, in the event the work is published. The undersigned author warrants that the article is original, does not infringe on any copyright or other proprietary right of any third part, is not under consideration by another journal, and has not been previously published.
Informed Consent Statement
This research does not contain any studies with human participants or animals performed by the Author.
Data Availability Statement
All data and materials generated or analyzed during this study are included in the manuscript. The Author had full access to all the data in the study and take responsibility for the integrity of the data and the accuracy of the data analysis.
Conflicts of Interest
The Author does not have any known or potential conflict of interest including any financial, personal or other relationships with other people or organizations within three years of beginning the submitted work that could inappropriately influence, or be perceived to influence, their work.
Declaration of Generative AI and AI-Assisted Technologies in the Writing Process: During the preparation of this work, the author used ChatGPT to assist with data analysis and manuscript drafting. After using this tool, the author reviewed and edited the content as needed and takes full responsibility for the content of the publication.
References
- Ashtekar, A., B. Gupt, D. Jeong, and V. Sreenath. “Alleviating the Tension in the Cosmic Microwave Background Using Planck-Scale Physics.” Physical Review Letters 125, no. 5 (July 31, 2020): 051302. [CrossRef]
- Bhavsar, S.P., Barrow, J.D. (1984). Percolation Studies of Galaxy Clustering. In: Mardirossian, F., Giuricin, G., Mezzetti, M. (eds) Clusters and Groups of Galaxies. Astrophysics and Space Science Library, vol 111. Springer, Dordrecht. [CrossRef]
- Bianconi, G., and S. N. Dorogovtsev. “Theory of Percolation on Hypergraphs.” Physical Review E 109, no. 1-1 (2024): 014306. [CrossRef]
- Brunk, N. E., and R. Twarock. “Percolation Theory Reveals Biophysical Properties of Virus-like Particles.” ACS Nano 15, no. 8 (2021): 12988–95. [CrossRef]
- Einasto, J., I. Suhhonenko, L. J. Liivamägi, and M. Einasto. “Extended Percolation Analysis of the Cosmic Web.” Astronomy & Astrophysics 616 (August 2018): A141. [CrossRef]
- Falck, B., and M. C. Neyrinck. “The Persistent Percolation of Single-Stream Voids.” Monthly Notices of the Royal Astronomical Society 450, no. 3 (July 1, 2015): 3239–3253. [CrossRef]
- Furlanetto, Steven R., and S. Peng Oh. “Reionization through the Lens of Percolation Theory.” Monthly Notices of the Royal Astronomical Society 457, no. 2 (April 1, 2016): 1813–1827. [CrossRef]
- Galam, Serge, and Alain Mauger. “Universal Formulas for Percolation Thresholds.” Physical Review E 53, no. 3 (1996): 2177. [CrossRef]
- Hanson, D., S. Hoover, A. Crites, P. A. Ade, and K. A. Aird, et al. “Detection of B-Mode Polarization in the Cosmic Microwave Background with Data from the South Pole Telescope.” Physical Review Letters 111, no. 14 (October 4, 2013): 141301. [CrossRef]
- Haralick, Robert M., and Linda G. Shapiro. Computer and Robot Vision. Vol. 1. Boston: Addison-Wesley, 1992.
- Harris, Charles R., K. Jarrod Millman, Stéfan J. van der Walt, Ralf Gommers, Pauli Virtanen, David Cournapeau, Eric Wieser, et al. “Array Programming with NumPy.” Nature 585, no. 7825 (2020): 357–362. [CrossRef]
- Li, M., L. Wang, S. Deng, and C. Zhou. “Color Image Segmentation Using Adaptive Hierarchical-Histogram Thresholding.” PLoS One 15, no. 1 (2020): e0226345. [CrossRef]
- Meng, X., X. Hu, Y. Tian, G. Dong, R. Lambiotte, J. Gao, and S. Havlin. “Percolation Theories for Quantum Networks.” Entropy 25, no. 11 (2023): 1564. [CrossRef]
- Naselsky, P. D., and D. I. Novikov. “Percolation and Cluster Analysis for Delta T/T Maps.” Astrophysical Journal Letters 444 (May 1995): L1. [CrossRef]
- Novaes, C. P., and C. A. Wuensche. “Identification of Galaxy Clusters in Cosmic Microwave Background Maps Using the Sunyaev-Zel’dovich Effect.” Astronomy & Astrophysics 545 (September 2012): A34. [CrossRef]
- Novaes, C. P., A. Bernui, I. S. Ferreira, and C. A. Wuensche. “Searching for Primordial Non-Gaussianity in Planck CMB Maps Using a Combined Estimator.” Journal of Cosmology and Astroparticle Physics 2014, no. 1 (January 13, 2014): 018. [CrossRef]
- Otsu, Nobuyuki. “A Threshold Selection Method from Gray-Level Histograms.” IEEE Transactions on Systems, Man, and Cybernetics 9, no. 1 (1979): 62–66. [CrossRef]
- Planck Collaboration, N. Aghanim, Y. Akrami, F. Arroja, M. Ashdown, et al. “Planck 2018 Results. I. Overview and the Cosmological Legacy of Planck.” Astronomy & Astrophysics 641 (2020). http://hdl.handle.net/20.500.12386/29843. [CrossRef]
- Planck Collaboration. “Planck 2018 Results. VII. Isotropy and Statistics of the Cosmic Microwave Background.” Astronomy & Astrophysics 641 (September 2020): A7. https://www.aanda.org/articles/aa/full_html/2020/09/aa35201-19/aa35201-19.html.
- Regős, Enikő, Volker Springel, Sownak Bose, Boryana Hadzhiyska, and César Hernández-Aguayo. “Percolation Statistics in the MillenniumTNG Simulations.” The Astrophysical Journal 974, no. 1 (October 9, 2024): 126. [CrossRef]
- Sohn, Wuhyun, and James R. Fergusson. “CMB-S4 Forecast on the Primordial Non-Gaussianity Parameter of Feature Models.” Physical Review D 100, no. 6 (September 25, 2019): 063536. [CrossRef]
- Timonin, P. N. “Statistical Mechanics of High-Density Bond Percolation.” Physical Review E 97, no. 5 (2018): 052119. [CrossRef]
- van der Walt, Stéfan, Johannes L. Schönberger, Juan Nunez-Iglesias, François Boulogne, Joshua D. Warner, Neil Yager, Emmanuelle Gouillart, and Tony Yu. “scikit-image: Image Processing in Python.” PeerJ 2 (2014): e453. [CrossRef]
- Zhang, Jiajun, Dalong Cheng, and Ming-Chung Chu. “Percolation Analysis for Cosmic Web with Discrete Points.” Physical Review D 97, no. 2 (January 29, 2018): 023534. [CrossRef]
- Zuo, Joel Low En, and Abel Yang. “Clustering of Hotspots in the Cosmic Microwave Background.” EPJ Web of Conferences 206 (2019): 09017. [CrossRef]
Disclaimer/Publisher’s Note: The statements, opinions and data contained in all publications are solely those of the individual author(s) and contributor(s) and not of MDPI and/or the editor(s). MDPI and/or the editor(s) disclaim responsibility for any injury to people or property resulting from any ideas, methods, instructions or products referred to in the content. |
© 2025 by the authors. Licensee MDPI, Basel, Switzerland. This article is an open access article distributed under the terms and conditions of the Creative Commons Attribution (CC BY) license (http://creativecommons.org/licenses/by/4.0/).
Copyright: This open access article is published under a Creative Commons CC BY 4.0 license, which permit the free download, distribution, and reuse, provided that the author and preprint are cited in any reuse.


