1. Introduction
Mussels represent an affordable and environmentally sustainable source of protein, with minimal greenhouse gas emissions [
1]. It is estimated that approximately 94% of global mussel production is currently derived from aquaculture, with raft culture representing one of the most efficient techniques, enabling consistent year-round production [
2]. However, the expansion of raft culture is constrained by spatial limitations [
3]. Concurrently, the accelerated growth of renewable energy sources has established offshore wind farms as a crucial element in the global drive towards a clean energy future. However, as offshore wind installations expand, they increasingly occupy limited coastal waters, which may result in potential conflicts with existing aquaculture activities. To address these spatial challenges, integrating wind energy infrastructure with raft aquaculture facilities represents a promising solution [
4]. By deploying aquaculture structures within the confines of a wind farm, the utilization of ocean space can be optimized. Meanwhile, turbine foundations can serve as dual-purpose anchoring points for aquaculture, potentially functioning as artificial reefs that support marine biodiversity [
5]. This integrated approach represents a compelling opportunity for economic synergy. Despite the existence of numerous conceptual designs for integrated systems of this nature, only a small number have progressed to the stage of commercial operation. The majority of countries remain at the pilot development stage [
6,
7,
8].
The combination of offshore wind farms with aquaculture systems has the potential to offer several benefits, including optimization of marine space usage and advancement of sustainable development. Specifically, integrating mussel raft culture with wind farms could facilitate efficient, year-round production by leveraging shared infrastructure. However, a notable gap exists in the literature regarding the effective layouts and structural interactions between mussel raft systems and offshore wind turbines. Despite the proposal by Buck et al. (2004) that combines bivalve raft culture with offshore wind turbines [
7], detailed research on the structural interactions between wind turbine foundations and aquaculture facilities remains scarce. The potential for wind turbine monopiles to be effectively utilized as anchor points for mussel raft structures has yet to be investigated, and the optimal structural arrangements for aquaculture within offshore wind farms have not been thoroughly explored.
The majority of current studies have concentrated on the integration of offshore wind farms with aquaculture cages, rather than raft systems. For example, Zhao et al. (2023) employed the OpenFOAM software to simulate the structural load interactions between the combined wind turbine and fish cage systems, with a particular focus on the effects of wave height and water depth on load amplitude [
9]. Similarly, Zheng et al. (2018) evaluated the dynamic response of an innovative floating offshore wind turbine integrated with a steel fish-farming cage (FOWT-SFFC) under diverse environmental conditions, confirming its exceptionally dynamic performance [
10]. Further investigation of the dynamic behaviour of wind-cage structures was conducted by Zhang et al. (2022) and Cao et al. (2022), who observed the damping effects of cage nets on platform dynamics [
11,
12]. Yi et al. (2024) demonstrated that the aquaculture cage serves to reduce the oscillation amplitude and acts as a damper in an integrated offshore wind-wave-aquaculture (WWA) system [
13]. These findings underscore the focus on fish cage systems and highlight the lack of equivalent research on raft culture within offshore wind farms.
In the past, studies have tended to focus hydrodynamic characteristics of wind turbines and raft aquaculture structures as separate entities. For example, research on floating offshore wind turbines has conducted a comprehensive analysis of their hydrodynamic performance under a range of environmental conditions. Zhong et al. (2023) analyzed the dynamics of a semi-submersible platform designed for a 15 MW wind turbine in the context of freak wave conditions, with a particular focus on the platform’s motion responses and mooring line tension [
14]. In a similar vein, Tang et al. (2020) employed computational fluid dynamics (CFD) to examine the nonlinear wave load impacts on a 10-MW-scale monopile offshore wind turbine, investigating the variations in wave pressure and horizontal forces under diverse sea conditions [
15]. Investigations into raft aquaculture structures have concentrated on the hydrodynamic behaviour of isolated structures. In a recent study, Wang et al. (2023) employed numerical simulations to investigate the hydrodynamic characteristics of an attenuator-type wave energy converter with varying raft shapes, with a particular focus on parameters such as wave period and structural design [
16]. Wang et al. (2022) proposed that the scale and spatial layout of the floating raft aquaculture structures should be considered when assessing the impact of aquaculture activities on the hydrodynamic environment [
17]. The aforementioned studies provide valuable insights into the hydrodynamic characteristics of monopile foundations or raft facilities, addressing various factors such as wave loads, structural integration, and dynamic responses under different environmental conditions. However, there is a notable absence of studies on the hydrodynamic characteristics of raft aquaculture facilities within offshore wind farms, which highlights the necessity for further research in this area.
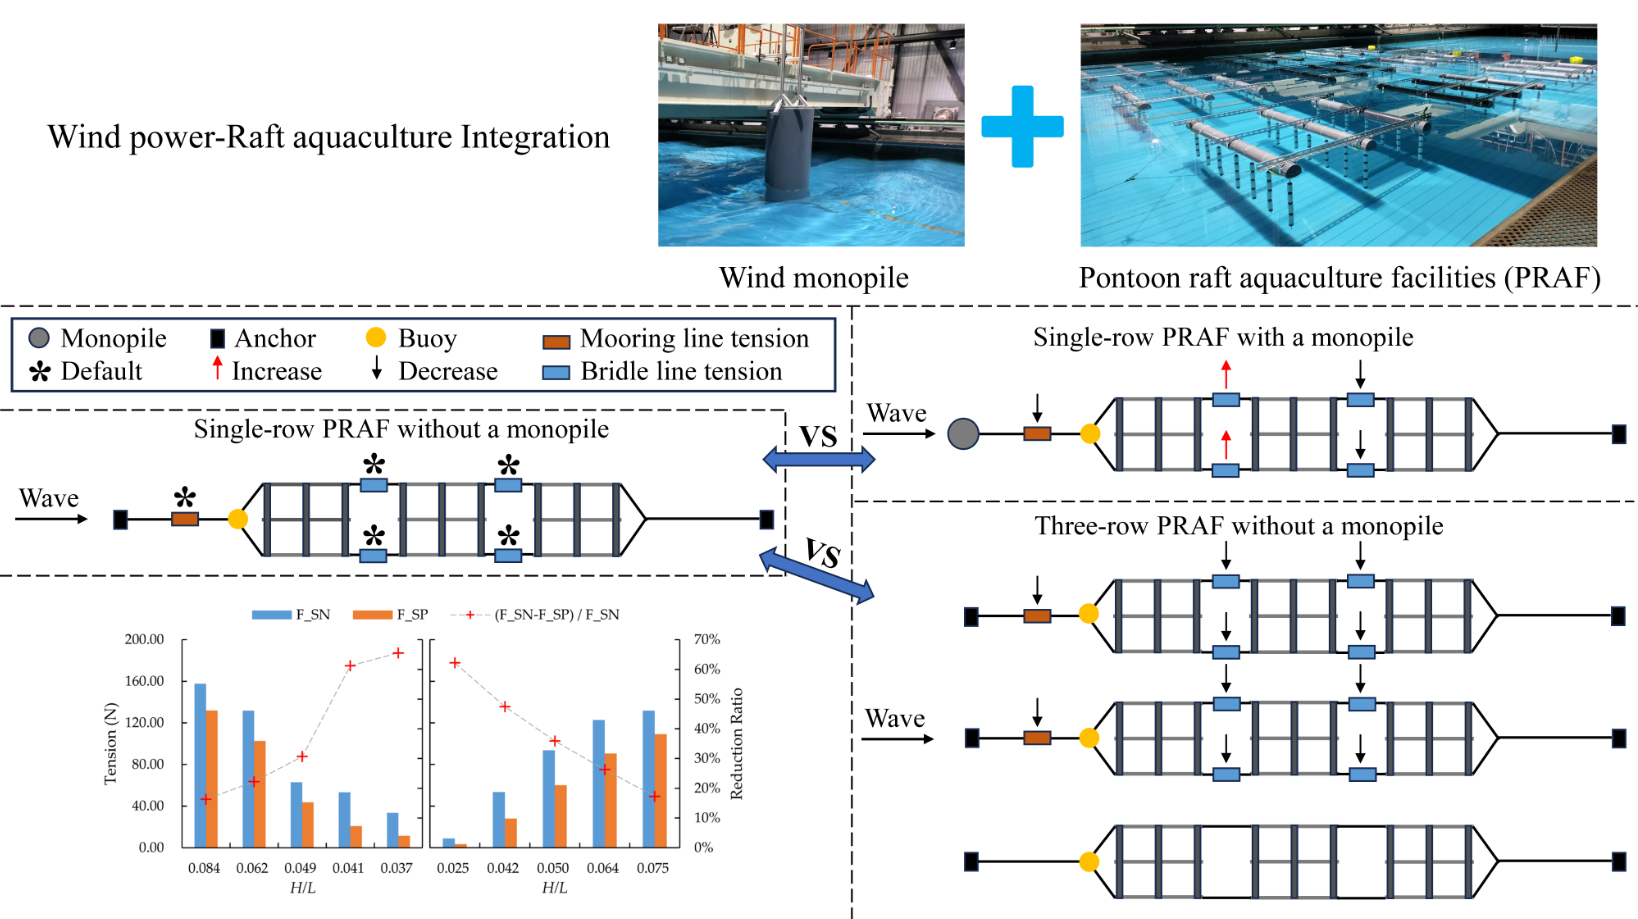
In the present study, the hydrodynamic response of pontoon raft aquaculture facilities (PRAF) around a wind monopile has been investigated. Our previous paper (Ai et al., 2024) considered the mooring line tension [
18]. In this paper, the focus includes the mooring line tension and bridle line tension, with the relationship between them. Moreover, the hydrodynamic performance of the single-row arrangement PRAF and multi-row arrangement PRAF are compared. The effects of the wind monopile on wave propagation are assessed through numerical simulations, which also serve to clarify the interaction mechanisms between the monopile and PRAF. Experimental results can also be used to illustrate the potential for using wind monopile foundations as anchored points for PRAF. The findings can provide valuable insights for the design and optimization of integrated wind-aquaculture areas.
2. Physical Experiment Methods
2.1. Study Area
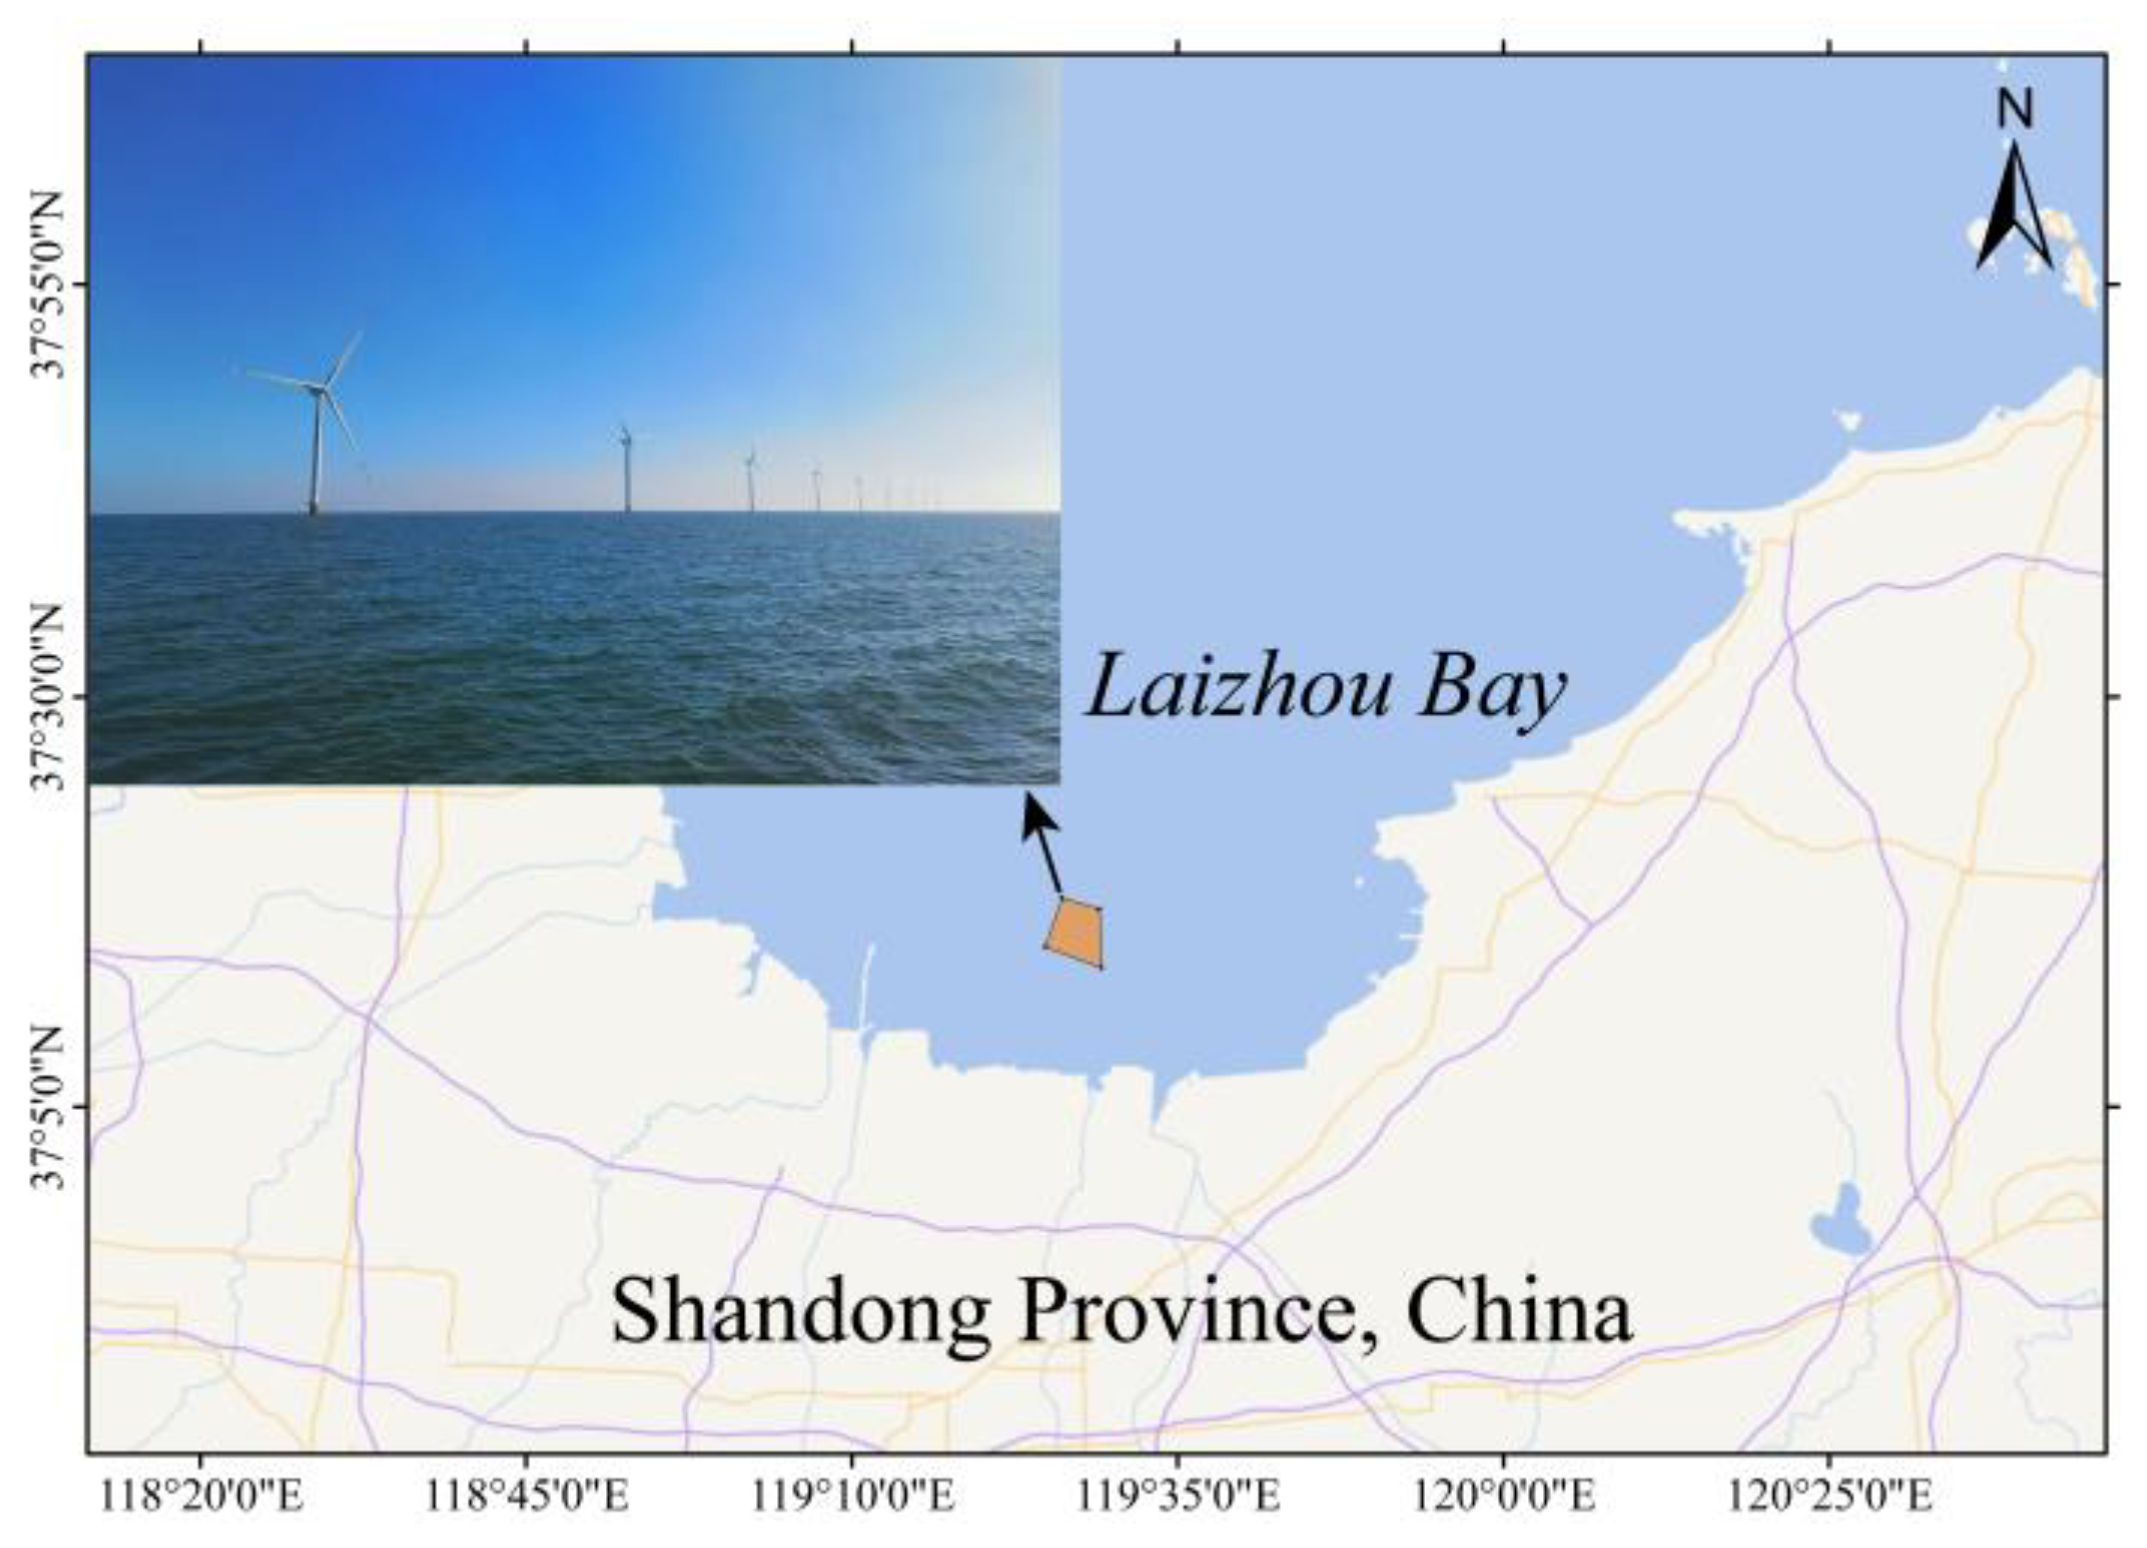
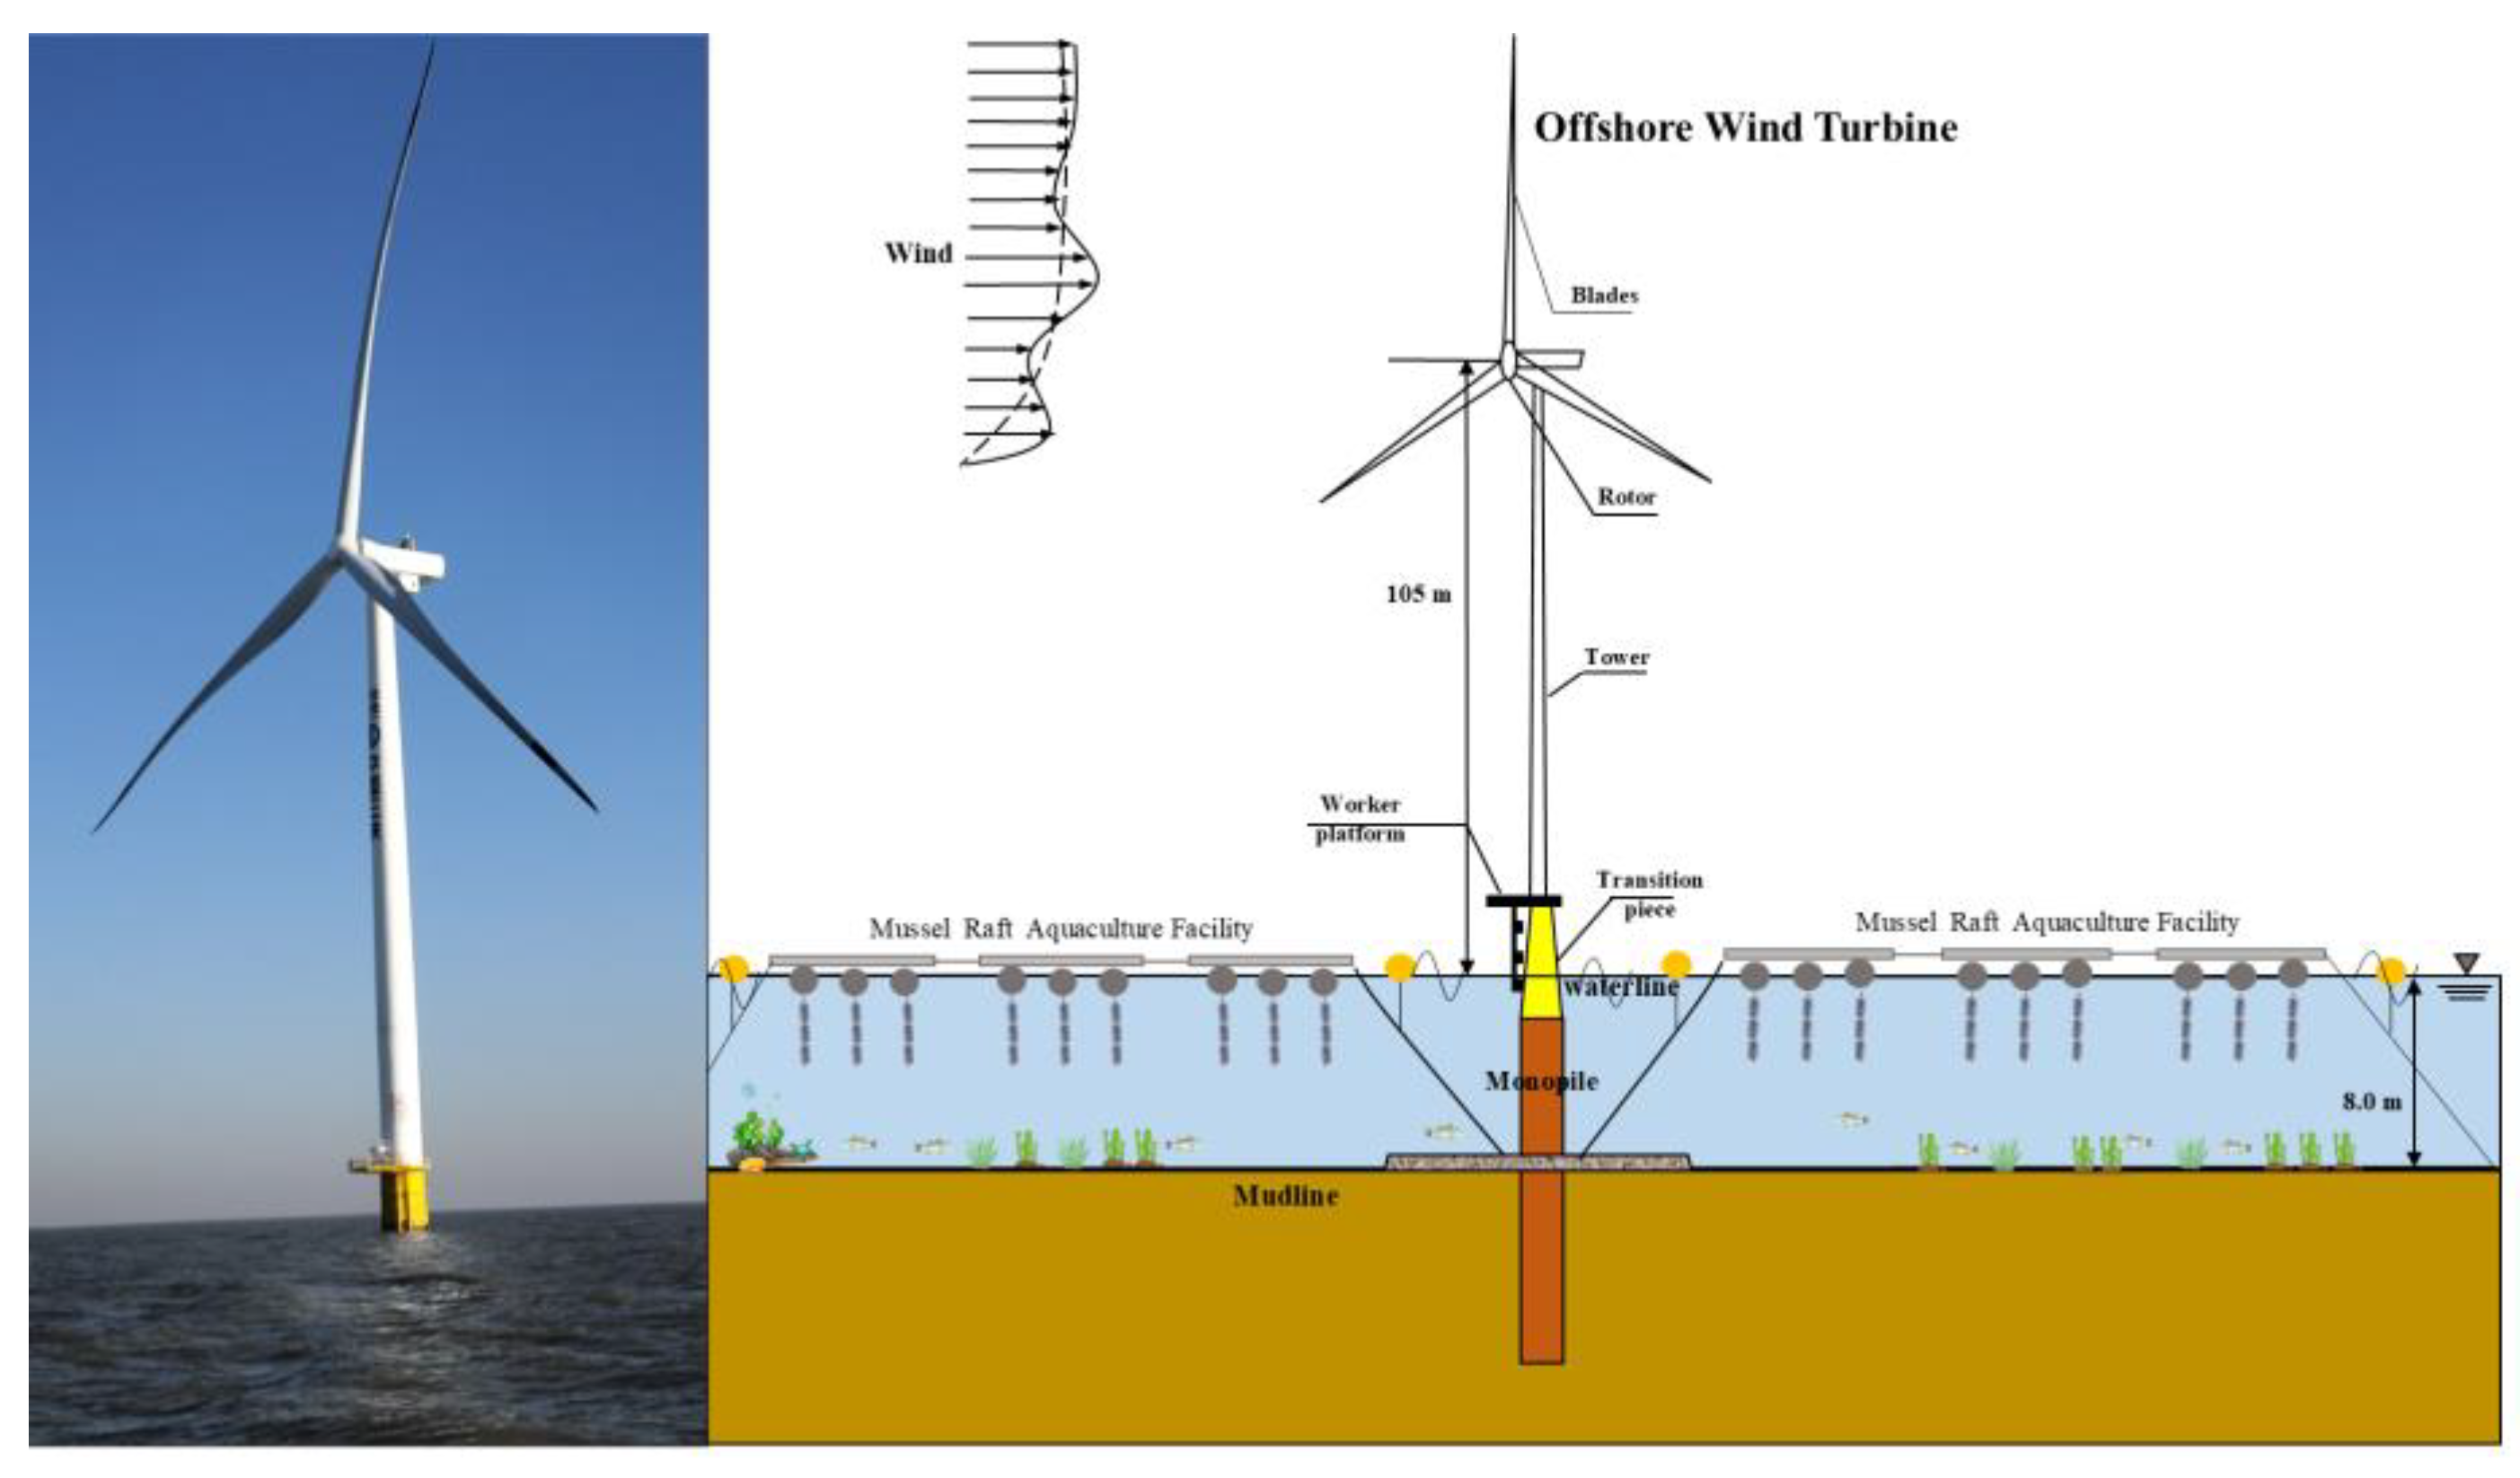
The wind farm studied in this paper is located in the southern area of Laizhou Bay of Changyi City, Shandong Province, China (
Figure 1), which is 15.5 km from the coastline. Local water depths of 6.7 m to 9.2 m are suitable for the installation of wind power. Waves in this area have significant wave height varying from 0.5 m to 2.0 m and average periods varying from 2.3 s to 7.1 s [
18]. Moreover, the wind farm is oriented towards the integration of offshore aquaculture, with the aspiration of establishing a model for the development of multifunctional areas. The foresight of installation of mariculture facilities within an offshore wind farm is depicted in
Figure 2.
2.2. Wave Tank
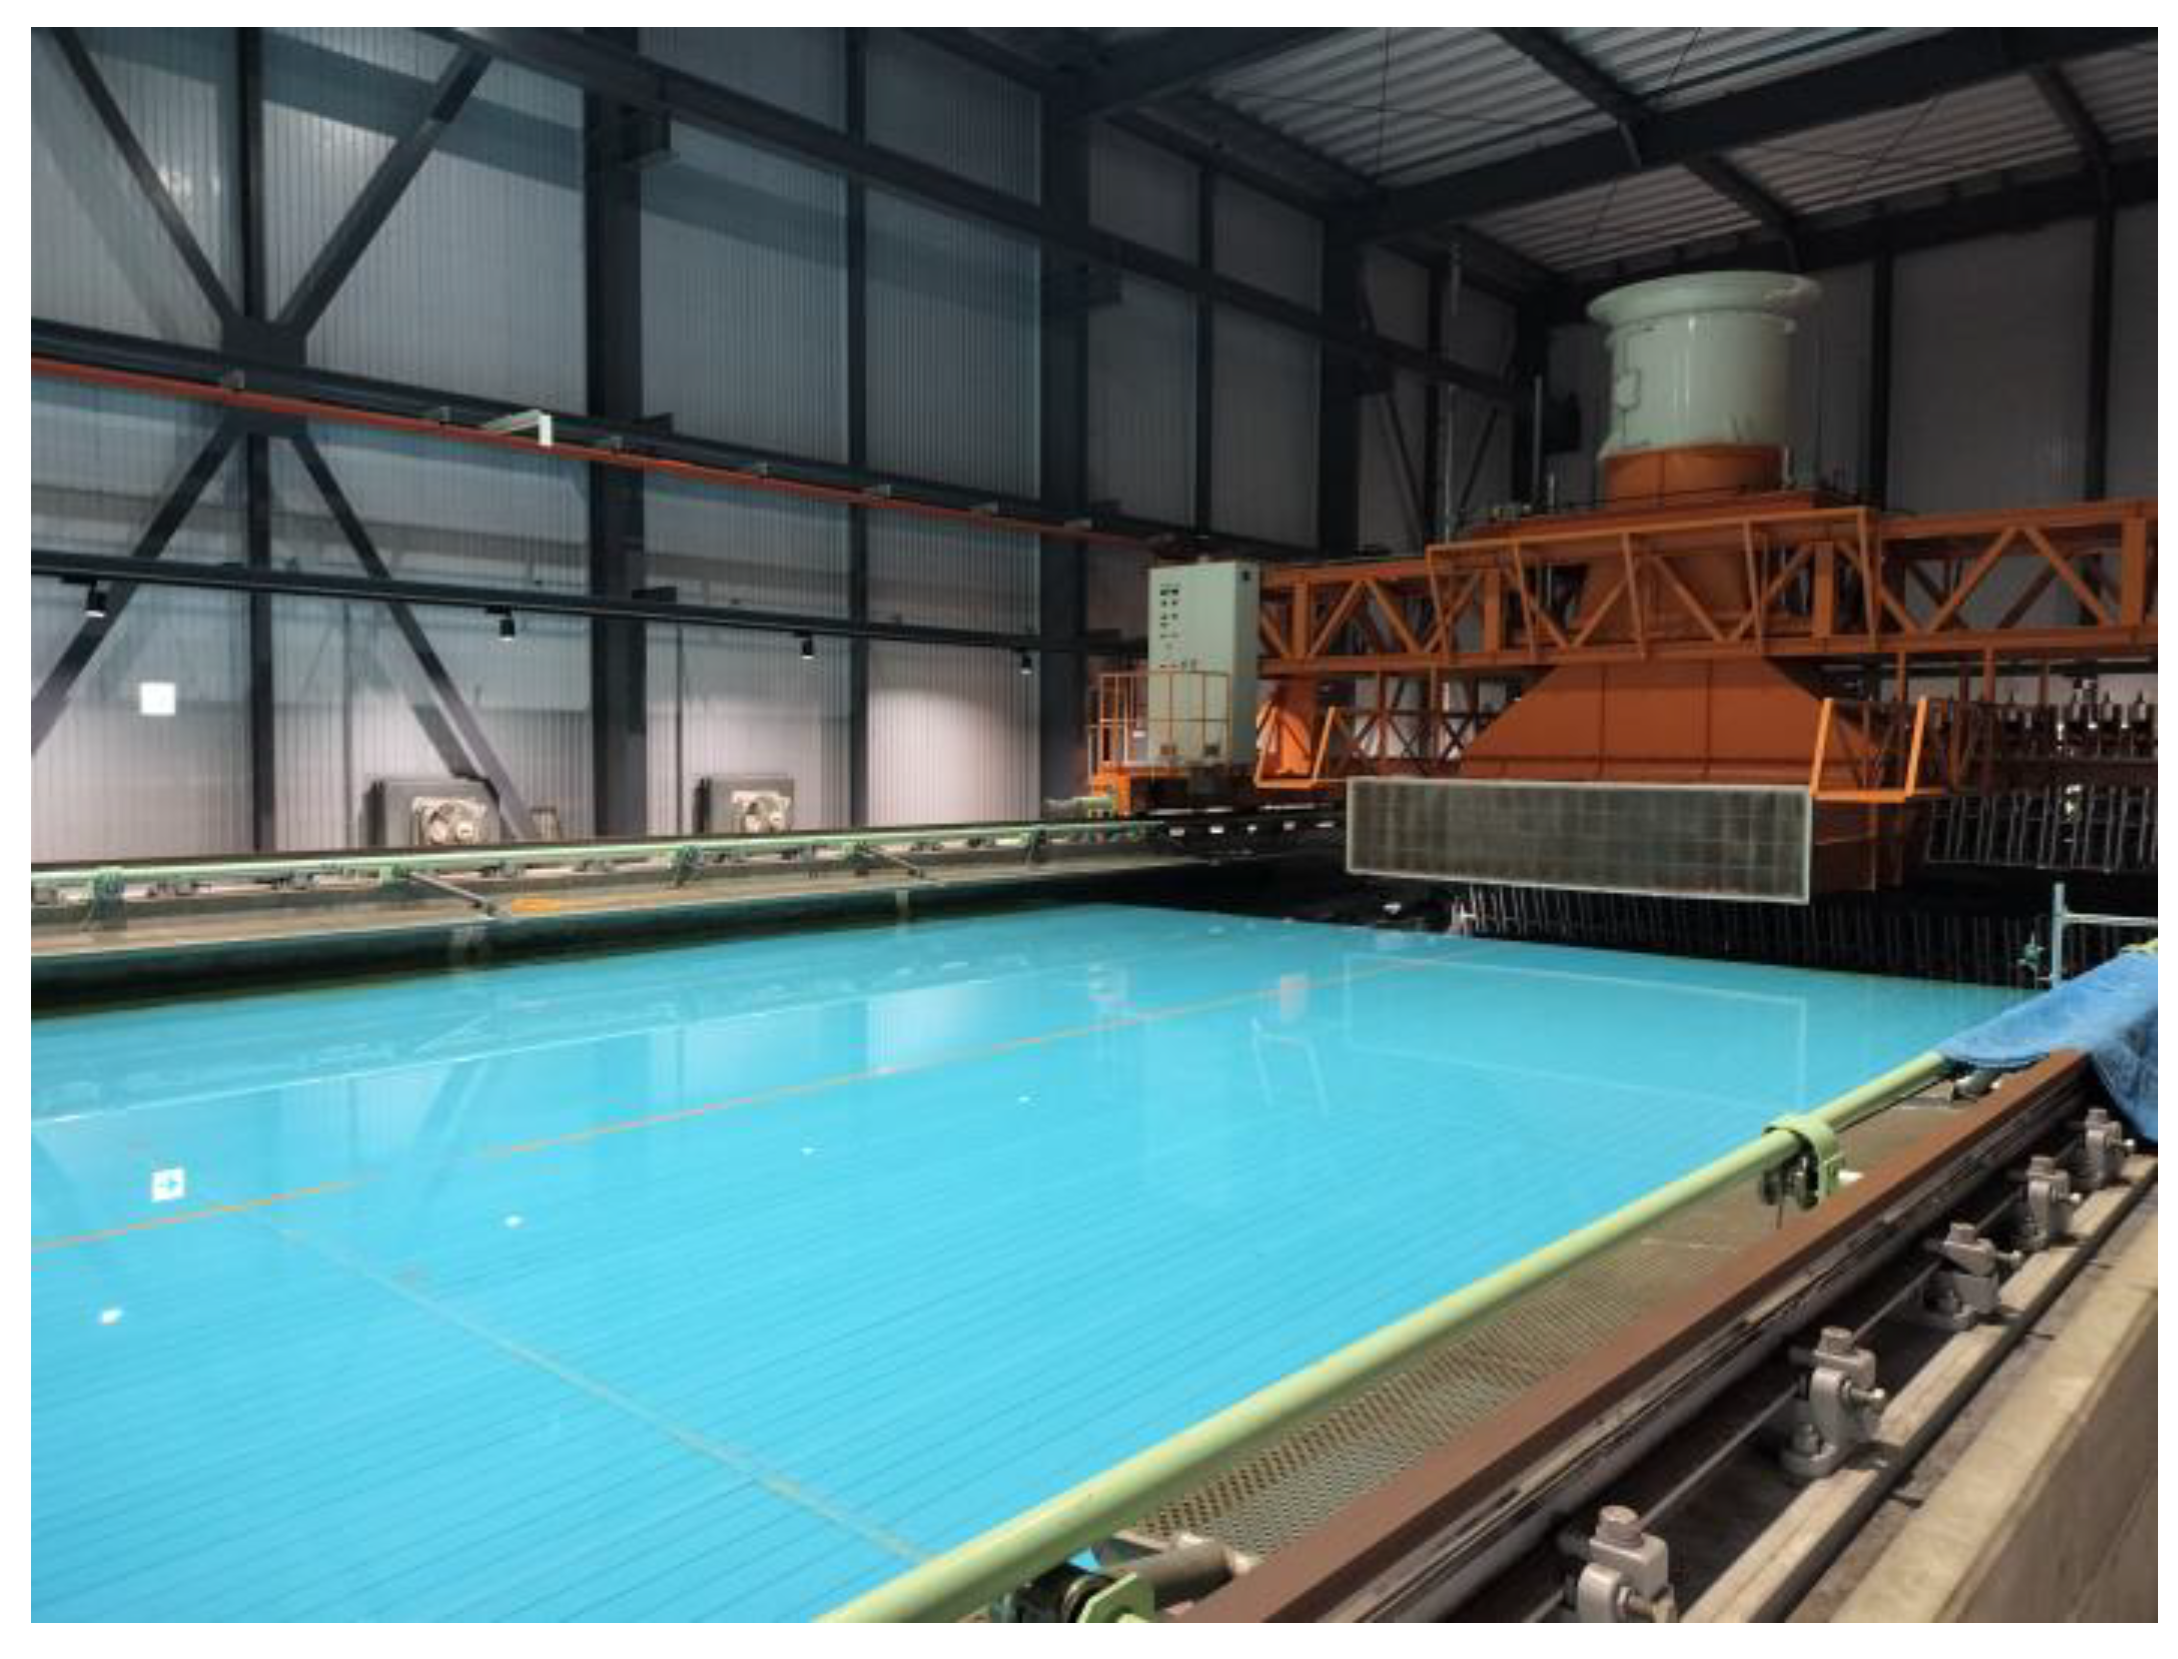
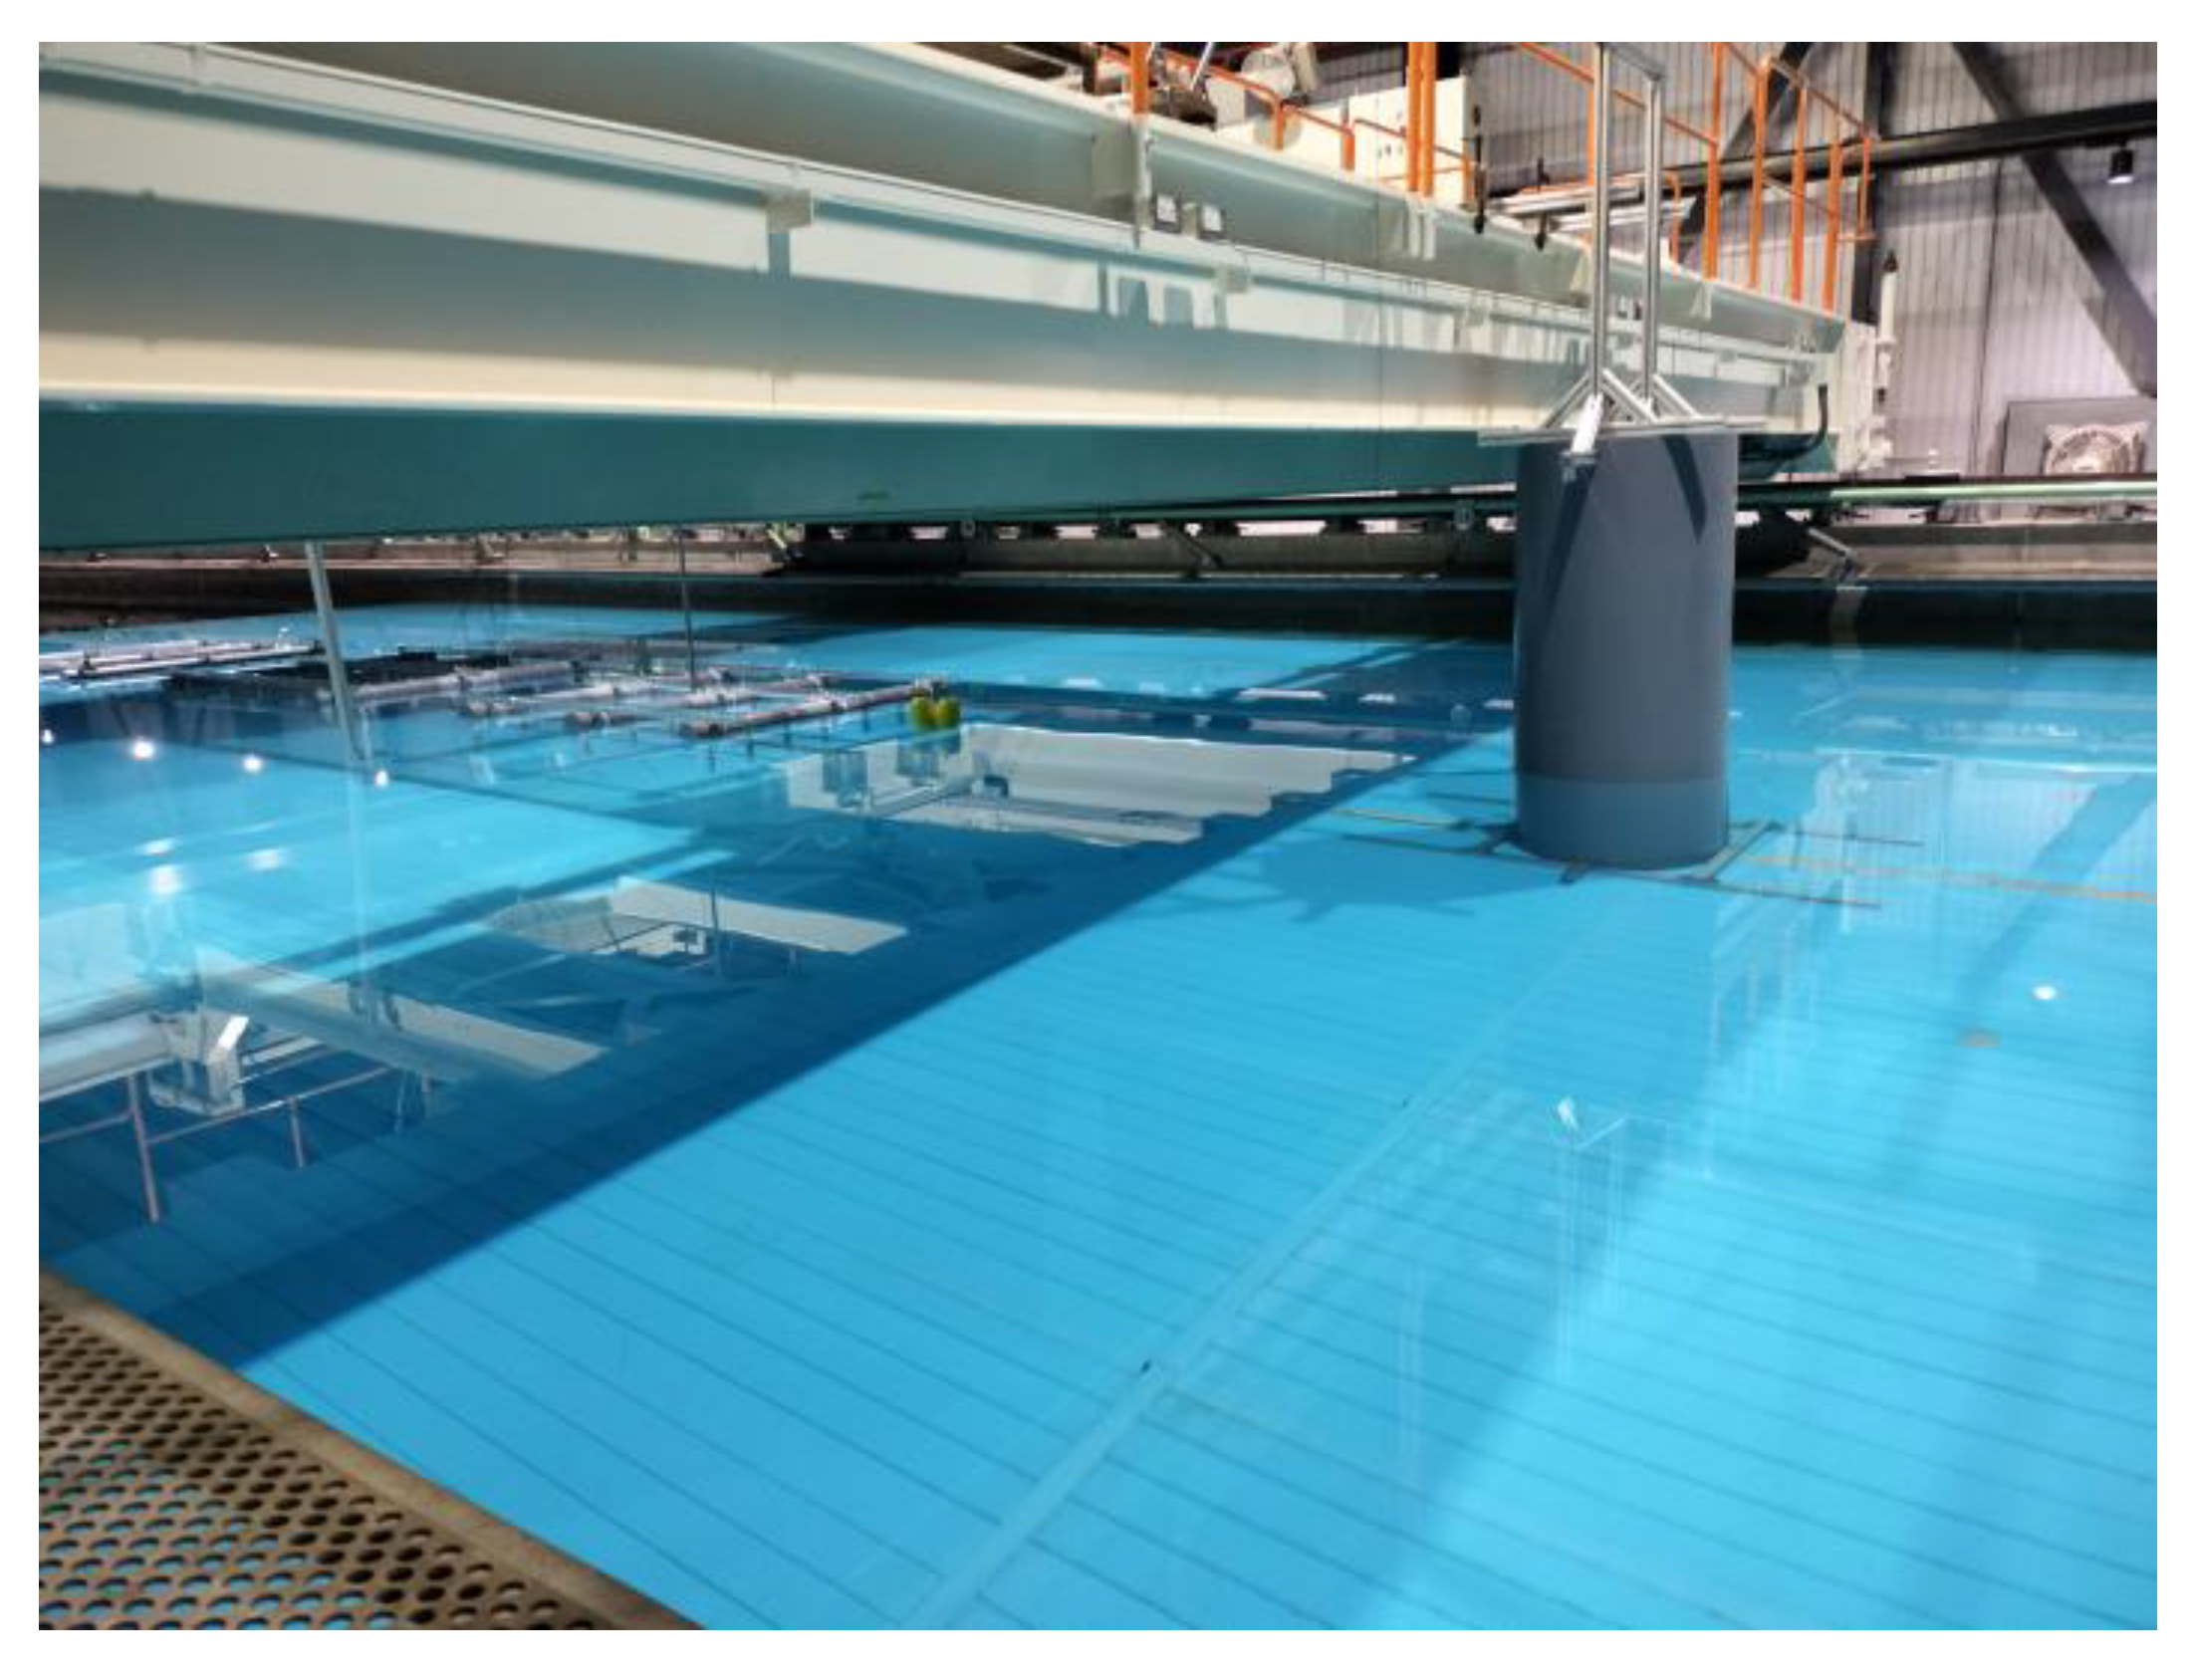
Experimental studies were carried out at the Ocean Engineering Basin, Institute of Industrial Science, the University of Tokyo. The wave tank is 50 m in length, 10 m in width and 5 m in depth, as shown in
Figure 3. The experimental water depth can be adjusted using a platform. The facility is equipped with a piston-type wave maker, which can generate regular incident waves with periods of 0.5–5.0 s and wave heights of 0.02–0.30 m. An absorbing metallic ramp opposite to the wavemaker can dissipate the incident waves and avoid the reflected waves.
2.3. Monopile and PRAF Model
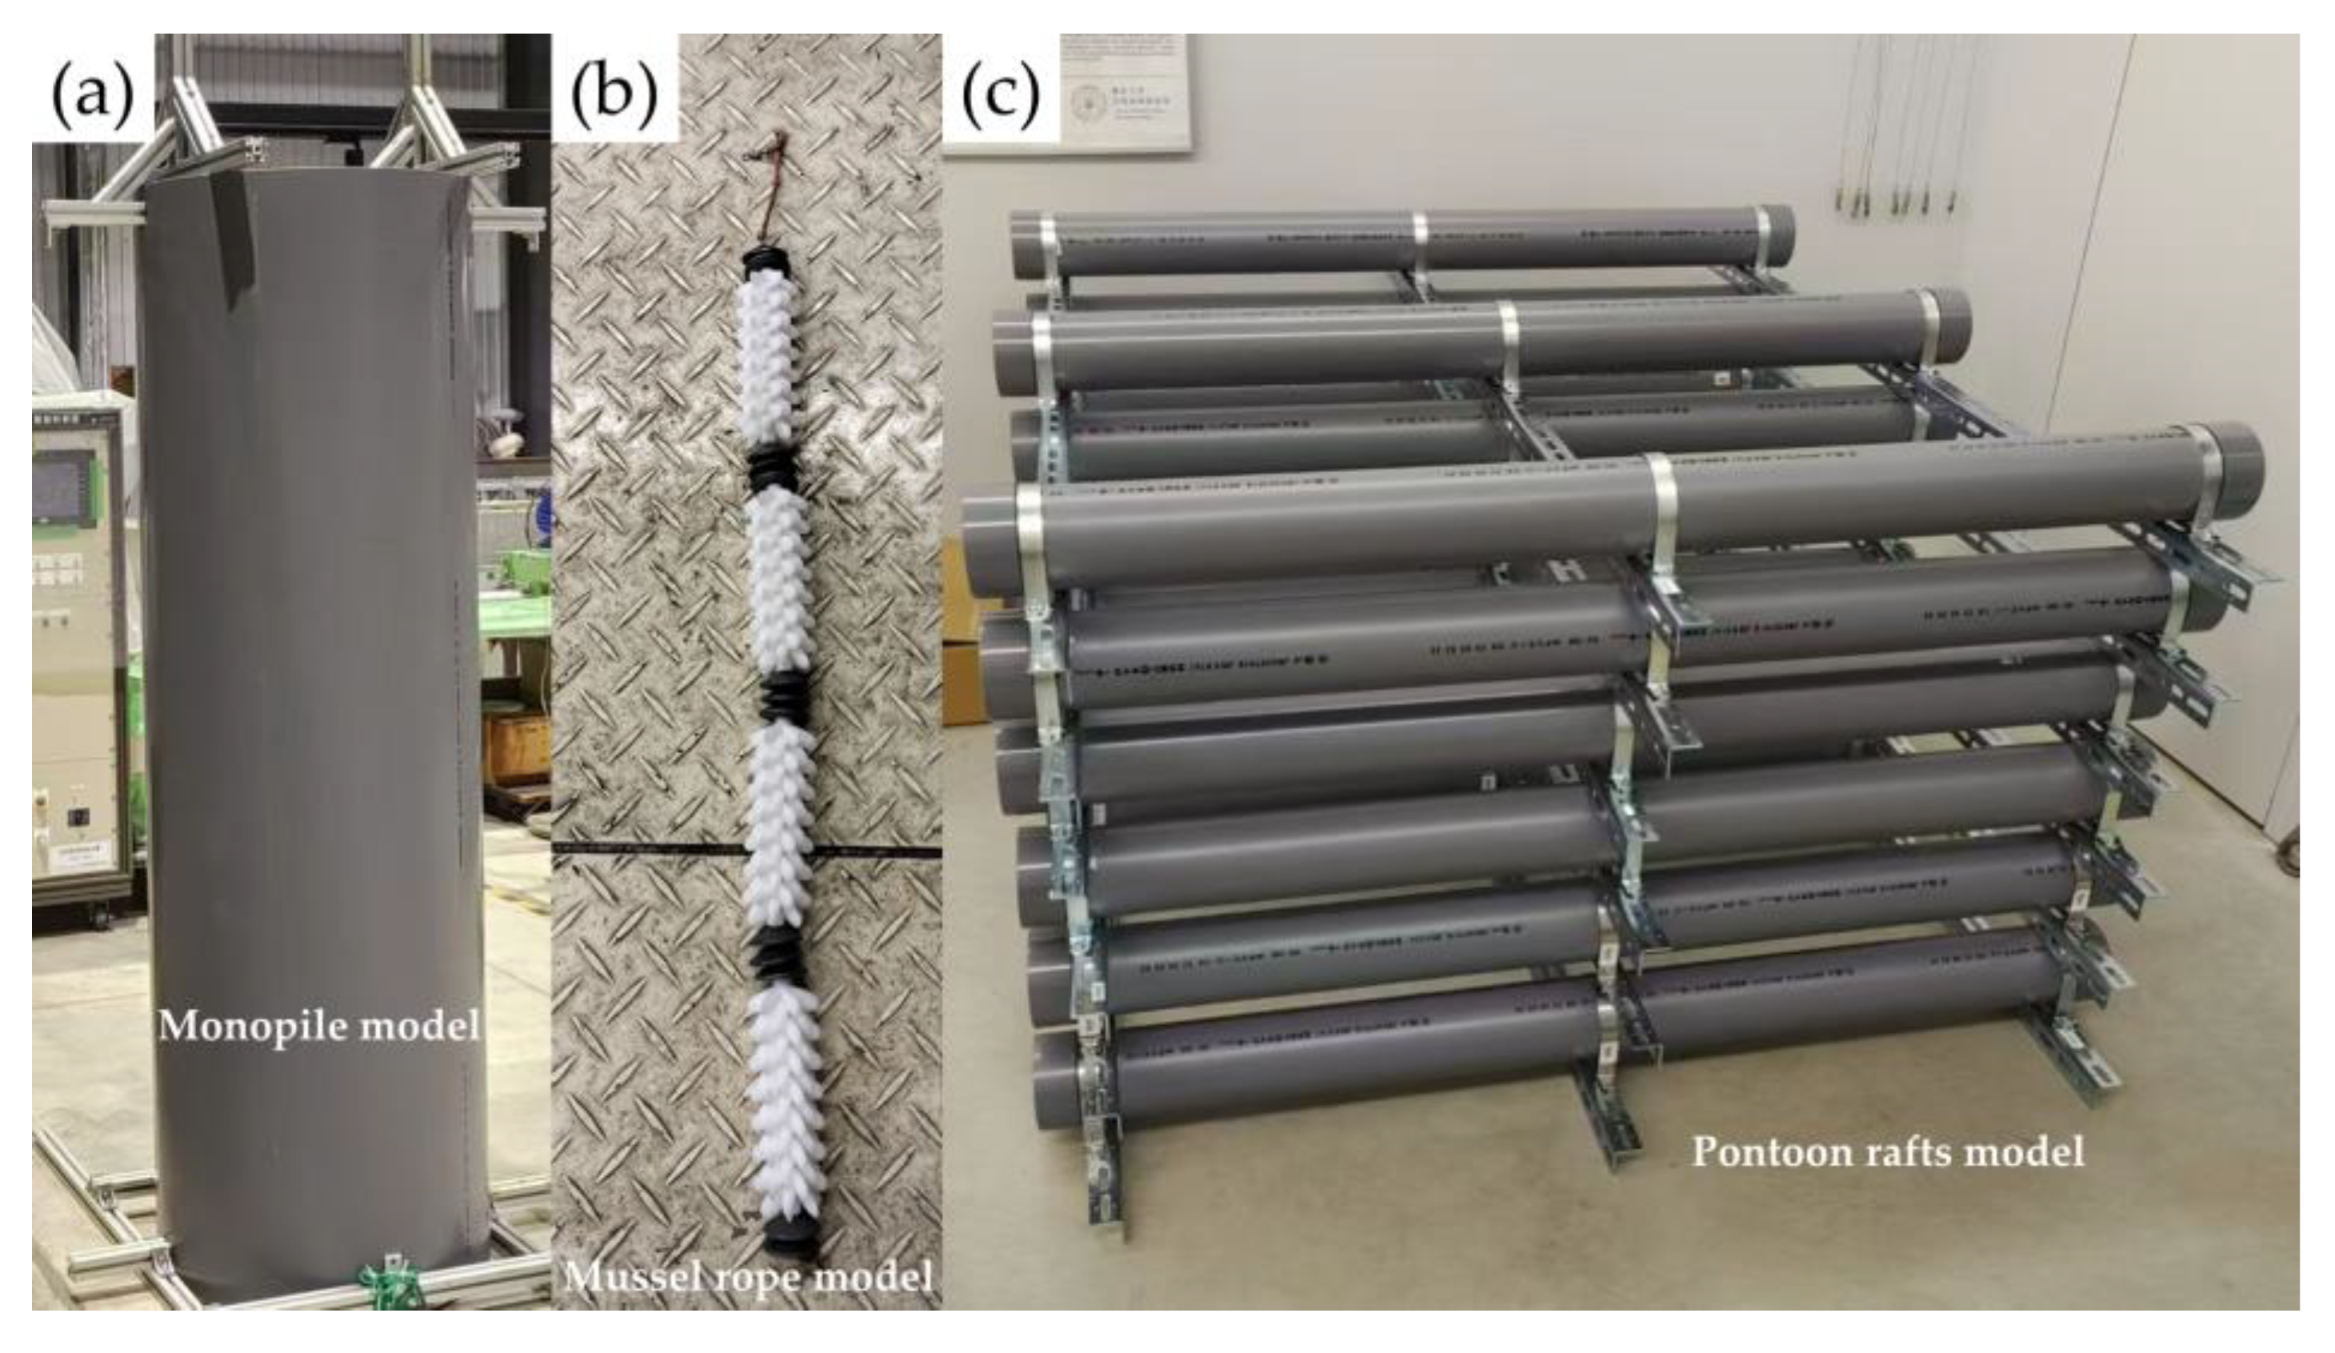
Froude principle scale of 1:8 is adopted in this experiment according to the dimensions of the water tank and PRAF. As shown in Figure 4a, the monopile is 2 m in height and 0.63 m in diameter, and is composed of Polyvinyl Chloride (PVC) to ensure stability in waves. The PRAF is referenced from our previous studies in Wang et al. (2015) and Ai et al. (2024) [
18,
19]. PRAF is composed of three rafts (Figure 4f), featuring an upper triple pontoon connected by steel angles (Figure 4c) and lower mussel rope models (Figure 4b). The depth of PRAF immersed in the water is 3.8 cm (1/3 times the height of PRAF) as shown in
Figure 4f,g. The 3D-printed mussel ropes are weighted to equal the mass of the actual mussel ropes in the water. More detailed parameters of PRAF model are provided in [
18].
2.4. Experimental Setup
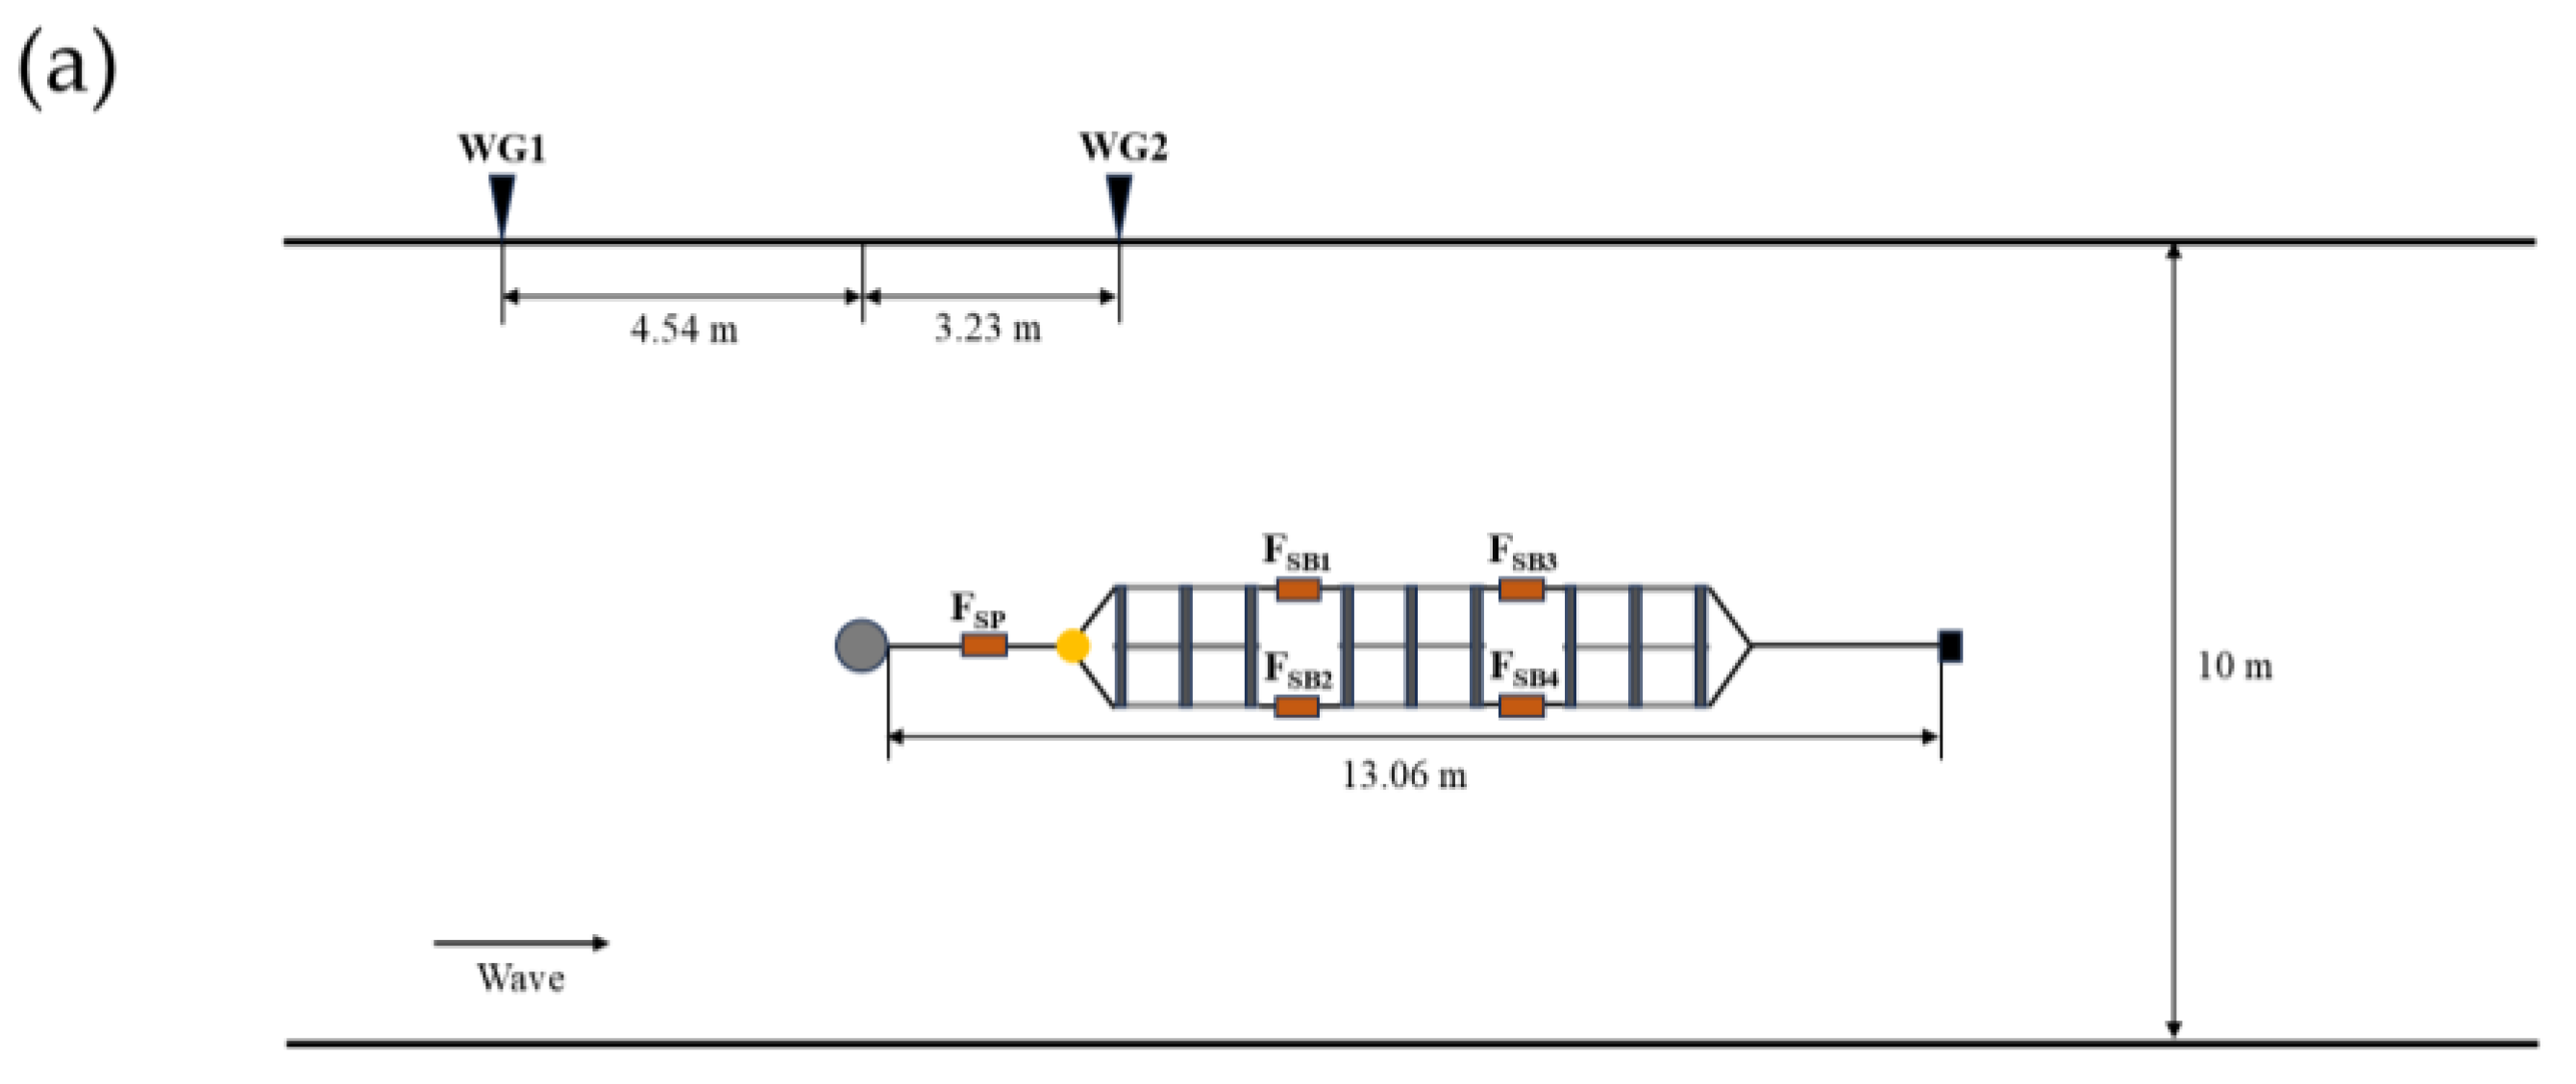
As illustrated in
Figure 5, this is a configuration of the single-row PRAF with monopile in experiments [
18]. The monopile was secured to the middle line of the bottom of the water tank at 16.63 m from the upstream wavemaker, to act as an anchoring element for the upstream mooring line of the single-row PRAF. PRAF was installed directly behind the monopile with a mooring line length to water depth ratio of 3 (water depth was 1 m).
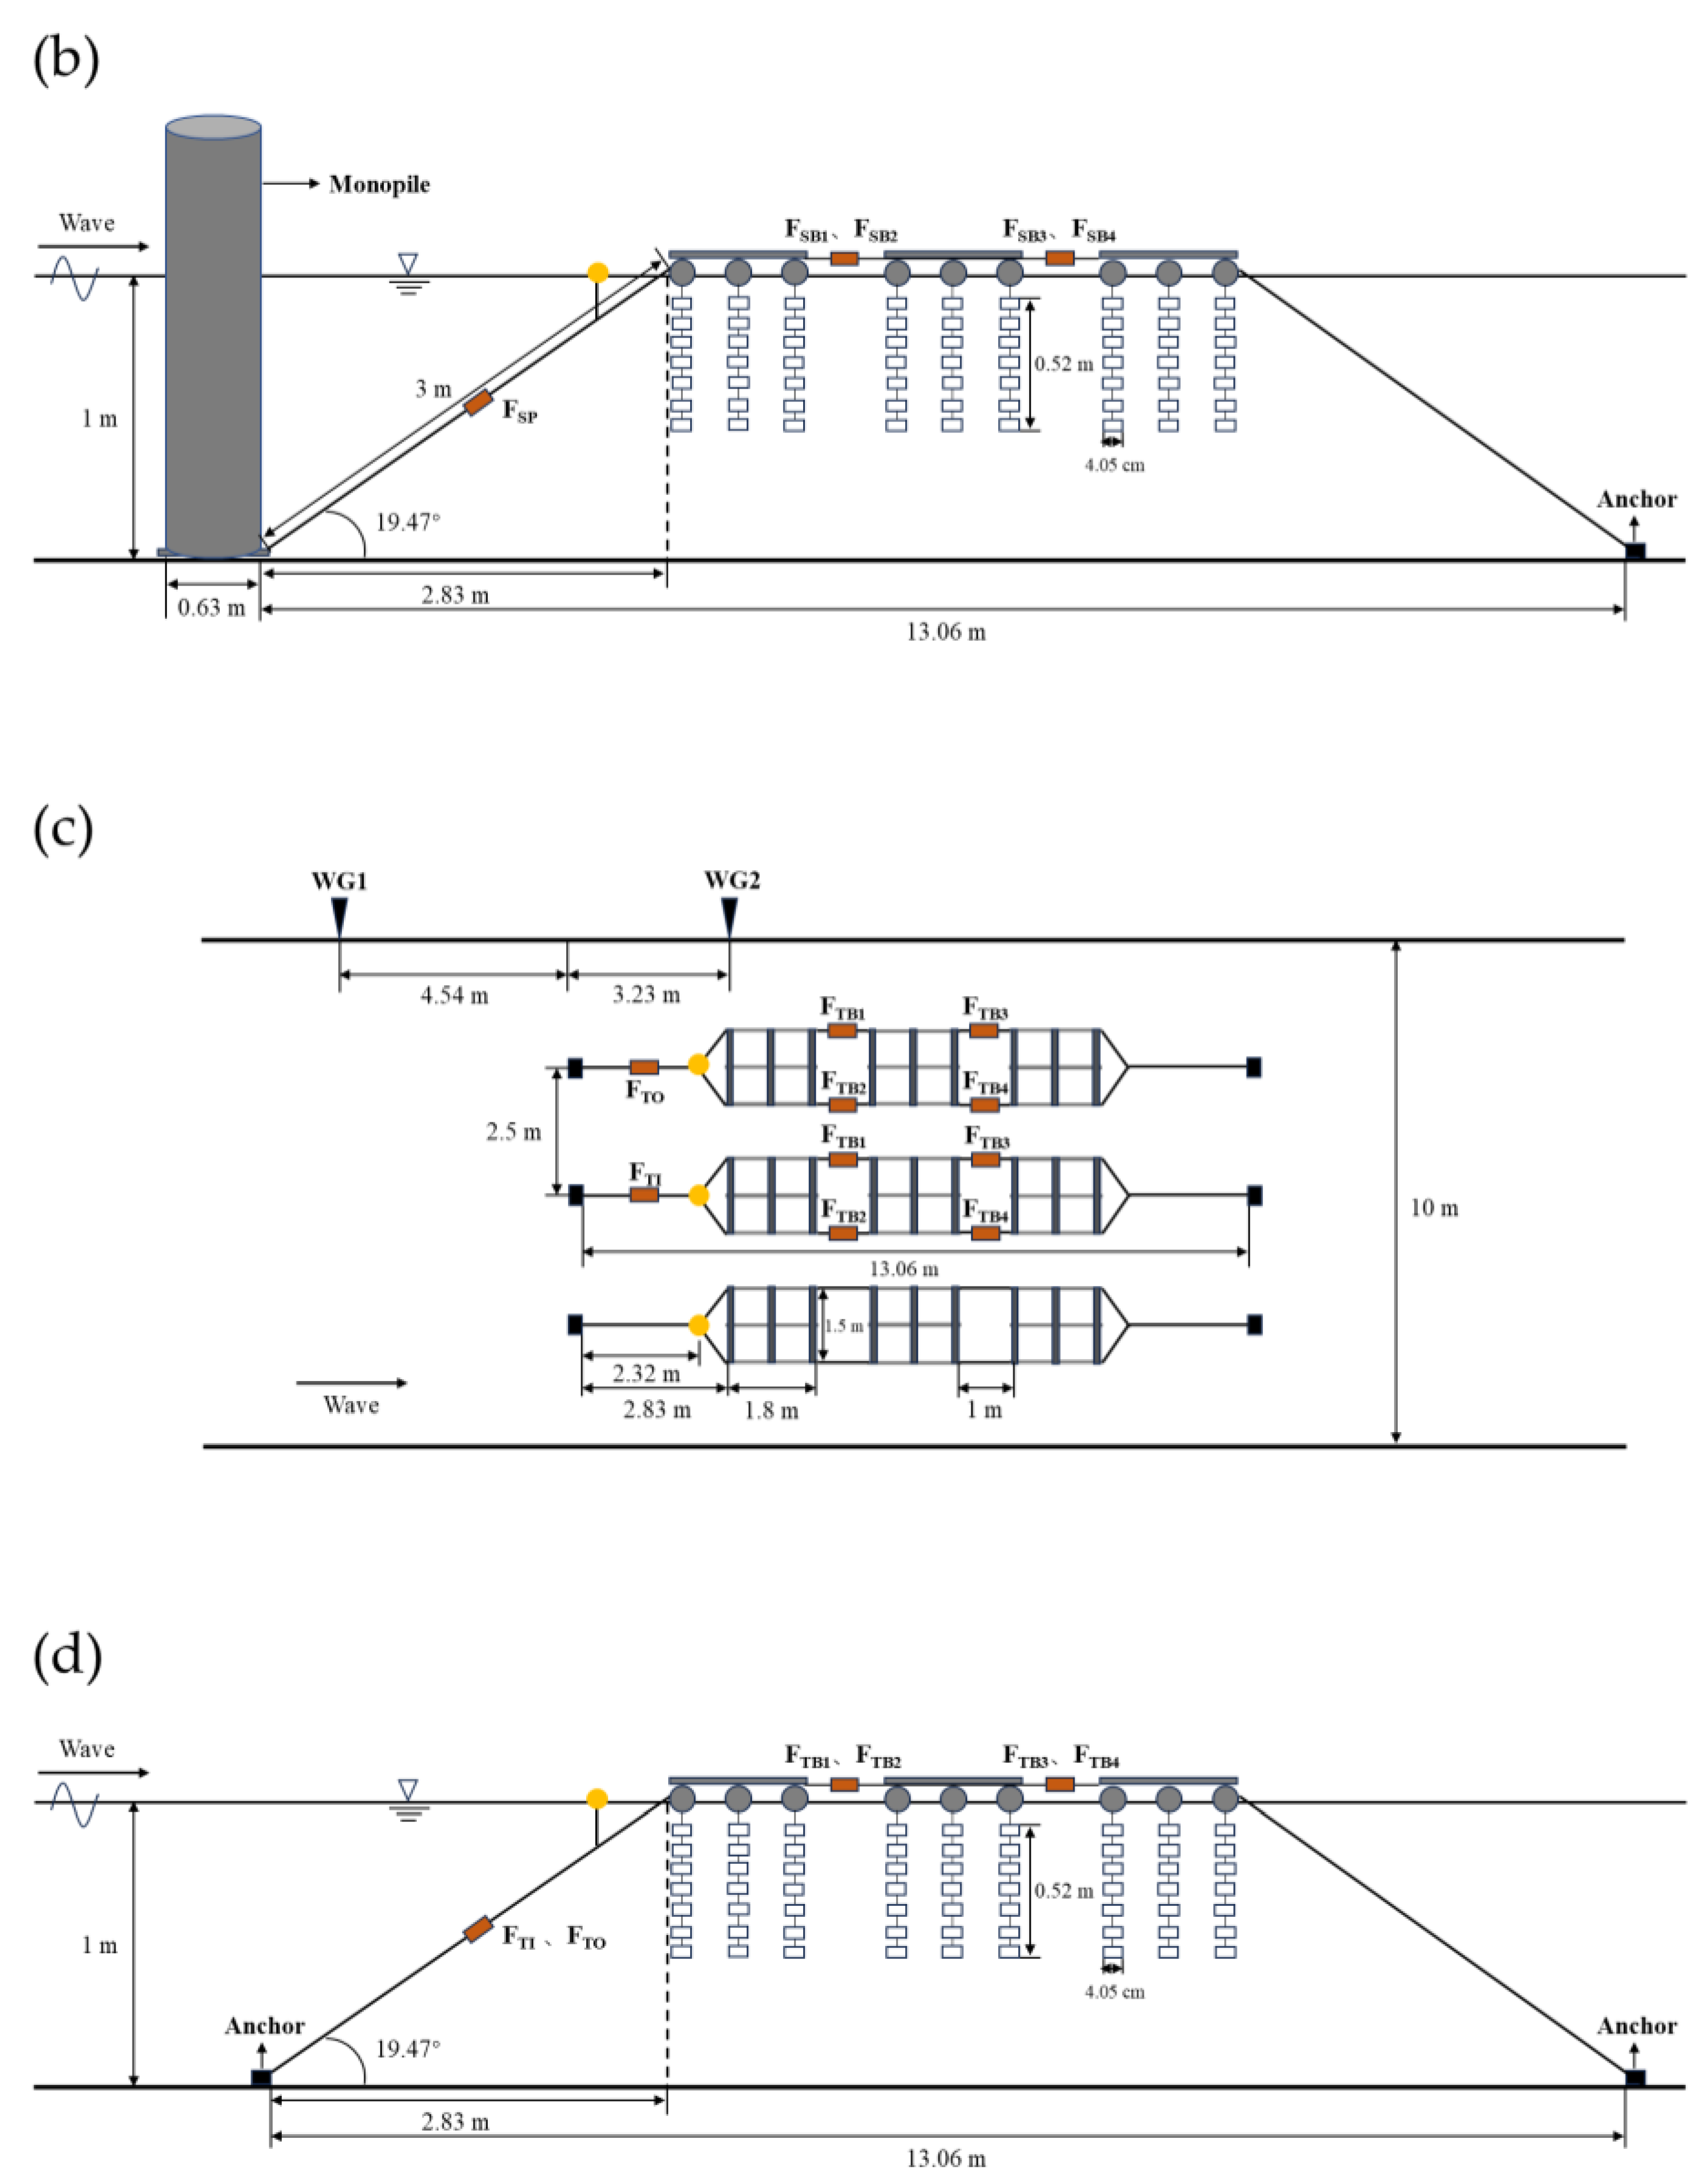
In this study, three configurations of PRAF were designed and analysed [
18]:
(1) Single-row PRAF with a monopile: PRAF and a monopile were aligned along the middle line of the bottom of the wave tank with the monopile serving as an anchor for the upstream mooring line of PRAF;
(2) Single-row PRAF without a monopile: Similar to configuration (1), but an iron block replaced the monopile as the anchor;
(3) Three-row PRAF without a monopile: Three PRAFs were installed in parallel with each other with a spacing of 2.5 m, and their anchors were all iron blocks.
Representative layouts in the experiments are shown in
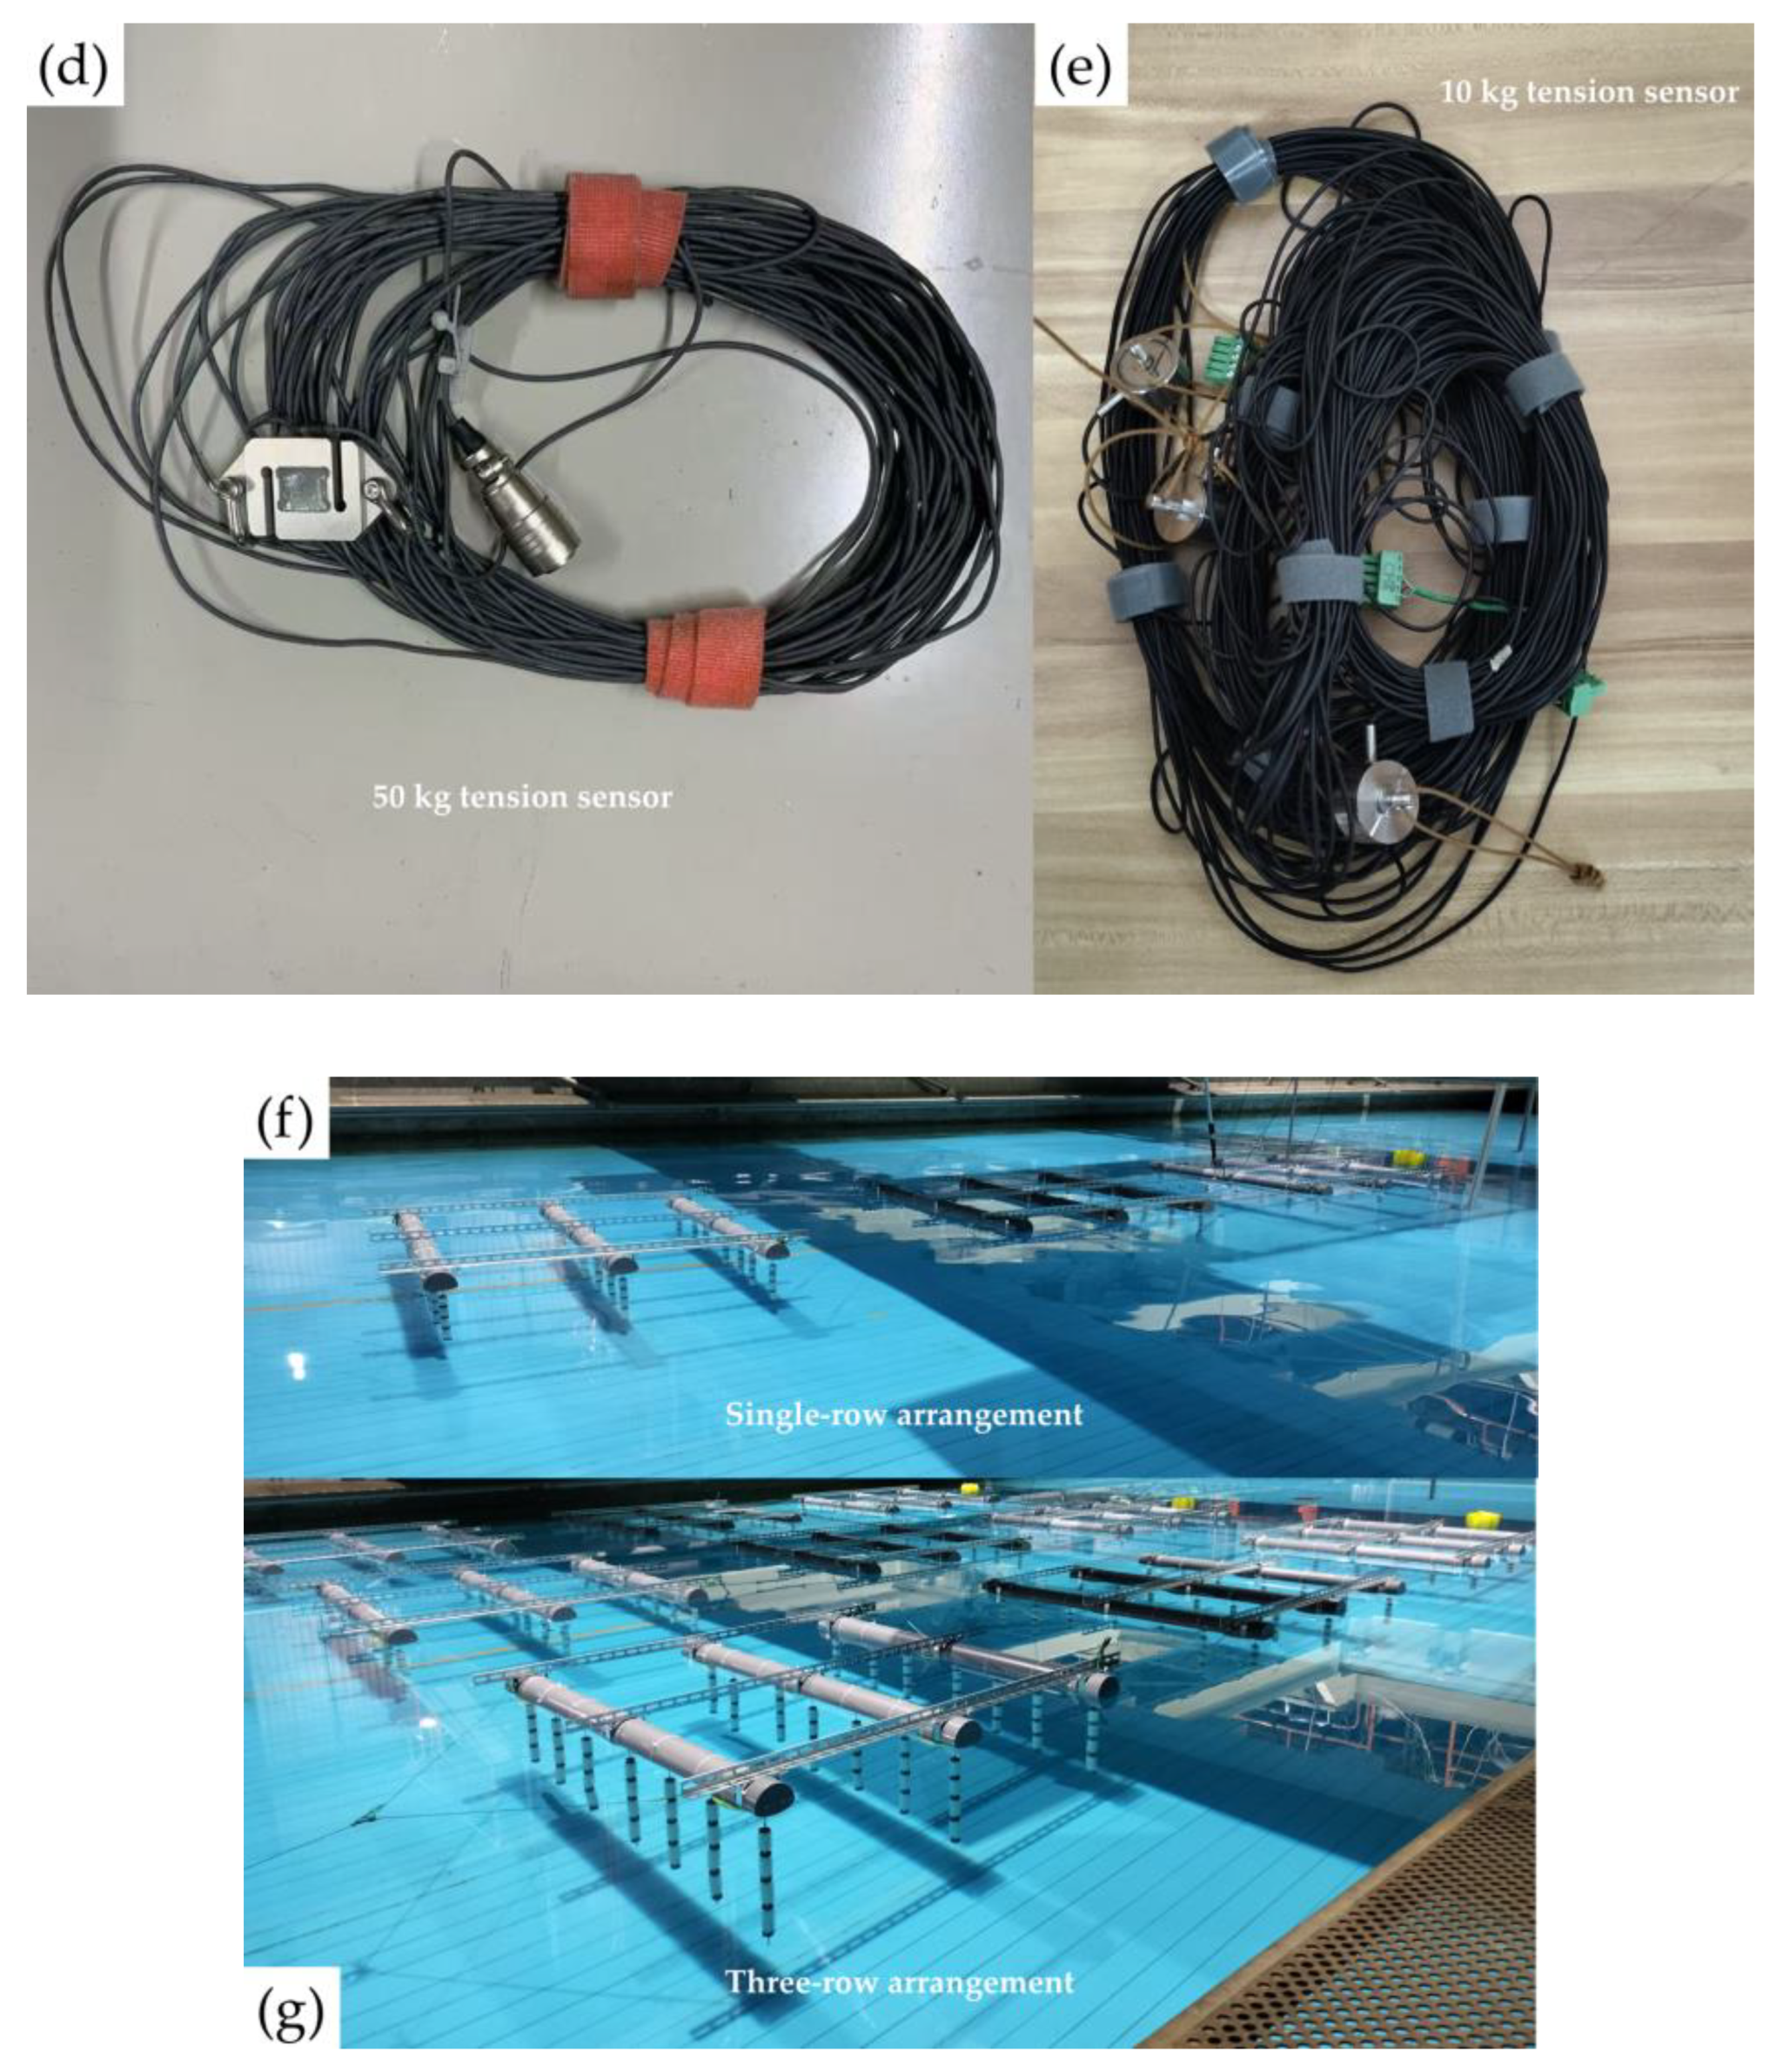
Figure 6. A 50 kg tension sensor (
Figure 4d) was affixed to the middle of the upstream mooring line to measure the mooring line tension under wave conditions. Four 10 kg tension sensors (
Figure 4e) were affixed to the middle of the bridle lines to obtain the internal forces between the rafts, respectively. Two wave gauges were placed. WG1 was positioned 4.54 m upstream of the monopile to collect incident wave data and WG2 was positioned 3.23 m downstream of the monopile to monitor transmitted wave data [
18].
Based on the Froude similarity, the wave conditions for the experiments were designed accordingly. Tests were conducted at a water depth of 1 m, with wave heights ranging from 0.063 to 0.188 m and periods from 1.0 to 1.4 s. The experimental wave conditions are listed in
Table 1. Experimental wave conditions set up. When scaled to actual sea conditions at a depth of 8 m, these ranges correspond to wave heights of 0.504 to 1.504 m and wave periods of 2.8 to 4.0 s, which closely match the marine environment at the Changyi City wind farm [
18].
3. Numerical Simulation Methods
This study employs numerical simulations to investigate how monopile foundations influence wave transmission, offering valuable insights for optimizing the layout of raft aquaculture facilities. STAR-CCM+, a commercial computational fluid dynamics software, is well-suited for multidisciplinary problems involving fluid and solid continuum mechanics. It serves as a powerful tool for analyzing complex fluid dynamics. In this paper, the Reynolds-averaged Navier-Stokes (RANS) equations are solved using the finite volume method, based on the SST
k-ω turbulence model in STAR-CCM+, to determine wave attenuation after interacting with a wind turbine monopile foundation [
20]. The free surface is modelled using the Volume of Fluid (VOF) method.
3.1. Governing Equation
Fluid motion must adhere to three fundamental laws: the Law of Conservation of Mass, the Law of Conservation of Momentum, and the Law of Conservation of Energy. For incompressible fluid flow, the energy conservation equation can be neglected due to negligible heat transfer. In this numerical simulation, wave motion is governed by the continuity equation and the momentum equation, as follows:
where
is the fluid density;
is the mean velocity;
is the corrected mean pressure, where
is the mean pressure and
is the turbulent kinetic energy;
is the unit tensor;
is the mean viscous stress tensor;
is the stress tensor extra term, obtained by solving the SST
k-ω turbulence model [
21];
is the combined volume force (e.g., gravity and centrifugal force).
3.2. Free Surface Tracking
The VOF multiphase model in STAR-CCM+ is an interfacial capture method used to track the motion and distribution of immiscible fluid interfaces [
22]. This modelling approach assumes that the grid cell resolution is sufficient to meet the solution requirements. The Euler phase volume fraction, denoted as
, represents the distribution and location of fluid phases and their interfaces. The phase volume fraction
is defined as shown in Equation (3),
where
represents the volume of phase
in the grid cell;
is the grid cell volume.
The sum of the volume fractions of all Euler phases within a grid is 1. Based on the value of the Euler phase volume fraction , the distribution of Euler phases in each grid can be determined:
(1) , indicating that there is no Euler phase in the grid cell;
(2) , indicating that the grid cell is filled with i Euler phase;
(3) , indicating that there is an interface within the grid cell.
The distribution of phase
is obtained from the phase mass conservation equation as shown in Equation (4).
where
is the average mixing velocity;
is the surface area vector;
is the customized source term;
is the Lagrange derivative of the phase density
; and
is the diffusion velocity. When two phases are present, the volume fraction transport is solved for the first phase only, and the volume fraction of the second phase is then adjusted in each grid cell so that the sum of the volume fractions of the two phases is 1.
3.3. Grid Settings and Boundary Conditions
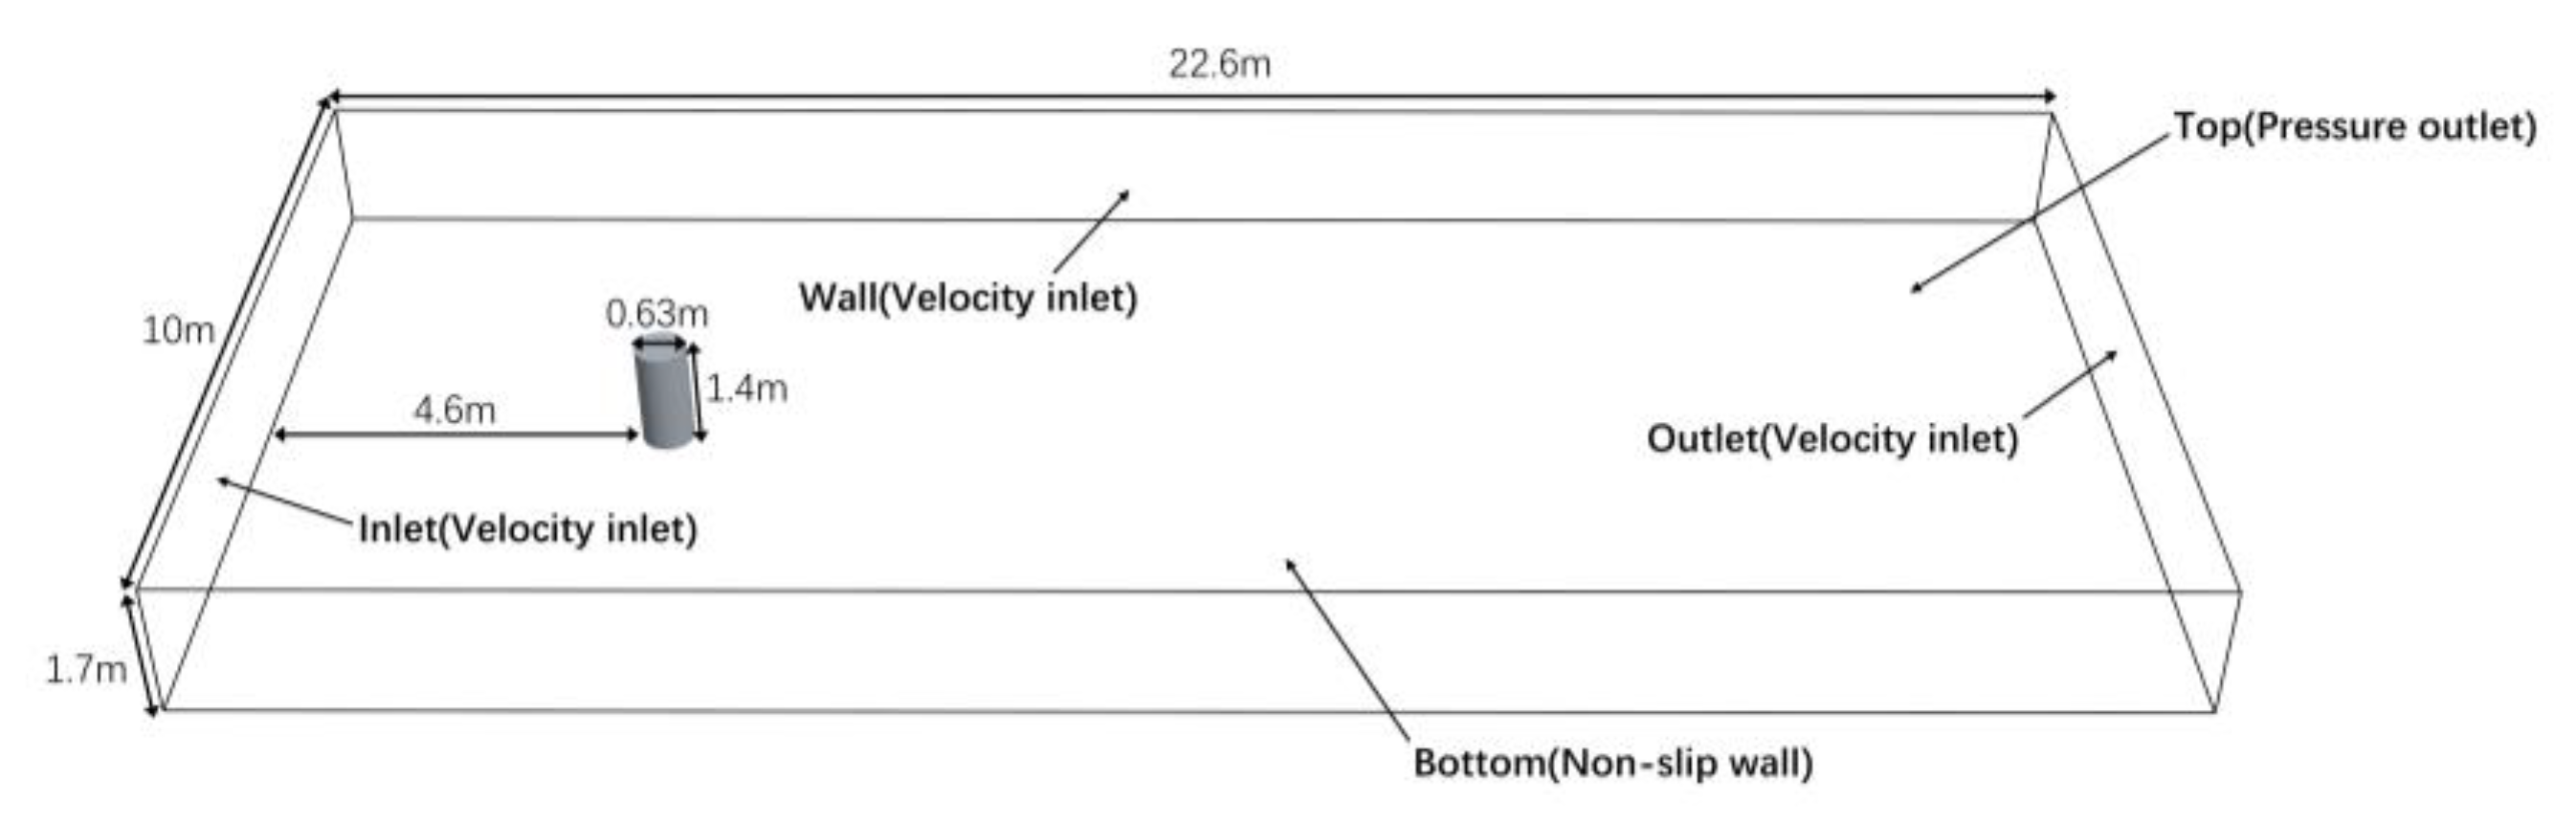
The wave flume utilized in the physical experiment was similarly employed in the numerical simulations, with appropriate simplifications to reduce computational demand.
Figure 7 presents the established numerical wave flume, which has dimensions of 22.6 m in length, 10 m in width, and 1.7 m in height. A wind turbine monopile foundation, with a diameter of 0.63 m and a height of 1.4 m, is 4.6 m from the wave inlet. The water depth in the flume is set at 1 m. To solve the governing in the STAR-CCM+ official manual, a second-order implicit unsteady-state scheme is used for solving the equations, with a time step of 0.001 s. Fifth-order waves were generated at the flume inlet using Stokes' fifth-order wave theory [
23], and the inlet boundary conditions were specified as a velocity inlet.
To further optimize computational efficiency, a symmetry plane was defined along the centerline of the flume. The outlet and the opposite side were also defined as velocity inlets, while the bottom boundary was treated as a no-slip wall, and the top boundary was set as a pressure outlet. To mitigate wave reflection effects at the computational boundaries, a wave attenuation option was activated at both the inlet and outlet, extending the wave absorbing region by twice the wavelength length. Moreover, a source term, as expressed in Equation (5), was introduced into the momentum equation within the wave-absorbing region to simulate wave forces [
24].
where
is the force coefficient,
is the solution to the transport equation, and
is the value approximated by the tension solution. The solution of the Navier-Stokes equations is made to converge to the set numerical solution within the specified wave dissipation region.
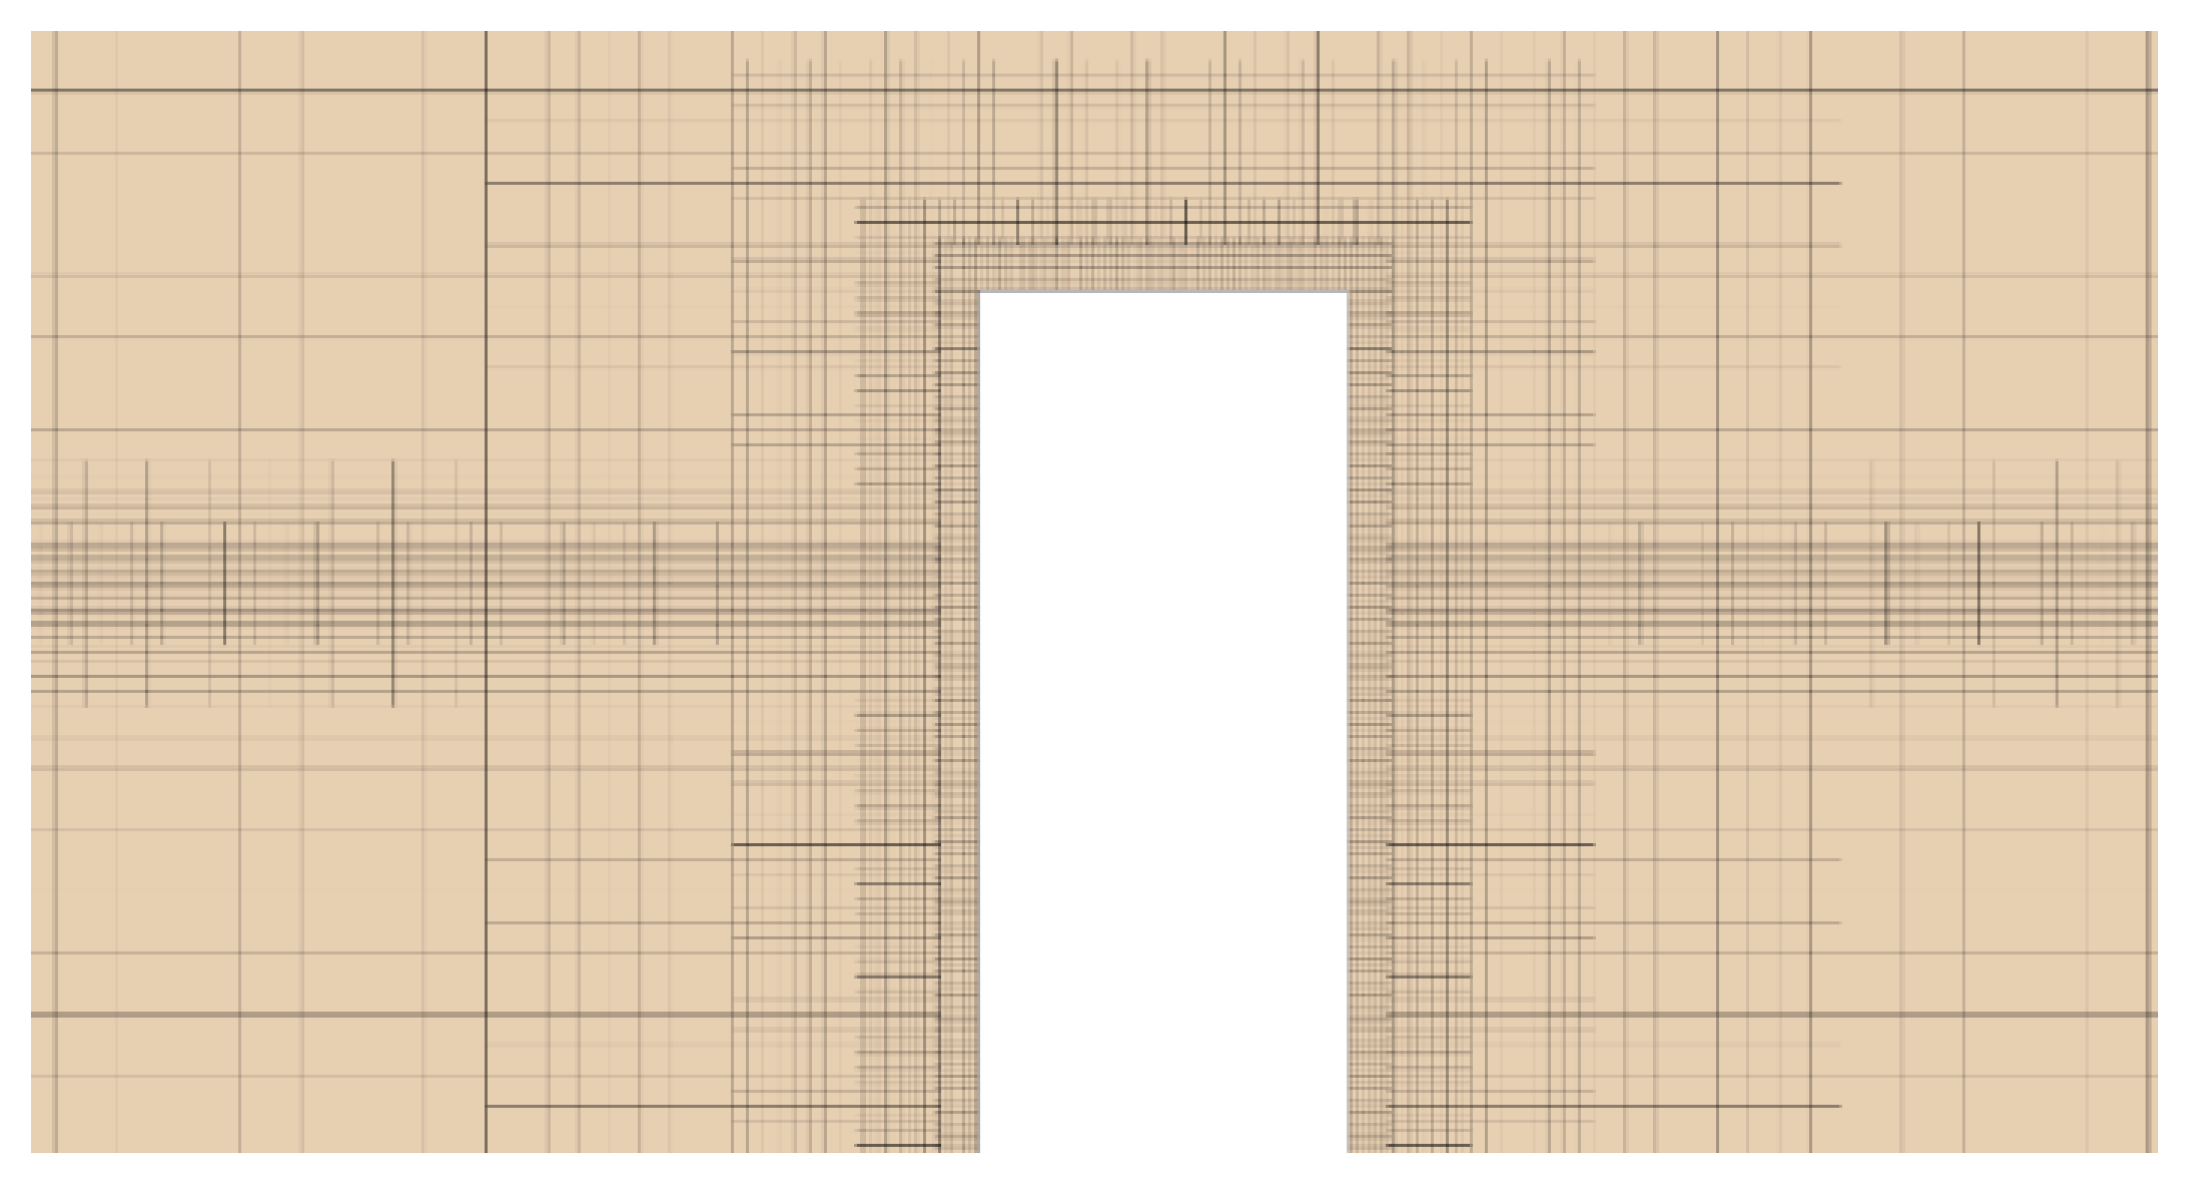
After conducting a convergence examination, the grid size in the computational domain was set to 0.8 times the wave height. To ensure sufficient grid refinement for capturing wave variations, additional refinement was applied within the wave amplitude range, with the grid size set to 0.05 times the wave height in the vertical direction and 0.2 times the wave height in the horizontal direction. An overlapping grid region was specifically defined around the wind turbine foundation, where the base grid size is set to 0.01 m. The total grid count ranges between 4 and 6 million. The actual grid division is illustrated in
Figure 8.
3.4. Wave Height Monitoring Points Setup
The validation of the numerical flume is provided in
Appendix A. This section investigated the wave propagation characteristics in the wake region behind the wind turbine monopile foundation subjected to regular waves.
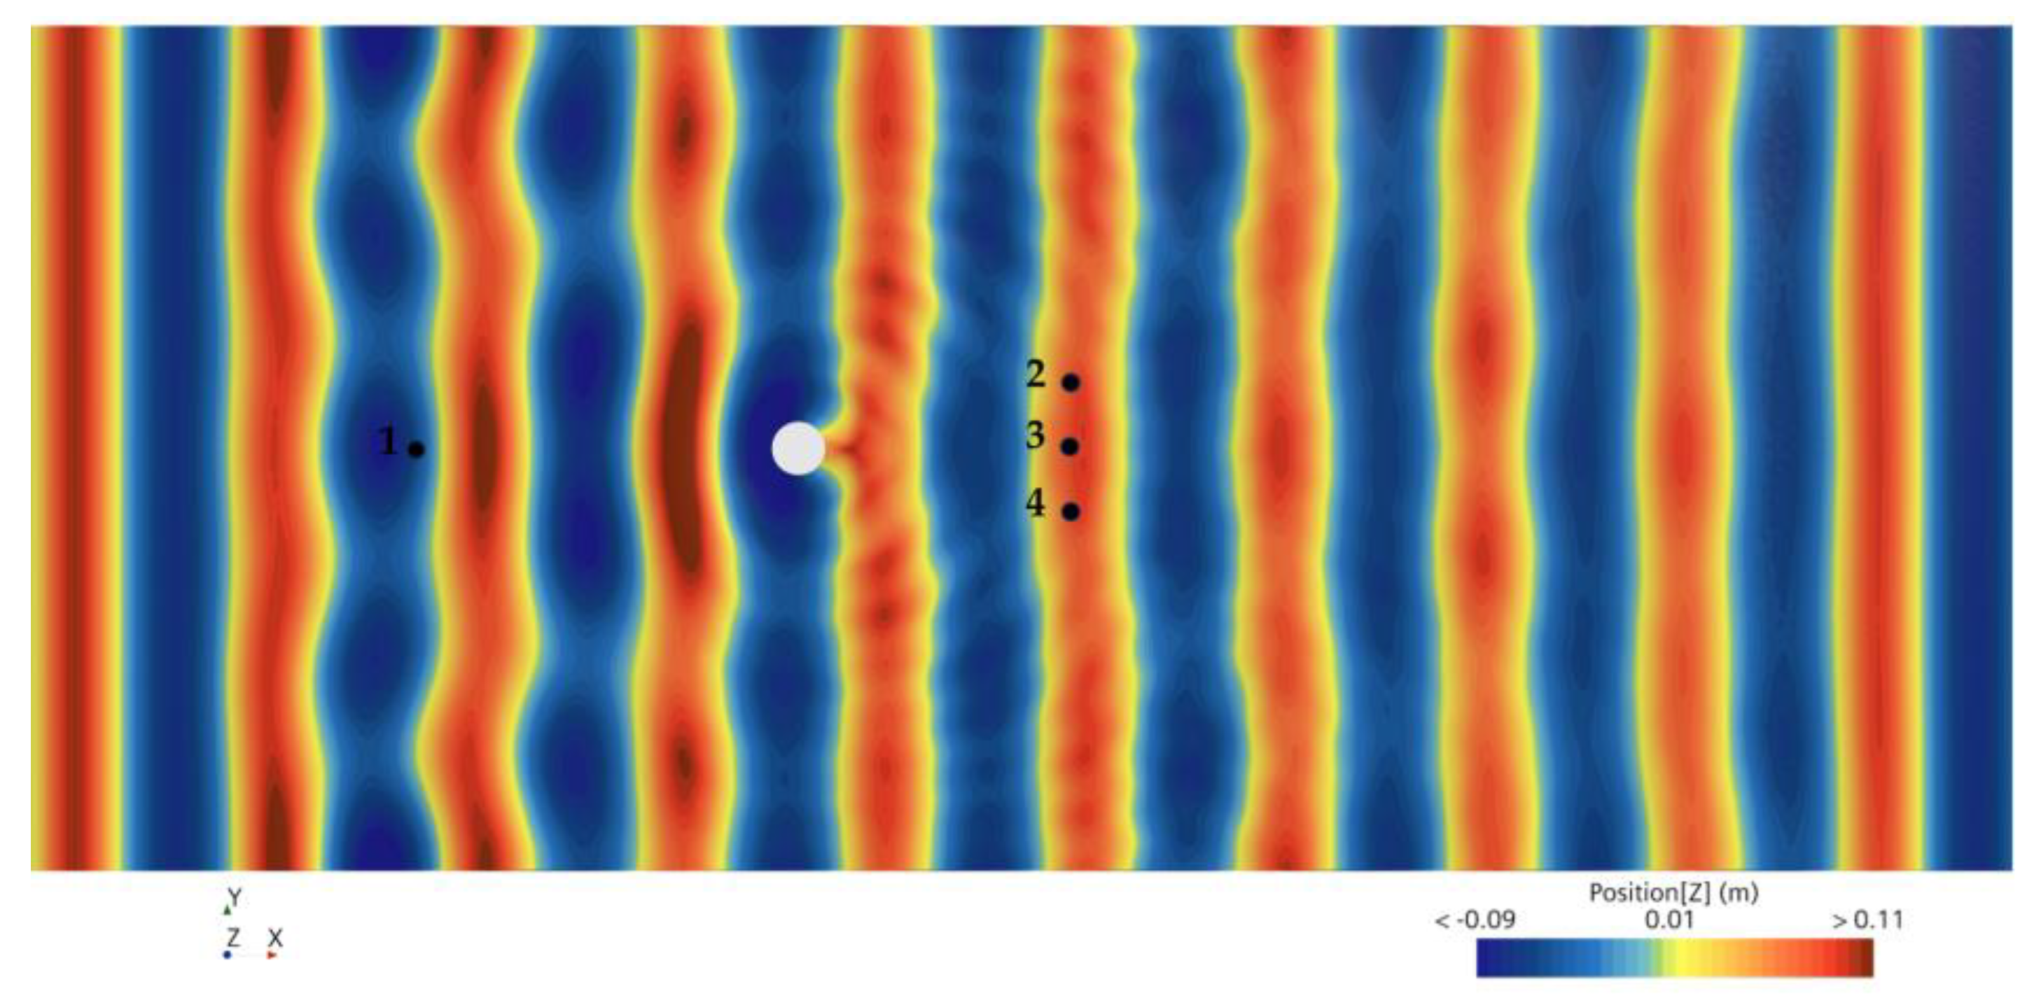
Figure 9 shows four monitoring points established in the numerical flume to calculate the wave heights at specific locations. Point 1 was positioned in front of the wind turbine monopile foundation to verify the incident wave conditions, while the remaining points (2, 3 and 4) were distributed within the down-wave region of the monopile, located slightly ahead of PRAF in experiments. The wave height values at the representative points (2, 3 and 4) were used to evaluate the effect of the wind monopile foundation on the surrounding wave field.
Detailed numerical simulations were conducted for all experimental scenarios to examine its influence on wave propagation. The numerical results provide insights into why the presence of a wind turbine monopile foundation reduces the mooring line tension of the raft aquaculture facility. This reduction in mooring line tension can be attributed to the attenuation and redistribution of wave energy as the waves interact with the monopile, thereby altering the hydrodynamic loads acting on the aquaculture system.
4. Results and Discussion
In the following subsections, the results of this study are presented. First, the effects of wave period and wave height on the dynamic response of mooring lines and bridle lines of PRAF are analyzed. In addition, we compare the hydrodynamic forces of a single-row PRAF with and without a monopile, as well as those on the hydrodynamic forces of the inner structure and the outer structure in a three-row PRAF. Tension sensors installed on the mooring lines and bridle lines recorded the mooring line tensions and the bridle line tensions of PRAF. Meanwhile, the maximum values of the mooring line and bridle line tensions are averaged. Next, the effects of the monopile on wave propagation is discussed, and the wave-attenuation effect of the monopile obtained from numerical simulations is also used to explain the observed reduction in mooring line tension. Finally, the relationship between the wave-attenuation effect of the monopile and the reduction of mooring line tension is presented and analyzed.
4.1. Mooring Line Tensions of PRAF
The structural integrity of aquaculture facilities relies heavily on the mooring system. Mooring line failure is an important factor in exposing structure to risks. This study analyzes the effect of different arrangements on the mooring system of PRAF, which can provide an important reference for the design and construction of raft aquaculture facilities, as well as the decision-making of wind turbine foundations as anchorage points.
4.1.1. The Maximum Mooring Line Tensions of the Single-Row PRAF Under Wave Conditions
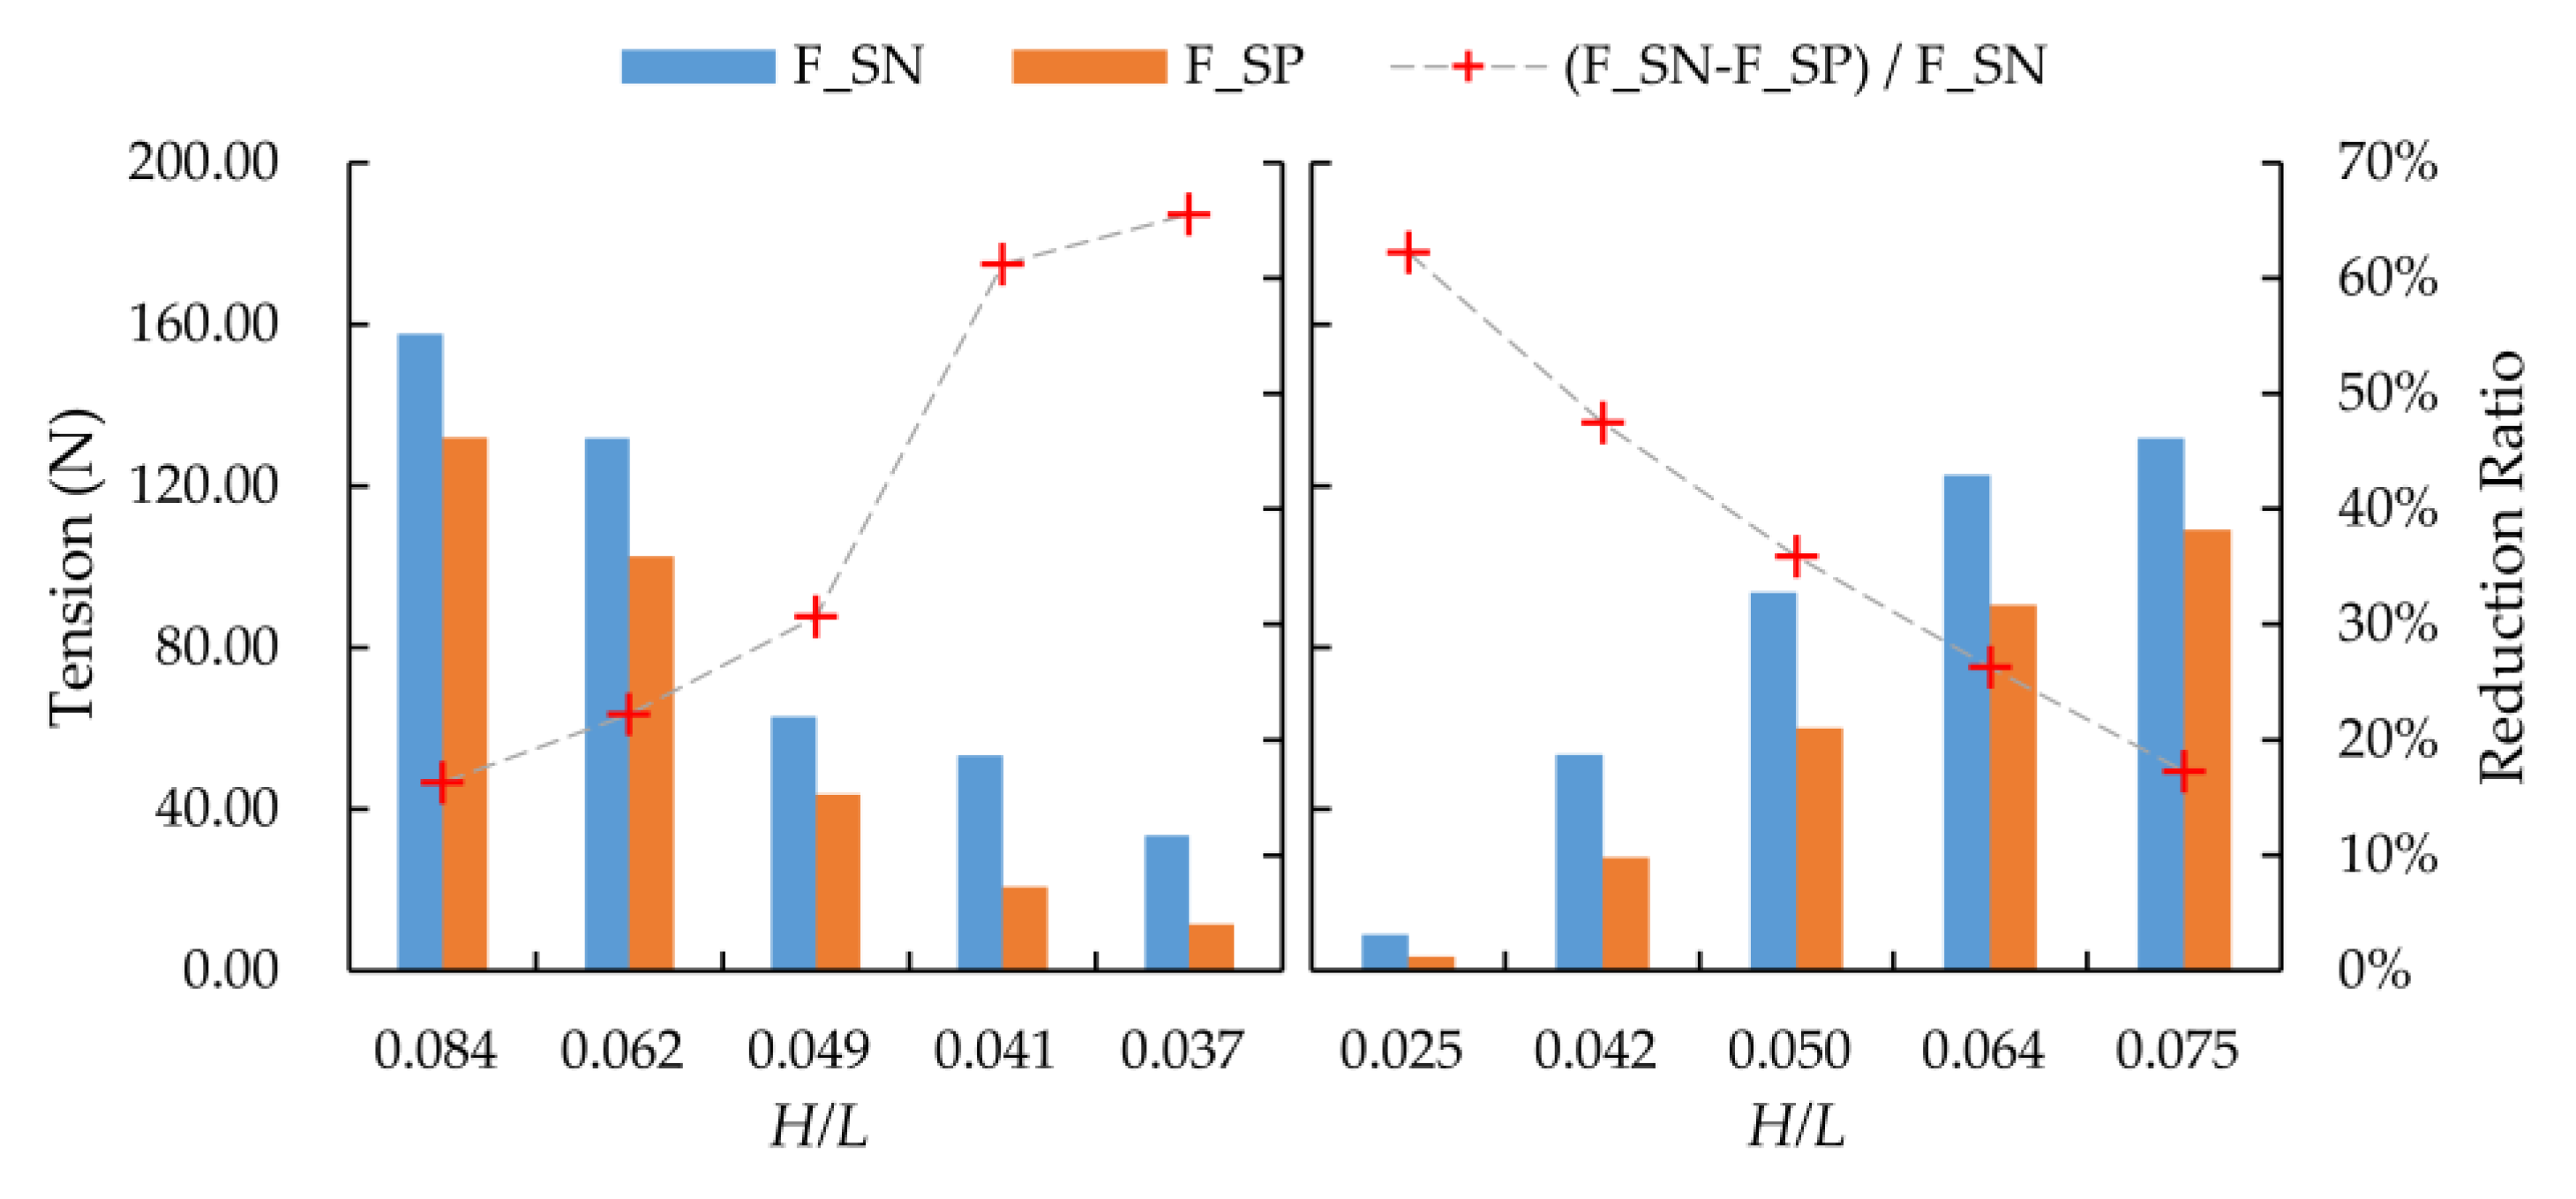
Figure 10 shows the maximum tensions of the upstream mooring line for a single-row PRAF under different wave periods and heights. Here,
and
are the maximum mooring line tension without and with a monopile, respectively. The results indicate that, regardless of the presence of the wind turbine monopile in the wave tank, the maximum mooring line tension decreases in the wave periods from 1.0 s to 1.4 s when the wave height is 0.1125 m (left side of Figure 10). When the wave period is 1.237 s, the maximum mooring line tension increases in wave height from 0.063 m to 0.188 m (right side of Figure 10). This trend is consistent with previous research findings [
19,
25]. When the wave period is 1.0 s and the wave height is 0.1125 m (Case 1), the wave steepness is at its maximum (
= 0.084), and with the largest maximum mooring line tension
of 157.67 N. These results are consistent with the phenomenon observed in most marine engineering structures: when wave steepness is higher, the stability decreases, and the impact force on the structure increases [
26,
27].
By comparing and analyzing the effects of the wind monopile on PRAF,
represents the reduction ratio of the maximum mooring line tension in the presence of the wind monopile relative to the condition without it. The results show that when the monopile is present, the maximum mooring line tension is decreased by 16% to 66%, and the reduction ratio increases as the wave steepness decreases. This effect is most pronounced when the wave steepness is 0.037. As a type of marine structure, the wind turbine monopile disrupts wave propagation, with wave diffraction and reflection being the main mechanisms of wave energy loss when waves encounter an obstacle. The likelihood and intensity of diffraction effects are closely related to the length scale ratio between the monopile diameter (
) and the wavelength (
: at small
ratios, flow separation is important while diffraction is minimal, whereas at large
ratios, diffraction becomes dominant and flow separation is less significant. de Leon et al., (2011) [
28] noted that the monopile creates a shadow zone downstream with lower significant wave height (
. Meanwhile, the interaction between waves and the monopile leads to a weakened and more confined oscillating flow in the vicinity of the monopile [
29]. These wave-structure interaction effects contribute to a reduction in mooring line tension compared to conditions without the monopile.
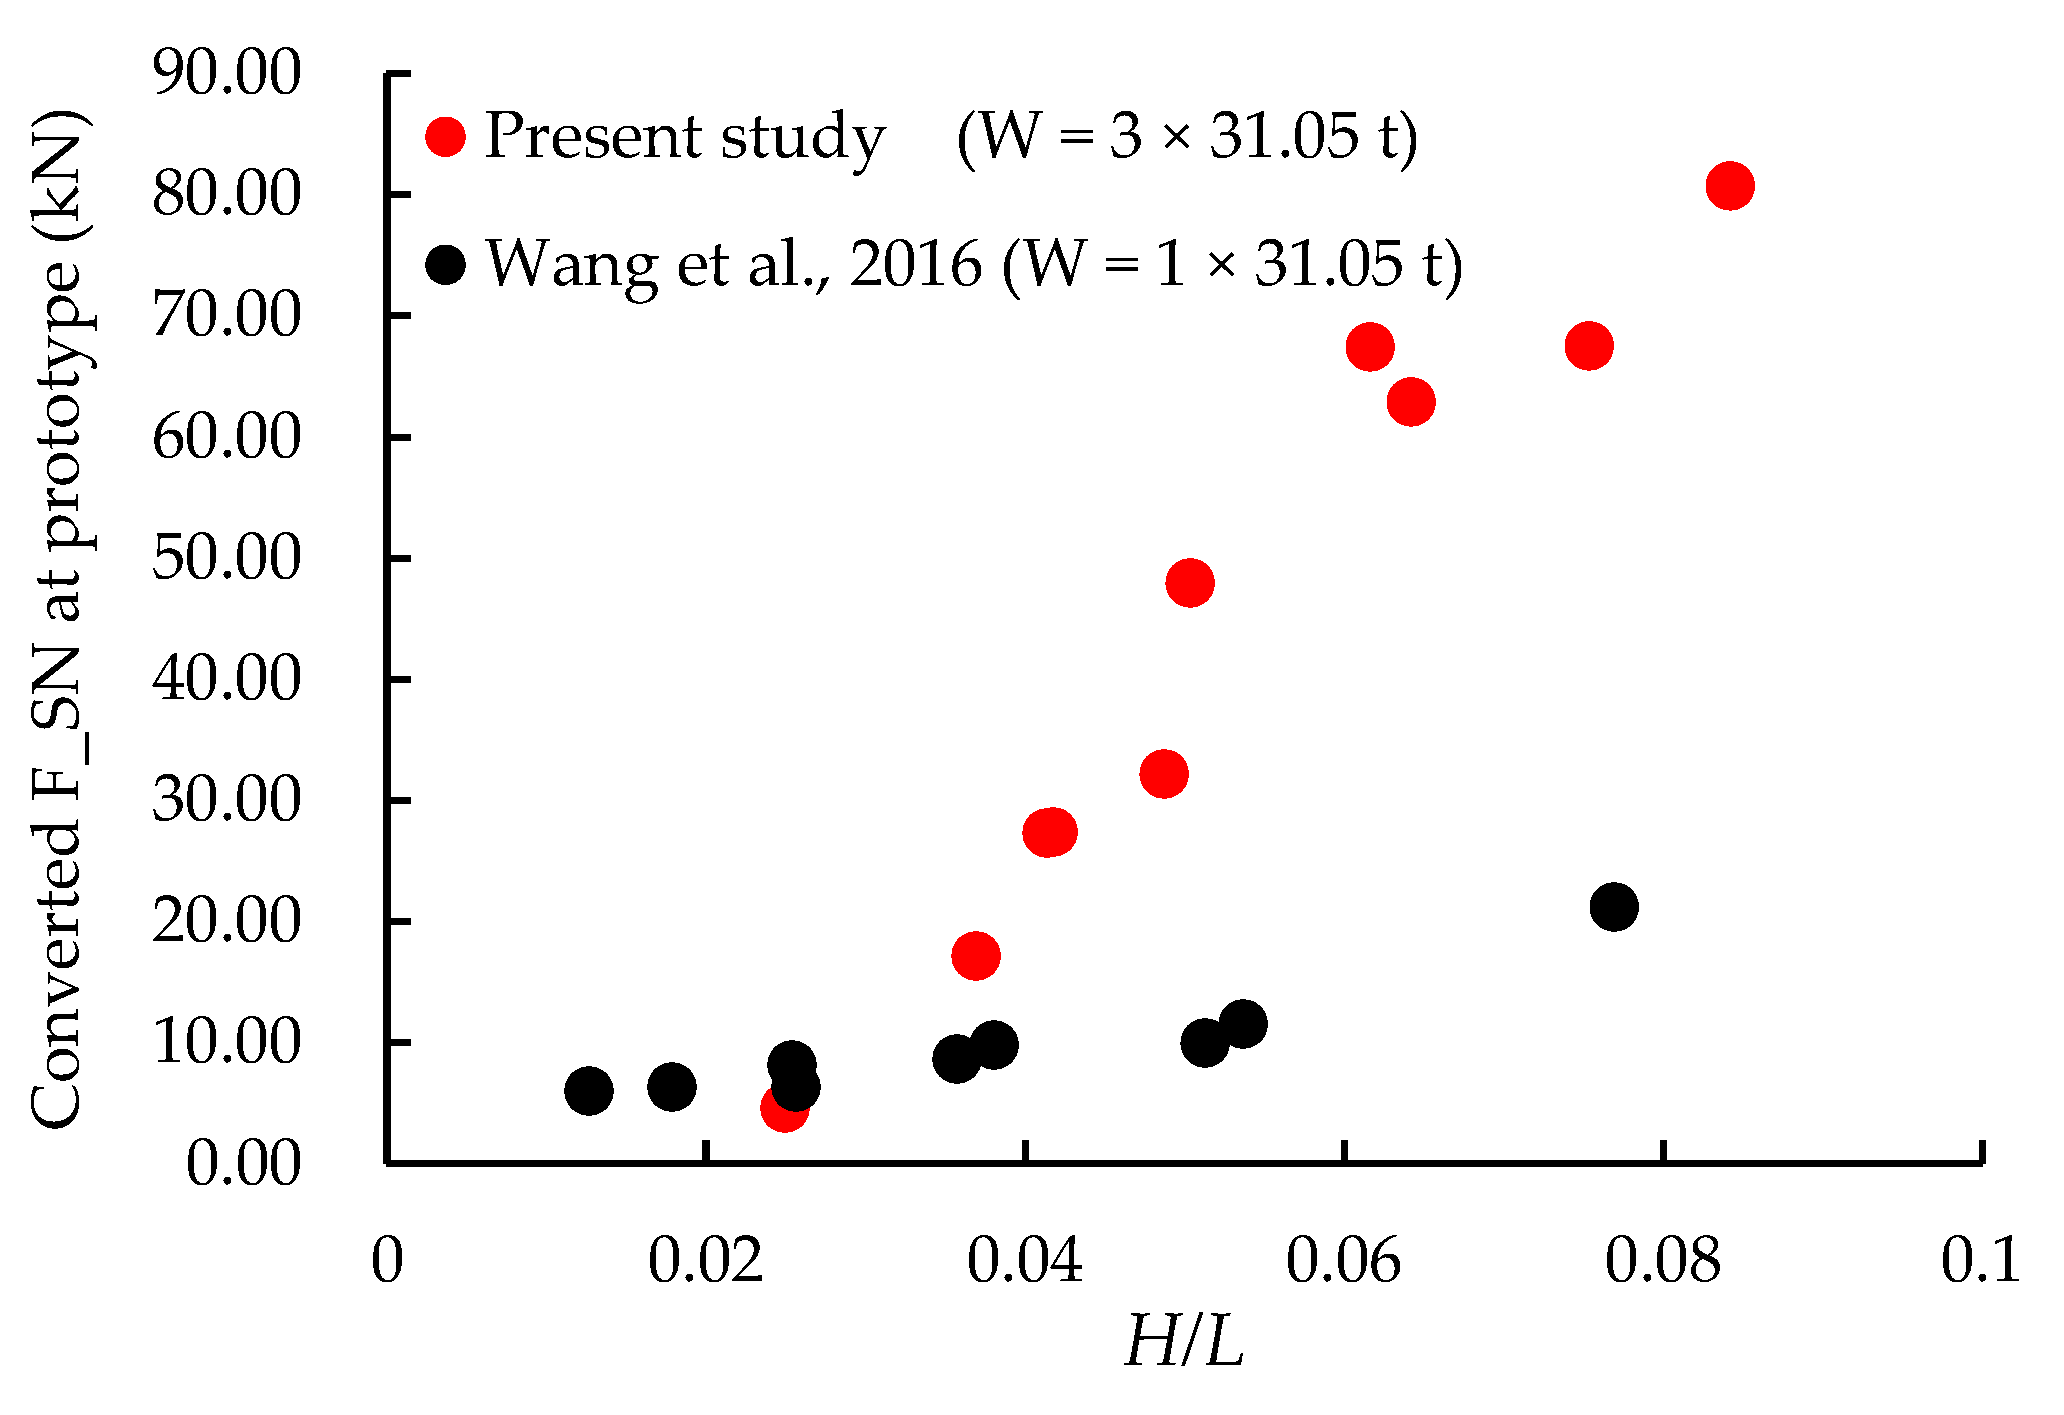
Using the measured tensions from the experimental model and applying a 1/512 scale ratio based on the Froude similarity, we converted the maximum tension values to the corresponding full-scale conditions for a single-row PRAF.
Figure 11 compares the converted
at full scale for a single-row PRAF with three rafts (each raft supports 31.05 t of mussel weight) with a raft facility described in [
25]. As wave steepness increases from 0.025 to 0.084, the maximum mooring line tension rises from 4.60 kN to 80.73 kN. This trend aligns with the numerical simulation results of a raft facility reported by Wang et al. (2015), where the maximum mooring line tension increases from 5.96 kN to 21.13 kN at wave steepness ranging from 0.013 to 0.077 [
25]. The consistency suggests that the relationship between wave steepness and mooring line tension is robust for different configurations, supporting both the validity of the present experimental setup and the importance of wave steepness as a key parameter in pontoon raft aquaculture systems [
27]. The comparison also indicates that the mooring line tension increases with the addition of each pontoon raft, yet not in a manner strictly proportional to the number of rafts. The increased tension suggests complex hydrodynamic interactions among the additional pontoons, which could amplify the structural loads beyond a simple summation effect. Moreover, Masoudi et al. (2024) have shown that the number of pontoons significantly affects diffraction wave amplitudes, with multi-pontoon structures improving breakwater efficiency by up to 45% within the same cross-sectional area [
30]. These findings highlight the importance of considering such interactions when designing multi-pontoon raft aquaculture systems.
4.1.2. The Maximum Mooring Line Tensions of the Three-Row PRAF Under Wave Conditions
Figure 12 compares the maximum tensions of the upstream mooring line for the outer (
) and the inner (
) raft facility in three-row PRAF. Similar to the single-row PRAF, when the wave height is 0.1125 m, the maximum mooring line tension decreases as the wave period increases from 1.0 s to 1.4 s. However, at the wave period of 1.237 s, the maximum mooring line tension increases in response to wave heights ranging from 0.063 m to 0.188 m. The comparison shows no significant difference between
and
, indicating that under these test conditions, whether the raft facility is located in the outer or inner position does not notably affect the mooring line tension. This finding suggests that PRAF in multi-row configuration may be equally exposed to wave impact under different wave conditions.
Moreover, it can be observed in Figure 12 that the maximum tensions of the upstream mooring line in the three-row configuration are generally smaller than those in the single-row configuration under the same wave conditions. This finding suggests that the multi-row PRAF can effectively reduce the impact of wave forces by altering wave propagation and promoting energy dissipation around these structures. The reduction in maximum mooring line tension for the three-row configuration can be attributed to the intensified energy dissipation resulting from interference among multiple rows of pontoons, which collectively scatter and dampen wave energy more effectively than a single-row arrangement. These results align with the work of Masoudi et al. (2024) and Li et al. (2022), who showed that the multi-row arrangement significantly reduces both wave energy and mooring loads compared to the single-row system [
30,
31]. Furthermore, the presence of multiple rows of pontoons may create constructive and destructive interference patterns within the wave field, thereby reducing the overall force acting on individual mooring lines.
Compared with the single-row setup, the multi-row configuration distributes hydrodynamic loads more evenly, reducing the concentration of forces on individual mooring lines and enhancing overall system stability. By lowering mooring line tension, multi-row arrangement underscores the importance of optimizing pontoon raft layouts to improve wave attenuation performance. Moreover, the multi-row configuration provides greater stability across a range of wave conditions and mitigates wave-induced loads effectively, contributing to the long-term sustainability and safety of offshore aquaculture facilities. In future work, we will continue to conduct both experimental and numerical studies to explore how different spacing arrangements affect multi-row setups. These findings will ultimately provide practical guidance for the spatial layout of multi-row raft aquaculture in offshore wind farms.
4.2. Bridle Line Tensions of PRAF
The combination of raft aquaculture facilities offers several advantages, including enhanced comprehensive utilization of aquaculture waters, reduced equipment investment costs, and improved feasibility for large-scale management. In addition to the mooring lines, the connecting lines between individual rafts within PRAF are also subjected to hydrodynamic loads. This section presents the variation in bridle line tensions for both single-row PRAF (e.g.,) and three-row PRAF (e.g., ).
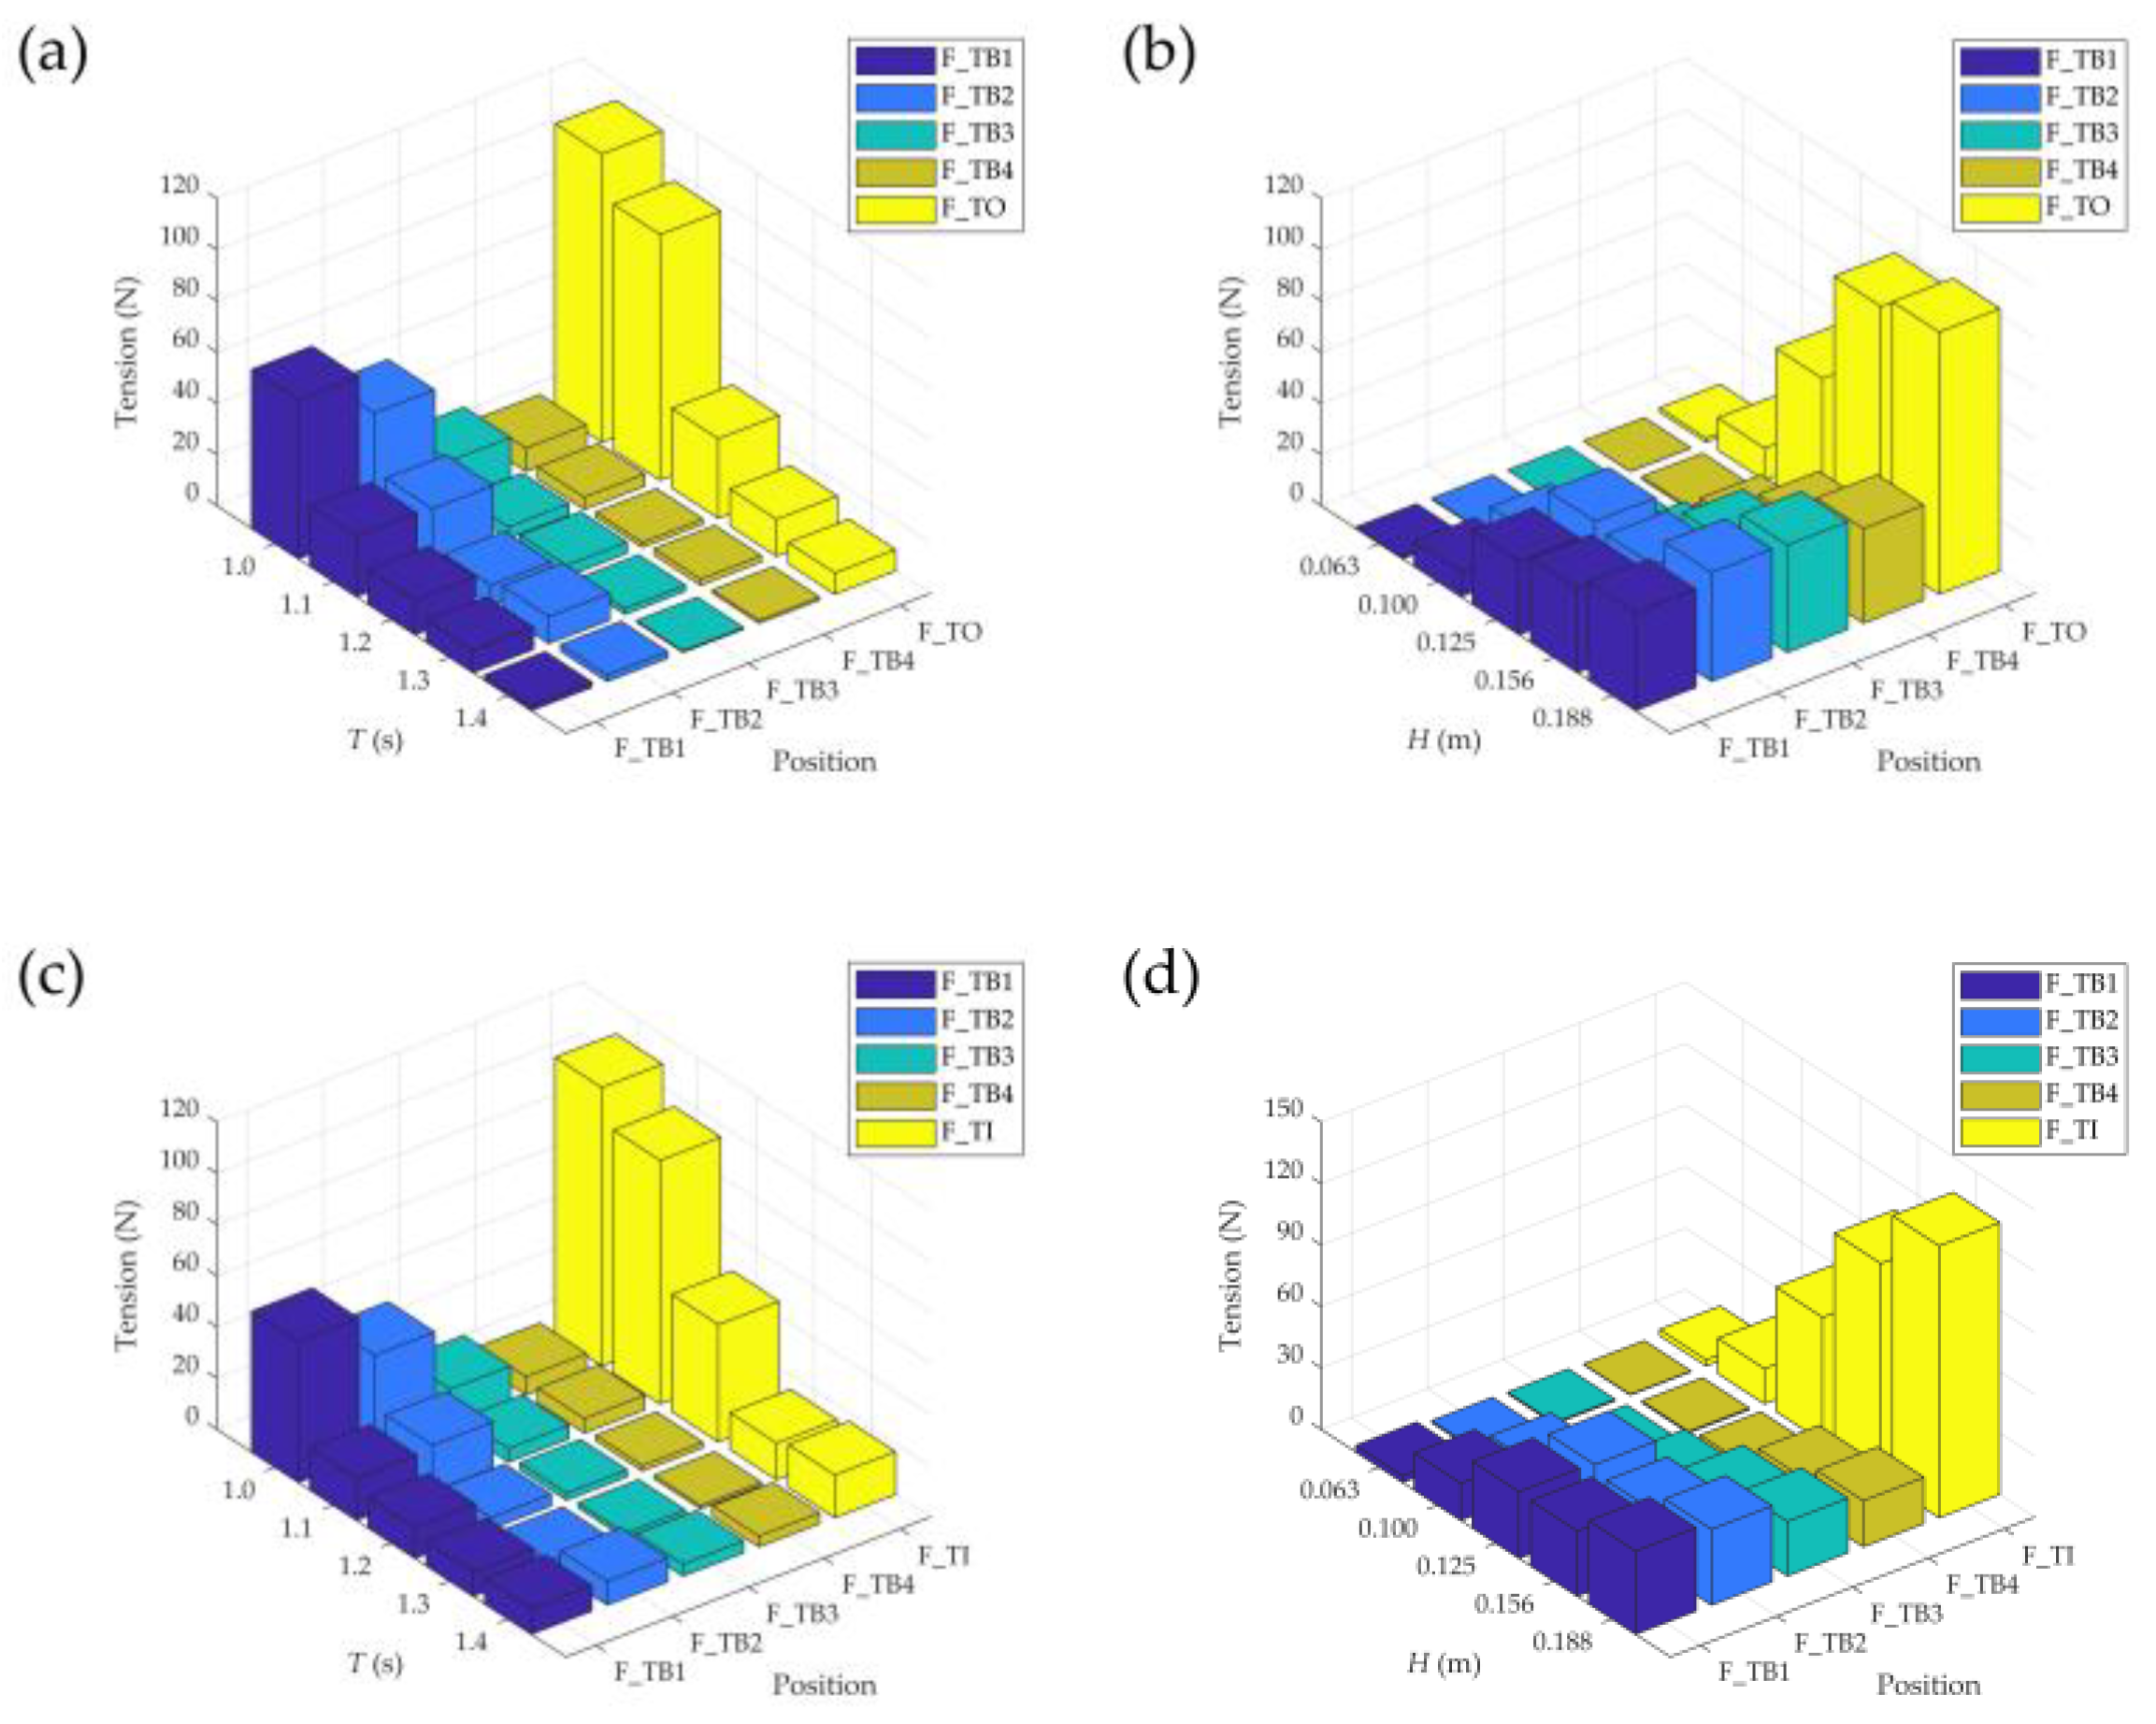
4.2.1. The maximum bridle line tensions of the single-row PRAF under wave conditions
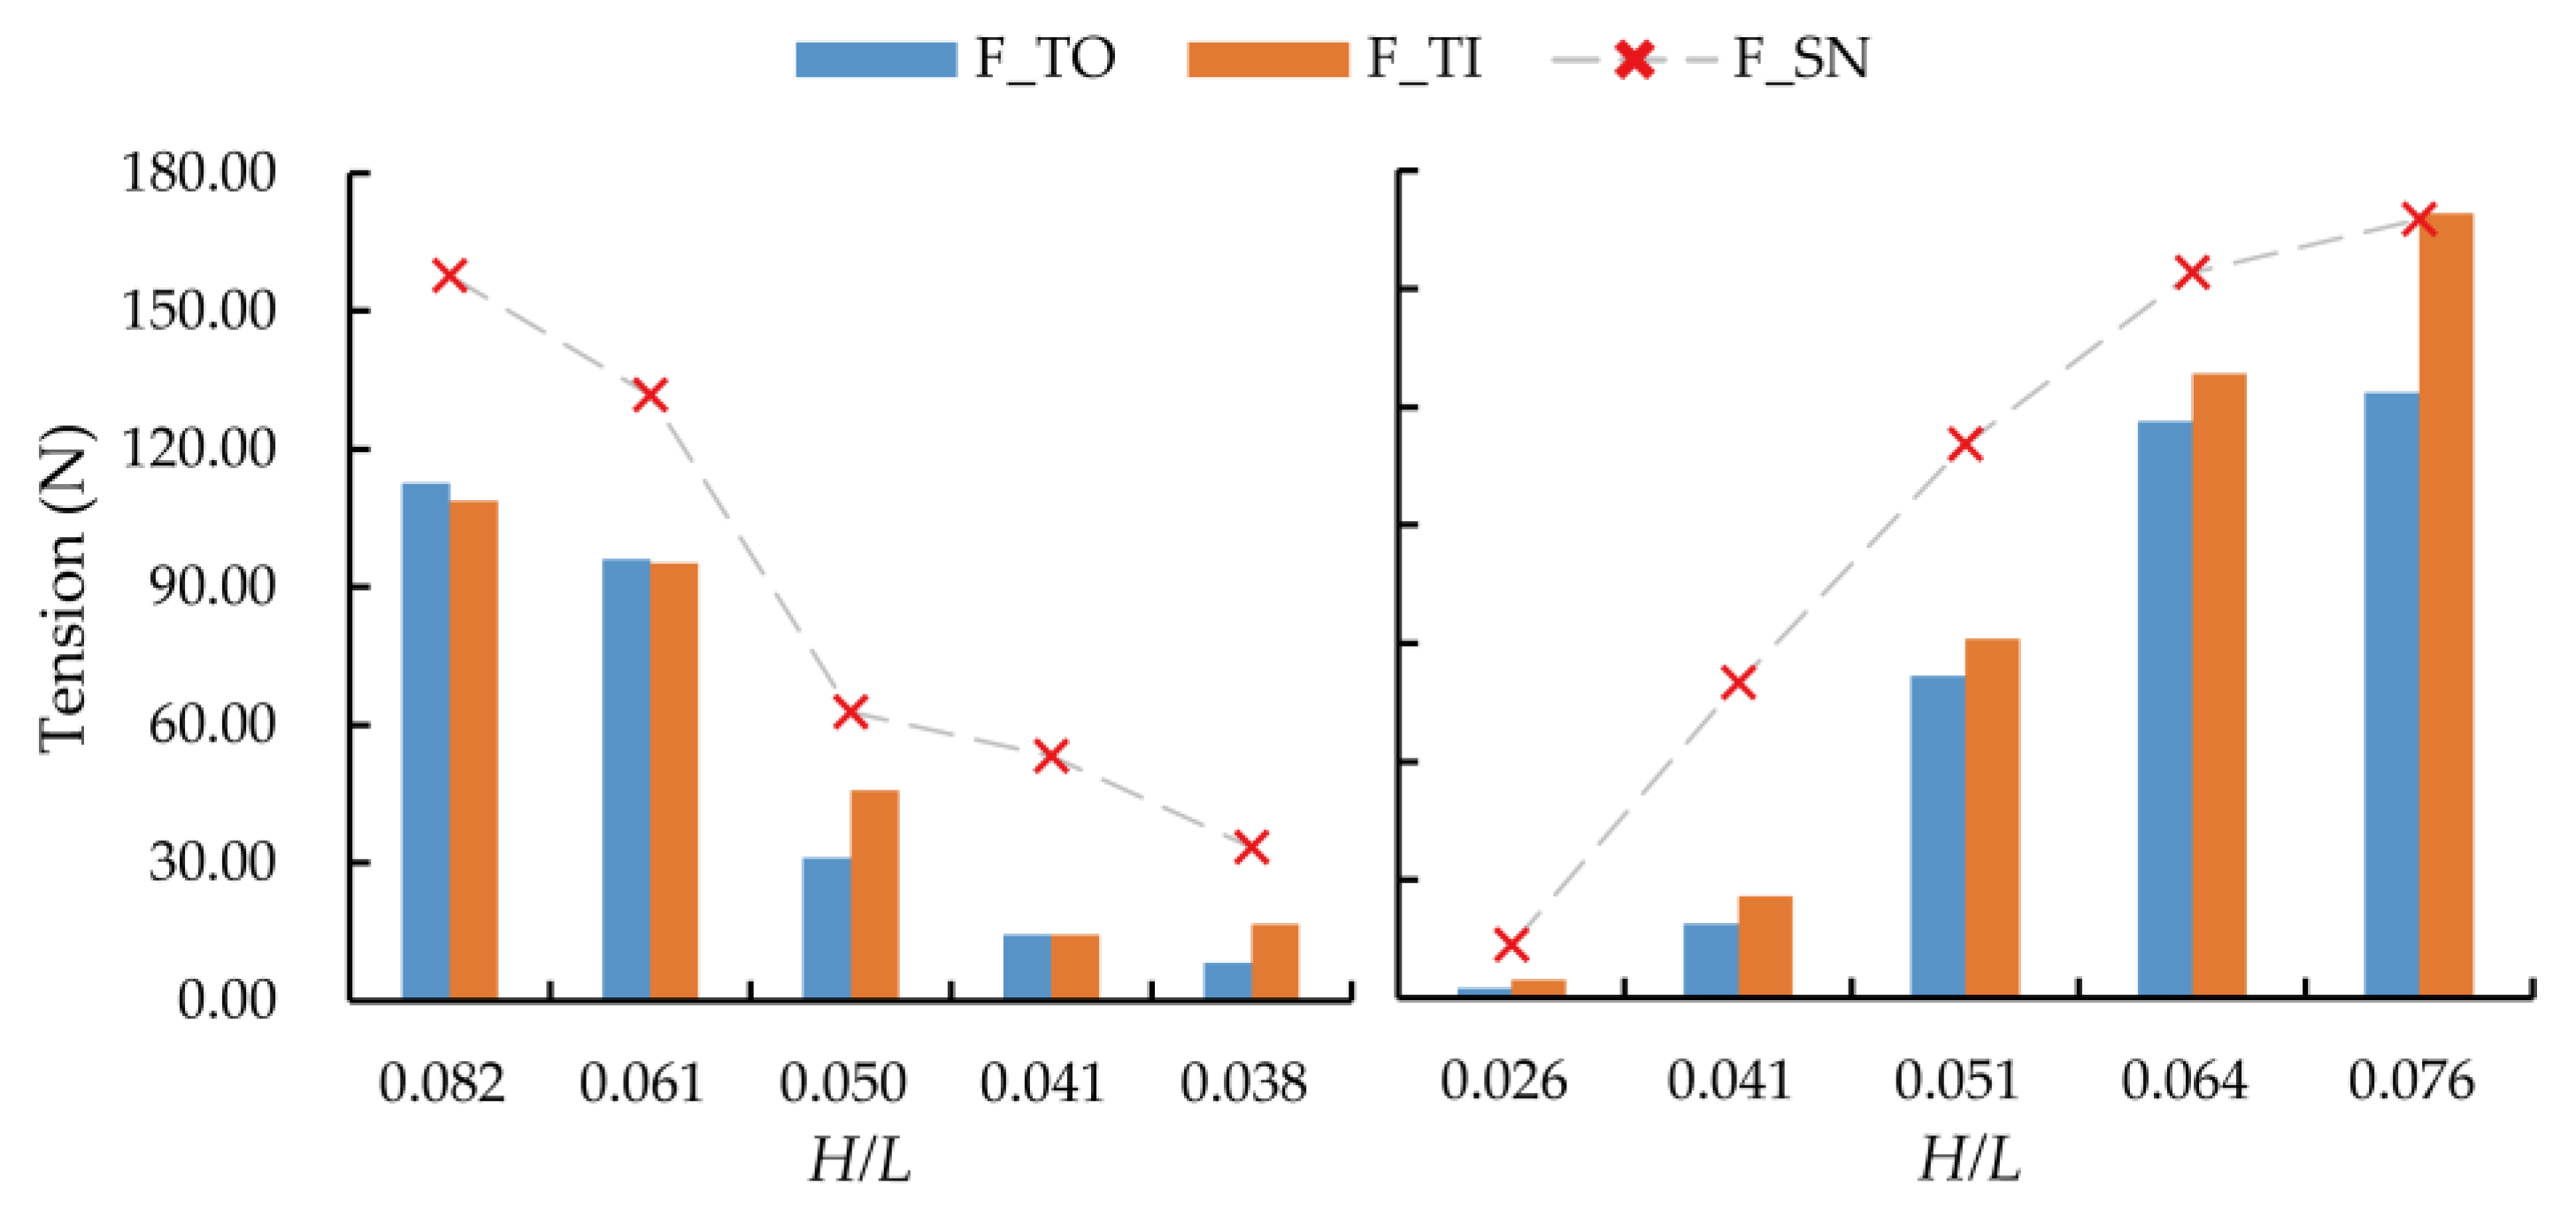
Figure 13 shows the relationship between the bridle line tensions
and wave steepness under different wave conditions, with and without the presence of a wind monopile. Similar to the mooring line tension, the bridle line tension increases as the wave steepness increases. The bridle line tensions have maximums when the wave steepness gets to the value near 0.08. The maximum values of
are 50.42 N, 48.75 N, 64.06 N, and 58.48 N, respectively. It should be noted that the maximum values of
and
occur with the monopile, while the maximum values of
and
occur without the monopile.
Figure 13a,b show that the presence of a monopile increases the bridle line tensions
and
with rising wave steepness, exhibiting similar sensitivities to both wave height and wave period. In contrast, Figure 13c,d show the presence of a monopile weakens the tensions
and
, and that these tensions are more responsive to changes in wave height than to wave period. This outcome aligns with the understanding that wave height primarily affects the maximum force amplitude, whereas wave period plays a larger role in determining force distribution. Consequently, the increase in wave height leads to a noticeable rise in the maximum bridle line tension. Furthermore,
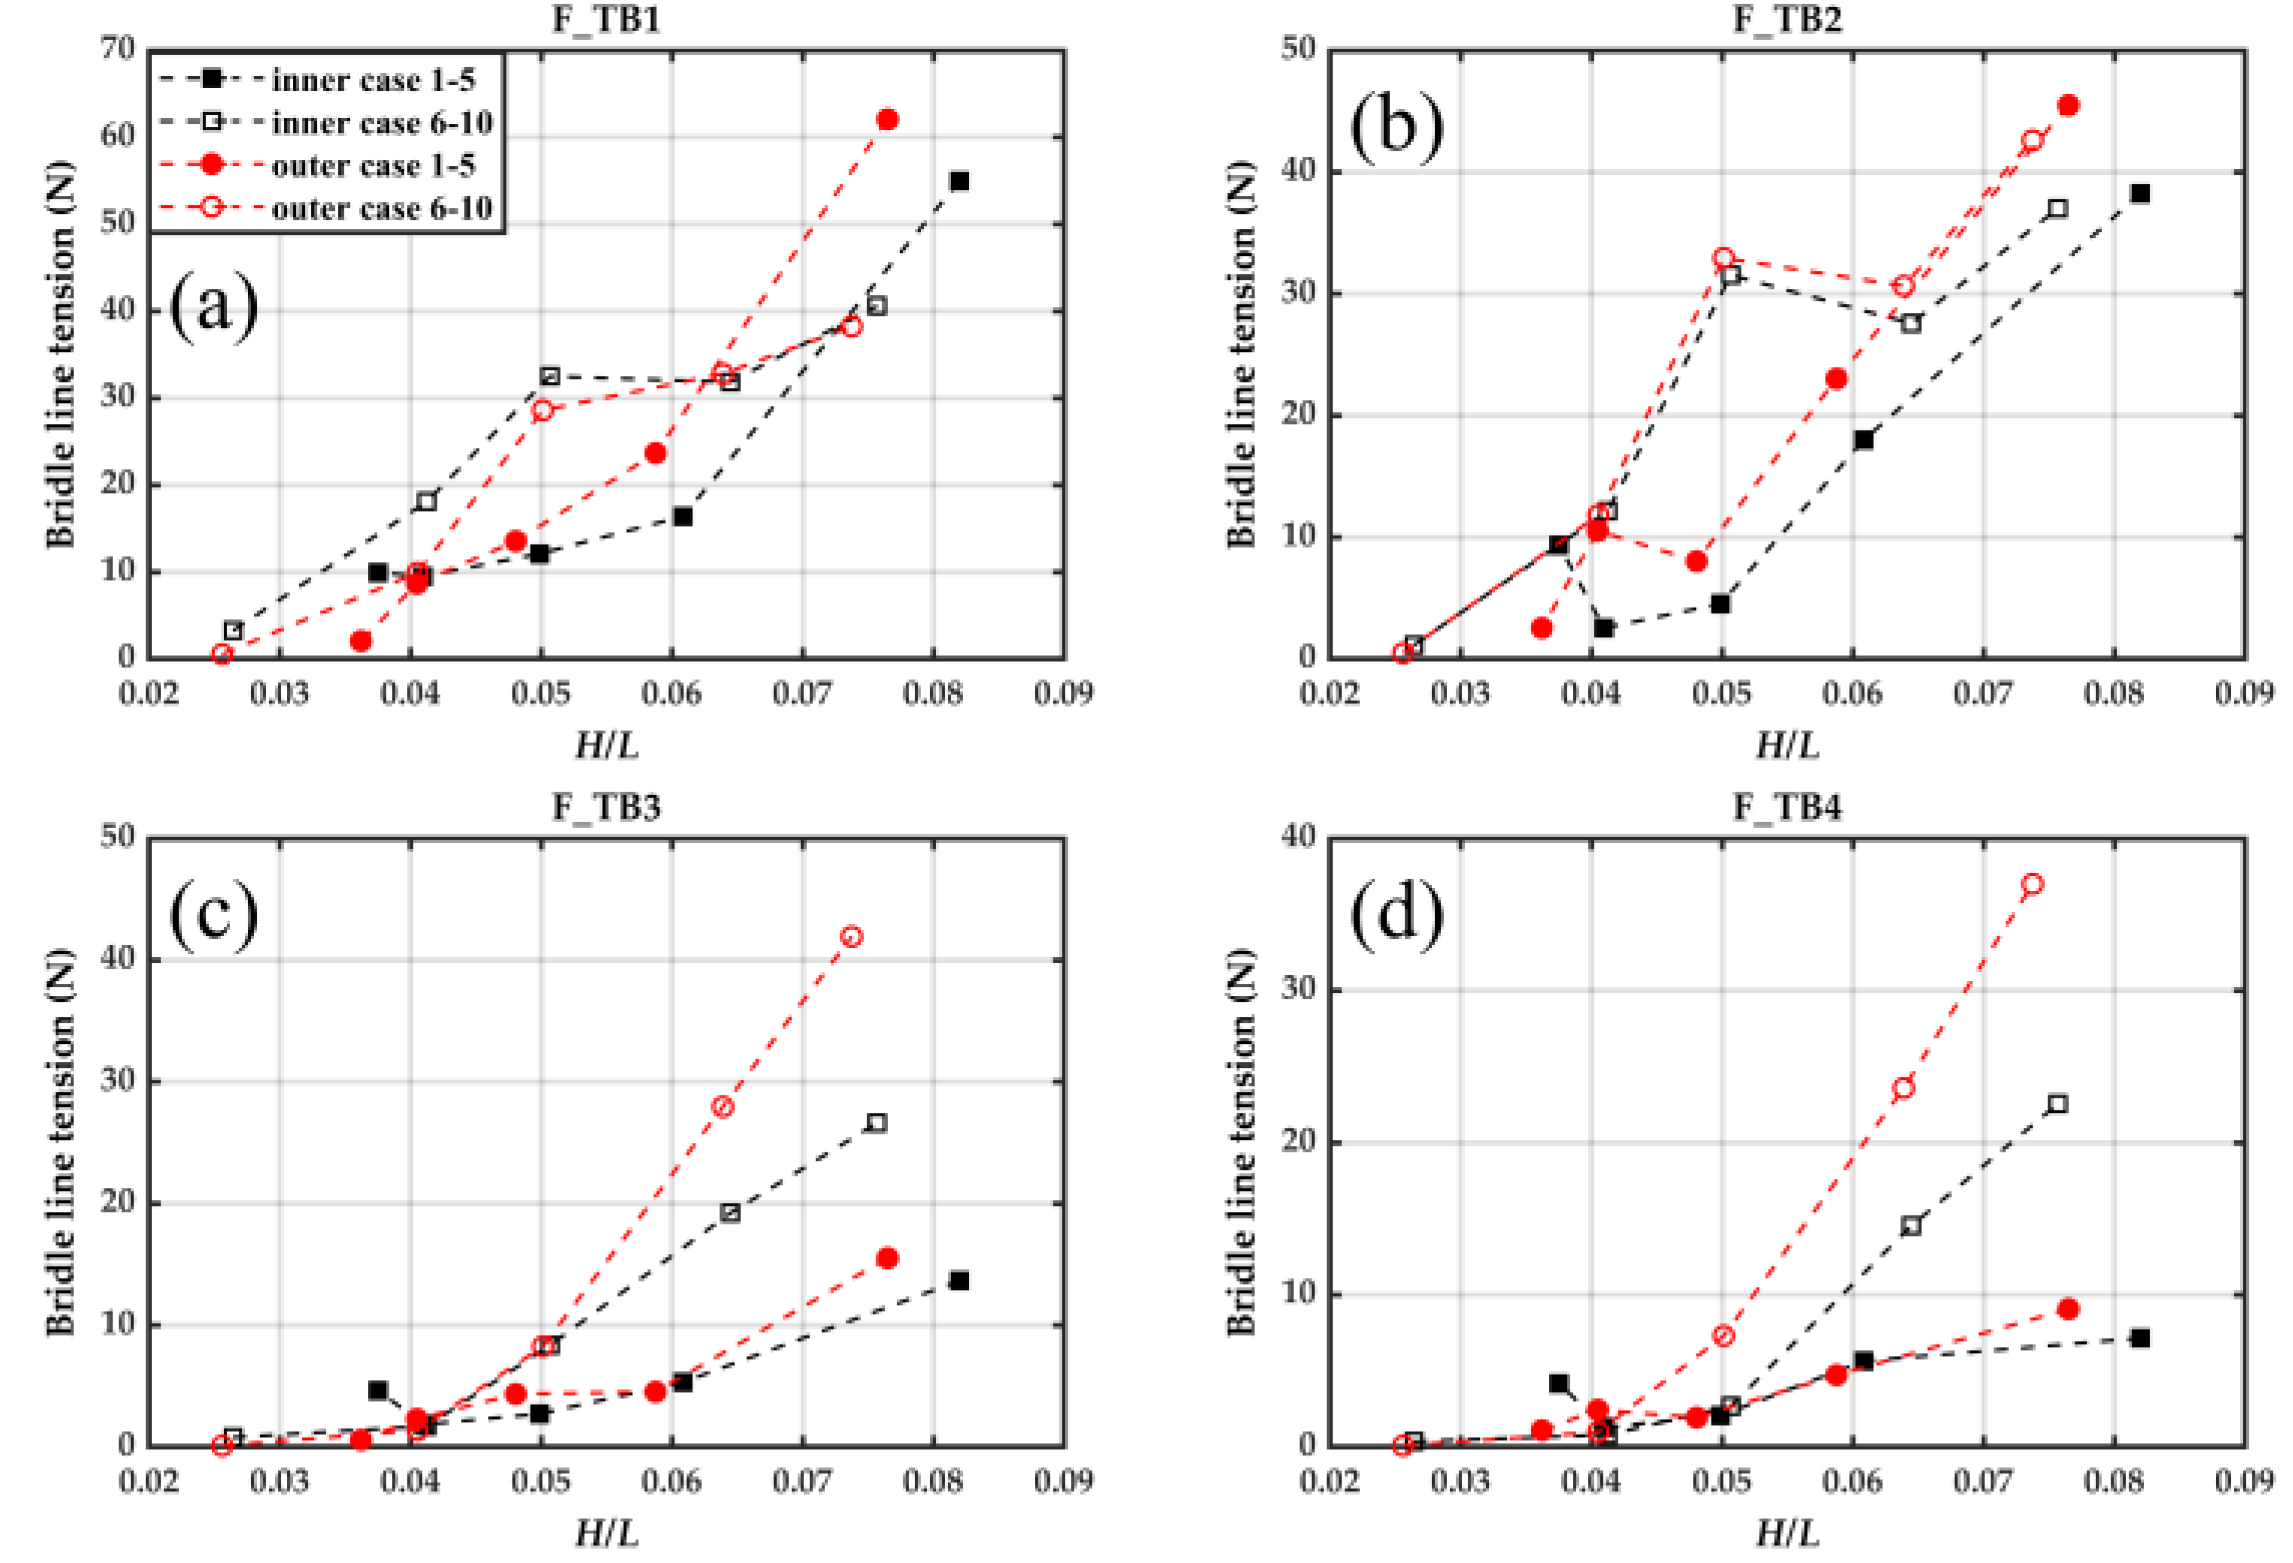
Figure 14a,c also demonstrate that, in the presence of the monopile,
and
exceed
and
across Case 1–5. This is precisely the opposite of the situation without the monopile. The difference between
and
can be attributed to the distinct positions of the connecting lines within the raft system. The monopile alters the surrounding wave field, particularly the upstream region of the raft facilities, thereby intensifying the hydrodynamic loads on the upstream bridle lines closest to it. Miles et al. (2017) found oscillatory velocities decrease immediately behind the pile, but recover even exceed background levels rapidly within a distance of approximately 1.65 to 3.5 times the pile diameter [
32]. Consequently, the first raft in the wave propagation direction (located 3.15 m from the monopile centre, i.e., beyond 3.5 times the diameter of the pile) experiences greater wave forces than in the no-monopile scenario, while consuming more wave energy and thus exposing subsequent rafts to lower significant wave heights (
). This phenomenon underlies the marked differences in
and
between the monopile and no-monopile configurations. In the future, further research is required to investigate the effects of the geometric parameters of the monopile, wave characteristics, and other factors on the hydrodynamic performance. This will facilitate a more comprehensive understanding and enable improved prediction of the hydrodynamic responses of raft aquaculture facilities in offshore wind farms.
Figure 14 also presents the mooring line tensions and bridle line tensions for a single-row PRAF under different wave conditions with and without monopile.
are generally lower than
or
, and mooring line tension increase with decreasing wave period or increasing wave height more rapidly than bridle line tension. The above results are contrary to the study findings by Martinelli et al. (2008) on the forces along moorings and connectors of floating breakwaters [
33]. This is because in this study the initial tension is 0 N in both the mooring line and bridle line, and the mooring line is closer to the incident wave. For mooring line and bridle line tensions, their maximum values are not synchronized due to the phase differences between rafts. The mooring line tensions depend mainly on the incident wave. As for internal forces between the rafts, the brindle line tensions are influenced by numerous factors, which make them particularly complex to analyze. First,
and
represent the connecting line forces of two adjacent rafts, respectively. The two rafts are in different motions at any time and thus correspond to different states of tautness of the connecting lines. Second, wave energy is consumed when waves act on the mussel ropes and pontoons (wave impact and wave reflection), which leads to disparate hydrodynamic loads on rafts with wave propagation. Liao (2017) analyzed the hydrodynamic characteristics of different combinations of floating raft structures under the influence of regular waves, and the results suggested that combined raft structures can significantly reduce the mooring force in submerged conditions. Based on the wave factor alone, the combined raft structure is preferable to the single raft structure if the ropes of the system are strong enough [
34].
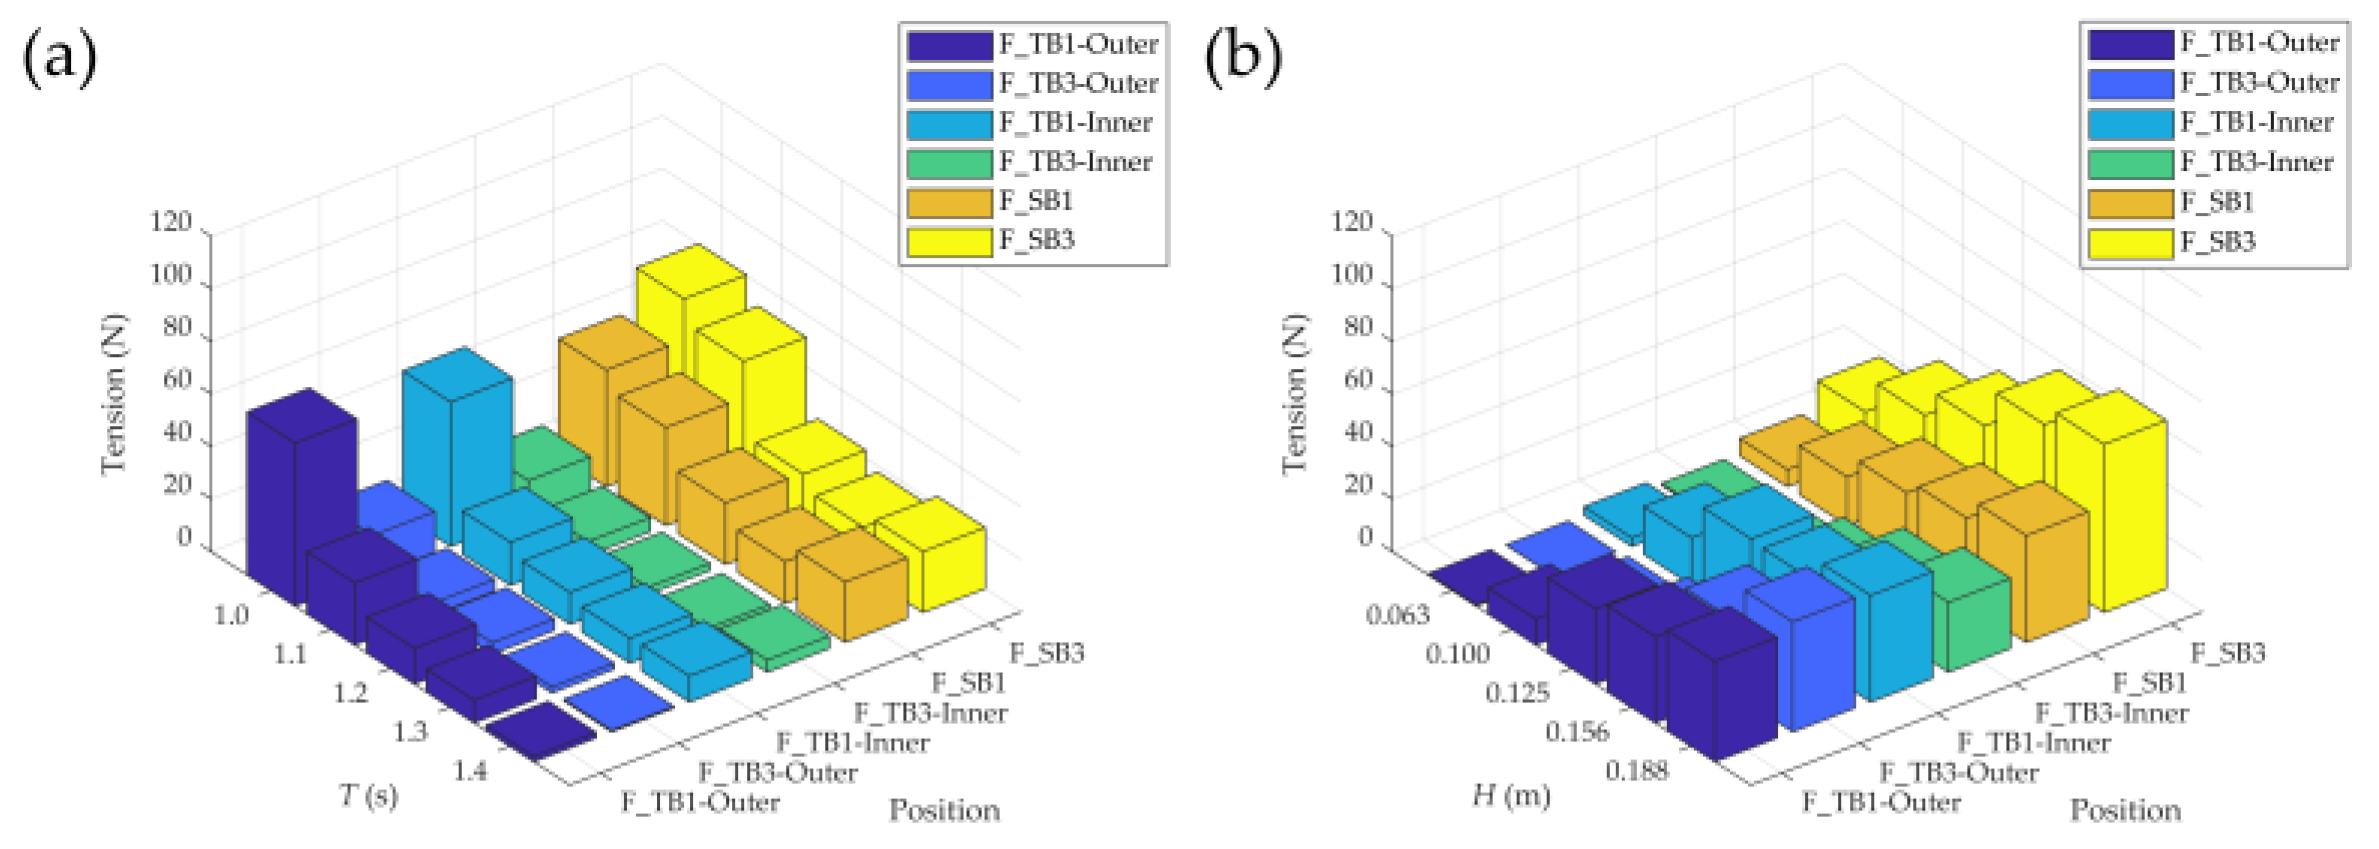
4.2.2. The Maximum Bridle Line Tensions of the Three-Row PRAF Under Wave Conditions
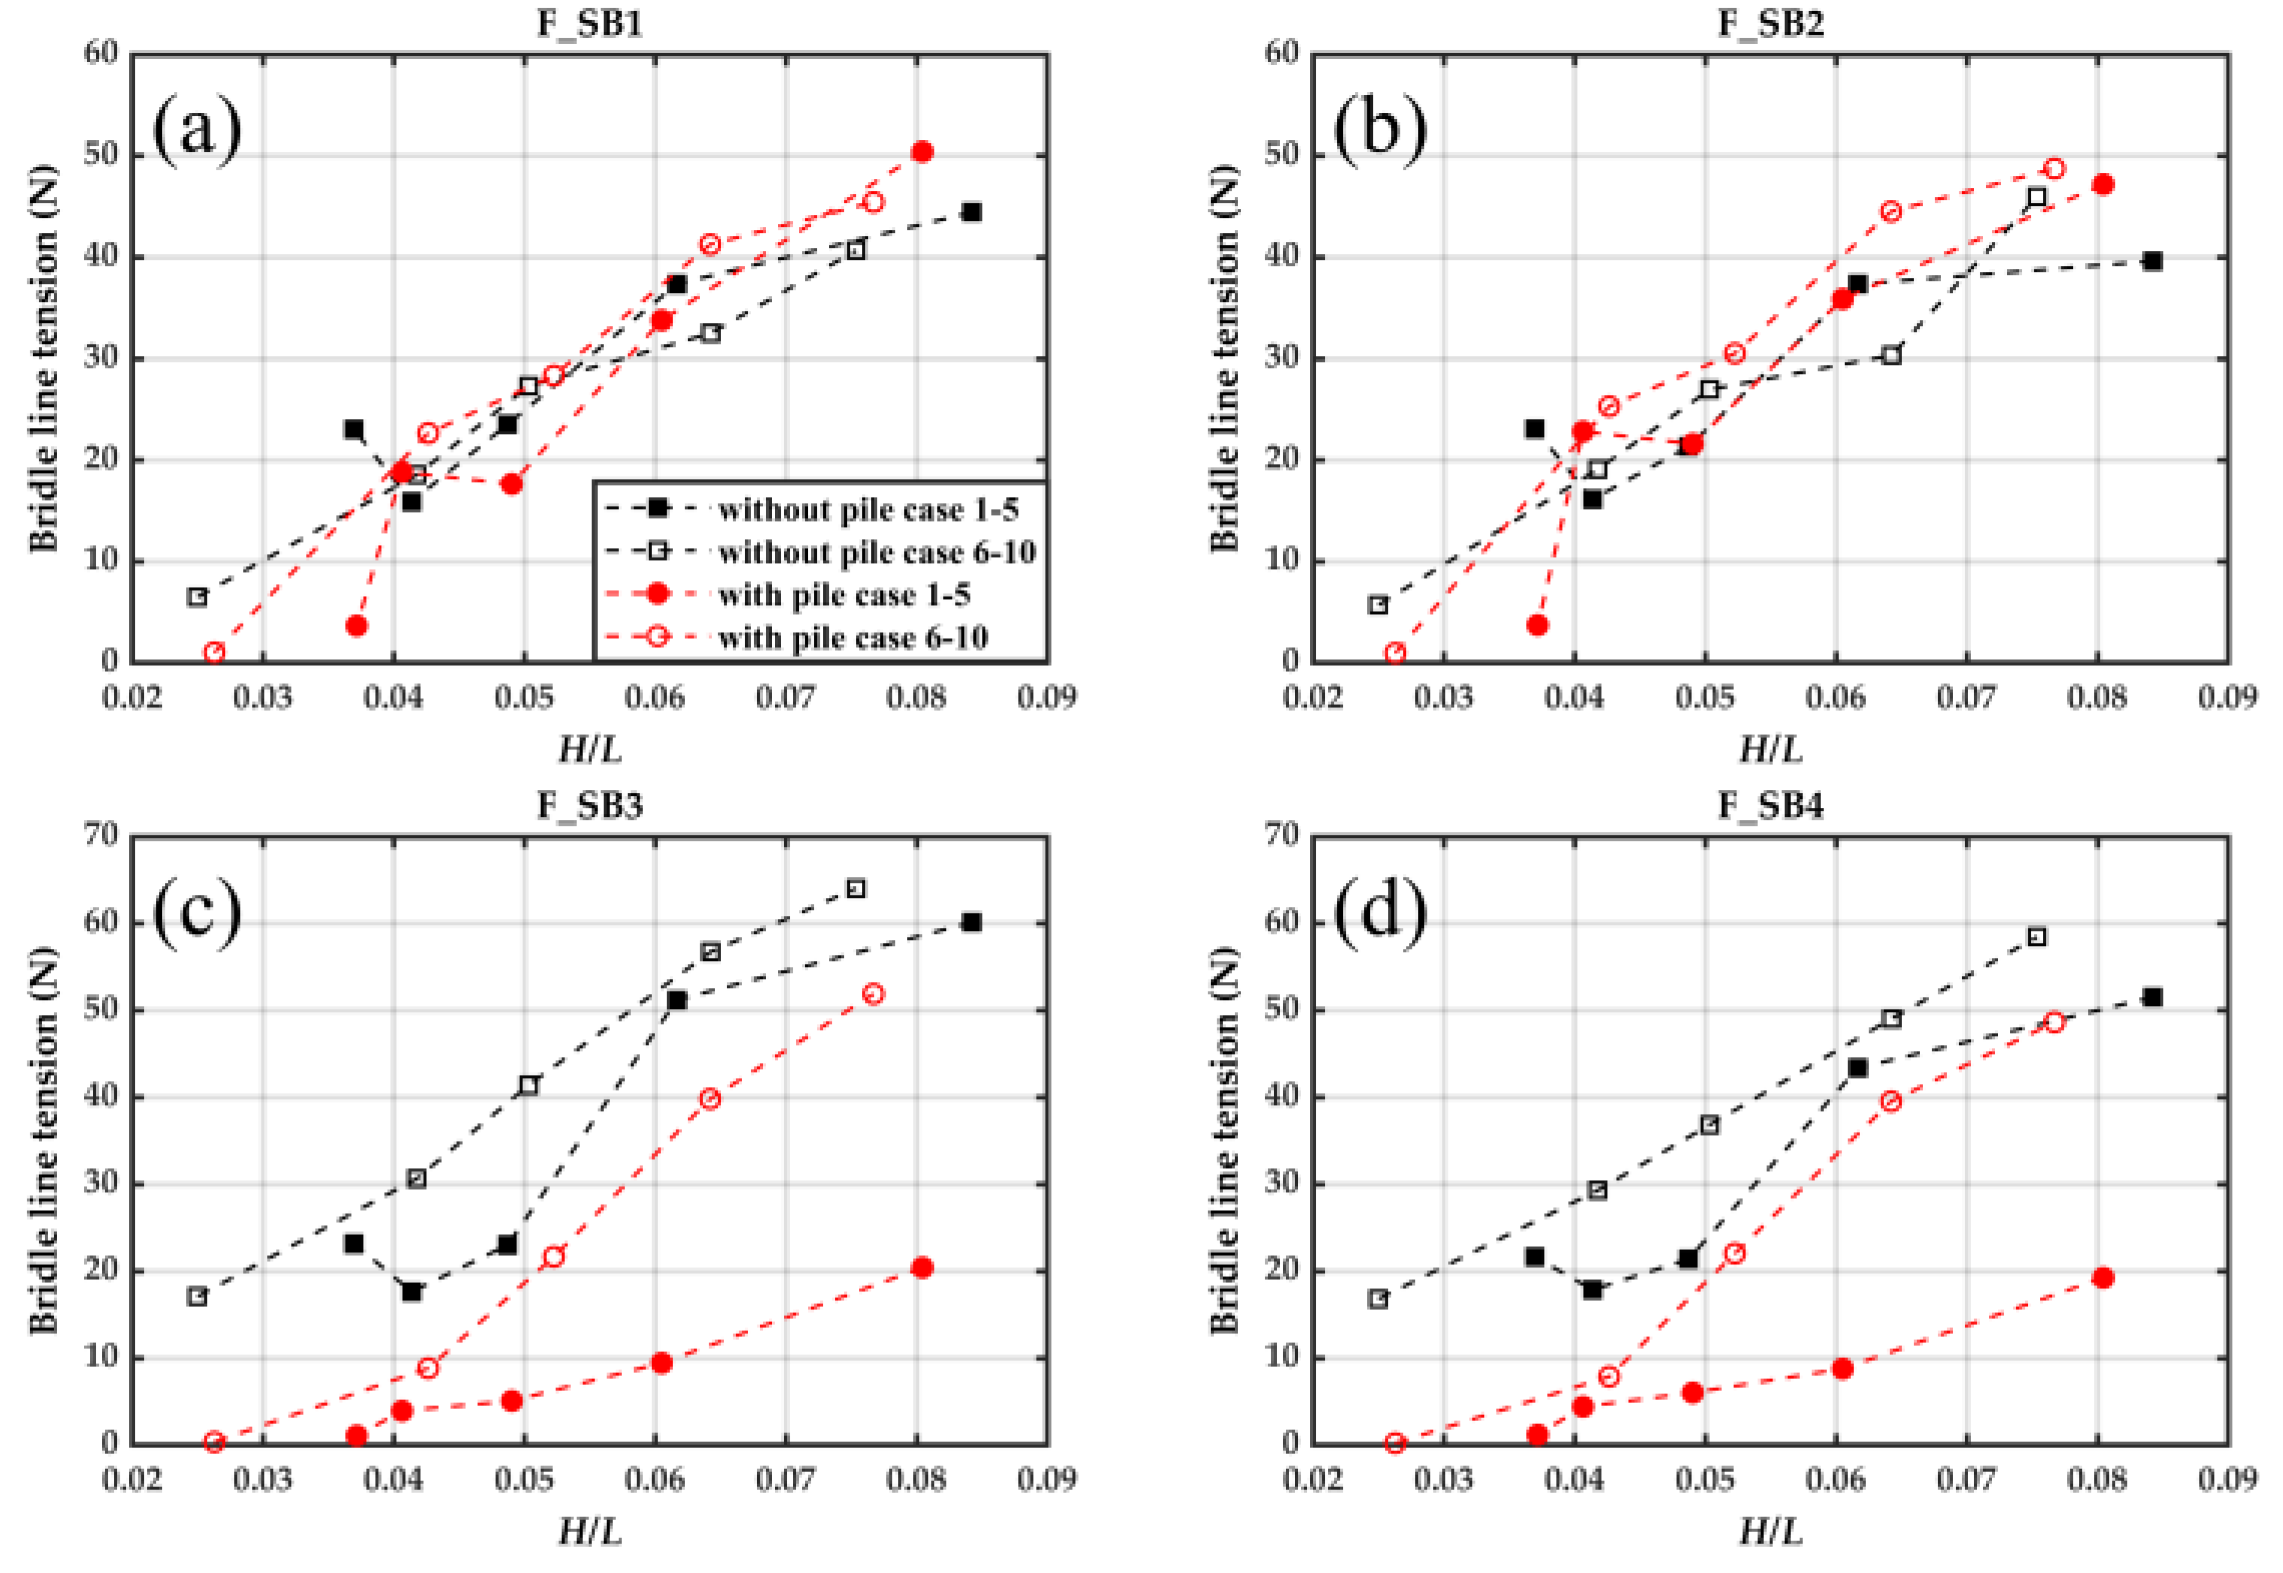
Figure 15 shows the effects of different wave periods and wave heights on the bridle line tensions
, including the outer structure and inner structure of the three-row PRAF.
tend to increase with increasing wave steepness. As wave steepness approaches 0.08,
have the maximum values of 62.09 N, 45.51 N, 41.94 N and 37.01 N, respectively. Figure 15a,b indicate that
and
of the outer structure are slowly higher than those of the inner structure with rising wave steepness. The sensitivities of
and
to wave height and wave period are not obvious.
Figure 15c,d indicate that
and
of the outer structure are notably greater than
and
of the inner structure with increasing wave steepness, and the sensitivities of
to changes in wave height are stronger than in wave period.
In the three-row PRAF, significant interactions among the structures are observed. The bridle line tension results suggest that the inner structure exhibits greater stability under varying wave conditions. This can likely be attributed to the redistribution of the wave field after waves encounter the raft system. The inner structure is subjected to converging diffracted waves from opposite directions along both sides of the outer structures, leading to partial wave energy cancellation. As a result, the inner structure experiences reduced hydrodynamic loads compared to the outer structure. Notably, this effect becomes more pronounced as the wave intensity increases, further reducing the bridle line tensions in the inner structure relative to the outer structure. These findings highlight the importance of wave interference and energy dissipation in multi-row configuration, which inspires spatial deployment of offshore aquaculture.
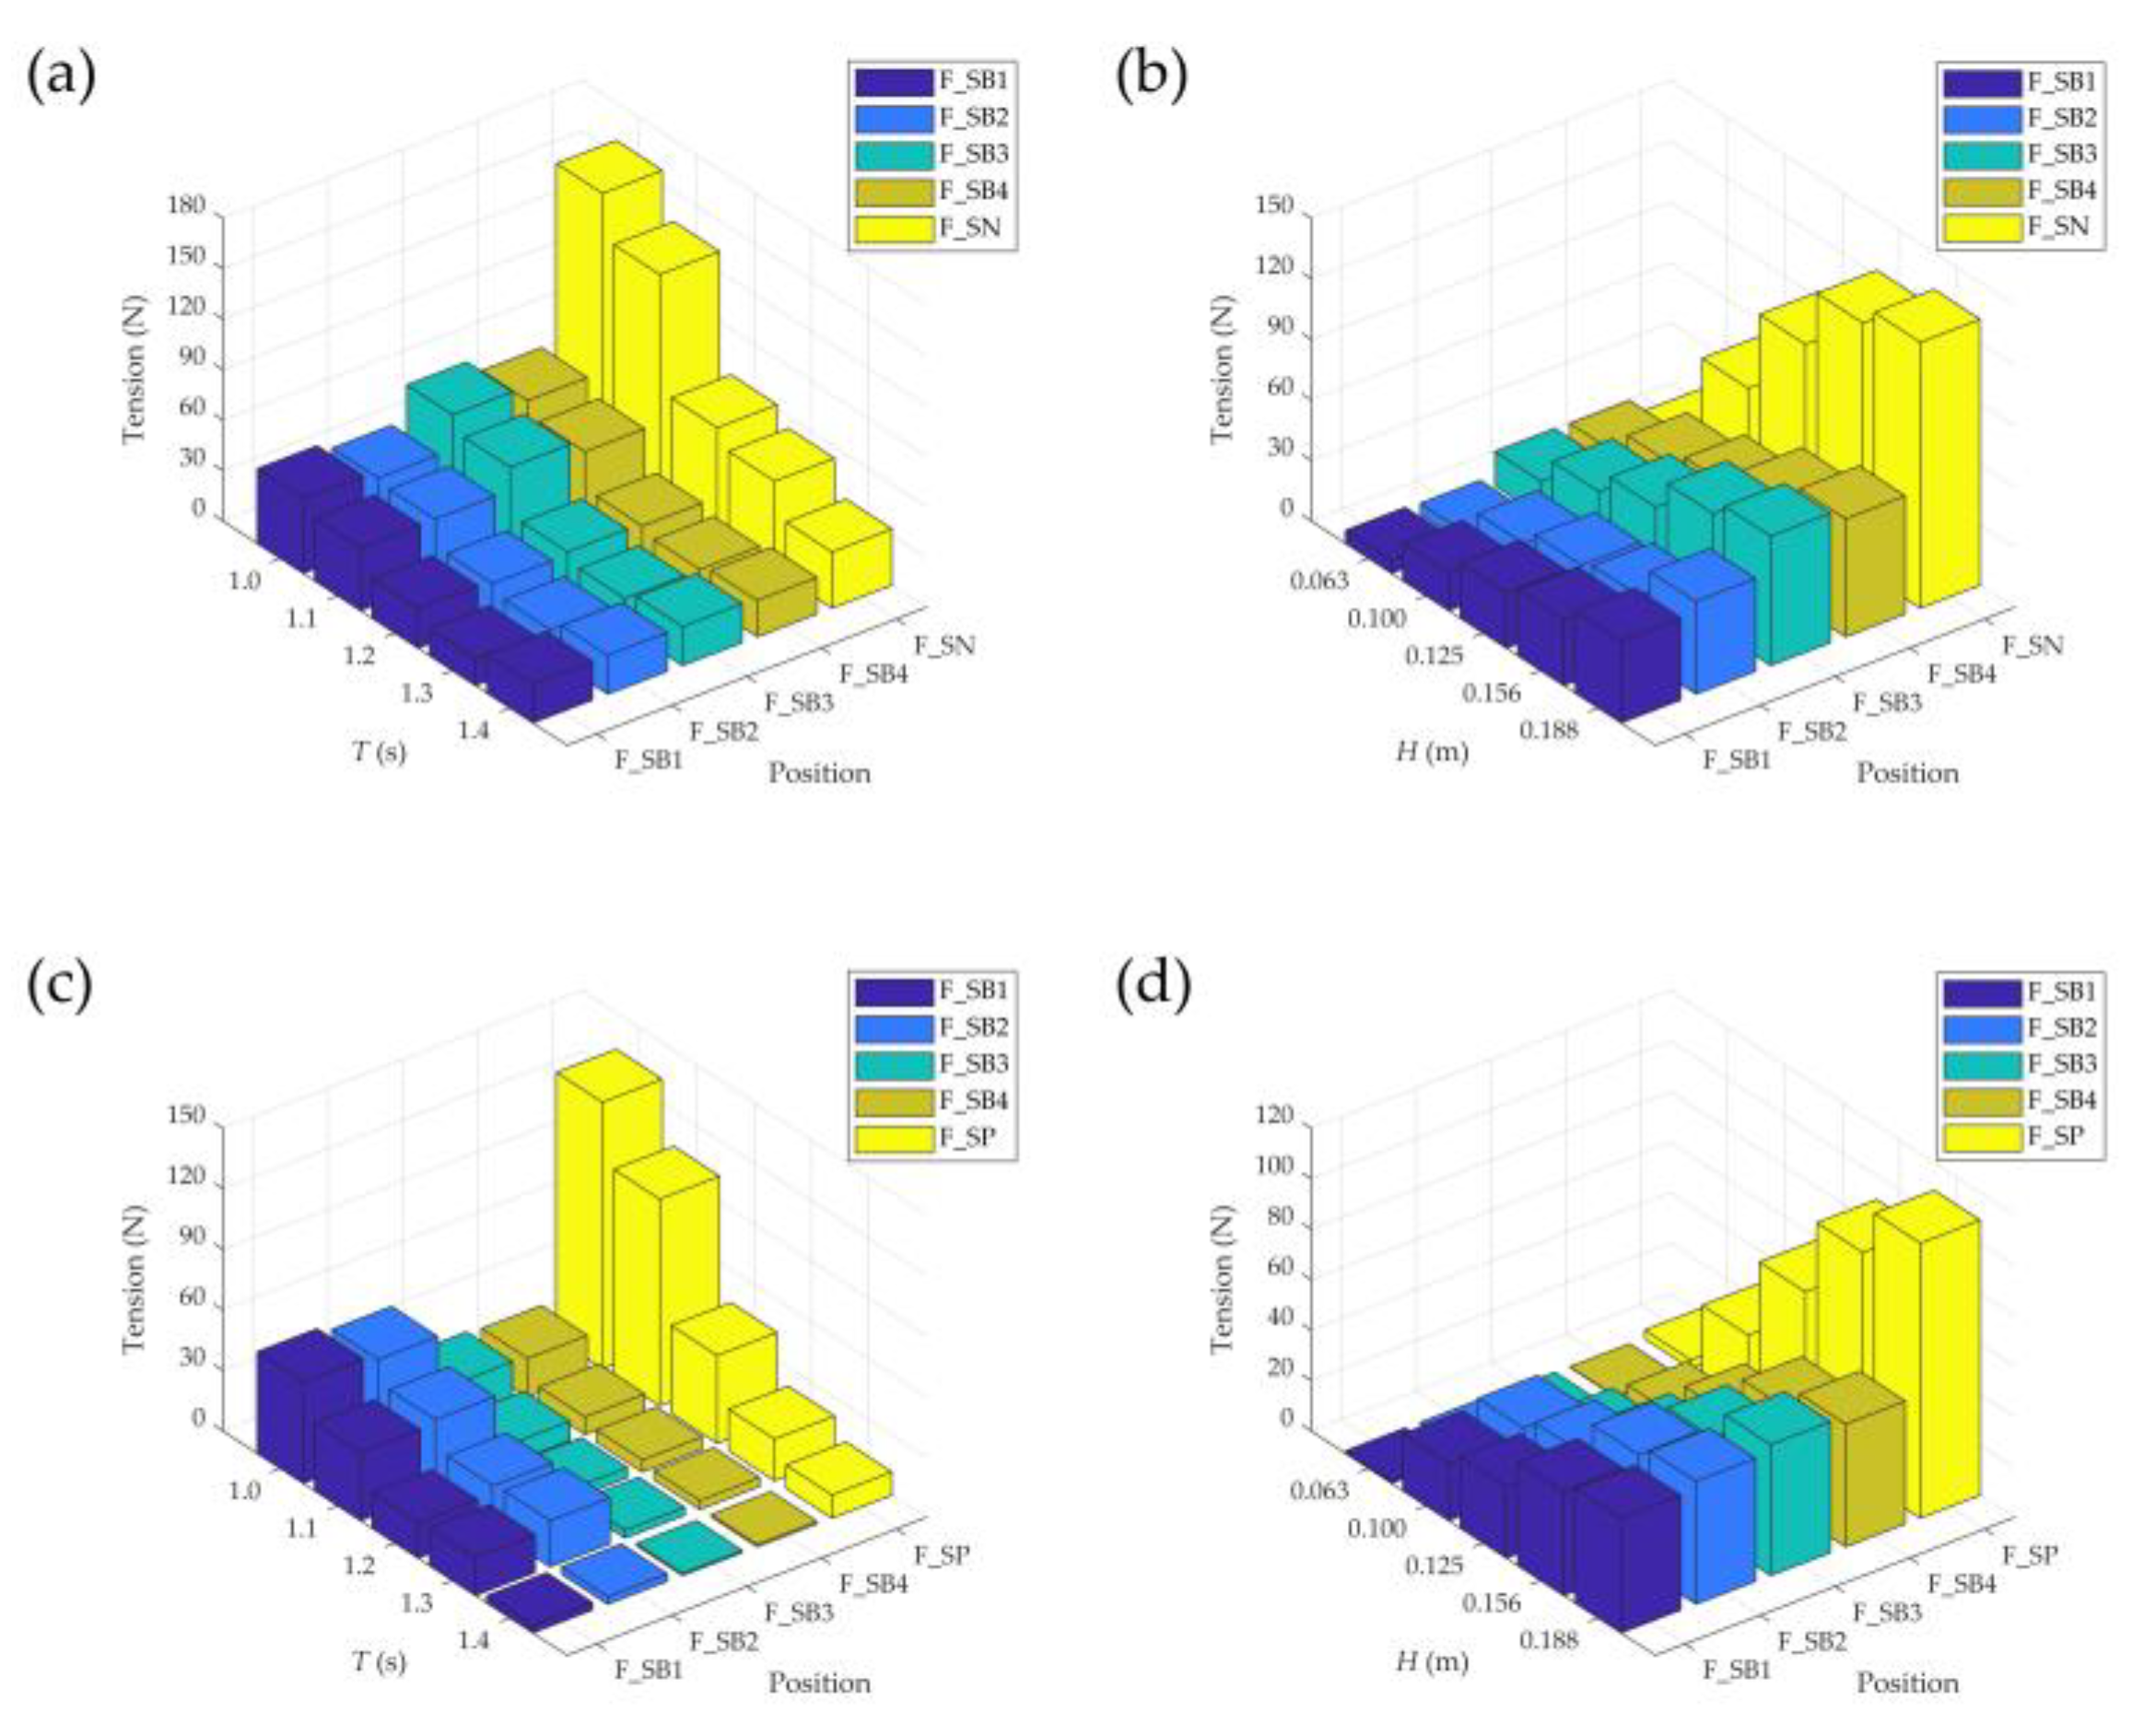
Figure 16 compares the mooring line tensions and bridle line tensions for three-row PRAF under different wave conditions. Overall,
are generally lower than the upstream mooring line tensions
or
. Additionally, the comparison shows that as wave intensity increases, the tensions
and
become significantly higher than
and
, particularly at shorter wave periods. This phenomenon is exactly the opposite of the force distribution observed in the single-row PRAF. The underlying reason for this difference can be attributed to the wave energy attenuation and redistribution caused by the interaction between the multi-row configuration and the incoming waves. In the single-row setup, the rear rafts experience higher forces because they are exposed to waves that have not been significantly dissipated, resulting in cumulative wave impacts on the trailing rafts. In contrast, for the three-row configuration, the upstream raft directly encounters the undisturbed wave energy, resulting in higher hydrodynamic loads on the front bridle lines. The upstream raft effectively acts as a wave energy dissipator, reducing the wave energy that reaches the subsequent rafts. Moreover, the constructive and destructive interference patterns generated by the presence of multiple rows influence the distribution of hydrodynamic forces. In the three-row configuration, the interference caused by the interaction of the scattered waves from the front row reduces the wave impact on the inner and rear rows, leading to lower bridle line tensions in those regions. Additionally, the shadowing effect of the front row rafts further shields the subsequent rows from the full wave energy, contributing to the observed tension differences. In summary, the difference in tension distribution between single-row and three-row raft systems can be attributed to the wave energy dissipation, interference patterns, and shadowing effects introduced by the multi-row configuration, which alters the wave field and reduces the hydrodynamic loads on the rear rows. This also further explains why the mooring line tensions in the three-row configuration are lower than those in the single-row configuration, as shown in Figure 12. The front row of rafts in the three-row system acts as a barrier that dissipates wave energy, reducing the wave forces transmitted to the subsequent rows and, consequently, decreasing the overall mooring line tensions. In contrast, in the single-row configuration, the raft facility is exposed to undisturbed wave energy, resulting in higher cumulative forces on the mooring line.
Figure 17 shows the comparison of the bridle line tensions of the single-row PRAF (
and
) and those of the three-row raft facilities (
and
). The results indicate that the three-row configuration generally reduces the bridle line tensions compared to the single-row configuration, except under the condition of
= 1.0 s and
= 0.1125 m, where
exceeds
. As shown in Figure 16a,
under this specific condition appears to be an abnormal value. One possible explanation is that certain components of the three-row PRAF may have a natural vibration period similar to the incident wave period (
= 1.0 s), leading to localized resonance and generating the higher-than-expected bridle line tensions. This phenomenon suggests that resonance effects in multi-row configuration can significantly impact structure loads under specific wave conditions. Martinelli et al. (2008) also observed that under perpendicular wave conditions, mooring and intermodal connector forces can vary significantly with increasing layout complexity [
33]. Therefore, the findings highlight the importance of optimizing the spatial layout of aquaculture facilities to enhance their hydrodynamic performance and reduce structural loads, particularly in multi-row configurations.
4.3. Numerical Simulation Results of The Wave Propagation around The Wind Monopile
For the validation of the numerical wave flume model with the monopile, please refer to the
Appendix A. The successful validation against experimental data from Mo et al. (2007), demonstrates that the numerical flume model is applicable for the simulations involving the wind monopile [
35]. In this section, the incident wave height monitored at 4.6 m in front of the monopile is
, and the average of the wave heights at three points located 2.8 m behind the monopile is
(Figure 9). The numerical results are shown in
Table 2 Transmission coefficient (
/
) is an important coefficient to reflect the wave attenuation performance of the monopile. In Case 1–5,
decreases with the increase of
and
is greater than 0.79. When
> 0.2, the diffraction effects of waves start to become significant [
36]. In the design of breakwater,
> 0.25 is considered as a reference to be able to effectively resist waves [
30]. This rule coincides with our results.
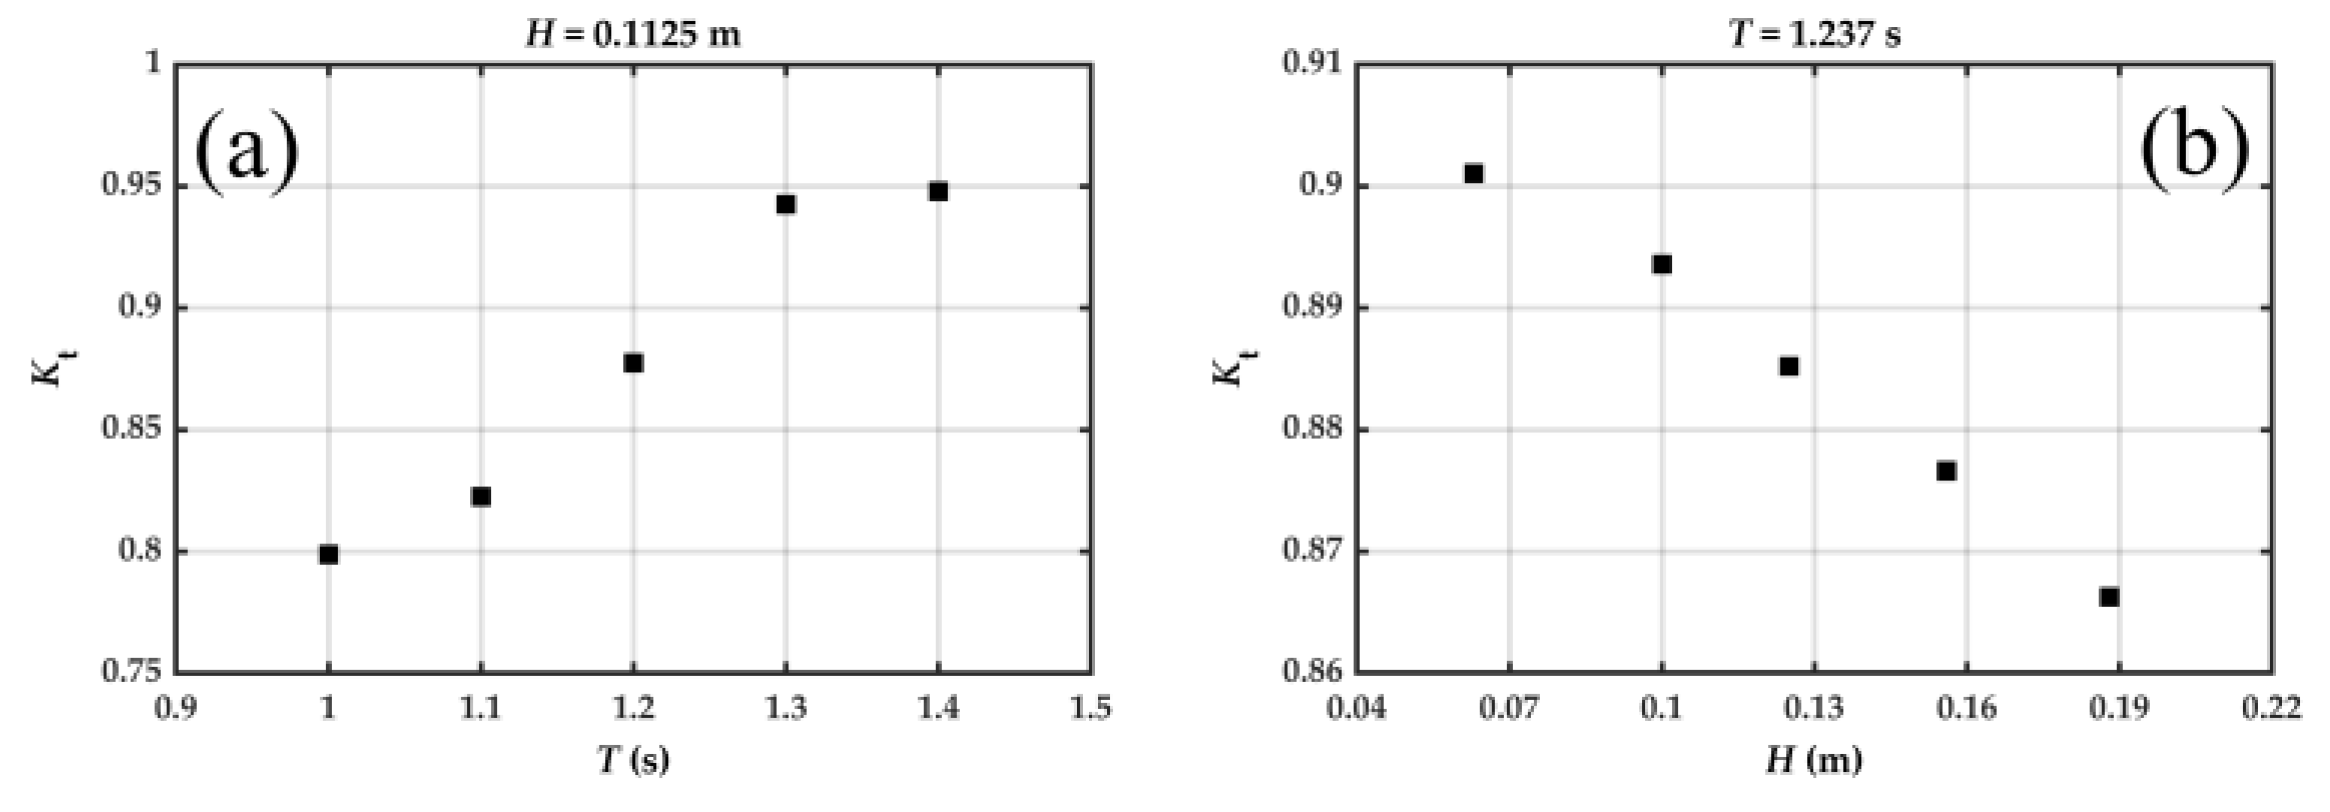
The presence of the monopile helps to reduce wave height in the transmitted region. This paper concentrates on the
. As shown in
Figure 18, it can be seen that
increases with increasing wave period and decreases with increasing wave height. Regardless of the conditions in experiments,
is greater than 0.79.
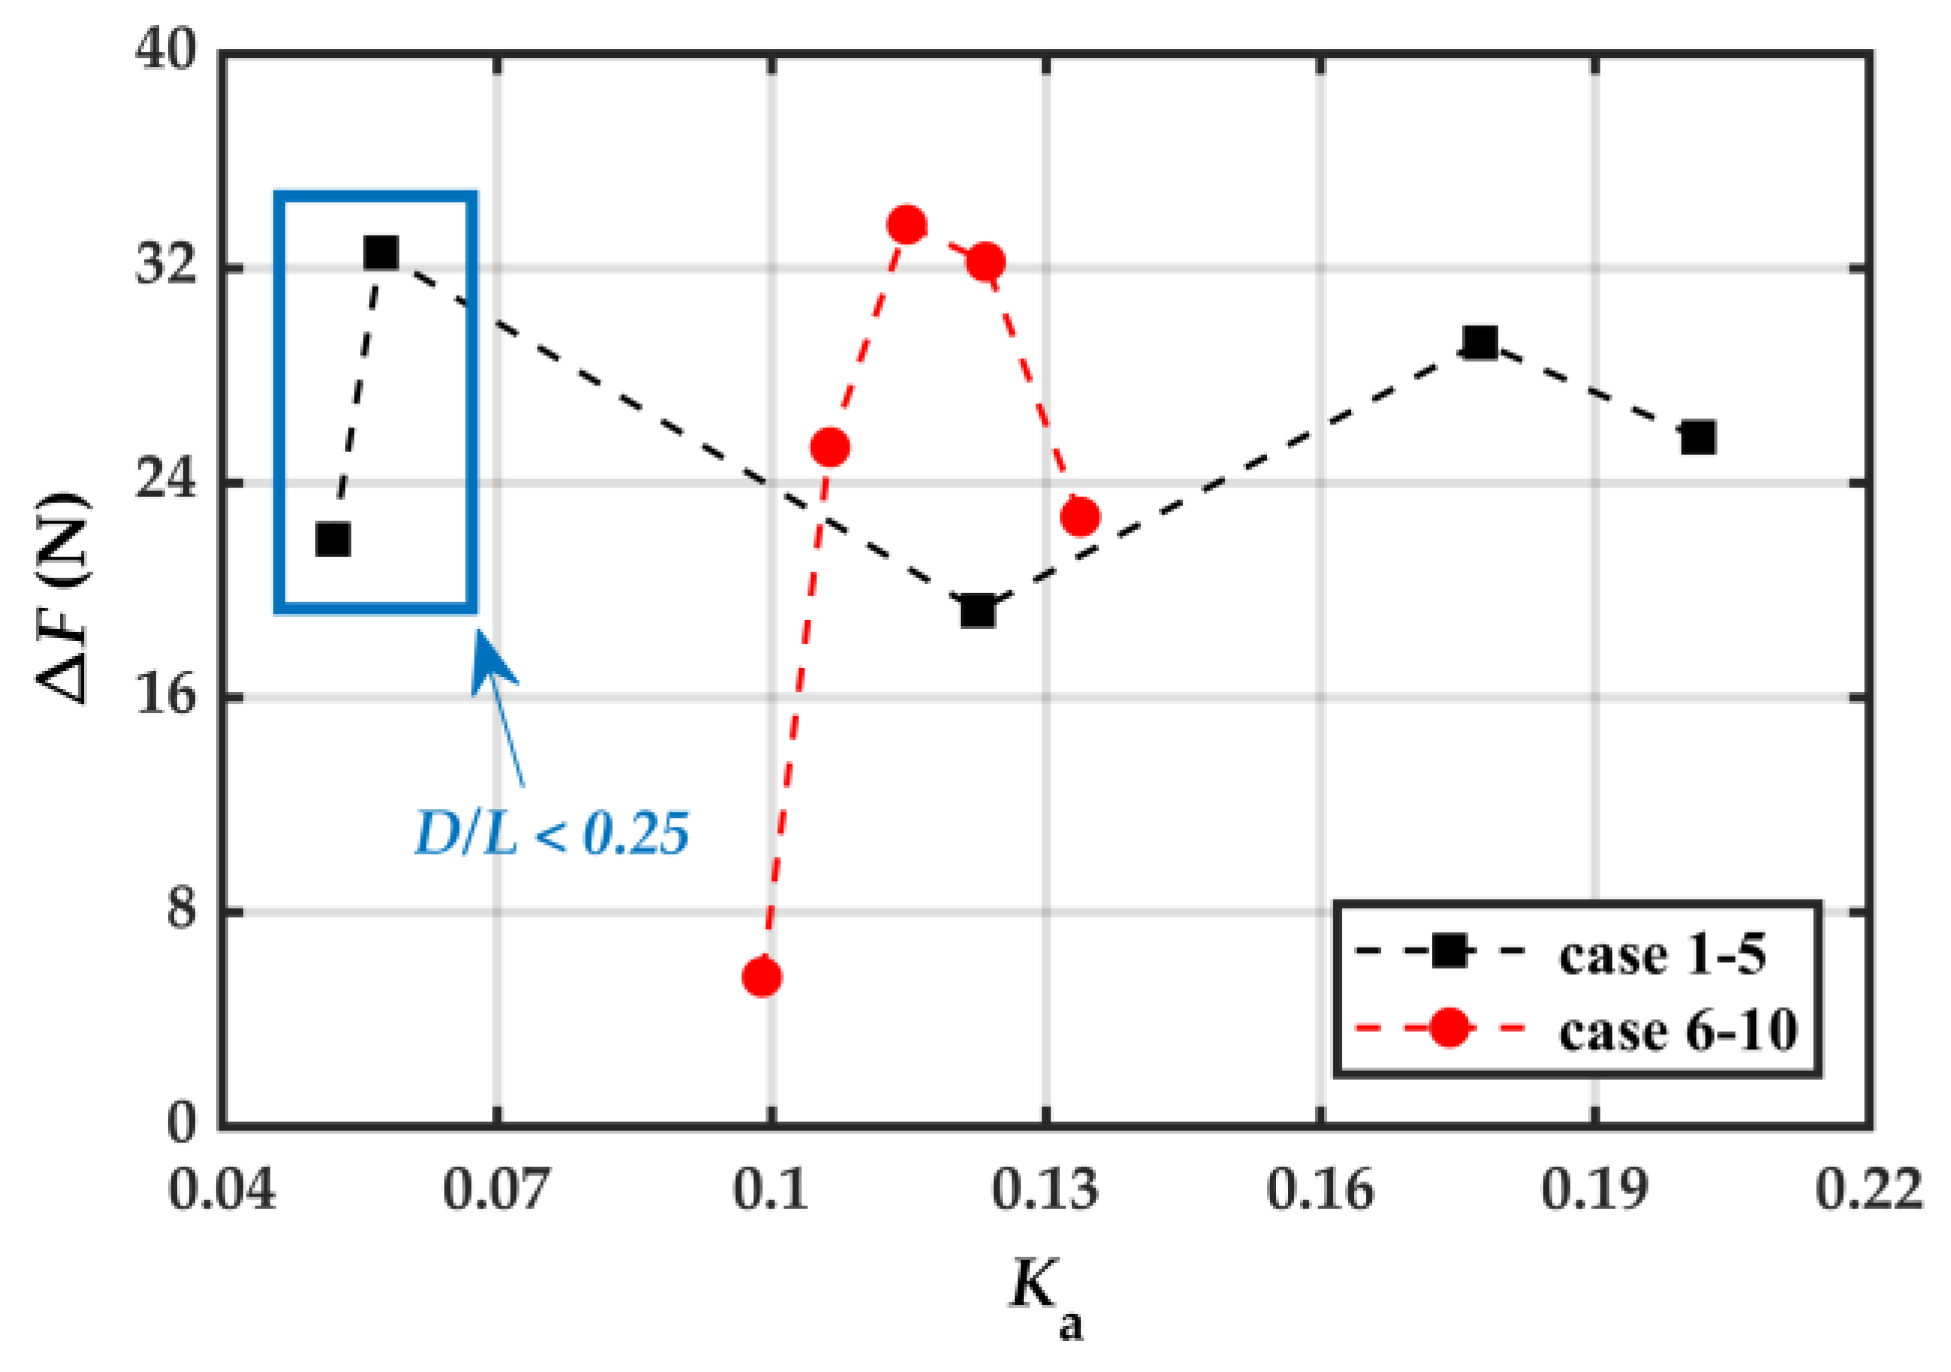
Figure 19 shows the relationship between the reduction of mooring line tension
(
) and attenuation coefficient
(
). For Case 1–5, when
< 0.07 (
< 0.25),
cannot be used as a reference for change in mooring line tension because the monopile is not a means of wave attenuation in this condition.
increases initially from 0.12 to 0.18 of
, and decreases from 0.18 to 0.2 of
. For Case 6–10,
increases initially from 0.1 to 0.11 of
, and decreases from 0.11 to 0.13 of
. Consequently, the response of
to
is more sensitive to wave height compared to wave period, which suggests that when the wave period is constant, the wave height condition is more restrictive to maintain a high
. As shown in Figure 19, when
ranges from 0.11 to 0.20, the presence of a wind turbine can effectively reduce the mooring line tension of PRAF.
Wave height attenuation is observed as waves propagate past the monopile, with the wave height reduction being significantly greater in the downstream areas shielded by the monopile compared to regions without a monopile. Since wave energy is proportional to the square of the wave height, aquaculture facilities located near wind turbines experience reduced wave impacts. Experimental results indicate that the reduction in mooring line tension is particularly significant under conditions of long wave periods and small wave heights. In such scenarios, the presence of wind turbines can effectively enhance the wave resistance of aquaculture facilities. These findings provide valuable insights for optimizing the spatial arrangement of raft aquaculture structures in offshore wind farms to improve their stability and reduce hydrodynamic loads.
In this study, we have initially established a numerical flume model with the wind monopile, aiming to explore how wave heights change when encountering the monopile. This investigation seeks to explain why the presence of the wind monopile affects the mooring line and bridle line tensions of PRAF. This research will not only contribute to our understanding of the mechanisms behind these interactions but also provide a theoretical basis for the sustainable development of wind-aquaculture structures. In the future, we plan to extend our research by developing a hydrodynamic model for PRAF within offshore wind farms. This effort will allow us to better understand the interaction between the wind turbine foundations and floating aquaculture structures, particularly the impact on wave transmission in the surrounding marine environment. By simulating the different configurations of aquaculture facilities around the wind turbine foundation, we attempt to uncover the potential effects of these structures on marine conditions, and ultimately provide actionable insights for the design and optimization of such facilities.
5. Conclusions
In this study, we investigated the hydrodynamic performance of PRAF located around a wind farm monopile under different wave conditions based on the water tank model tests. Our analysis emphasized the mooring line and bridle line tensions, drawing insights from experimental results. Additionally, we incorporated the wave height loss derived from the numerical simulations to enhance our understanding of the observed weakening of mooring line tension in the experimental findings. The following key conclusions can be drawn from this research:
(1) Impacts of wave parameters
The maximum mooring line and bridle line tension of PRAF exhibit a consistent trend: they decrease with increasing wave period and increase with increasing wave height. This correlation is closely related to variations in wave steepness, as evidenced by the observed increase in hydrodynamic forces within the range of 0.02 to 0.09 of .
(2) Effects of a wind farm monopile
The presence of a wind monopile significantly impacts both mooring line tension and bridle line tension for PRAF. Mooring line tension is reduced, and the reduction ratio decreases when wave steepness increases, which ranging from 16% to 66%. Furthermore, there is an increase in bridle line tension on the upstream component, while a decrease in bridle line tension on the downstream component.
(3) Benefits of multi-row arrangement
Three-row configuration demonstrates lower maximum mooring line and bridle line tension compared to single-row setup, and the inner structure of three-row PRAF tends to experience lower bridle line tension compared to outer structure of three-row PRAF. Increasing layout complexity is one way to improve the overall stability of aquaculture facilities.
(4) Wave height loss of waves passing through a monopile
Wave height attenuation occurs as the waves propagate through a monopile, with wave height loss () ranging from 5% to 20%. It is observed that the monopile’s influence on wave height diminishes with increasing wave period. Additionally, greater wave height corresponds to increased . When ranges from 0.11 to 0.20, the presence of a monopile can effectively reduce the mooring line tension of PRAF.
Author Contributions
Conceptualization, Wang, X.X. and Tang, Y.L.; methodology, Chen D.M. and Wang, X.X.; software, Lin M.C., Chen, D.M.; validation, Wang, X.X., Chen, D.M.; formal analysis, Chen, D.M.; investigation, Chen, D.M., Zhou, J.X., Zhao, F.F., Wang, X.X., and Li, Q.; resources, Tang, Y.L.; data curation, Chen, D.M., Wang, X.X.; writing—original draft preparation, Chen, D.M.; writing—review and editing, Wang, X.X.; visualization, Zhao, F.F., Wang, X.X.; supervision, Wang, X.X., Yu, M.J.; project administration, Tang, Y.L.; funding acquisition, Tang, Y.L., and Kitazawa, D. All authors have read and agreed to the published version of the manuscript.
Funding
This research was mainly funded by China Three Gorges Renewable (Group) Co., Ltd. No. 37022078, and partially supported by the JSPS Grants-in-Aid for Scientific Research No. 23H01619.
Institutional Review Board Statement
Not applicable.
Informed Consent Statement
No applicable.
Data Availability Statement
Code for data analysis is available on request from the authors.
Acknowledgments
The authors would like to express gratitude to Dr. J. Han, from Yokohama National University, for water tank experiment assistance.
Conflicts of Interest
The authors declare no conflicts of interest.
Appendix A. Validation of the Numerical Flume Model
Appendix1. Experimental Setup
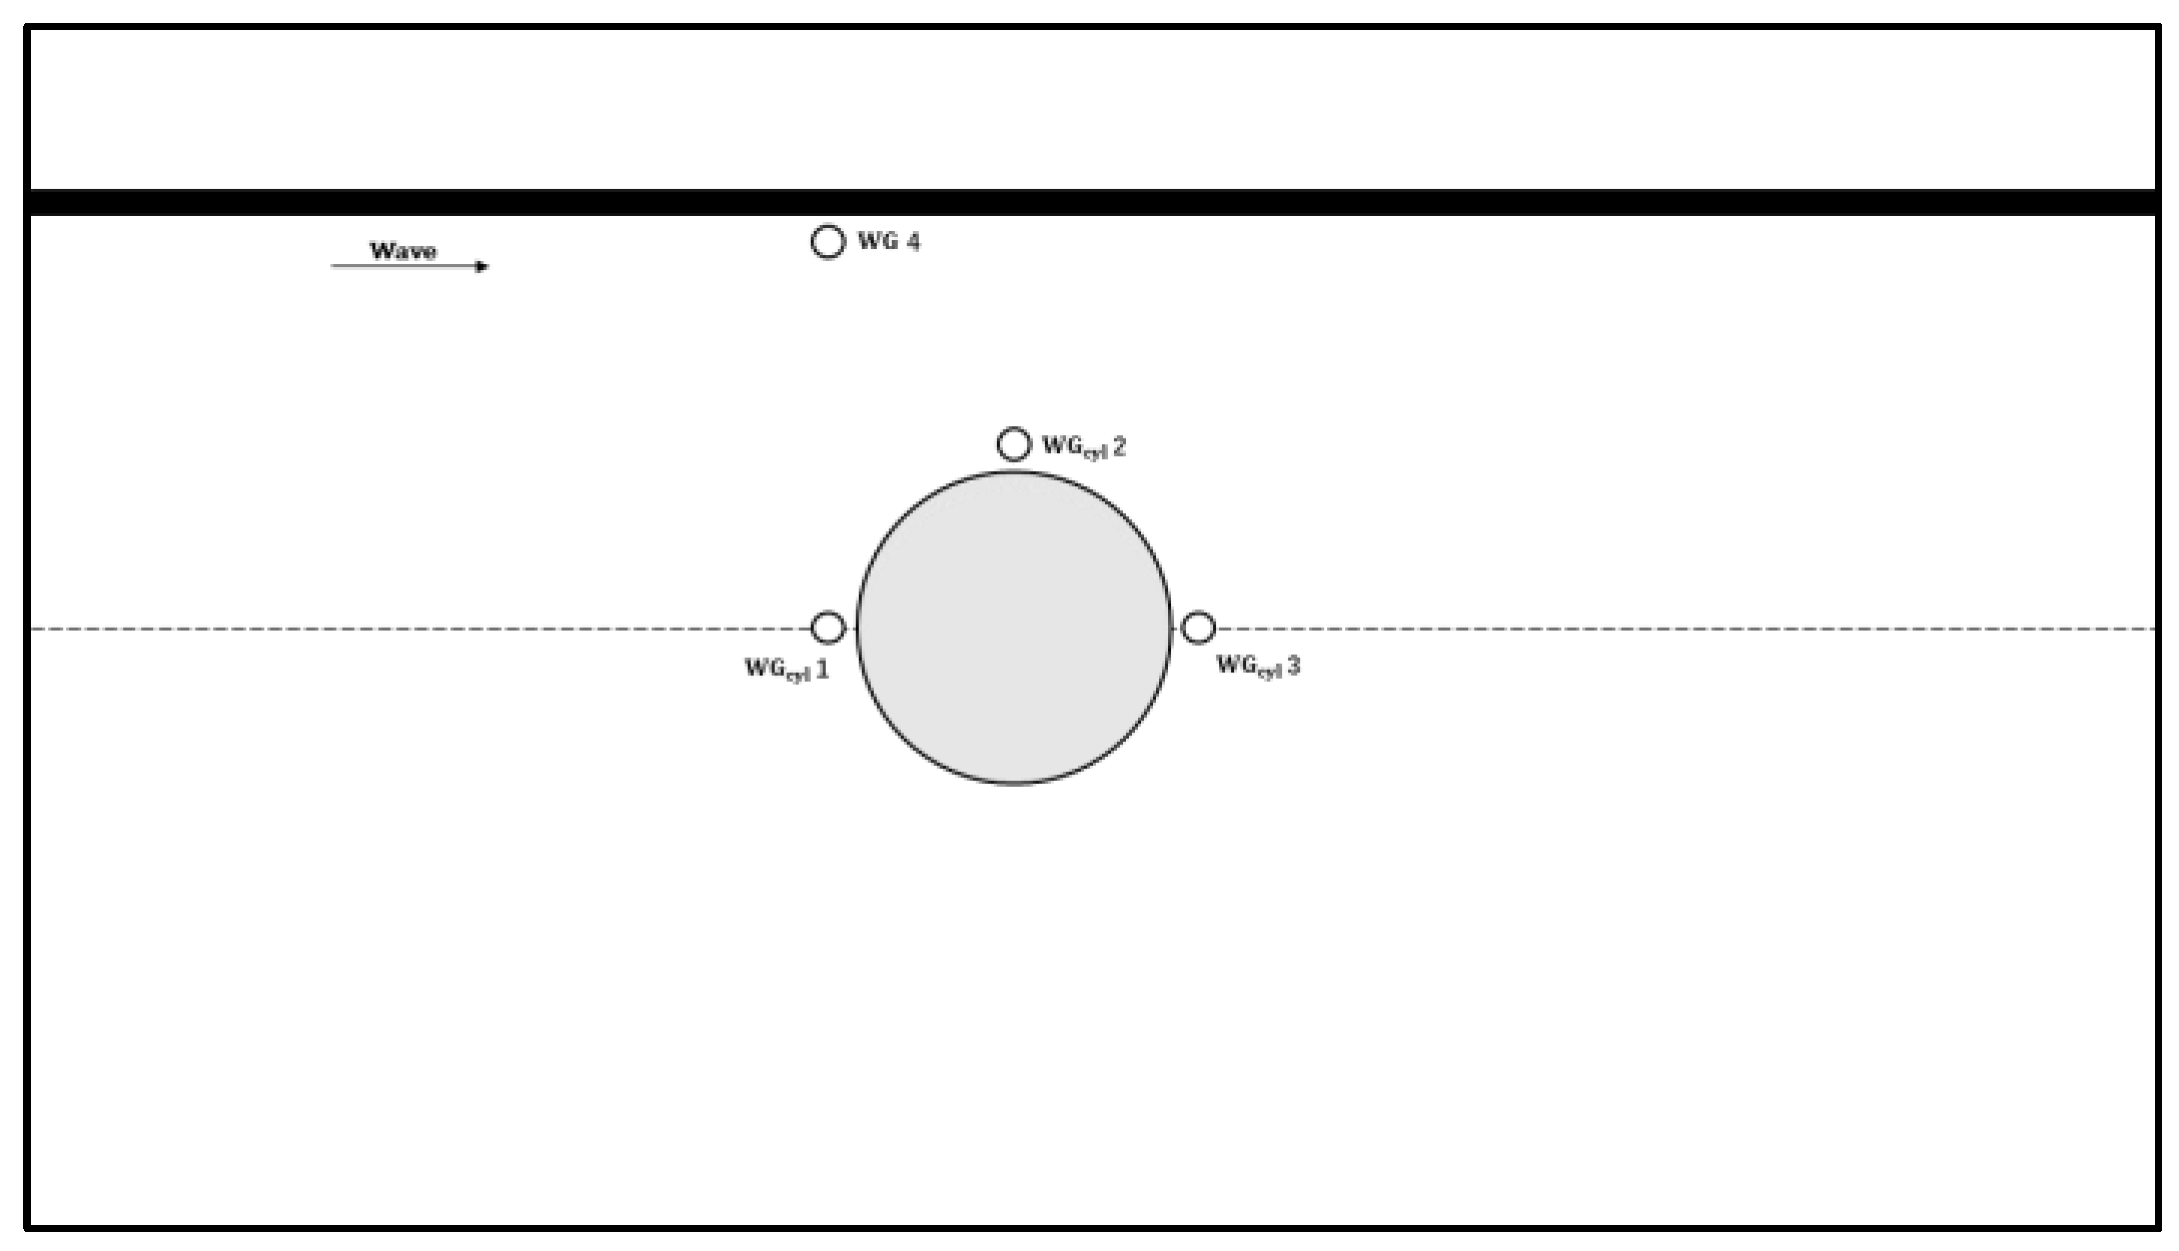
To verify the accuracy of the numerical flume model with a wind monopile foundation, we compared the numerical results with the experimental data reported by Mo et al. [
35], due to the lack of corresponding experimental data for direct validation. The experimental flume used in Mo’s study has a length of 60 m, a width of 5 m, and a depth of 7 m. A steel circular cylinder with a diameter of 0.7 m was placed in the flume to simulate the monopile structure. The experimental conditions selected for comparison were a depth
, a wave period
, and a wave height
. These conditions were applied to the numerical model to ensure a consistent basis for comparison.
Appendix A2. Numerical Model Setup
As shown in
Figure S1, the numerical flume model was configured to replicate the experimental setup as described in Mo et al. [
35]. The model included the same geometric parameters for the flume and monopile structure. Boundary conditions were set to replicate the experimental wave conditions and the same wave generation and absorption techniques were applied. The numerical simulation was conducted using a fully coupled wave-structure interaction approach, with the governing equations solved using the Reynolds-Averaged Navier-Stokes (RANS) method and a standard
turbulence model. Mesh refinement was applied near the monopile to improve the accuracy of the wave elevation results.
Figure A1.
Schematic diagram of four wave-gauge locations around a cylinder in the experiment by Mo et al. in 2007.
Figure A1.
Schematic diagram of four wave-gauge locations around a cylinder in the experiment by Mo et al. in 2007.
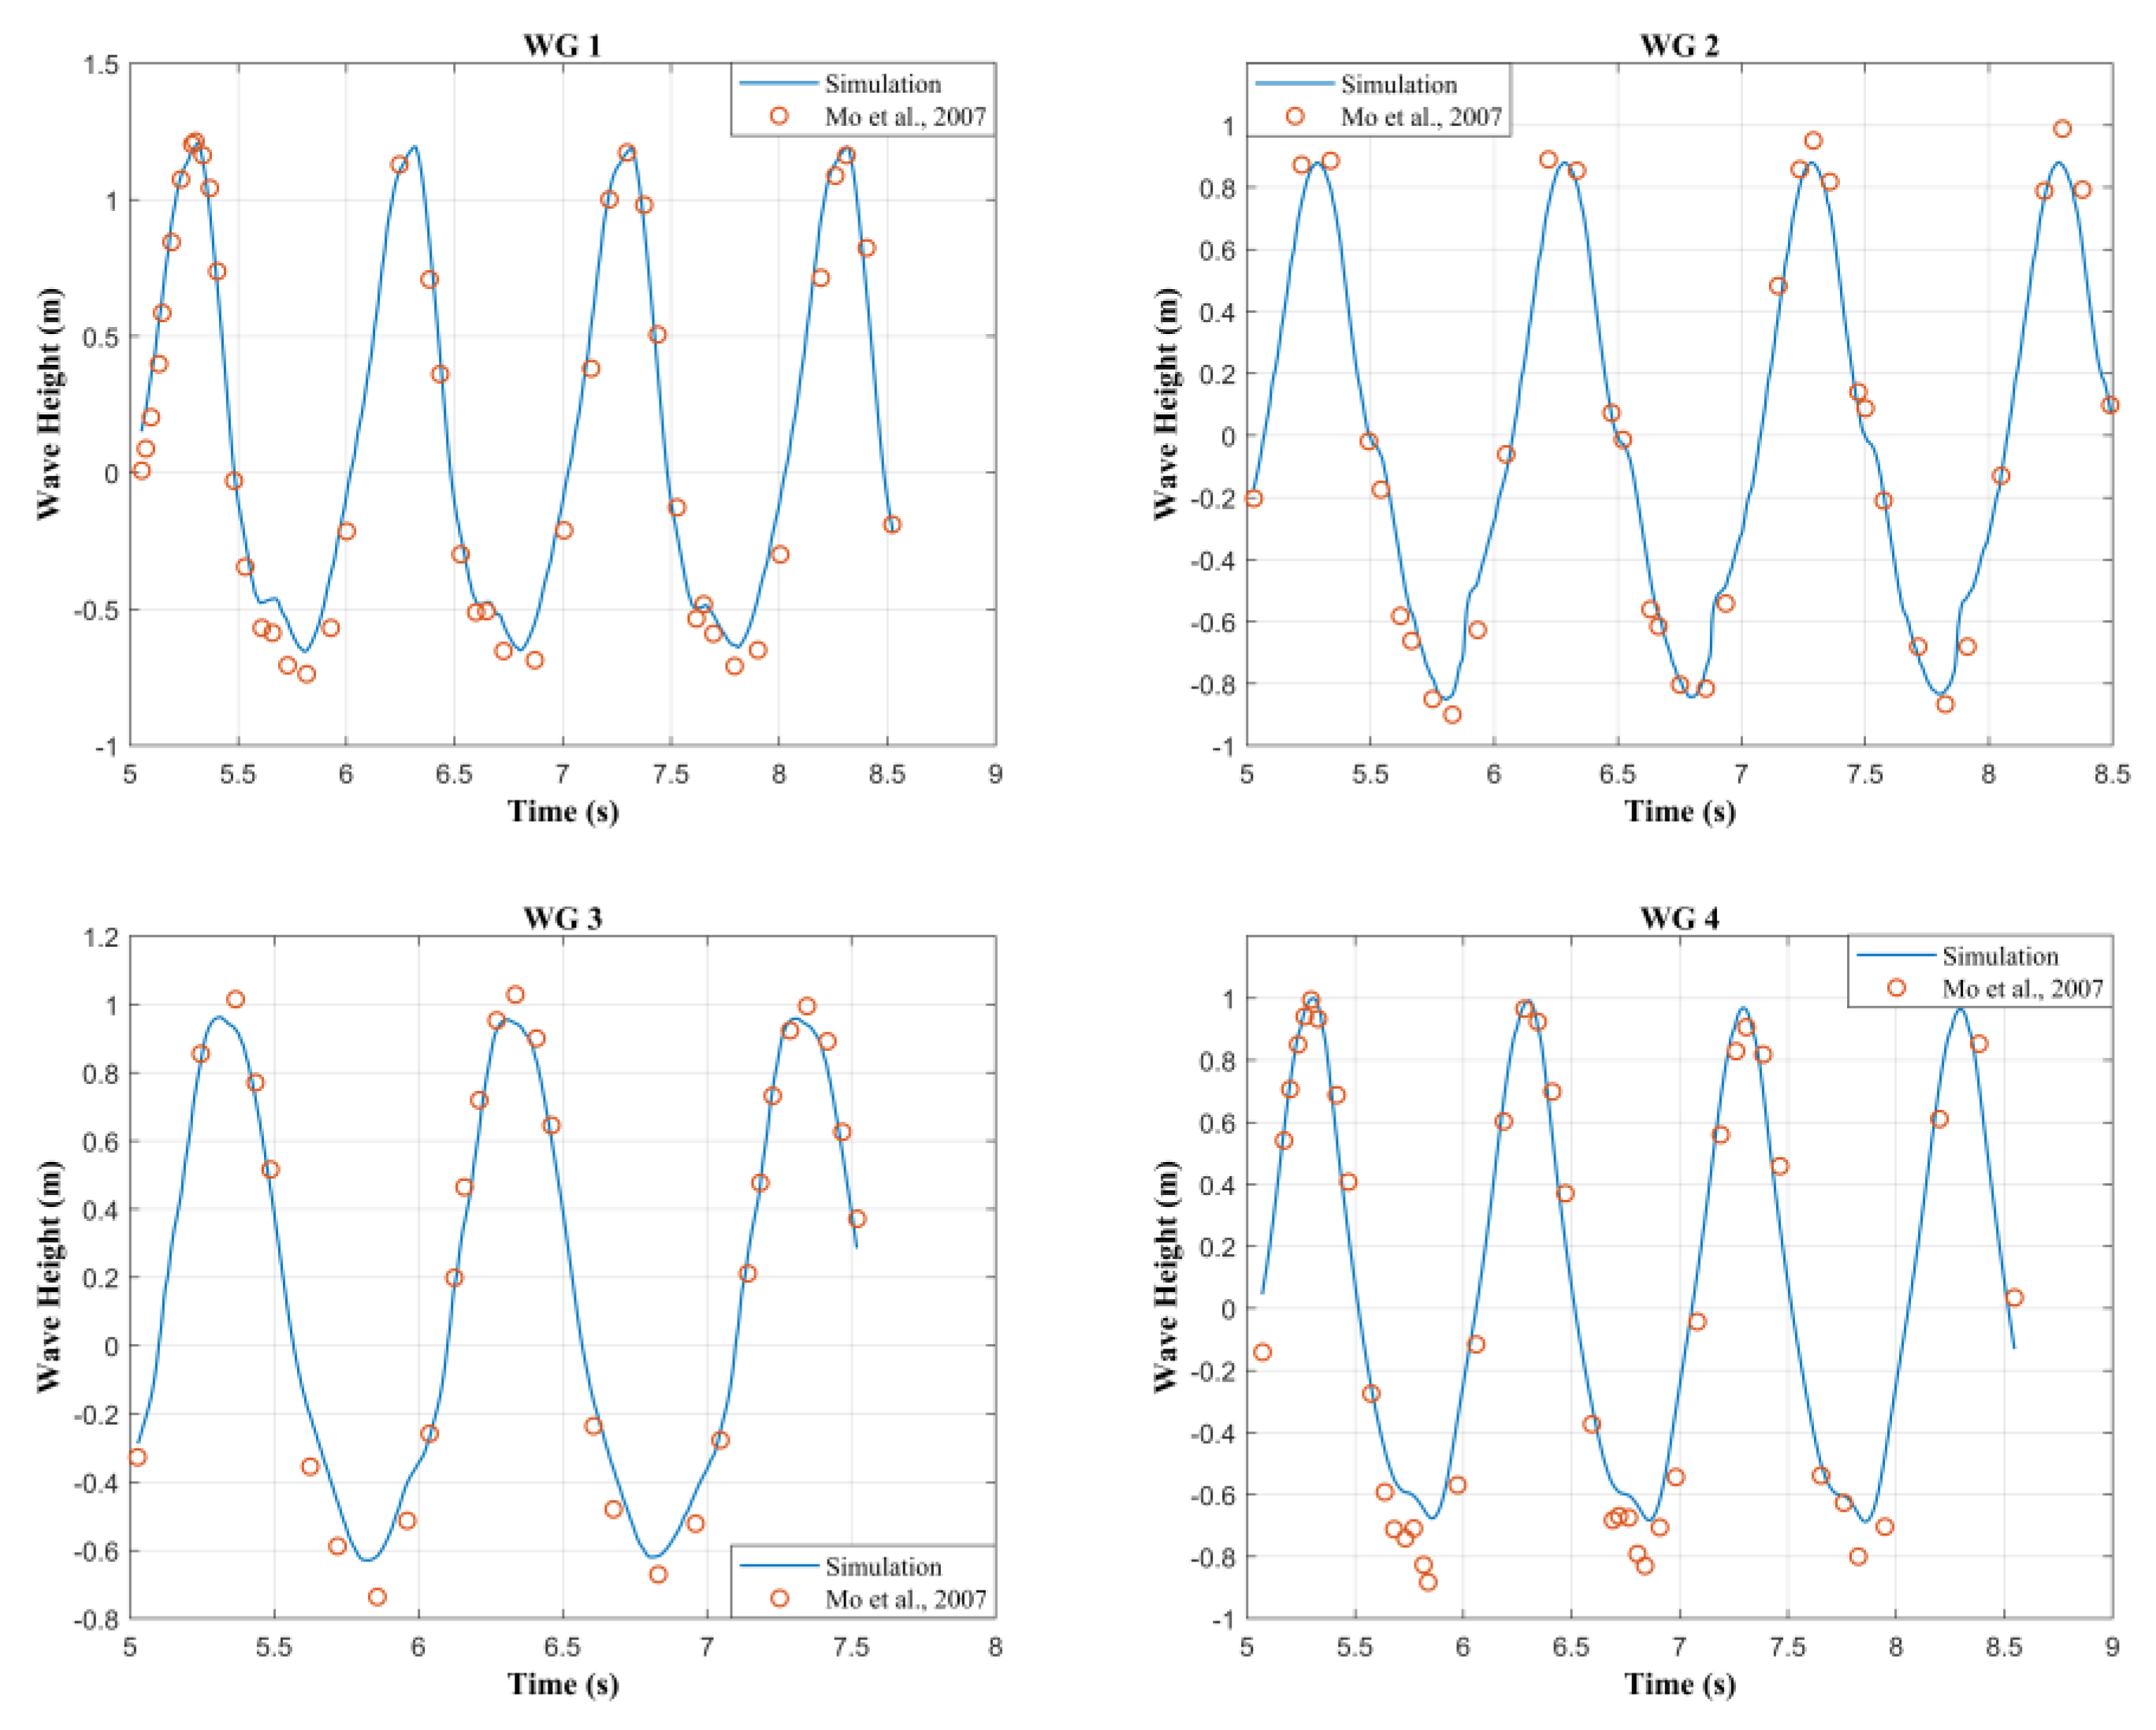
Appendix A3. Validation Results
The comparison between the numerical simulation results and the experimental data is presented in
Figure S2. The results demonstrate that the numerical model accurately captures the key hydrodynamic features observed in the experimental study. The wave trough elevations predicted by the numerical model align closely with those recorded in the experimental results, indicating that the model successfully reproduces the wave profile around the monopile structure. The successful validation against experimental data from Mo et al. [
35] demonstrates that the numerical flume model is applicable for further simulations involving wind farm monopile foundation. The results provide confidence in the accuracy of the numerical predictions presented in the main text.
Figure A2.
Comparison of numerical results with experimental results by Mo et al. in 2007.
Figure A2.
Comparison of numerical results with experimental results by Mo et al. in 2007.
References
- Yaghubi, E.; Carboni, S.; Snipe, R.M.J.; Shaw, C.S.; Fyfe, J.J.; Smith, C.M.; Kaur, G.; Tan, S.Y.; Hamilton, D.L. Farmed mussels: A nutritive protein source, rich in omega-3 fatty acids, with a low environmental footprint. Nutrients 2021, 13, 1124. [Google Scholar] [CrossRef] [PubMed]
- Avdelas, L.; Avdic-Mravlje, E.; Marques, A.C.B.; Cano, S.; Capelle, J.J.; Carvalho, N. ;... & Asche, F. The decline of mussel aquaculture in the European Union: causes, economic impacts and opportunities. Reviews in Aquaculture 2021, 13, 91–118. [Google Scholar] [CrossRef]
- Karayücel, S.; Celik, M.Y.; Karayücel, I.; Erik, G. Growth and Production of Raft Cultivated Mediterranean Mussel (Mytilus galloprovincialis Lamarck, 1819) in Sinop, Black Sea. Turkish Journal of Fisheries and Aquatic Sciences 2010, 10, 9–17. [Google Scholar] [CrossRef]
- Langan, R. Mussel Culture, Open Ocean Innovations. In Sustainable Food Production, Christou, P., Savin, R., Costa-Pierce, B.A., Misztal, I., Whitelaw, C.B.A., Eds. ed; Springer: NewYork, America, 2013. [Google Scholar] [CrossRef]
- Maar, M.; Holbach, A.; Boderskov, T.; Thomsen, M.; Buck, B.H.; Kotta, J.; Bruhn, A. Multi-use of offshore wind farms with low-trophic aquaculture can help achieve global sustainability goals. Communications earth 2023, 4, 447. [Google Scholar] [CrossRef]
- Buck, B.H. Open Ocean Aquaculture und OffshoreWindparks: Eine Machbarkeitsstudie uber die multifunktionale Nutzung von Offshore-Windparks und Offshore-Marikultur im Raum Nordsee. Alfred Wegener Institute for Polar and Marine Research, Bremerhaven, Germany, 2002; pp. 412–252. hdl:10013/epic.10417.d001.
- Buck, B.H.; Krause, G.; Rosenthal, H. Extensive open ocean aquaculture development within wind farms in Germany: the prospect of offshore co-management and legal constraints. Ocean & Coastal Management 2004, 47, 95–122. [Google Scholar] [CrossRef]
- Buck, B.H.; Langan, R. Aquaculture perspective of multi-use sites in the open ocean: The untapped potential for marine resources in the anthropocene. Springer Nature, Berlin, Germany, 2017. [CrossRef]
- Zhao, Z.L.; Yu, W.Z.; Xu, T.J. Study of the Interaction between Regular Waves and a Wind-Fish Combined Structure. Applied Sciences 2023, 13, 3103. [Google Scholar] [CrossRef]
- Zheng, X.Y.; Lei, Y. Stochastic response analysis for a floating offshore wind turbine integrated with a steel fish farming cage. Applied Sciences 2018, 8, 1229. [Google Scholar] [CrossRef]
- Zhang, C.L.; Wang, S.M.; Cui, M.C.; Liu, H.; Liu, A.D.; Xu, J.C.; Xie, S.Y. Modeling and dynamic response analysis of a submersible floating offshore wind turbine integrated with an aquaculture cage. Ocean Engineering 2022, 263, 112338. [Google Scholar] [CrossRef]
- Cao, S.G.; Cheng, Y.L.; Duan, J.L.; Fan, X.X. Experimental investigation on the dynamic response of an innovative semi-submersible floating wind turbine with aquaculture cages. Renewable Energy 2022, 200, 1393–1415. [Google Scholar] [CrossRef]
- Yi, Y.; Sun, K.; Liu, Y.Q.; Zhang, J.H.; Jiang, J.; Liu, M.Y.; Ji, R.W. Experimental investigation into the dynamics and power coupling effects of floating semi-submersible wind turbine combined with point-absorber array and aquaculture cage. Energy 2024, 296, 131220. [Google Scholar] [CrossRef]
- Zhong, W.J.; Zhang, X.M.; Wan, D.C. Hydrodynamic characteristics of a 15 MW semi-submersible floating offshore wind turbine in freak waves. Ocean Engineering 2023, 283, 11594. [Google Scholar] [CrossRef]
- Tang, Y.; Shi, W.; You, J.K.; Michailides, C. Effects of nonlinear wave loads on large monopile offshore wind turbines with and without ice-breaking cone configuration. Journal of Marine Science and Technology 2021, 26, 37–53. [Google Scholar] [CrossRef]
- Wang, J.; Wang, S.Q.; Jiang, Q.D.; Xu, Y.X.; Shi, W.C. Effect of different raft shapes on hydrodynamic characteristics of the attenuator-type wave energy converter. China Ocean Engineering 2023, 37, 645–659. [Google Scholar] [CrossRef]
- Wang, K.; Li, N.; Wang, Z.H.; Song, G.J.; Du, J.; Song, L.; Jiang, H.Z.; Wu, J.H. The impact of floating raft aquaculture on the hydrodynamic environment of an open sea area in Liaoning Province, China. Water 2022, 14, 3125. [Google Scholar] [CrossRef]
- Ai, Q.; Cao, J.C.; Jin, L.; Chen, D.M.; Tang, Y.L.; Zhao, F.F.; Sheng, H.X.; Wang, X.X. Experimental Study of the Hydrodynamic Characteristics of the Raft Aquaculture Facilities Around a Windfarm Monopile. In Proceedings of ASME 2024 43rd International Conference on Offshore Mechanics and Arctic Engineering, Singapore, Singapore, 09-14, June, 2024. [CrossRef]
- Wang, X.X.; Swift, M.R.; Dewhurst, T.; Tsukrov, I.; Celikkol, B.; Newell, C. Dynamics of submersible mussel rafts in waves and current. China Ocean Engineering 2015, 29, 431–444. [Google Scholar] [CrossRef]
- In Proceedings of 16th Offshore Technology Conference, Houston, America. STAR-CCM+, 2024. User Manual. Version 19.02, Siemens Industry Software Inc. https://www.plm.automation.siemens.com/global/zh/products/simulation-test/cae-simulation.html.
- Menter, F.R. Two-equation eddy-viscosity turbulence modeling for engineering applications. AIAA Journal 1994, 32, 1598–1605. [Google Scholar] [CrossRef]
- Hirt, C.W.; and Nichols, B.D. Volume of fluid (VOF) method for the dynamics of free boundaries. Journal of Computational Physics 1981, 39, 201–225. [Google Scholar] [CrossRef]
- Fenton, J.D. A fifth-order Stokes theory for steady waves. Journal of waterway, port, coastal, and ocean engineering 1985, 111, 216–234. [Google Scholar] [CrossRef]
- Kim, J.; O’Sullivan, J.; Read, A. Ringing analysis of a vertical cylinder by Euler overlay method. Proceedings of ASME 2012 31st International Conference on Offshore Mechanics and Arctic Engineering, Rio de Janeiro, Brazil, July; (accessed on day month year). [CrossRef]
- Wang, X.X.; Zhao, F.F.; Tang, Y.L.; Huang, L.Y.; Wan, R.; Cheng, H. Numerical Analysis of Submersible Mussel Raft for Exposed Marine Environment. In Proceedings of ASME 2017 36th International Conference on Offshore Mechanics and Arctic Engineering, 25-30, June, 2017. [CrossRef]
- Wang, X.X.; Xie, J.Y.; Luo, Y.; Wang, X.; Guo, G.B.; You, X.X. Experimental Investigation of the Hydrodynamic Characteristics of Longline Aquaculture Facilities under Current and Wave Conditions. Fishes 2023, 8, 204. [Google Scholar] [CrossRef]
- Liu, H.F.; Bi, C.W.; Zhao, Y.P. Experimental and numerical study of the hydrodynamic characteristics of a semisubmersible aquaculture facility in waves. Ocean Engineering 2020, 214, 107714. [Google Scholar] [CrossRef]
- de Leon, S.P.; Bettencourt, J.H.; Kjerstad, N. Simulation of irregular waves in an offshore wind farm with a spectral wave model. Continental Shelf Research 2011, 31, 1541–1557. [Google Scholar] [CrossRef]
- Corvaro, S.; Crivellini, A.; Marini, F.; Cimarelli, A.; Capitanelli, L.; Mancinelli, A. Experimental and numerical analysis of the hydrodynamics around a vertical cylinder in waves. Journal of Marine Science and Engineering 2019, 7, 453. [Google Scholar] [CrossRef]
- Masoudi, E.; Marshall, A. Diffraction of waves by multi-pontoon rectangular floating breakwaters. Ocean Engineering 2024, 310, 118789. [Google Scholar] [CrossRef]
- Li, C.; Zhang, H.J.; Zhang, H.; Sun, B.; Yang, S.L. Wave-attenuation and hydrodynamic properties of twin pontoon floating breakwater with kelp. Applied Ocean Research 2022, 2022. 124, 103213. [Google Scholar] [CrossRef]
- Miles, J.; Martin, T.; Goddard, L. Current and wave effects around windfarm monopile foundations. Coastal Engineering 2017, 121, 167–178. [Google Scholar] [CrossRef]
- Martinelli, L.; Ruol, P.; Zanuttigh, B. Wave basin experiments on floating breakwaters with different layouts. Applied ocean research 2008, 30, 199–207. [Google Scholar] [CrossRef]
- Liao, P. Study on Hydrodynamic Behaviors of "Tian" shaped Shellfish Raft Cultivate Facilities. MA thesis, Dalian University of Technology, Dalian, June, 2017.
- Mo, W.H.; Irschik, K.; Oumeraci, H.; Liu, P.L.F. A 3D numerical model for computing non-breaking wave forces on slender piles. Journal of Engineering Mathematics 2007, 58, 19–30. [Google Scholar] [CrossRef]
- Wynants, M.; Schendel, A.; Welzel, M.; Kerpen, N.B.; Schlurmann, T. Current-distorted wave diffraction patterns in the near-field of a monopile in coastal seas. Ocean Engineering 2024, 302, 117432. [Google Scholar] [CrossRef]
Figure 1.
Location of the offshore wind farm in Laizhou Bay of Changyi City, Shandong Province, China.
Figure 1.
Location of the offshore wind farm in Laizhou Bay of Changyi City, Shandong Province, China.
Figure 2.
Schematic diagram of ‘Offshore Wind-Raft Aquaculture Integration’.
Figure 2.
Schematic diagram of ‘Offshore Wind-Raft Aquaculture Integration’.
Figure 3.
Experimental wave tank.
Figure 3.
Experimental wave tank.
Figure 4.
Experimental models and arrangement: (a) Wind turbine monopile model; (b) Mussel rope model; (c) Pontoon rafts model; (d) 50 kg tension sensor; (e) 10 kg tension sensor; (f) Picture of single-row PRAF model arrangement; (g) Picture of three-row PRAF model arrangement.
Figure 4.
Experimental models and arrangement: (a) Wind turbine monopile model; (b) Mussel rope model; (c) Pontoon rafts model; (d) 50 kg tension sensor; (e) 10 kg tension sensor; (f) Picture of single-row PRAF model arrangement; (g) Picture of three-row PRAF model arrangement.
Figure 5.
The installed monopile model and single-row PRAF model.
Figure 5.
The installed monopile model and single-row PRAF model.
Figure 6.
The layouts of PRAF in the wave tank: (a) The single-row arrangement with a monopile in bird-view; (b) The single-row arrangement with a monopile in side-view; (c) The three-row arrangement in bird-view; (d) The three-row arrangement in side-view.
Figure 6.
The layouts of PRAF in the wave tank: (a) The single-row arrangement with a monopile in bird-view; (b) The single-row arrangement with a monopile in side-view; (c) The three-row arrangement in bird-view; (d) The three-row arrangement in side-view.
Figure 7.
Boundary conditions of the numerical flume.
Figure 7.
Boundary conditions of the numerical flume.
Figure 8.
The scheme of grid settings around the wind monopile model.
Figure 8.
The scheme of grid settings around the wind monopile model.
Figure 9.
The locations of four set points to monitor wave heights in a numerical flume with the monopile.
Figure 9.
The locations of four set points to monitor wave heights in a numerical flume with the monopile.
Figure 10.
The maximum tensions of the upstream mooring line of the single-row PRAF under different wave periods and wave heights in the presence () and absence () of a monopile.
Figure 10.
The maximum tensions of the upstream mooring line of the single-row PRAF under different wave periods and wave heights in the presence () and absence () of a monopile.
Figure 11.
Comparison of the converted at prototype scale between a single-row PRAF with three rafts in ( from 0.025 to 0.084) and a raft facility in ( from 0.013 to 0.077).
Figure 11.
Comparison of the converted at prototype scale between a single-row PRAF with three rafts in ( from 0.025 to 0.084) and a raft facility in ( from 0.013 to 0.077).
Figure 12.
The maximum tensions of the upstream mooring line of single-row () and three-row ( and ) PRAF withiout a monopile under different wave periods and wave heights.
Figure 12.
The maximum tensions of the upstream mooring line of single-row () and three-row ( and ) PRAF withiout a monopile under different wave periods and wave heights.
Figure 13.
The maximum tensions of the bridle line for different wave periods and wave heights in the presence and absence of a monopile.
Figure 13.
The maximum tensions of the bridle line for different wave periods and wave heights in the presence and absence of a monopile.
Figure 14.
Comparison of the mooring line tensions and bridle line tensions for single-row PRAF under different wave conditions with and without monopile.
Figure 14.
Comparison of the mooring line tensions and bridle line tensions for single-row PRAF under different wave conditions with and without monopile.
Figure 15.
The maximum tensions of the bridle line for different wave periods and wave heights.
Figure 15.
The maximum tensions of the bridle line for different wave periods and wave heights.
Figure 16.
Comparison of the mooring line tensions and bridle line tensions for the three-row PRAF under different wave conditions.
Figure 16.
Comparison of the mooring line tensions and bridle line tensions for the three-row PRAF under different wave conditions.
Figure 17.
Comparison of the bridle line tensions for the single-row and three-row PRAF under different wave conditions.
Figure 17.
Comparison of the bridle line tensions for the single-row and three-row PRAF under different wave conditions.
Figure 18.
of the monopile under different wave conditions: (a) varies with wave period increasing from 1.0 s to 1.4 s (= 0.1125 m); (b) varies with wave height increasing from 0.063 m to 0.188 m (= 1.237 s).
Figure 18.
of the monopile under different wave conditions: (a) varies with wave period increasing from 1.0 s to 1.4 s (= 0.1125 m); (b) varies with wave height increasing from 0.063 m to 0.188 m (= 1.237 s).
Figure 19.
The relationship between and .
Figure 19.
The relationship between and .
Table 1.
Experimental wave conditions set up.
Table 1.
Experimental wave conditions set up.
| Case |
1 |
2 |
3 |
4 |
5 |
6 |
7 |
8 |
9 |
10 |
Wave Periods
T (s) |
1.0 |
1.1 |
1.2 |
1.3 |
1.4 |
1.237 |
1.237 |
1.237 |
1.237 |
1.237 |
| Wave Heights H (m) |
0.1125 |
0.1125 |
0.1125 |
0.1125 |
0.1125 |
0.063 |
0.100 |
0.125 |
0.156 |
0.188 |
Wave Length
L (m) |
1.56 |
1.88 |
2.23 |
2.59 |
2.97 |
2.36 |
2.36 |
2.36 |
2.36 |
2.36 |
Table 2.
Numerical simulation results of and
Table 2.
Numerical simulation results of and
| Case |
(m) |
(m) |
|
|
| 1 |
0.1313 |
0.1049 |
0.404 |
0.799 |
| 2 |
0.1161 |
0.955 |
0.335 |
0.823 |
| 3 |
0.1086 |
0.953 |
0.283 |
0.878 |
| 4 |
0.1073 |
0.1012 |
0.243 |
0.943 |
| 5 |
0.1097 |
0.104 |
0.212 |
0.948 |
| 6 |
0.59 |
0.532 |
0.267 |
0.902 |
| 7 |
0.987 |
0.882 |
0.267 |
0.894 |
| 8 |
0.1189 |
0.1053 |
0.267 |
0.886 |
| 9 |
0.1518 |
0.1331 |
0.267 |
0.877 |
| 10 |
0.1781 |
0.1543 |
0.267 |
0.866 |
|
Disclaimer/Publisher’s Note: The statements, opinions and data contained in all publications are solely those of the individual author(s) and contributor(s) and not of MDPI and/or the editor(s). MDPI and/or the editor(s) disclaim responsibility for any injury to people or property resulting from any ideas, methods, instructions or products referred to in the content. |
© 2025 by the authors. Licensee MDPI, Basel, Switzerland. This article is an open access article distributed under the terms and conditions of the Creative Commons Attribution (CC BY) license (http://creativecommons.org/licenses/by/4.0/).