Submitted:
22 January 2025
Posted:
22 January 2025
You are already at the latest version
Abstract
Background: Transposable elements (TEs) play crucial roles in genome evolution and ecological adaptation, yet their dynamics in non-model plant species remain poorly understood. Methods: Using a combination of genomic, transcriptomic and population genomics approaches, we analyzed the TE landscape in Barthea barthei, a unique member of Melastomataceae distributed across tropical and subtropical regions of South China. Results: Our analysis identified 64,866 TE copies comprising 16.76% of the compact genome (235 Mb), dominated by Ty3/Gypsy retrotransposons (8.82%) and DNA/Mutator elements (2.7%). Through genome-wide analysis, we discovered 13 TE islands enriched in genes related to photosynthesis, tryptophan metabolism, and stress response pathways. Moreover, we identified 3,859 high-confidence TE insertion polymorphisms (TIPs), including 29 fixed insertions between red and white flower ecotypes, affecting genes involved in cell wall modification, stress responses, and secondary metabolism. Transcriptome analysis of flower buds revealed 343 differentially expressed TEs between ecotypes, with 30 located near or within differentially expressed genes. The non-random distribution of TEs, predominantly within 5 kb of genes, and their association with adaptive traits suggest their significant role in B. barthei's successful colonization of diverse habitats. Conclusions: Our findings provide insights into how TEs contribute to plant genome evolution and ecological adaptation in tropical forest environments, particularly through their impact on regulatory networks governing stress response and developmental processes.
Keywords:
Transposable elements
; Ecological adaptation
; Genome evolution
; Barthea barthei
; TE insertion polymorphisms
1. Introduction
Transposable elements (TEs) make up a substantial proportion of most plant genomes. The hallmark of active TEs is their ability to copy/cut themselves and integrate elsewhere in the host genome. According to their transposition mechanisms [1], TEs are grouped into two classes: Class I (Retrotranspons, REs) and Class II (DNA transposons). REs proliferates via an RNA intermediate called ‘copy and paste’ strategy, whereas DNA transposons propagate via a DNA intermediate using a ‘cut and paste’ strategy. Alongside this classification system, TEs can also be divided into autonomous elements or non-autonomous elements based on their ability to transpose on their own or dependence on others. Furthermore, each class is hierarchically organized into orders, superfamilies, families, and subfamilies based on DNA sequence structure features and phylogenetic relationships [2]. In plant genomes, the order LTR (long terminal repeats) REs are usually the most prevalent type, and are subdivided into two superfamilies, Copia (RLC) and Gypsy (RLG), with size ranging from a few hundred base pairs to 25 kb [3]. Other orders in the non-LTR REs are mainly composed of LINEs (long interspersed sequences), SINEs (short interspersed sequences), DIRS (DIRS-like elements), PLEs (Penelope-like elements). Class II elements in the plant genomes are grouped into the order TIRs (terminal inverted repeats) or Helitrons. According the variations of target site duplications (TSDs) and terminal inverted sequences, the order TIRs are categorized into 6 superfamilies including Tc1–Mariner (DTT), hAT (DTA), Mutator (DTM), P (DTP), PIF– Harbinger (DTH), CACTA (DTC), respectively. With two terminal inverted repeated sequences but truncated or deleted internal transposase (Tase), MITEs (miniature inverted-repeat transposable elements) are another non-autonomous group of common DNA transposons in plant genomes. MITEs are usually short in length (less than 500 bp) but high in copy number (tens of thousands), such as the Stowaway family of MITEs and the Tourist family of MITEs in rice. However, according to the unified classification system [3], the designation of MITEs has no descriptive power in a taxonomic sense due to shared structural features with different origins. With a typical 5’TC and 3’CTRR motif and a short hairpin structure lying 15 ~ 20 bp before the 3′ end, the other order class II elements, Helirtrons, replicate via a unique rolling-circle mechanism and frequently duplicate passenger genes.
Once considered “junk DNA” or “parasites” in the host genome, TEs are now increasingly recognized as major determinants of genome architecture and organism evolution [4,5]. For example, genome size variations among different plant species are mainly attributed to their TE content, ranging from less 3% of the minute genome of the carnivorous bladderwort plant Utricularia gibba (77 Mb) [6], to over 70% of the giant genome of Norway spruce (Picea abies, 19.6 Gb) [7]. Counter-intuitively, the expectation that there is a positive correlation between genome size and TE diversity only held true when the genome size was less than 500 Mb. Beyond this threshold, this correlation no longer exists [8]. Despite having low transposable element diversity at the family level, the Norway spruce genome was dominated by a relatively small family number of long terminal repeat (LTR) elements with high copy numbers, which were estimated to range in age from 5 to 60 million years ago (MYA). In contrast, medium-sized genomes with high transposable element diversity usually exhibited high turnover rates, as evidenced by the vast majority of TEs being less than 5 million years old [7,9]. Why TE diversity was so variable among different species? Why have some transposable element (TE) superfamilies/families been so successful in certain lineages? So far, there are still few clues as to how environmental and genetic factors have modulated the accumulation and diversification of TEs across species [10]. With the increasing availability of plant whole-genome sequences, it is promising that we can characterize TE landscapes across a broader phylogenetic scale and untangle the causal mechanisms and processes underlying the observed variations.
Transposable elements are an important source of genetic variation within and across species, contributing to phenotypic innovations and adaptations through mechanisms like domestication, exaptation, host gene regulation, retrogene formation, and enhanced genomic plasticity [11,12,13]. Typically, TEs are rendered inactive in the genome through various silencing mechanisms like DNA methylation, histone modification, small RNA-based silencing, chromatin modifications [14]. However, these silenced TEs can become activated in response to stresses or developmental cues [15,16]. Diverse TE elements have been found to regulate a wide range of agronomically or ecologically relevant traits, such as flower color variation in morning glories [17], fruit coloration in apple [18], sex determination in melon [19], drought tolerance in maize seedlings [20], and photoperiod sensitivity in maize [21]. While these TE-driven trait variations have been primarily reported in crops and model species, the impact of TEs may be underestimated in natural populations, where a wider range of abiotic and biotic factors can influence their expression. With the increasing availability of non-model plant genomes, the hidden diversity of TEs is likely to be further revealed.
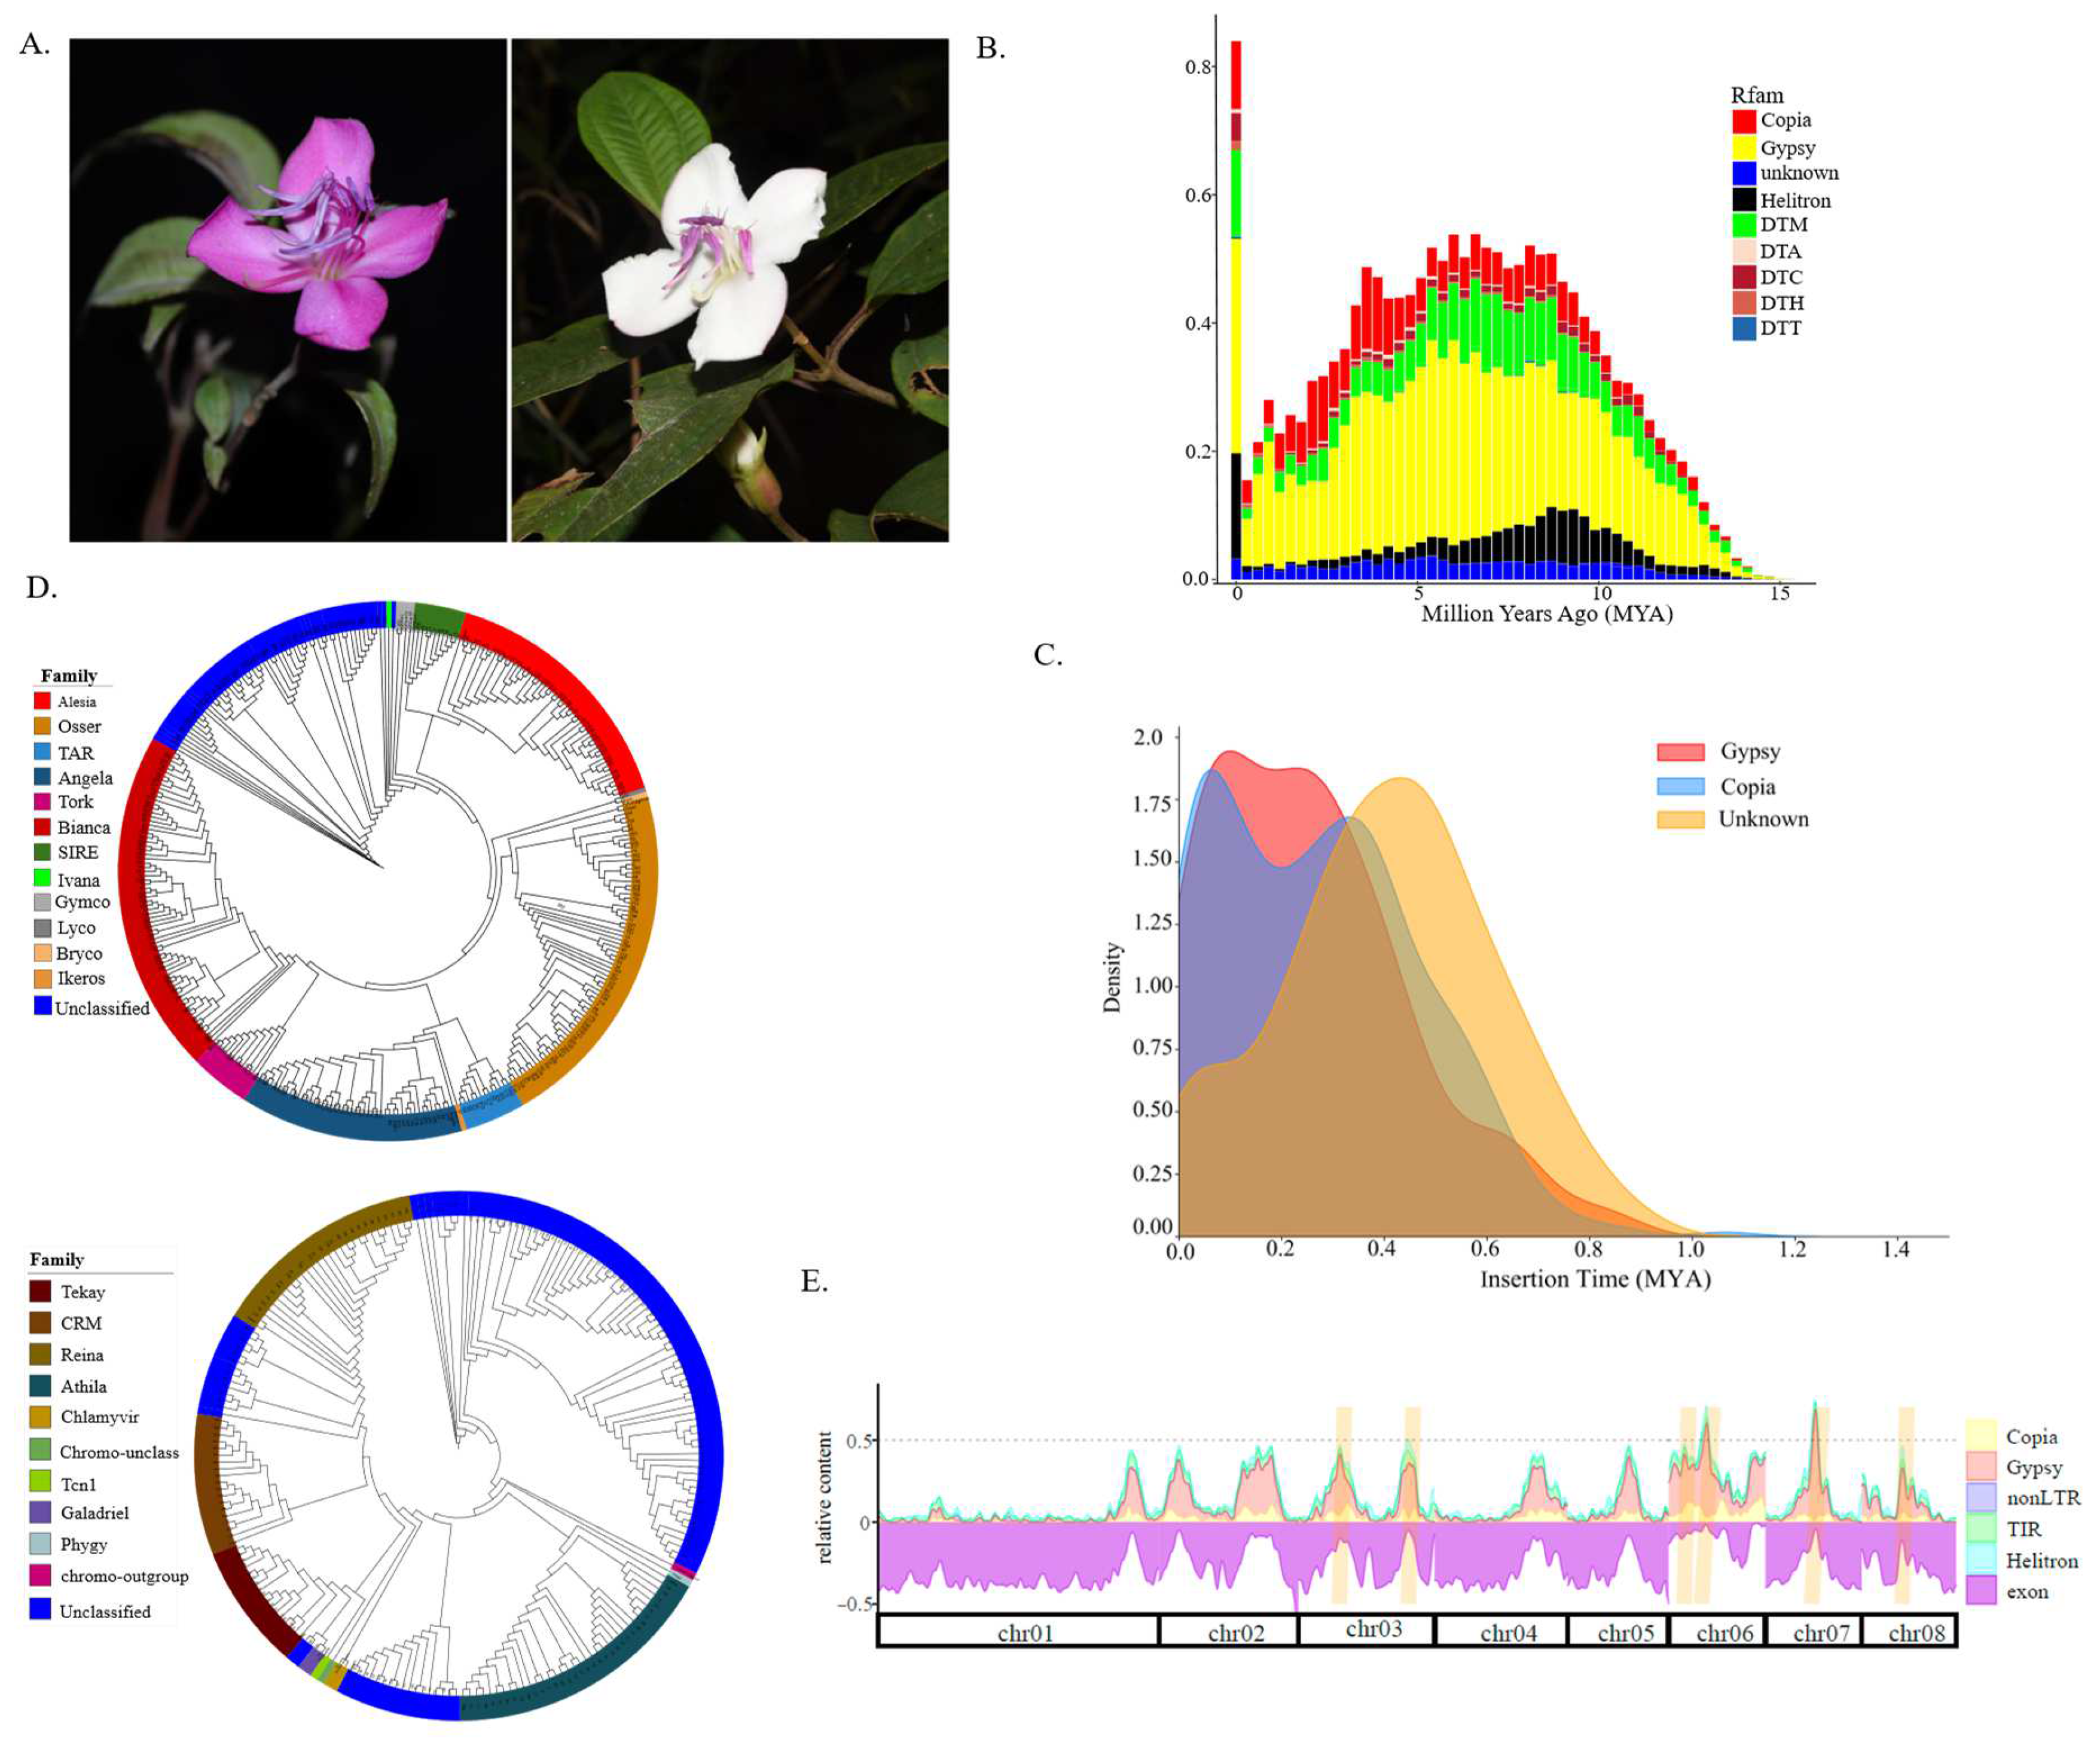
The evergreen shrub species Barthea barthei is the sole representative in the monotypic genus Barthea (Melastomataceae). It is exclusively found in southern mainland China, specifically in Hunan Province, Guangdong Province, Guangxi Province, and Fujian Province, as well as in Taiwan Province [22]. Two varieties were previously recognized based on the width of the capsule wings, but recent population genetic analysis did not provide support for this distinction [23]. In contrast to the uniform red flowers found in the Melastoma genus, the flower colors of B. barthei exhibit polymorphism among populations, with two distinct colors observed in natural populations spanning altitudes between 400 and 2500 meters (Figure 1A). The red-flowered populations tend to occupy open areas within the forest or mountain-tops, while the white-flowered populations are typically found in the understory forest, where light resources are limited. Based on their adaptation to varying light intensities, we designated these two population types as the 'red ecotype' and 'white ecotype,' respectively. In this study, we utilized de novo genome assembly of B. barthei and performed RNA-seq sequencing on the two ecotypes with the aim of characterizing the transposable element (TE) landscape of this unique species. Additionally, we sought to determine the role of transposable elements in the adaptation to contrasting light environments.
2. Materials and Methods
2.1. Plant Material and Sequencing
Flower buds of the two ecotypes of B. barthei were collected in the field. One ecotype with red petals were sampled from Erhuangzhang Nature Reserve, Yangcun county, Guangdong, China (EHZ population, E111°25′22.59″, N21°53′14.37″, alt.611m) and red ecotype from Lianhua Mt. Huidong county, Guangdong, China (LHS population, E115°13'56.10", N23°3'42.43", alt. 1280m). Flower buds for each ecotype were frozen using the Liquid-Nitrogen in the field, and taken back for total RNA isolation using the RNAprep Pure Plant Kit (TIANGEN Biotech Co. Ltd., Beijing, China). The quality of total RNA was determined using Agilent 2100 Bioanalyzer (Agilent Technologies, Palo Alto, CA, USA). The qualified RNAs were subject to paired-end library construction using Illumina TruSeq RNA Sample Preparation Kit (Illumina, San Diego, CA, USA), and sequenced on the Illumina Hiseq2500 platform using 150bp paired-end reads.
2.2. Transposable Elements Annotation of the Genome B. barthei and Phylogenetic Analysis
The published chromosome-level genome assembly of B. barthei were obtained using Pacific Biosciences single-molecule real-time sequencing on PacBio Sequel II platform and high-throughput chromatin conformation capture mapping [24]. Using the Extensive de novo TE Annotator (EDTA) package [25], we curated a non-redundant TE library for the B. barthei and annotated the genome. For the predicted LTR-RTs or non-LTRs in the categories of unknown superfamilies, a de novo classification tool with convolutional neural network implemented in the package DeepTE was used to classify them with a default probability threshold of 0.6 [26]. Using RPSBLASTN v.2.11.0+, all retroelements were searched against NCBI’s conserved domain database (CDDs, http://www.ncbi.nlm.nih.gov/Structure/cdd/cdd.shtml) [27], and only those retroelements hit to Pfam00078 (RVT_1, Ty3/Gypsy) or Pfam07727 (RVT_2, Ty1/Copia) with a significance E-value of 0.001 were extracted. To classify these filtered retroelements at the family level, one RT domain protein sequence from each family in the REXdb (Viridiplante v3.0) [28] were randomly selected. For those extracted nucleotide sequences, the putative amino acid sequences were determined using an ORF finder program (RRID:SCR_016643). Only those amino acid sequences with size over 50 were aligned using MAFFT v7.407 with default settings [29]. Prior to maximum likelihood phylogeny inferences, amino acid substitution models were determined using ModelTest-NG v0.1.7 [30]. Using RAxML v8.2.12 [31], the phylogeny inferences based on RT domains were implemented with 100 nonparametric bootstrap replicates. Customer scripts used in the data analysis were deposited at Github project (https://github.com/altingia/Barthea_TE_manuscript).
2.3. Insertion Time Calculation of Intact LTRs and History of TEs Proliferation Inference
The two long terminal repeats for LTR-RT were identical at the initial insertion moment, thus the divergence between them can be used to approximate the insertion time for an intact LTR-RT. Using the LTRpred v 1.1.3 tool [32], which is optimized for detecting intact LTR-RTs, the insertion ages were calculated based on a mutation rate of 1.3E-8 substitutions per site per year [33]. Additionally, the Kimura genetic distances between individual TE family copies and their consensus sequences were retrieved from the RepeatMasker output using the ‘parseRM.pl’ script. This information was then used to summarize and visualize the accumulated coverage of TE classes and subclass across different age ranges, providing insights into the proliferation history of transposable elements, as detailed in custom R scripts (https://github.com/altingia/Barthea_TE_manuscript /03.TE_islands/).
2.4. Relationship between Transposable Elements and Adjacent Genes and Transposable Element Islands in the Host Genome
Using TSSFinder [34], the Barthea specific model for transcription start site (TSS) were trained based on the initial model of Arabidopsis, then TSSs with TATA-box motif in the core promoter region in the upstream of B. barthei genes were predicted, only those TE elements located less upstream 1000 bp to the corresponding TSS were considered to be promoter insertion. We developed a versatile pipeline to identify the relative position and distance between each transposable element and its neighboring genes. We classified the relationship between a TE and its nearest gene into following categories: ‘upstream (promoter)’, ‘5-overlap’, ‘5-UTR’, ‘CDS’, ‘intron’, ‘3-UTR’, ’3-overlap’, ‘downstream’. For nested TE elements, we further determined the spanned regions by integrating the coordinates of the TE into the coordinates array of the corresponding gene features, which were recorded in a hash table. This approach allowed us to precisely map the positional relationships between TEs and gene features (https://github.com/altingia/Barthea_TE_manuscript/04.TE_gene_relationships).
We summarized the frequency of different categories, along with their associated distances or overlap lengths across various classes of TE elements. To assess TE abundance, we analyzed the genome using 500 kb sliding windows with a step size of 100kb along each linkage group. Windows with over 50% TE content coverage were designated as TE islands, and consecutive windows meeting this criterion were merged. Gene ontology (GO) terms and KEGG pathways for genes within TE islands, as well as for the entire genome, were assigned by aligning with the KOBAS v3.03 databases [35] with an E-value threshold of 1e-3. These annotations served as the foreground and background in enrichment analysis. The significance of the results was evaluated using the Benjamini-Hochberg (BH) test and False Discovery Rate (FDR) correction methods [36].
2.5. Transcriptome Profiles for Transposable Element and Genes between White and Red-ecotypes
Raw RNA-seq reads of flower buds, with three biological replicates for each population, were filtered and trimmed using Trimmomatic v0.39 [37] with default parameters (ILLUMINACLIP: TruSeq3-PE.fa:2:30:10 LEADING:3 TRAILING:3 SLIDINGWINDOW:4:15 MINLEN:36 TOPHRED33). The trimmed clean reads were then mapped to the reference genome assembly using the aligner STAR 2.7.9 [38] allowing multiple mapped reads with parameters settings as “ --outFilterMultimapNmax 100 -- winAnchorMultimapNmax 200 --outSAMtype BAM SortedByCoordinate”, in accordance with recommendations for TE analyses. For both TEs and genes were normalized to Counts Per Million (CPM, DESeq_default). Differential expression analysis between ecotypes was performed using the TEtranscripts v2.0.3 package [39] with the following parameters: “-stranded no -mode multi -p 0.05 -i 10”. In this analysis, only genes or TEs with reads mapping along the entire length were considered to be transcribed.
2.6. Transposable element insertion polymorphisms among B. barthei populations
According to the recommendations for specificity and sensitivity [40], we used SPLITEREADER pipeline beta-1.2 [41] and TEPID pipeline v0.10 [42] to identify non-reference insertion sites and reference absence variants respectively. For SPLITREADER pipeline, it identifies potential non-reference insertion sites individually. These sites are then merged and filtered by TE family across the population, keeping sites where at least one individual show 3 or more supporting reads. The process examines negative coverage patterns in nearby regions (100bp upstream and downstream) for both presence and absence variants. For presence variants, true non-reference sites show reduced coverage compared to surrounding areas. Similarly, true absence variants show coverage drops at their edges. Low-coverage genomes that lack sufficient evidence for either insertion presence (positive coverage) or absence (negative coverage) are marked as NA, as neither pipeline can make reliable calls for these cases. Single nucleotide polymorphisms (SNPs) were identified using the GATK pipeline following best practices [43,44]. Sequencing reads were aligned with BWA-MEM, duplicates were marked using Picard, and base quality scores recalibrated with GATK's BaseRecalibrator. Variants were called using GATK HaplotypeCaller, which accounts for local haplotype structures. Post-calling, SNPs were filtered using default GATK parameters: QD < 2.0, FS > 60.0, MQRankSum < -12.5, ReadPosRankSum < -8.0, and QUAL < 30.0 to ensure high-confidence variants. A principal component analysis (PCA) using identified TIPs was performed using the ‘prcomp’ function from the stats package v3.2.3 in R v3.4.4 [45]. The first two eigenvectors were retained to create a two-dimensional plot. We analyzed linkage disequilibrium (LD) patterns for each transposable element insertion polymorphism (TIP) using PLINK v1.9 [46]. For each TIP, we calculated the LD coefficient (r²) between the TIP and 300 SNPs on each side (upstream and downstream), as well as pairwise r² values among all 600 SNPs surrounding the TIP. We then compared the proportion of TIP-SNP pairs showing high LD (r² > 0.4) with the proportion of SNP-SNP pairs showing high LD. Similar patterns were observed using a less stringent threshold of r² > 0.2. To account for regional variation in LD patterns, we classified TE variants into 'low', 'medium', or 'high' LD categories by comparing their ranked r² values (TIP-SNP) against the median ranked r² value of SNP-SNP pairs in the same region.
3. Results
3.1. Composition and Proliferation History of Transposable Elements in the B. barthei Genome
Using the EDTA package, we curated a lineage-specific, non-redundant library of 1081 consensus TE sequences for B. barthei. Subsequent RepeatMasker analysis of the genome assembly revealed a total of 64,866 TE copies, accounting for 16.76% of the genome based on a 40% divergence threshold from the consensus sequences (Table 1). Additionally, we identified 19,316 copies of other repeat elements, including low-complexity regions and microsatellites, comprising 2.1% of the genome. The initial EDTA output classified 5923 LTR and 358 non-LTR copies as unclassified at the superfamily level. Further analysis with DeepTE successfully assigned 5665 of these LTR/unknown copies to Ty3/Gypsy (3768 copies) and the Ty1/Copia (1897 copies) superfamilies (Table 1). The unclassified non-LTRs were further categorized into 224 PLEs, 95 LINEs, 38 SINE/tRNAs, and 1 DIR. In total, we identified 24,296 Ty3/Gypsy (8.82%) and 9602 Ty1/Copia (2.47%) copies, together comprising 11.29% of the entire genome assembly. The non-LTR fraction included 588 LINEs/L1, 8 LINEs/I, 278 Penelope copies, and 220 tRNA copies (Table 1).
Class II DNA transposons accounted for 5.28% of the genome, with TIRs contributing 3.44% and Helitrons 1.63%. MITEs made up an additional 0.21% (Table 1). Among the TIR DNA transposons, the Mutator superfamily was the most abundant, with 13,868 copies (2.7%), followed by CACTA (2,820 copies, 0.49%), PIF-Harbinger (747 copies, 0.12%), hAT (516 copies, 0.09%), and Tc1-Mariner (127 copies, 0.04%). Of the 64,864 TEs identified, 1108 copies, representing 2.1% of the genome, were found to be intact. These including 120 LTR/Copia, 220 LTR/Gypsy, 1 nonLTR/PLE, 426 TIR/DTM, 118 TIR/DTC, 81 TIR/DTA, 38 TIR/DTH, 15 TIR/DTT, and 89 Helitron. The remaining 14.66% of the genome consisted of truncated or fragmented TEs (Table 1).
The age distribution of all TEs showed a sharp peak at zero, indicating recent proliferation of TEs, followed by a steep decline and a broad distribution spanning from 3 to 10 million years ago (MYA) (Figure 1B). Among the superfamilies, the order of decreasing proliferation was as follows: LTR/Gypsy, DNA/Helitron, DNA/DTM, LTR/Copia, DNA/DTC, and DNA/DTH, with most elements being younger than 15 MYA. We identified 782 intact LTR elements, consisting of 188 Ty1/Copia, 381 Ty3/Gypsy, and 213 unclassified elements. These insertions occurred between 0.001 and 1.064 MYA (Figure 1C), with a notable concentration within the last 1.00 MYA. Insertion times for Copia and Gypsy largely overlap, showing minor peaks under 0.5 MYA, whereas unclassified LTRs had an older peak (Figure 1C). Overall, this subset of intact LTR elements, being relatively recent, suggests they might still be mobile and functional.
Figure 1.
Transposable element landscape of Barthea barthei. (A) Photographs for two ecotypes of B. barthei; (B) The age distributions of different superfamiles measured by divergence with corresponding consensus sequences; (C) Insertion time distribution for intact LTR retrotransposons (LTR-RTs); (D) Classifications for LTR retrotransposons (LTR-RTs) based on phylogenies of reverse transcriptase (RT) domains for superfamily Ty1/Copia (above), superfamily Ty3/Gypsy (below); (E) Relative content of exonic and TE- derived sequences along the eight largest scaffolds of the B. barthei genome. Shown are DNA transposons (DNA), long interspersed nuclear element (LINE) and long terminal repeat (LTR) retrotransposons, as well as other TEs (other). The genome is well structured into TE- poor regions (“low- density regions,” LDRs) and TE- rich regions (“TE islands,” orange highlights).
3.2. Retrotransposon Classification Based on RT Domains
By analyzing RT domains, we identified 342 copies of Ty1/Copia elements and 214 copies of Ty3/Gypsy elements, which matched the RVT_2 and RVT_1 domain, respectively. This analysis included 17 Ty1/Copia and 12 Ty3/Gypsy family representatives, which were used to constructed a maximum likelihood phylogenetic tree for the LTR-RT sequences using PROTGAMMAJTT amino acid substitution model and a rapid bootstrap method. Within the Ty1/Copia, we identified nine distinct lineages. The most common were Osser (74 copies), Bianca (73 copies), Angela (47 copies), followed by less prevalent families such as Ale (20 copies), Sire (10 copies), Tork (12 copies), and Tar (12 copies) (Figure 1D). For the Ty3/Gypsy elements, the majority were unclassified (108 copies), while the remaining copies were categorized into Athila (36 copies), Renia (28 copies), CRM (18 copies), Tekay (16 copies), Galadriel (3 copies), and Chlamyvir (1 copy) (Figure 1D).
3.3. Identification and Characterization of Transposable Element Islands in Gene Spaces
Our investigation revealed an uneven distribution of transposable elements across the 20 linkage groups. We identified 13 TE islands, ranging in size from 20.9 kb to 1.4 Mb, which account for 11.7% of the genome’s total TE content (Figure 1E, Table S1, Figure S1). The largest of these TE islands, located on chromosome 6, extends over 1.4Mb. These TE islands contained 1037 protein-encoding genes, which exhibited significantly lower gene density compared to regions with fewer TEs presence (Fisher’s exact test, p-value < 2.2e-16). However, these regions were hotspots for genes involved in the photosynthesis pathway (ath00195, FDR = 2.2E-09, Benjamini-Hochberg (BH) test) and the tryptophan metabolism pathway (ath00380, FDR = 0.04, BH test). Additionally, 29 GO terms, particularly those related to abiotic stress (e.g., 'response to hydroxyurea', 'response to aluminum ion', 'response to UV-B'), were significantly enriched in these TE islands (Table S2). This suggests that the genetic evolution of B. barthei has been shaped by its adaptation to the acidic, aluminum-saturated soils and variable light conditions in South China.
3.4. Genome-wide Survey of Transposable Element Insertion Preferences in the B. barthei Genome
A genome-wide survey was conducted to map transposable element insertion sites in the B. barthei genome using a flexible pipeline (http://github.com/alitniga/04.TE_gene_relationships) (Figure S2, Table S3). Of the 64,864 identified TE copies, 63,665 were mapped relative to neighboring genes, while 1199 were found unannotated scaffolds (Table 2). Analysis revealed that transposable elements (TEs) showed preferential insertion in upstream regions of genes (45.8%; 29,144 copies) compared to downstream regions (41.7%; 26,562 copies). For LTR-RTs, more higher proportions were located more than 5 kb away from the nearest genes in both upstream and downstream regions (Figure S3A, S3B). In contrast, DNA transposons (both TIRs and Helitrons) were predominantly found within 5 kb of genes (Figure S3C, S3D). In total, 17,991 upstream and 14,845 downstream TEs were located within 5 kb of neighboring genes. Additionally, 577 TE copies were identified within gene promoters, affecting 431 genes (Table 2). Approximately 26.1% of B. barthei genes had at least one TE copy within 1 kb - a lower frequency compared to Arabidopsis (36%) or maize (86%) [47,48]. The most common TE types near genes were LTR/Gypsy, DNA/TIRs, LTR/Copia, DNA/Helitrons, and nLTR (Table 2). The study identified. Only a small proportion of genes with adjacent TEs showed significant GO term enrichment, including 'ADP binding '(GO0043531) and 'response to ethylene ' (GO0009723) (Table S4, Table S5). Additionally, 760 TE copies overlapped with gene 5' ends and 630 with the 3' ends.
Intriguingly, 6569 copies (10.3%) were found nested within host genes, classified as intronic, coding sequence (CDS), or untranslated region (UTR) TEs (Table 2). Single-intron nested TEs were most prevalent, with 5,454 copies distributed across 2560 genes. The gene Barthea36295, homologous to LUTEIN DEFICIENT 5 (a cytochrome P450 member in Vitis vinifera) [49], contained the highest number of copies (37), with 23 located in its third intron (Figure S4a). Genes containing single-intron nested TEs showed significant enrichment for ‘cytosol’ (GO:0005829, FDR = 3.3E-6) and ‘cytoplasm’ (GO:0005737, FDR = 3.2E-4) (Table S6).
For exon-nested transposons, 635 copies were identified within 227 genes, predominantly in UTR regions (190 in 5' UTR, 370 in 3' UTR) rather than CDS regions (75 copies in 43 genes). The gene Barthea44534, homologous to beta-glucosidase 12-like [50], contained the highest number of UTR-nested TEs (22 copies) (Figure S4b). Particularly, Barthea28554, homologous to the beta' subunit of RNA polymerase, contained the highest number of DNA/DTM copies in its sequences (Figure S4c). Notably, while eight genes lacked significant hits, 35 others resembled conserved proteins such as Ribonuclease, Reverse transcriptase, plant disease resistance polyprotein, heat shock protein, and others (Table S7). Genes containing exon-nested TEs were associated with cellular and stress responses, including protein folding chaperone activity and response to temperature stimulus (Table S8). Additionally, 480 TE copies spanning multiple introns/exons were found in 618 genes, linked to developmental processes and epigenetic modification (Table S9).
3.5. Expression Profiles of Genes and Transposable elements During Flower Bud Development between Contrasting Ecotypes
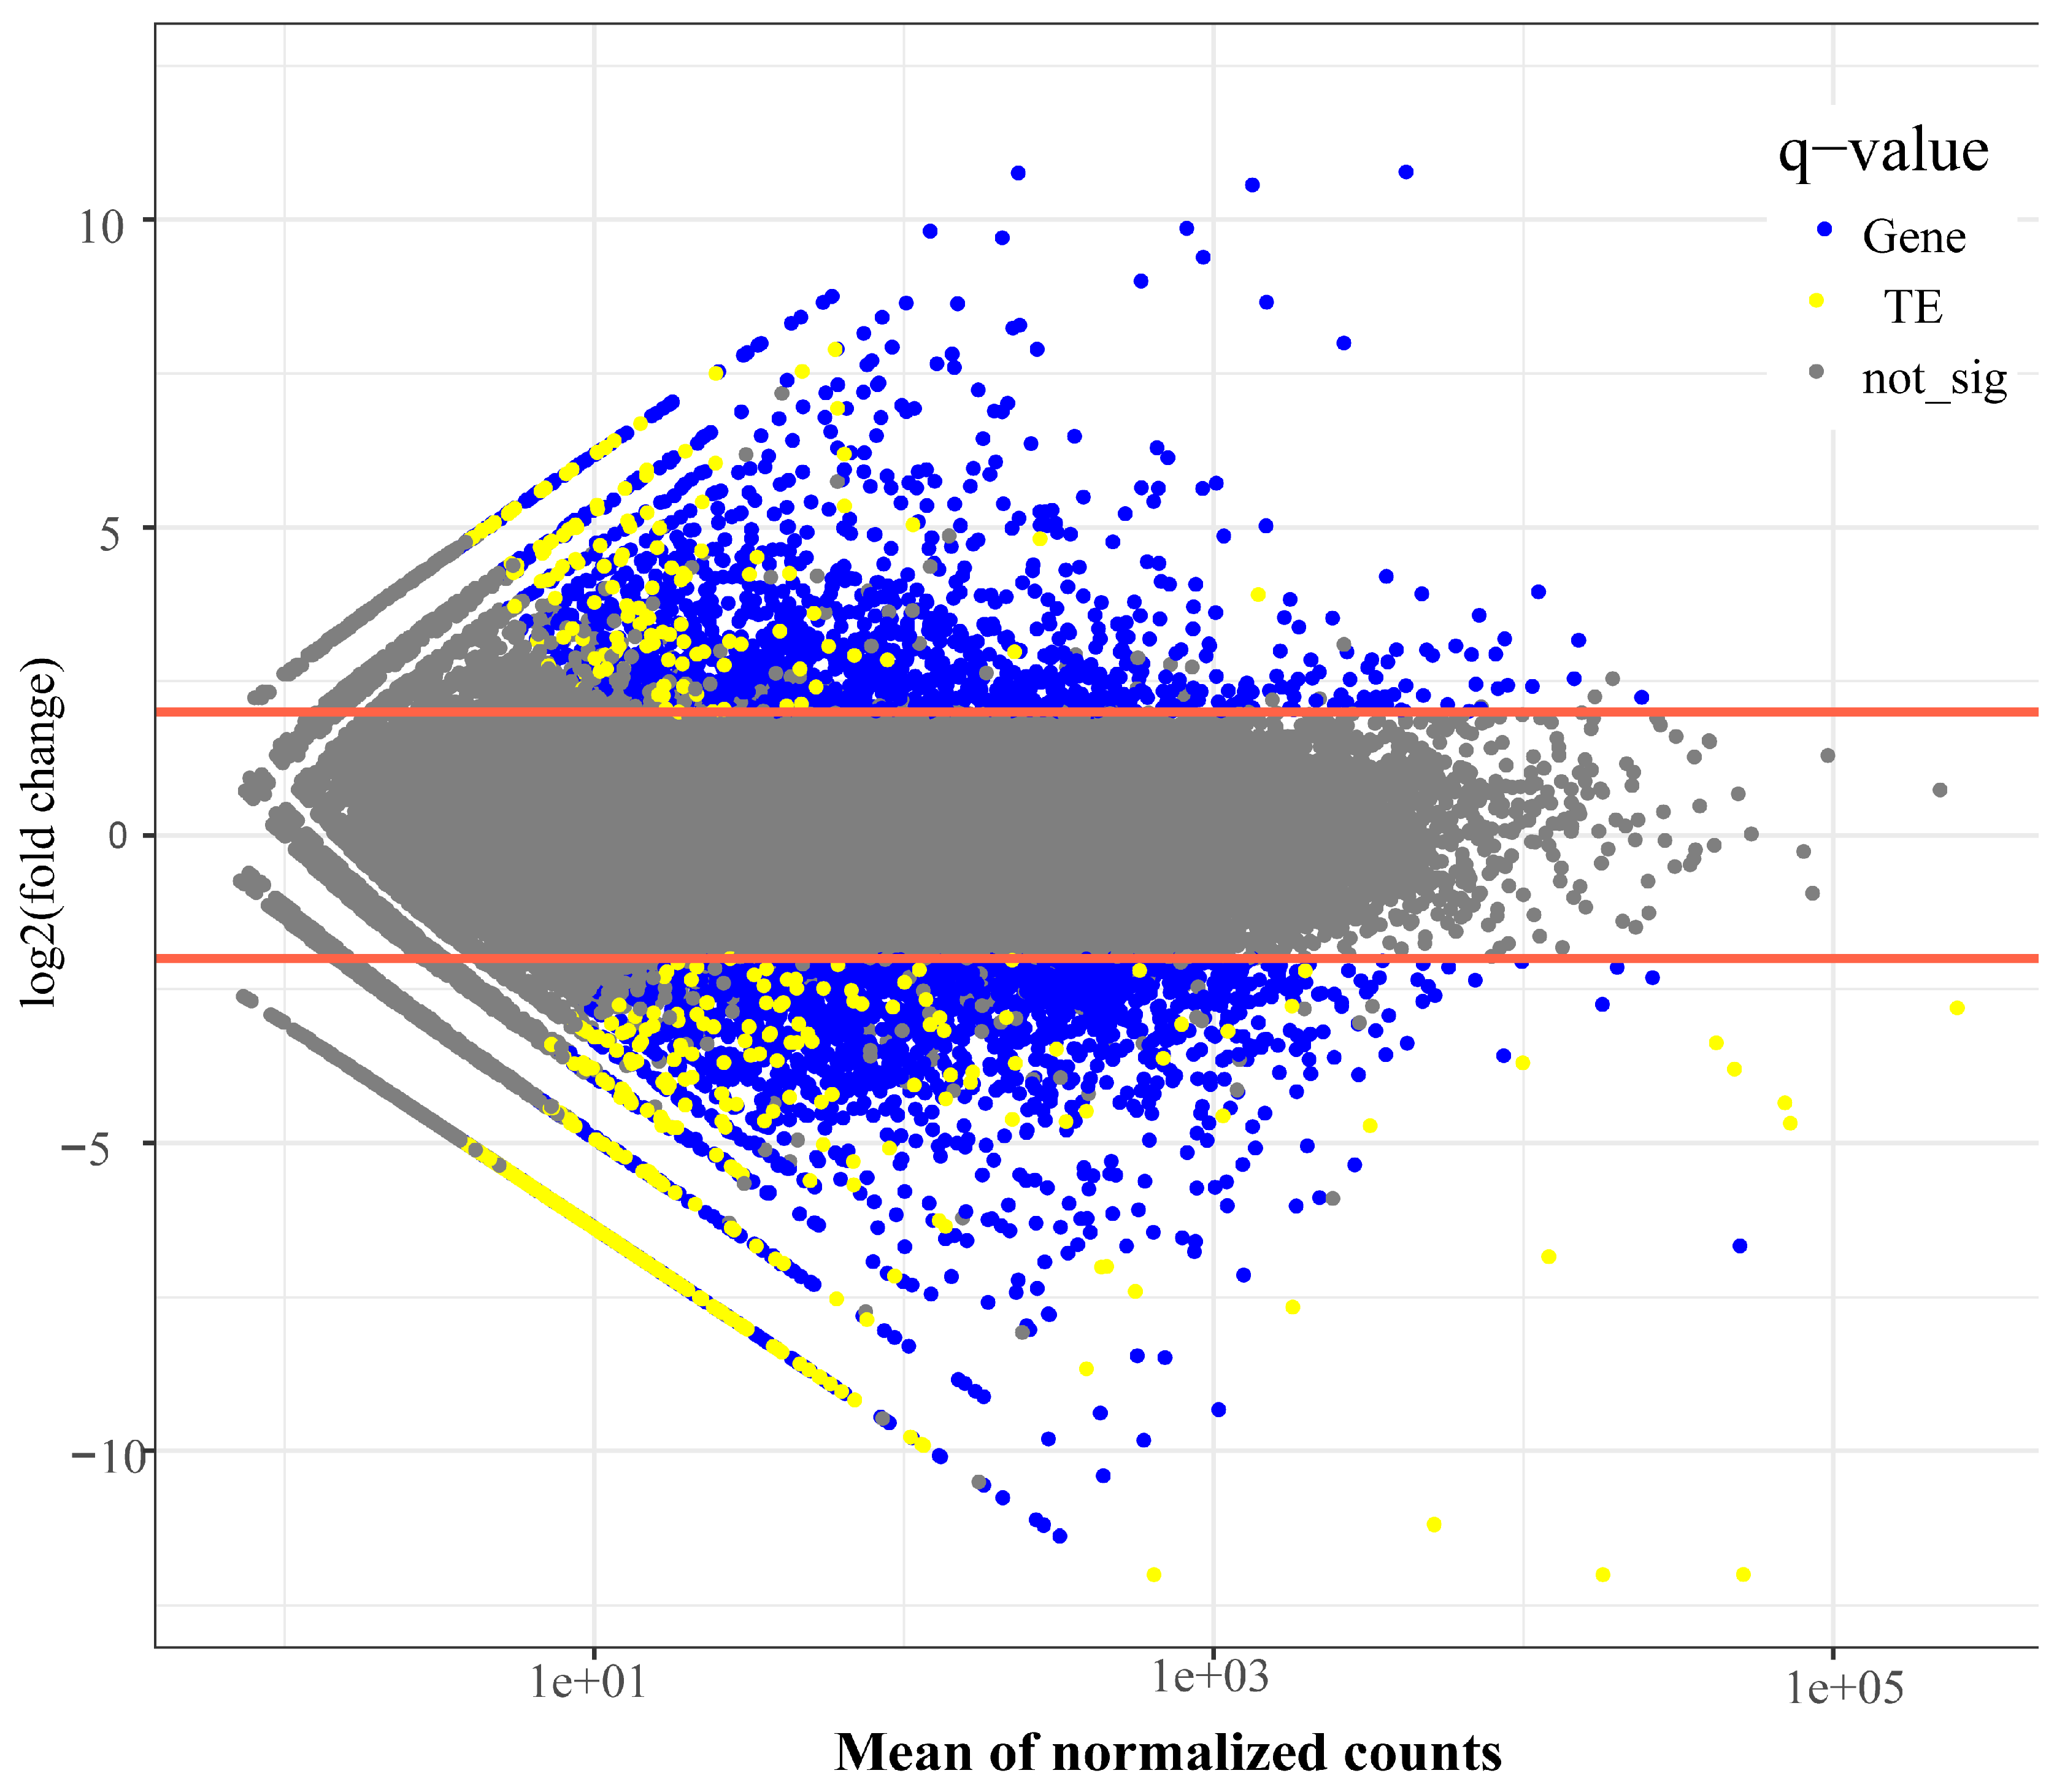
Initial validation of RNA-sequencing samples through hierarchical clustering demonstrated high reproducibility within ecotypes (Figure S5). Transcriptome analysis identified 40,538 expressed genes and 4495 transcribed TE copies (Figure 2, Table S10). Differentiation expression analysis, using stringent criteria (baseMean > 10, |log2FoldChange| ≥ 2, and Padj < 0.05), identified 2544 differentially expressed genes (DEGs), comprising 1357 up-regulated and 1187 down-regulated genes between the two ecotypes (Table S11).
KEGG pathway enrichment analysis of DEGs revealed three significantly pathways (Table S12). The photosynthesis-antenna proteins (KO00196, FDR = 3.23E-8, BH test) included 20 DEGs corresponding to 12 Arabidopsis proteins, including LHCA1~LHCA6, LHCB1~LHCB 6 (Table S13), which are essential for energy equilibrium under variable light [51]. The phenylpropanoid biosynthesis (KO00940, FDR = 1.50E-7, BH test) comprised 51 DEGs, homologous to 30 Arabidopsis proteins (Table S14, S15), playing crucial roles in lignin and flavonoid synthesis and light-induced stress response [52]. The cutin, suberine, and wax biosynthesis (KO00073, FDR = 2.09E-4, BH test) contained 15 DEGs annotated as homologs of various Arabidopsis proteins, including HXXXD-type acyl-transferase family protein, FAR2, CYP86A1, CER1, CYP704B1, CYP86B1 in Arabidopsis (Table S16), which are involved in producing protective cuticular waxes against environmental stressors [53,54].
Figure 2.
The distribution of differentially expressed genes and transposable elements between the white petal ecotype and purple ecotype during flower bud development of Barthea barthei. The significant levels were determined using a log2FoldChange > 2 and an adjusted p-value of 0.05.
Figure 2.
The distribution of differentially expressed genes and transposable elements between the white petal ecotype and purple ecotype during flower bud development of Barthea barthei. The significant levels were determined using a log2FoldChange > 2 and an adjusted p-value of 0.05.
Among the transcribed TEs, retrotransposons were predominant, with 1457 transcripts identified, including 1059 LTR/Gypsy, 206 LTR/Copia, 148 LTR/unknown elements, and 44 LINEs/unknown elements. These elements were frequently observed near genes or within single introns, with LTR-REs maintained an average distance of 5738.5 bp from adjacent genes (Table 3, Table S17). Additionally, 1938 DNA transposon transcripts (43.1% of expressed TE transcripts) were detected, comprising various types: 403 DNA/DTC, 626 DNA/DTM, 48 DNA/DTH, 45 DNA/DTA, 27 DNA/DTT, 140 MITEs, and 649 Helitrons. Of these, 855 transcripts (19.0%) were located within intron/UTR/CDS regions, while the remainder were positioned at an average distance of 1881 bp from their respective genes (Table 3, Table S17). The consistent detection of DNA transposon-derived transcripts across samples suggests these are not mere DNA contaminants, as previously suggested in other RNA-seq studies [55,56]. Rather, their distribution pattern-42.8% nested within genes and 57.2% located within 2000 bp of host genes – indicates probable passive co-transcription. Furthermore, 1083 unclassified TE transcripts were identified, with 391 nested within introns/UTR/CDS and 605 positioned near host genes at an average distance of 7995.8 bp (Table 3).
Differential express analysis of TEs revealed 343 significantly differentially expressed elements between ecotypes, comprising 90 upregulated and 253 downregulated TEs (Figure 2, Table S18). These included 76 LTR/Gypsy elements, 16 LTR/Copia elements, 9 LTR/unknown elements, 125 DNA transposons, and 117 elements of unknown type. Notably, 30 of these differentially expressed TEs were located near or nested within genes (Table S19). Statistical analysis demonstrated that overall, TE expression levels were significantly lower than genes expression levels (t-test, p= 1.91e-07).
3.6. Transposable Element Insertion Polymorphisms among Two Ecotypes
After stringent filtering, we identified 3859 high-confidence transposable element insertion polymorphisms (TIPs), including 3615 non-reference TE presence variants and 244 reference absence variants (Table S20). The majority of these TIPs were attributed to Gypsy (2,764) and Copia (231), along with DNA transposon superfamilies DNA/DTM (488) and DNA/DTA (128) (Figure 3A). Site frequency spectrum (SFS) analysis of TIPs, based on informative genomes at each site, showed that 1.62% of TIPs had a minor allele frequency below 0.05, though this proportion may be underestimated due to limited sample size (Figure 3B).
ecotype from YC population and purple ecotype from HD population of Barthea barthei. A. Superfamily components and proportions of non-reference transposon element insertion variants (Left) and reference absence variants (Right); B. The minor allele frequency (MAF) distribution of transposable element insertion polymorphism for B. barthei; C. Counts of TE variants with different minor allele frequencies within each genomic feature classified as coding regions (CDS), intergenic regions, intron and untranslated regions (UTR) regions; D. Principal component analysis for the samples of red ecotype and white ecotype based on non-reference TE insertion variants and reference TE absence variants; E. Pattern of transposable element variants and single nucleotide polymorphisms (TE – SNP) linkage, Boxplots showing distribution of minor allele frequencies for Boxplots showing distribution of minor allele frequencies for each LD category (high, mid, low); Proportion of TE insertions, TE deletions in each LD category (below).
Distribution analysis of TIP variants with estimated minor allele frequencies (MAF) revealed 1,699 in intergenic regions, 415 in introns, 264 in UTRs, and 95 in CDSs. Within each genomic category, variant frequency decreased consistently across increasing MAF bins from 0-0.1 to 0.4-0.5 (Figure 3C). Principal component analysis of TIPs demonstrated significant genetic differentiation between HD and YC populations, underscore the role of TIPs in distinguishing the genetic makeup of these populations (Figure 3D). Linkage disequilibrium (LD) analysis with nearby single nucleotide polymorphisms (SNPs) classified 51.4%, 39.0% and 9.6% of TE variants as having low, intermediate, and high LD, respectively. A positive correlation was observed between MAF and LD state, with higher MAF variants more frequently exhibiting high LD. This pattern was consistent across both TE insertions and deletions (Figure 3E). Notably, the classification of TE variants into high, intermediate, or low LD categories was largely consistent between TE insertions and TE deletions (Figure 3E), supporting the observation that common alleles tend to exist in high-LD states.
Twenty-nine fixed TIPs associated with 28 genes were identified between HD and YC populations (Table S21). These TIPs were distributed across various genomic regions: 22 in intergenic regions, 3 in introns, 2 each in CDS and UTR regions. The affected genes included homologs of various transcription factors (AP2/ERF, bHLH, MYB-like, C2H2) and key enzymes such as Homocysteine S-methyltransferase (HMT), alpha/beta hydrolase fold, and 2OG-Fe (II) oxygenase superfamily (Table S22). Three genes containing fixed TIPs showed differential expression between white and red color ecotypes. Barthea13541 (log|fold change| = -2.70, P-adj = 0.0003), containing a non-reference DNA/DTM insertion in YC population, is homologous to Pmr5/Cas1p GDSL/SGNH-like acyl-esterase family protein, which influences cell wall modification, plant-pathogen interactions, stress responses, development [57]. Barthea35147 (log|Fold Change| = 3.90, P-adj = 0.002), with a fixed DNA/DTM present in HD but absent in YC, is homologous to transcription factor AP2/ERF, which regulates plant morphogenesis, stress responses, hormone signaling, and metabolism [58,59]. Barthea36291 (log|Fold Change| = 4.05, P-adj = 0.003), containing a fixed DNA/DTA present in YC but absent in HD, is homologous to Cytochrome P450 (CYPs), which synthesizes various compounds crucial for membrane structure, hormones, UV protection, pigments, signaling, and volatile compounds that mediate biotic and abiotic interactions [60].
4. Discussion
4.1. Impact and Distribution of Transposable Elements in the Compact Genome of B. barthei
The B. barthei genome, spanning 235,034,099 bp, exhibits a relatively low proportion of TE components, consistent with its compact nature. This proportion aligns with the wide range of TE content observed across plant genomes, from 2.5% in the bladderwort U.gibba [6] to 85% in maize [61]. Among plant genomes, the Ty1/Copia and Ty3/Gypsy superfamilies predominate, distinguished by their distinct arrangements of RT (Reverse Transcriptase) and INT (Integrase) sequences within the POL (Polymerase-like protein) open reading frames. The higher abundance of Ty3/Gypsy copies in Viridiplantae compared to Ty1/Copia [62] may reflect their distinct genomic distributions: older Ty3/Gypsy elements typically occupy heterochromatic regions, while younger Ty1/Copia elements are more prevalent in euchromatic areas where recombination suppression is reduced [63,64].
The B. barthei genome contains five well-recognized superfamilies of Class II DNA transposons, though notably lacks the P superfamily. The relative abundance of these elements varies considerably among plant species [65], with TIR and Helitron transposons showing particularly marked interspecific variation compared to the more stable prevalence of LTR retrotransposons. For instance, Arabidopsis harbors more Helitron copies than TIRs, and DNA transposon abundance can differ significantly even between closely related species [66]. Although DNA transposons typically constitute a small fraction of plant genomes, their frequent proximity to genes and role as mutagens significantly influences genome structure [65]. Mutator-like elements (MULEs), particularly active in plants, can increase mutation rates up to 50-fold [67]. Pack-MULEs, can generate biased gene modifications through selective insertion and DNA capture [68]. In B. barthei, Mutator elements emerge as the predominant DNA transposons, likely serving as important contributors to genomic diversity through their mutagenic activity.
This analysis reveals the complex dual nature of TEs in the B. barthei genome: they simultaneously serve as sources of genetic variation and potential threats to genomic integrity. Their ultimate impact on genome evolution and adaptation depends on both their regulatory mechanisms within the genome and the broader ecological and evolutionary context of the organism. The balance between promoting adaptability and maintaining genome stability appears to be particularly refined in B. barthei’s compact genome.
4.2. TE Island Facilitates the Adaptation to Tropical Forest for B. barthei
The TE islands in B. barthei, despite their sparse gene distribution, exhibit non-random gene enrichment patterns, particularly in pathways related to photosynthesis, tryptophan metabolism, abiotic stress tolerance. Photosynthesis, the fundamental process of converting carbon dioxide (CO2) into sugars, is notably sensitive to various abiotic stressors including ultraviolet (UV) radiation, light intensity fluctuations, and hypoxic or anoxic conditions [69]. Additionally, the tryptophan metabolism pathway plays a crucial defensive role against pathogenic infections, as demonstrated in both rice or Arabidopsis [70,71]. This pathway’s enrichment in B. barthei’s TE islands may confer evolutionary advantages against pathogens and herbivores, particularly relevant given the Janzen-Connell hypothesis, which emphasizes their role in maintaining tropical forest diversity [72].
B. barthei stands out among Melastomaceae species for its extension into southern subtropical areas of South China. This distribution pattern aligns with MacArthur’s (1972) ecological paradigm, which posits that species' geographical ranges along environmental gradients are constrained by abiotic factors at one extreme and biotic pressures at the other [73]. To overcome these constrains, B. barthei has developed various adaptive traits, including enhanced photosynthetic capacity, polymorphic flower colors, and diverse growth forms. These adaptations are particularly evident in high-altitude populations, such as the purple-flowered ecotype from Huidong county, Guangdong province. This ecotype, adapted to an environment characterized by mountain mists, variable rainfall, strong winds, and intense sunlight, exhibits distinctive features including deep purple flowers, thick coriaceous leaves, and compact growth structure.
While the adaptive significance of TE islands has been well-documented in species such as the invasive ant C. obscurior [12], where they facilitate relaxed selection and enable genetic modifications that enhance chemical perception, learning, and insecticide resistance, their role in plant adaptation remains less understood. In B. barthei, the diverse phenotypes observed in flower color and leaf texture suggest that TE islands may play a crucial role in facilitating expansion into various ecological niches. Further research is needed to elucidate how transposable elements adjacent to candidate genes regulate these adaptive traits, potentially revealing the mechanisms by which TE islands contribute to B. barthei ‘s successful adaptation to tropical forest environments.
4.3. Transposable Element Insertion Preferences and Polymorphisms Associated with Ecological Divergence between Ecotypes
The distribution of transposable elements in the B. barthei genome reveals distinct insertion patterns and their potential role in ecological adaptation. While only 26.1% of B. barthei genes are associated with TEs – markedly lower than the 78% observed in maize [74] – both species show similar patterns of TE distribution, with most copies residing within 5 kb of genes rather than within their coding regions. Our genome-wide survey identified 3859 high-confidence TE insertion polymorphisms, predominantly contributed by Gypsy (2764) and Copia (231) elements, along with DNA transposon superfamilies DNA/DTM (488) and DNA/DTA (128). The distribution of these polymorphic insertions mirrors the general pattern of TE insertion preferences, with the majority occurring in intergenic regions (1699) followed by introns (415), UTRs (264), and CDS regions (95).
The non-random distribution of TEs reflects the interplay between natural selection and genetic drift [75]. The decreasing frequency of TIP variants across increasing minor allele frequency (MAF) bins suggests ongoing selection pressures, particularly against potentially deleterious insertions within gene bodies. This selective pressure is further evidenced by the linkage disequilibrium (LD) patterns, where 51.4% of TE variants showed low LD with nearby SNPs, while only 9.6% exhibited high LD. The positive correlation between MAF and LD state suggests that beneficial or neutral TE insertions are more likely to persist and become common variants.
The impact of TE insertions varies considerably depending on their genomic location [76]. Insertions in regulatory regions (promoter, enhancers) can lead to three distinct outcomes: gene expression nullification, enhanced expression through new cis-regulatory sites, or silencing via repressive chromatin marks [77]. This regulatory potential is exemplified by cases such as the Copia-like element insertion into upstream of the ruby gene, a key MYB transcriptional activator, affecting anthocyanin production in blood oranges [78]; and two independent insertions by a MITE and an LTR element in the teosinte branched1 (tb1) locus led to increased apical dominance and altered ear morphology during maize domestication [79].
The significant genetic differentiation between HD and YC populations revealed by TIP-based PCA analysis underscores the role of TE polymorphisms in ecological divergence. Particularly noteworthy are the 29 fixed TIPs associated with 28 genes between these populations, including three differentially expressed genes that may contribute to ecotype-specific adaptations. The fixed DNA/DTM insertion affecting Barthea13541 in the YC population potentially influences cell wall modification and stress responses through its homology to Pmr5/Cas1p GDSL/SGNH-like acyl-esterase. Similarly, the ecotype-specific insertions near Barthea35147 (AP2/ERF homolog) and Barthea36291 (Cytochrome P450 homolog) likely contribute to divergent morphogenesis, stress responses, and secondary metabolism between white and red ecotypes.
While intron-nested insertions constitute 8.6% of total insertions and have been linked to natural phenotypic variations in other plants - such as the double-flower variants in Japanese morning glory [80] and yellowhorn [81] – CDS insertions remain rare due to strong negative selection. The few surviving CDS-nested TEs, like the Copia insertion affecting salt sensitivity in soybean [82], typically represent ancient, conserved elements. This pattern of insertion distribution, combined with the fixed polymorphisms between ecotypes, suggesting that TEs have played a significant role in the adaptive divergence of B. barthei populations across different ecological niches.
5. Conclusions
Our comprehensive analysis of the transposable element landscape in B.barthei reveals several significant findings regarding genome organization and ecological adaptation. The compact genome of B. barthei (235 Mb) contains a relatively low proportion of TEs, with distinct patterns of distribution dominated by Ty3/Gypsy elements and Mutator-like DNA transposons. Despite their limited abundance, these TEs demonstrate a clear non-random distribution pattern, with most elements residing within 5 kb of genes, suggesting their potential regulatory roles in genome evolution and adaptation.
The identification of TE islands enriched in genes related to photosynthesis, tryptophan metabolism, and stress response provides compelling evidence for their role in ecological adaptation. These genomic features likely facilitated B. barthei's successful colonization of diverse habitats across tropical and subtropical regions of South China, as evidenced by distinct ecotypes such as the purple-flowered variant in Huidong county.
Analysis of 3,859 high-confidence TE insertion polymorphisms revealed significant genetic differentiation between populations, particularly between HD and YC ecotypes. The discovery of 29 fixed TIPs associated with 28 genes, including those involved in cell wall modification, stress responses, and secondary metabolism, suggests that TE-mediated genetic variations have contributed substantially to ecological divergence in B. barthei. The observed patterns of TE distribution and polymorphism, characterized by preferential insertion in intergenic regions and strong selection against CDS insertions, reflect the delicate balance between generating adaptive variation and maintaining genome stability.
These findings enhance our understanding of how TEs contribute to plant genome evolution and adaptation, particularly in the context of tropical forest environments. Future research should focus on elucidating the specific regulatory mechanisms by which TE insertions influence adaptive traits, potentially offering insights into the role of mobile genetic elements in plant speciation and ecological divergence.
Supplementary Materials
The following supporting information can be downloaded at: Preprints.org, Figure S1~5: Supplementary_Figures_Barthea_TE.pdf; Table S1~S22: Supplementary_Tables_Barthea_TE.xlsx.
Author Contributions
Conceptualization, W.W. and B.X.; methodology, W.W., Y.Z., B.X., Z.H., H.P., Z.S.; software, W.W., Y.Z., B.X., Z.H., H.P., Z.S.; validation, W.W., Y.Z, Z.H; formal analysis, W.W., Y.Z, B.X; investigation, W.W., Y.Z.; resources, W.W. and B.X.; data curation, W.W., Y.Z.; writing—original draft preparation, W.W., Y.Z.; writing—review and editing, W.W., Y.Z.,B.X., Z.H., H.P., Z.S; visualization, W.W., Y.Z; supervision, W.W. and B.X.; project administration, W.W. and B.X.; funding acquisition, W.W. and B.X. All authors have read and agreed to the published version of the manuscript.
Funding
This research was financially supported by Science and Technology Program from Forestry Administration of Guangdong Province, grant number 2020KJCX002.
Institutional Review Board Statement
Not applicable.
Informed Consent Statement
Not applicable.
Data Availability Statement
The raw data of whole genome sequencing and RNA sequencing are deposited in the Genome Sequence Archive (GSA accession: CRA012896 under the project PRJCA020264) in China National Genomics Data Center (NGDC) database. The genome assemblies and annotations were available with accession.: GWHDUDN00000000.
Acknowledgments
We are grateful to Mr. Yubing Zhou for help with technical assistance.
Conflicts of Interest
The authors declare no conflicts of interest.
Abbreviations
The following abbreviations are used in this manuscript:
| DIRS | DIRS-like elements |
| DTA | hAT |
| DTC | CACTA |
| DTH | PIF– Harbinger |
| DTM | Mutator |
| DTT | Tc1–Mariner |
| GO | Gene ontology |
| KEGG | Kyoto Encyclopedia of Genes and Genomes |
| LD | Linkage disequilibrium |
| LINEs | Long interspersed sequences |
| LTRs | Long terminal repeats |
| MITEs | Miniature inverted repeats |
| MYA | Million years ago |
| P | DTP |
| PCA | Principal component analysis |
| PLEs | Penelope-like elements |
| RE | Retrotransposon element |
| RLC | LTR/Copia |
| RLG | LTR/Gypsy |
| SINEs | Short interspersed sequences |
| SNPs | Single nucleotide polymorphisms |
| TE | Transposable element |
| TIRs | Terminal inverted repeats |
| TSDs | Target site duplications |
| TSS | Transcription start site |
| UTR | Untranslated region |
References
- Finnegan, D.J. Eukaryotic transposable elements and genome evolution. Trends in Genetics 1989, 5, 103–107. [Google Scholar] [CrossRef] [PubMed]
- Arkhipova, I.R. Using bioinformatic and phylogenetic approaches to classify transposable elements and understand their complex evolutionary histories. Mobile DNA 2017, 8, 19. [Google Scholar] [CrossRef]
- Wicker, T.; Sabot, F.; Hua-Van, A.; Bennetzen, J.L.; Capy, P.; Chalhoub, B.; Flavell, A.; Leroy, P.; Morgante, M.; Panaud, O.; et al. A unified classification system for eukaryotic transposable elements. Nature Reviews Genetics 2007, 8, 973–982. [Google Scholar] [CrossRef] [PubMed]
- Lisch, D. How important are transposons for plant evolution? Nature Reviews Genetics 2013, 14, 49–61. [Google Scholar] [CrossRef]
- Ariel, F.D.; Manavella, P.A. When junk DNA turns functional: transposon-derived non-coding RNAs in plants. J Exp Bot 2021, 72, 4132–4143. [Google Scholar] [CrossRef] [PubMed]
- Ibarra-Laclette, E.; Lyons, E.; Hernández-Guzmán, G.; Pérez-Torres, C.A.; Carretero-Paulet, L.; Chang, T.-H.; Lan, T.; Welch, A.J.; Juárez, M.J.A.; Simpson, J.; et al. Architecture and evolution of a minute plant genome. Nature 2013, 498, 94–98. [Google Scholar] [CrossRef] [PubMed]
- Nystedt, B.; Street, N.R.; Wetterbom, A.; Zuccolo, A.; Lin, Y.-C.; Scofield, D.G.; Vezzi, F.; Delhomme, N.; Giacomello, S.; Alexeyenko, A.; et al. The Norway spruce genome sequence and conifer genome evolution. Nature 2013, 497, 579–584. [Google Scholar] [CrossRef] [PubMed]
- Elliott, T.A.; Gregory, T.R. Do larger genomes contain more diverse transposable elements? BMC Evolutionary Biology 2015, 15, 69. [Google Scholar] [CrossRef]
- Stitzer, M.C.; Anderson, S.N.; Springer, N.M.; Ross-Ibarra, J. The genomic ecosystem of transposable elements in maize. PLOS Genetics 2021, 17, e1009768. [Google Scholar] [CrossRef] [PubMed]
- Wells, J.N.; Feschotte, C. A field guide to eukaryotic transposable elements. Annual review of genetics 2020, 54, 539–561. [Google Scholar] [CrossRef] [PubMed]
- Catlin, N.S.; Josephs, E.B. The important contribution of transposable elements to phenotypic variation and evolution. Current Opinion in Plant Biology 2022, 65, 102140. [Google Scholar] [CrossRef]
- Schrader, L.; Kim, J.W.; Ence, D.; Zimin, A.; Klein, A.; Wyschetzki, K.; Weichselgartner, T.; Kemena, C.; Stökl, J.; Schultner, E.; et al. Transposable element islands facilitate adaptation to novel environments in an invasive species. Nature Communications 2014, 5, 5495. [Google Scholar] [CrossRef] [PubMed]
- Wei, L.; Cao, X. The effect of transposable elements on phenotypic variation: insights from plants to humans. Science China Life Sciences 2016, 59, 24–37. [Google Scholar] [CrossRef]
- Lisch, D. Epigenetic Regulation of Transposable Elements in Plants. 2009, 60, 43–66. [CrossRef]
- Casacuberta, E.; González, J. The impact of transposable elements in environmental adaptation. Mol Ecol 2013, 22, 1503–1517. [Google Scholar] [CrossRef] [PubMed]
- Rey, O.; Danchin, E.; Mirouze, M.; Loot, C.; Blanchet, S. Adaptation to global change: a transposable element–epigenetics perspective. Trends Ecol. Evol. 2016, 31, 514–526. [Google Scholar] [CrossRef]
- Iida, S.; Morita, Y.; Choi, J.-D.; Park, K.-I.; Hoshino, A. Genetics and epigenetics in flower pigmentation associated with transposable elements in morning glories. Advances in Biophysics 2004, 38, 141–159. [Google Scholar] [CrossRef] [PubMed]
- Zhang, L.; Hu, J.; Han, X.; Li, J.; Gao, Y.; Richards, C.M.; Zhang, C.; Tian, Y.; Liu, G.; Gul, H.; et al. A high-quality apple genome assembly reveals the association of a retrotransposon and red fruit colour. Nature Communications 2019, 10, 1494. [Google Scholar] [CrossRef] [PubMed]
- Martin, A.; Troadec, C.; Boualem, A.; Rajab, M.; Fernandez, R.; Morin, H.; Pitrat, M.; Dogimont, C.; Bendahmane, A. A transposon-induced epigenetic change leads to sex determination in melon. Nature 2009, 461, 1135–1138. [Google Scholar] [CrossRef] [PubMed]
- Mao, H.; Wang, H.; Liu, S.; Li, Z.; Yang, X.; Yan, J.; Li, J.; Tran, L.-S.P.; Qin, F. A transposable element in a NAC gene is associated with drought tolerance in maize seedlings. Nature Communications 2015, 6, 8326. [Google Scholar] [CrossRef] [PubMed]
- Yang, Q.; Li, Z.; Li, W.; Ku, L.; Wang, C.; Ye, J.; Li, K.; Yang, N.; Li, Y.; Zhong, T.; et al. CACTA-like transposable element in ZmCCT attenuated photoperiod sensitivity and accelerated the postdomestication spread of maize. Proceedings of the National Academy of Sciences 2013, 110, 16969–16974. [Google Scholar] [CrossRef] [PubMed]
- Chen, C.; Renner, S. Melastomataceae. In Flora of China, Wu, Z., Raven, P., Eds.; Science Press Missouri Botanical Garden Press: Beijing, China. St. Louis, Missouri, USA, 2007. [Google Scholar]
- Huang, G.; Liu, H.; Sun, H.; Liu, Y.; Zhou, R.; Liao, W.; Fan, Q. Development and characterization of 18 polymorphic SSR markers for Barthea barthei (Melastomataceae). Applications in Plant Sciences 2017, 5, 1600149. [Google Scholar] [CrossRef]
- Huang, W.; Xu, B.; Guo, W.; Huang, Z.; Li, Y.; Wu, W. De novo genome assembly and population genomics of a shrub tree Barthea barthei (Hance) krass provide insights into the adaptive color variations. Frontiers in Plant Science 2024, 15. [Google Scholar] [CrossRef]
- Ou, S.; Su, W.; Liao, Y.; Chougule, K.; Agda, J.R.A.; Hellinga, A.J.; Lugo, C.S.B.; Elliott, T.A.; Ware, D.; Peterson, T.; et al. Benchmarking transposable element annotation methods for creation of a streamlined, comprehensive pipeline. Genome Biology 2019, 20, 275. [Google Scholar] [CrossRef] [PubMed]
- Yan, H.; Bombarely, A.; Li, S. DeepTE: a computational method for de novo classification of transposons with convolutional neural network. Bioinformatics 2020, 36, 4269–4275. [Google Scholar] [CrossRef] [PubMed]
- Marchler-Bauer, A.; Derbyshire, M.K.; Gonzales, N.R.; Lu, S.; Chitsaz, F.; Geer, L.Y.; Geer, R.C.; He, J.; Gwadz, M.; Hurwitz, D.I. CDD: NCBI's conserved domain database. Nucleic acids research 2015, 43, D222–D226. [Google Scholar] [CrossRef]
- Neumann, P.; Novák, P.; Hoštáková, N.; Macas, J. Systematic survey of plant LTR-retrotransposons elucidates phylogenetic relationships of their polyprotein domains and provides a reference for element classification. Mobile DNA 2019, 10, 1. [Google Scholar] [CrossRef]
- Katoh, K.; Standley, D.M. MAFFT Multiple Sequence Alignment Software Version 7: Improvements in Performance and Usability. Molecular Biology and Evolution 2013, 30, 772–780. [Google Scholar] [CrossRef]
- Darriba, D.; Posada, D.; Kozlov, A.M.; Stamatakis, A.; Morel, B.; Flouri, T. ModelTest-NG: A New and Scalable Tool for the Selection of DNA and Protein Evolutionary Models. Molecular Biology and Evolution 2020, 37, 291–294. [Google Scholar] [CrossRef]
- Stamatakis, A. RAxML version 8: a tool for phylogenetic analysis and post-analysis of large phylogenies. Bioinformatics 2014, 30, 1312–1313. [Google Scholar] [CrossRef]
- Drost, H.-G. LTRpred: de novo annotation of intact retrotransposons. Journal of Open Source Software 2020, 5. [Google Scholar] [CrossRef]
- Ma, J.; Bennetzen, J.L. Rapid recent growth and divergence of rice nuclear genomes. Proceedings of the National Academy of Sciences 2004, 101, 12404–12410. [Google Scholar] [CrossRef]
- de Medeiros Oliveira, M.; Bonadio, I.; Lie de Melo, A.; Mendes Souza, G.; Durham, A.M. TSSFinder—fast and accurate ab initio prediction of the core promoter in eukaryotic genomes. Briefings in Bioinformatics 2021, 22, bbab198. [Google Scholar] [CrossRef]
- Bu, D.; Luo, H.; Huo, P.; Wang, Z.; Zhang, S.; He, Z.; Wu, Y.; Zhao, L.; Liu, J.; Guo, J. KOBAS-i: intelligent prioritization and exploratory visualization of biological functions for gene enrichment analysis. Nucleic acids research 2021, 49, W317–W325. [Google Scholar] [CrossRef]
- Benjamini, Y.; Hochberg, Y. Controlling the false discovery rate: a practical and powerful approach to multiple testing. Journal of the Royal statistical society: series B (Methodological) 1995, 57, 289–300. [Google Scholar] [CrossRef]
- Bolger, A.M.; Lohse, M.; Usadel, B. Trimmomatic: a flexible trimmer for Illumina sequence data. Bioinformatics 2014, 30, 2114–2120. [Google Scholar] [CrossRef]
- Dobin, A.; Davis, C.A.; Schlesinger, F.; Drenkow, J.; Zaleski, C.; Jha, S.; Batut, P.; Chaisson, M.; Gingeras, T.R. STAR: ultrafast universal RNA-seq aligner. Bioinformatics 2013, 29, 15–21. [Google Scholar] [CrossRef] [PubMed]
- Jin, Y.; Tam, O.H.; Paniagua, E.; Hammell, M. TEtranscripts: a package for including transposable elements in differential expression analysis of RNA-seq datasets. Bioinformatics 2015, 31, 3593–3599. [Google Scholar] [CrossRef] [PubMed]
- Baduel, P.; Quadrana, L.; Colot, V. Efficient detection of transposable element insertion polymorphisms between genomes using short-read sequencing data. In Plant Transposable Elements: Methods and Protocols; Springer: 2021; pp. 157–169.
- Quadrana, L.; Bortolini Silveira, A.; Mayhew, G.F.; LeBlanc, C.; Martienssen, R.A.; Jeddeloh, J.A.; Colot, V. The Arabidopsis thaliana mobilome and its impact at the species level. eLife 2016, 5, e15716. [Google Scholar] [CrossRef]
- Stuart, T.; Eichten, S.R.; Cahn, J.; Karpievitch, Y.V.; Borevitz, J.O.; Lister, R. Population scale mapping of transposable element diversity reveals links to gene regulation and epigenomic variation. eLife 2016, 5, e20777. [Google Scholar] [CrossRef] [PubMed]
- McKenna, A.; Hanna, M.; Banks, E.; Sivachenko, A.; Cibulskis, K.; Kernytsky, A.; Garimella, K.; Altshuler, D.; Gabriel, S.; Daly, M.J.G.r. The Genome Analysis Toolkit: a MapReduce framework for analyzing next-generation DNA sequencing data. Geome Research 2010, 20, 1297–1303. [Google Scholar] [CrossRef]
- Van der Auwera, G.A.; Carneiro, M.O.; Hartl, C.; Poplin, R.; Del Angel, G.; Levy-Moonshine, A.; Jordan, T.; Shakir, K.; Roazen, D.; Thibault, J. From FastQ data to high-confidence variant calls: the genome analysis toolkit best practices pipeline. Current protocols in bioinformatics 2013, 43, 1.10. 11–11.10. 33. [Google Scholar] [CrossRef] [PubMed]
- Team, R.C. A language and environment for statistical computing. 2021.
- Purcell, S.; Neale, B.; Todd-Brown, K.; Thomas, L.; Ferreira, M.A.; Bender, D.; Maller, J.; Sklar, P.; De Bakker, P.I.; Daly, M.J. PLINK: a tool set for whole-genome association and population-based linkage analyses. The American journal of human genetics 2007, 81, 559–575. [Google Scholar] [CrossRef] [PubMed]
- Li, Q.; Gent, J.I.; Zynda, G.; Song, J.; Makarevitch, I.; Hirsch, C.D.; Hirsch, C.N.; Dawe, R.K.; Madzima, T.F.; McGinnis, K.M.; et al. RNA-directed DNA methylation enforces boundaries between heterochromatin and euchromatin in the maize genome. Proceedings of the National Academy of Sciences 2015, 112, 14728–14733. [Google Scholar] [CrossRef]
- Saze, H.; Kitayama, J.; Takashima, K.; Miura, S.; Harukawa, Y.; Ito, T.; Kakutani, T. Mechanism for full-length RNA processing of Arabidopsis genes containing intragenic heterochromatin. Nature Communications 2013, 4, 2301. [Google Scholar] [CrossRef] [PubMed]
- Ma, G.; Zhang, L.; Yungyuen, W.; Tsukamoto, I.; Iijima, N.; Oikawa, M.; Yamawaki, K.; Yahata, M.; Kato, M. Expression and functional analysis of citrus carotene hydroxylases: unravelling the xanthophyll biosynthesis in citrus fruits. Bmc Plant Biol 2016, 16, 148. [Google Scholar] [CrossRef] [PubMed]
- Kumar, M.; Yusuf, M.A.; Yadav, P.; Narayan, S.; Kumar, M. Overexpression of Chickpea Defensin Gene Confers Tolerance to Water-Deficit Stress in Arabidopsis thaliana. Frontiers in Plant Science 2019, 10. [Google Scholar] [CrossRef] [PubMed]
- Blankenship, R.E. Structural and functional dynamics of photosynthetic antenna complexes. Proceedings of the National Academy of Sciences 2015, 112, 13751–13752. [Google Scholar] [CrossRef] [PubMed]
- Vogt, T. Phenylpropanoid Biosynthesis. Molecular Plant 2010, 3, 2–20. [Google Scholar] [CrossRef] [PubMed]
- Lewandowska, M.; Keyl, A.; Feussner, I. Wax biosynthesis in response to danger: its regulation upon abiotic and biotic stress. New Phytologist 2020, 227, 698–713. [Google Scholar] [CrossRef] [PubMed]
- Shepherd, T.; Wynne Griffiths, D. The effects of stress on plant cuticular waxes. New Phytologist 2006, 171, 469–499. [Google Scholar] [CrossRef]
- Helmprobst, F.; Kneitz, S.; Klotz, B.; Naville, M.; Dechaud, C.; Volff, J.-N.; Schartl, M. Differential expression of transposable elements in the medaka melanoma model. PLOS ONE 2021, 16, e0251713. [Google Scholar] [CrossRef] [PubMed]
- Lanciano, S.; Cristofari, G. Measuring and interpreting transposable element expression. Nature Reviews Genetics 2020, 21, 721–736. [Google Scholar] [CrossRef]
- Vogel, J.P.; Raab, T.K.; Somerville, C.R.; Somerville, S.C. Mutations in PMR5 result in powdery mildew resistance and altered cell wall composition. The Plant Journal 2004, 40, 968–978. [Google Scholar] [CrossRef]
- Gutterson, N.; Reuber, T.L. Regulation of disease resistance pathways by AP2/ERF transcription factors. Current opinion in plant biology 2004, 7, 465–471. [Google Scholar] [CrossRef]
- Mizoi, J.; Shinozaki, K.; Yamaguchi-Shinozaki, K. AP2/ERF family transcription factors in plant abiotic stress responses. J Biochimica et Biophysica Acta 2012, 1819, 86–96. [Google Scholar] [CrossRef]
- Hansen, C.C.; Nelson, D.R.; Møller, B.L.; Werck-Reichhart, D. Plant cytochrome P450 plasticity and evolution. Molecular Plant 2021, 14, 1244–1265. [Google Scholar] [CrossRef] [PubMed]
- Schnable, P.S.; Ware, D.; Fulton, R.S.; Stein, J.C.; Wei, F.; Pasternak, S.; Liang, C.; Zhang, J.; Fulton, L.; Graves, T.A. The B73 maize genome: complexity, diversity, and dynamics. Science 2009, 326, 1112–1115. [Google Scholar] [CrossRef]
- Sun, H.-Y.; Dai, H.-Y.; Zhao, G.-L.; Ma, Y.; Ou, C.-Q.; Li, H.; Li, L.-G.; Zhang, Z.-H. Genome-wide Characterization of Long Terminal Repeat -retrotransposons in Apple Reveals the Differences in Heterogeneity and Copy Number between Ty1-copia and Ty3-gypsy Retrotransposons. Journal of Integrative Plant Biology 2008, 50, 1130–1139. [Google Scholar] [CrossRef]
- Xu, Y.; Du, J. Young but not relatively old retrotransposons are preferentially located in gene-rich euchromatic regions in tomato (Solanum lycopersicum) plants. The Plant Journal 2014, 80, 582–591. [Google Scholar] [CrossRef] [PubMed]
- Zavallo, D.; Crescente, J.M.; Gantuz, M.; Leone, M.; Vanzetti, L.S.; Masuelli, R.W.; Asurmendi, S. Genomic re-assessment of the transposable element landscape of the potato genome. Plant Cell Reports 2020, 39, 1161–1174. [Google Scholar] [CrossRef] [PubMed]
- Feschotte, C.; Pritham, E.J. DNA Transposons and the Evolution of Eukaryotic Genomes. Annual review of genetics 2007, 41, 331–368. [Google Scholar] [CrossRef]
- Quesneville, H. Twenty years of transposable element analysis in the Arabidopsis thaliana genome. Mobile DNA 2020, 11, 28. [Google Scholar] [CrossRef] [PubMed]
- Robertson, D.S. Characterization of a mutator system in maize. Mutation Research/Fundamental and Molecular Mechanisms of Mutagenesis 1978, 51, 21–28. [Google Scholar] [CrossRef]
- Jiang, N.; Bao, Z.; Zhang, X.; Eddy, S.R.; Wessler, S.R. Pack-MULE transposable elements mediate gene evolution in plants. Nature 2004, 431, 569–573. [Google Scholar] [CrossRef] [PubMed]
- Muhammad, I.; Shalmani, A.; Ali, M.; Yang, Q.-H.; Ahmad, H.; Li, F.B. Mechanisms Regulating the Dynamics of Photosynthesis Under Abiotic Stresses. Frontiers in Plant Science 2021, 11. [Google Scholar] [CrossRef]
- Hiruma, K.; Fukunaga, S.; Bednarek, P.; Piślewska-Bednarek, M.; Watanabe, S.; Narusaka, Y.; Shirasu, K.; Takano, Y. Glutathione and tryptophan metabolism are required for Arabidopsis immunity during the hypersensitive response to hemibiotrophs. Proceedings of the National Academy of Sciences 2013, 110, 9589–9594. [Google Scholar] [CrossRef] [PubMed]
- Ishihara, A.; Hashimoto, Y.; Tanaka, C.; Dubouzet, J.G.; Nakao, T.; Matsuda, F.; Nishioka, T.; Miyagawa, H.; Wakasa, K. The tryptophan pathway is involved in the defense responses of rice against pathogenic infection via serotonin production. The Plant Journal 2008, 54, 481–495. [Google Scholar] [CrossRef] [PubMed]
- Bagchi, R.; Gallery, R.E.; Gripenberg, S.; Gurr, S.J.; Narayan, L.; Addis, C.E.; Freckleton, R.P.; Lewis, O.T. Pathogens and insect herbivores drive rainforest plant diversity and composition. Nature 2014, 506, 85–88. [Google Scholar] [CrossRef]
- MacArthur, R.H. Geographical Ecology; Patterns in the Distribution of Species; Princeton University Press: Princeton, NJ, 1972. [Google Scholar]
- Anderson, S.N.; Stitzer, M.C.; Brohammer, A.B.; Zhou, P.; Noshay, J.M.; O'Connor, C.H.; Hirsch, C.D.; Ross-Ibarra, J.; Hirsch, C.N.; Springer, N.M. Transposable elements contribute to dynamic genome content in maize. The Plant Journal 2019, 100, 1052–1065. [Google Scholar] [CrossRef] [PubMed]
- Lynch, M.; Walsh, B. The origins of genome architecture; Sinauer associates Sunderland, MA: 2007; Volume 98.
- Sigman, M.J.; Slotkin, R.K. The first rule of plant transposable element silencing: location, location, location. The Plant Cell 2016, 28, 304–313. [Google Scholar] [CrossRef] [PubMed]
- Dubin, M.J.; Mittelsten Scheid, O.; Becker, C. Transposons: a blessing curse. Current Opinion in Plant Biology 2018, 42, 23–29. [Google Scholar] [CrossRef]
- Butelli, E.; Licciardello, C.; Zhang, Y.; Liu, J.; Mackay, S.; Bailey, P.; Reforgiato-Recupero, G.; Martin, C. Retrotransposons Control Fruit-Specific, Cold-Dependent Accumulation of Anthocyanins in Blood Oranges The Plant Cell 2012, 24, 1242–1255. [CrossRef]
- Clark, R.M.; Wagler, T.N.; Quijada, P.; Doebley, J. A distant upstream enhancer at the maize domestication gene tb1 has pleiotropic effects on plant and inflorescent architecture. Nature Genetics 2006, 38, 594–597. [Google Scholar] [CrossRef]
- Nitasaka, E. Insertion of an En/Spm-related transposable element into a floral homeotic gene DUPLICATED causes a double flower phenotype in the Japanese morning glory. The Plant Journal 2003, 36, 522–531. [Google Scholar] [CrossRef]
- Wang, H.; Lu, Y.; Zhang, T.; Liu, Z.; Cao, L.; Chang, Q.; Liu, Y.; Lu, X.; Yu, S.; Li, H.; et al. The double flower variant of yellowhorn is due to a LINE1 transposon-mediated insertion. Plant Physiology 2023, 191, 1122–1137. [Google Scholar] [CrossRef] [PubMed]
- Guan, R.; Qu, Y.; Guo, Y.; Yu, L.; Liu, Y.; Jiang, J.; Chen, J.; Ren, Y.; Liu, G.; Tian, L. Salinity tolerance in soybean is modulated by natural variation in G m SALT 3. The Plant Journal 2014, 80, 937–950. [Google Scholar] [CrossRef]
Figure 3.
Transposable element insertion polymorphism patterns between the white petal.
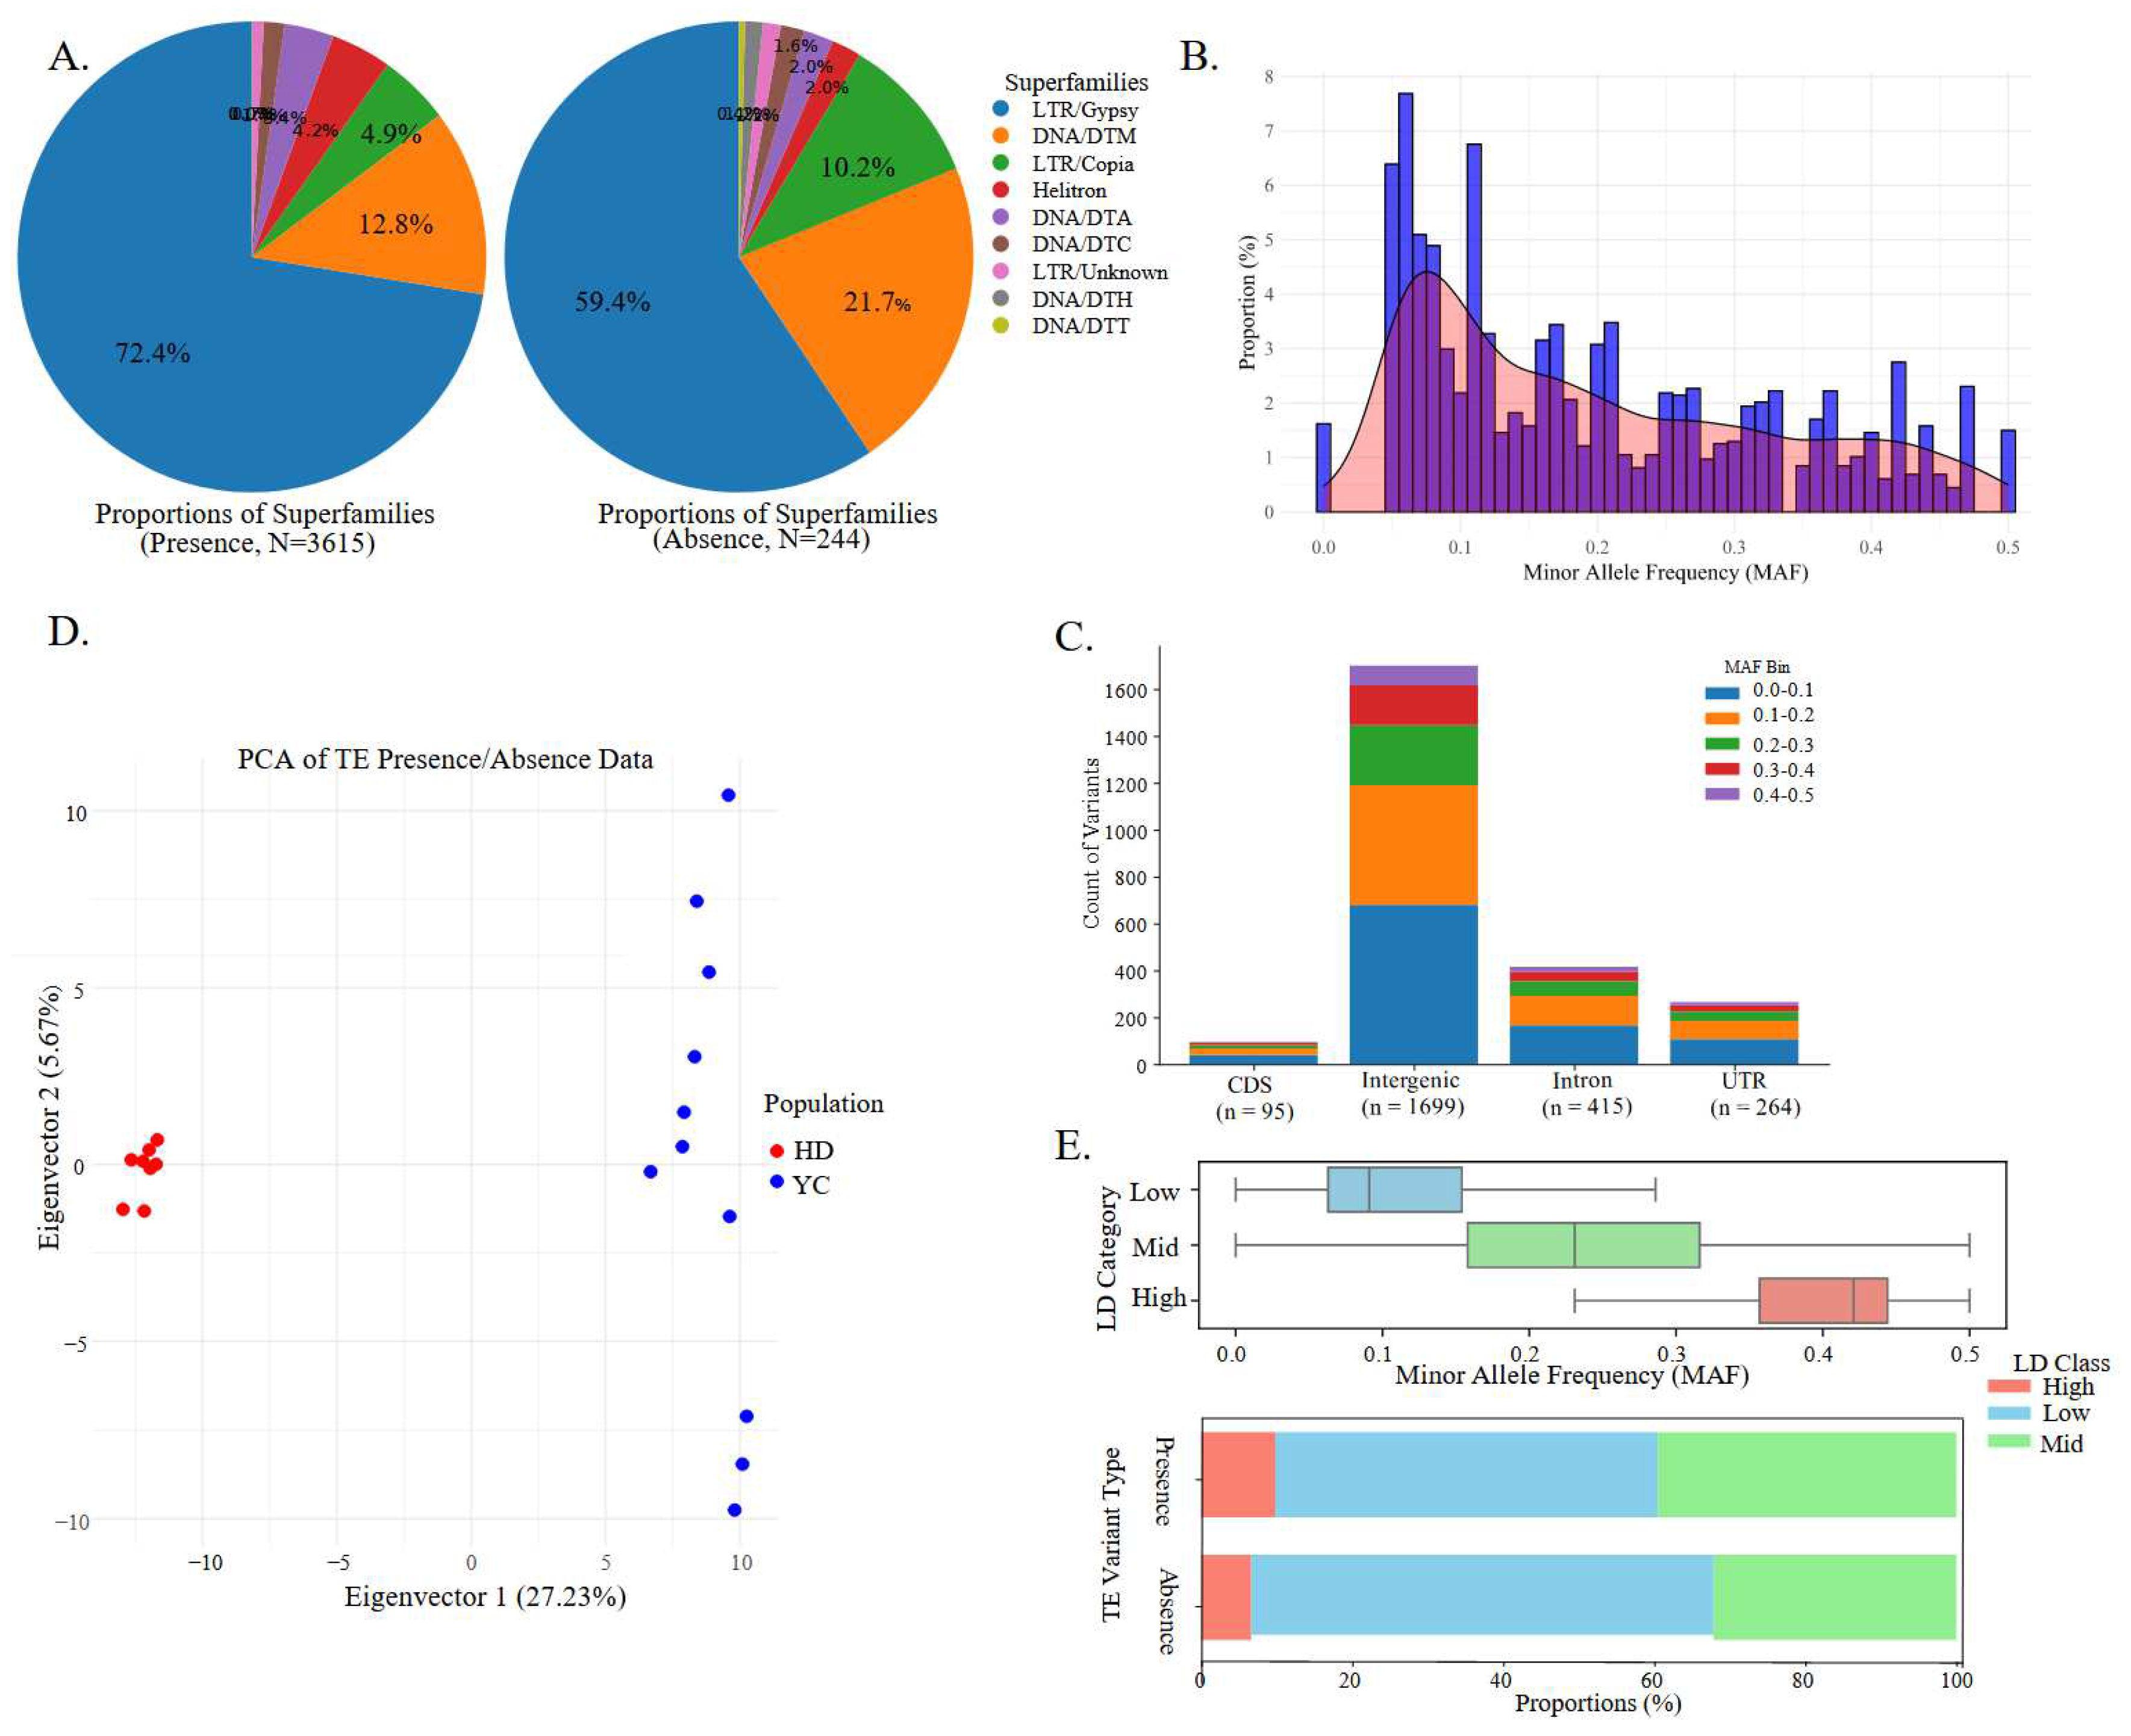

Table 1.
Summaries of repeat contents in the genome Barthea barthei. Intact transposable elements shown in the Parentheses.
Table 1.
Summaries of repeat contents in the genome Barthea barthei. Intact transposable elements shown in the Parentheses.
| Class | Order | Superfamily | Number | Total length (bp) | Percentage of the genome (%) |
| Retrotransposon | LTR | ||||
| Copia | 9602 (120) | 5809421 (665156) | 2.47 (0.28) | ||
| Gypsy | 24293 (220) | 20729316 (2036809) | 8.82 (0.87) | ||
| DIRs | |||||
| DIRs | 1 | 254 | 0 | ||
| LINE | |||||
| L1 | 588 | 277520 | 0.12 | ||
| I | 8 | 13274 | 0.01 | ||
| PLE | |||||
| Penelope | 278 (1) | 176212 (4083) | 0.07 (0.00) | ||
| SINE | |||||
| tRNA | 220 | 21226 | 0.01 | ||
| DNA Transposon | |||||
| TIRs | |||||
| hAT | 516 (56) | 222301 (98002) | 0.09 (0.04) | ||
| CACTA | 2820 (112) | 1144474 (310909) | 0.49 (0.13) | ||
| PIF_Harbinger | 747 (30) | 282584 (92465) | 0.12 (0.04) | ||
| Mutator | 13868 (296) | 6337070 (729432) | 2.7 (0.31) | ||
| Tc1-Mariner | 127 (14) | 97949 (41156) | 0.04 (0.02) | ||
| MITEs | |||||
| DTA | 455 (25) | 107235 (8582) | 0.05 (0.00) | ||
| DTC | 7 (6) | 2317 (2196) | 0 (0.00) | ||
| DTH | 70 (8) | 11773 (2513) | 0.01 (0.00) | ||
| DTM | 1769 (130) | 360581 | 0.15 | ||
| DTT | 1 (1) | 221 (221) | 0 (0.00) | ||
| Helitron | |||||
| Helitron | 9494 (89) | 3834769 (984799) | 1.63 (0.42) | ||
| Other_repeats | |||||
| Other_repeats | Other_repeats | 19316 | 4942020 | 2.1 | |
| Total | 18.88 |
Table 2.
The summaries of coordinate relationships between different order or superfamilies of transposon elements and the nearest host genes in the genome Barthea barthei.
Table 2.
The summaries of coordinate relationships between different order or superfamilies of transposon elements and the nearest host genes in the genome Barthea barthei.
| Copia | Gypsy | TIRs | Helitron | nLTR | Total | Proportion (%) | ||
| Upstream | 29144 | 45.8 | ||||||
| Promoter | 64 | 95 | 254 | 161 | 3 | 577 | 0.9 | |
| other | 4480 | 11422 | 8599 | 3970 | 96 | 28567 | 44.9 | |
| Downstream | 4185 | 10611 | 7999 | 3635 | 132 | 26562 | 41.7 | |
| 5'-overlap | 71 | 246 | 281 | 159 | 3 | 760 | 1.2 | |
| 3'-overlap | 61 | 249 | 209 | 111 | 0 | 630 | 1.0 | |
| Nested | 6569 | 10.3 | ||||||
| single Intron | 543 | 1333 | 2347 | 1213 | 18 | 5454 | 8.6 | |
| single 5’ UTR | 43 | 47 | 59 | 41 | 0 | 190 | 0.3 | |
| single 3’UTR | 61 | 112 | 119 | 78 | 0 | 370 | 0.6 | |
| single CDS | 3 | 23 | 37 | 12 | 0 | 75 | 0.1 | |
| Exon/intron | 91 | 155 | 123 | 108 | 3 | 480 | 0.7 | |
| Total | 9602 | 24293 | 20027 | 9488 | 255 | 63665 |
Table 3.
Coordinated expression of transposable element transcripts and nearby/nested genes during flower bud development in Barthea barthei.
Table 3.
Coordinated expression of transposable element transcripts and nearby/nested genes during flower bud development in Barthea barthei.
| Class | Order | superfamily | Copy number | Average baseMean | aInstances of coordination |
| Class I (Retransposons) | |||||
| LTR | 1457 | 9.85 | |||
| Copia | 206 | 5.62 | 69: 7: 2: 54: 2: 7: 1: 64 | ||
| Gypsy | 1059 | 10.55 | 392: 18: 4: 207: 13: 0: 4: 24 | ||
| Unknown | 148 | 9.37 | 33: 4: 0: 55: 2: 0: 0: 4 | ||
| Line | Unknown | 44 | 14.53 | 4: 1: 0: 30: 3: 0: 0: 6 | |
| Class II (DNA transposons) | |||||
| TIR | 1149 | 16.67 | |||
| DTA | 45 | 13.1 | 11: 5: 0: 19: 0: 0: 1: 9 | ||
| DTC | 403 | 18.43 | 57: 30: 0: 235: 7: 2: 16: 56 | ||
| DTH | 48 | 13.14 | 8: 10: 0: 17: 0: 0: 2: 11 | ||
| DTM | 626 | 8.43 | 174: 25: 4: 216: 3: 0: 38: 165 | ||
| DTT | 27 | 17.67 | 9: 2: 0: 2: 0: 0: 3: 11 | ||
| MITE | 140 | 6.17 | |||
| DTA | 68 | 8.15 | 5: 0: 0: 58: 1: 0: 0: 4 | ||
| DTC | 3 | 2.1 | 0: 0: 0: 1: 0: 0: 0: 2 | ||
| DTH | 13 | 4.51 | 2: 1: 0: 8: 0: 0: 0: 2 | ||
| DTM | 56 | 4.37 | 22: 2: 0: 18: 0: 0: 2: 12 | ||
| DTT | 0 | 0 | |||
| Helitron | 649 | 24 | 136: 47: 2: 264: 8: 3: 39: 150 | ||
| Unknown | 1083 | 573 | 289: 70: 7: 360: 31: 6: 34: 316 | ||
| pararetrovirus | 17 | 5.24 | 4: 0: 0: 5: 1: 0: 0: 7 |
aUpstream:5'-overlap: 5'UTR: intron: intron-CDS (CDS): 3'UTR: 3'-overlap: downstream.
Disclaimer/Publisher’s Note: The statements, opinions and data contained in all publications are solely those of the individual author(s) and contributor(s) and not of MDPI and/or the editor(s). MDPI and/or the editor(s) disclaim responsibility for any injury to people or property resulting from any ideas, methods, instructions or products referred to in the content. |
© 2025 by the authors. Licensee MDPI, Basel, Switzerland. This article is an open access article distributed under the terms and conditions of the Creative Commons Attribution (CC BY) license (https://creativecommons.org/licenses/by/4.0/).
Copyright: This open access article is published under a Creative Commons CC BY 4.0 license, which permit the free download, distribution, and reuse, provided that the author and preprint are cited in any reuse.


