
Submitted:
22 January 2025
Posted:
22 January 2025
You are already at the latest version
Abstract
Neglected and Underutilized Species (NUS)—locally available, climate-resilient species—possess significant nutritional, social, and environmental benefits, yet their use, research focus, and market presence have diminished over time. Incorporating NUS into school meal programs can potentially boost childhood nutrition, promote healthy eating, encourage sustainable food production, preserve food culture and heritage, and support biodiversity conservation. School meals offered in Kenya are often monotonous and nutritionally inadequate. We conducted a case study targeting a school in an informal urban settlement in Nairobi, to demonstrate how incorporating locally grown, nutrient-rich foods into school meals can result in better nutrition for school-age children, while making significant savings for schools. Using the World Food Programme's School Meal Planner (SMP) PLUS software, the meals offered at the school were analyzed for nutrient adequacy and optimized. The optimization process was based on commodity price fluctuations and nutrient composition using local agrobiodiversity. The results show how NUS are a viable and healthy alternative to meet the recommended daily nutrient needs for school-aged children at affordable prices. The tool results showcased the effectiveness of linear programming in enabling national decision-making in efficient school feeding program planning, by designing comprehensive, affordable food baskets using local agrobiodiversity. Future research should explore implementing optimized school menus while examining broader aspects, such as school lunches’ environmental impacts and direct procurement approach opportunities that source local ingredients from smallholder farmers.
Keywords:
Food and nutrition security
; Kenya
; neglected and underutilized species
; school meals
; school feeding
; public procurement
; linear programming
1. Introduction
In 2024, Kenya continued to face significant challenges in ensuring food and nutrition security for children and adolescents. Despite ongoing efforts and various government programs, malnutrition rates remain a concern, particularly in marginalized and drought-prone regions [1]. The country grapples with undernutrition, micronutrient deficiencies, and the rising prevalence of overweight and obesity among adults and adolescents, and children, reflecting a triple burden of malnutrition [2]. Furthermore, in 2022, almost 8 out 10 Kenyans (79.2%) were unable to afford a healthy diet [3]. Adolescent girls in East Africa are particularly vulnerable, especially those belonging to poorer households and living in rural areas. At least one in three adolescent girls and women are not consuming the variety of foods they need for adequate nutrition [4]. Malnutrition in children and adolescents has detrimental short- and long-term health outcomes, by increasing the risk of morbidity and mortality, but also growth-related problems, like impaired physical and cognitive development [5]. Improving access to affordable and nutritious foods—including fruits, vegetables, and animal-source foods (ASFs) such as milk, eggs, fish, and meat—is crucial to leveraging the food system to better protect, promote, and support children's right to adequate food and nutrition[6]. At the United Nations Climate Change Conference (COP28), held in Dubai at the end of 2023, over 160 nations, including Kenya, signed the Declaration on sustainable agriculture, resilient food systems, and climate action. By so doing, they declared their intention to "Promote food security and nutrition by increasing efforts to support vulnerable people through approaches such as social protection systems and safety nets, school feeding, and public procurement programs". At the global climate meeting (COP29) held in Baku, Azerbaijan in November 2024, school meals were offered as part of the solution to offsetting the climate crisis [7].
Nutrition and food security have consistently been prioritized on Kenya’s political agenda. Since introducing the first National Food Policy in 1981 [8], the Government of Kenya (GoK) has developed and implemented several policies and programs to enhance its population’s food and nutrition security. The updated Constitution of 2010 [9] underscores the right to food, stating that “Every person has the right to be free from hunger, to have adequate food of acceptable quality” and to have “clean and safe water in adequate quantities” (Art. 43). The GoK’s dedication to ensuring these rights is reflected in the numerous programs and strategies introduced in the subsequent years, including the introduction of school feeding programs. In 1980 the GoK and World Food Programme (WFP) introduced school feeding programs in Arid and Semi-Arid Lands (ASAL). This collaboration lasted about 30 years when, in 2009 the launch of Kenya’s School Meal Program marked the beginning of a gradual handover from WFP-supported school meal programs to nationally led programs, to foster sustainability and decreased reliance on donor funding [10]. As at August 2022, the program was providing school lunches to more than 1.5 million pupils in primary school [11]. Numerous school meal programs have followed, with the most recent—Dishi na County school feeding program—launched in Nairobi, at the end of August 2023, thanks to the collaboration between Nairobi County and the Kenyan charity Food 4 Education [12]. Dishi na County school feeding program offers students from low-income families in public primary schools and early-child education centers in Nairobi County a free or heavily subsidized nutritious lunch. In October 2024, Kenya also assumed a global leadership role by promoting the integration of food systems with education and environmental policies as essential for a sustainable future [13]. The Dishi na County planet-friendly school meals program will procure food from local smallholder farmers, especially women, aligning with the global recognition that empowering women in agriculture strengthens food systems, as they frequently are custodians of biodiversity and advocate for nutritional needs in their communities. These efforts aim to minimize the carbon footprint of the school meals program, reflecting Kenya's ongoing commitment to climate-change mitigation and adaptation [14].
School feeding programs and initiatives to incorporate nutrient-dense, locally sourced foods into children's diets have shown promise [15,16]. They can also catalyze demand-driven, eco-friendly practices within local food systems [7]. Regardless of its nutritional quality, food provision in schools also increases school enrolment and participation, allowing equity of access to education, especially for girls [17]. When school gardens are also implemented, they can also be used as educational tools, providing opportunities for hands-on involvement and activities related to agriculture, nutrition, and sustainability in real-world settings [18]. These simple educational tools are likely to influence the eating habits of children, their caregivers, and the entire community by promoting messaging on healthy eating and dietary habits, agrobiodiversity conservation, in addition to improving their understanding of the effects of climate change on agriculture and food production, along with other benefits [7,19].
School meal programs also play a pivotal role in food systems transformation globally [7,20]. They may empower smallholder farmers, promote local food production, local sustainable development, and could represent a means to support food biodiversity production through public procurement strategies [17,21]. Indeed, implementing sustainable school meal programs could allow the creation of more-resilient, planet-friendly, sustainable food systems and climate-responsive diets, when less resource-intensive food items, like vegetables, fruit, and legumes are home-grown or purchased from local and smallholder producers [22].
Integrating Neglected and Underutilized Species (NUS), or ‘opportunity crops’ as they have more recently been termed [23] are native, locally adapted, climate-resilient, nutrient-rich, and cost-efficient species. Their inclusion in school meals can result in multiple benefits [15,18,24]. These include a direct effect on children’s healthy dietary behaviors, which may prevent most of the risk factors linked to malnutrition and non-communicable diseases in later life [25,26,27]. NUS also increase the resilience of agricultural production system to climate change, contribute to empowering traditional communities and Indigenous peoples, particularly women, and preserve cultural heritage [28,29]. Most NUS are well adapted to growing in poor soils, on marginal lands (in agroecological niches where common crops cannot grow), are resistant to several biotic and abiotic stresses, and require fewer external inputs. Moreover, many NUS are richer in micronutrients than their cultivated counterparts [15,30,31,32]. Incorporating these local species into community diets has the potential to address micronutrient deficiencies, promote more-nutritious and cost-effective meals, enhance dietary diversity, and support both human health and environmental sustainability [31,33,34].
For much of human history, NUS have been integral to local diets [35]. Over time, they have been increasingly neglected in both domestic and international agricultural markets. They are perceived as less productive, less competitive, and less profitable than cash crops, which have gradually replaced NUS in farming and food production systems. Additionally, producing and consuming NUS is often discouraged because of their stigmatization as ‘poor people’s food’ [36,37,38]. Although research on NUS and agrobiodiversity for better nutrition, higher incomes, and environmental sustainability was promoted by the former International Plant Genetic Resources Institute (now Bioversity International) and others almost 50 years ago [39], it is only in the last decade that these resources have been gaining consideration as an effective food-based dietary intervention to fill the nutrient gap while being kinder to the planet [7,19,40]. Their epithet as ‘opportunity crops’ is thus highly deserved.
However, implementing school feeding programs that incorporate local foods faces several barriers on both the supply and demand side of the food value chain. Farmers are wary of the schools’ ability to pay promptly and reliably, while they, in turn, often lack the necessary information and skills to manage their businesses effectively and establish contracts to supply food to schools [16]. Dishi na County tender notices, for example, are only advertised online, thus excluding the many smallholder farmers who do not have easy access to the internet. From the schools' perspective, there is a noted absence of budget or delayed funding to feed all children reliably throughout the entire school year, as well as the lack of networks, contacts, and structures to facilitate negotiations between schools and farmers [11,41]. Also, logistical challenges, such as inconsistent supply chains and the seasonal availability of local produce, can hinder the reliable provision of primary meal ingredients [11,16,42]. The issue of inadequate infrastructure, including insufficient storage facilities and kitchen equipment, further complicates the preparation and preservation of fresh local foods [11]. Limited awareness and training among school staff about the benefits and methods of using local foods can also impede the successful integration of these programs. Finally, policy and regulatory hurdles, such as strict procurement policies and lack of supportive policies promoting local food systems, can further complicate the implementation process [17,43]. These barriers collectively pose significant challenges to the adoption of school feeding programs that leverage local food sources.
To showcase the possibility and benefits of effectively incorporating NUS into school meals, this study used a linear programming tool to calculate how school meals could be nutritionally improved while reducing costs. Findings from our pilot study reveal that optimizing ingredient quantities and including NUS can significantly improve the nutritional profile of school meals in a cost-effective manner. Results can be helpful for future, long-term planning of local and national school meal programs.
2. Materials and Methods
2.1. NUS and School Selection
The study was undertaken between 2020 and 2021 in the city of Nairobi, Kenya. As a first step, a desk review was conducted to select the most suitable NUS to include in the study. Relevant articles on Kenyan NUS were found using Google Scholar, while additional scholarly literature was identified by reviewing relevant reference lists, reviews, reports, and by consulting agrobiodiversity experts. Based on their nutritional profiles, distribution within the study area, and accessibility, five target NUS were selected: African nightshade (Solanum spp.), spider plant (Cleome gynandra), Bambara groundnut (Vigna subterranea), bonavist or hyacinth bean (Lablab purpureus), and slender leaf (Crotalaria spp.). Indigenous to Sub-Saharan Africa (SSA), the spider plant’s wide adaptability and resilience have promoted the species from a weed to a cultivated crop [44]. Rich in nutrients, the plant’s leaves are a good source of minerals, vitamins—such as provitamin A carotenoids—as well as fiber, protein, carbohydrates, and essential amino acids. Raw spider plant also contributes about 152.88 kcal of energy per 100 g portion [45,46]. Bambara groundnut (Vigna subterranea) is another important indigenous crop native to SSA. Because of its rich nutritional profile and balanced macronutrient composition, the legume is considered a complete food and can contribute to reducing the impact of protein-energy malnutrition [47,48,49,50]. The fast-growing, multipurpose bonavist or hyacinth bean (Lablab purpureus) is a drought-tolerant and nutritious legume rich in proteins (with the beans containing up to 25% protein), dietary fiber, carbohydrates, calcium, phosphorus, and iron. The plant’s immature pods and young leaves are cooked as vegetables, while the dry beans are cooked and eaten as pulses [51,52]. Finally, slender leaf (Crotalaria spp.), another indigenous leguminous crop, which is consumed for its young leaves and shoots, is a rich source of provitamin A, vitamin C, iron, calcium, and proteins [53]. With other native crops, these NUS have shown potential in contributing to dietary diversity and food security in SSA [54] while also contributing to enhancing livelihoods in a pilot home-grown school feeding approach tested in Busia County, Western Kenya [16]. Rich in nutrients and also used for its medicinal properties, African nightshade (Solanum spp.) is widespread throughout tropical Africa, but less used in community catering in Kenya. In this study it was therefore included on the list of target NUS during the optimization process. The plants’ leaves and seeds provide provitamin A and vitamin C, calcium, carbohydrates, antioxidants, carotenoids, folic acid, minerals, and amino acids [55,56,57]. The leaves are appreciated for their bitterness and are mostly used as a vegetable, often cooked with other greens, while the fruit is consumed in limited amounts as it is mildly toxic when unripe.
Selecting the study school was considerably more complicated than the NUS selection, particularly considering the school closures following the COVID-19 pandemic. To be relevant, the school needed to provide precise information on its school menu, as well as a detailed list of ingredients and quantities used in school meal preparation. Finally, the choice fell on the Volunteers Foundation Academy (VFA), a charity-supported primary school situated in Kibera, an informal settlement in Nairobi. The school provides education to children aged between 2 and 18 years from disadvantaged families and has a small kitchen garden where kale and spinach are mostly grown. At the time of the study, the school was not included in Kenya’s school feeding program.
2.2. The School Meal Menus
Using its own budget, the school offered breakfast—primarily porridge—and a warm midday meal to 126 people, including the children, teachers, and school staff (see Annex S1 for the menus’ baseline composition, item quantity, and costs). Meals were prepared by two local women, who also worked in the school kitchen garden, together with the administrator and part of the school staff. Since the vegetables grown in the garden were insufficient to meet the children’s entire nutritional requirements, the school also purchased vegetables from external suppliers.
Vegetables were bought and delivered weekly by the Farm to Feed Foundation: a social enterprise that tackles food loss and waste by creating a market for imperfect/surplus produce (rescue vegetables) from family farmers. The vegetables usually delivered to the school were carrots, courgettes (zucchini), capsicum, kales, cabbage, spinach, and collard greens. Depending on their availability and on market prices, the variety and quantity of food items changed weekly, varying by plus or minus 10 kilograms (kg) per food item listed per week (Annex S1). Some weeks the school received only one type of vegetable, which was prepared with a base of tomatoes and onions purchased locally. However, when all the ingredients were available, the menu consisted of a fixed set of dishes that rotated on a weekly basis. All main courses were prepared using a similar cooking method: onions and tomatoes lightly sautéed with vegetable oil to form the base of the recipe, to which vegetables were then added. For recipes that included potatoes or legumes, water was added to cook them with the base. Maize meal (known locally as ugali) and rice were boiled separately in water and were served alongside the base with boiled vegetables, potatoes, or legumes. Fish and meat were never provided.
Given the wide variability in ingredient quantity and food type, the school offered multiple weekly menus, complicating efforts to establish a standard menu. For this reason, this study considered two baseline menus representing extremes: a best-possible menu, indicative of an ideal scenario where all ingredients were available in sufficient quantity, and a sub-optimal menu, or worst-case scenario, featuring only one type of vegetable and a weekly reduction of 10 kg in quantity of food supplied to the school.
The study used the World Food Programme (WFP) school menu planner (SMP) PLUS school menu creation platform to reproduce and analyze the nutritional profile of the two baseline menus offered by the school at the time of the study. Qualitative and quantitative data provided by VFA on the weekly ingredients and costs incurred for food procurement over a one-year period (from October 2020 to October 2021) were manually inserted into SMP PLUS to create a nutritional profile of the two baseline menus. Data on the ingredients purchased to prepare the VFA school meals were entered following the harmonization of mass units into kilograms. By including data on food prices and the food nutritional composition, the software used advanced algorithms to generate a series of optimized menus, which included different food items daily, for up to four weeks. The software also allowed the inclusion of new food items, not originally listed on the platform, and the manual creation of menus.
National food composition tables were used as the reference document to generate the nutritional profile of commodities [57], except for the nutrient values of slender leaf, which was retrieved from the literature [58]. The ration per person was then calculated by dividing the total quantity of ingredients by the number of beneficiaries. The weekly menus’ nutritional profile per person was analyzed using the SMP PLUS software and results, shown as daily values, were compared to the 30% threshold for energy and nutrient requirements established by the national school feeding guidelines [59,60].
2.3. The Optimizations
Following the nutritional analysis of the baseline menus offered at VFA, three optimizations (Figure 1)—for both baseline menus—were undertaken to establish what could be changed in the school meal menus to maximize the meals’ nutritional value (in terms of energy and nutrient requirements) within the available budget (at the lowest possible price to meet the 30% RDA target for key nutrients per meal [59,60,61]).
The SMP PLUS software allows users to design menus either manually or automatically, using a built-in algorithm. In manual mode, users can generate menus by selecting food items and specifying the price and quantity of ingredients. This was the approach used to evaluate the two baseline menus. In automatic mode, the software's algorithm generates the most cost-effective and nutrient-dense meals based on several configurable parameters, as used in the three optimization scenarios. Parameters such as menu duration and nutrition rules (nutrient targets) were the same for all optimizations, while food groups and item rules assigned by the software varied depending on the optimization performed. During the first optimization, the parameters were set to allow the tool to adjust only the quantities of food items already available to VFA, without altering the existing ingredients list. In the second and third optimizations, the five target NUS were added to the ingredients list, with the software allowed to freely choose among the available plant-based foods in the second optimization and all food items, including ASF, in the third.
3. Results
3.1. Nutritional Analysis of the Baseline Menus
The two weekly baseline school menus—the best-possible and sub-optimal menus—were analyzed for their nutritional adequacy using SMP PLUS and the results are presented below.
3.1.1. The Best-Possible Baseline Menu (BL Best-Possible)
At baseline, the best-possible weekly menu included mixed-flour porridge for breakfast and, in addition to the base of oil, tomatoes, and onion, used all food items that were available for lunch, as outlined below:
- Monday: White rice (Oryza sativa), green grams (Vigna radiata) (known locally as ndengu), and mixed vegetables;
- Tuesday: Maize meal (ugali) and mixed vegetables;
- Wednesday: White rice, yellow beans (Phaseolus vulgaris), and mixed vegetables;
- Thursday: White rice, green grams, and Irish potatoes (Solanum tuberosum)
- Friday: White rice, yellow beans, and mixed vegetables.
3.1.2. The Sub-Optimal Baseline Menu (BL Sub-Optimal)
In the sub-optimal menu, only one type of green leafy vegetable was available for the entire week, alongside legumes and different starchy staples, in addition to the base of oil, tomatoes and onion. Vegetables were supplied in reduced quantities (10 kg less than the average weekly vegetable supply), and potatoes were excluded. Meals in the sub-optimal menu included mixed-flour porridge for breakfast and lunch, as outlined below.
- Monday: White rice, green grams (ndengu), and spinach;
- Tuesday: Maize meal (ugali) and spinach;
- Wednesday: White rice, yellow beans, and spinach;
- Thursday: White rice and green grams;
- Friday: White rice, yellow beans, and spinach.
The nutritional profile of the two menus is provided in Figure 2. Nutritional values are compared to the 30% cut-off for energy and nutrient requirements established by national school feeding guidelines [59,60]. For detailed quantities, refer to Annex S1.
Both baseline menus provided adequate amounts of protein, vitamin C, zinc, magnesium, and vitamins B1 to B9. The lack of ASF in both menus, however, provided no vitamin B12. The weekly best-possible baseline menu was thus more nutritious than the sub-optimal menu, however, neither provided adequate calcium and fat, while the sub-optimal menu also provided inadequate energy (calories), vitamin A, and iron.
Following the analysis of the two baseline menus, the study proceeded to create three distinct optimizations for each of the two baseline menus. Each optimization allowed varying degrees of flexibility within the software. The menu optimizations determined an improvement from a nutritional and cost-efficiency perspective, as shown below.
3.2. SMP PLUS Optimizations
3.2.1. First Optimization: Baseline Menu Ingredients in Optimum Quantity
Best-possible menu (BL best-possible +)
Despite the optimization, the provision of vitamin B12 continued to be inadequate due to the menu’s lack of ASF. However, the optimization allowed the menu to reach the mean daily threshold of 30% for calcium and fat requirements (Figure 3). To fill these nutrient gaps, SMP PLUS increased the quantity of millet, wheat, and sorghum flours (for porridge) from 30g to 150g per week and changed the vegetables’ proportion and variety. Kale quantities were increased by 133%, while the quantity of collard greens underwent a more than six-fold increase, from 48g to 361g per week. Conversely, the quantity of potatoes, rice, and courgettes decreased by 82%, 47%, and 65%, respectively (see Table 1 in Supplementary materials). The nutritional improvement was associated with a substantial cost reduction for the best-possible baseline meal, which decreased by approximately 44%, from USD 0.40 to USD 0.22, per school meal. This cost reduction would imply daily savings of USD 0.17 per meal, generating monthly savings of USD 3.45 per meal and a total saving of USD 435 for the school.
Sub-optimal menu (BL sub-optimal +)
Similarly to the best-possible menu, optimizing the sub-optimal menu could not ensure the provision of vitamin B12 due the absence of ASF. However, increases in the quantity and portions of the available ingredients (Table S1) enabled the menu to meet the average daily target of 30% for calcium and fat requirements, as well as the nutrient requirements for energy, vitamin A, and iron (see Figure 3 and Table 1).
In this optimization, SMP PLUS increased the quantity of most ingredients. The amount of porridge flour increased five-fold (from 30g to 150g per week), while the quantity of yellow beans, green grams and spinach increased by 64,5%, 38%, and 160%, respectively. Conversely, the quantities of the two most-popular ingredients in contemporary Kenyan cuisine—tomato and onion—were reduced by 89% and 35%, respectively. The increases determined by the software for most food items caused a slight rise in the cost of each school meal, which rose by 3.6%, from USD 0.25 to USD 0.26 per day.
3.2.2. Second Optimization: Software Freely Selects Fruits, Legumes, and Vegetables, Including NUS
The outcome of the second optimization was identical for both baseline menus, as the difference between the best-possible and sub-optimal menus depended solely on vegetable availability. Vitamin B12 requirements continued to fall short due to the lack of ASF in both baseline menus, while all other micro- and macro-nutrient requirements were met (see Figure 4 and Table 1).
Alongside the NUS that were manually included in the software’s ingredients’ list, SMP PLUS selected amaranth—another important traditional crop—kale, and avocado. Interestingly, the amount of millet, sorghum, wheat, and groundnut porridge flours was left unchanged, but the overall quantity of cereals was integrated with 235g of red sorghum grain per week (see Table S1).
The second optimization produced a more affordable school meal compared to both baseline menus. The cost dropped by around 66% for the best-possible baseline menu and 45% for the sub-optimal menu, decreasing from USD 0.40 to USD 0.14 per meal and USD 0.25 to USD 0.14 per meal, respectively. This translates into savings of USD 0.26 per meal per day and USD 5.20 per meal per month, adding up to a total monthly savings of USD 655 for the entire school with the best-possible menu. For the sub-optimal menu, the savings come to USD 0.11 per meal per day and USD 2.25 per meal per month, resulting in a total monthly savings of USD 283.50 for the school.
3.2.3. Third Optimization: Software Freely Selects All Menu Ingredients Including NUS
Like the second SMP PLUS optimization, the third yielded identical results for both baseline menus. The software’s unrestricted selection of ingredients led to the development of a school menu capable of fulfilling 30% of children’s daily nutritional requirements. Based on these calculations, the 30% threshold was achieved for all macro- and micronutrients (Figure 5 and Table 1).
To achieve the 30% threshold for vitamin B12, the SMP PLUS optimization incorporated cow’s milk in weekly portions of 525 g (510 ml) per meal, equivalent to 105 g per day (approximately 102 ml—nearly half the average serving size). Notably, the mixed-flour porridge was replaced exclusively with maize flour. Additionally, this optimization included amaranth, kale, and avocado, alongside the NUS (Table S1).
This final optimization resulted in the most cost-effective school meal, priced at USD 0.13 per meal, per day. Compared to the best-possible baseline menu, costs decreased by approximately 67%, and by around 48% for the sub-optimal menu. For the best menu, the cost was reduced from USD 0.40 to 0.13 USD per meal, resulting in daily savings of USD 0.27, and monthly savings of USD 5.3 per meal. This would amount to a total monthly saving of approximately USD 668 for the entire school. Relative to the sub-optimal menu, the optimized menu reduced costs from USD 0.25 to USD 0.13 per meal, saving USD 0.12 per day, per meal and USD 2.36 per month, per meal. For the whole school, this represents a monthly saving of USD 297. A comparison of nutritional data and prices of all the VFA menus is shown in Table 1.
4. Discussion
Current school meal menus in Kenya lack important micronutrients and require improvements to meet the 30% threshold for energy and nutrient requirements established by the national school feeding guidelines [59,60]. This is not only the case for the study school, but is also relevant for schools in other Kenyan counties [62]. The results of this study illustrate how introducing local foods and NUS into school meals can provide nutritionally adequate meals at affordable prices. The results also highlight that besides the selected NUS, other locally available vegetables and fruits, such as amaranth and avocado to name but two, could be included to optimize the school meals’ nutrient adequacy. At the same time, our results indicate that, including local vegetables in school menus, can produce substantial savings for the school at procurement level.
The cost of school meals could be further minimized by exploring alternative food sources or using substitute ingredients, as outlined in the next sections. This is particularly noteworthy if we consider that schools are often challenged to provide students with nutritious meals while maintaining affordability. School meal programs regularly face budget constraints, making it difficult to procure fresh, high-quality ingredients [63]. However, costs like potential extra labor needed to clean and cut the leafy vegetables may need to be added depending on how food preparation is organized at the school level. Alternatively, vegetables may be obtained readily washed and cut (pre-processed), which comes at a cost. Either of these costs may be covered by the overall savings generated by including locally available NUS.
Food and economic crises further take their toll. As a net importer of wheat, fertilizer, and fuel, by the second half of 2021 and into 2022, Kenya’s economy and food security were severely affected by prolonged droughts, while the health and economic impacts of the COVID-19 pandemic hit the education sector most severely [64]. The long-lasting effects of these shocks on food prices and supplies were dramatic, especially for small, private schools such as VFA, which was forced to reduce the quantity and variety of food provided in its school meal program. Therefore, tools such as SMP PLUS can be extremely valuable for exploring alternative food options, maximizing the use of local agrobiodiversity to close nutrient gaps, and making school meals more affordable.
At the same time, software such as SMP PLUS can guide national decision making when it comes to implementing effective national school feeding programs. In 2023, an audit was conducted to evaluate whether Kenya's National School Meals and Nutrition Program, managed by the State Department for Early Learning and Basic Education, effectively provided adequate and nutritious school meals in informal urban settlements. While the program was found to enhance school attendance, it failed to meet expectations in several critical areas [11]. Budget constraints and delayed payments to beneficiary schools hindered the provision of sufficient meals throughout the school year. Additionally, the allocation of KES 10 (USD 0.07, using the exchange rate at the time of the study) per child, per day, set in 2009, failed to account for fluctuations in food commodity prices and the rising cost of living, rendering it insufficient to provide nutritious meals for its beneficiaries. The audit noted that the program fell short of providing a "complete food basket", with schools at times receiving only rice, without the pulses, salt, and vegetables considered essential components of the program.
Among the audit’s recommendations to the State Department for Early Learning and Basic Education is to “continuously carry-out market research to ascertain the actual cost of a meal so as to better inform budgeting and planning of the program”. As our study has shown, the SMP PLUS software enables the user to input up-to-date pricing information for each commodity, ensuring schools can adequately budget for the year. Furthermore, the third meal optimization yielded a nutritionally balanced weekly menu at an affordable cost of USD 0.13 per day. With an additional USD 0.06 per day invested on top of its current allocation (for a total investment of USD 1.35 million), the Kenyan government could ensure its 10.4 million primary school population is adequately nourished. Considering an inflation rate of 5% per year, the estimated costs after optimization are below the current (at October 2024) national average costs per meal, which was estimated to be USD 0.27 [65]. Seasonal price fluctuations may be bridged by using the huge variety of locally/nationally available NUS. However, this will require investing in national education to support learning and nutrition-related outcomes at school level (e.g., chefs, teachers, procurement staff) and in the way food is produced and supplied by small-holder farmers to school meal programs to overcome seasonal gaps [62]. It also aligns with recommendations stemming from the recent School Meals Coalition’s Task Force meeting (October 29, 2024), which recommended strengthening evidence to support better decision making and more cost-efficient school meal programs [66], whilst documenting the cost-efficient best practices of sustainable national school meal programs. Additional recommendations were to request financial and technical advice from the Ministry of Agriculture on farming initiatives and meal diversification by incorporating local varieties of tubers, vegetables, pulses, and cereals.
Notable examples of direct procurement approaches that link smallholder farmers to schools for the supply of African indigenous vegetables are already available in Kenya, in an approach known as ‘home-grown school feeding’ [16]. Innovative approaches such as urban gardening and aquaponics are being co-created and tested with a diverse range of food-system actors in informal urban settlements in Western Kenya [67]. Targeting African leafy vegetables and fish value chains, these initiatives could be linked to a range of schools for the supply of NUS and ASFs.
In addition to addressing child malnutrition by providing students with vital vitamins and minerals for healthy growth and cognitive development, effective school meal programs help tackle hunger, boosting concentration, academic performance, and attendance. Furthermore, such initiatives can break poverty cycles by alleviating food insecurity among disadvantaged communities, while also promoting equity. From an economic perspective, healthier populations reduce healthcare costs and foster a more capable workforce, ensuring a return of up to USD 9 for every USD 1 invested [68] that bolsters societal well-being and national development.
4.1. Study Limitations
The study focused on a single school that relies on charitable donations to implement its school meal program. This is not a typical scenario for Kenya, and future research should expand to encompass both state and private schools in rural and urban areas across Kenya, allowing for a comprehensive assessment of menu quality across diverse settings and varying funding sources.
Additionally, it is important to recognize that the nutritional values of food items in the optimized menus are based on estimates for raw ingredients, without accounting for factors such as special needs, nutrient retention, or the bioavailability of food nutrients. This study focused solely on meeting the students’ basic nutritional requirements. Children with special (dietary) needs may have higher-than-average nutritional demands or specific dietary requirements depending on their type of malnutrition, and separate thresholds should be established for them. To obtain more precise nutrient values for each meal, future enhancements to the software and methodology will be required.
Additionally, to meet the 30% threshold established for the students' daily macro- and micronutrient requirements, the optimized menus occasionally exceeded the recommended levels of certain micronutrients. The highest levels were observed for vitamin C and magnesium. In the first and second optimizations of the best-possible menu, vitamin C levels were over three times the daily requirement, while in the first optimization of the sub-optimal menu, magnesium levels were more than double the recommended amount. However, these values do not reflect actual daily intakes. Notably, the calculations were performed using raw ingredients as a reference and considered a period of five school days. Cooking leafy vegetables, which in the meals were the primary source of vitamin C, significantly reduces their vitamin C content. Moreover, as previously highlighted, many Kenyan households are unable to meet a child’s full daily nutritional requirements at home, making school meals the only significant meal children will receive daily. As a result, excess micronutrient levels should be distributed over seven days to account for the days when children are not in school. However, the micronutrients concerned are still within the Tolerable Upper Intake Level listed by the European Food Safety Authority [69]. Finally, the bioavailable portion of a nutrient that reaches the gastrointestinal tract is significantly smaller than the amounts in food items (often raw) listed in food composition tables.
Additional limitations are those related to the constraints inherent in SMP PLUS. For instance, the food basket from which users could select at the time of this study were limited and excluded traditional, culturally acceptable, yet nutritious food options, such as underutilized traditional crops, cheese, fungi, and insects. Thus, the algorithm generated the optimized menus according to a wide but non-exhaustive list of commodities. Additionally, the tool did not always provide detailed information about food items; while it sometimes specified whether a product was fresh or dried, this detail was often omitted. Furthermore, the nutrient database within the software appeared incomplete. For instance, amino acids were not specified, making it impossible to assess the biological value of the proteins selected by the tool. Another software limitation was its inability to establish minimum diversity requirements within food groups. Although the optimized menus typically include five or more food groups, the variety of items within a single food group was often very limited in some menus.
5. Conclusions
Annex 3 of the Kenyan National School Meals and Nutrition Strategy 2017-2022, offers examples of nutritionally balanced school meals that provide 38−66% of energy and nutrient requirements for school-age children. However, the menus are monotonous, leaving single-serve Multiple Micronutrient Powder formulations, fortified flours, and super cereal porridges to provide the bulk of vitamins A, B1−B12, C, D, and E [60].
The study results illustrate that underutilized nutrient-rich food species offer a valid and healthy option to meet the recommended daily nutrient needs for school-age children at affordable prices, making important savings for schools. Based on these results, national school meal programs are encouraged to consider including NUS and other traditional commodities in school meal preparation. This would result in a more diversified and nutritionally balanced diet at lower prices. The savings on school meals would also enable schools to increase the quantity of food provided to students (thus going beyond the 30% threshold of the students’ minimum nutritional requirements) and to introduce ASFs or alternative sources of protein and vitamins (especially vitamin B12) into the meals. This is of the utmost importance, as one can assume that the nutrient provision at household level is limited, especially in informal settlement catchments or ASAL areas. Moreover, the inclusion of NUS, either fresh or dried, in school meals would contribute to promoting healthy diverse school menus, fostering sustainable food production, preserving the cultural heritage of local communities, while supporting biodiversity conservation and use.
The study also highlighted the value of linear programming tools like SMP PLUS in guiding national decision-making for school feeding programs. These tools are instrumental in designing cost-effective, nutritionally optimized menus that leverage locally available agrobiodiversity, thus promoting sustainable food systems and enhancing community resilience and livelihoods. By accounting for variables like commodity price fluctuations, such tools can help policymakers create stable, comprehensive food baskets that remain affordable, even amid economic volatility.
Given the inadequate nutritional quality of the breakfast and lunch provided to VFA students, and in alignment with the minimum school meal composition outlined in the national school meal strategy [59], this study established that school meals should reach a threshold of 30% of the daily energy requirements. However, it would be valuable to calculate the additional costs required to meet a 50% threshold, allocating 30% of the requirements to lunch and 20–25% to snacks and breakfast, as commonly practiced by many countries implementing school meal programs [70].
Future research should build on this foundation by testing these optimized menus in a broader range of real-world school settings, ensuring that they are not only nutritionally and economically viable, but also practically implementable. Additionally, assessing the broader implications, such as the environmental impacts of these meal programs, is essential. For example, understanding the carbon footprint or land use associated with different food options can and should guide the adoption of more sustainable practices. This holistic approach would ensure that school feeding programs are aligned with public health goals, economic feasibility, and environmental sustainability, making them a powerful tool for addressing global malnutrition, poverty, and climate change challenges.
Supplementary Materials
The following supporting information can be downloaded at the website of this paper posted on Preprints.org, Annex S1: Volunteers Foundation Academy baseline menus composition, item quantity and costs; Table S1: Weekly school meal composition stemming from the SMP PLUS optimizations.
Author Contributions
Conceptualization, I.P. and T.B.; methodology, I.P.; validation, I.P., T.B. and I.J.; formal analysis, I.P.; investigation, I.P.; resources, I.P.; data curation, I.P.; writing—original draft preparation, I.P., T.B; writing—review and editing, T.B., I.J. All authors have read and agreed to the published version of the manuscript.
Funding
This research received no external funding
Institutional Review Board Statement
Not applicable
Informed Consent Statement
Not applicable.
Data Availability Statement
The original contributions presented in this study are included in the article/supplementary material. Further inquiries can be directed to the corresponding author.
Acknowledgments
We gratefully acknowledge the World Food Programme (WFP) for providing access to the School Meal Planner SMP PLUS software and for their invaluable guidance, both of which were pivotal in achieving the results presented in this pilot study. Additionally, we express our appreciation to the University of Florence for their contributions and assistance throughout this project. Our sincere gratitude is also extended to the Volunteers Foundation Academy, particularly Pauline Martin and Farm to Feed for sharing detailed data on the school menus, ingredients, and recipes. We also acknowledge and thank Olga Spellman, Science editor of the Alliance of Bioversity and CIAT’s Science Writing Service for copy editing of this manuscript.
Conflicts of Interest
The authors declare no conflicts of interest. The funders had no role in the design of the study; in the collection, analyses, or interpretation of data; in the writing of the manuscript; or in the decision to publish the results.
References
- Kenya Food Security Steering Group The 2023 Short Rains. Food and Nutrition Security Assessment Report; Nairobi, Kenya, 2024;
- Global Nutrition Report Kenya Country Profile Available online: https://globalnutritionreport.org/resources/nutrition-profiles/africa/eastern-africa/kenya/ (accessed on 2 December 2024).
- FAO, IFAD, UNICEF, WFP, W. The State of Food Security and Nutrition in the World 2024; FAO; IFAD; UNICEF; WFP; WHO: Rome, Italy, 2024; ISBN 978-92-5-138882-2.
- UNICEF Undernourished and Overlooked: A Global Nutrition Crisis in Adolescent Girls and Women; New York, USA, 2023;
- Bundy, D.A.P.; de Silva, N.; Horton, S.; Patton, G.C.; Schultz, L.; Jamison, D.T.; Abubakara, A.; Ahuja, A.; Alderman, H.; Allen, N.; et al. Investment in Child and Adolescent Health and Development: Key Messages from Disease Control Priorities, 3rd Edition. Lancet 2018, 391, 687–699.
- Beal, T.; Manohar, S.; Miachon, L.; Fanzo, J. Nutrient-Dense Foods and Diverse Diets Are Important for Ensuring Adequate Nutrition across the Life Course. Proc. Natl. Acad. Sci. 2024, 121, doi:10.1073/pnas.2319007121. [CrossRef]
- Pastorino, S.; Hughes, D.; Schultz, L.; Owen, S.; Morris, K.M.; Backlund, U.; Bellanca, R.; Hunter, D.; Kaljonen, M.; Singh, S.; et al. School Meals and Food Systems: Rethinking the Consequences for Climate, Environment, Biodiversity, and Food Sovereignty; London, UK, 2023.
- Republic of Kenya Sessional Paper No. 4 of 1981 on National Food Policy 1981, 52.
- Republic of Kenya The Constitution of Kenya, 2010 2010, 211.
- Republic of Kenya National School Meals and Nutrition Strategy 2017-2022 2018, 61.
- Office of the Auditor-General The Auditor-General’s Performance Audit Report on National School Meals and Nutrition Programme; Nairobi, Kenya, 2023.
- School Meals Coalition Kenya Champions Planet-Friendly School Meals Available online: https://schoolmealscoalition.org/stories/kenya-champions-planet-friendly-school-meals (accessed on 9 December 2024).
- School Meals Coalition Governments Announce Strategic Priorities to Achieve Universal School Meals by 2030 Available online: https://schoolmealscoalition.org/stories/press-release-governments-announce-strategic-priorities-achieve-universal-school-meals-2030 (accessed on 9 December 2024).
- SMC Secretariat Kenya Champions Planet-Friendly School Meals Available online: https://schoolmealscoalition.org/stories/kenya-champions-planet-friendly-school-meals (accessed on 2 December 2024).
- Hunter, D.; Borelli, T.; Beltrame, D.M.O.; Oliveira, C.N.S.; Coradin, L.; Wasike, V.W.; Wasilwa, L.; Mwai, J.; Manjella, A.; Samarasinghe, G.W.L.; et al. The Potential of Neglected and Underutilized Species for Improving Diets and Nutrition. Planta 2019, 250, 709–729, doi:10.1007/s00425-019-03169-4. [CrossRef]
- Borelli, T.; Wasike, V.; Manjella, A.; Hunter, D.; Wasilwa, L. Linking Farmers and Schools to Improve Diets and Nutrition in Busia County, Kenya. In Public food procurement for sustainable food systems and healthy diets – Volume 2; Swensson, L.F.J., Hunter, D., Schneider, S., Tartanac, F., Eds.; FAO; Bioversity International and Editora UFRGS: Rome, Italy, 2021; pp. 338–353 ISBN 978-92-5-135479-7.
- Gelli, A.; Aurino, E. School Food Procurement and Making the Links between Agriculture, Health and Nutrition; Swensson, L.F.J., Hunter, D., Schneider, S., Tartanac, F., Eds.; 1st ed.; Food and Agricultural Organization of the United Nations: Rome, Italy, 2021; ISBN 978-92-5-135475-9.
- Agrobiodiversity, School Gardens and Healthy Diets; Hunter, D., Monville-Oro, E., Burgos, B., Rogel, C.N., Calub, B., Gonsalves, J., Lauridsen, N., Eds.; 1st ed.; Routledge: Abingdon, Oxon; New York, NY: Routledge, 2020., 2020; ISBN 9780429053788.
- Hunter, D.; Loboguerrero, A.M.; Martínez-Barón, D. Next-Generation School Feeding: Nourishing Our Children While Building Climate Resilience. UN-Nutrition. Transform. Nutr. 2022, 1, 158–163, doi:10.4060/cc2805en. [CrossRef]
- FAO; Alliance of Bioversity International and CIAT; Editora da UFRGS Public Food Procurement for Sustainable Food Systems and Healthy Diets - Volume 2; Swensson, L.F.J., Hunter, D., Schneider, S., Tartanac, F., Eds.; 1st ed.; Rome, Italy, 2021; ISBN 978-92-5-135479-7.
- Gelli, A.; Neeser, K.; Drake, L. Home Grown School Feeding: Linking Small Holder Agriculture to School Food Provision; HGSF; London, UK, 2010.
- Borelli, T.; Nekesa, T.; Mbelenga, E.; Jumbale, M.; Morimoto, Y.; Bellanca, R.; Jordan, I. Planet Friendly Home-Grown School Feeding: What Does It Mean?; Rome, Italy, 2024.
- Karl, K.; MacCarthy, D.; Porciello, J.; Chimwaza, G.; Fredenberg, E.; Freduah, B.S.; Guarin, J.; Mendez Leal, E.; Kozlowski, N.; Narh, S.; et al. Opportunity Crop Profiles for the Vision for Adapted Crops and Soils (VACS) in Africa; 2024.
- Singh, S. Home-Grown School Feeding: Promoting the Diversification of Local Production Systems through Nutrition-Sensitive Demand for Neglected and Underutilized Species. In Public food procurement for sustainable food systems and healthy diets - Volume 1; Swensson, L.F.J., Hunter, D., Schneider, S., Tartanac, F., Eds.; FAO and Bioversity International: Rome, Italy, 2021; pp. 125–141 ISBN 978-92-5-135475-9.
- Medeiros, G.C.B.S. de; Azevedo, K.P.M. de; Garcia, D.; Oliveira Segundo, V.H.; Mata, Á.N. de S.; Fernandes, A.K.P.; Santos, R.P. dos; Trindade, D.D.B. de B.; Moreno, I.M.; Guillén Martínez, D.; et al. Effect of School-Based Food and Nutrition Education Interventions on the Food Consumption of Adolescents: A Systematic Review and Meta-Analysis. Int. J. Environ. Res. Public Health 2022, 19.
- Contento, I.R.; Manning, A.D.; Shannon, B. Research Perspective on School-Based Nutrition Education. J. Nutr. Educ. 1992, 24, doi:10.1016/S0022-3182(12)81240-4. [CrossRef]
- Berg, A. More Resources for Nutrition Education: Strengthening the Case. J. Nutr. Educ. 1993, 25.
- FAO; Alliance of Bioversity International; CIAT Public Food Procurement for Sustainable Food Systems and Healthy Diets - Volume 2; 2021.
- Padulosi, S.; Roy, P.; Rosado-May, F.J. Supporting Nutrition Sensitive Agriculture through Neglected and Underutilized Species - Operational Framework ; Rome, 2019.
- Bharucha, Z.; Pretty, J. The Roles and Values of Wild Foods in Agricultural Systems. Philos. Trans. R. Soc. B Biol. Sci. 2010, 365, 2913–2926.
- FAO The State of the World’s Biodiversity for Food and Agriculture; Belanger, J., Pilling, D., Eds.; 1st ed.; FAO, Commission on Genetic Resources for Food and Agriculture Assessments: Rome, Italy, 2019; ISBN 978-92-5-131270-4.
- Smith, G.C.; Dueker, S.R.; Clifford, A.J.; Grivetti, L.E. Carotenoid Values of Selected Plant Foods Common to Southern Burkina Faso, West Africa. Ecol. Food Nutr. 1996, 35, doi:10.1080/03670244.1996.9991474. [CrossRef]
- UNEP; CBD; WHO Connecting Global Priorities: Biodiversity and Human Health: A State of Knowledge Review; 1st ed.; World Health Organization and Secretariat of the Convention on Biological Diversity, 2015; ISBN 9789241508537.
- Kuyper, E.; Vitta, B.; Dewey, K. Novel and Underused Food Sources of Key Nutrients for Complementary Feeding; A&T Technical Brief; Washington DC, USA, 2013; Vol. 6.
- Fuks, D.; Schmidt, F.; García-Collado, M.I.; Besseiche, M.; Payne, N.; Bosi, G.; Bouchaud, C.; Castiglioni, E.; Dabrowski, V.; Frumin, S.; et al. Orphan Crops of Archaeology-based Crop History Research. Plants, People, Planet 2024, doi:10.1002/ppp3.10468. [CrossRef]
- Adhikari, L.; Hussain, A.; Rasul, G. Tapping the Potential of Neglected and Underutilized Food Crops for Sustainable Nutrition Security in the Mountains of Pakistan and Nepal. Sustainability 2017, 9, 291, doi:10.3390/su9020291. [CrossRef]
- Padulosi, S.; Thompson, J.; Rudebjer, P. Fighting Poverty, Hunger and Malnutrition with Neglected and Underutilized Species: Needs, Challenges and the Way Forward; 2013.
- Bala Ravi, S.; Swain, S..; Sengotuvel, D.; Parida, N.R. Promoting Nutritious Millets for Enhancing Income and Improved Nutrition: A Case Study From Tamil Nadu and Orissa. In Minor millets in South Asia – Learning from the IFAD-NUS Project in India and Nepal; Bioversity International, Ed.; Bioversity International: Chennai, 2010; pp. 19–46.
- Vietmeyer, N.D. Lesser-Known Plants of Potential Use in Agriculture and Forestry. Science (80-. ). 1986, 232, 1379–1384, doi:10.1126/science.232.4756.1379. [CrossRef]
- Ndlovu, M.; Scheelbeek, P.; Mjabuliseni, N.; Mabhaudhi, T. Underutilized Crops for Diverse, Resilient and Healthy Agri-Food Systems: A Systematic Review of Sub-Saharan Africa. Front. Sustain. Food Syst. Sec. Clim. Food Syst. 2024, 8, doi:10.3389/fsufs.2024.1498402. [CrossRef]
- Gelli, A.; Masset, E.; Folson, G.; Kusi, A.; Arhinful, D.K.; Asante, F.; Ayi, I.; Bosompem, K.M.; Watkins, K.; Abdul-Rahman, L.; et al. Evaluation of Alternative School Feeding Models on Nutrition, Education, Agriculture and Other Social Outcomes in Ghana: Rationale, Randomised Design and Baseline Data. Trials 2016, 17, 37, doi:10.1186/s13063-015-1116-0. [CrossRef]
- Sumberg, J.; Sabates-Wheeler, R. Linking Agricultural Development to School Feeding in Sub-Saharan Africa: Theoretical Perspectives. Food Policy 2011, 36, 341–349, doi:10.1016/j.foodpol.2011.03.001. [CrossRef]
- FAO, A. of B.I.& C. Public Food Procurement for Sustainable Food Systems and Healthy Diets - Volume 1; 2021.
- Mashamaite, C.V.; Manyevere, A.; Chakauya, E. Cleome Gynandra: A Wonder Climate-Smart Plant for Nutritional Security for Millions in Semi-Arid Areas. Front. Plant Sci. 2022, 13, doi:10.3389/fpls.2022.1003080. [CrossRef]
- Kayitesi, E.; Moyo, S.M. Spider Plant (Cleome Gynandra). In Handbook of Phytonutrients in Indigenous Fruits and Vegetables; CABI: GB, 2022; pp. 27–49.
- Van den Heever, E.; Venter, S.L. Nutritional and Medicinal Properties of Cleome Gynandra. Acta Hortic. 2007, 127–130, doi:10.17660/ActaHortic.2007.752.17. [CrossRef]
- Ramatsetse, K.E.; Ramashia, S.E.; Mashau, M.E. A Review on Health Benefits, Antimicrobial and Antioxidant Properties of Bambara Groundnut (Vigna Subterranea). Int. J. Food Prop. 2023, 26, 91–107, doi:10.1080/10942912.2022.2153864. [CrossRef]
- Chelangat, M.; Muturi, P.; Gichimu, B.; Gitari, J.; Mukono, S. Nutritional and Phytochemical Composition of Bambara Groundnut (Vigna Subterranea [L.] Verdc) Landraces in Kenya. Int. J. Agron. 2023, 2023, 1–11, doi:10.1155/2023/9881028. [CrossRef]
- Tan, X.L.; Azam-Ali, S.; Goh, E. Von; Mustafa, M.; Chai, H.H.; Ho, W.K.; Mayes, S.; Mabhaudhi, T.; Azam-Ali, S.; Massawe, F. Bambara Groundnut: An Underutilized Leguminous Crop for Global Food Security and Nutrition. Front. Nutr. 2020, 7, doi:10.3389/fnut.2020.601496. [CrossRef]
- Veldsman, Z.; Pretorius, B.; Schönfeldt, H.C. Examining the Contribution of an Underutilized Food Source, Bambara Groundnut, in Improving Protein Intake in Sub-Saharan Africa. Front. Sustain. Food Syst. 2023, 7, doi:10.3389/fsufs.2023.1183890. [CrossRef]
- Pandey, D.K.; Singh, S.; Dubey, S.K.; Mehra, T.S.; Dixit, S.; Sawargaonkar, G. Nutrient Profiling of Lablab Bean (Lablab Purpureus) from North-Eastern India: A Potential Legume for Plant-Based Meat Alternatives. J. Food Compos. Anal. 2023, 119, 105252, doi:10.1016/j.jfca.2023.105252. [CrossRef]
- Kumari, M.; Naresh, P.; Acharya, G.C.; Laxminarayana, K.; Singh, H.S.; Raghu, B.R.; Aghora, T.S. Nutritional Diversity of Indian Lablab Bean (Lablab Purpureus (L.) Sweet): An Approach towards Biofortification. South African J. Bot. 2022, 149, 189–195, doi:10.1016/j.sajb.2022.06.002. [CrossRef]
- Sahou, D.M.; Makokha, A.O.; Sila, D.N.; Abukutsa-Onyango, M.O. Nutritional Composition of Slenderleaf (Crotalaria Ochroleuca and Crotalaria Brevidens) Vegetable at Three Stages of Maturity. J. Agric. Food Technol. 2014, 4.
- Ngidi, M.S.C. The Role of Traditional Leafy Vegetables on Household Food Security in Umdoni Municipality of the KwaZulu Natal Province, South Africa. Foods 2023, 12, 3918, doi:10.3390/foods12213918. [CrossRef]
- Abukutsa-Onyango, M.O.; Kavagi, P.; Amoke, P.; Habwe, F.O. Iron and Protein Content of Priority Vegetables in the Lake Victoria Basin. J. Agric. Sci. Technol. 2010, 4, 67–69.
- Kirigia, D.; Winkelmann, T.; Kasili, R.; Mibus, H. Nutritional Composition in African Nightshade (Solanum Scabrum) Influenced by Harvesting Methods, Age and Storage Conditions. Postharvest Biol. Technol. 2019, 153, 142–151, doi:10.1016/j.postharvbio.2019.03.019. [CrossRef]
- FAO; Republic of Kenya Kenya Food Composition Tables; 1st ed.; FAO/Republic of Kenya: Nairobi, Kenya, 2018; ISBN 978-92-5-130445.
- Mibei, E.K.; Ojijo, N.K.O.; Karanja, S.M.; Kinyua, J.K. Compositional Attributes of the Leaves of Some Indigenous African Leafy Vegetables Commonly Consumed in Kenya. Ann. Food Sci. Technol. 2011, 12, 146–154.
- Government of Kenya School Nutrition and Meals Strategy for Kenya; 2016.
- Government of Kenya National School Meals and Nutrition Strategy 2017-2022; 2018.
- Bundy, D.A..; Gentilini, U.; Schultz, L.; Bedasso, B.; Singh, S.; Okamura, Y.; Iyengar, H.T.M.M.; Blakstad, M.M. School Meals, Social Protection and Human Development: Revisiting Trends, Evidence, and Practices in South Asia and Beyond; Social Protection & Jobs; Washington DC, USA, 2024.
- Nyonje, W.; Roothaert, R. Feasibility Study for Inclusion of Traditional Leafy Vegetables in School Feeding Programs in Kenya; Arusha, Tanzania, 2024.
- MUFPP School Meals: The Transformative Potential of Urban Food Policies; Milan, Italy, 2024.
- Mathenge, N.M.; Ghauri, T.A.; Mutie, C.K.; Sienaert, A.; Angelique, U. Kenya Economic Update: Aiming High. Securing Education to Sustain the Recovery; Nairobi, Kenya, 2022.
- Kamau, J.; Wanjohi, M.N.; Raburu, P. School Meals Case Study: Kenya; Nairobi, Kenya, 2024.
- SMC Secretariat School Meals Coalition Task Force Meeting Outcome Statement Available online: https://schoolmealscoalition.org/sites/default/files/2024-11/Leaders Statement Kenya TF Meeting 29 October 2024_29.10.24 final pub.pdf (accessed on 2 December 2024).
- Kimani, O.; Chege, C.; Musita, C.; Termote, C. Transforming Food Systems in Kisumu: Sustainable Innovations for Nutrition and Food Security Available online: https://alliancebioversityciat.org/stories/transforming-food-systems-kisumu-sustainable-innovations-nutrition-and-food-security (accessed on 2 December 2024).
- WFP State of School Feeding Worldwide 2020; Rome, Italy, 2020.
- EFSA Tolerable Upper Intake Levels for Vitamins and Minerals; 2006.
- FAO Nutrition Guidelines and Standards for School Meals: A Report from 33 Low and Middle-Income Countries; Rome, Italy, 2019.
Figure 1.
The software optimizations undertaken on the two baseline menus as part of this study. using the SMP PLUS tool. Source: Authors’ own elaboration. NOTE: The "+" sign next to the two baseline menus denotes the optimization of existing school meal ingredients. The results of the second and third optimizations were identical for both baseline menus, as the variation between the best-possible and sub-optimal menus was solely influenced by vegetable availability. Consequently, BL best-possible and BL sub-optimal were consolidated by the software into a single baseline average (BL average).
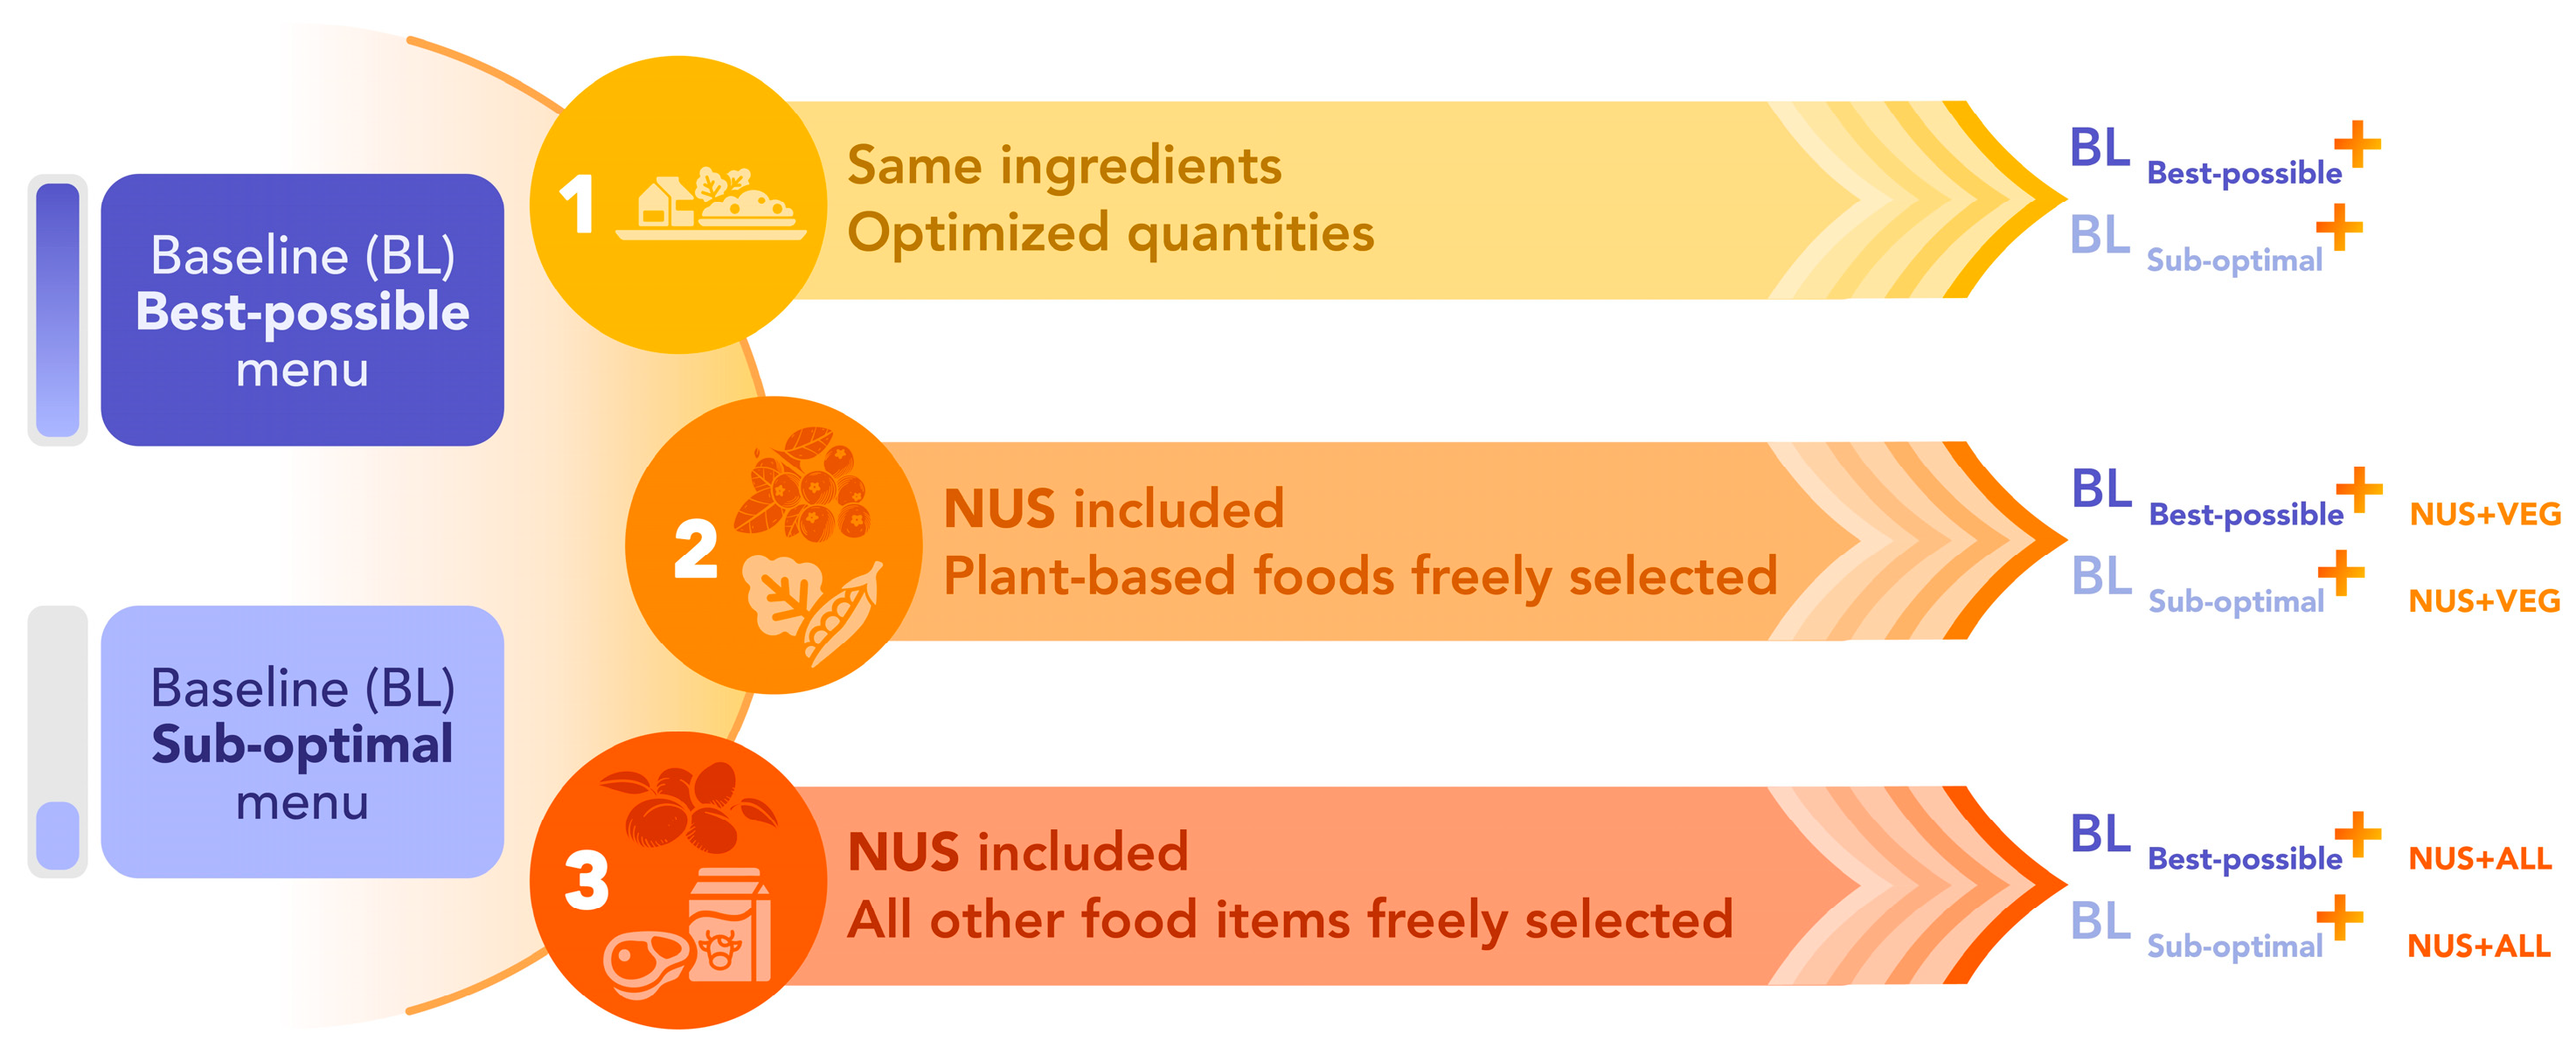
Figure 2.
Percentage of daily nutrient requirements supplied on average through best-possible (BL best-possible) and sub-optimal (BL sub-optimal) menus offered at the Volunteers Foundation Academy (VFA) compared to the 30% mean daily threshold (dotted line) for energy and nutrient requirements established by the national school feeding guidelines [59,60,61].
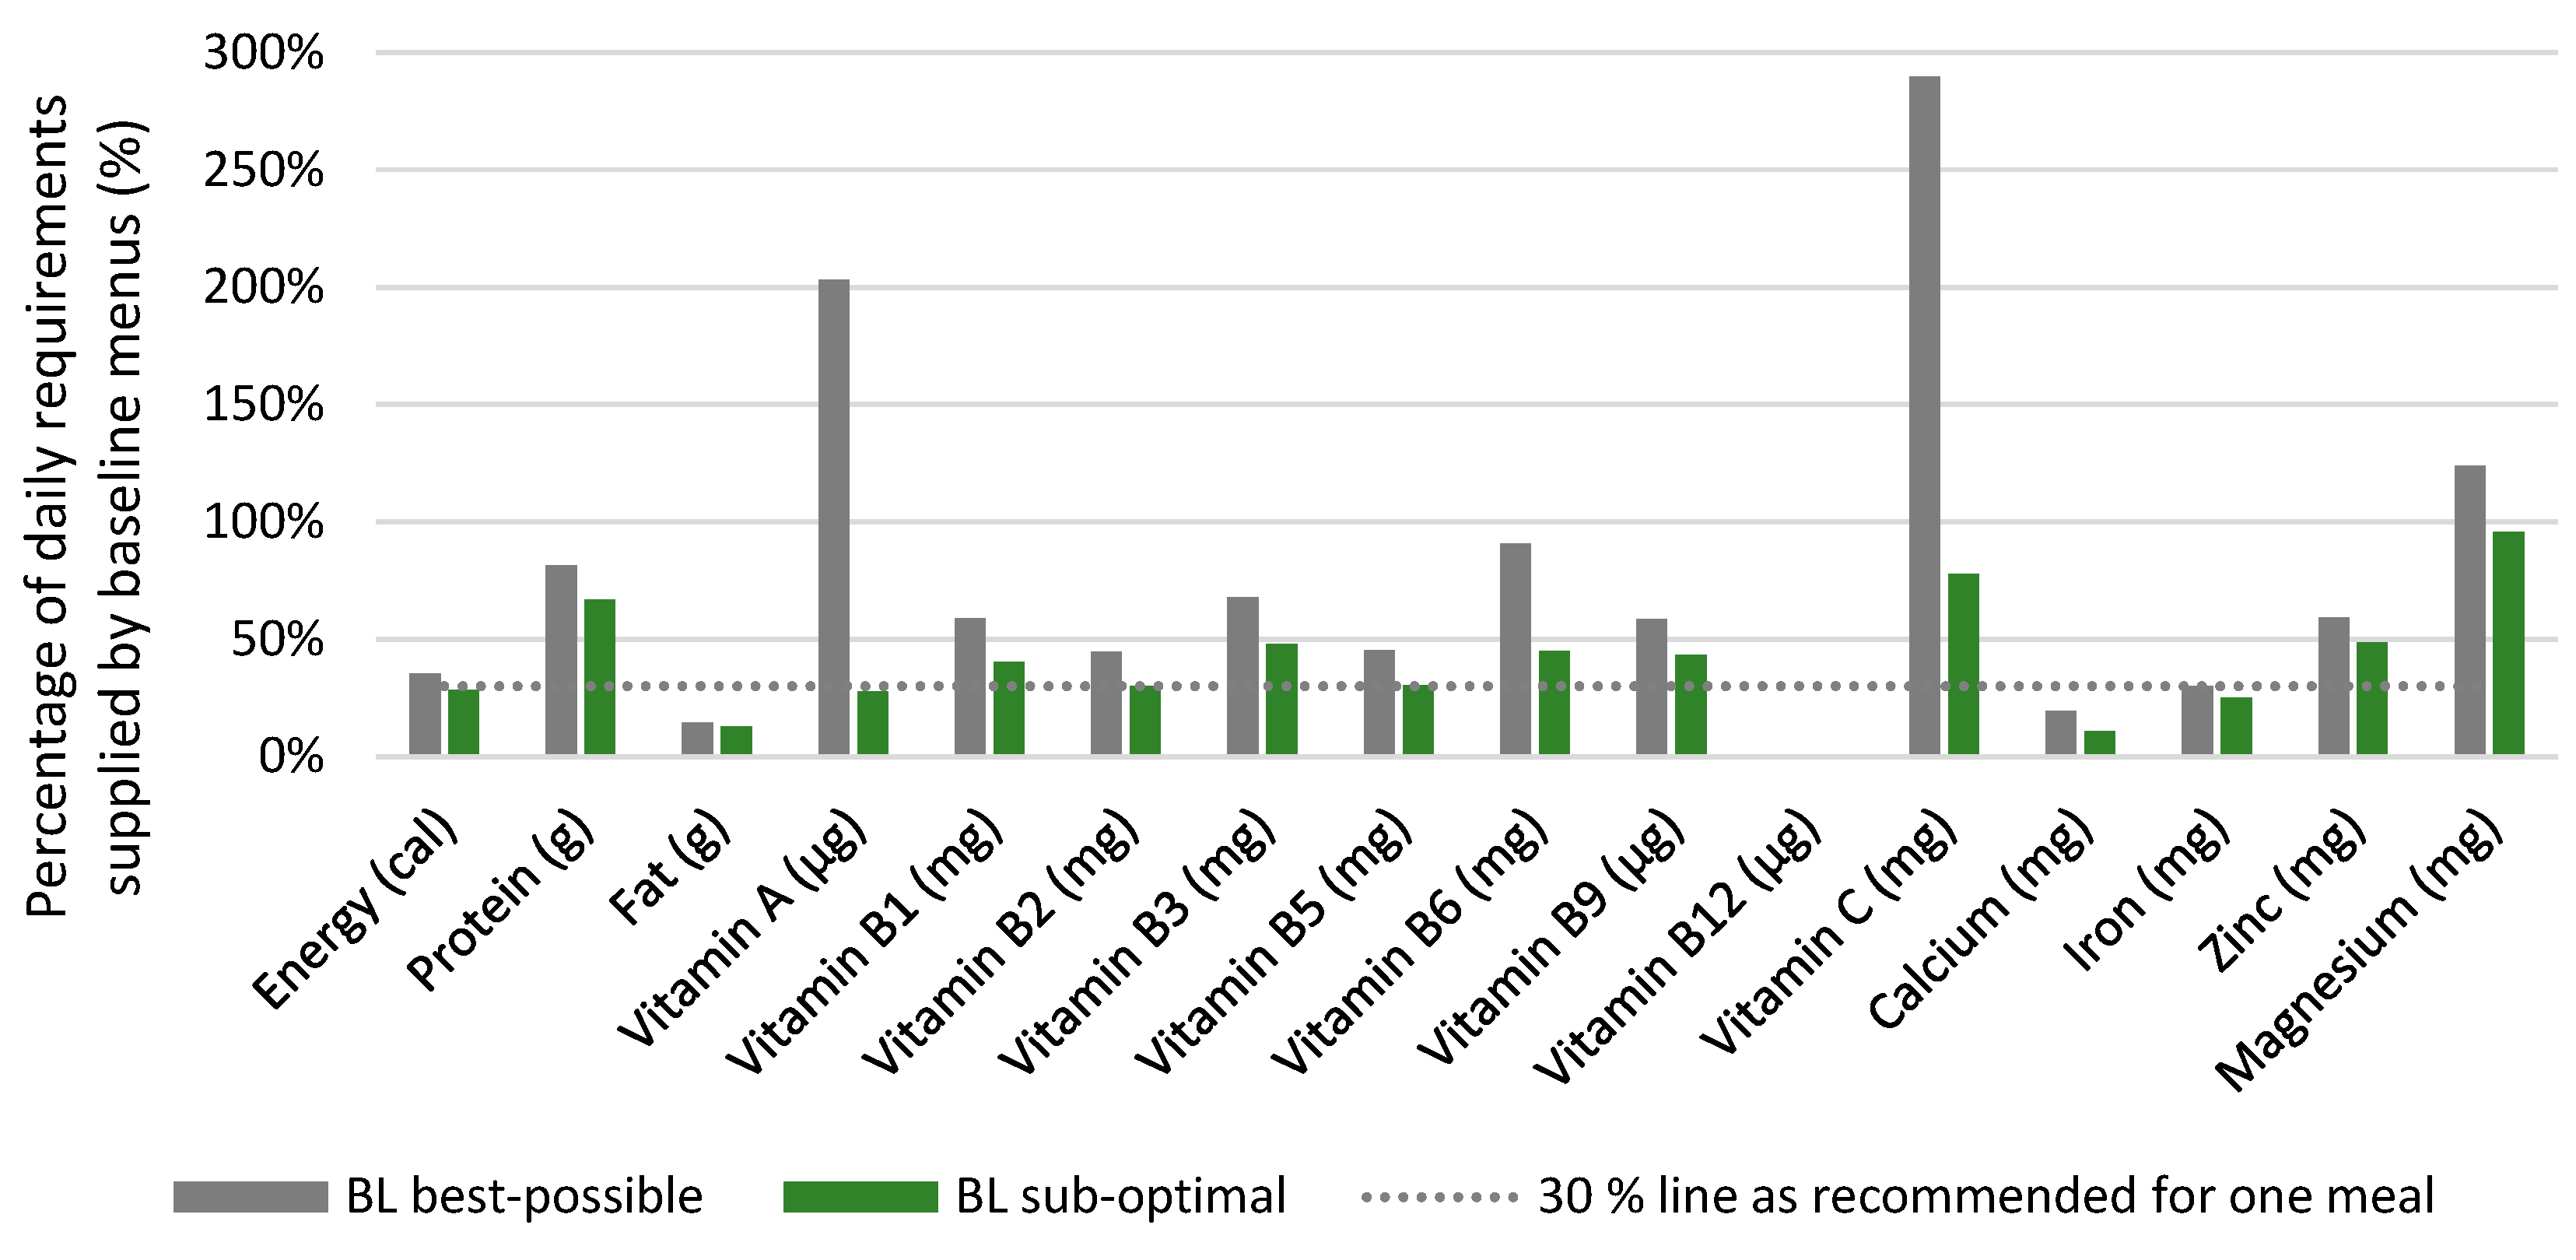
Figure 3.
Percentage of daily nutrient requirements supplied on average per menu following the first optimization for the best-possible and sub-optimal menus, elaborated by the SMP PLUS software. Values are compared to both baseline menus and the 30% mean daily threshold (dotted line) for energy and nutrient requirements established by the national school feeding guidelines [59,60,61].
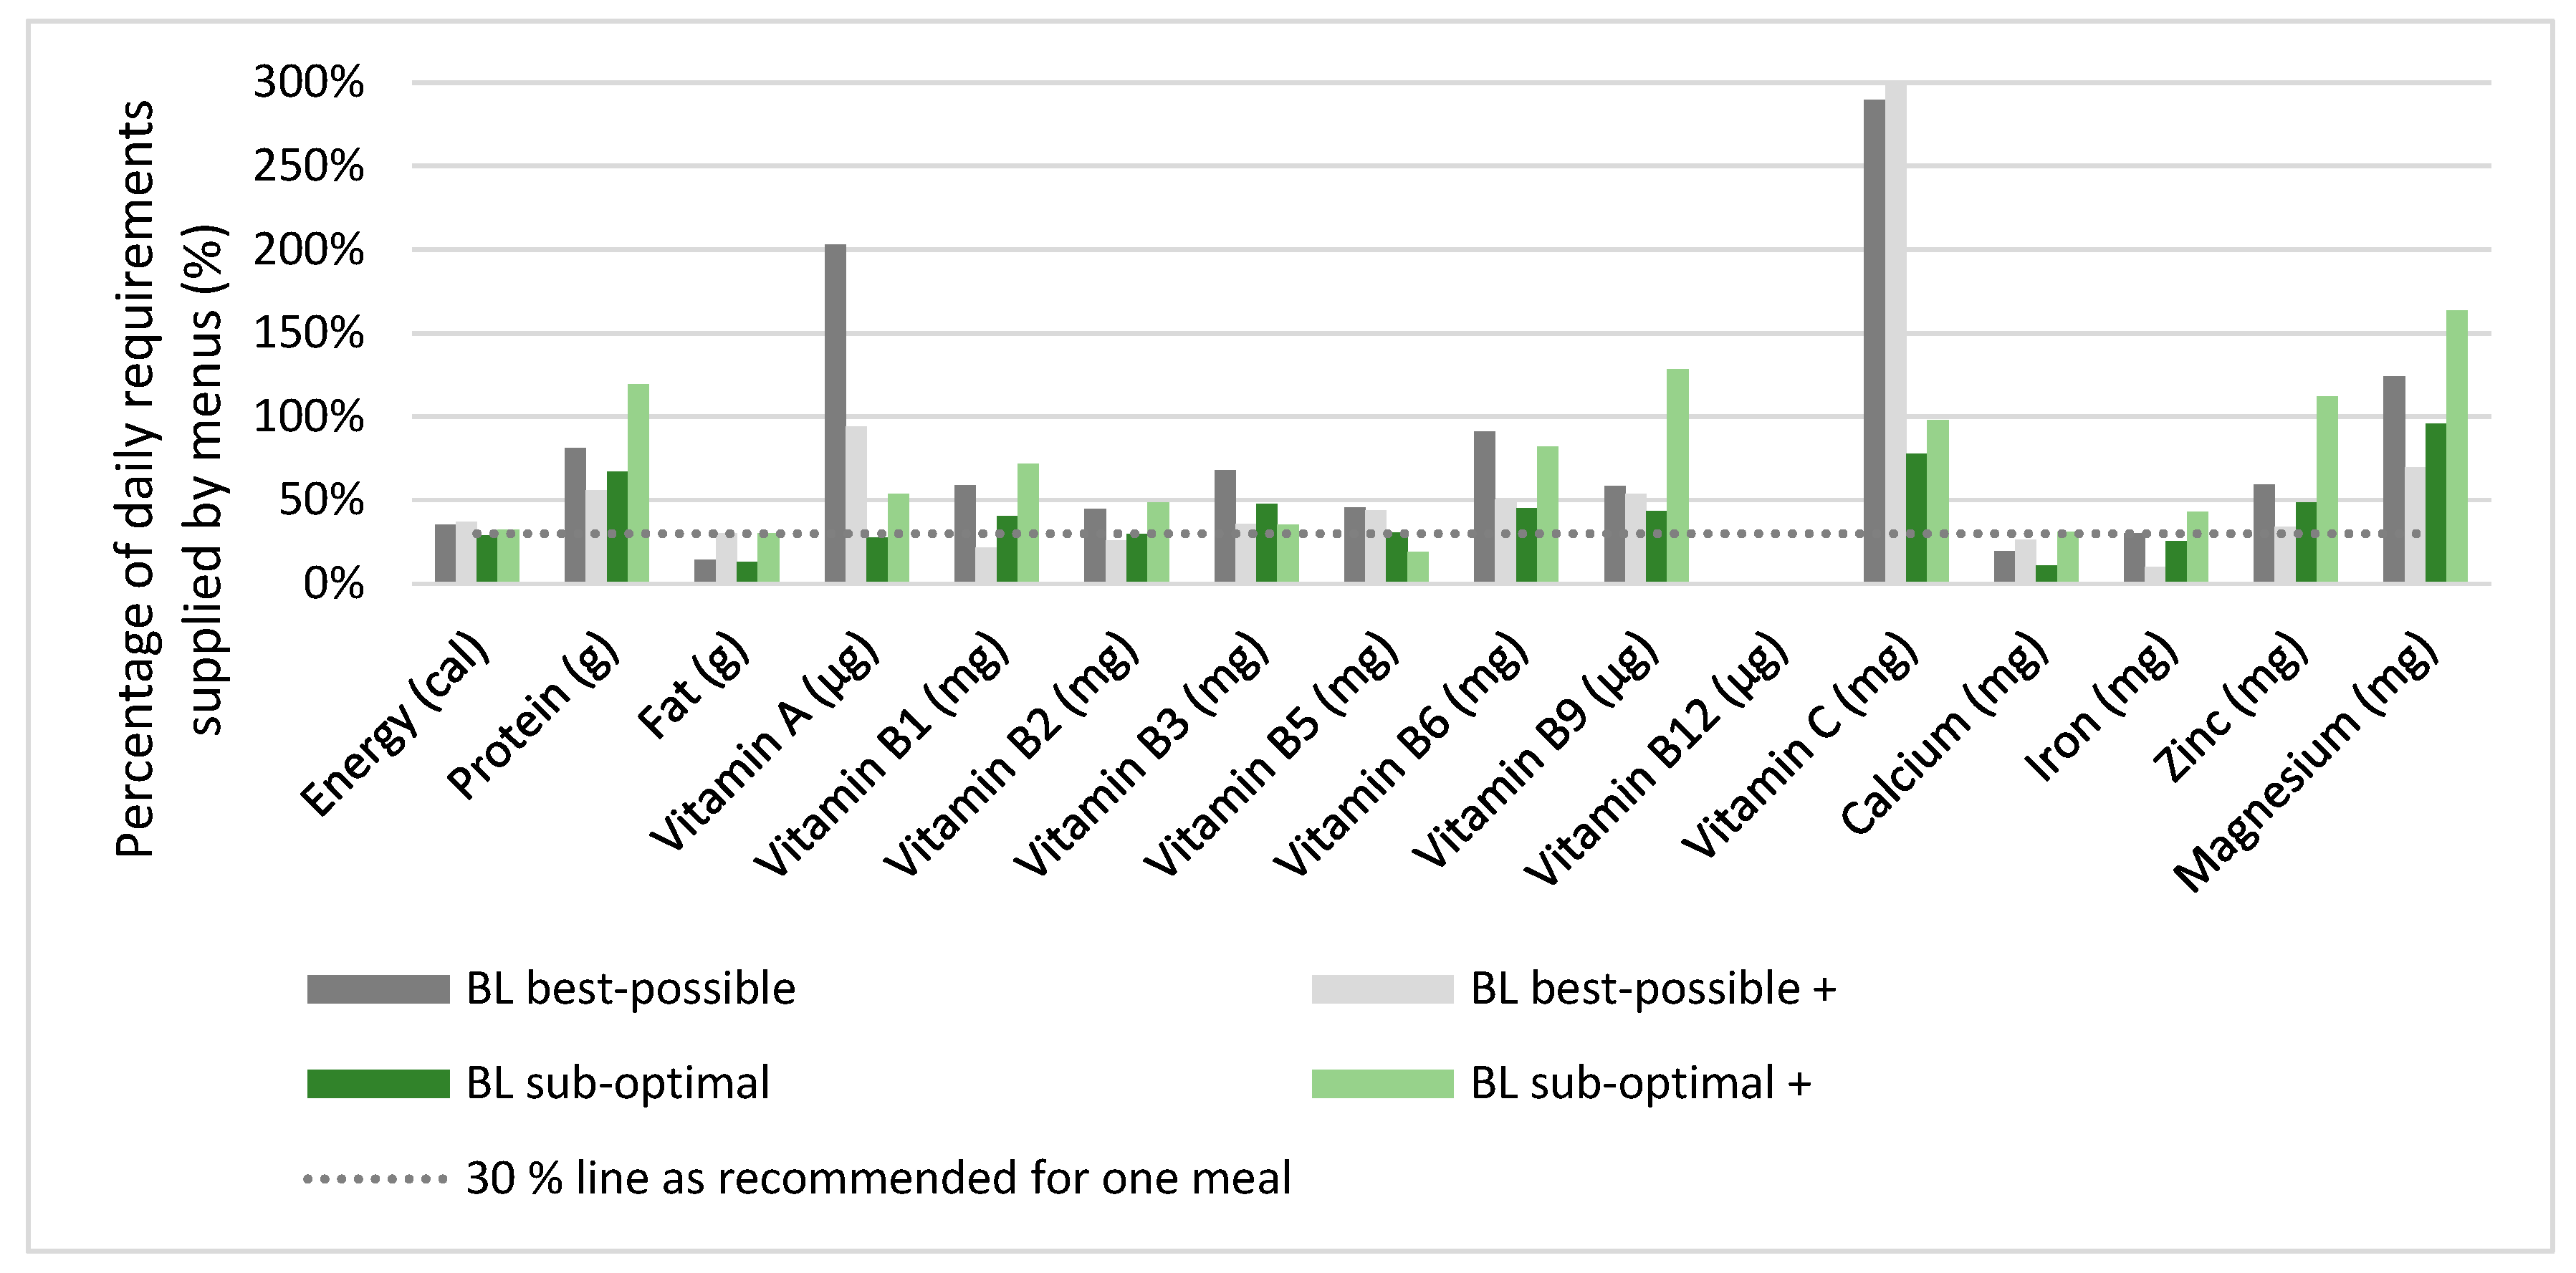
Figure 4.
The percentage of required daily nutrients supplied after including neglected and underutilized species (NUS) and free selection of plant-based foods (VEG) to the mean baseline menu (BL average + VEG), elaborated by the SMP PLUS software. NUS’ contribution (light green) is shown separately to other foods (dark green) [40]. No ASF were included. Values are compared to the 30% mean daily threshold (dotted line) for energy and nutrient requirements established by the national school feeding guidelines [59,60,61].
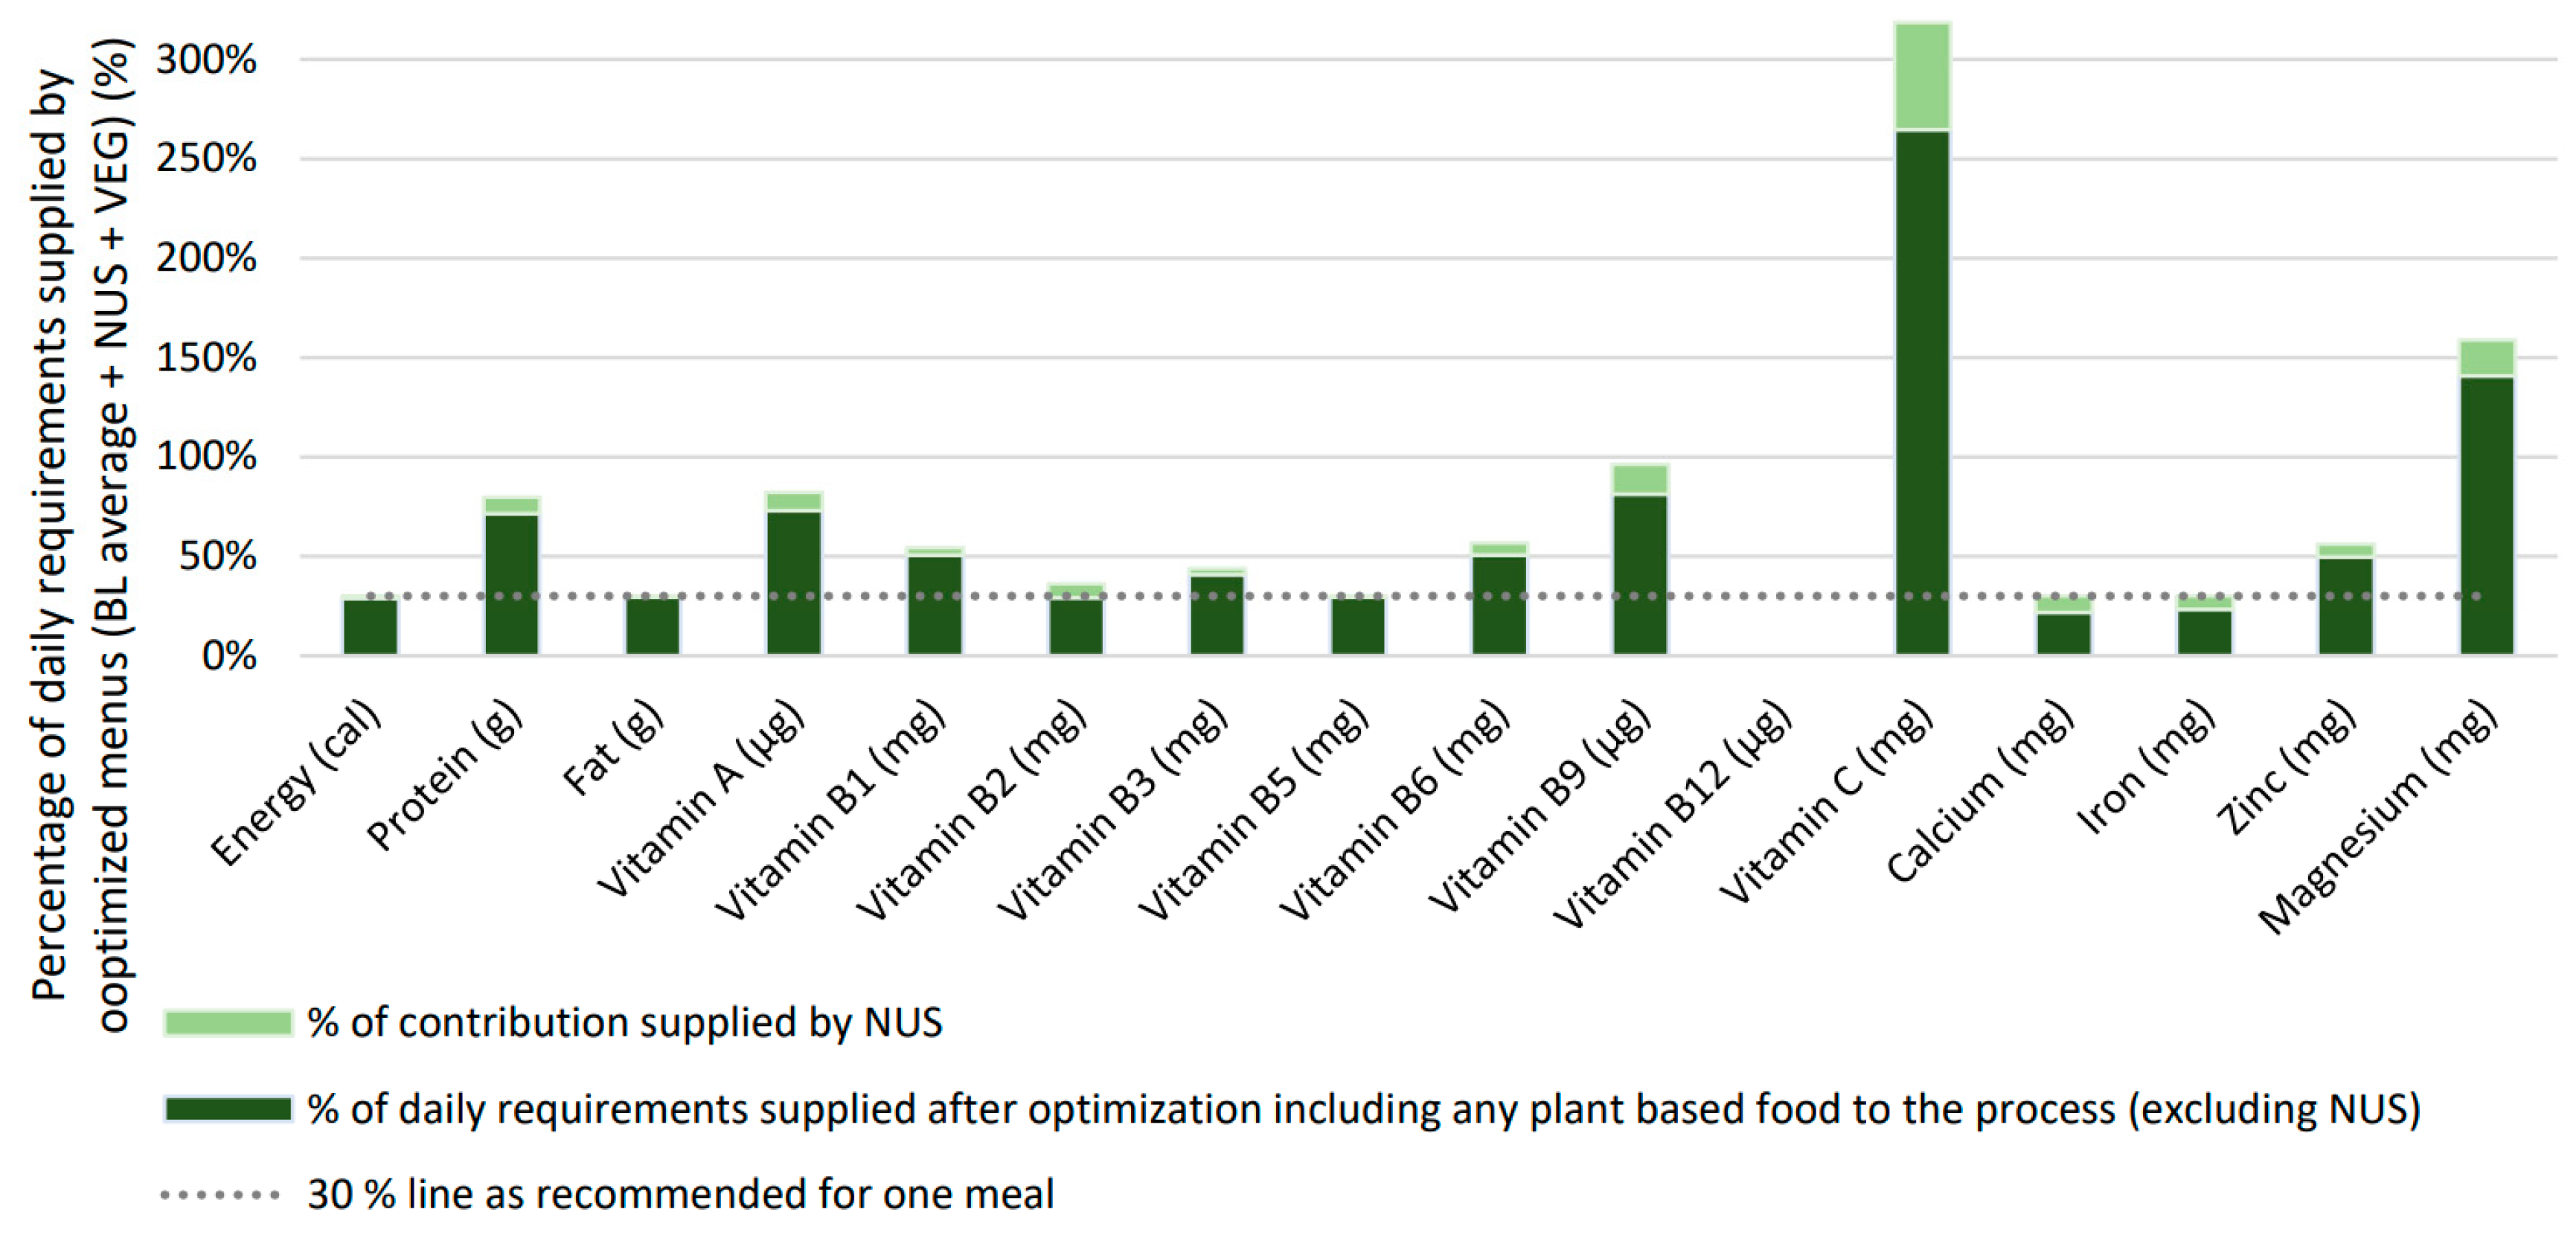
Figure 5.
Percentage of daily nutrient requirements supplied after including NUS and free selection of any other food to the mean baseline menu (BL average + NUS + ALL), elaborated by the SMP PLUS software. NUS’ contribution (light green color) is shown separately to other foods (blue) [40]. Values are compared to the 30% mean daily threshold (dotted line) for energy and nutrient requirements established by the national school feeding guidelines [59,60,61].
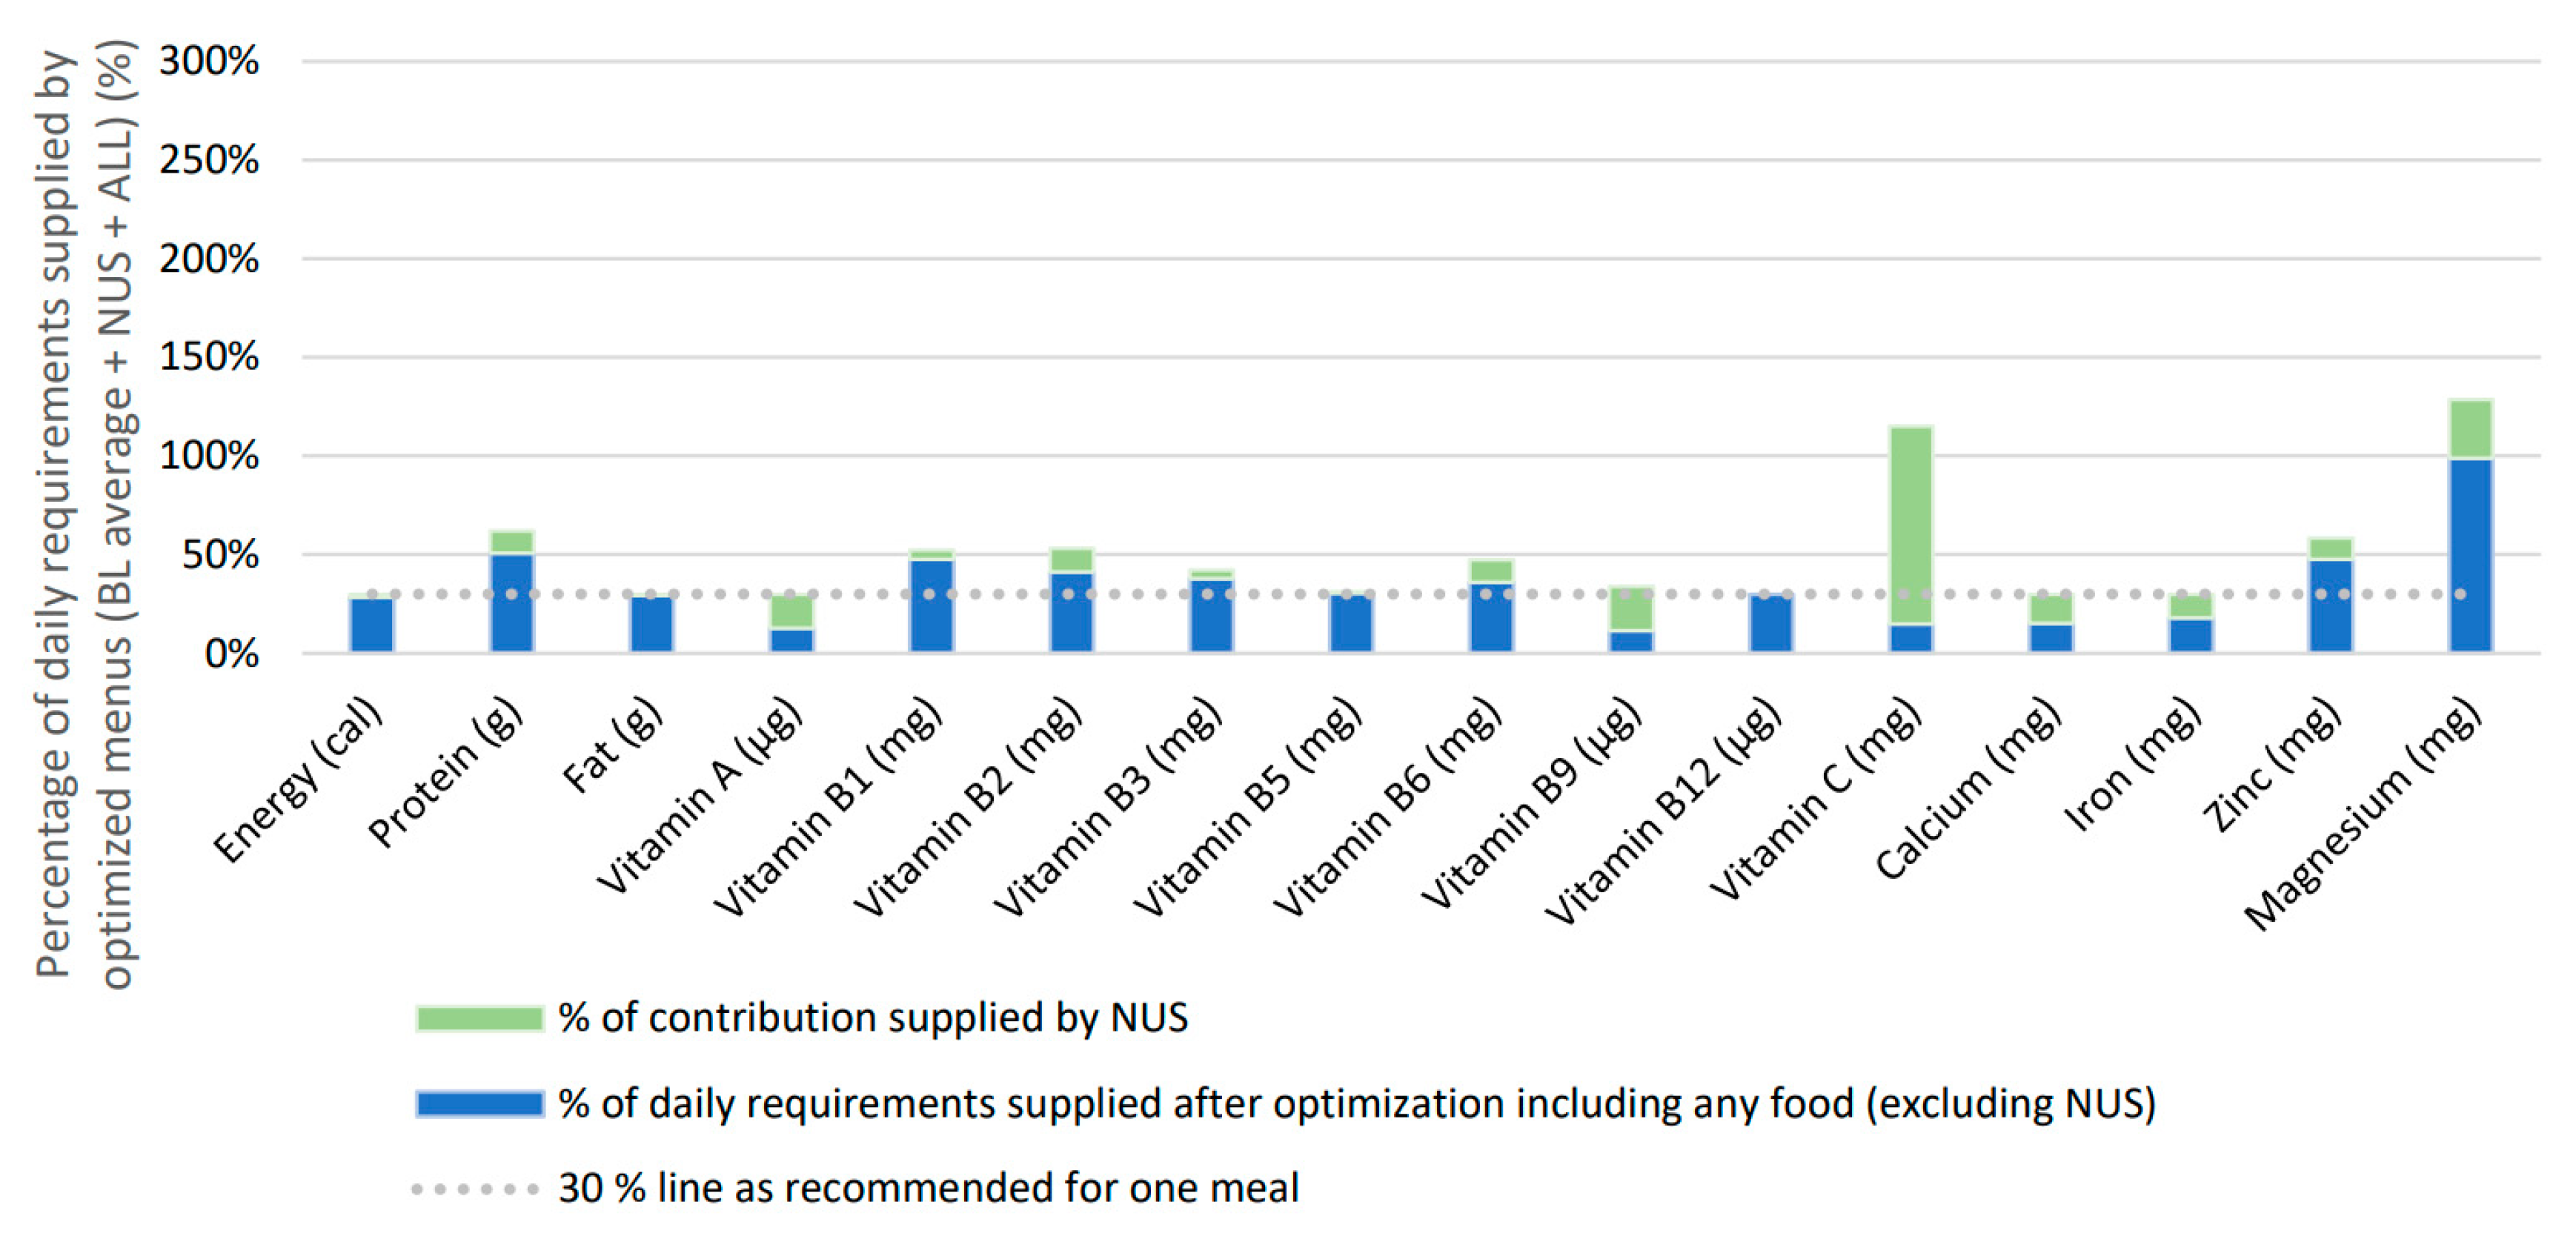

Table 1.
A summary of the nutritional analysis and SMP PLUS optimizations of the baseline menus offered at VFA. Nutrition adequacy and nutrient deficiencies are identified, as well as the cost per school meal (USD) before and after the optimizations.
Table 1.
A summary of the nutritional analysis and SMP PLUS optimizations of the baseline menus offered at VFA. Nutrition adequacy and nutrient deficiencies are identified, as well as the cost per school meal (USD) before and after the optimizations.
| Nutritional analysis and optimizations | VFA menus | Cost per meal, per day (USD) | Kcal | Prot (g) | Fat(g) | Vit A (µg) | Vit C (mg) | Vit B12 (µg) | Ca (mg) | Fe (mg) | Zn (mg) | Mg (mg) |
|---|---|---|---|---|---|---|---|---|---|---|---|---|
| Baseline menus | Best menu | 0.40 | √ | √ | ▼ | ▲ | ▲ | X | ▼ | √ | √ | ▲ |
| Sub-optimal menu | 0.25 | √ | √ | ▼ | √ | √ | X | ▼ | ▼ | √ | √ | |
| First optimization | BL best-possible + | 0.22 | √ | √ | √ | ▲ | ▲ | X | √ | √ | √ | ▲ |
| BL sub-optimal + | 0.26 | √ | ▲ | √ | √ | √ | X | √ | √ | √ | ▲ | |
| Second optimization | BL average + NUS + VEG** | 0.14 | √ | √ | √ | √ | ▲ | X | √ | √ | √ | ▲ |
| Third optimization | BL average + NUS + ALL** | 0.13 | √ | √ | √ | √ | ▲ | √ | √ | √ | √ | ▲ |
*√ = 30% threshold met; ▲ = value > 100% daily needs; ▼ = value < 30% daily needs; X = Value missing ** The financial outcomes of the second and third optimizations were the same for both baseline menus, as the variation between the best-possible and sub-optimal menus was solely determined by vegetable availability, influenced by the school’s financial situation and donations.
Disclaimer/Publisher’s Note: The statements, opinions and data contained in all publications are solely those of the individual author(s) and contributor(s) and not of MDPI and/or the editor(s). MDPI and/or the editor(s) disclaim responsibility for any injury to people or property resulting from any ideas, methods, instructions or products referred to in the content. |
© 2025 by the authors. Licensee MDPI, Basel, Switzerland. This article is an open access article distributed under the terms and conditions of the Creative Commons Attribution (CC BY) license (http://creativecommons.org/licenses/by/4.0/).
Copyright: This open access article is published under a Creative Commons CC BY 4.0 license, which permit the free download, distribution, and reuse, provided that the author and preprint are cited in any reuse.


