
Submitted:
21 August 2025
Posted:
22 August 2025
You are already at the latest version
Abstract
Background: Low dietary diversity is a key driver for undernutrition and remains a significant public health challenge in low- and middle-income countries. This study evaluated the effect of nutritional counselling and provision of livestock feed, aimed at sustaining milk production, on the dietary diversity of women and children in a pastoralist setting. Methods: A cluster randomized controlled trial was conducted among households in Laisamis sub-county, north-eastern Kenya, assigned to one of three arms: (1) livestock feed during critically dry periods, (2) livestock feed plus enhanced nutritional counselling, or (3) control. Dietary diversity for mothers and children was assessed every six weeks over two years. Panel difference-in-difference regression models estimated intervention effects on dietary outcomes. Results: A total of 1,734 households participated (639 in arm 1, 585 in arm 2, 510 control). Provision of livestock feed, alone or combined with counselling, significantly improved child minimum dietary diversity (MDD), minimum acceptable diet (MAD), and women’s dietary diversity (MDD-W), while reducing child food poverty during dry seasons and overall. Nutritional counselling enhanced gains, with effects evident from the first month. Improvements were mainly driven by increased consumption of cereals, legumes, nuts, seeds, milk, fruits, and vegetables. Milk intake among children aged 6–23 months was consistently higher in intervention arms compared to control during dry seasons and throughout follow-up. Conclusion: Ensuring livestock survival through feed provision sustains milk consumption and improves dietary diversity in pastoralist populations. When combined with nutritional counselling, these interventions strengthen the link between animal and human health, with important implications for food security.
Keywords:
diet diversity
; arid and semi-arid lands
; livestock for human health
1. Introduction
Undernutrition remains a significant public health challenge in Sub-Saharan Africa, with women of reproductive age and children <5 years of age particularly affected. [1] Household sanitation, income, feeding and caring practices have been identified as important determinants of undernutrition in these groups. [2,3] Globally, an estimated 820 million people were undernourished in 2020, and nearly 45% of deaths among children <5 years of age were linked to undernutrition. [4]
Consumption of a diverse diet has been associated with a reduction in undernutrition (underweight, wasting, stunting) among children <5 years old and women of reproductive age. [5,6,7] Diet diversity is assessed by either evaluating the number of food groups consumed or quantifying the intake of micronutrients within each food group over a 24-hour period. Guidelines have been established to classify the recommended food groups for children <5 years old and women of reproductive age, and both groups need at least five food groups to ensure adequate uptake of micronutrients. [8,9]
In Kenya, the 2022 Demographic and Health Survey reported stunting, underweight, and wasting in 18%, 10% and 5% of children <5 years respectively. [10] Comparison with the 2014 survey results indicated an 8% reduction in stunting, 1% decrease in underweight and 1% increase in wasting. [11] In both surveys, the regions predominantly inhabited by pastoralist communities consistently recorded the lowest proportions of children meeting the recommended diet diversity scores.[10,11]
Poor dietary diversity scores and high undernutrition levels have been reported in pastoralist communities in Sub-Saharan Africa. [12,13,14,15,16] These communities predominantly rely on animal source foods for their nutritional needs, with milk consumption contributing up to two thirds of the mean caloric daily intake among children.[17] However, this reliance is heavily contingent upon the availability of forage.[17,18] A significant increase in undernutrition is observed during the dry season, correlating with decreased pasture availability and reduced animal milk production.[19,20] Increased cost of alternative food sources such as cereals during this period also leads to a decline in energy intake. [19]
Improving diet diversity in pastoralist areas has been challenging due to factors such as climate variation, entrenched cultural practices, and limited access to diverse foods. [21] Diets comprise dairy products and maize, with little consumption of vegetables, fish, fruits, and eggs, which are culturally viewed as low-value food sources.[22] Promotion of contextualized feeding practices through nutritional counselling among vulnerable groups are recommended to improve dietary diversity in Kenya. [23,24,25] This strategy has also been recommended in the Kenya national Maternal Infant and Young Child Nutrition (MIYCN) policy guidelines. [26]
This study aimed to evaluate the influence of nutritional counseling and the provision of livestock feed to milking animals during critical dry periods on dietary diversity for children, and women of reproductive age. Through this investigation, we sought to generate local evidence about the importance of feeding practices among vulnerable groups reliant on animal source food availability, which hinges on forage conditions.
2. Materials and Methods
2.1. Study Area
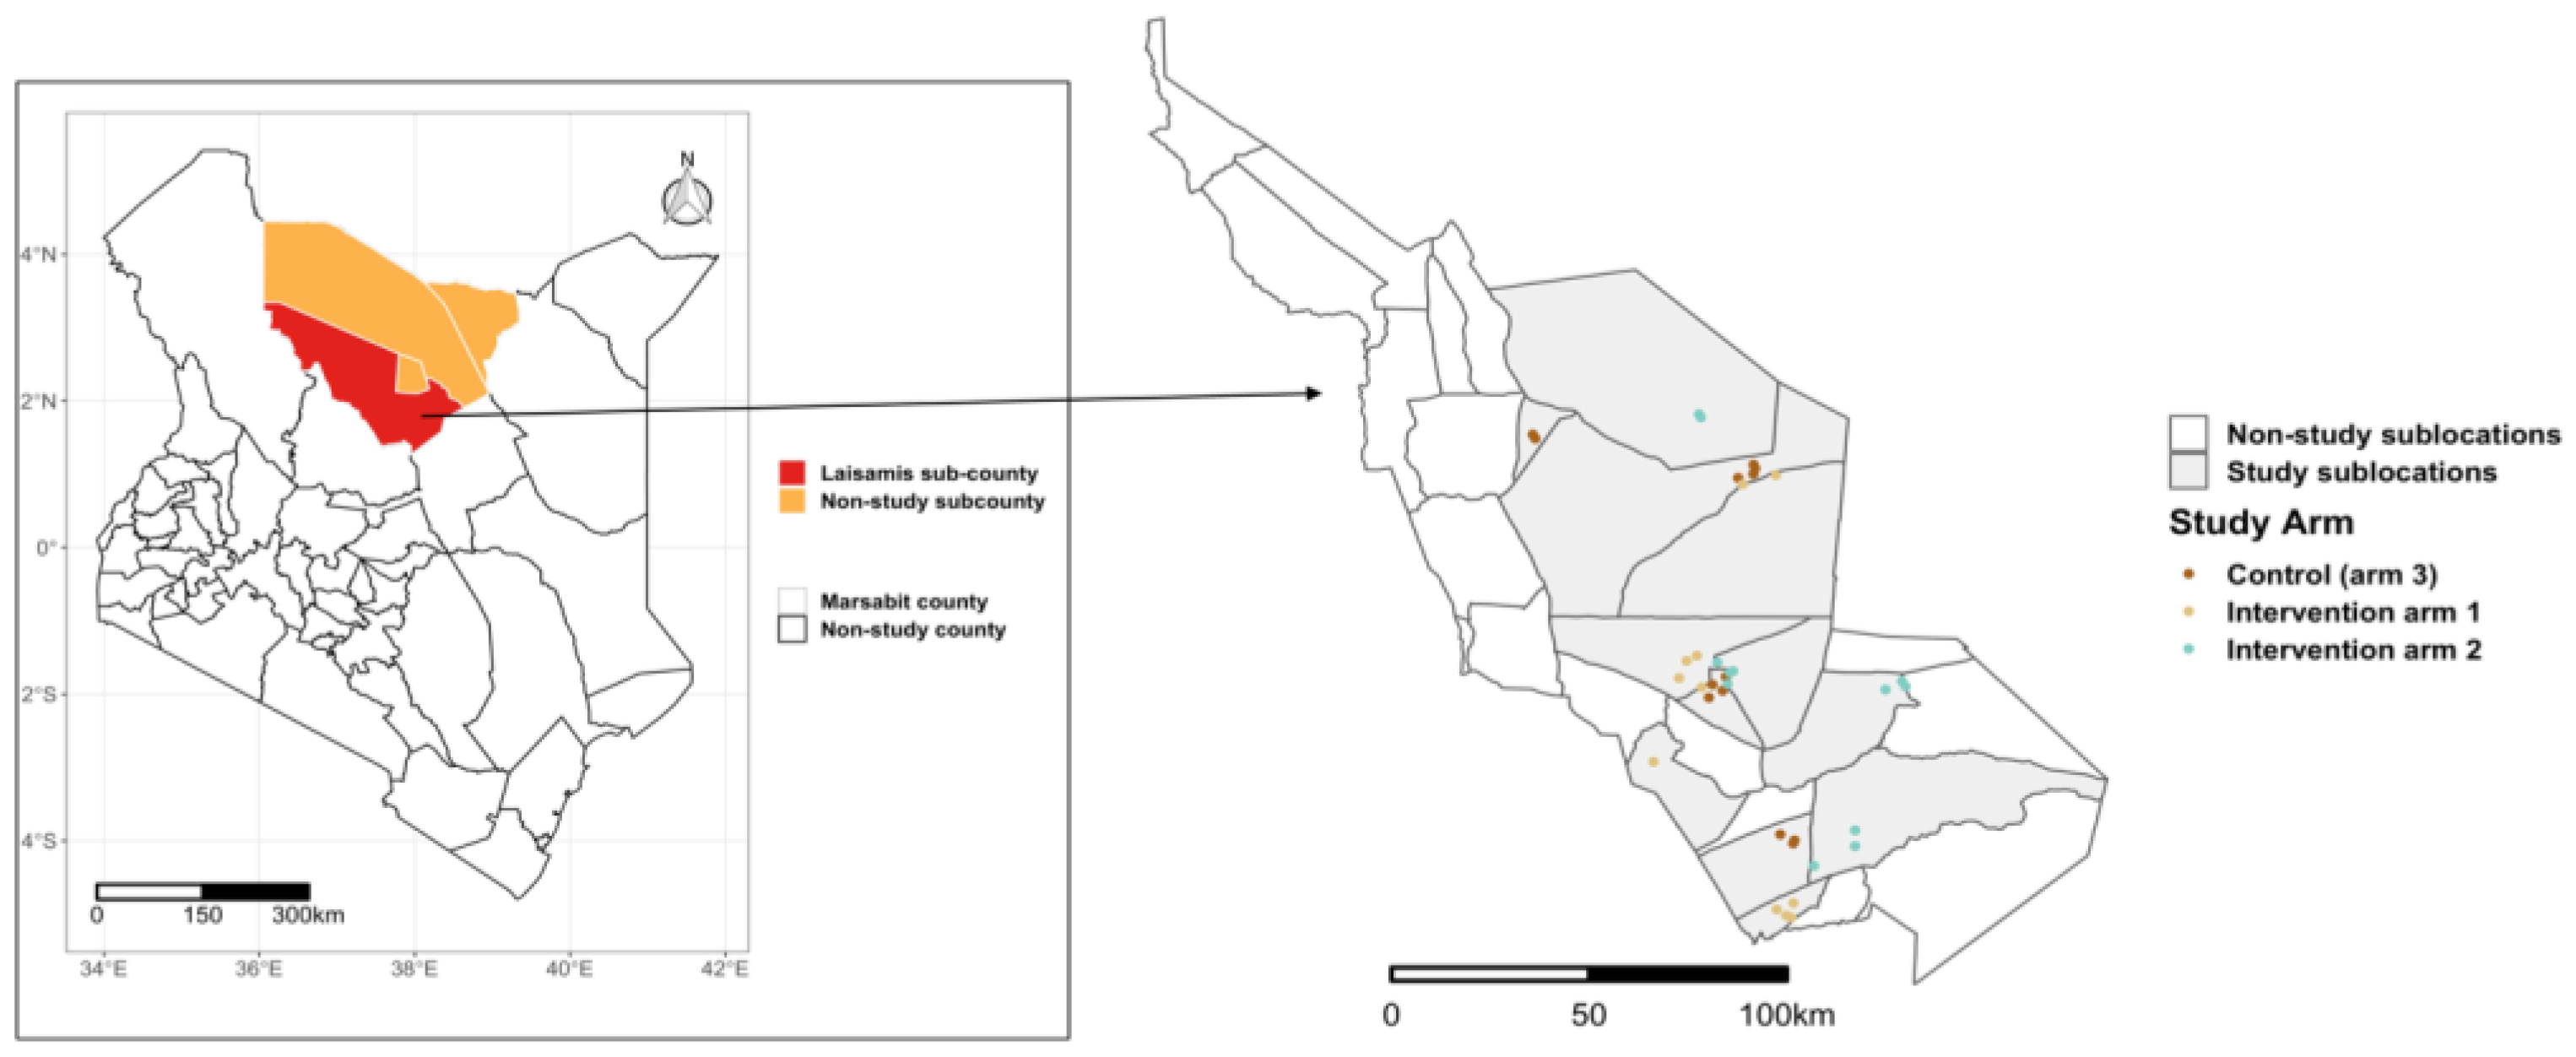
The study was conducted in Laisamis subcounty, Marsabit County, which is in the northern part of Kenya (Figure 1). The subcounty has reported lower measures of dietary diversity in children, and the highest proportion of malnourished women compared to the rest of the sub counties in Marsabit.[27]
The study utilized data from the Livestock for Health (L4H) Project, a cluster randomized control trial that aimed to investigate the effect of livestock supplementary feeding interventions during critical dry periods and enhanced nutrition counseling on maternal and child nutrition.[28]
Figure 1.
Map of Laisamis subcounty showing the selected sublocations and the villages in the different study arms. The inset map on the left shows the location of Marsabit County.
Figure 1.
Map of Laisamis subcounty showing the selected sublocations and the villages in the different study arms. The inset map on the left shows the location of Marsabit County.
2.2. Data Sources
The study enrolled households to two intervention arms and one control arm, with approximately 600 households allocated to each arm. These study arms were spread across Laisamis subcounty, ensuring a minimum of five kilometers between villages in different arms to minimize the risk of contamination (Figure 1). In intervention arm 1, households received 0.35 tons of supplementary livestock feed adequate for two tropical livestock units (two cows, two camels, 20 goats or 20 sheep) for a duration of approximately 90 days of a dry season. Households in intervention arm 2 received supplementary livestock feed similar to arm 1 during the dry period, along with enhanced nutrition counseling sessions held once a week throughout the 2-year study period. These counseling sessions were informed by the Kenya Maternal, Infant and Young Child Nutrition (MIYCN) policy guidelines. [26] The control arm did not receive any intervention during the study period, though animal feed for one dry season was provided at the end of the study.
In all three study arms, households with at least one child <3 years and a mother of reproductive age were recruited. Data were collected between September 2019 and December 2021, with children born during this period also enrolled into the study. The study design, including details on household selection and baseline results have been published elsewhere. [28]
2.3. Data Collection and Categorization
Household socio-demographic data and individual-level demographic, anthropometric and 24-hour recall of dietary and frequency of consumption information for both women and children were collected using a questionnaire administered to the caregiver. Figure 2 summarizes the variables collected, and their frequency.
Infants <6 months: Analysis was done on the proportion of children exclusively breastfeeding, and those who were breastfeeding with complementary feeding.
Children 6-23 months: Diet data were categorized into eight groups (Table 1) per WHO guidelines.[9] We computed the proportion of children who were breastfeeding, the reported age (in months) complementary feeding commenced, dietary diversity score, meal frequency score, acceptable diet score, child poverty score, egg/flesh food consumption and vegetable/ fruit consumption. Children who consumed fewer than three food groups were categorized as experiencing severe child food poverty. [29] In addition, children with a dietary diversity score of ≥ 5 were categorized as having attained minimum diet diversity (MDD). Those who had a meal frequency of at least twice a day for infants 6-8 months, thrice a day for breastfeeding children between 9-23 months and four times a day for non-breastfed children were categorized as having the minimum meal frequency (MMF). Children who had obtained both the minimum dietary diversity and minimum meal frequency for their age were categorized as having a minimum acceptable diet (MAD) (Table 1).
Children 24-59 months: The diet data were categorized into seven groups (Table 1). Similar to children 6-23 months, the dietary diversity score, meal frequency score, acceptable diet score, child food poverty score, egg/flesh food consumption and zero vegetable/ fruit consumption were calculated. Children were categorized as having MDD and MMF if they consumed at least four food groups and had a meal frequency of at least four times a day respectively (Table 1). Children who had obtained both MMD and MMF for their age satisfied the MAD standard. Children who had consumed <3 food groups were categorized as experiencing severe child food poverty.
Women of reproductive age: The diet data were categorized into ten food groups (Table 1) based on the guidelines by FAO and USAID’s Food and Nutrition Technical Assistance III project.[8] MDD for women of reproductive age (MDD-W) was achieved if at least five of the ten food groups had been consumed.

Table 1.
Food group categorization for the household, children, and women dietary diversity, and the diet scores.
Table 1.
Food group categorization for the household, children, and women dietary diversity, and the diet scores.
| Food group number | Children (6-23 months) |
Children (24 – 59 months) | Women |
|---|---|---|---|
| 1 | Cereals, roots, and tubers | Cereals, roots, and tubers | Cereals, roots, and tubers |
| 2 3 |
Vitamin A rich fruits and vegetables | Vitamin A rich fruits and vegetables | Dark green leafy vegetables |
| Other Vitamin A rich fruits and vegetables | |||
| 4 5 |
Other fruits and vegetables | Other fruits and vegetables | Other fruits |
| Other vegetables | |||
| 6 | Flesh foods | Flesh foods | Flesh foods |
| 7 | Eggs | Eggs | Eggs |
| 8 9 |
Legumes, nuts, and seeds | Legumes, nuts, and seeds | Legumes |
| Nuts and seeds | |||
| 10 | Dairy products | Dairy products | Dairy products |
| 11 | Breastmilk | - | - |
| Total food groups | 8 | 7 | 10 |
| Diet Scores | |||
| Minimum Diet Diversity score (MDD) | Consumption of at least 5/8 food groups | Consumption of at least 4/7 food groups | Consumption of at least 5/10 food groups |
| Minimum Meal Frequency (MMF) |
6-8 months: At least 2 meals a day 9-23 months: At least 3 meals a day Non-breastfed children: At least 4 meals a day |
At least 4 meals a day | - |
| Minimum Acceptable Diet | Attainment of both Minimum Diet Diversity and Minimum Meal Frequency | - | |
2.4. Analytical Methods
For all study participants, panel estimators for generalized linear difference-in-difference regression models were used to estimate the effect of the interventions on the likelihood of a seasonal changes in diet diversity scores. We also investigated the association between indicators of feeding practices and the interventions provided in arms 1 and 2. Regressors in these models included gender (for children), literacy status of women and household heads, primary occupation of women and household heads, household participation in any social safety net program, herd dynamics (births, purchases) and herd health.
3. Results
This section may be divided by subheadings. It should provide a concise and precise description of the experimental results, their interpretation, as well as the experimental conclusions that can be drawn. A total of 1734 households with 1734 women and 1748 children were enrolled in the study and followed up every six weeks, for a 2-year period. During the baseline period, 1748 children were part of the study, categorized as either infants <6 months (n=269, 16%), children 6-23 months (n=1009, 58%) or children 24-59 months (n=367, 21%). Over the course of the study period, 81 households were lost to follow-up either because of migration (63%), withdrawal (24%), child’s death (12%) or mother’s death (1%) (Figure 3). A total of 570 children were born and recruited into the study during the follow-up visits.
3.1. Dietary Patterns
3.1.1. Children
Within the first six months, nearly all children were breastfed, with this trend persisting until about the 18th month, at which point a sharp decline in breastfeeding was observed up until the 32nd month (third year), when less than 25% of the children were still consuming breast milk. Interestingly, an increase in breastfeeding was observed between the third and fourth year, followed by another decline (Figure 4). On average, mothers reported that complementary feeding began at six months of age. However, 35% of children had already started complementary feeding before this age. By the end of the first year, over 75% of children were consuming animal milk and milk products, cereals, roots, and tubers. Between 6 to 60 months, these foods groups remained predominant in the children’s diet, with an increasing trend observed in the consumption of legumes and nuts and fruits and vegetables (non-vitamin A rich) (Figure 4). Notably, throughout the study period, eggs, meat and vitamin A-rich fruits and vegetables were the least consumed food groups by children <5 years (Figure 4). For a detailed breakdown of the proportions of the various food groups consumed during the study period, please refer to Appendix page 2-3.
3.2.3. Women of Reproductive Age
Over the study period, women’s diets predominantly comprised only three of the ten recommended food groups: dairy products (92%), grains, roots, and tubers (90%) and pulses (68%). Less than a fifth of the women consumed fruits/vegetables (8%), eggs (3%) and flesh foods (8%). No participant consumed nuts and seeds during the study period. Appendix page 4 gives detailed consumption patterns among women.
Across the three intervention arms, the intake of cereals, roots and tubers and the dairy products remained consistent among women during both dry and non-dry seasons. However, women in the intervention arm receiving animal feed combined with enhanced counselling reported higher consumption of dark green leafy vegetables, fruits and eggs (Figure 5). This group also reported a marked increase in egg consumption during the dry seasons.
3.3. Dietary Intake Indicators
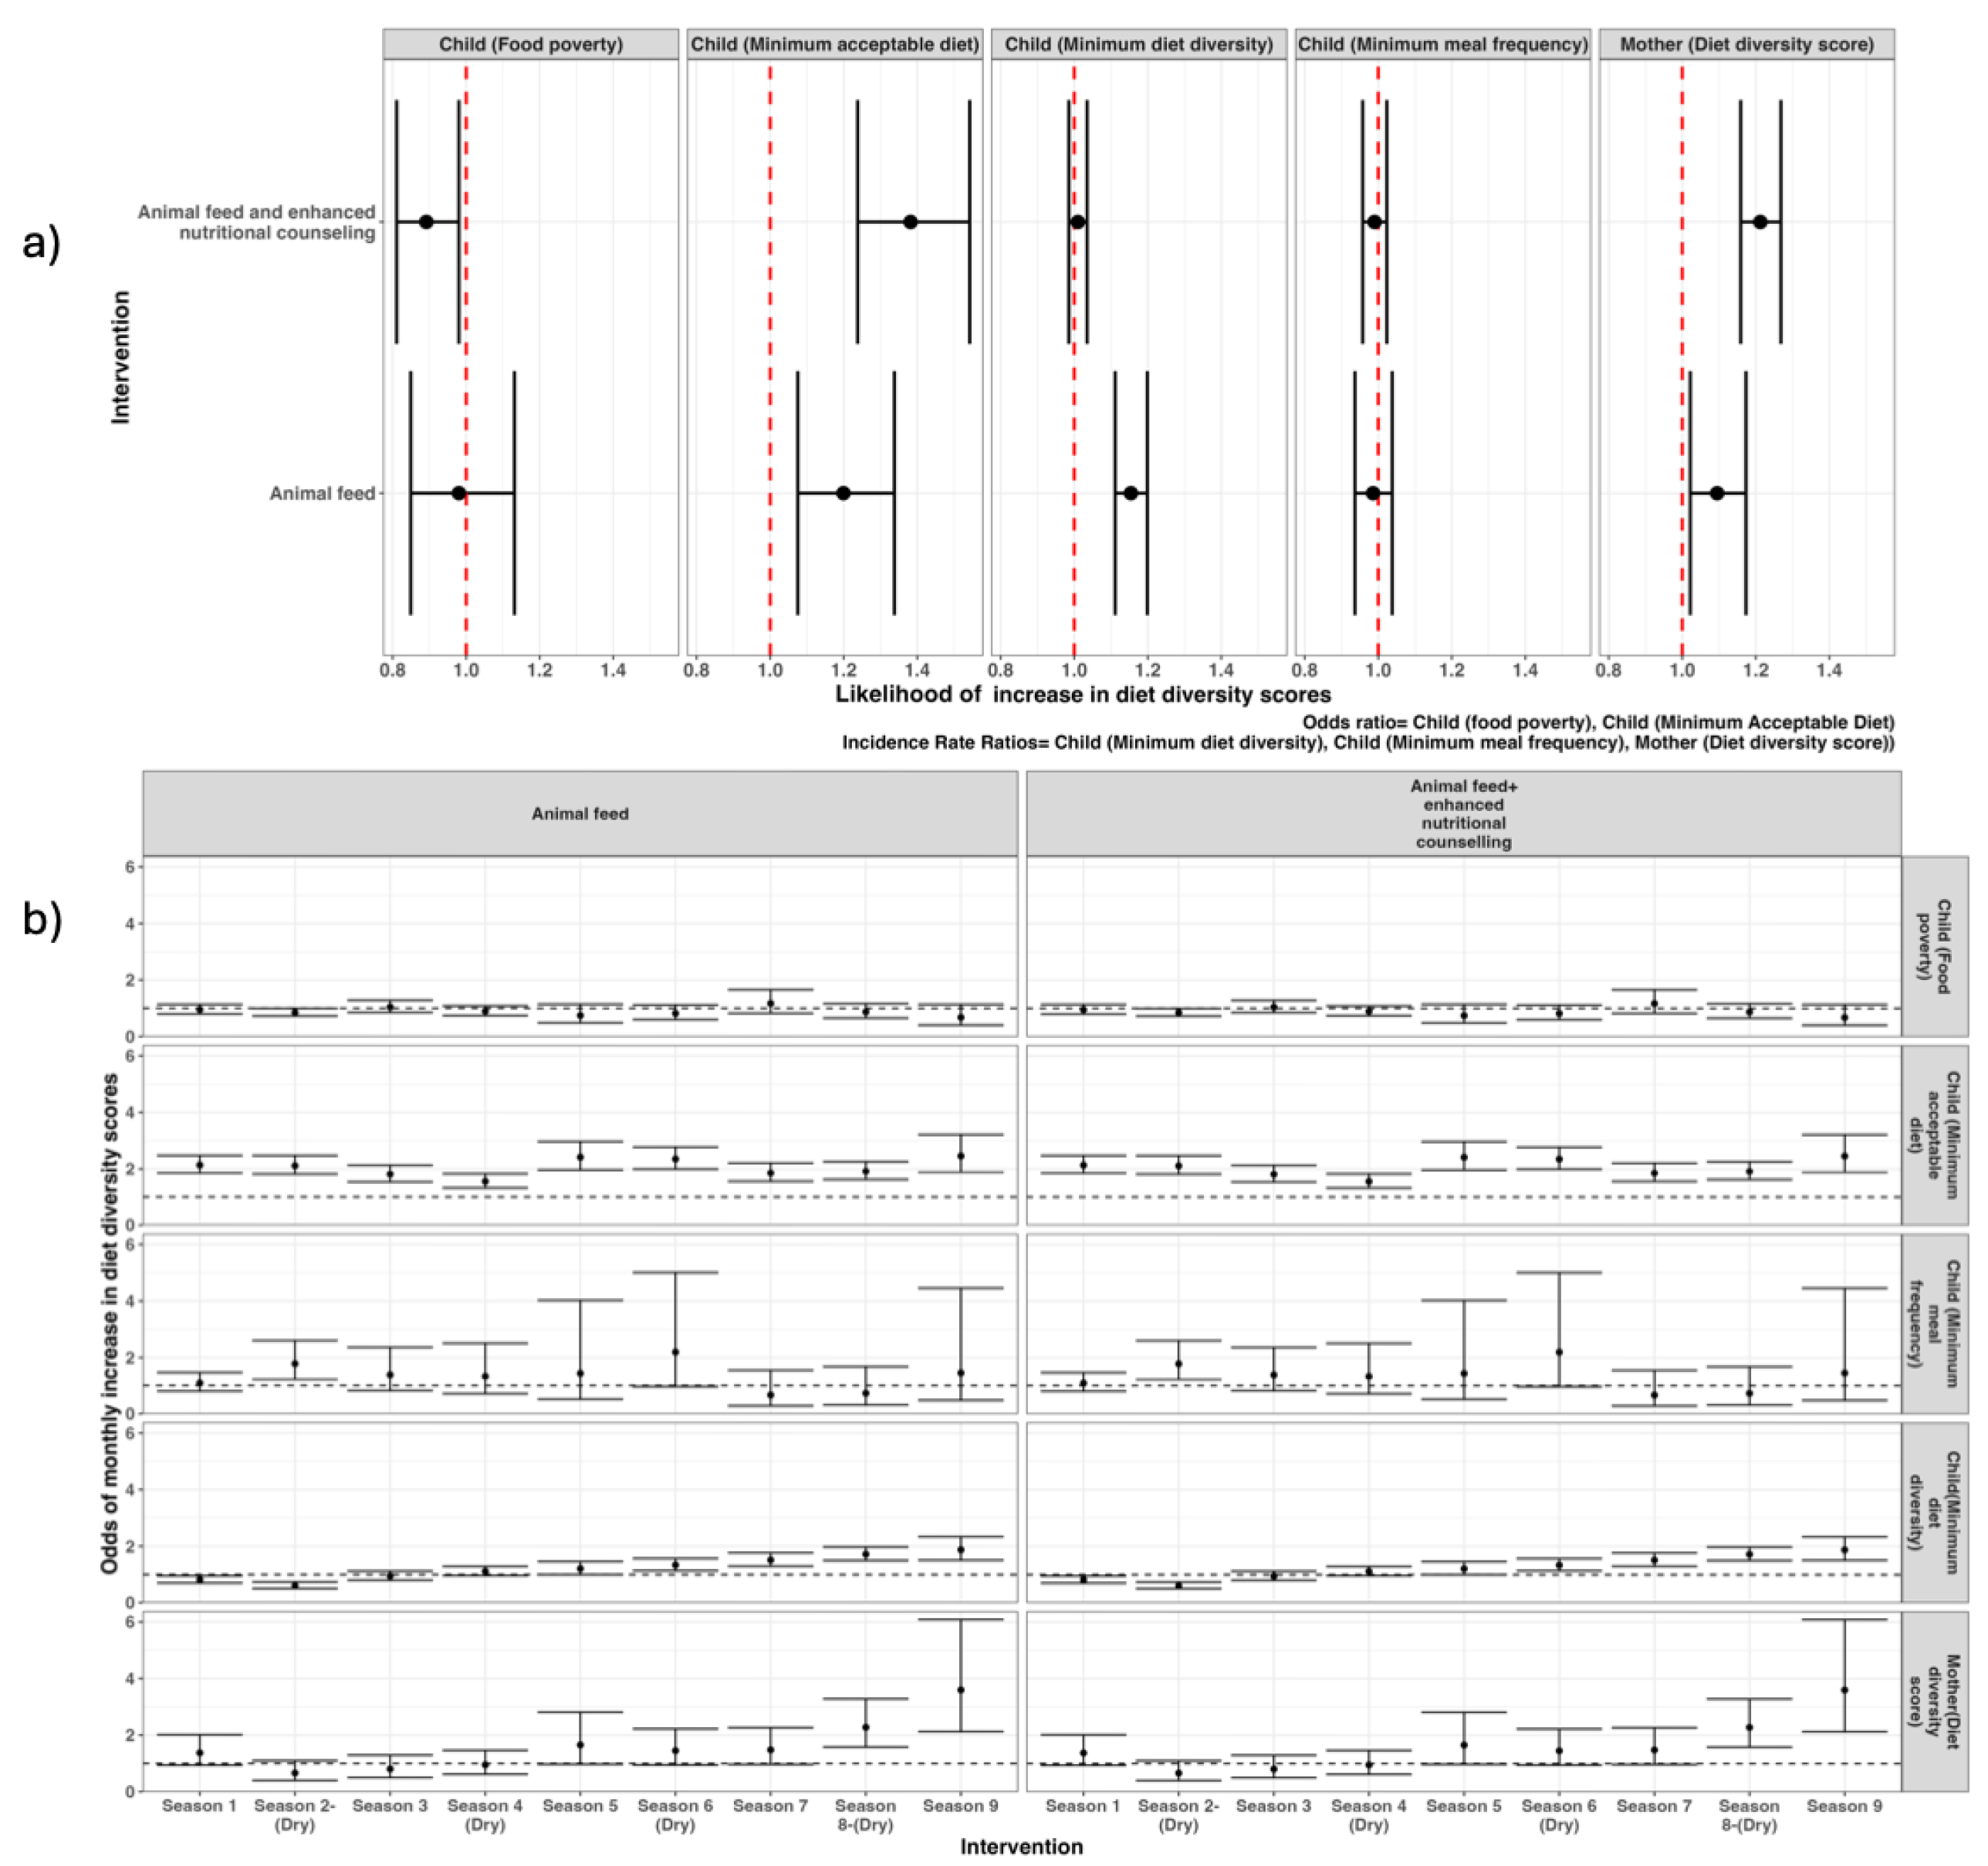
The difference-in-difference model results showed that, compared to the control group, households in arm 1 (animal feed only) were significantly associated with improvements in several child-specific indicators: minimum acceptable diet (OR 1.2; 95% CI 1.08 – 1.34), minimum diet diversity (1.15; 1.11 – 1.20) and mother’s diet diversity score (1.10 [1.01 – 1.19]). Furthermore, the combined intervention of animal feed and enhanced nutritional counselling (arm 2) was significantly associated with a decrease in child food poverty (0.89; 0.81 -0.99), increase in child minimum acceptable diet (1.39; 1.22 – 1.52), and an improvement in mother’s diet diversity score (1.21; 1.16 – 1.28) (Figure 6a). Neither intervention showed a significant effect on increasing the child’s minimum meal frequency compared to the control group (Figure 6a).
An analysis of dietary indicators over the study period showed no significant differences between the control group and the households receiving the different interventions at the baseline period. However, from the first month of the nutritional counselling intervention, there was a significant increase in the child diet diversity score, minimum acceptable diet and decreased food poverty. Despite some fluctuations, the effect of the animal feed combined with enhanced nutritional counselling on the minimum acceptable diet was maintained throughout the study period (Figure 5b). Similar effects were observed in the mother’s diet diversity score, which remained significantly higher from the first dry season (shaded in the grey areas, Figure 6b). The intervention of animal feed significantly decreased child food poverty and increased likelihood of children attaining minimum acceptable diet and improved diet diversity for both children and mothers during dry periods (Figure 6b).
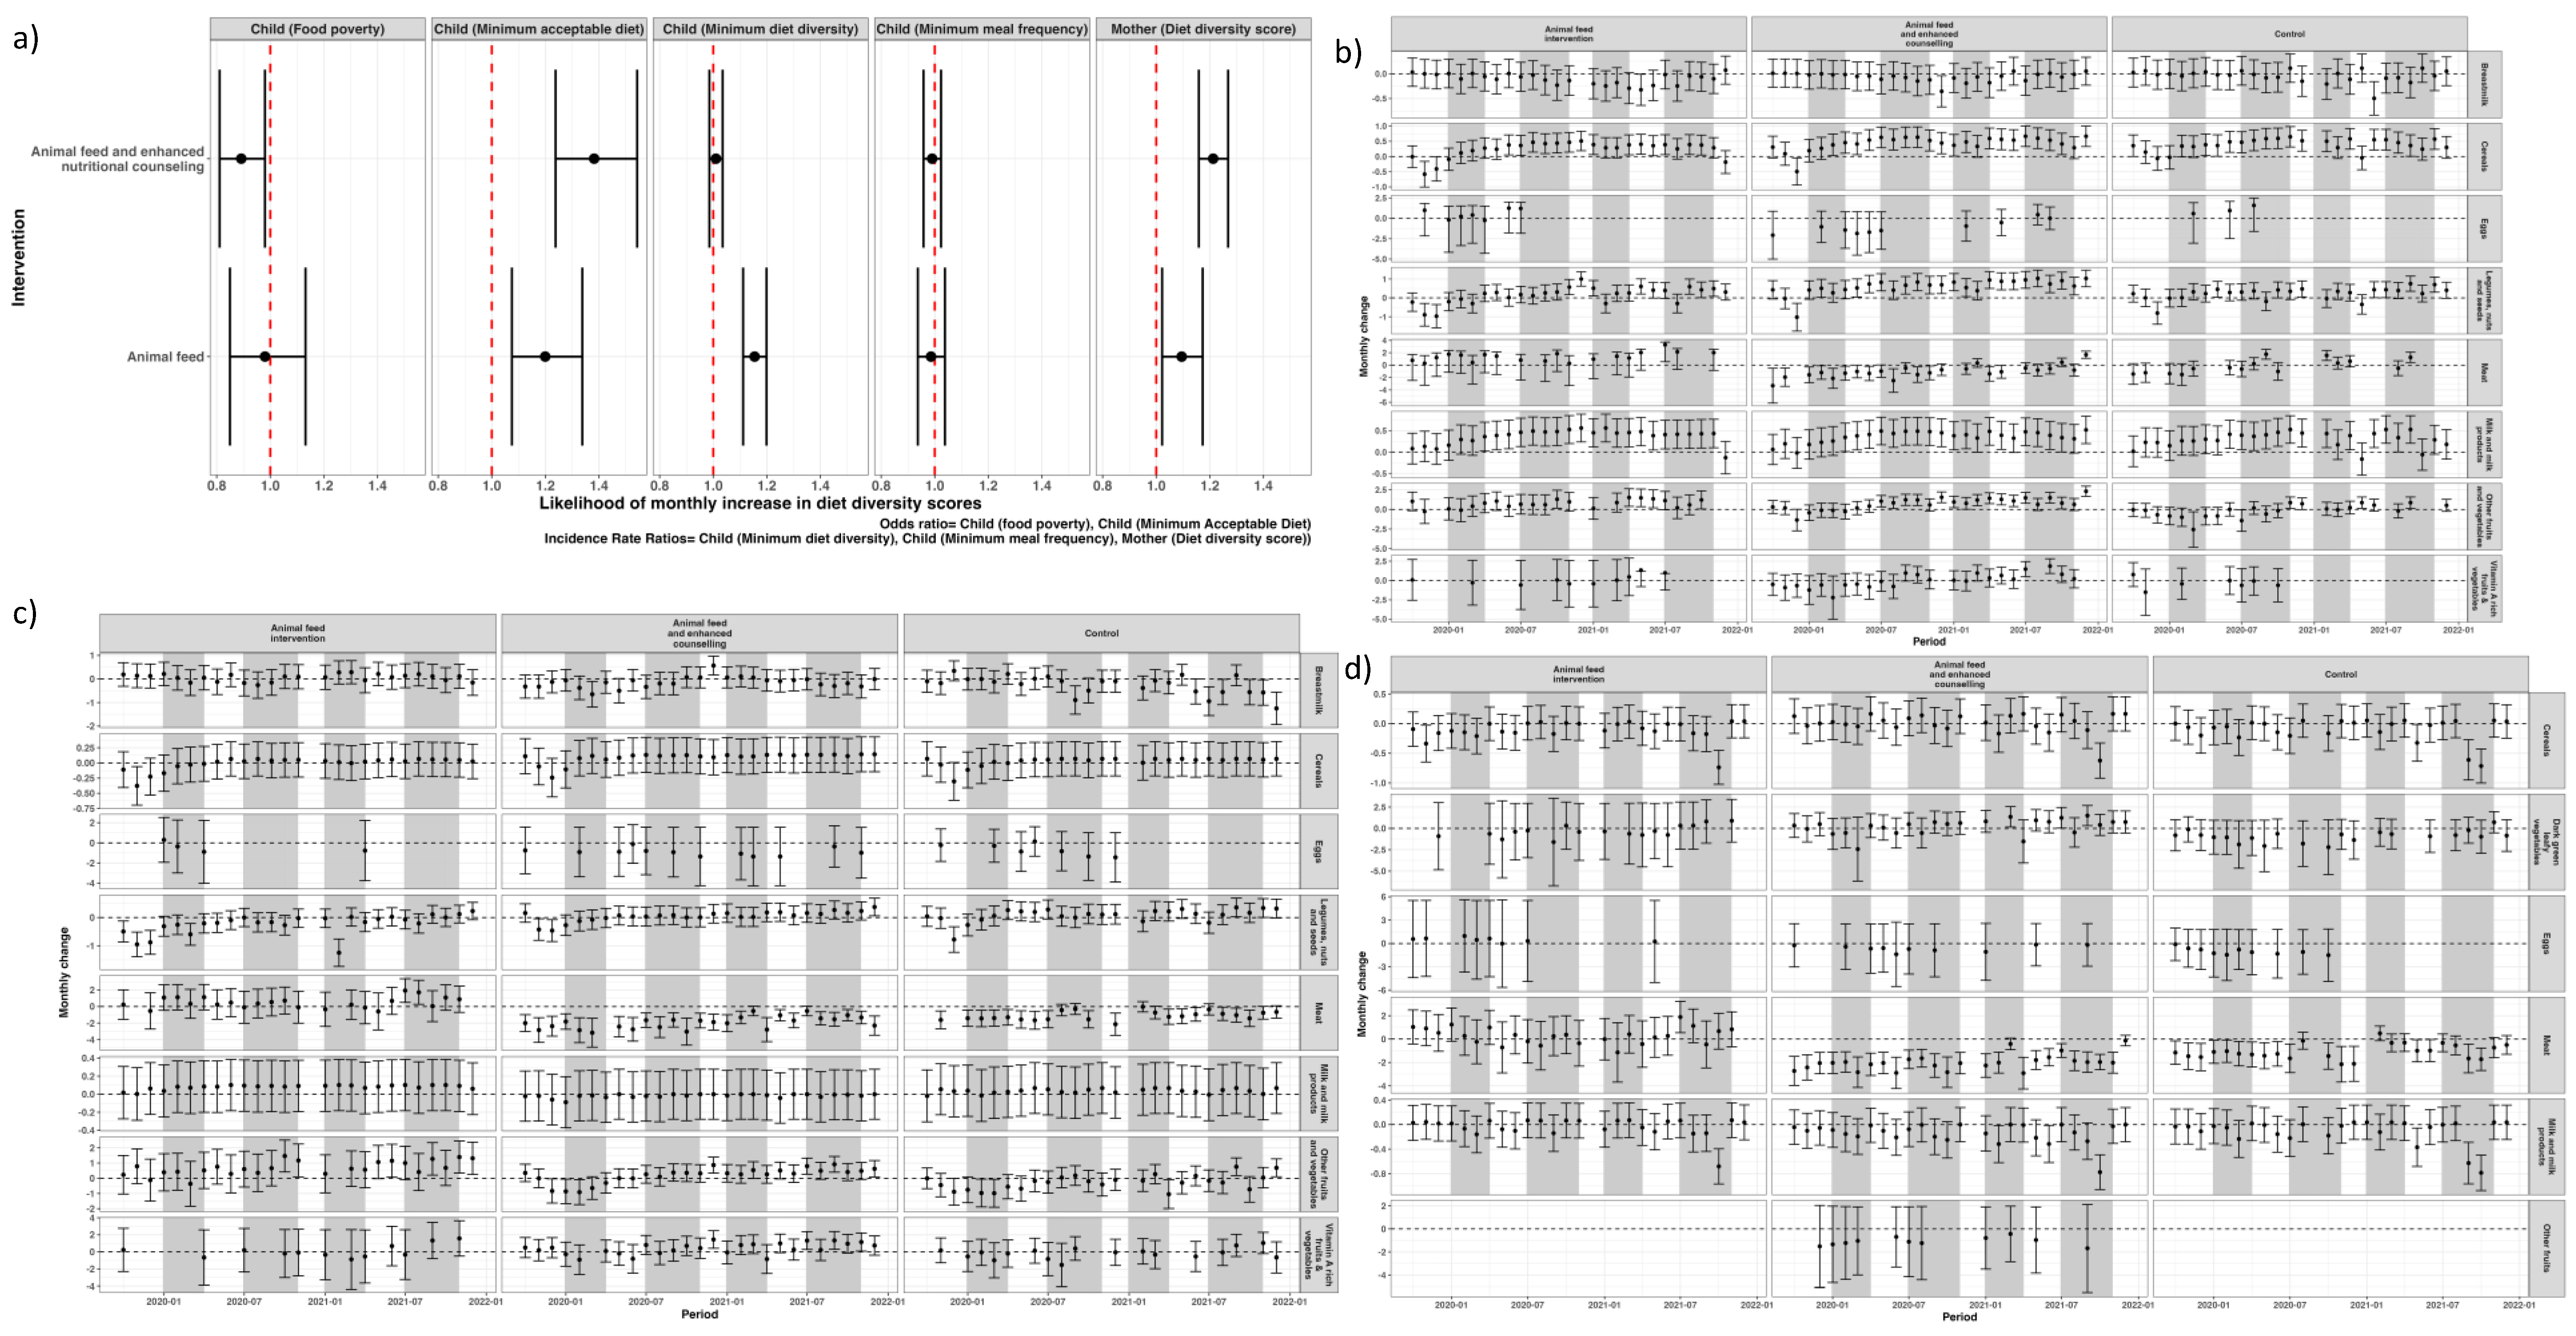
Analysis from the specific food groups showed a significant monthly increase in consumption of cereals, legumes, nuts and seeds, and fruits and vegetables during the dry season, among children 6-23 months within the households receiving animal feeds with enhanced nutritional counselling, in comparison to the baseline period (Appendix page 5). On the other hand, milk consumption for children 6-23 months remained significantly high during the dry season for households receiving interventions, with the effect maintained throughout the study period. For the control group, milk consumption was unimproved during the dry season, in comparison to the baseline (Appendix page 5). Detailed results of the other food groups are found in the appendix section.
Figure 6.
Likelihood of overall change in the indicators of diet diversity score (a) and seasonal change over time (b).
Figure 6.
Likelihood of overall change in the indicators of diet diversity score (a) and seasonal change over time (b).
3.4. Factors Associated with Feeding Patterns among Households, Infant, Young Children, and Women of Reproductive Age
When controlling for other factors, difference-in-difference regression results showed that both interventions were significantly associated with a higher likelihood of attaining the dietary diversity scores (Table 2). The effect was particularly higher among households receiving animal feed combined with enhanced nutritional counseling, showing the following effects: child MDD (OR 2.54; 95% CI 2.30 – 2.79), child MAD (3.10; 2.66 – 3.62) and women MDD (4.22; 3.29-5.42). Additionally, households with herd dynamics that included purchasing animals showed an increased likelihood of attaining dietary diversity scores, except for minimum meal frequency which was significantly reduced by livestock purchases (OR 0.8; 95% CI 0.8-0.9) (Table 2). On the other hand, households benefitting from cash transfer programs had a significantly decreased likelihood of attaining the dietary diversity scores for child MDD (0.90; 0.87-0.94), child MAD (0.95; 0.85 – 0.97) and women MDD (0.73; 0.54-0.89).
4. Discussion
This study assessed the effect of livestock feeding and nutritional counselling on dietary measures in infants, young children, and women of reproductive age in a pastoralist setting. Provision of animal feeds alone, and when combined with nutritional counselling were both associated with a significant increase in child minimum dietary diversity (MDD), minimum acceptable diet (MAD), women’s minimum dietary diversity (W-MDD) and decrease in child food poverty both overall, and during the dry season. Enhanced nutritional counseling significantly increased MDD, MAD and decreased child food poverty from the first month of intervention. The specific foods contributing to these improvements included cereals, legumes, nuts and seeds, milk and milk products, fruits, and vegetables. Milk consumption for children aged 6-23 months remained significantly higher in intervention groups both during the dry season and throughout the study period. However, there was no significant increase in the consumption of meat, fish, and eggs in intervention groups over the study period.
Sustaining milk consumption in human populations through the provision of animal feeds has also been documented in pastoralist settings in Ethiopia and Somalia.[17] The connection between animal health and human health is well established, with significant implications for food safety and security through the maintenance of healthy livestock.[30,31] Additionally, this link has economic and social impacts, influencing trade, income and livelihoods in these regions which have a low consumption of nutrient-dense foods. [31,32]
High dietary diversity scores are positively associated with better nutritional status for both children and women.[33,34] However, these scores have been particularly low in pastoralist settings due to limited consumption of nutrient-dense foods such as animal source foods, fruits, and vegetables.[14] These communities primarily rely on milk, cereals, legumes, nuts and seeds for their nutrition intake, a pattern observed in our study, and corroborated by other research in pastoralist areas. [35] The cultural context of pastoral communities, where livestock is regarded as a sign of wealth, partly explains this dietary pattern.[20] Additionally, negative perceptions within this community limit the consumption of chicken, fish, fruits, and vegetables.[36]
Nutritional counseling has been observed as an effective method for improving intake of these foods, as evidenced both in our study, and in other studies conducted in Malawi and Ethiopia.[37,38,39] This approach may be further enhanced by increased milk production which contributes to income generation in the household which may be used to purchase other food groups.[40] Women have been identified as a significant pathway to improving child nutrition outcomes and their economic empowerment enhances prioritization of food purchase for the household.[41]
Interestingly, an increased proportion of children consuming breastmilk was observed among older children between three and four years of age. This trend may be explained by the practice of short birth intervals which results in extended breastfeeding periods for older children.[42] However, despite the benefits of continued breastfeeding, the lack of dietary diversity in complementary foods can lead to nutrient deficiencies and increased vulnerability to malnutrition.
Cash transfer programs have been implemented in pastoralist communities to provide immediate financial relief, enabling households to purchase food and other essential items during critical dry periods.[43] Although the study found a negative association between cash transfers and high dietary diversity scores, the programme has been shown to positively influence household nutrition, particularly benefiting women.[44] This negative association may be explained by the fact that the social safety net programs already target the vulnerable population that is already experiencing undernutrition, and longer-term investment is required to observe positive effects, or the cash transfers not targeting women as primary beneficiaries given their role in family feeding.
Limitations: We examined qualitative food consumption patterns in the preceding 24-hour during the 2-year period but excluded quantitative food consumption data. Although this data is important in reflecting dimensions of dietary quality of micronutrient adequacy and reduce the chance of recall bias, qualitative data is usually used as a proxy for individual and household dietary diversity. Similarly, studies have reported a low probability of bias in the dietary assessment of recall bias among the 24-hour dietary assessment using both quantitative and qualitative methods.[45]
5. Conclusions
Provision of animal feed among pastoralist communities combined with enhanced nutritional counseling during critical dry periods have been associated with higher dietary diversity scores both among women and children <5 years. These two interventions can be productively applied in these regions to reduce the risk of malnutrition, with nutritional counselling targeting a change in community perception towards the uptake of other animal source foods, fruits, and vegetables.
Author Contributions
“Conceptualization, NM, JM, JN, IK, CJ, JY,GHP and SMT.; methodology, NM, JM,JN, IK, SMT; validation, JN, FW, GHP, JY,SMT; formal analysis, NM, JM, AM, SMT.; investigation, JM, ZP, IK, JN, GK, IM,FW, AMO, DS, SMT; resources, EB, CJ.; data curation, NM, AM.; writing—original draft preparation, NM,JM, SMT; visualization, NM, JM, AM, JY, SMT.; supervision, JN, FW,JY, SMT; project administration, JM, GK, IM; funding acquisition, JN, FW, SMT. All authors have read and agreed to the published version of the manuscript.” Please turn to the CRediT taxonomy for the term explanation. Authorship must be limited to those who have contributed substantially to the work reported.
Funding
This study was funded by the Office of Technical and Program Quality, Bureau for Humanitarian Assistance, USAID [720FDA18IO00035].
Institutional Review Board Statement
Ethical clearance was obtained from the Kenya Medical Research Institute Scientific and Ethics Review Committee (KEMRI/SERU/CGHR/02-09/3755). The study protocol was registered at https://clinicaltrials.gov(ID: NCT04608656).
Informed Consent Statement
Informed consent was obtained from all subjects involved in the study.
Data Availability Statement
The data used to generate this manuscript may be found in this repository: https://github.com/cema-uonbi/L4H_diet_diversity
Acknowledgments
The authors would like to thank the National government, county government of Marsabit, and the National Drought Management Authority for support during the study. The authors acknowledge support of the study participants and the field research team members: Arbelle Judy, Bonaya Galgallo, Bonaya Ibrae, Boru Galgallo, Bursuna Stephen, Darba Doche, Boranto Rosemary, Emanuel Eisimkorro, Gumatho Ann, Gobanai James, Kato Amos, Kargio Emmanuel, Keriya Sabrina, Lekapana Jacob, Leyamyam Jeremiah, Matini Newton, Ogoti Brian, Parkasio John, and Seree Stephen.
Conflicts of Interest
The authors declare no conflicts of interest. The funders had no role in the design of the study; in the collection, analyses, or interpretation of data; in the writing of the manuscript; or in the decision to publish the results.
Appendix A
Table A1.
Recommended food groups consumed by infants and children <60 months during the baseline period.
Table A1.
Recommended food groups consumed by infants and children <60 months during the baseline period.
| Food group | Infant <6 months (n=269) |
Children 6-23 months (n=1009) |
Children 24-59 months (n=367) |
|---|---|---|---|
| Breast milk (Exclusive) | 244 (90%) | 74 (7%) | - |
| Breast milk (non-exclusive) | 28 (10%) | 1025 (93%) | 122 (32%) |
| Breastfed and non-milk liquids | 15 (6%) | - | - |
| Breastfed and animal milk | 10 (4%) | - | - |
| Tubers, roots, and cereals | 3 (1%) | 613 (58%) | 348 (92%) |
| Pulses/legumes & nuts | 2 (1%) | 371 (34%) | 254 (67%) |
| Dairy products | 3 (1%) | 898 (82%) | 357 (95%) |
| Flesh foods | - | 29 (3%) | 23 (6%) |
| Eggs | - | 7 (1%) | 3 (1%) |
| Vitamin A-rich fruits and vegetables | - | 19 (2%) | 10 (3%) |
| Other fruits & vegetables | 1 (<1%) | 93 (8%) | 44 (12%) |
Table A2.
Recommended food groups consumed by children <60 months during the study period.
| Children 6-23 months | Children 24-59 months | |||||||||
|---|---|---|---|---|---|---|---|---|---|---|
| Food group | Overall | Intervention arm 1 | Intervention arm 2 | Control | P value | Overall | Intervention arm 1 | Intervention arm 2 | Control | P value |
| Breastmilk | 87.0% | 84.6% | 89.8% | 86.6% | 0.093 | 31.6% | 29.9% | 34.1% | 30.9% | 0.131 |
| Dairy products | 82.4% | 82.3% | 84.9% | 79.9% | 0.356 | 97.6% | 97.6% | 98.4% | 96.8% | 0.06 |
| Tubers, roots, and cereals | 78.4% | 77.8% | 79.9% | 77.4% | 0.821 | 94.7% | 93.3% | 94.8% | 96.0% | 0.423 |
| Pulses/legumes & nuts | 47.7% | 45.9% | 50.9% | 46.2% | 0.424 | 66.4% | 61.8% | 70.6% | 66.6% | 0.072 |
| Other fruits & vegetables | 15.7% | 8.5% | 25.4% | 11.2% | <0.001 | 16.9% | 9.2% | 26.5% | 14.4% | <0.001 |
| Flesh foods | 7.4% | 2.7% | 9.1% | 10.4% | 0.092 | 6.4% | 4.3% | 6.8% | 8.2% | 0.057 |
| Vitamin A-rich fruits and vegetables | 4.8% | 1.4% | 7.1% | 2.1% | 0.009 | 5.1% | 1.2% | 7.9% | 3.3% | <0.001 |
| Eggs | 1.6% | 1.0% | 2.1% | 1.2% | 0.214 | 1.4% | 1.1% | 1.1% | 2.1% | 0.015 |
| Eggs/ flesh foods | 7.7% | 2.9% | 9.9% | 10.5% | 0.066 | 6.7% | 4.4% | 7.2% | 8.7% | 0.018 |
| Fruits/vegetables | 16.5% | 8.6% | 27.1% | 11.6% | <0.001 | 17.6% | 9.5% | 27.8% | 14.9% | <0.001 |
Table A3.
Recommended food groups consumed by women of reproductive age during the study period.
| Baseline | Study period | ||||
|---|---|---|---|---|---|
| Food group | Women (n=1734) |
Intervention arm 1 | Intervention arm 2 | Control | P value |
| Dairy products | 92.7% | 92.8% | 91.4% | 91.3% | 0.573 |
| Grains, roots, and tubers | 92.2% | 89.8% | 90.0% | 90.6% | 0.892 |
| Pulses | 72.8% | 66.5% | 70.8% | 67.3% | 0.166 |
| Other vegetables | 15.1% | 10.7% | 27.2% | 13.2% | <0.001 |
| Flesh foods | 8.2% | 5.5% | 9.0% | 8.7% | 0.058 |
| Dark green leafy vegetables | 1.7% | 6.0% | 8.8% | 3.2% | 0.037 |
| Other vitamin-A rich fruits and vegetables | 1.0% | 1.4% | 3.7% | 2.0% | 0.002 |
| Eggs | 0.6% | 1.0% | 2.0% | 7.1% | 0.035 |
| Other fruits | 0.3% | 1.2% | 1.2% | 1.7% | 0.060 |
| Nuts and seeds | 0% | 0% | 0% | 0% | |
Figure A1.
Likelihood of overall change in the indicators of diet diversity score (a) and monthly change over time (b). Dry seasons are shown in grey.
Figure A1.
Likelihood of overall change in the indicators of diet diversity score (a) and monthly change over time (b). Dry seasons are shown in grey.
References
- Onyango AW, Jean-Baptiste J, Samburu B, et al. Regional Overview on the Double Burden of Malnutrition and Examples of Program and Policy Responses: African Region. Ann Nutr Metab 2019;75:127–30. [CrossRef]
- Birungi A, Koita Y, Roopnaraine T, et al. Behavioural drivers of suboptimal maternal and child feeding practices in Rwanda: An anthropological study. Matern Child Nutr 2023;19. [CrossRef]
- Katoch, OR. Determinants of malnutrition among children: A systematic review. Nutrition 2022;96. [CrossRef]
- Development Initiatives. Global Nutrition Report Action on equity to end malnutrition. 2020.
- Aboagye RG, Seidu AA, Ahinkorah BO, et al. Dietary diversity and undernutrition in children aged 6–23 months in sub-saharan africa. Nutrients 2021;13. [CrossRef]
- Gómez G, Previdelli ÁN, Fisberg RM, et al. Dietary diversity and micronutrients adequacy in women of childbearing age: Results from elans study. Nutrients 2020;12:1–16. [CrossRef]
- Chandrasekhar S, Aguayo VM, Krishna V, et al. Household food insecurity and children’s dietary diversity and nutrition in India. Evidence from the comprehensive nutrition survey in Maharashtra. Matern Child Nutr 2017;13. [CrossRef]
- FAO, USAID. Minimum Dietary Diversity for Women- A Guide to Measurement. 2016.
- WHO, UNICEF. Indicators for assessing infant and young child feeding practices Part 2 MeasureMent. 2021.
- KNBS, ICF. Kenya Demographic and Health Survey 2022 Key Indicators Report. 2023.
- Kenya National Bureau of Statistics. Kenya Demographic and Health Survey 2014. 2014.
- Mulaw GF, Feleke FW, Mare KU. Only one in four lactating mothers met the minimum dietary diversity score in the pastoral community, Afar region, Ethiopia: a community-based cross-sectional study. J Nutr Sci 2021;10. [CrossRef]
- Mayanja M, Rubaire-Akiiki C, Morton J, et al. Diet Diversity in Pastoral and Agro-pastoral Households in Ugandan Rangeland Ecosystems. Ecol Food Nutr 2015;54:529–45. [CrossRef]
- Mengistu G, Moges T, Samuel A, et al. Energy and nutrient intake of infants and young children in pastoralist communities of Ethiopia. Nutrition 2017;41:1–6. [CrossRef]
- Schelling E, Daoud S, Daugla DM, et al. Morbidity and nutrition patterns of three nomadic pastoralist communities of Chad. Acta Trop 2005;95:16–25. [CrossRef]
- Geletaw A, Egata G, Weldegebreal F, et al. Nutritional Status and Associated Factors among Primary Schoolchildren from Pastoral Communities, Mieso-Mulu District, Sitti Zone, Somali Regional State, Eastern Ethiopia: Institution-Based Cross-Sectional Study. J Nutr Metab 2021;2021. [CrossRef]
- Sadler K, Kerven C, Calo M, et al. A Literature Review of Pastoralist Nutrition and Programming Responses MILK MATTERS. 2009.
- Getabalew M, Alemneh T. Dairy Production and Milk Consumption in Pastoral Areas of Ethiopia. Archives of Animal Husbandry & Dairy Science 2019;1. [CrossRef]
- Loutan L, Lamotte J-M. SEASONAL VARIATIONS IN NUTRITION AMONG A GROUP OF NOMADIC PASTORALISTS IN NIGER. The Lancet 1984;323:945–7. [CrossRef]
- FAO, UNICEF, Washington State University. Seasonality of malnutrition: Community knowledge on patterns and causes of undernutrition in children and women in Laisamis, Marsabit County, Kenya. FAO and UNICEF; 2020. [CrossRef]
- Homewood, KM. Development and the ecology of maasai pastoralist food and nutrition. Ecol Food Nutr 1992;29:61–80. [CrossRef]
- Safari JG, Kirwa MK, Mandara CG. Food insecurity in pastoral communities of Ngorongoro conservation area, Tanzania. Agric Food Secur 2022;11. [CrossRef]
- Vossenaar M, Knight FA, Tumilowicz A, et al. Context-specific complementary feeding recommendations developed using Optifood could improve the diets of breast-fed infants and young children from diverse livelihood groups in northern Kenya. Public Health Nutr 2017;20:971–83. [CrossRef]
- Ahoya B, Kavle JA, Straubinger S, et al. Accelerating progress for complementary feeding in Kenya: Key government actions and the way forward. Matern Child Nutr 2019;15. [CrossRef]
- Jans C, Mulwa Kaindi DW, Meile L. Innovations in food preservation in pastoral zones. OIE Revue Scientifique et Technique 2016;35:597–610. [CrossRef]
- Government of the Republic of Kenya Ministry of Health. Division of Nutrition National Maternal, Infant and Young Child Nutrition Policy Guidelines. 2013.
- County Government of Marsabit. Maternal, Infant and Young Children Nutrition Knowledge Attitude and Practices Baseline Survey for Marsabit County. 2018.
- Thumbi SM, Muema J, Mutono N, et al. The Livestock for Health Study: A Field Trial on Livestock Interventions to Prevent Acute Malnutrition Among Women and Children in Pastoralist Communities in Northern Kenya. Food Nutr Bull 2023;44:119–23. [CrossRef]
- UNICEF. Child Food Poverty. Nutrition Deprivation in Early Childhood. Child Nutrition Report. New York: 2024.
- DeLay ND, Thumbi SM, Vanderford J, et al. Linking calving intervals to milk production and household nutrition in Kenya. Food Secur 2020;12:309–25. [CrossRef]
- Mosites EM, Rabinowitz PM, Thumbi SM, et al. The relationship between livestock ownership and child stunting in three countries in eastern Africa using national survey data. PLoS One 2015;10:1–10. [CrossRef]
- McElwain TF, Thumbi SM. Animal pathogens and their impact on animal health, the economy, food security, food safety and public health. Rev Sci Tech 2017;36:423–33. [CrossRef]
- Kuche D, Moss C, Eshetu S, et al. Factors associated with dietary diversity and length-for-age z-score in rural Ethiopian children aged 6–23 months: A novel approach to the analysis of baseline data from the Sustainable Undernutrition Reduction in Ethiopia evaluation. Matern Child Nutr 2020;16. [CrossRef]
- Savy M, Martin-Prével Y, Sawadogo P, et al. Use of variety/diversity scores for diet quality measurement: Relation with nutritional status of women in a rural area in Burkina Faso. Eur J Clin Nutr 2005;59:703–16. [CrossRef]
- Megersa, B. <p>Dietary Intake of Infant and Young Children and Assessment of Dietary Adequacy Indicators in a Pastoral Setting, Southern Ethiopia</p>. Nutr Diet Suppl 2020;Volume 12:1–10. [CrossRef]
- Chege PM, Kimiywe JO, Ndungu ZW. Influence of culture on dietary practices of children under five years among Maasai pastoralists in Kajiado, Kenya. International Journal of Behavioral Nutrition and Physical Activity 2015;12. [CrossRef]
- Katenga-Kaunda LZ, Iversen PO, Kamudoni PR, et al. Food-based nutrition counselling and education intervention for improved diets of pregnant women in rural Malawi: a qualitative study of factors influencing dietary behaviour change. Public Health Nutr 2022;25:2436–47. [CrossRef]
- Gebregziabher H, Kahsay A, Gebrearegay F, et al. Food taboos and their perceived reasons among pregnant women in Ethiopia: a systematic review, 2022. BMC Pregnancy Childbirth 2023;23. [CrossRef]
- Mengie T, Dessie Y, Egata G, et al. Food taboos and associated factors among agro-pastoralist pregnant women: A community-based cross-sectional study in Eastern Ethiopia. Heliyon 2022;8. [CrossRef]
- Vall E, Sib O, Vidal A, et al. Dairy farming systems driven by the market and low-cost intensification in West Africa: the case of Burkina Faso n.d. [CrossRef]
- Heckert J, Olney DK, Ruel MT. Is women’s empowerment a pathway to improving child nutrition outcomes in a nutrition-sensitive agriculture program?: Evidence from a randomized controlled trial in Burkina Faso. Soc Sci Med 2019;233:93–102. [CrossRef]
- Soofi SB, Khan University A, Adu-Bonsaaoh K, et al. Short birth interval and its associated factors among multiparous women in Mieso agro-pastoralist district, Eastern Ethiopia: A community-based cross-sectional study. n.d.
- Manley J, Gitter S, Slavchevska V. How Effective are Cash Transfer Programmes at Improving Nutritional Status? A Rapid Evidence Assessment of Programmes’ Effects on Anthropometric Outcomes. 2012.
- Hagen-Zanker J, Pellerano L, Bastagli F, et al. Briefing Shaping policy for development The impact of cash transfers on women and girls A summary of the evidence. 2017.
- Carroll RJ, Midthune D, Subar AF, et al. Taking advantage of the strengths of 2 different dietary assessment instruments to improve intake estimates for nutritional epidemiology. Am J Epidemiol 2012;175:340–7. [CrossRef]
Figure 2.
Overview of variables collected during each collection period.
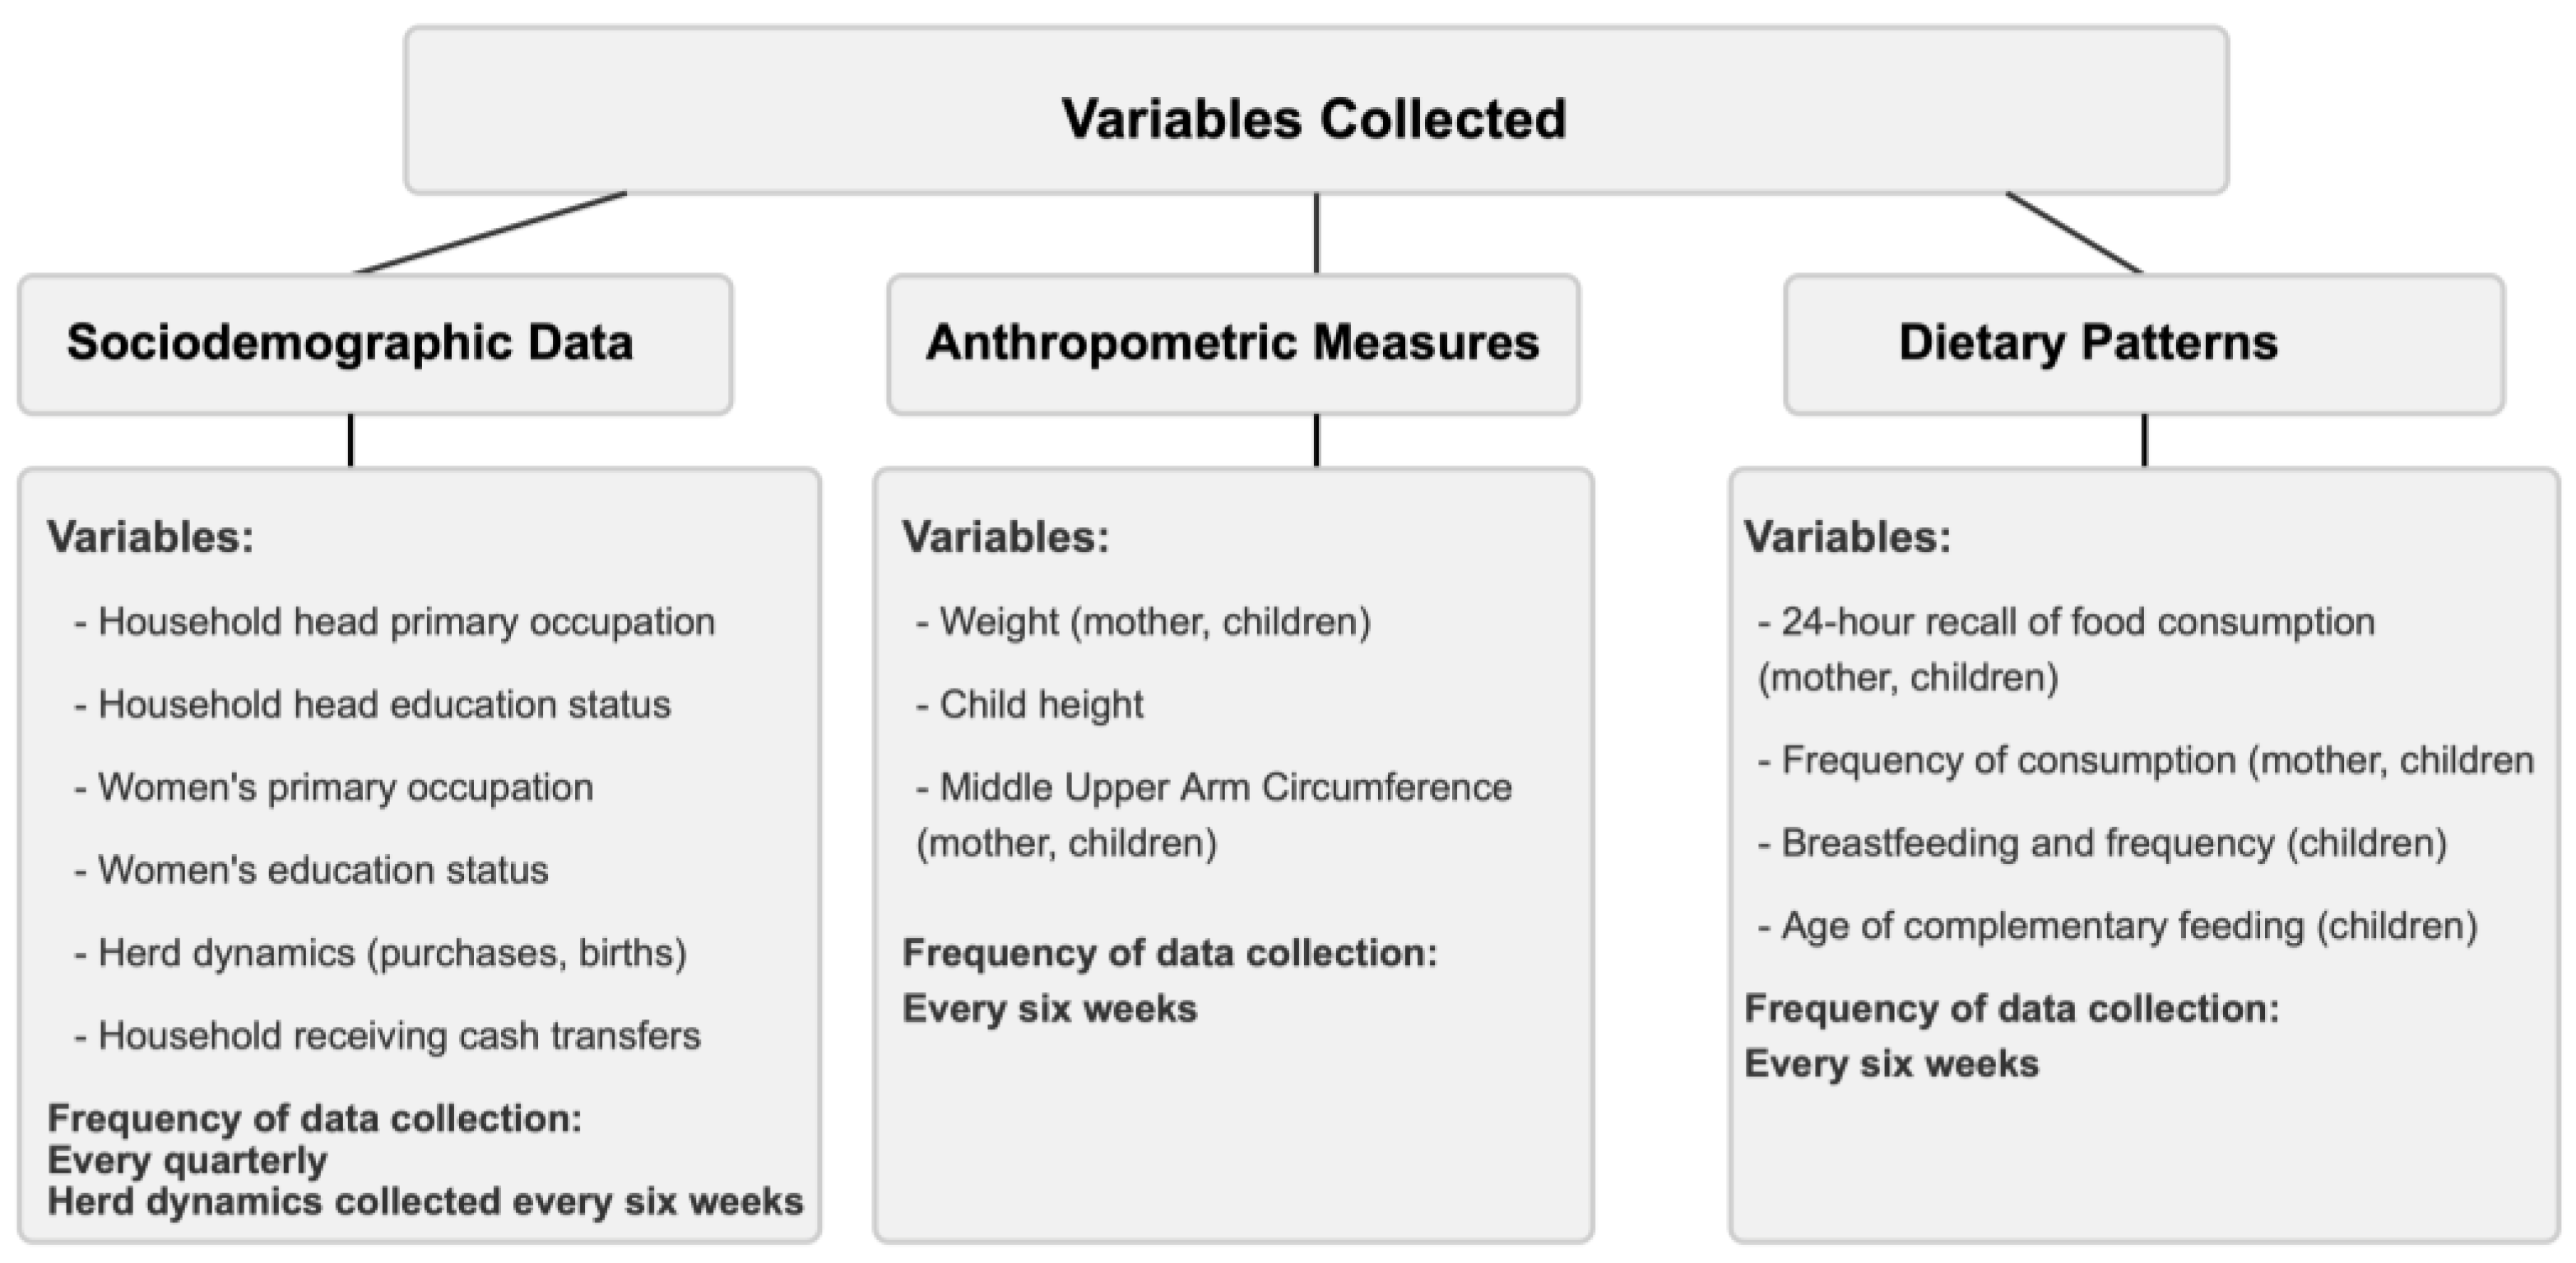
Figure 3.
Participant flow diagram for the cluster-randomised controlled trial.
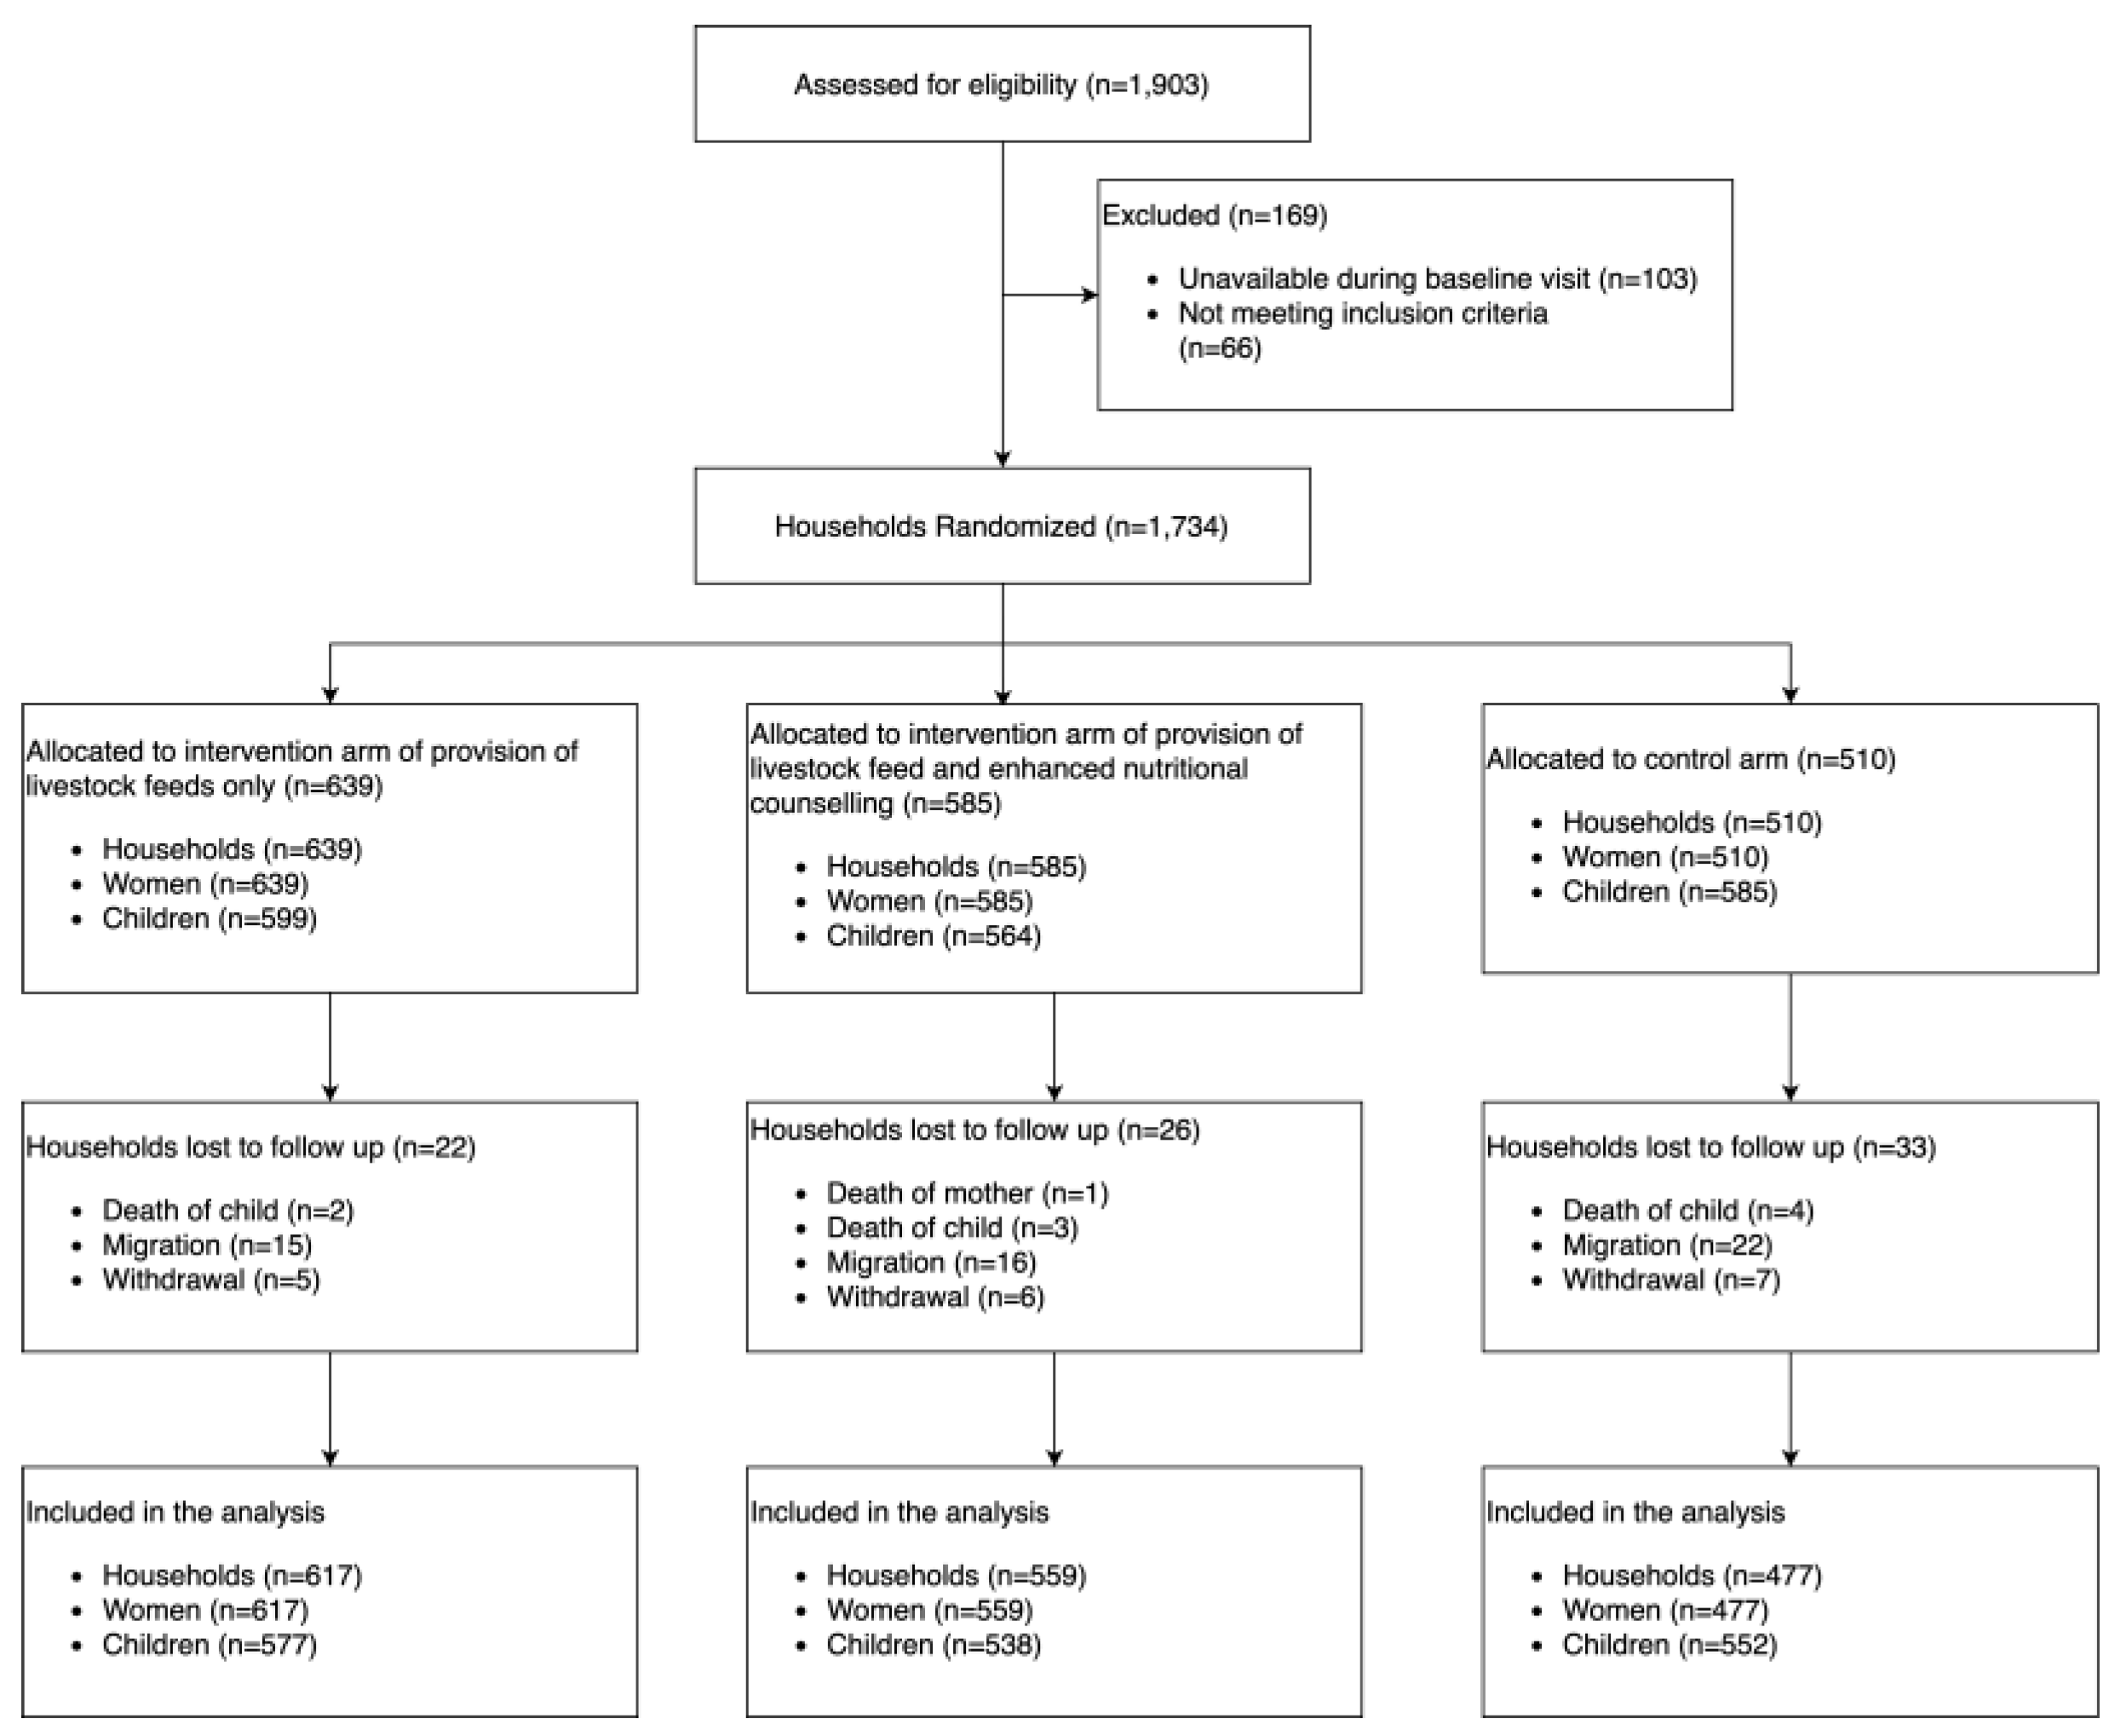
Figure 4.
Food groups consumed by children <5 years over the study period.
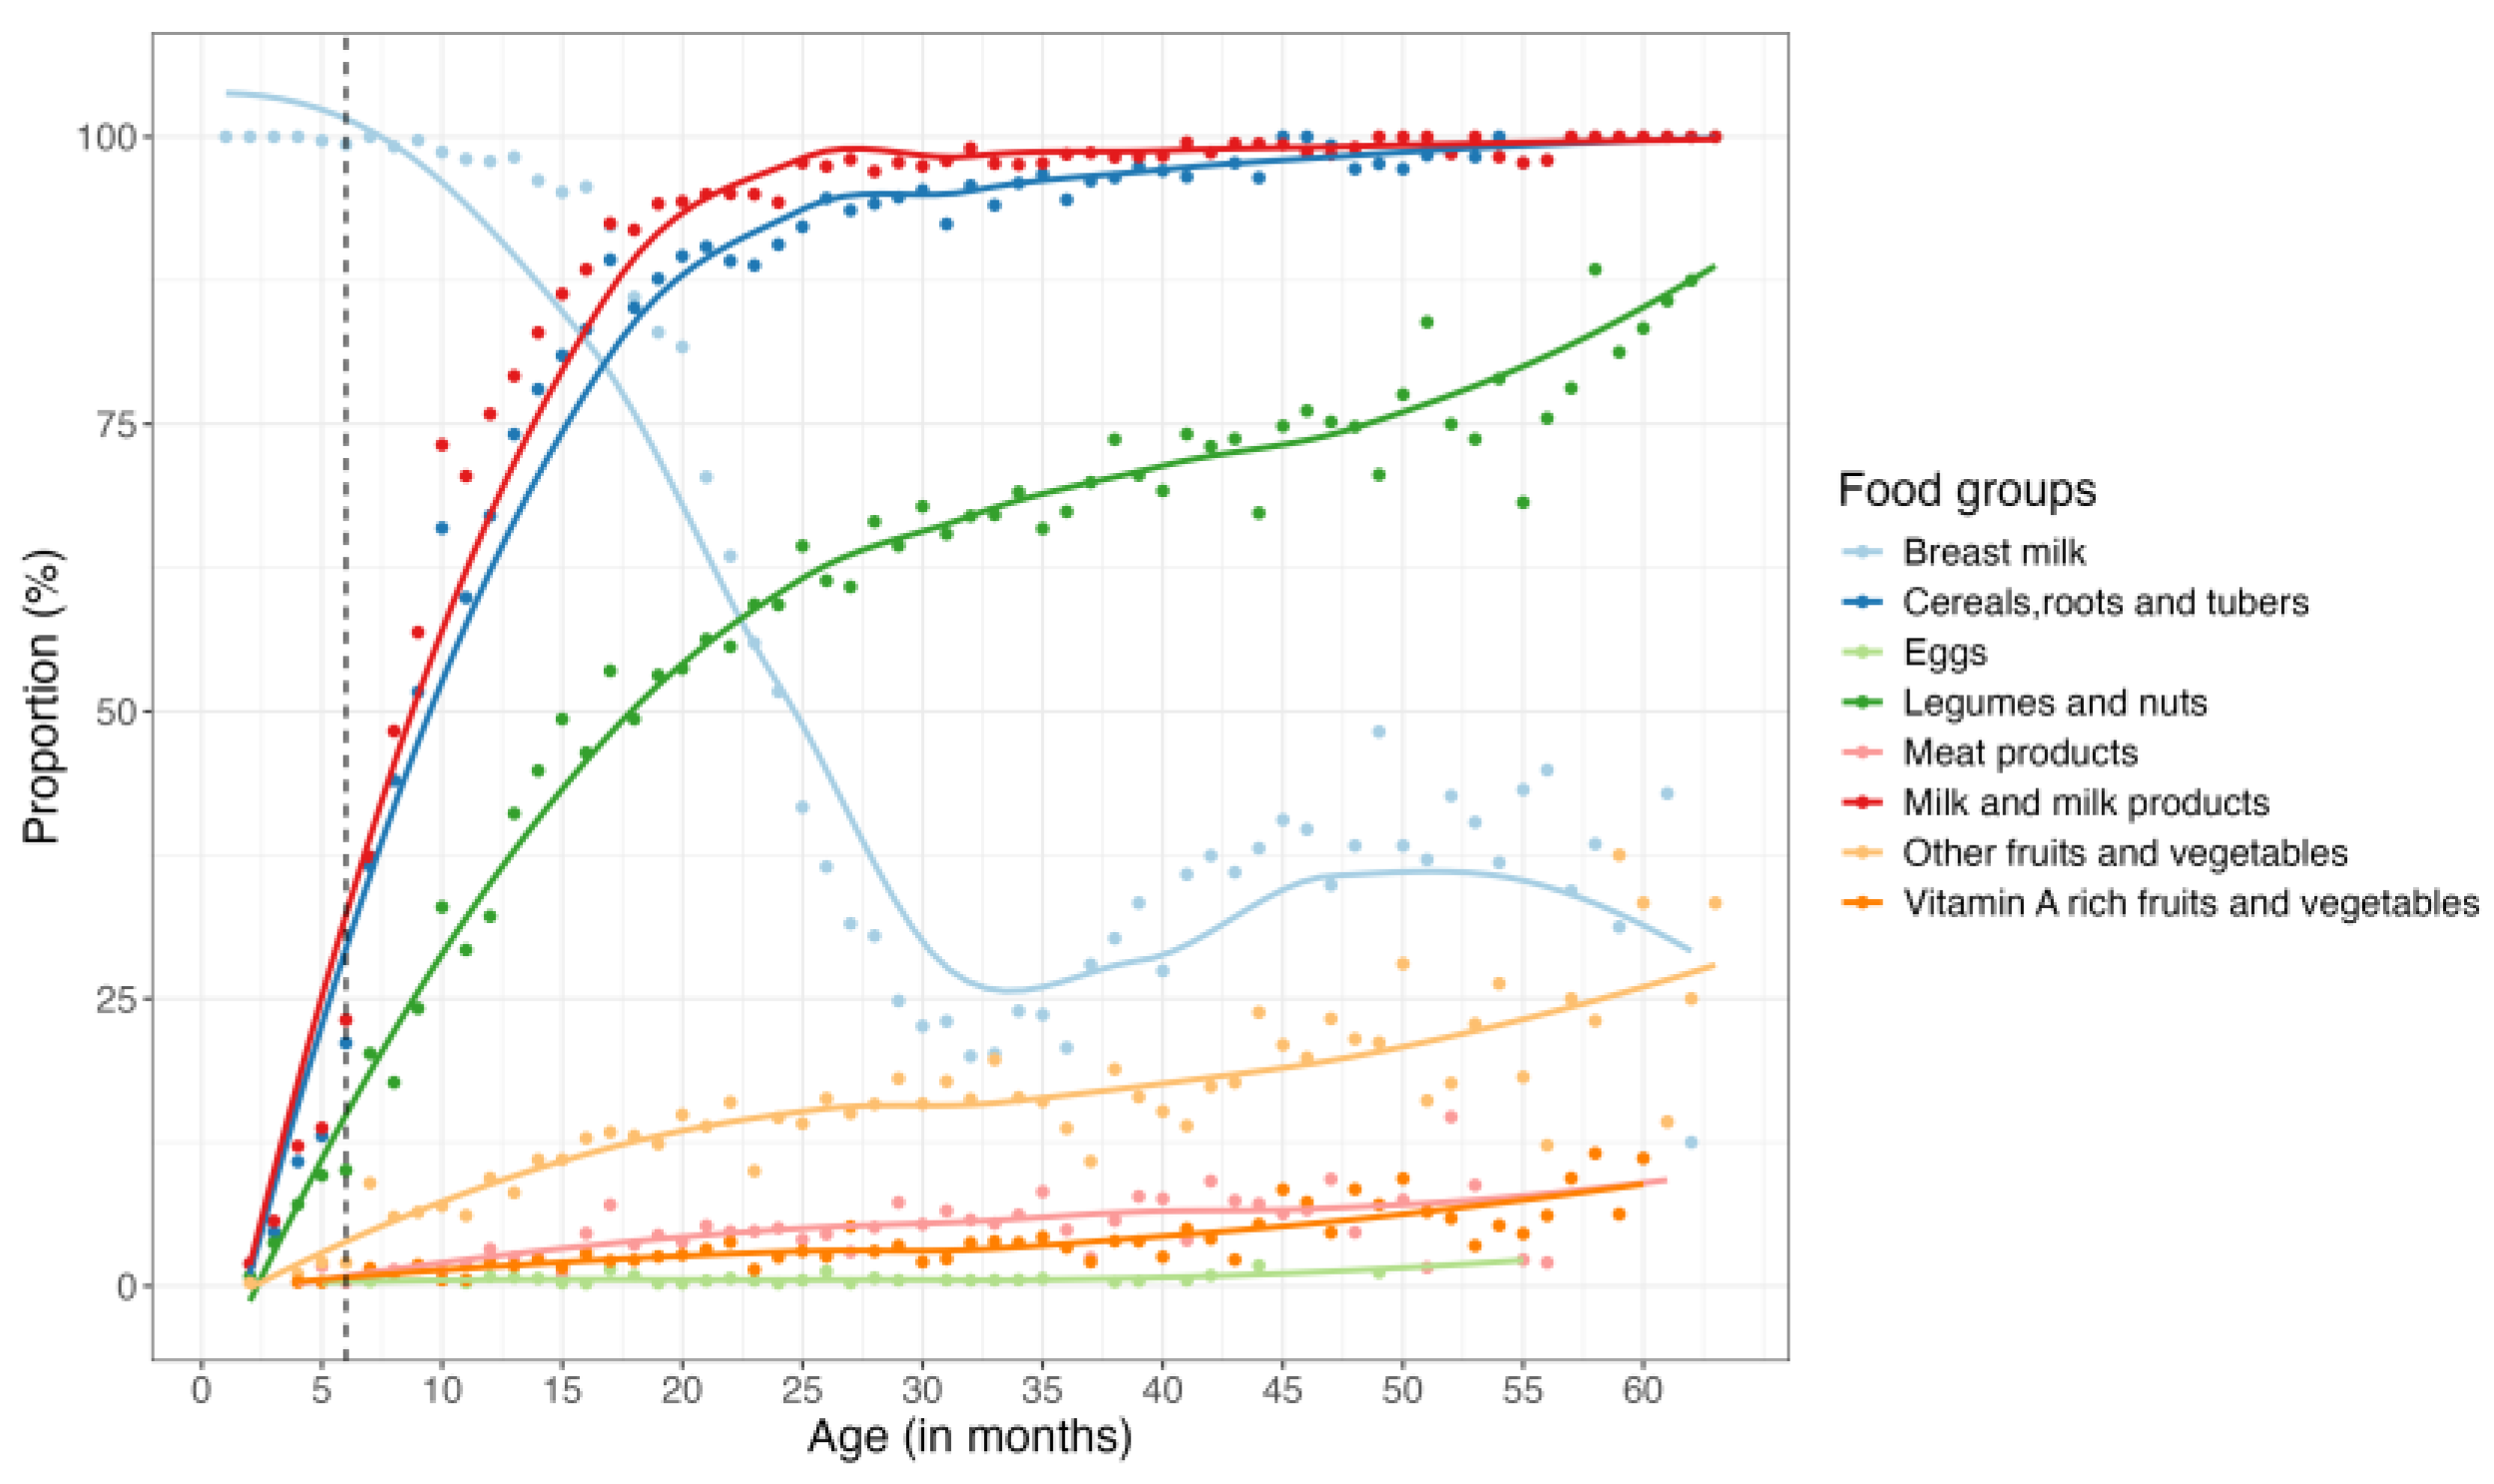
Figure 5.
Proportion of women in the different intervention arms consuming each of the different food groups over the study period.
Figure 5.
Proportion of women in the different intervention arms consuming each of the different food groups over the study period.
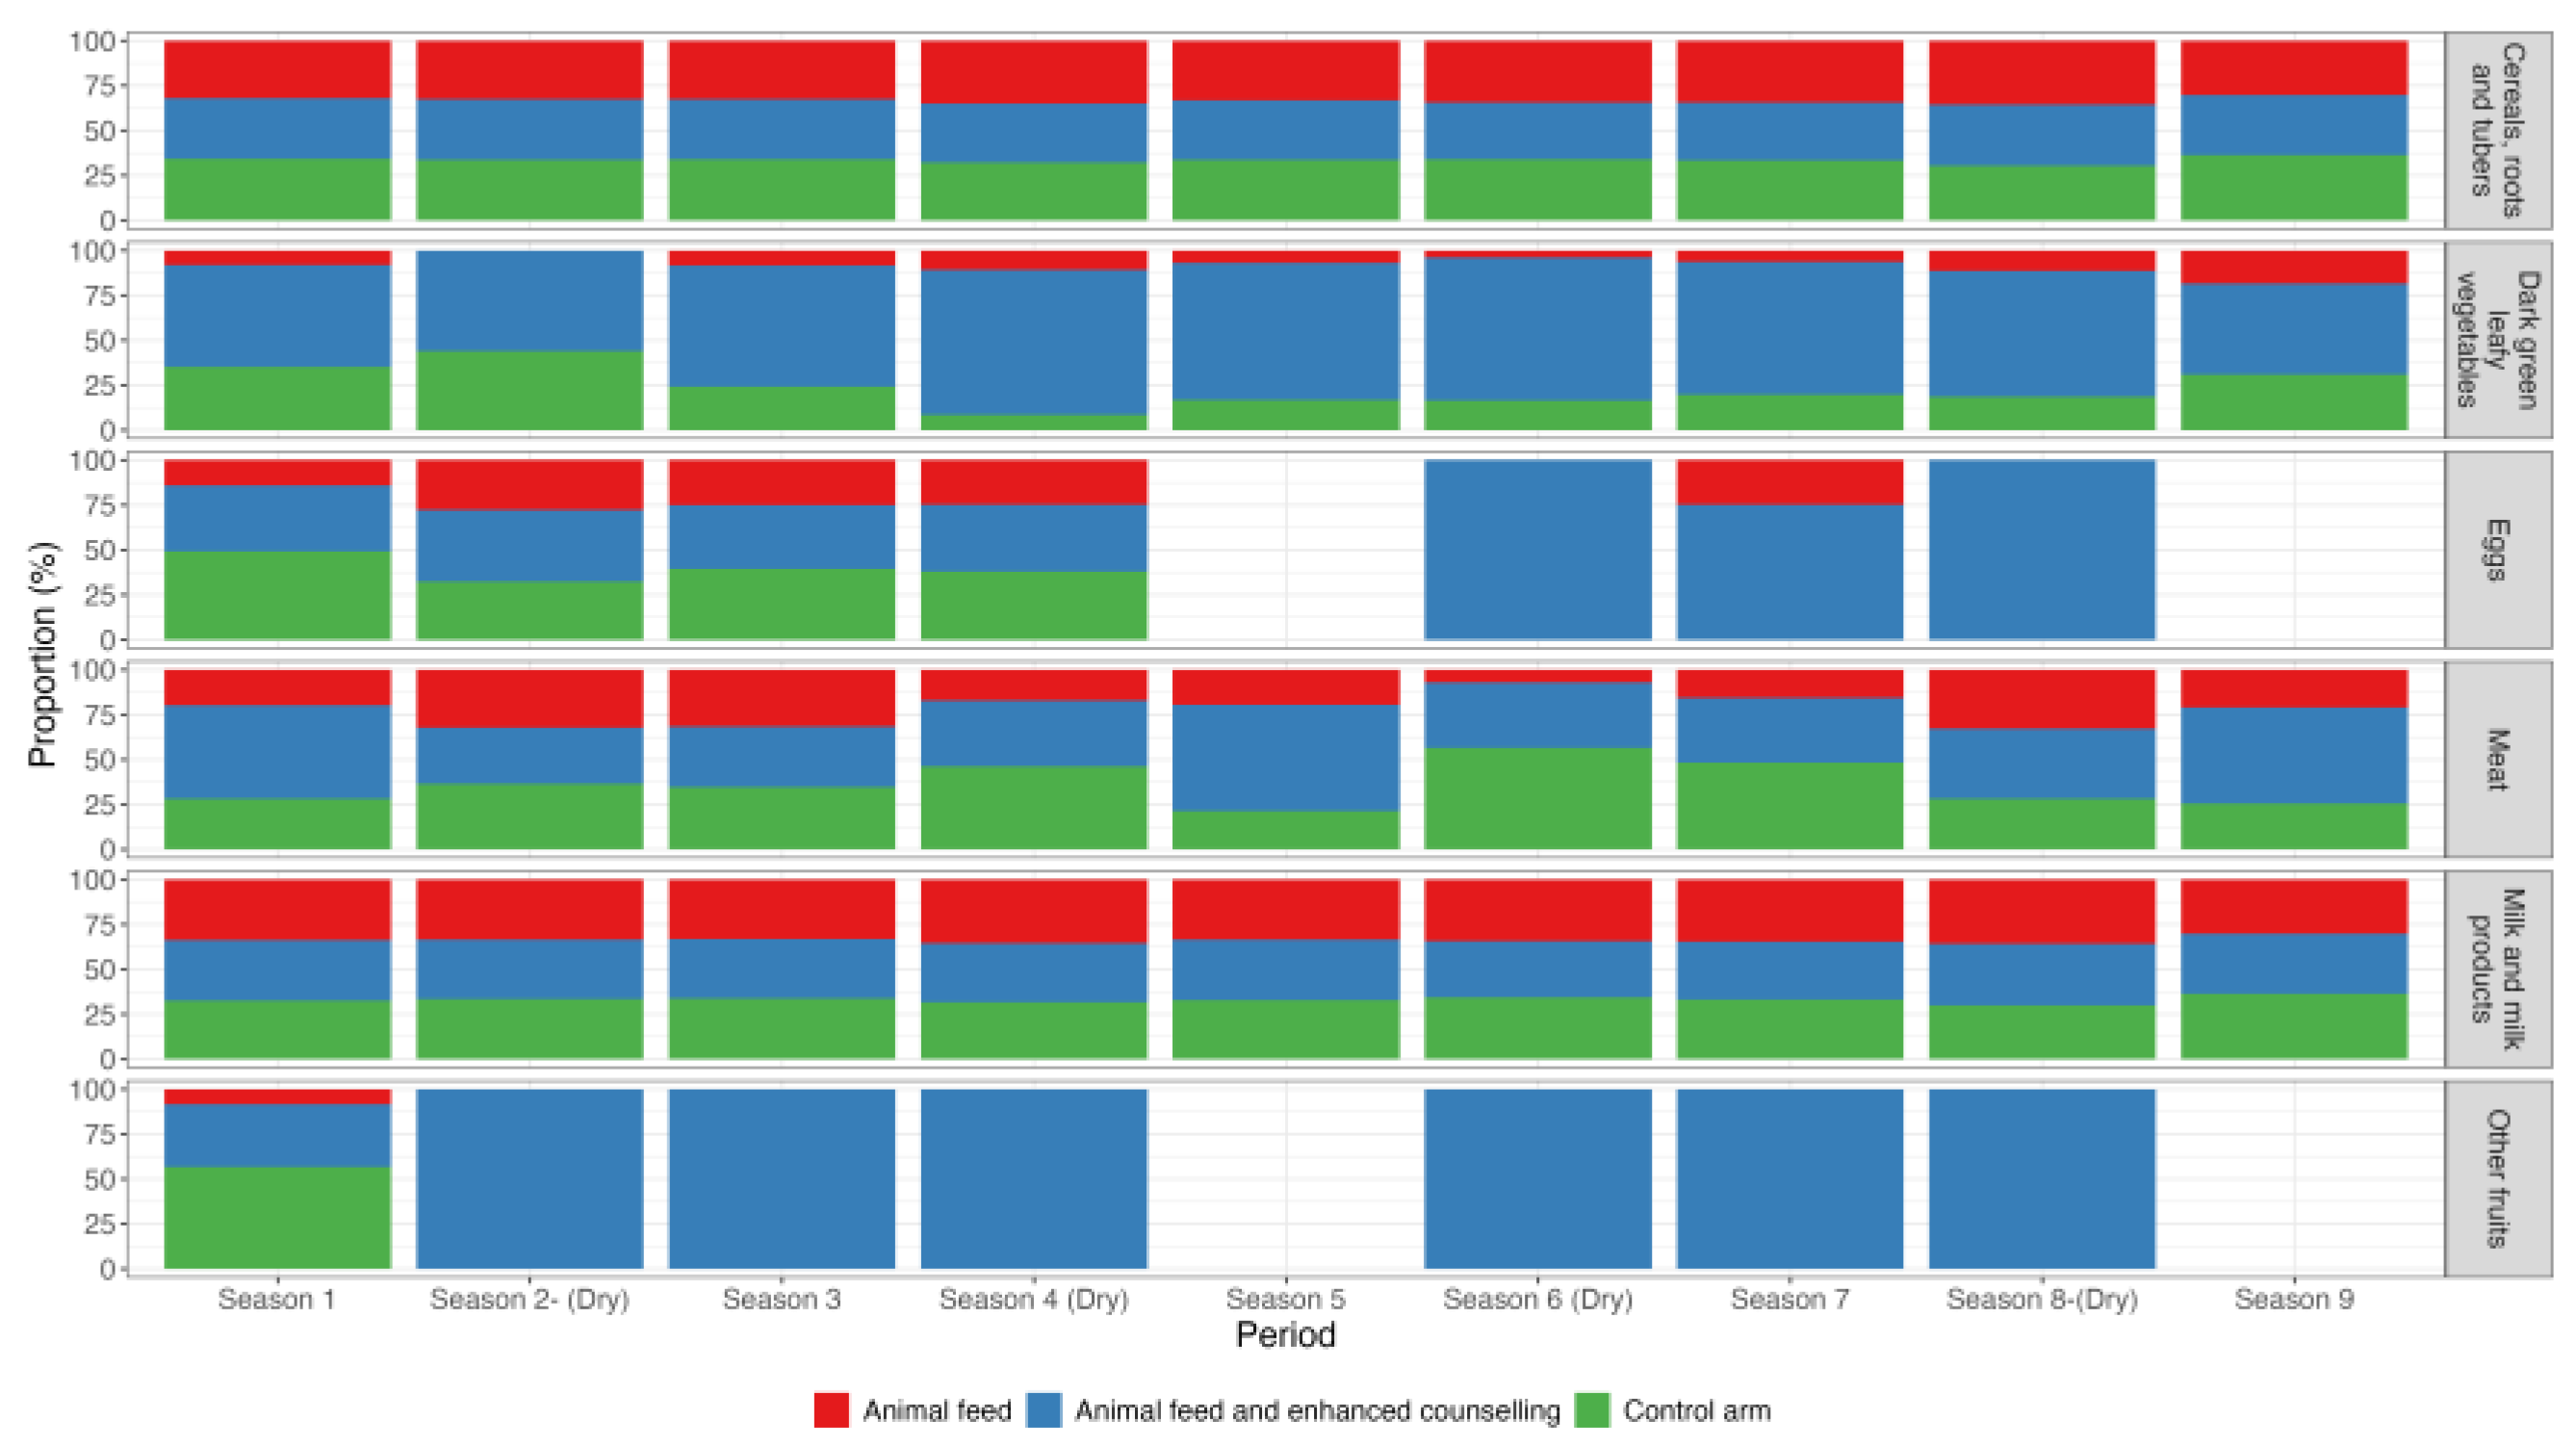
Table 2.
Difference-in-Difference regression results on the effects of factors associated Minimum Diet Diversity (MDD), Minimum Meal Frequency, Minimum Acceptable Diet in children and women of reproductive age.
Table 2.
Difference-in-Difference regression results on the effects of factors associated Minimum Diet Diversity (MDD), Minimum Meal Frequency, Minimum Acceptable Diet in children and women of reproductive age.
| Infant and young child | Women of reproductive age | |||
|
Dependent variables → Factors ↓ |
MDD Odds Ratio (95% CI) | MMF Odds Ratio (95% CI) | MAD Odds Ratio (95% CI) | MDD-W Odds Ratio (95% CI) |
| Study arm | ||||
| Control arm | Reference | Reference | Reference | Reference |
| Animal feed only | 1.78 (1.60,1.98) | 2.19 (1.56, 3.07) | 1.77 (1.53, 2.04) | 1.55 (1.23, 1.89) |
| Animal feed and enhanced nutritional counselling | 2.54 (2.30,2.79) | 1.61 (1.08, 2.39) | 3.10 (2.66, 3.62) | 4.22 (3.29, 5.42) |
| Gender | ||||
| Female | Reference | Reference | Reference | |
| Male | 0.83 (0.67,1.02) | 1.19 (0.94, 1.51) | 1.07 (1.00, 1.15) | - |
| Household head primary occupation | ||||
| Livestock herding | Reference | Reference | Reference | Reference |
| Non-livestock herding | 0.47 (0.42,0.52) | 1.18 (0.69, 2.03) | 2.29 (2.02, 2.60) | 2.81 (2.24, 3.54) |
| Household head education status | ||||
| Received formal education | 2.33 (2.10,2.60) | 1.53 (0.74, 3.16) | 0.47 (0.40, 0.57) | 0.93 (0.70, 1.24) |
| No formal education | Reference | Reference | Reference | Reference |
| Women’s primary occupation | ||||
| Livestock herding | Reference | Reference | Reference | Reference |
| Non-livestock herding | 1.75 (1.62,1.89) | 1.43 (1.09,1.88) | 1.21 (1.13, 1.30) | 2.41 (1.93, 3.01) |
| Women’s education status | ||||
| Received formal education | 3.02 (2.69,3.38) | 2.53 (1.19, 5.38) | 0.93 (0.78, 1,11) | 5.29 (3.91, 7.18) |
| No formal education | Reference | Reference | Reference | Reference |
| Herd dynamics | ||||
| Births (count) | 1.002 (1.001, 1.004) | 1.01 (0.99, 1.02) | 0.98 (0.95, 1.12) | 1.21 (0.85, 1.66) |
| Purchases (count) | 1.03 (1.01,1.06) | 0.84 (0.76,0.93) | 1.02 (1.01, 1.07) | 4.73 (2.53, 8.85) |
| Cash transfer | 0.90 (0.87,0.94) | 1.08 (0.93, 1.26) | 0.95 (0.89, 0.97) | 0.73 (0.54, 0.89) |
Disclaimer/Publisher’s Note: The statements, opinions and data contained in all publications are solely those of the individual author(s) and contributor(s) and not of MDPI and/or the editor(s). MDPI and/or the editor(s) disclaim responsibility for any injury to people or property resulting from any ideas, methods, instructions or products referred to in the content. |
© 2025 by the authors. Licensee MDPI, Basel, Switzerland. This article is an open access article distributed under the terms and conditions of the Creative Commons Attribution (CC BY) license (https://creativecommons.org/licenses/by/4.0/).
Copyright: This open access article is published under a Creative Commons CC BY 4.0 license, which permit the free download, distribution, and reuse, provided that the author and preprint are cited in any reuse.


