
Submitted:
22 January 2025
Posted:
23 January 2025
You are already at the latest version
Abstract
Business Process Redesign (BPR) plays a crucial role in improving organizational efficiency and adapting to evolving operational demands. This study explores the application of the BPR Assessment Framework to real-life processes within the Greek public financial management (GPFM) domain, moving beyond prior controlled-environment analyses. The framework systematically evaluates processes based on internal metrics, such as complexity and flexibility, and external quality factors, using clustering techniques to classify processes by their redesign capacity. Real-life workflows from the Greek Customs Service and the Financial and Economic Crime Unit are analyzed, providing insights into their potential for enhanced efficiency, compliance, and resource utilization. By evaluating representative processes, this research demonstrates the framework’s utility in identifying redesign opportunities and addressing challenges in complex, operational contexts. The study emphasizes the value of systematic, data-driven approaches to BPR while also highlighting practical considerations for implementing such methodologies in public sector environments. These findings contribute to advancing BPR practices by bridging the gap between theoretical development and real-world application, offering a pathway for improved public sector performance and digital transformation.
Keywords:
Business Process Redesign (BPR)
; Plasticity
; Cluster Analysis
; Public Financial Management (PFM)
; Redesign Capacity
1. Introduction
The ever-increasing demand for organizations to adapt to volatile and competitive environments has made the design and management of business processes (BPs) a critical factor for sustained success [1]. Business Process Redesign (BPR) has emerged as a key approach for enhancing organizational performance, enabling reductions in cost and time, improving quality and efficiency, and addressing the continuous evolution of operational requirements [2,3]. Despite its potential, most BPR efforts are conducted reactively, at runtime, based on post-implementation analysis. This limits organizations’ ability to evaluate and systematically apply redesign strategies during the design phase, where decisions have a more significant impact and are less costly to implement.
To address these challenges, the BPR Assessment Framework [4] was developed as a structured methodology to evaluate the redesign capacity of BP models systematically. By introducing and operationalizing the concept of "model plasticity" [5] the framework aims to measure the feasibility and effectiveness of applying BPR heuristics at design time. It provides a systematic approach to classify BPs based on internal and external quality metrics, thereby aiding practitioners in identifying candidate processes for redesign. This research builds upon the foundational work that introduced and demonstrated the framework using a repository of pre-existing BP models. While these efforts showcased the framework’s potential, the testing was confined to controlled conditions with repository-based models. The current study shifts focus towards exploring the framework’s applicability in real-world settings, specifically within the context of Greek Public Financial Management (GPFM). By applying the framework to real-life processes, this study aims to emphasize its practical usability, challenges, and potential contributions to operational efficiency and digital transformation efforts. The processes analyzed in this research originate from the Customs Service and the Financial and Economic Crime Unit (S.D.O.E.) of the Greek Ministry of Finance. These processes represent critical operational workflows that directly impact public sector efficiency and compliance. Through a series of analyses, this work categorizes processes by their plasticity and external quality, providing actionable insights for practitioners.
By bridging the gap between conceptual framework development and real-world application, this research contributes to advancing the discourse on systematic BPR methodologies. It highlights the significance of pre-implementation analysis and offers valuable perspectives for practitioners and researchers seeking to integrate BPR into dynamic and complex organizational environments.
2. Related Work
The field of Business Process Redesign (BPR) has its roots in the seminal work of [6], who introduced the concept as a radical rethinking and redesign of business processes to achieve dramatic improvements in performance. This vision of transformative change emphasized the need for organizations to rethink how work is performed to optimize outcomes in cost, speed, quality, and service. Subsequently, Davenport [7] expanded on this concept by integrating principles of incremental improvement and systematic analysis, paving the way for a broader adoption of BPR methodologies. Over the years, numerous methodologies have emerged to support BPR efforts. Early frameworks primarily focused on qualitative assessments, leveraging managerial insights to guide process redesign decisions [8,9]. However, as organizations increasingly sought data-driven approaches, quantitative metrics for evaluating business processes gained prominence. For example, Adesola and Baines [10] proposed a Business Process Improvement (BPI) methodology that combined strategic objectives with feasibility analysis, though their work largely emphasized post-implementation evaluation.
A significant shift occurred with the introduction of quantitative measures for pre-implementation analysis. Sánchez-González et al. [11] and Zur Muehlen and Ho [12] highlighted the importance of structural complexity, modifiability, and flexibility in determining a process’s redesign potential. These metrics, such as modularity and control flow complexity, provided a foundation for evaluating processes systematically. More recently, the concept of "model plasticity" has emerged [5], emphasizing the adaptability of process models to structural changes without compromising functional integrity. Model plasticity synthesizes prior work on complexity and flexibility, offering a holistic measure for assessing redesign feasibility. The advent of computational techniques further enhanced the field, with clustering algorithms playing a central role in modern BPR methodologies [13,14]. Clustering, particularly K-means, enables the categorization of processes based on similarity in their structural metrics, allowing organizations to prioritize redesign efforts effectively [15]. For instance, repositories such as the SOA-based Business Process Database have been utilized in research to demonstrate the utility of clustering in evaluating and grouping processes by redesign potential. These efforts demonstrated the value of clustering in identifying high-priority processes and provided insights into patterns that might not be evident through qualitative assessments alone.
The BPR Assessment Framework [4] builds on this lineage by integrating robust metric-based evaluations with clustering techniques. Earlier studies applying the framework demonstrated its effectiveness in controlled environments, where pre-existing repositories of process models were used to test its theoretical underpinnings. These applications confirmed the framework’s capacity to classify processes into Low, Moderate, and High redesign capacity, linking structural characteristics to practical decision-making. However, much of the existing research has been conducted in controlled settings, limiting its applicability to real-world scenarios [16]. While controlled environments are valuable for refining methodologies and testing theoretical assumptions, they often fail to capture the complexities and constraints inherent in operational settings. For example, organizational culture, regulatory compliance, and resource limitations are factors that can critically influence the success of BPR initiatives but are rarely accounted for in theoretical models [17]. This gap underscores the need for research that bridges the divide between theoretical development and practical application. Real-life testing of BPR frameworks, particularly in complex domains such as public financial management, offers a unique opportunity to validate their utility and address challenges that arise in operational contexts [18,19]. By applying the BPR Assessment Framework to real-life processes in the GPFM domain, this study aims to extend its applicability beyond controlled settings and explore its practical relevance in achieving efficiency, compliance, and standardization in public sector workflows.
3. Methodology
This section outlines the step-by-step approach used to apply the BPR Assessment Framework to real-life processes within the GPFM context. The methodology ensures a comprehensive and systematic evaluation while tailoring the framework's application to meet the unique requirements of public sector workflows.
- Overview of the Framework: The BPR Assessment Framework combines process measurement techniques with clustering methods to categorize processes based on their redesign capacity. The framework’s main phases include problem formulation, metric calculation, clustering, and practical evaluation. A schematic representation of the framework (Figure 1) is provided to offer a clear visualization of its components and interactions.
- Selection of Input Models: The input models for this study were derived from operational processes documented within the Customs Service and the Financial and Economic Crime Unit (S.D.O.E.) of the Greek Ministry of Finance. These processes were modeled using the BPMN 2.0 standard to ensure interoperability and adherence to widely accepted modeling practices. Selection criteria focused on diversity in process complexity, relevance to public sector objectives, and the availability of detailed process documentation. The selected processes include routine administrative workflows and specialized investigative tasks, representing a broad spectrum of operational activities.
- Metric Calculation: The evaluation of each process model involved calculating a set of predefined internal and external quality metrics. Internal metrics, such as Degree of Activity Flexibility (DoAF), Control Flow Complexity (CFC), and Token Split (TS), were used to assess model plasticity. External quality metrics included measures of modifiability and correctness, providing insights into the practical feasibility of process redesign. These metrics were computed using standardized formulas to ensure consistency and comparability with previous studies.
- Clustering and Categorization: The calculated metrics were used as inputs for a clustering analysis, enabling the categorization of processes into groups based on their redesign potential. The K-means clustering algorithm was selected for its effectiveness in grouping data based on similarity[20]. The number of clusters was pre-defined to represent Low, Moderate, and High redesign capacity. Cluster centroids were analyzed to identify representative processes within each category, facilitating targeted recommendations for redesign.
- Practical Evaluation: Representative processes from each cluster were subjected to a detailed practical evaluation to validate the clustering results and assess the framework’s applicability. This step involved examining the feasibility of redesigning these processes and identifying potential improvements in efficiency, compliance, and resource utilization. The practical evaluation provided actionable insights into the benefits and challenges associated with applying the framework in real-world settings.
- Analysis and Reporting: The results of the clustering and practical evaluation phases were synthesized to identify trends and key findings. This analysis highlighted the relationship between process complexity and redesign feasibility, offering valuable guidance for public sector practitioners seeking to implement BPR initiatives.
The BPR Assessment Framework operates in two distinct modes (Figure 2) to address different organizational needs:
- Staging Mode: This mode evaluates a large set or library of processes to determine their redesign potential. Using clustering techniques, processes are grouped into categories (Low, Moderate, and High redesign capacity) based on their internal and external quality metrics. Staging Mode is particularly beneficial for organizations seeking to prioritize redesign efforts across a portfolio of processes.
- Measuring Mode: In this mode, the framework assesses an individual process by measuring its proximity to cluster centroids established during the Staging Mode. This allows practitioners to make informed decisions about the redesign feasibility of a specific process, leveraging insights from the broader process landscape.
Figure 2.
Staging & Measuring Operation Modes.
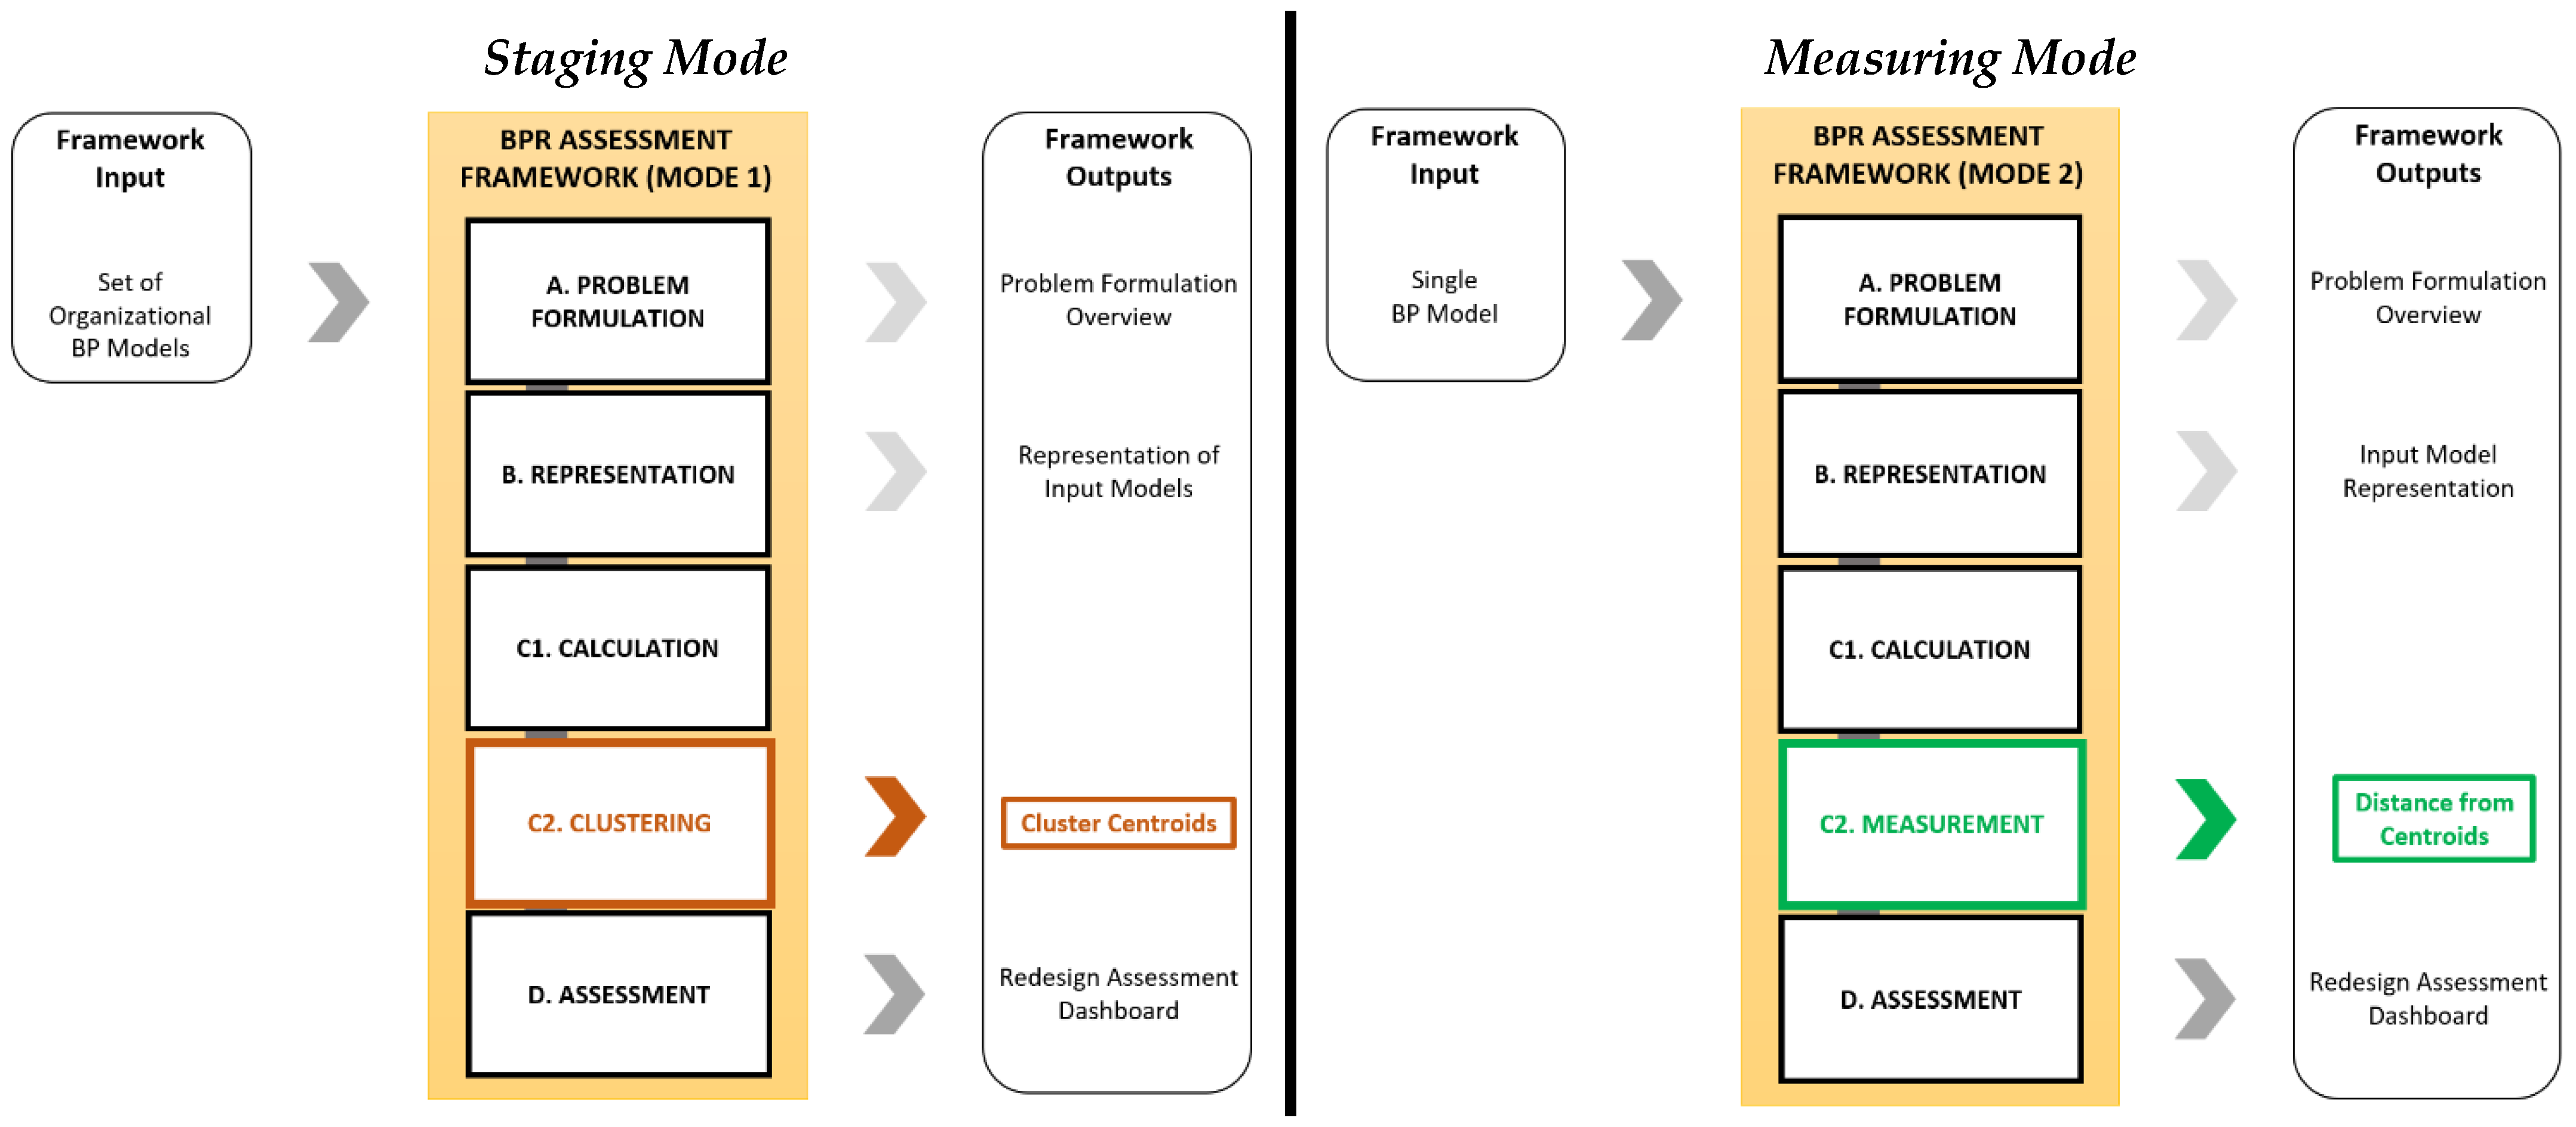
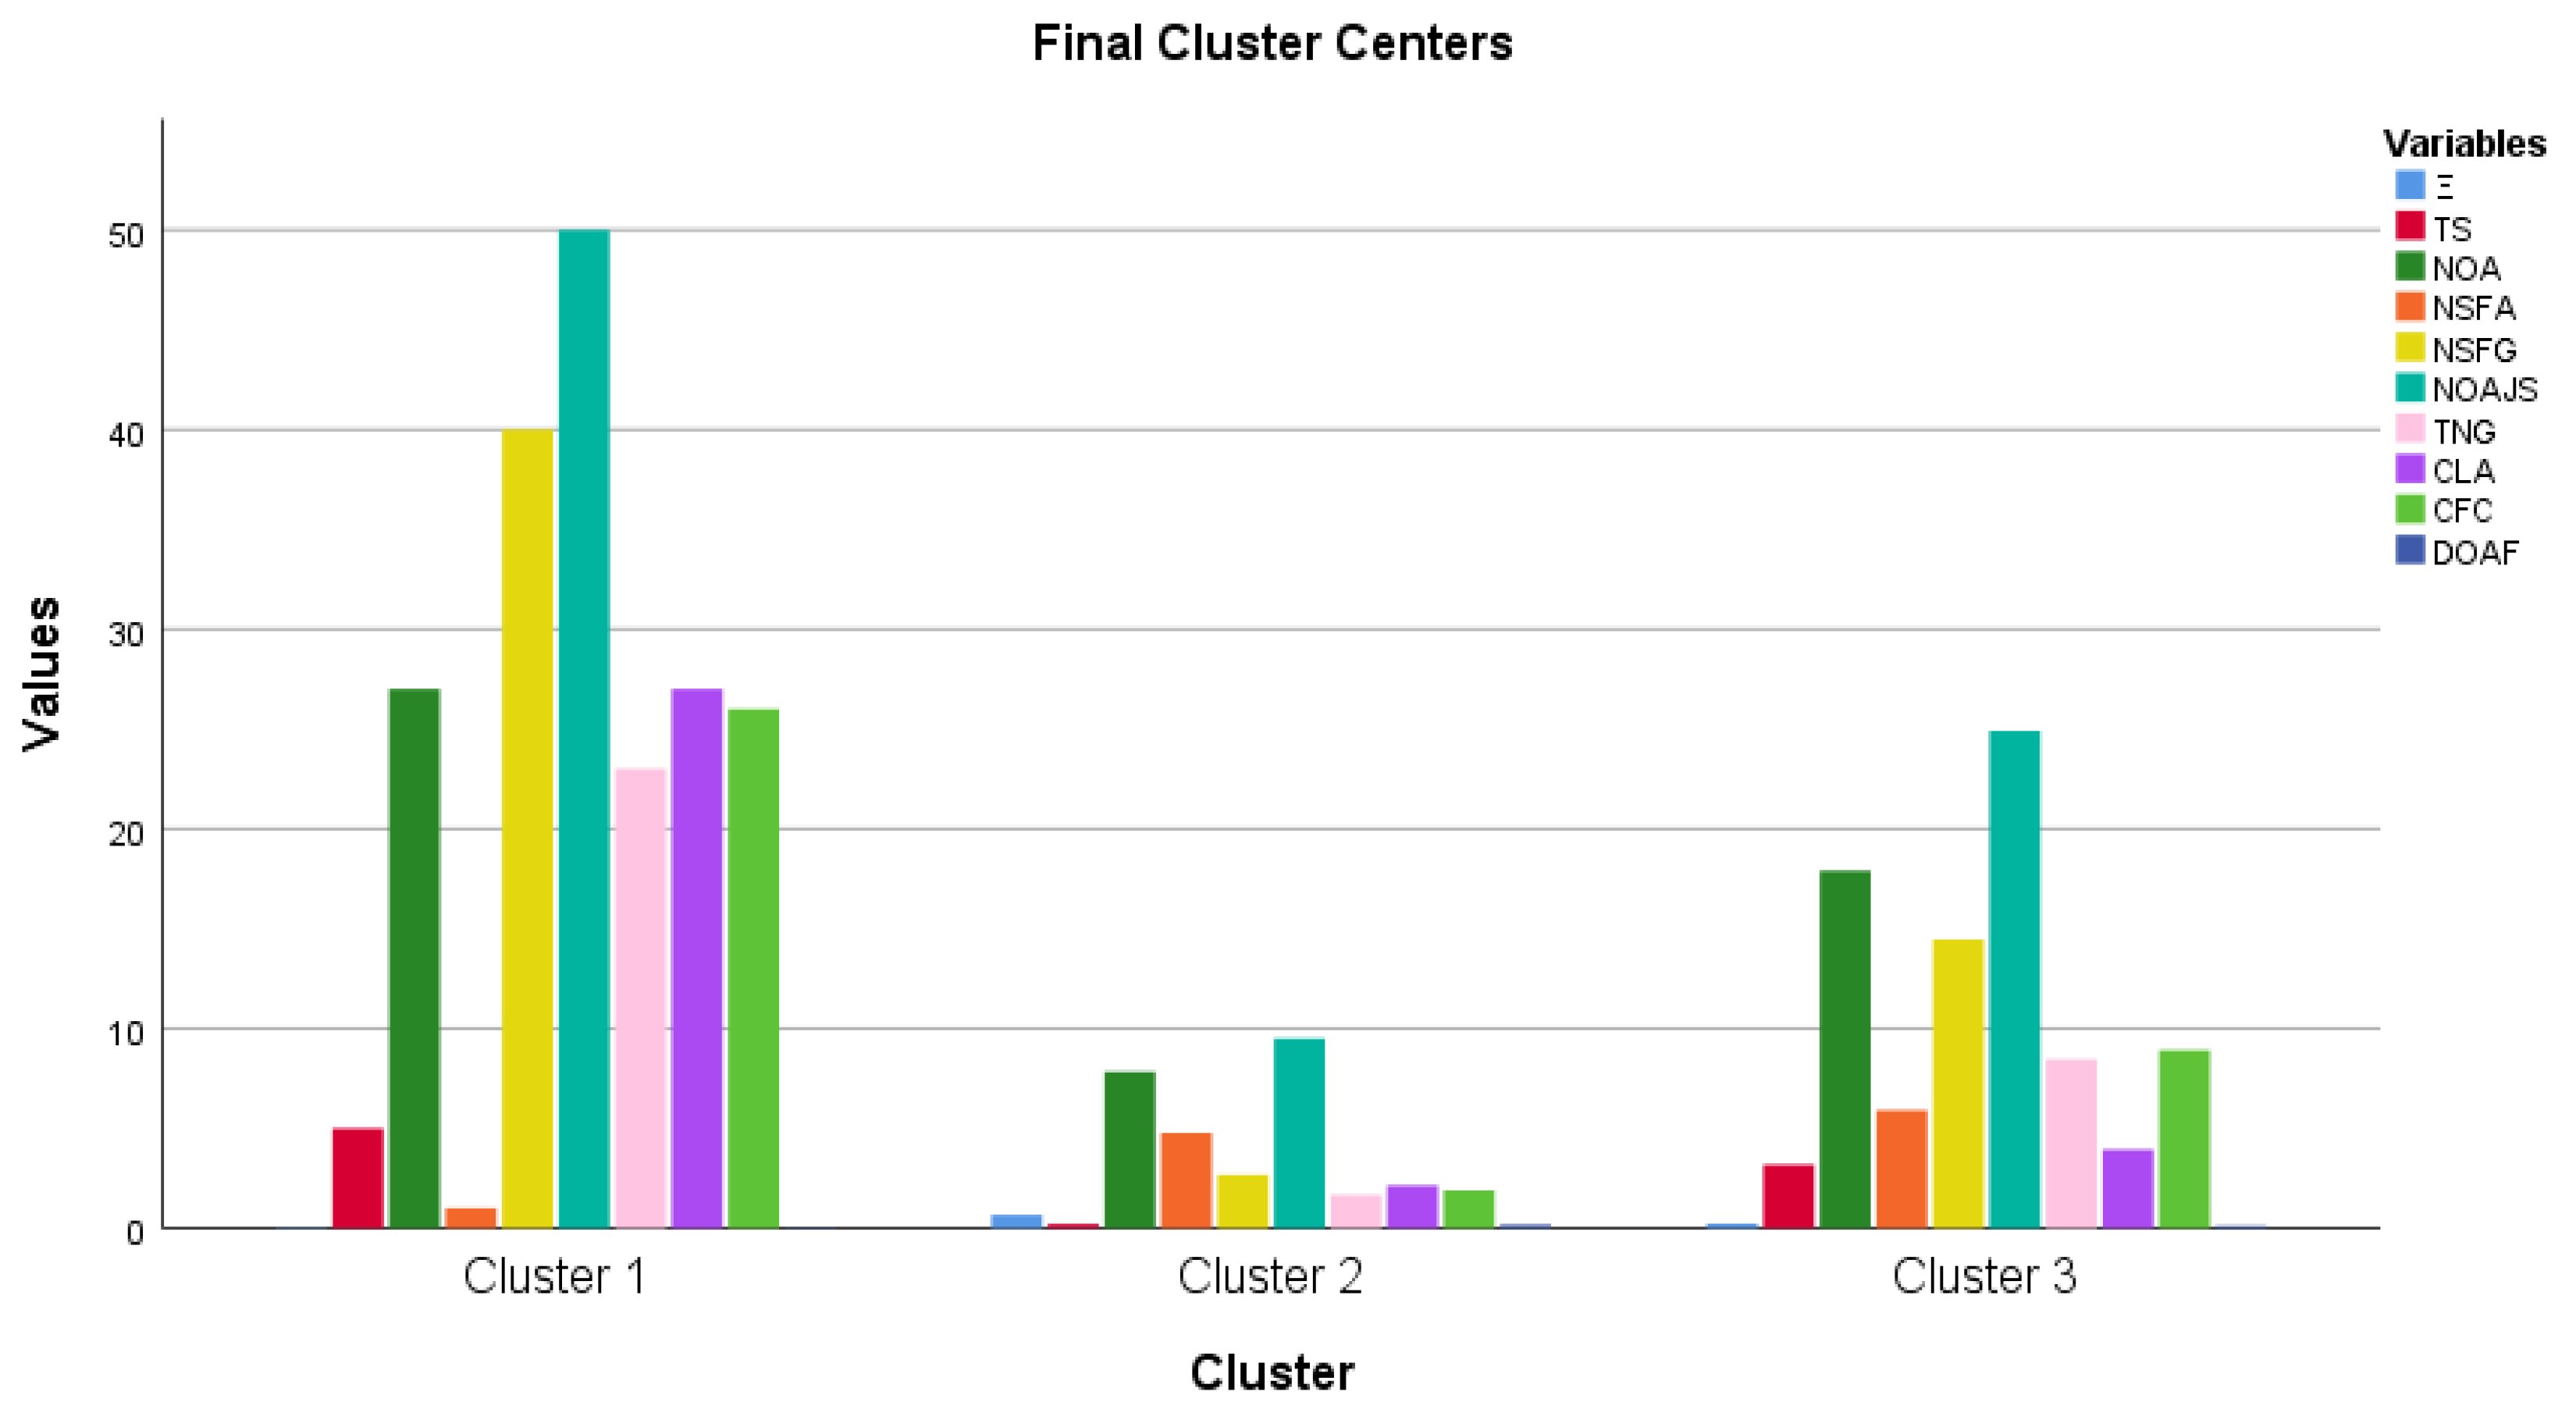
Figure 2.
Bar Chart presenting the Final Cluster Centers of Plasticity.
4. Discussion
The application of the BPR Assessment Framework within the GPFM domain represents a critical step in exploring its practical utility. By systematically applying the framework to real-life processes, this study examines its ability to provide actionable insights for redesign initiatives in the public sector. This section describes the implementation of the framework, detailing how the selected processes were analyzed, and the complexity metrics were calculated.
4.1. Selection of Input Models
The selected BP models derive from the official documentation of the Greek Customs Service and from applied investigation processes of S.D.O.E. agency of the Greek Ministry of Finance. The BPs were created by the authors, in collaboration with MSc students. They were modelled in the BPMN 2.0 standard with the SAP Signavio Process Manager, and they are publicly available at the link: bit.ly/4g50zCP.
4.1.1. Benefits from Adopting BPs in Greek Public Financial Management
The application of real-life BPs provides a multitude of benefits for both agencies, their employees and investigators [21]. The act of modeling and applying BPs is a typical example of digital transformation [22] in the Greek public financial Management, since it fulfils: (a) the need for compliance with the Digital Transformation Strategy 2020-2025 of Greece, (b) the obligation of public agencies to index their administrative processes to the National Process Registry (Law N.4727/2020), and most importantly (c) the need to standardize the administrative and investigation processes of the agencies and to enhance the efficiency and situational awareness of the ones that are tasked with this authority. The employees and investigators get accustomed to the different scenarios that can emerge, they know beforehand which official documents to complete, and they are aware of the applying laws and rules. By using the processes, they examine more cases in the same time periods, a fact that has provably reduced the operating expenses of the agency, both monetary and in human resources. Lastly principal advantage of the BPMN processes is that they can be readily applied by (a) the employees of all Customs Service Agencies and (b) the investigators of the Operational Directorate S.D.O.E. of Attica and other Law Enforcement Agencies that have the same authority.
4.1.2. Customs Service – General Directorate of Customs and Excise Duty
The General Directorate of Customs and Excise Duty with its executive Customs Directorates, its Special Decentralized and Regional Customs Authorities constitute a set of institutional units of the Greek Ministry of Finance that form the Customs Service [23]. The A.A.D.E. authority issued an Official Report in November 2020 under the title “Manual of selected operational processes of the General Directorate of Customs and Excise Duty of A.A.D.E.” (Available in bit.ly/4hlVjeP). The report aimed to provide a set of optimal practices to the customs employees and officials, towards amplifying public benefit and improving the quality of services to citizens and companies. The manual is consisted of a detailed documentation of sixty operational BPs that were identified and recorded for the first time by the A.A.D.E. authority (further details in Apendix).
4.1.3. S.D.O.E. – Greek Ministry of Finance
The Financial and Economic Crime Unit (S.D.O.E.) serves as the primary law enforcement agency under the Ministry of Finance, tasked with combating financial crime and corruption. One of the authors of this study, as a financial crime investigator within S.D.O.E., has modeled key investigative processes using the BPMN 2.0 standard with SAP Signavio Process Manager. These processes, focusing on intellectual property rights infringements and cyber-related offenses, are included in the framework’s analysis (see Appendix). This real-life application emphasizes the role of systematic process modeling in improving investigative efficiency and compliance.
4.2. Calculation of Internal Measures
This step involves the calculation of the internal measures for the sixty-four real-life BPs. In particular, the authors have already selected the DoAF, Ξ, CLA, CFC, NOA, NSFA, NSFG, NoAJS, TNG and TS for predicting the plasticity of input models and GM, GH, AGD, and MGD for Modifiability and Correctness. Prior to the calculation of these metrics, the input models have been represented during the Representation phase (see Figure 1) with the use of the BPD-Graph.
The values of the internal measures are presented in Table 1. The models’ size varies from 2 to 27 activities and from 0 to 23 gateway nodes. Given the observation that both process models in literature and applied administrative processes in Greek public financial Management are in general small to moderate in size, the experimental material has a sufficient variation in size. Their structural complexity also has a sufficient variation since there are models with CFC=0 to CFC=26 and they are comprised of 0 to 40 sequence flows from gateways. The values are rounded to three decimal places and their variability was also analyzed by considering the standard deviation (SD) of each metric. The results of DOAF metric showed a SD close to zero (0.124) which indicates that the data points tend to be very close to the mean, which is also considered very low (0,162). This small variability indicates that most of the diagrams have a very low DOAF value ranging between 0.038 and 0.286.
5. Presentation of Findings
The authors use the cluster analysis evaluation method presented in [4] to group the BP models in categories, based on the metric values indicating plasticity and external quality. The selected parameters are K-means algorithm, three clusters, Euclidean distance for proximity and random initialization method.
5.1. Clustering of Input Models Based on Plasticity
The clustering of the set of sixty-four real-life BPs based on their plasticity revealed three discrete clusters - categories - of models. Convergence achieved due to no change in cluster centers with a maximum absolute coordinate change for any center being zero after 2 iterations. Table 2 presents the final cluster centers for each of the selected internal measures and the Analysis of Variance (ANOVA) table, which shows how the sum of squares is distributed according to the source of variation, and hence the mean sum of squares. The F-value in the ANOVA is calculated as the fraction of the variation between sample means to the variation within the samples. As it is evident, the F-values of the NSFA and DOAF metrics are very low (1,833 and 1,466) which entails that these variables contribute the least to the cluster solution. This is also indicated by their large sig. value, 0,169 and 0,239 respectively, which are not close to the acceptable <0,05 significance level. On the other hand, CLA, NOAJS, NSFG and TNG are the variables with large F values that provide the greatest separation between the three clusters.
Figure 3 presents a bar chart from the pivot table with the three clusters and an indication of their center values. What is evident is that for almost all measures, cluster 2 refers to low values, cluster 3 to moderate values and cluster 1 to high values.
As presented in [4], the plasticity of models refers to the applicability of the RESEQ and PAR heuristics and based on the conducted experiments there is a positive or negative correlation as presented in Table 2. This correlation indicates that the applicability of RESEQ is more efficient for models with high values of Ξ, NOA, NSFA, CFC and DOAF, and low CLA, while the applicability of PAR is more efficient for low values of TS, NSFG, NOAJS, TNG, CLA and CFC and high NSFA. Since the metrics depicting plasticity are not contradicting in nature – except in the case of CFC - the authors assume that the correlation of the metrics with overall plasticity is the one presented in Table 2, Regarding CFC, a low value denotes a more efficient application of PAR heuristic, while a high value denotes high applicability of RESEQ.
By observing how each metric evolves between the three clusters and by considering the correlation of the metrics with the overall plasticity in Table 3, the authors assume that cluster 1 refers to the models with low plasticity, cluster 3 to the models with moderate plasticity and cluster 2 to the models with a high plasticity. This cluster sequence is confirmed by the fact that the correlation of all metrics is consistent, except for NOA metric, as indicated in the last column of Table 3.
According to the results, which are further presented in Table A3 (Cluster Membership) of the Appendix, most of the cases have the necessary capacity for BPR and there is a high possibility that the application of RESEQ or PAR heuristics would be efficient. This entails that they are considered as good candidate models for BPR, except for models 2.11, 1.3, 1.5, 1.12, 2.10, 2.16, 3.3, 3.8, 4.13, 5.1, 5.3 and 5.4 that have a low to moderate plasticity. The same procedure was followed for classifying the BP models according to their external quality.
5.2. Clustering of Input Models Based on External Quality.
The clustering of the set of sixty-four real-life BPs based on their external quality also revealed three discrete clusters of models. Table 4 presents the final cluster centers for each of the selected internal measures and the ANOVA table. The F-values in the ANOVA indicate that all four metrics contributed to the cluster solution, where GM (108,517) had the biggest and GH (7,308) the smallest contribution to the separation of the clusters. All sig. values are under the acceptable <0,05 significance level.
Figure 3 presents a bar chart from the pivot table with the three clusters and an indication of their center values. What is evident is that for almost all measures, cluster 1 refers to low values, cluster 3 to moderate values and cluster 2 to high values.
As presented in [11] the external quality measures of modifiability and correctness have a negative correlation to all four selected internal measures, namely AGD, MGD, GH and GM. This means that low metric values entail high modifiability and correctness. By observing how each metric evolves between the three clusters in Table 4 and by considering the negative correlation of the metrics with modifiability, correctness and therefore external quality, the authors assume that cluster 2 refers to the models with low quality, cluster 3 to the models with moderate quality and cluster 1 to the models with a high quality. This cluster sequence is consistent to the correlation of AGD, MGD and GH metrics, except for GM metric, where it is not evident how the metric evolves between clusters. In total, it is observed that most of the process models are considered to have a high external quality for BPR, since they are both easy to modify and have a low probability of containing semantic and syntactical errors. This fact renders them as good candidates for BPR except for models labelled 3.8, 1.3, 2.5, 2.6, 2.11, 2.16 and 4.13 that have a low to moderate external quality.
6. Practical Evaluation of Models
This section presents the practical evaluation of real-life business processes models by using the two operational modes of the BPR Assessment Framework.
6.1. Staging Mode: Practical Evaluation of Models
The repository of real-life BP models from the Greek Customs Service and the S.D.O.E. authority of the Greek Ministry of Finance was classified in the previous sections regarding the plasticity and external quality for BPR. In total, the models were categorized differently in terms of plasticity or quality, nevertheless, both clustering procedures proved to be consistent with each other, leading to similar results. The authors introduce three discrete categories for BPR Capacity, i.e., “Low”, “Moderate” and “High” for cases that were categorized accordingly in both plasticity and external quality. The two intermediate categories “Low to Moderate” and “Moderate to High” BPR Capacity account for BP cases that had either of the two scorings for plasticity and the other scoring for external quality (Table 5). Regarding the set of models, fifty out of sixty-four models proved to have a high BPR capacity, nine models had a moderate to high scoring, four models had a moderate scoring and lastly two models had the worst scoring, having low to moderate BPR capacity. Right after, a small presentation of two BP cases with low and high BPR capacity is provided to demonstrate how this categorization facilitates decision-making.
6.1.1. Case Study with Low BPR Capacity
Due to fact that no BP case had a low scoring in both model plasticity and external quality, the authors assume that model 2.11 can serve as typical examples of low BPR capacity from the available real-life BP cases. The BP case refers to the “Submission of a request for intervention by Customs Authorities in the context of customs enforcement of Intellectual Property Rights” (Figure 4). The process accounts for different applications regarding Application for Action (AFA) by Intellectual Property Rights (IPR) holders and there are discrete subprocesses in the form of XOR gateway branches. This fact denotes that the process has its activities distributed along different XOR branches which entails that in many cases these activities are bound to implicit constraints.
The metric values of this BP model are presented in Table 6 in contrast to the thresholds presented in [11,24]. The values visibly denote that the model is not a good candidate for BPR. Four out of six metrics show that the application of RESEQ would be highly inefficient and at the same time four out of seven metrics indicate a highly inefficient and two out of seven metrics an inefficient PAR applicability. Also, three out of four metrics denote a high probability of errors in the model, while the only good measures refer to the modifiability of the model in general.
In total, the model has been categorized through cluster analysis to have a low BPR capacity, a fact that is confirmed by the overall view of the model’s metric values. A process modeler would be discouraged to proceed with BPR, as it would most probably be inefficient, leading to unnecessary time and resource consumption.
6.1.2. Case Study with High BPR Capacity
Many BP cases of the repository had a high scoring in both plasticity and external quality and model 4.6 is a typical example of high overall BPR capacity. The BP case refers to the “Authorization Process for the Operation of Small (two-day) Distilleries” (Figure 5).
The model is relatively small is size having 14 activities and 4 gateways all of which are parallel nodes (GH=0). There is a low control flow complexity (CFC=2), since only 2 AND split gateways exist in the model and only 6 sequence flows from gateways. The model is highly structured with a GM equal to zero and more than half of the activities are ordered sequentially (Ξ=0,526), a fact that reduces the possibility of implicitly constrained activities, and conversely increases the applicability of RESEQ or PAR.
The metric values are presented in Table 7, where the model is a good candidate for BPR. In specific, half of the metrics indicate a very efficient applicability of RESEQ, while one metric shows a moderately efficient applicability and two metrics a rather inefficient one. Regarding PAR heuristic the results are even more clear, since four out of seven metrics indicate a moderately efficient applicability, and the rest three metrics show a rather to very efficient applicability. As for the external quality, the model is either easy or very easy to modify and at the same time all of the metrics denote a small probability of errors. In total, the metric values clearly indicate that the BP case has a high plasticity and external quality, which entails that it is considered a very good candidate model for BPR.
6.2. Measuring Mode: Practical Evaluation of Models
In the selection step, two real-life BPs from the Greek public financial Management are used as input models towards assessing their BPR capacity. The BP cases have been documented by the General Directorate of Tax Administration of the A.A.D.E. authority and published in December 2021 in an Official Report under the title “Manual of selected operational processes of the General Directorate of Tax Administration” (Available in t.ly/7ORr).
6.2.1. Case Study with Low BPR Capacity
The case study used as an example of a BP model with low BPR capacity is retrieved from the report of A.A.D.E. authority, it is enumerated as 2.3 and titled “Composition of Audit Reports and Issuance of Tax Imposition” (Figure 6).
The selected internal measures were calculated for the model and are presented in Table 8 in comparison to the thresholds of each measure. The model is relatively large with 35 activities and 16 gateways. Even though it has many gateways, the control flow complexity is relatively moderate (CFC=9) due to high structuredness, since only two AND split gateways are not followed by merging nodes. Based on the report that the case was retrieved, almost all activities are bound to precedence constraints, a fact that is evident in the very low DOAF value. What is also observed is that AGD has a value very close to 3 (3,125), which in combination with the high TNG entails that most of the gateways have two ingoing and one outgoing arc or vice versa. The MGD is valued 4 and GM is 6, which is due to the three AND split gateways that are not followed by merge nodes. Lastly GH is 0,511 since the model is composed of 12 XOR and 4 AND gateways. Based on the methodology of the Measuring Mode, the authors calculate the Euclidean distance of the model from the three cluster centroids of Plasticity and External Quality presented in Table 2 and Table 4. The distances are given in Table 9:
Regarding plasticity, it is shown that the proximity of the model is smaller to the centroid of cluster 1 (d=37,402), which means that the model is categorized to have low plasticity. Given the two other calculated distances, the model is closer to the cluster of moderate plasticity (d=38,468). In the same sense, measuring the distance of the model from the clusters of external quality, resulted in appointing the model to cluster 3 (d=0,908), which includes the models with moderate quality. From the two other distances, the model is closer to the cluster with the models of high external quality (d=6,161). In total, the case model is categorized to have a low plasticity and moderate external quality for BPR.
The classification of the model to categories of plasticity and external quality is consistent to the comparison of the model’s metric values to the thresholds in [5,25] and [11]. What one can observe is that half of the measures indicate inefficient and the other half efficient applicability of RESEQ, and at the same time most of the measures (5 out of 7) indicate inefficient applicability of PAR. Thus, the model is considered to have low plasticity which is in accordance with the classification from the Measuring Mode. Regarding external quality, the measures indicate that the model is easy or very easy to modify, and at the same time all metric values indicate a high probability of errors in the model. These contradicting results are in accordance with the classification of the model to the cluster of moderate external quality.
6.2.2. Case Study with High BPR Capacity
The case study used as an example of a BP model with high BPR capacity is enumerated as 2.9 and titled “Registry to the Fiscal Records and Initiation of Personal Company Operation” (Figure 7).
The internal measures were calculated for the model and are presented in Table 10. The model is small with 7 activities and 6 gateways. The control flow complexity is very low (CFC=3), due to the existence of three XOR split gateway nodes with each one having two branches. The model has a very low Sequentiality (Ξ=0,066) ratio, which indicates that the model has the minimum sequential activities. This is also evident by the high CLA value (CLA=7) which is the ratio of NOA to NSFA and indicates that only one sequence flow exists between the 7 activities of the model. What is also observed is that all gateways have a degree of three, meaning that they either split or merge two branches (AGD=3, MGD=3). Lastly GH equals zero since all gateway nodes are XOR and GM also equals zero indicating a highly structured model. The authors calculate the Euclidean distance of the model from the three cluster centroids of Plasticity and External Quality:

Table 10.
Metric Values of a BP Case with High BPR Capacity.
| Metric | Ξ | TS | NOA | NSFA | NSFG | NoAJS | TNG | CLA | CFC | DOAF | |||
|---|---|---|---|---|---|---|---|---|---|---|---|---|---|
| Plasticity Type | RESEQ | PAR | RESEQ | RESEQ | PAR | PAR | PAR | PAR | RESEQ | PAR | RESEQ | PAR | RESEQ |
| Value | 0,066 | 0 | 7 | 1 | 1 | 9 | 13 | 6 | 7 | 7 | 3 | 3 | 0,143 |
| Metric | AGD | MGD | GH | GM | |||||||||
| Quality Type | MOD | COR | MOD | COR | MOD | COR | MOD | COR | |||||
| Value | 3 | 3 | 3 | 3 | 0 | 0 | 3 | 0 | |||||
Table 11.
Distance of Case Study from Cluster Centroids.
| Plasticity | External Quality | |||||
|---|---|---|---|---|---|---|
| Centroid 1 (Low) | Centroid 3 (Moderate) | Centroid 2 (High) | Centroid 2 (Low) | Centroid 3 (Moderate) | Centroid 1 (High) | |
| Distance | 63.032 | 19.369 | 10.540 | 9.116 | 6.877 | 2.017 |
Regarding plasticity, it is shown that the proximity of the model is smaller to the centroid of cluster 2 (d=10,540), which means that the model is categorized to have high plasticity. Given the two other calculated distances, the model is closer to the cluster of moderate plasticity (d=19,369). In the same sense, measuring the distance of the model from the clusters of external quality, resulted in appointing the model to cluster 1 (d=2,017), which includes the models with high quality. From the two other distances, the model is closer to the cluster with the models of moderate external quality (d=6,877). In total, the case model is categorized to have a high plasticity and external quality for BPR.
The classification of the model is relatively consistent to the comparison of the model’s metric values to the metric thresholds. Regarding plasticity, we get contradicting results due to the low Sequentiality of activities. Specifically, in all measures the model seems to have a rather inefficient applicability of RESEQ, and at the same time a rather or highly efficient applicability of PAR heuristic. In total the plasticity of the model is regarded as high, having though a low proximity to the cluster of moderate plasticity. A modeler could potentially focus more on the application of PAR heuristic in the case that BPR is decided to be implemented. Regarding external quality, the classification is very clear, since all measures indicate a very easily modifiable model and at the same time a low probability of errors. The classification clearly denotes that the model has the necessary external quality to be redesigned.
7. Discussion
The findings from the application of the BPR Assessment Framework to real-life processes in the GPFM domain provide valuable insights into its practical relevance and challenges. A key observation from the study is the framework’s ability to categorize processes effectively based on their redesign capacity. This categorization aids practitioners in prioritizing redesign efforts, enabling a more strategic approach to improving organizational efficiency and compliance.
One important strength of the framework lies in its systematic use of internal and external quality metrics. Metrics such as Degree of Activity Flexibility (DoAF) and Control Flow Complexity (CFC) have proven instrumental in assessing the structural characteristics of processes. By integrating these metrics with clustering techniques, the framework offers a robust mechanism for identifying processes that are most suitable for redesign. The practical evaluation of representative processes highlights the tangible benefits of applying the framework. For example, processes categorized as high redesign capacity demonstrated opportunities for significant improvements in efficiency and compliance. Additionally, the ability to analyze complex workflows, such as those within the Customs Service and S.D.O.E., underscores the framework’s adaptability to diverse operational contexts.
However, the study also reveals certain limitations. The framework’s reliance on pre-defined metrics and clustering algorithms may not fully capture the nuances of all process types. Furthermore, the application in the GPFM domain, while comprehensive, does not account for potential variations in other sectors or international contexts. Future work should address these limitations by expanding the framework’s scope and refining its metrics to enhance its applicability across broader domains. The study also highlights the importance of process documentation and modeling standards. The consistent use of BPMN 2.0 facilitated the seamless application of the framework, emphasizing the need for standardized practices in process management. Furthermore, the clustering results point to a strong correlation between structural complexity and redesign feasibility, providing actionable insights for practitioners.
In conclusion, the BPR Assessment Framework demonstrates significant potential for enhancing BPR efforts in the public sector. Its systematic methodology, grounded in robust metrics and clustering techniques, offers a valuable tool for practitioners seeking to optimize organizational workflows. While challenges remain, the findings from this study provide a strong foundation for future research and practical applications.
8. Conclusion
This study explored the application of the BPR Assessment Framework to real-life processes within the GPFM domain. By systematically evaluating and categorizing processes based on their redesign potential, the framework demonstrated its utility as a practical tool for guiding BPR initiatives. The results underscore the framework’s ability to identify processes with high potential for redesign, providing actionable insights that can enhance organizational efficiency and compliance. The use of internal and external quality metrics, combined with clustering techniques, proved effective in assessing the structural characteristics of processes. These findings highlight the importance of a data-driven approach to BPR, emphasizing the role of systematic methodologies in decision-making. The practical evaluation of representative processes further reinforced the framework’s applicability, showcasing its capacity to address the complexities of real-world workflows. While the study focused on the GPFM domain, the framework’s principles are broadly applicable to other sectors and contexts. Future research should explore its scalability and adaptability, refining its metrics and methodologies to meet the needs of diverse organizational environments. By doing so, the framework can become a cornerstone of modern BPR practices, driving continuous improvement and innovation across industries.
In conclusion, the BPR Assessment Framework represents a significant advancement in the field of process management. Its systematic approach, grounded in robust theoretical foundations, provides a valuable resource for practitioners and researchers alike. By bridging the gap between theory and practice, this study contributes to the ongoing evolution of BPR methodologies, paving the way for more effective and efficient organizational processes.
Supplementary Materials
The following supporting information can be downloaded at the website of this paper posted on Preprints.org.
Author Contributions
For research articles with several authors, a short paragraph specifying their individual contributions must be provided. The following statements should be used “Conceptualization, X.X. and Y.Y.; methodology, X.X.; software, X.X.; validation, X.X., Y.Y. and Z.Z.; formal analysis, X.X.; investigation, X.X.; resources, X.X.; data curation, X.X.; writing—original draft preparation, X.X.; writing—review and editing, X.X.; visualization, X.X.; supervision, X.X.; project administration, X.X.; funding acquisition, Y.Y. All authors have read and agreed to the published version of the manuscript.” Please turn to the CRediT taxonomy for the term explanation. Authorship must be limited to those who have contributed substantially to the work reported.
Funding
This research received no external funding.
Conflicts of Interest
The authors declare no conflicts of interest.
References
- Sidorova, A.; Isik, O. Business Process Research: A Cross-Disciplinary Review. Business Process Management Journal 2010, 16, 566–597. [Google Scholar] [CrossRef]
- Tsakalidis, G.; Vergidis, K. Business Process Redesign: A Systematic Review of Evaluation Approaches. Decision Making: Applications in Management and Engineering 2024, 7, 79–98. [Google Scholar] [CrossRef]
- Wang, C.-N.; Vo, T.T.B.C.; Hsu, H.-P.; Chung, Y.-C.; Nguyen, N.T.; Nhieu, N.-L. Improving Processing Efficiency through Workflow Process Reengineering, Simulation and Value Stream Mapping: A Case Study of Business Process Reengineering. Business Process Management Journal 2024, 30, 2482–2515. [Google Scholar] [CrossRef]
- Tsakalidis, G.; Nousias, N.; Vergidis, K. BPR Assessment Framework: Staging Business Processes for Redesign Using Cluster Analysis. In Decision Support Systems XIII. Decision Support Systems in An Uncertain World: The Contribution of Digital Twins; Liu, S., Zaraté, P., Kamissoko, D., Linden, I., Papathanasiou, J., Eds.; Springer Nature Switzerland: Cham, 2023; pp. 97–110. [Google Scholar]
- Tsakalidis, G.; Vergidis, K.; Tambouris, E. Business Process Model Plasticity: Measuring the Capacity to Redesign Prior to Implementation. In Proceedings of the 2021 IEEE 23rd Conference on Business Informatics (CBI); IEEE, 2021; Vol. 1, pp. 31–41. [Google Scholar]
- Hammer, M.; Champy, J. Reengineering the Corporation: A Manifesto for Business Revolution. Business Horizons 1993, 36, 90–91. [Google Scholar] [CrossRef]
- Davenport, T.H. Process Innovation: Reengineering Work Through Information Technology; Harvard Business Press: Boston, Massachusetts, 1993; ISBN 978-1-4221-6066-4. [Google Scholar]
- Melão, N.; Pidd, M. A Conceptual Framework for Understanding Business Processes and Business Process Modelling. Information Systems Journal 2000, 10, 105–129. [Google Scholar] [CrossRef]
- Reijers, H.A.; Mansar, S.L. Best Practices in Business Process Redesign: An Overview and Qualitative Evaluation of Successful Redesign Heuristics. Omega 2005, 33, 283–306. [Google Scholar] [CrossRef]
- Adesola, S.; Baines, T. Developing and Evaluating a Methodology for Business Process Improvement. Business Process Management Journal 2005. [Google Scholar] [CrossRef]
- Sánchez-González, L.; García, F.; Ruiz, F. BPMIMA: Business Process Model Improvement Based on Measurement Activities; University of Castilla-La Mancha: Ciudad Real, Spain, 2015. [Google Scholar]
- Zur Muehlen, M.; Ho, D.T.-Y. Risk Management in the BPM Lifecycle. In Proceedings of the BPM’05: Proceedings of the Third international conference on Business Process Management; Springer: Nancy, France, 2005; pp. 454–466. [Google Scholar]
- Al-Anqoudi, Y.; Al-Hamdani, A.; Al-Badawi, M.; Hedjam, R. Using Machine Learning in Business Process Re-Engineering. Big Data and Cognitive Computing 2021, 5, 61. [Google Scholar] [CrossRef]
- Vergidis, K.; Tiwari, A.; Majeed, B. Business Process Analysis and Optimization: Beyond Reengineering. IEEE Transactions on Systems, Man, and Cybernetics, Part C: Applications and Reviews 2008, 38, 69–82. [Google Scholar] [CrossRef]
- Fotoglou, C.; Tsakalidis, G.; Vergidis, K.; Chatzigeorgiou, A. Complexity Clustering of BPMN Models: Initial Experiments with the K-Means Algorithm. In Decision Support Systems X: Cognitive Decision Support Systems and Technologies; Moreno-Jiménez, J.M., Linden, I., Dargam, F., Jayawickrama, U., Eds.; Springer International Publishing: Zaragosa, Spain, 2020; pp. 57–69. [Google Scholar]
- Lohrmann, M.; Reichert, M. Effective Application of Process Improvement Patterns to Business Processes. Softw Syst Model 2016, 15, 353–375. [Google Scholar] [CrossRef]
- Trkman, P. The Critical Success Factors of Business Process Management. International journal of information management 2010, 30, 125–134. [Google Scholar] [CrossRef]
- Cho, M.; Song, M.; Comuzzi, M.; Yoo, S. Evaluating the Effect of Best Practices for Business Process Redesign: An Evidence-Based Approach Based on Process Mining Techniques. Decision Support Systems 2017, 104, 92–103. [Google Scholar] [CrossRef]
- Satyal, S.; Weber, I.; Paik, H.; Di Ciccio, C.; Mendling, J. Business Process Improvement with the AB-BPM Methodology. Information Systems 2019, 84, 283–298. [Google Scholar] [CrossRef]
- Ahmed, M.; Seraj, R.; Islam, S.M.S. The K-Means Algorithm: A Comprehensive Survey and Performance Evaluation. Electronics 2020, 9, 1295. [Google Scholar] [CrossRef]
- Tsakalidis, G.; Vergidis, K. Mitigating Financial Cybercrime with BPMN-Based Standardised Investigation Procedures. ERCIM News 2022, 48. [Google Scholar]
- Baiyere, A.; Salmela, H.; Tapanainen, T. Digital Transformation and the New Logics of Business Process Management. European Journal of Information Systems 2020, 29, 238–259. [Google Scholar] [CrossRef]
- Independent Authority for Public Revenue (A.A.D.E.) Customs Service – General Directorate of Customs and Excise Duty. Available online: https://www.aade.gr/en/teloneia/customs-service-general-directorate-customs-and-excise-duty-0.
- Tsakalidis, G.; Nousias, N.; Madas, M.; Vergidis, K. Systematizing Business Process Redesign Initiatives with the BPR:Assessment Framework; IEEE: Amsterdam, The Netherlands, 2022. [Google Scholar]
- Kokkinis, V. Business Process Model Plasticity: Inclusion and Evaluation of the PAR Heuristic. Master’s Thesis, University of Macedonia, Thessaloniki, Greece, 2022. [Google Scholar]
Figure 1.
BPR Assessment Framework [4].
Figure 1.
BPR Assessment Framework [4].
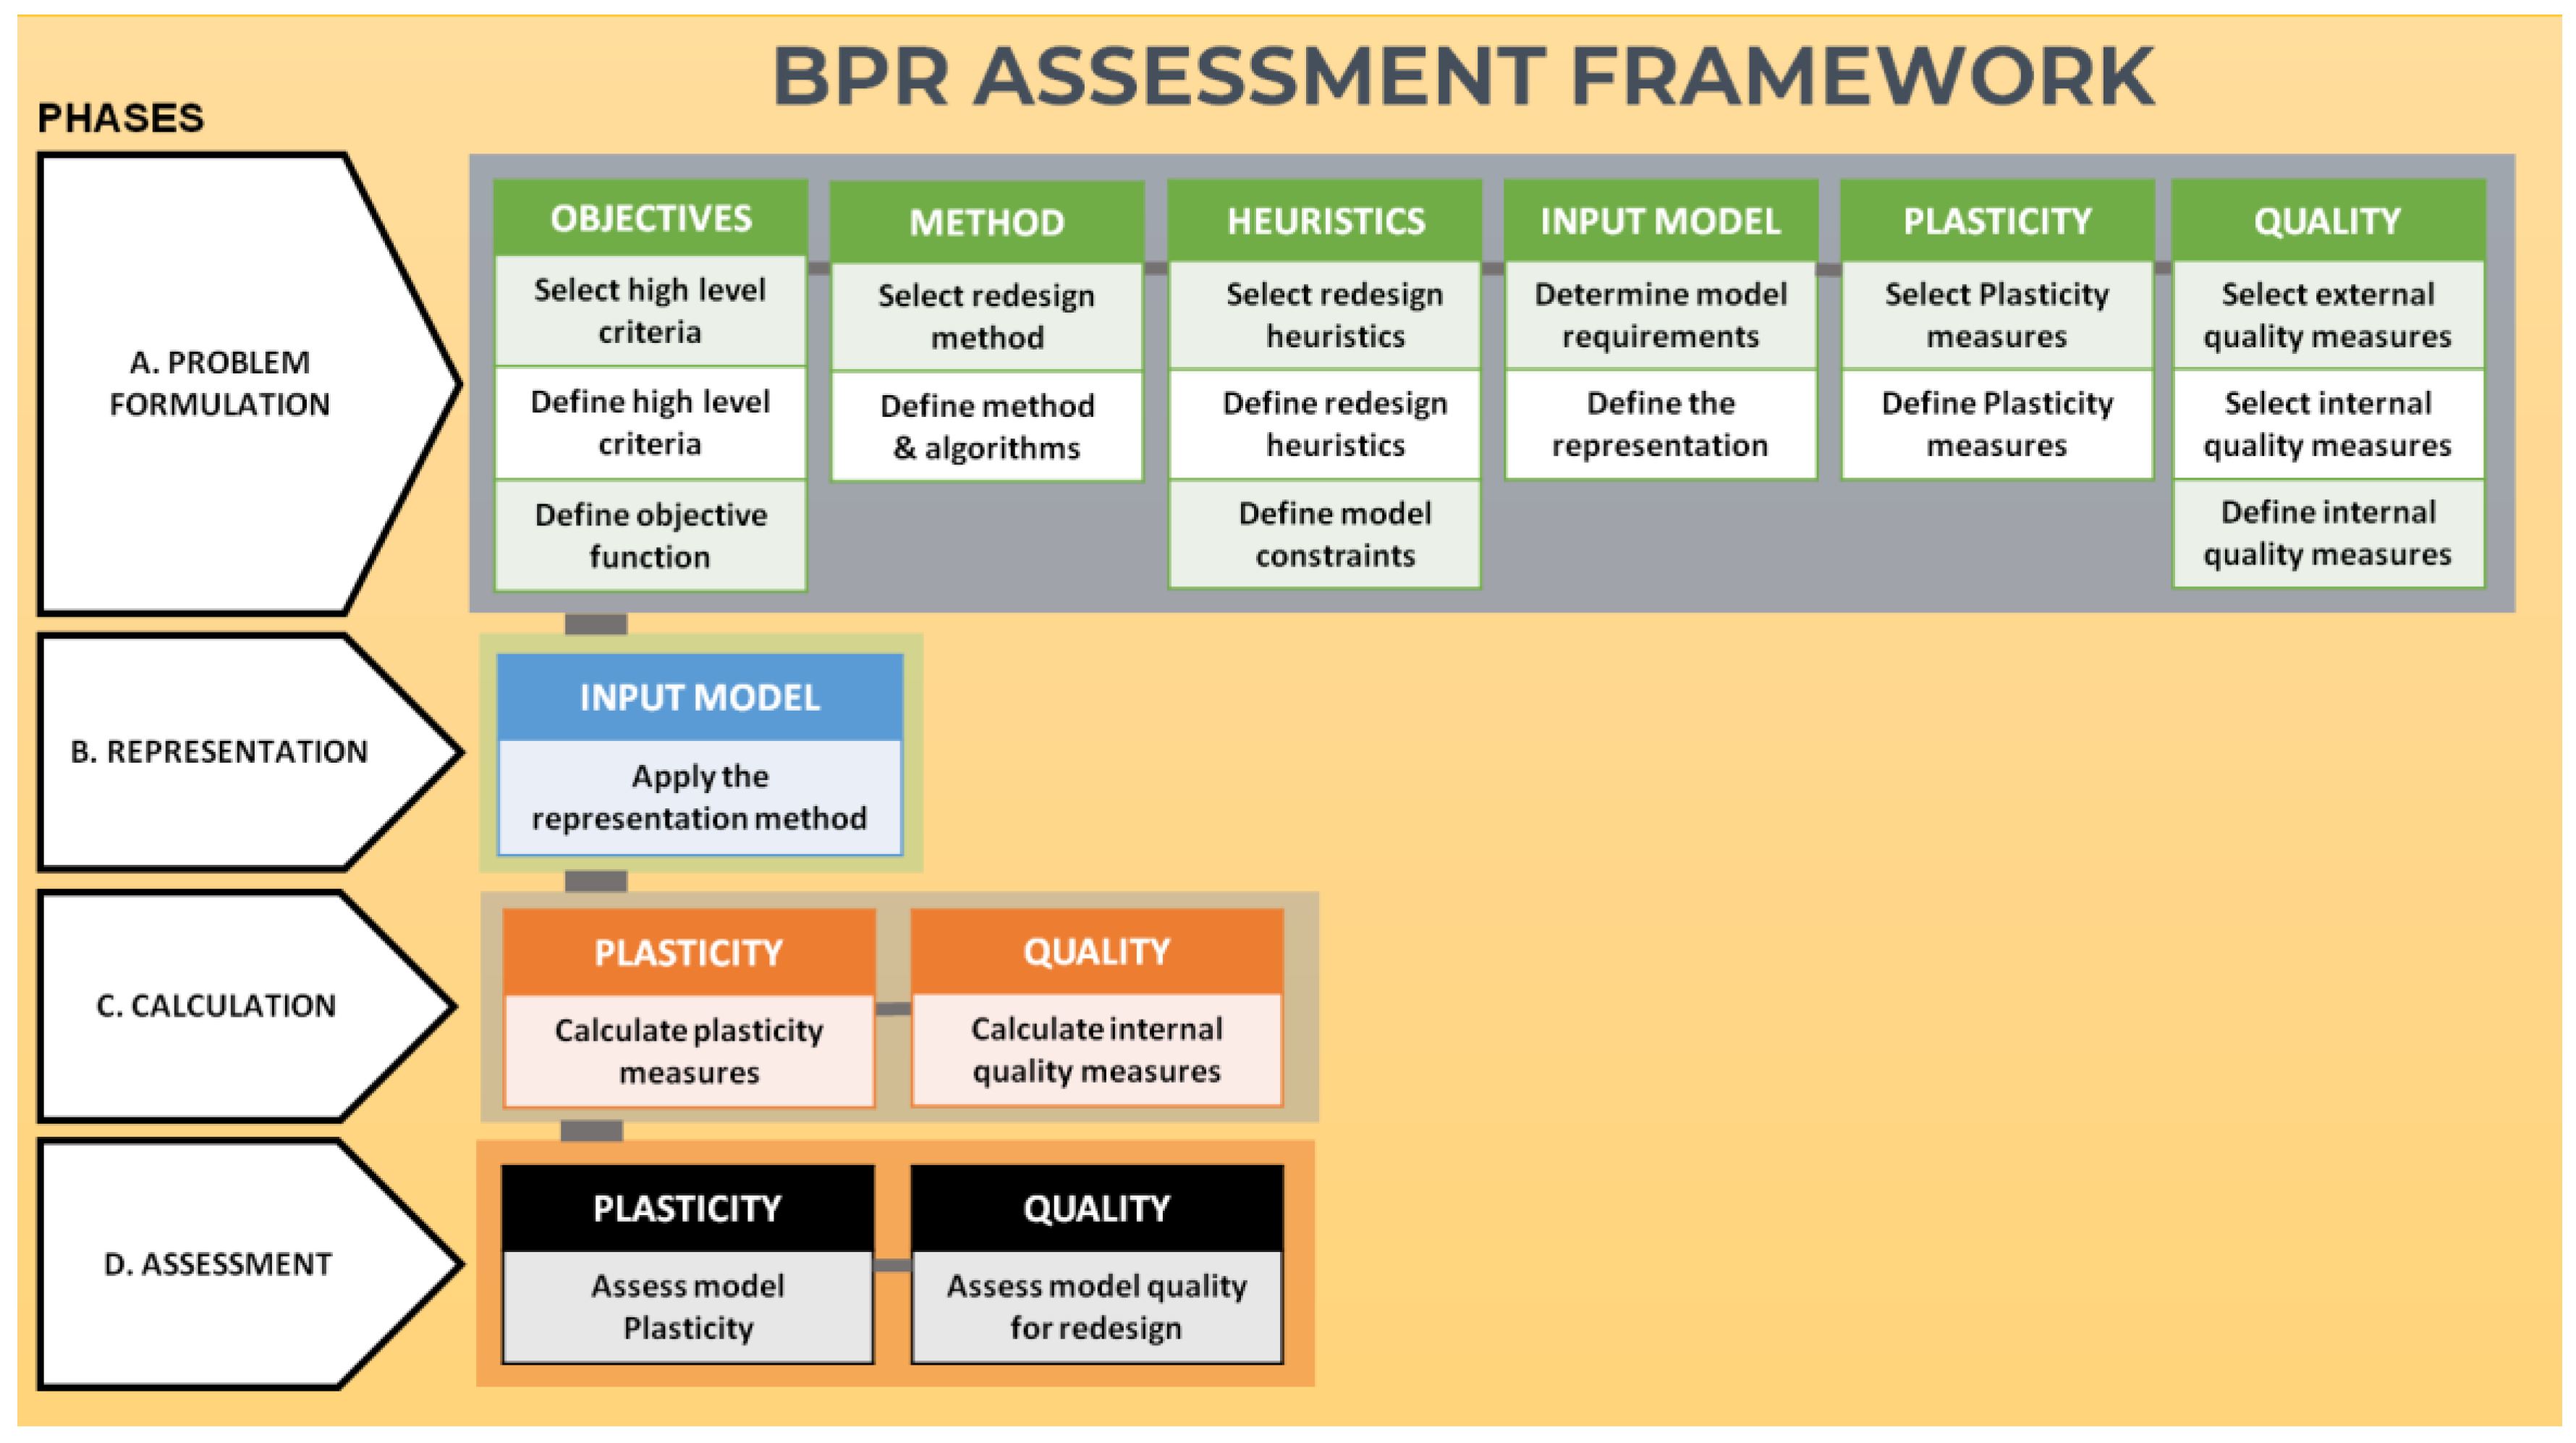
Figure 3.
Bar Chart presenting the Final Cluster Centers of Quality.
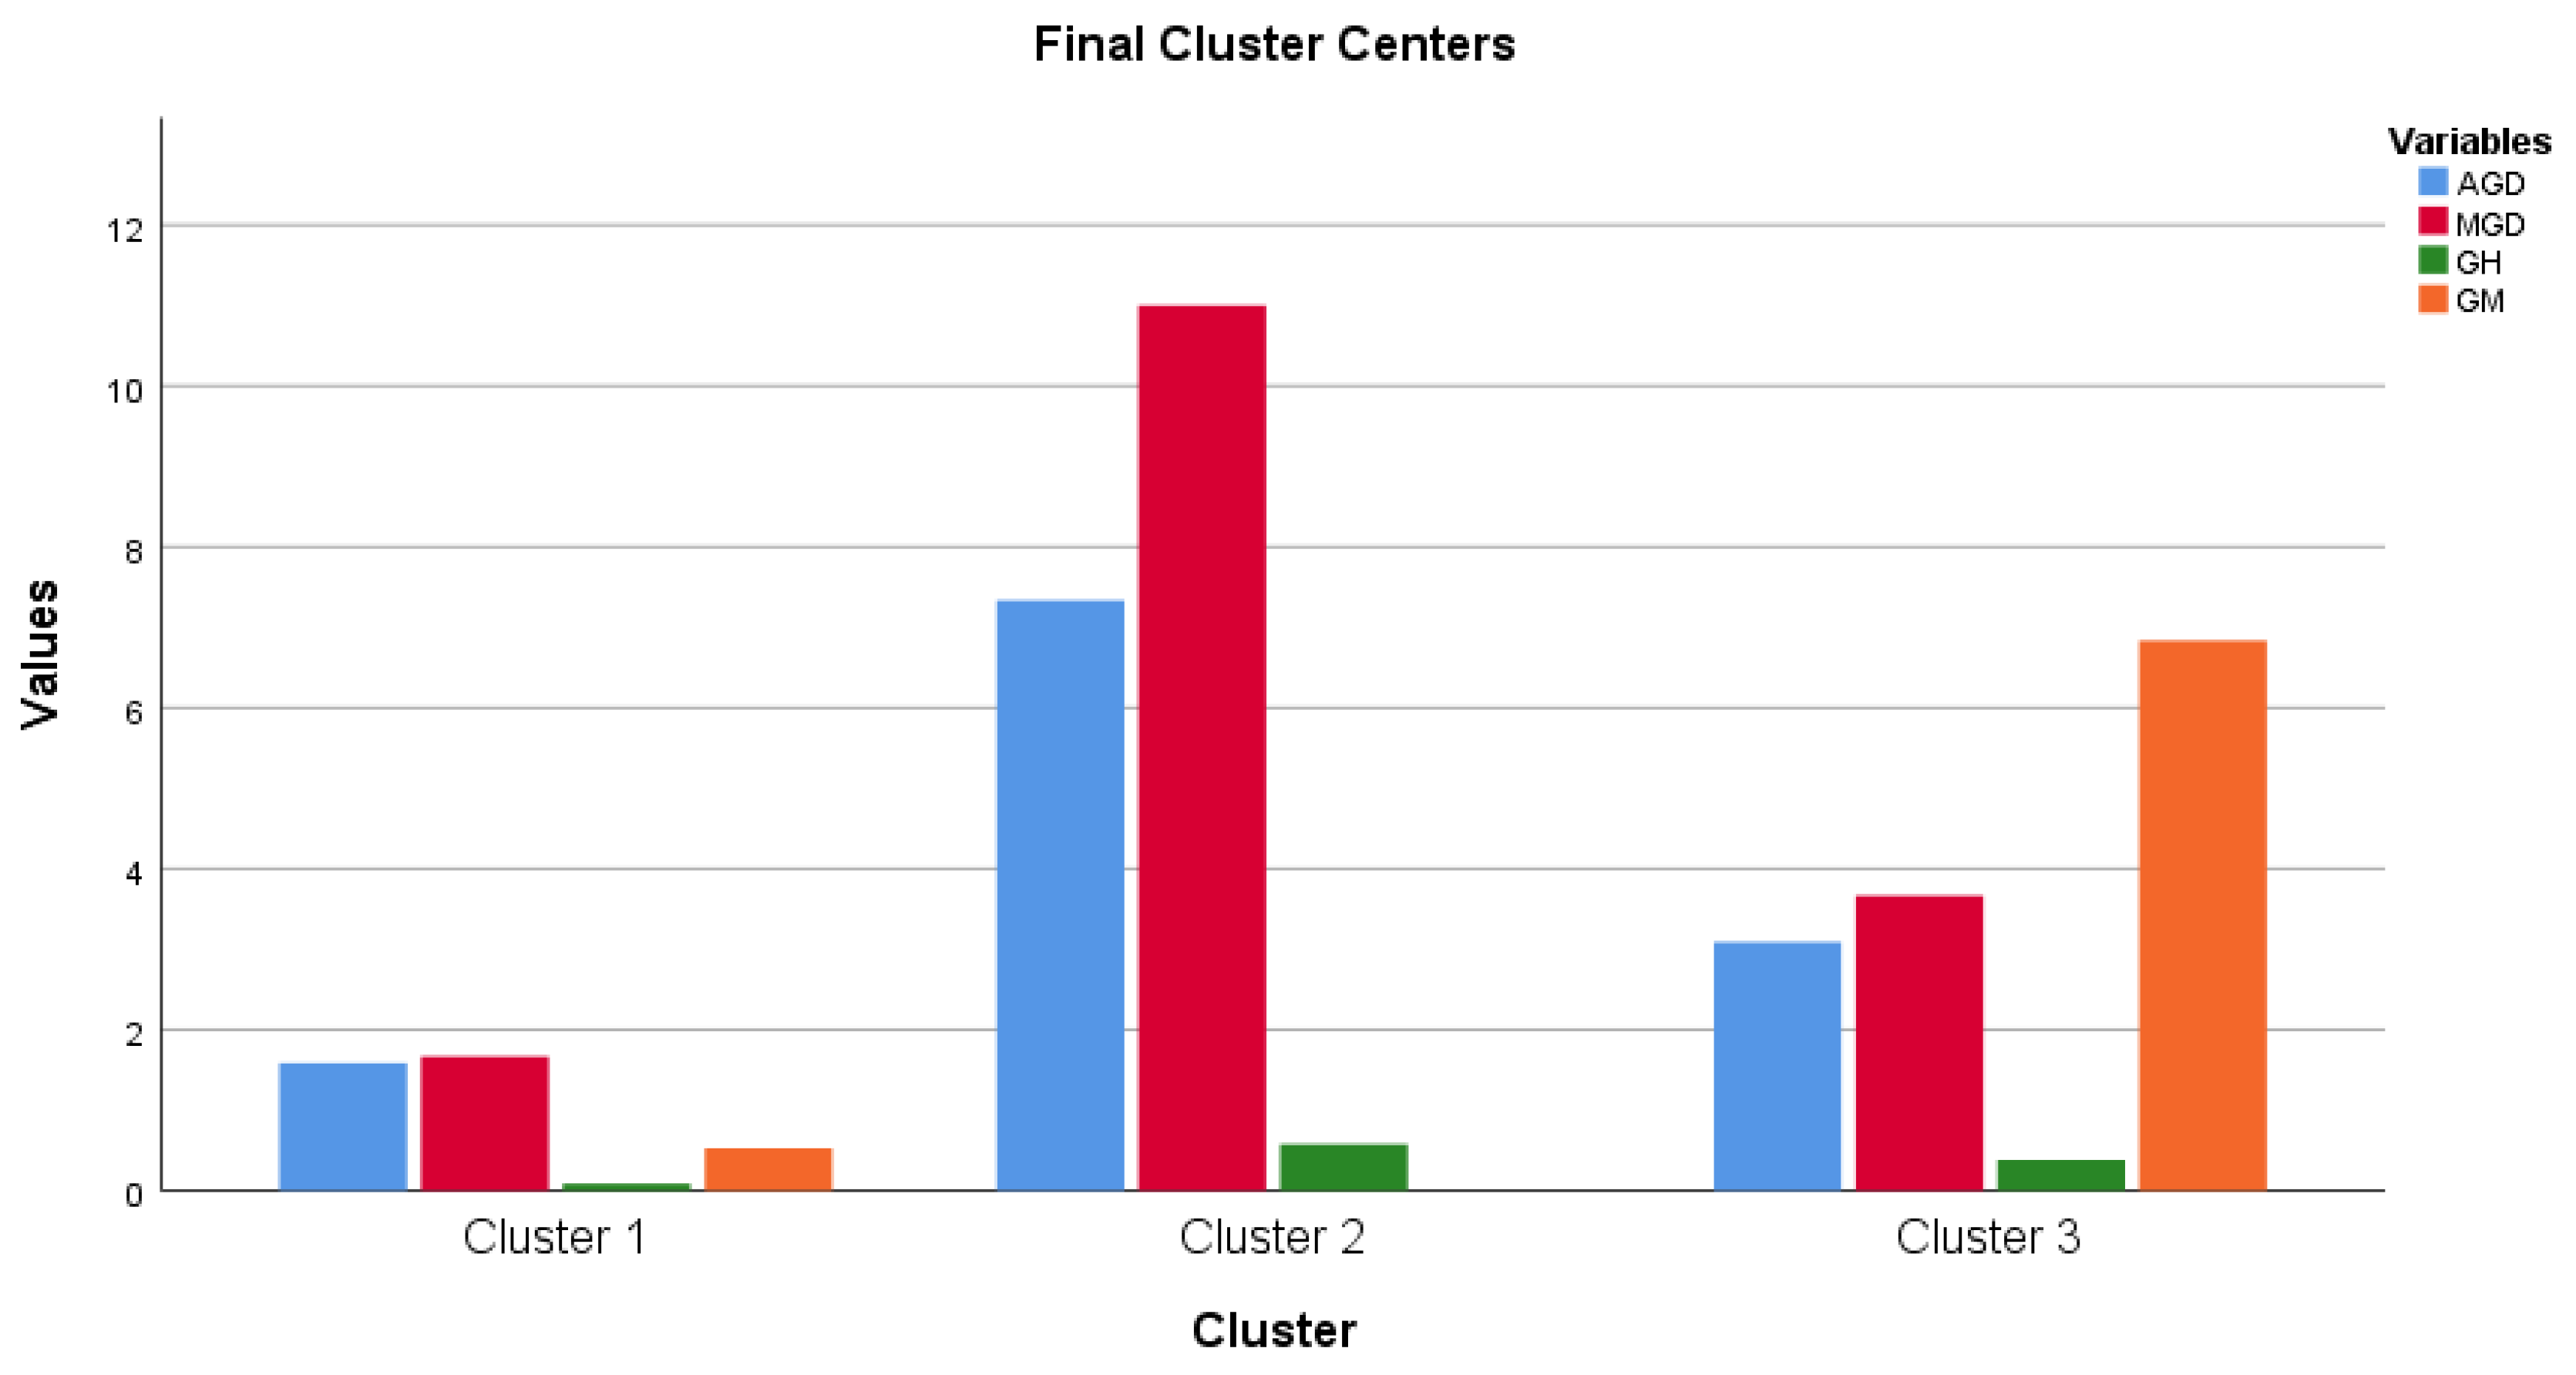
Figure 4.
BP Case (2.11) - Submission of a request for intervention.
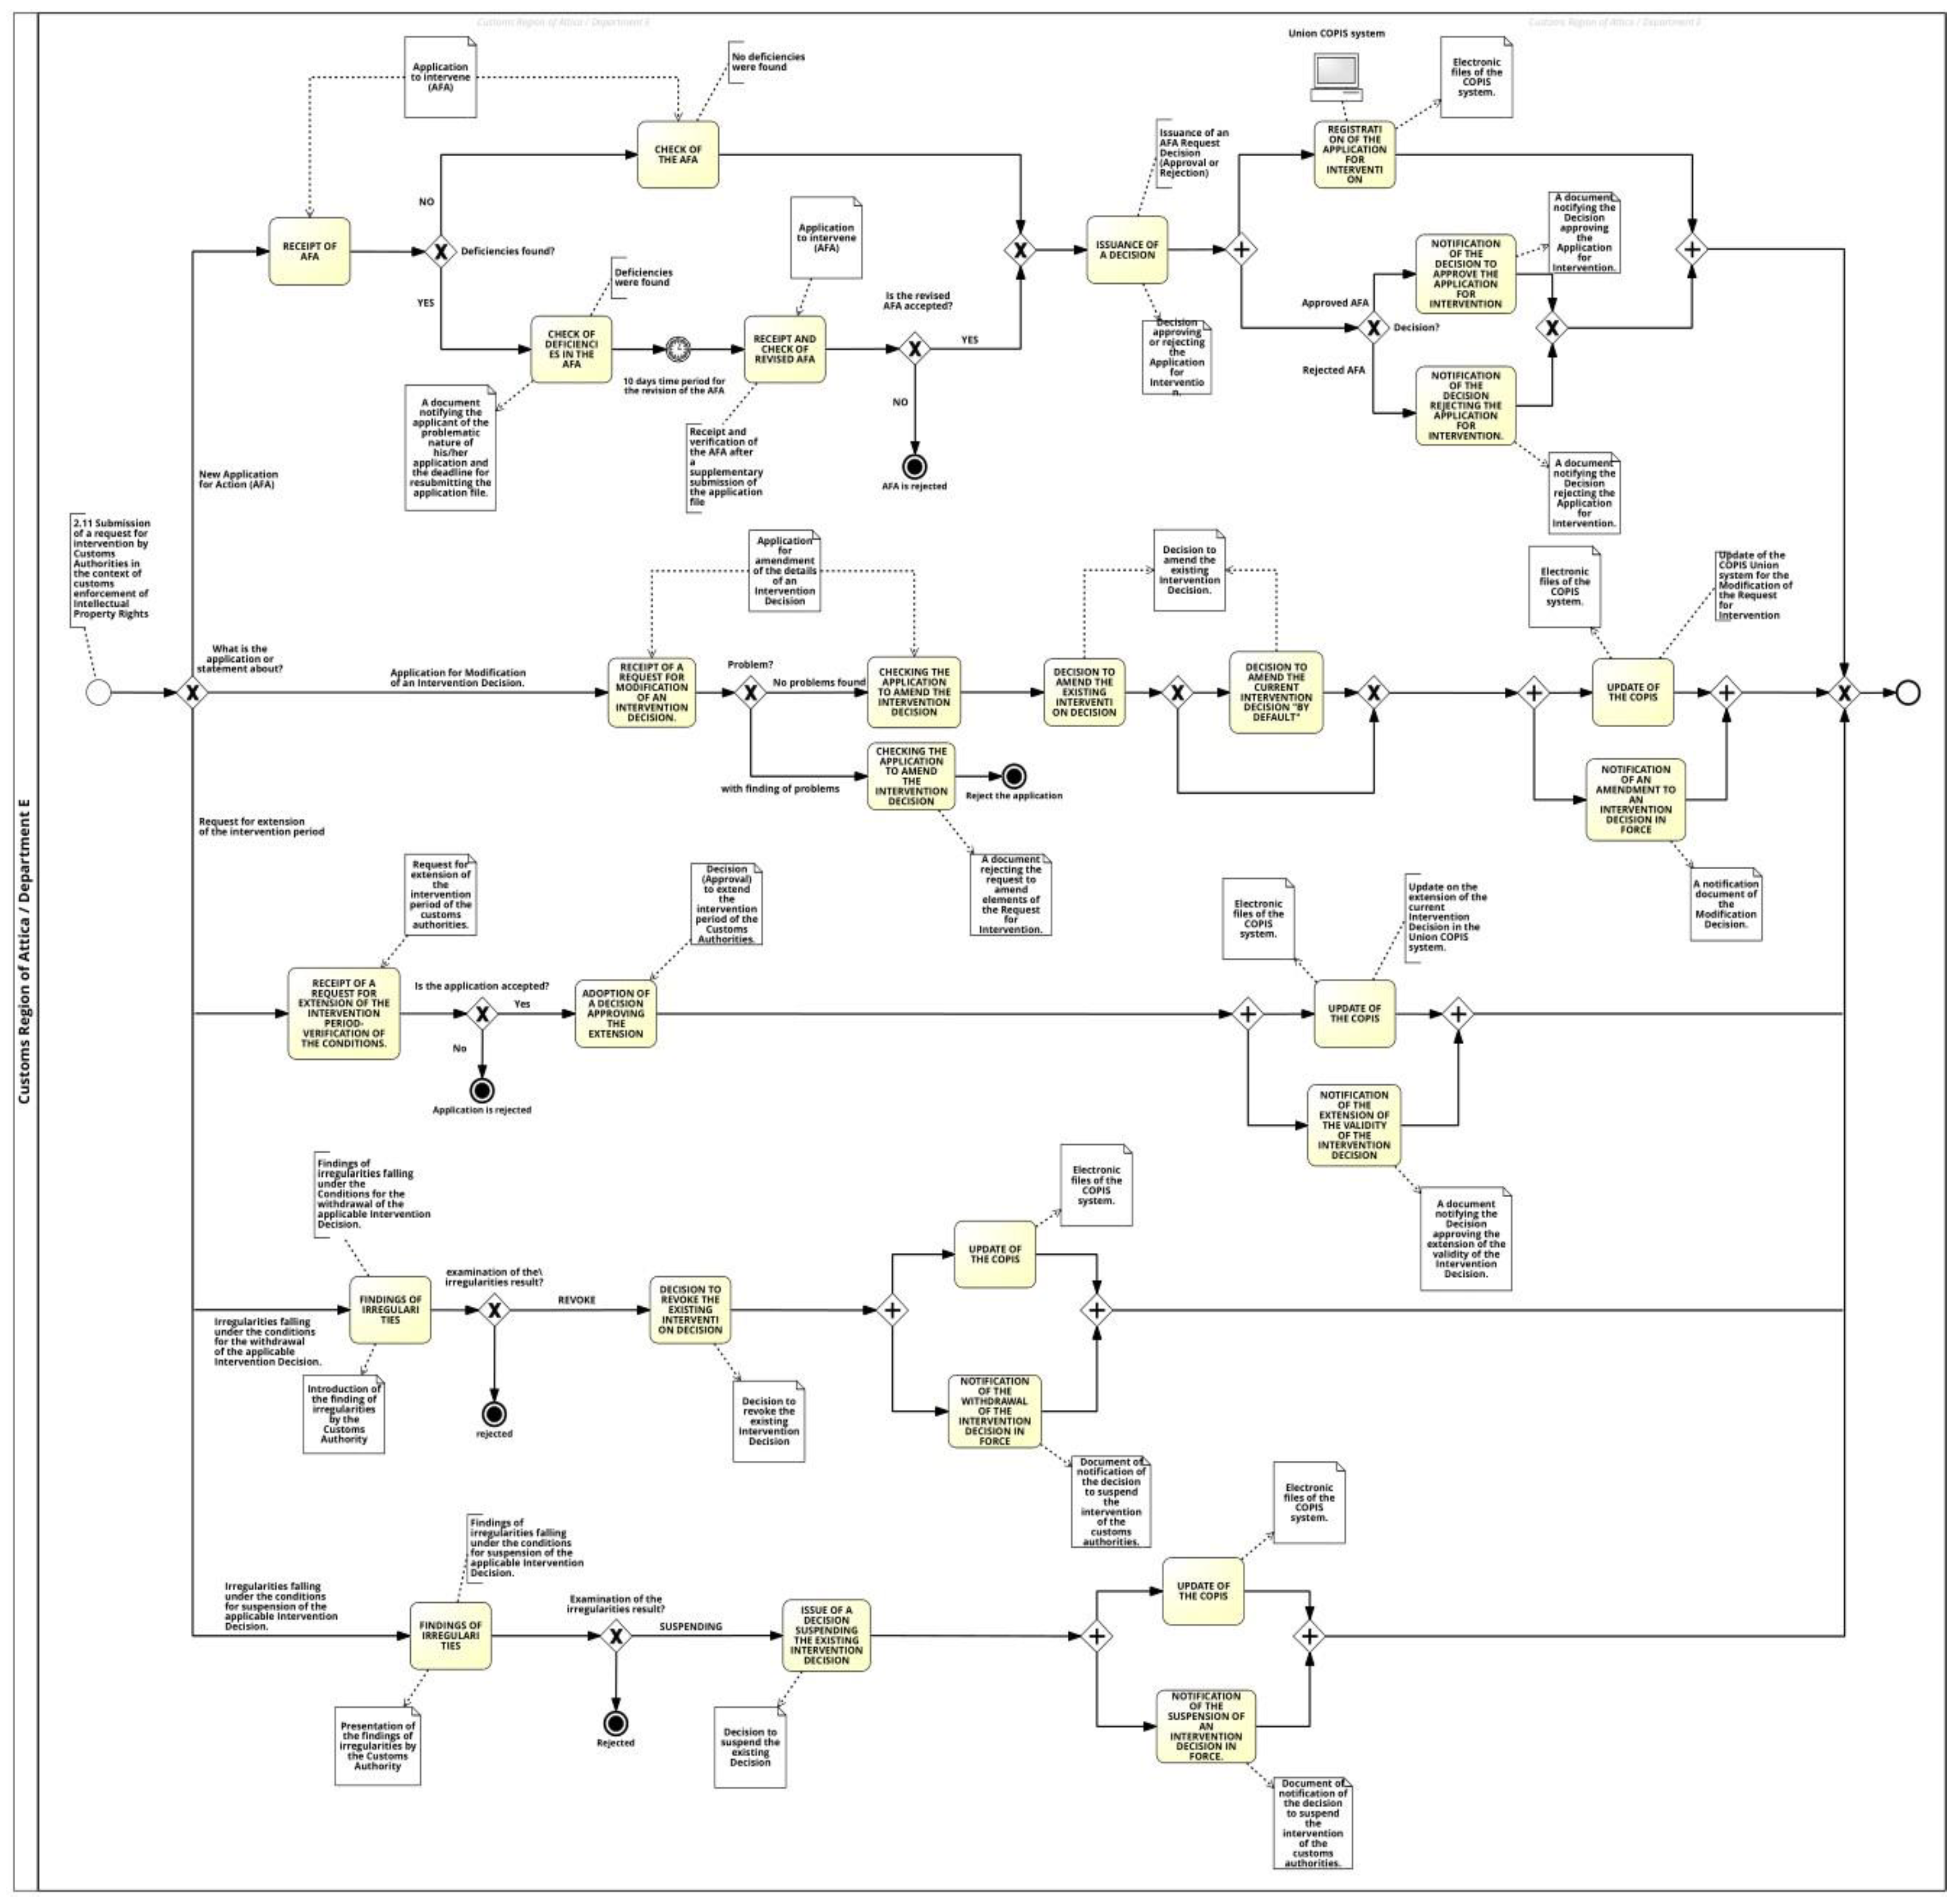
Figure 5.
BP Case (4.6) - Authorization Process for distilleries.

Figure 6.
BP Case (2.3) – Composition of Audit Reports (A more visible image is available at t.ly/7mRN).
Figure 6.
BP Case (2.3) – Composition of Audit Reports (A more visible image is available at t.ly/7mRN).
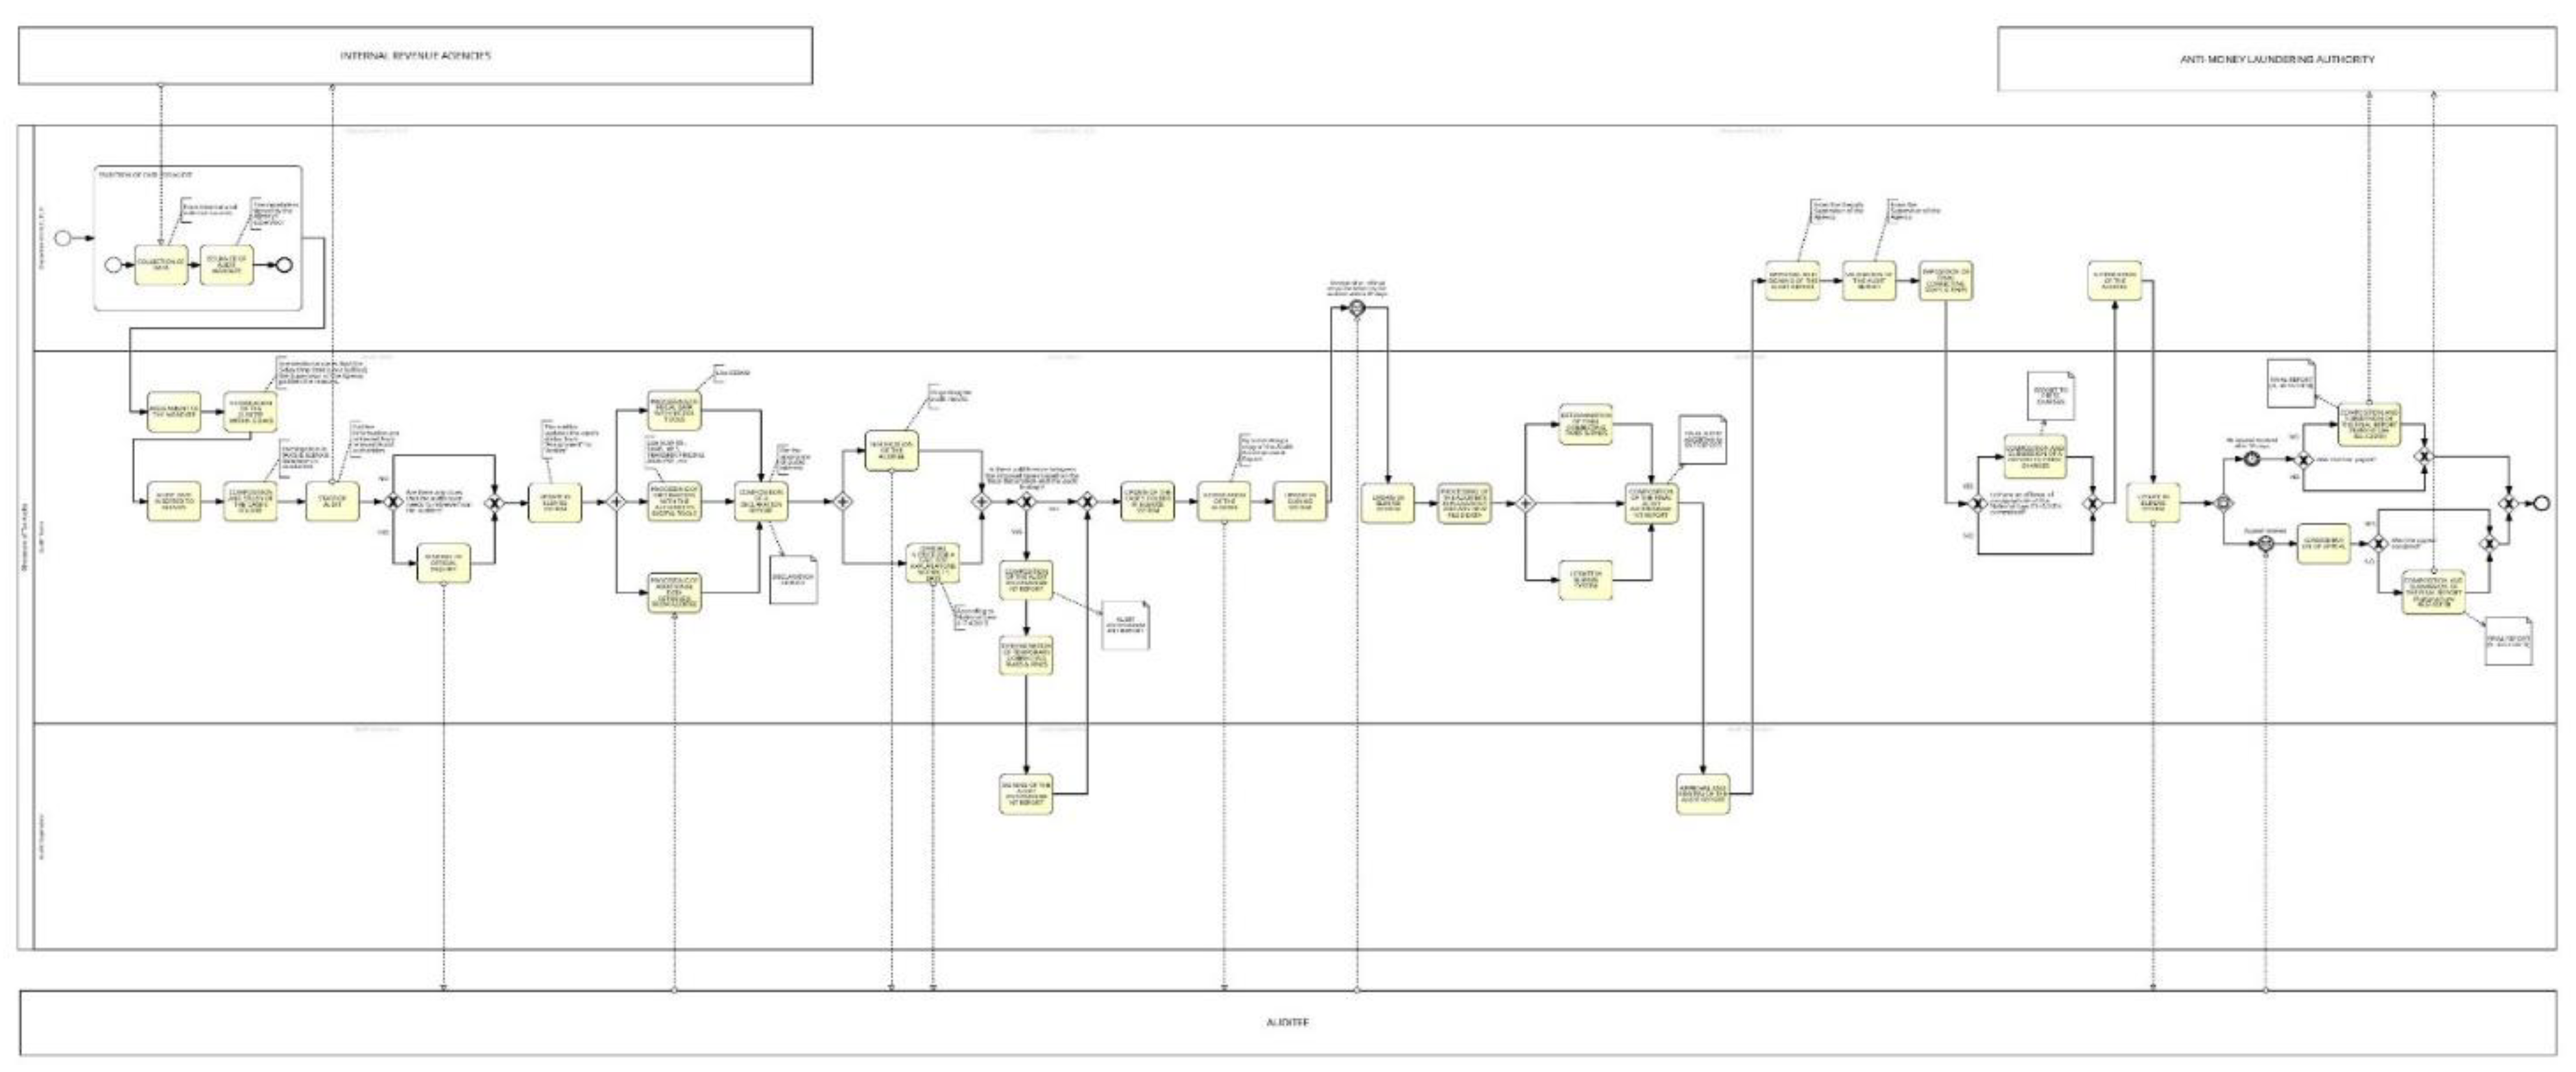
Figure 7.
BP Case (2.9) – Process for Initiation of Personal Company Operation.
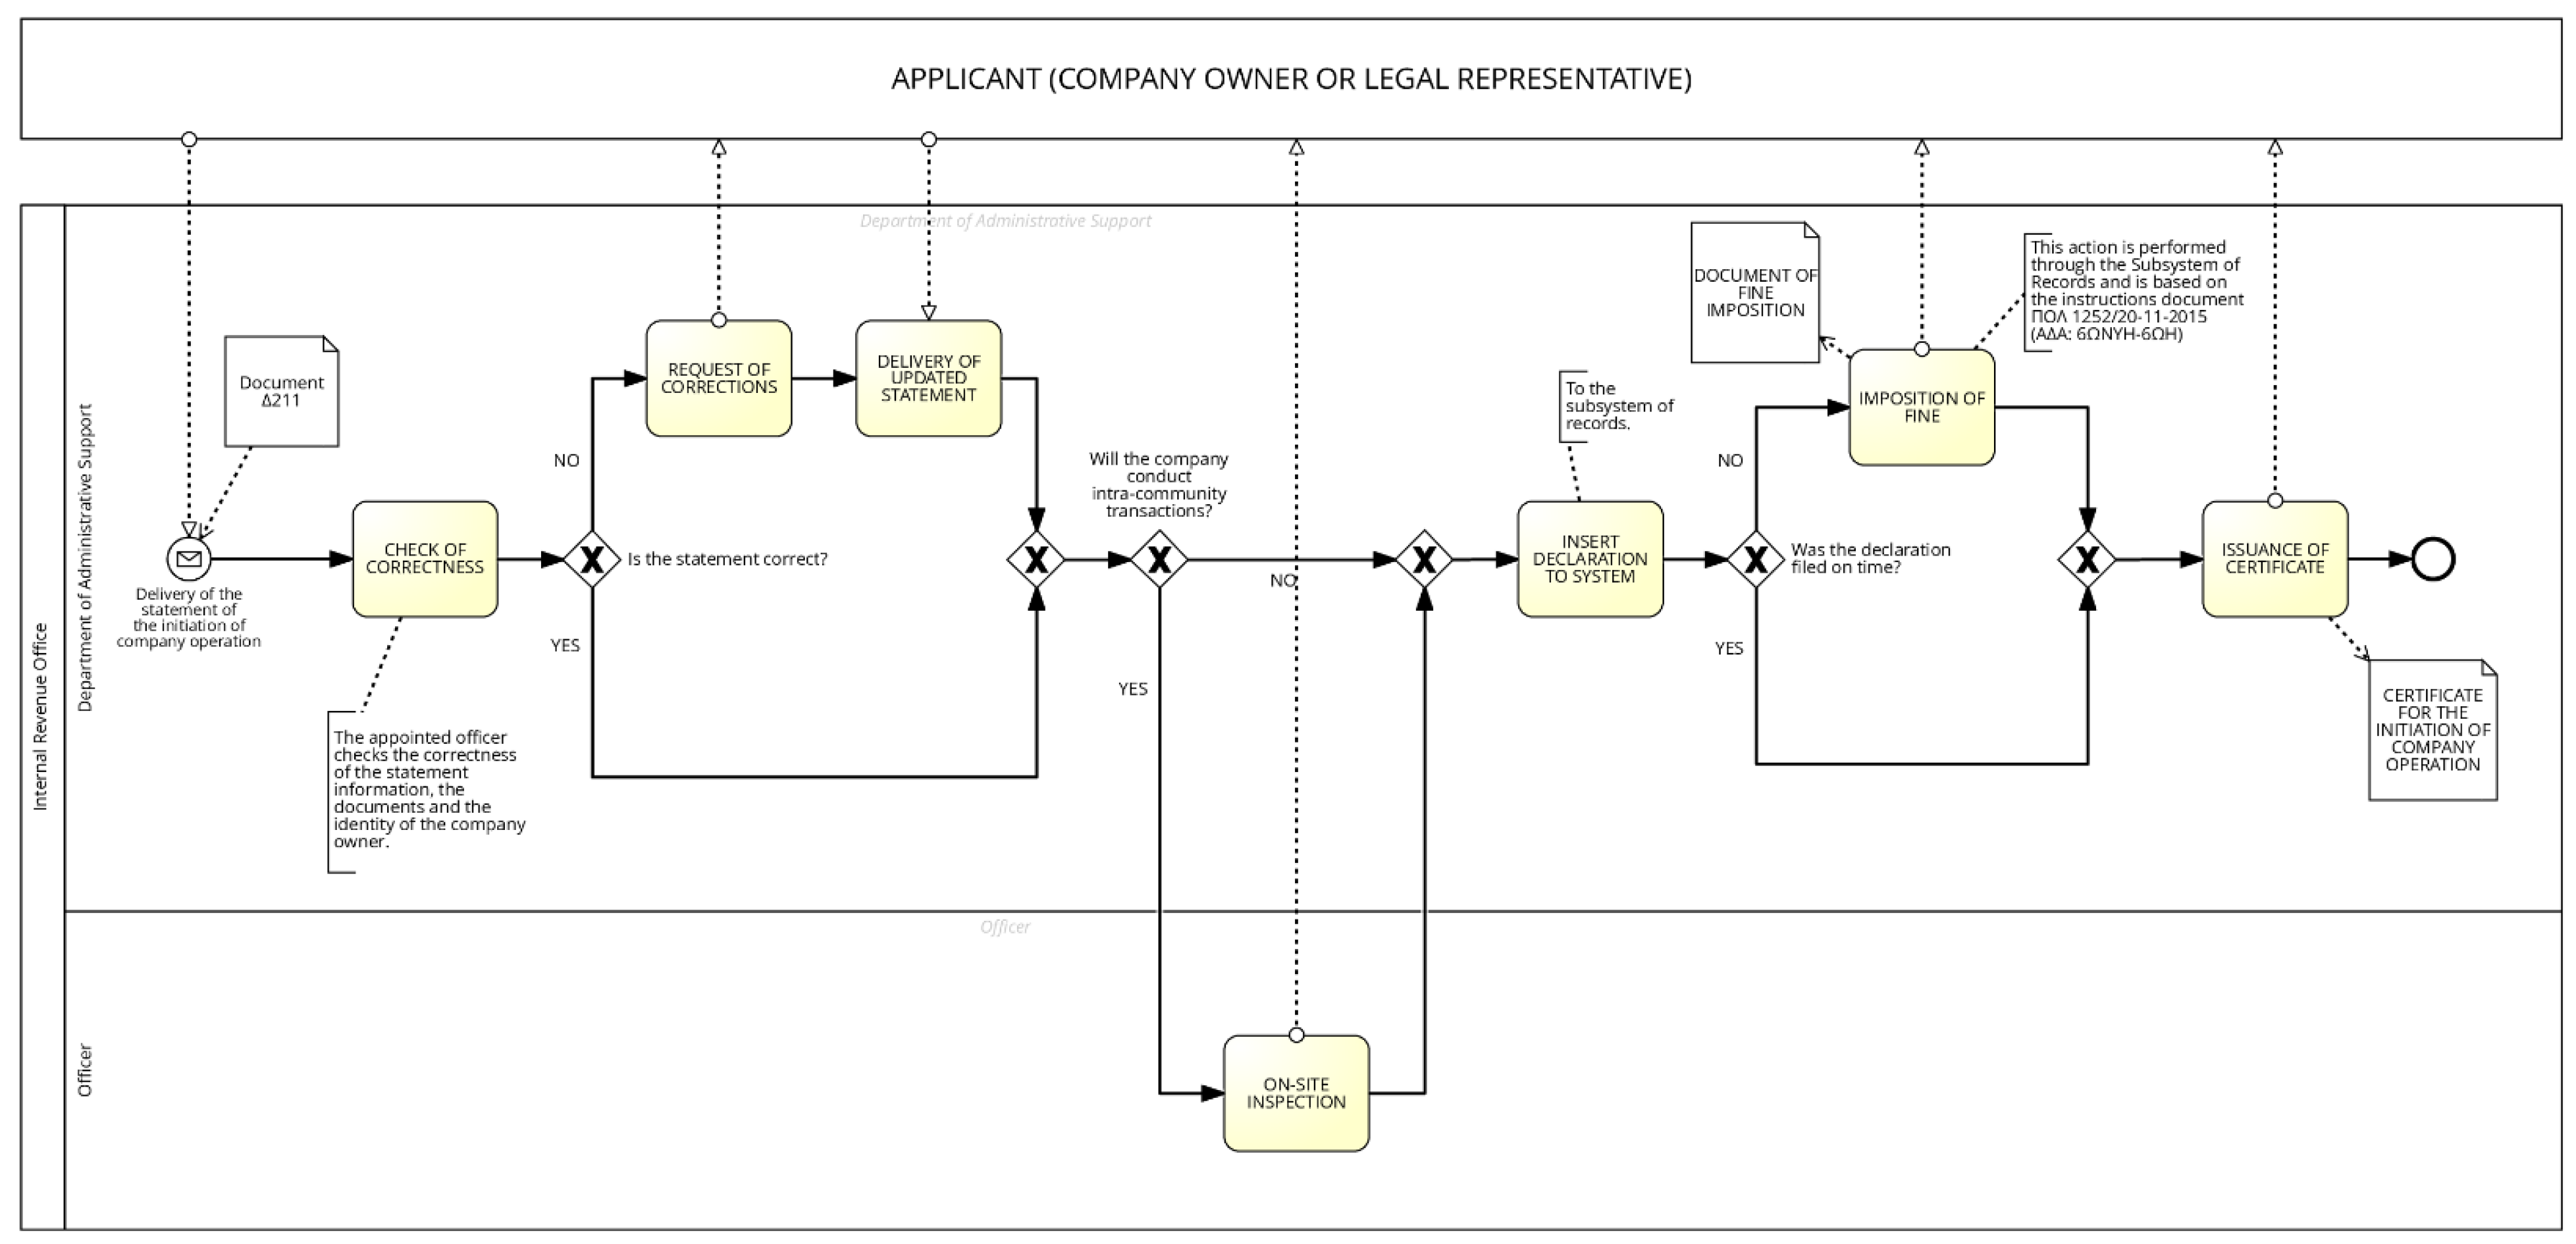
Table 1.
Internal Measure Values of Real-life BPs.
| Input Model | Ξ | TS | NOA | NSFA | NSFG | NoAJS | TNG | CLA | CFC | DOAF | AGD | MGD | GH | GM |
|---|---|---|---|---|---|---|---|---|---|---|---|---|---|---|
| 1.1 | 0,181 | 0 | 7 | 2 | 6 | 11 | 4 | 3,500 | 4 | 0,143 | 3 | 3 | 0 | 0 |
| 1.2 | 0,250 | 0 | 4 | 1 | 2 | 5 | 1 | 4,000 | 2 | 0,250 | 3 | 3 | 0 | 2 |
| 1.3 | 0,270 | 2 | 14 | 6 | 10 | 20 | 6 | 2,333 | 7 | 0,071 | 3,166 | 4 | 0,579 | 4 |
| 1.4 | 0,500 | 0 | 4 | 2 | 2 | 5 | 1 | 2,000 | 2 | 0,250 | 3 | 3 | 0 | 2 |
| 1.5 | 0,181 | 3 | 13 | 4 | 11 | 20 | 7 | 3,250 | 5 | 0,077 | 3 | 3 | 0,372 | 2 |
| 1.6 | 1 | 0 | 10 | 8 | 0 | 10 | 0 | 1,250 | 0 | 0,100 | 0 | 0 | 0 | 0 |
| 1.7 | 1 | 0 | 8 | 7 | 0 | 8 | 0 | 1,143 | 0 | 0,125 | 0 | 0 | 0 | 0 |
| 1.8 | 1 | 0 | 7 | 6 | 0 | 7 | 0 | 1,167 | 0 | 0,143 | 0 | 0 | 0 | 0 |
| 1.9 | 0,250 | 0 | 6 | 2 | 3 | 8 | 2 | 3,000 | 2 | 0,167 | 3 | 3 | 0 | 0 |
| 1.10 | 0,300 | 0 | 7 | 3 | 5 | 10 | 3 | 2,333 | 4 | 0,143 | 3 | 3 | 0 | 2 |
| 1.11 | 0,222 | 2 | 12 | 4 | 8 | 17 | 5 | 3,000 | 4 | 0,083 | 3 | 3 | 0,455 | 2 |
| 1.12 | 0,238 | 0 | 12 | 5 | 11 | 19 | 7 | 2,400 | 8 | 0,083 | 3 | 3 | 0 | 2 |
| 1.13 | 0,714 | 0 | 7 | 5 | 2 | 8 | 1 | 1,400 | 2 | 0,143 | 3 | 3 | 0 | 2 |
| 1.14 | 0,058 | 0 | 8 | 1 | 11 | 15 | 7 | 8,000 | 8 | 0,125 | 3 | 3 | 0 | 2 |
| 1.15 | 0,083 | 0 | 7 | 1 | 6 | 11 | 4 | 7,000 | 4 | 0,143 | 3 | 3 | 0 | 0 |
| 1.16 | 0,090 | 0 | 5 | 1 | 8 | 10 | 5 | 5,000 | 6 | 0,200 | 3 | 3 | 0 | 2 |
| 2.1 | 0,315 | 0 | 12 | 6 | 8 | 17 | 5 | 2,000 | 5 | 0,750 | 3,200 | 4 | 0 | 1 |
| 2.2 | 0,235 | 0 | 12 | 4 | 8 | 17 | 5 | 3,000 | 6 | 0,083 | 3 | 3 | 0 | 2 |
| 2.3 | 1 | 0 | 8 | 7 | 0 | 8 | 0 | 1,143 | 0 | 0,125 | 0 | 0 | 0 | 0 |
| 2.4 | 1 | 0 | 3 | 2 | 0 | 3 | 0 | 1,500 | 0 | 0,333 | 0 | 0 | 0 | 0 |
| 2.5 | 0,400 | 0 | 13 | 6 | 6 | 16 | 3 | 2,167 | 6 | 0,077 | 3 | 3 | 0 | 6 |
| 2.6 | 0,400 | 0 | 13 | 6 | 6 | 16 | 3 | 2,167 | 6 | 0,077 | 3 | 3 | 0 | 6 |
| 2.7 | 1 | 0 | 11 | 9 | 0 | 11 | 0 | 1,222 | 0 | 0,091 | 0 | 0 | 0 | 0 |
| 2.8 | 1 | 0 | 7 | 5 | 0 | 7 | 0 | 1,400 | 0 | 0,286 | 0 | 0 | 0 | 0 |
| 2.9 | 0,384 | 1 | 10 | 5 | 5 | 13 | 3 | 2,000 | 3 | 0,000 | 3 | 3 | 0,58 | 2 |
| 2.10 | 0,354 | 4 | 22 | 11 | 10 | 28 | 6 | 2,000 | 3 | 0,045 | 3,333 | 4 | 0 | 0 |
| 2.11 | 0,032 | 5 | 27 | 1 | 40 | 50 | 23 | 27,000 | 26 | 0,037 | 3,080 | 4 | 0,62 | 10 |
| 2.12 | 0,363 | 0 | 8 | 4 | 5 | 11 | 3 | 2,000 | 4 | 0,125 | 3 | 3 | 0 | 2 |
| 2.13 | 1 | 0 | 8 | 7 | 0 | 8 | 0 | 1,143 | 0 | 0,125 | 0 | 0 | 0 | 0 |
| 2.14 | 1 | 0 | 8 | 7 | 0 | 8 | 0 | 1,143 | 0 | 0,125 | 0 | 0 | 0 | 0 |
| 2.15 | 1 | 0 | 10 | 9 | 0 | 10 | 0 | 1,111 | 0 | 0,100 | 0 | 0 | 0 | 0 |
| 2.16 | 0,384 | 2 | 20 | 4 | 18 | 30 | 10 | 5,000 | 19 | 0,050 | 3,200 | 4 | 0,455 | 8 |
| 2.17 | 1 | 0 | 6 | 5 | 0 | 6 | 0 | 1,200 | 0 | 0,167 | 0 | 0 | 0 | 0 |
| 2.18 | 1 | 0 | 5 | 4 | 0 | 5 | 0 | 1,250 | 0 | 0,200 | 0 | 0 | 0 | 0 |
| 2.19 | 0,454 | 1 | 9 | 5 | 3 | 11 | 2 | 1,800 | 3 | 0,111 | 3 | 3 | 0 | 0 |
| 3.1 | 1 | 0 | 7 | 6 | 0 | 7 | 0 | 1,167 | 0 | 0,143 | 0 | 0 | 0 | 0 |
| 3.2 | 1 | 0 | 3 | 2 | 0 | 3 | 0 | 1,500 | 0 | 0,333 | 0 | 0 | 0 | 0 |
| 3.3 | 0,560 | 1 | 20 | 14 | 6 | 24 | 4 | 1,429 | 3 | 0,050 | 3 | 3 | 0,630 | 0 |
| 3.4 | 1 | 0 | 12 | 9 | 0 | 12 | 0 | 1,333 | 0 | 0,083 | 0 | 0 | 0 | 0 |
| 3.5 | 1 | 0 | 10 | 9 | 0 | 10 | 0 | 1,111 | 0 | 0,100 | 0 | 0 | 0 | 0 |
| 3.6 | 1 | 0 | 9 | 7 | 0 | 9 | 0 | 1,286 | 0 | 0,111 | 0 | 0 | 0 | 0 |
| 3.7 | 1 | 0 | 6 | 5 | 0 | 6 | 0 | 1,200 | 0 | 0,167 | 0 | 0 | 0 | 0 |
| 3.8 | 0,048 | 15 | 20 | 2 | 22 | 26 | 6 | 10,000 | 4 | 0,000 | 7,333 | 11 | 0,579 | 0 |
| 3.9 | 1 | 0 | 3 | 2 | 0 | 3 | 0 | 1,500 | 0 | 0,333 | 0 | 0 | 0 | 0 |
| 3.10 | 1 | 0 | 2 | 1 | 0 | 2 | 0 | 2,000 | 0 | 0,500 | 0 | 0 | 0 | 0 |
| 3.11 | 1 | 0 | 3 | 2 | 0 | 3 | 0 | 1,500 | 0 | 0,333 | 0 | 0 | 0 | 0 |
| 4.1 | 0,50 | 0 | 10 | 6 | 3 | 12 | 2 | 1,667 | 2 | 0,100 | 3 | 3 | 0 | 0 |
| 4.2 | 1 | 0 | 8 | 7 | 0 | 8 | 0 | 1,143 | 0 | 0,125 | 0 | 0 | 0 | 0 |
| 4.3 | 1 | 0 | 7 | 6 | 0 | 7 | 0 | 1,167 | 0 | 0,143 | 0 | 0 | 0 | 0 |
| 4.4 | 0,400 | 1 | 8 | 6 | 3 | 10 | 2 | 1,333 | 1 | 0,125 | 3 | 3 | 0 | 0 |
| 4.5 | 0,176 | 2 | 9 | 3 | 9 | 15 | 6 | 3,000 | 4 | 0,111 | 3 | 3 | 0,579 | 0 |
| 4.6 | 0,526 | 2 | 14 | 10 | 5 | 18 | 4 | 1,400 | 2 | 0,143 | 3 | 3 | 0 | 0 |
| 4.7 | 1 | 0 | 7 | 6 | 0 | 7 | 0 | 1,167 | 0 | 0,143 | 0 | 0 | 0 | 0 |
| 4.8 | 0,111 | 0 | 10 | 2 | 10 | 16 | 6 | 5,000 | 8 | 0,100 | 3,333 | 4 | 0 | 1 |
| 4.9 | 1 | 0 | 6 | 5 | 0 | 6 | 0 | 1,200 | 0 | 0,167 | 0 | 0 | 0 | 0 |
| 4.10 | 0,142 | 1 | 5 | 1 | 3 | 7 | 2 | 5,000 | 1 | 0,200 | 3 | 3 | 0 | 0 |
| 4.11 | 1 | 0 | 5 | 4 | 0 | 5 | 0 | 1,250 | 0 | 0,200 | 0 | 0 | 0 | 0 |
| 4.12 | 0,153 | 0 | 7 | 2 | 6 | 11 | 4 | 3,500 | 4 | 0,143 | 3 | 3 | 0 | 0 |
| 4.13 | 0,153 | 3 | 22 | 6 | 21 | 19 | 13 | 3,667 | 15 | 0,045 | 3,076 | 4 | 0,628 | 7 |
| 4.14 | 1 | 0 | 8 | 6 | 0 | 8 | 0 | 1,333 | 0 | 0,125 | 0 | 0 | 0 | 0 |
| 5.1 | 0,166 | 4 | 25 | 6 | 19 | 35 | 10 | 4,167 | 10 | 0,360 | 3,700 | 5 | 0,613 | 1 |
| 5.2 | 0,389 | 1 | 13 | 7 | 6 | 17 | 4 | 1,857 | 3 | 0,385 | 3 | 3 | 0,631 | 0 |
| 5.3 | 0,111 | 0 | 18 | 5 | 23 | 33 | 15 | 3,600 | 15 | 0,333 | 3,066 | 4 | 0 | 1 |
| 5.4 | 0,087 | 1 | 11 | 2 | 8 | 20 | 9 | 5,500 | 9 | 0,182 | 2 | 2 | 0,482 | 2 |
| MIN | 0,032 | 0 | 2 | 1 | 0 | 2 | 0 | 1,111 | 0 | 0 | 0 | 0 | 0 | 0 |
| MAX | 1 | 15 | 27 | 14 | 40 | 50 | 23 | 27 | 26 | 0,750 | 7,333 | 11 | 0,631 | 10 |
| MEAN | 0,581 | 0,800 | 9,860 | 4,910 | 5,280 | 12,780 | 3,170 | 2,847 | 3,470 | 0,162 | 1,815 | 2,000 | 0,122 | 1,111 |
| SD | 0,382 | 2,132 | 5,462 | 2,764 | 7,375 | 8,759 | 4,275 | 3,550 | 4,950 | 0,124 | 1,660 | 2,016 | 0,236 | 2,102 |
Table 2.
Final Cluster Centers & ANOVA Table.
| Final Cluster Centers | ANOVA Table | ||||||||
|---|---|---|---|---|---|---|---|---|---|
| Cluster | Cluster | Error | F | Sig. | |||||
| 1 | 2 | 3 | Mean Square | df | Mean Square | df | |||
| Ξ | 0,032 | 0,665 | 0,232 | 1,005 | 2 | 0,118 | 61 | 8,551 | 0,001 |
| TS | 5 | 0 | 3 | 49,025 | 2 | 3,087 | 61 | 15,881 | 0,000 |
| NOA | 27 | 8 | 18 | 610,691 | 2 | 10,793 | 61 | 56,584 | 0,000 |
| NSFA | 1 | 5 | 6 | 13,649 | 2 | 7,445 | 61 | 1,833 | 0,169 |
| NSFG | 40 | 3 | 14 | 1242,384 | 2 | 15,445 | 61 | 80,437 | 0,000 |
| NOAJS | 50 | 10 | 25 | 1781,514 | 2 | 20,818 | 61 | 85,575 | 0,000 |
Table 3.
Correlation between Plasticity and the Internal Measures.
| Metric | RESEQ | PAR | Overall Plasticity | Cluster Sequence (1→3→2) |
|---|---|---|---|---|
| Ξ | + | + | + | |
| TS | - | - | - | |
| NOA | + | + | - | |
| NSFA | + | + | + | + |
| NSFG | - | - | - | |
| NOAJS | - | - | - | |
| TNG | - | - | - | |
| CLA | - | - | - | - |
| CFC | + | - | +/- | - |
| DOAF | + | + | + |
Table 4.
Final Cluster Centers & ANOVA Table.
| Final Cluster Centers | ANOVA Table | ||||||||
|---|---|---|---|---|---|---|---|---|---|
| Cluster | Cluster | Error | F | Sig. | |||||
| 1 | 2 | 3 | Mean Square | df | Mean Square | df | |||
| AGD | 1,584 | 7,333 | 3,087 | 21,596 | 2 | 2,138 | 61 | 10,101 | 0,000 |
| MGD | 2 | 11 | 4 | 52,000 | 2 | 2,492 | 61 | 20,868 | 0,000 |
| GH | 0,087 | 0,579 | 0,381 | 0,340 | 2 | 0,047 | 61 | 7,308 | 0,001 |
| GM | 1 | 0 | 7 | 108,595 | 2 | 1,001 | 61 | 108,517 | 0,000 |
Table 5.
BPR Capacity of the real-life BP Repository.
| Final Categories of BPR Capacity | ||||||
|---|---|---|---|---|---|---|
| Low | Low to Moderate | Moderate | Moderate to High | High | ||
| 2.11 | 1.3 | 1.5 | 1.1 | 2.7 | 3.10 | |
| 3.8 | 2.16 | 2.5 | 1.2 | 2.8 | 3.11 | |
| 3.3 | 2.6 | 1.4 | 2.9 | 4.1 | ||
| 4.13 | 2.10 | 1.6 | 2.12 | 4.2 | ||
| 1.12 | 1.7 | 2.13 | 4.3 | |||
| 5.1 | 1.8 | 2.14 | 4.4 | |||
| 5.3 | 1.9 | 2.15 | 4.5 | |||
| 5.4 | 1.10 | 2.17 | 4.6 | |||
| 1.11 | 2.18 | 4.7 | ||||
| 1.13 | 2.19 | 4.8 | ||||
| 1.14 | 3.1 | 4.9 | ||||
| 1.15 | 3.2 | 4.10 | ||||
| 1.16 | 3.4 | 4.11 | ||||
| 2.1 | 3.5 | 4.12 | ||||
| 2.2 | 3.6 | 4.14 | ||||
| 2.3 | 3.7 | 5.2 | ||||
| 2.4 | 3.9 | |||||
| 0 | 2 | 4 | 8 | 50 | ||
Table 6.
Metric Values of a BP Case with Low BPR Capacity.
| Metric | Ξ | TS | NOA | NSFA | NSFG | NoAJS | TNG | CLA | CFC | DOAF | |||
|---|---|---|---|---|---|---|---|---|---|---|---|---|---|
| Plasticity Type | RESEQ | PAR | RESEQ | RESEQ | PAR | PAR | PAR | PAR | RESEQ | PAR | RESEQ | PAR | RESEQ |
| Value | 0,032 | 5 | 27 | 1 | 1 | 40 | 50 | 23 | 27,000 | 27,000 | 26 | 26 | 0,037 |
| Metric | AGD | MGD | GH | GM | |||||||||
| Quality Type | MOD | COR | MOD | COR | MOD | COR | MOD | COR | |||||
| Value | 3,080 | 3,080 | 4 | 4 | 0,62 | 0,62 | 10 | 10 | |||||
Table 7.
Metric Values of a BP Case with High BPR Capacity.
| Metric | Ξ | TS | NOA | NSFA | NSFG | NoAJS | TNG | CLA | CFC | DOAF | |||
|---|---|---|---|---|---|---|---|---|---|---|---|---|---|
| Plasticity Type | RESEQ | PAR | RESEQ | RESEQ | PAR | PAR | PAR | PAR | RESEQ | PAR | RESEQ | PAR | RESEQ |
| Value | 0,526 | 2 | 14 | 10 | 10 | 6 | 18 | 4 | 1,400 | 1,400 | 2 | 2 | 0,143 |
| Metric | AGD | MGD | GH | GM | |||||||||
| Quality Type | MOD | COR | MOD | COR | MOD | COR | MOD | COR | |||||
| Value | 3 | 3 | 3 | 3 | 0 | 0 | 0 | 0 | |||||
Table 8.
Metric Values of a BP Case with Low BPR Capacity.
| Metric | Ξ | TS | NOA | NSFA | NSFG | NoAJS | TNG | CLA | CFC | DOAF | |||
|---|---|---|---|---|---|---|---|---|---|---|---|---|---|
| Plasticity Type | RESEQ | PAR | RESEQ | RESEQ | PAR | PAR | PAR | PAR | RESEQ | PAR | RESEQ | PAR | RESEQ |
| Value | 0,21 | 5 | 35 | 19 | 19 | 31 | 51 | 16 | 2,692 | 2,692 | 9 | 9 | 0,029 |
| Metric | AGD | MGD | GH | GM | |||||||||
| Quality Type | MOD | COR | MOD | COR | MOD | COR | MOD | COR | |||||
| Value | 3,125 | 3,125 | 4 | 4 | 0,511 | 0,511 | 6 | 6 | |||||
Table 9.
Distance of Case Study from Cluster Centroids.
| Plasticity | External Quality | |||||
|---|---|---|---|---|---|---|
| Centroid 1 (Low) | Centroid 3 (Moderate) | Centroid 2 (High) | Centroid 2 (Low) | Centroid 3 (Moderate) | Centroid 1 (High) | |
| Distance | 37,402 | 38,468 | 61,196 | 10,134 | 0,908 | 6,161 |
Disclaimer/Publisher’s Note: The statements, opinions and data contained in all publications are solely those of the individual author(s) and contributor(s) and not of MDPI and/or the editor(s). MDPI and/or the editor(s) disclaim responsibility for any injury to people or property resulting from any ideas, methods, instructions or products referred to in the content. |
© 2025 by the authors. Licensee MDPI, Basel, Switzerland. This article is an open access article distributed under the terms and conditions of the Creative Commons Attribution (CC BY) license (http://creativecommons.org/licenses/by/4.0/).
Copyright: This open access article is published under a Creative Commons CC BY 4.0 license, which permit the free download, distribution, and reuse, provided that the author and preprint are cited in any reuse.


