
Submitted:
22 January 2025
Posted:
23 January 2025
You are already at the latest version
Abstract
Volatile organic compounds (VOCs) in biological samples originate both from exogenous and endogenous sources. Recent studies have highlighted their potential as cancer biomarkers, emphasizing the need for accurate detection methods in clinical settings. However, the analysis of VOCs in whole blood (WB) samples remains challenging due to complex matrix effects caused by protein-VOCs binding phenomenon and lack of standardized sample preparation protocols. Therefore, this study suggests a standardized method for advanced VOC analysis in WB samples specifically for veterinary applications. We compared 12 combinations of reagents composed of protein denaturing reagents and salts, particularly urea mixtures, to enhance VOC decoupling from proteins and improve matrix effect uniformity in gas chromatography-mass spectrometry (GC-MS) analysis. Among all combinations, urea with NaCl showed optimal performance, demonstrating advancement in the detection sensitivity up to 339.4% and significantly reduced matrix effect variation (-35.5% to 25%) compared to the water-only control. This novel approach eliminates complex procedures while maintaining accuracy, making it particularly suitable for veterinary uses. The method's standardization and improved performance characteristics offer a practical solution for efficient VOC detection in veterinary diagnostics, potentially advancing both environmental exposure monitoring and tumor biomarker research.
Keywords:
Veterinary Cancer
; Sample Preparation
; VOCs
; Mass Spectrometry
; Dog
1. Introduction
Volatile organic compounds (VOCs) are environmental pollutants originating from various industries, vehicle emissions, and other anthropogenic sources [1,2]. Recently, specific VOCs have been identified as potential cancer biomarkers due to their association with altered cancer metabolism, emphasizing the need for accurate detection methods for novel diagnostic solutions. Some studies have suggested multiple VOC biomarkers from breath samples for detecting colorectal cancer [3] and from urine samples for detecting prostate cancer [4,5]. However, in veterinary medicine, using these biological samples are not proper for quantitative analysis due to the sample quality [6]. Therefore, studies have conducted to find biomarkers from blood samples for cancer diagnosis in dogs yet the analysis of VOCs in blood samples remains challenging due to complex matrix effects [7,8].
Previous studies showed unexpectedly high variability in internal standard (IS) sensitivity across WB samples, while consistent sensitivity was observed in repeated analyses of the same sample. This observation led us to hypothesize that VOCs are trapped by blood proteins through specific interactions. A study demonstrated that benzene binds stably to hemoglobin (Hb)'s heme pocket, significantly reducing oxygen binding capacity even at high temperatures (70-80 °C) [9]. In addition, protein aromatic residues and cationic sites have been shown to form strong π-π interactions [10] and cation-π interactions [11]. Also, the influence of ionic strength on aromatic compound solubility suggests that protein-VOC interactions can be modulated by chemical conditions [12]. These studies collectively indicate that VOCs can form specific, stable interactions with blood proteins, which can be disrupted by altering biochemical conditions, thus providing a theoretical framework for developing improved analytical methods for VOC detection in blood samples.
Generally, when VOC analysis in aqueous solution is challenging, salts like NaCl are added during preparation step to decrease VOC solubility and increase the sensitivity [13,14]. However, in the cases of body fluid samples (serum, plasma, urine, and whole blood), there have been no studies regarding that induce protein denaturation using chemicals to facilitate the release of protein-bound VOCs. Therefore, in this study, we suggest distinct methods at the sample preparation step that simultaneously increases sensitivity while being simple, rapid, and highly reproducible.
2. Materials and Methods
2.1. Standards and Chemicals
All standard reference materials including benzene, toluene, ethylbenzene, m-/p-xylene, o-xylene, styrene, and fluorobenzene were purchased from Accustandard (New Haven, CT, USA). Stock solutions dissolved in methanol were stored at -20 °C and diluted with methanol as needed. Methanol and HPLC-grade deionized water used for standard dilution were purchased from J.T. Baker (Avantor, Radnor, USA). Urea and SDS (Sodium Dodecyl Sulfate), used to induce protein denaturation, were obtained from JUNSEI (Saitama, Japan) and Daejung Chemicals (Gyeonggi, Korea), respectively. Among the salts added to facilitate VOC release from blood, NaCl was purchased from Daejung Chemicals (Gyeonggi, Korea), while Na2SO4 and K2SO4 were obtained from Junsei (Saitama, Japan).
2.2. Sample Collection
350 mL Canine whole blood packs preserved in CPDA (Citrate-Phosphate-Dextrose-Adenine) bag were purchased from Korea Animal Blood Bank (Gangwon, Republic of Korea) and 103 samples were provided by Naeun Animal Hospital located in Euijeongbu, Gyeonggi, Repubilc of Korea with the consent from the owners for research uses. Citric acid or EDTA (Ethylene-diamine-tetra acetic acid) were supplemented as anti-coagulants and the samples were preserved at 4 °C until use.
2.3. Sample Preparation
Protein denaturing reagents (PDR; urea and SDS) along with salts that increase the release intensity of VOCs from samples, and water were added in multiple combinations to a 20 mL headspace (H/S) vial containing the blood sample. The addition of salts induces a salt-out effect, reducing VOC solubility in the aqueous phase and thereby enhancing analytical sensitivity. The specific combinations of PDRs and salts tested are summarized in Table 1.
2.4. Gas Chromatography-Mass Spectrometry Analysis
VOCs in canine blood were analyzed using a HS-GC/MS (Headspace-Gas Chromatography-Mass Spectrometry) system equipped with a TriPlus 500 (Headspace autosampler) and ISQ 7610 (Single Quadrupole Mass Spectrometry) from Thermo Fisher Scientific (Waltham, MA, USA). Sample analysis was performed using 20 mL amber screw cap vials (Thermo Fisher Scientific, Waltham, MA, USA), and the separation of target compounds was achieved using a TG-624SilMS capillary column (30 m, 0.32 mm I.D., 1.8 µm film thickness). The detailed specifications of HS-GC/MS are summarized in Table S1.
2.5. Selection of Quantification and Qualification Ions for GC-MS Analysis
Quantification ions were selected from fragment ions showing the highest sensitivity in MS spectra obtained by analyzing standard solutions in positive scan mode. Qualification ions were chosen from ions that showed sufficient sensitivity for compound confirmation and ion ratio verification without interference from other compounds. These ions were analyzed in SIM (Selected Ion Monitoring) mode for quantification, and the detailed mass to charge (m/z) values are presented in Table 2.
2.6. GC-MS Analysis
The prepared samples were heated at 99 °C for 40 minutes in the instrument's incubator, after which 1 mL of each headspace gas was injected into the GC-MS. For the separation of VOCs loaded onto the capillary column, the column oven temperature was held at 50 °C for 5 minutes, then increased to 100 °C at a rate of 10°C per minute and further raised to 120 °C at a rate of 20 °C per minute. Subsequently, the temperature was increased from 120 °C to 260 °C at a rate of 30 °C per minute and held for 4.33 minutes, resulting in a total temperature program time of 20 minutes. Peak integration and quantification of the analyzed data were performed using Trace Finder 5.1 software (Thermo Fisher Scientific, Walthan, MA, USA).
2.7. Comparison of Sensitivity and Matrix Effects Among Combinations
Samples purchased from the Korean Animal Blood Bank were analyzed using 1.5 mL for each combination summarized in Table 1 to compare their relative sensitivities. The sensitivity comparison for each combination was performed as a ratio relative to control, which contained no salt or reagent (Formula 1). Additionally, to indirectly evaluate whether similar sensitivities could be achieved across samples with various matrices, sensitivity changes were measured using blood sample volumes of 0.5 mL and 1.5 mL for each combination in Table 1, with standard solutions added at the same concentration of 100 ng/mL (Formula 2). Subsequently, the three combinations showing the least sensitivity variation with sample volume were selected to evaluate matrix effects using fluorobenzene, a commonly used internal standard, comparing samples without blood to those with 0.5 mL and 1.5 mL of blood (Formula 3). Finally, for the optimal combination, matrix effects on fluorobenzene were assessed using 1 mL of actual samples received from Naeun Animal Hospital.
Formula 1:
Formula 2:
Formula 3:
3. Results
3.1. Sensitivity Comparison Across Sample Preparation Reagent Combinations
The sensitivity alteration effects among each combination were evaluated by comparing the relative responses to a control containing no additives (Table 3). Interestingly, Comb 1 demonstrated superior sensitivity enhancement across all VOC analytes, with particularly notable increases for aromatic compounds: styrene (178.6%), o-xylene (176.1%), m-/p-xylene (165.5%), ethylbenzene (160.2%), and benzene (153.6%). While toluene showed a relatively lower enhancement (75.3%), the overall sensitivity improvements were consistently higher than those observed with other combinations. This enhancement across multiple aromatic VOCs suggests that Comb 1 effectively improves the extraction efficiency of these compounds from the blood sample.
3.2. Sensitivity Alterations According to Sample Volume
The stability of analytical performance across different sample volumes was assessed by comparing the variability in sensitivity between 0.5 mL and 1.5 mL blood samples, both spiked with 100 ng/mL of the analyte. This comparison aimed to evaluate the consistency of sensitivity across samples with different matrix levels but identical analyte concentrations. (Table 4). In results, Comb 1 exhibited remarkable stability, particularly for ethylbenzene (7.7%), m-/p-xylene (8.9%), and o-xylene (9.6%), with variability under 10%. While slightly higher variability was observed for benzene (31.4%) and toluene (34.8%), these values were still among the most stable across all combinations tested. This low variability across different sample volumes is crucial for analytical reliability, especially when challenging with limited or varying sample quantities in clinical laboratories.
These results collectively demonstrate that Comb 1 provides the optimal balance of enhanced sensitivity and analytical stability. The combination of high sensitivity enhancement and low volume-dependent variability makes it particularly suitable for reliable quantification of VOCs in blood samples, where both detection capability and reproducibility are essential for accurate analysis.
3.3. Comparison of Matrix Effect Uniformity Across Combinations
After confirming the sensitivity advancement and variance alleviation, we examined the uniformity of matrix effects according to Comb 1-3. We aimed to experimentally implement various matrices by using different sample volume and verified the degree of matrix effects when applying and analyzing each combination across various matrices. Matrix effects were evaluated by measuring the sensitivity changes in samples, calculated by dividing the area values from samples with different blood weights by the area values from samples using water instead of blood.
First, when analyzing 63 blood samples obtained from Naeun Animal Hospital using 1 mL of blood without urea, fluorobenzene's matrix effects showed a wide distribution ranging from 44% to -81.6% (Figure 1a). Next, matrix effects were examined for samples of 0.5 mL and 1.5 mL in Comb 1-3. In Comb 1, the effects were 10.5% and 41.2% respectively. In Comb 2, they were 22.9% and 4.3% respectively. In Comb 3, they were 2.1% and 22.4% respectively. These three combinations showed improved matrix effects within a narrower range compared to when reagents were not applied (Figure 1b).
Subsequently, using the urea and NaCl combination from Comb 1, which showed the highest sensitivity, we evaluated the variance degree of the matrix effect with 1 mL blood samples using H/S-GC-MS. When analyzing 40 samples, the matrix effects showed a distribution from 25% to -35.5%, confirming reduced matrix effects compared to the control (Figure 2). In short, cases with urea mixtures showed matrix effects more uniformly, compared to cases without urea.
4. Discussion
Our study demonstrates that protein denaturation combined with salt addition significantly improves the sensitivity and reproducibility for VOC detection in canine blood samples. The wide distribution of matrix effects (-81.6% to 44%) observed in untreated blood samples indicates strong protein-VOC interactions, consistent with previous studies showing stable binding of benzene to the heme pocket [9]. The dramatic reduction in matrix effect variation (25% to -35.5%) achieved with Comb 1 suggests partial disruption of these protein-VOC interactions through the combined action of urea and NaCl. The optimal performance of Comb 1 can be attributed to two complementary mechanisms. First, urea's protein denaturing effect likely disrupts the structural integrity of blood proteins, particularly hemoglobin, releasing trapped VOCs. Second, the addition of NaCl creates a salting-out effect, reducing VOC solubility in the aqueous phase and enhancing their partitioning into the headspace. This dual mechanism not only improves sensitivity but also provides consistent results across varying sample volumes, a crucial feature for clinical diagnostic applications in veterinary medicine.
While our study demonstrates the significance of protein-VOC interactions in blood analysis, several important aspects remain to be investigated. Although we observed clear effects of protein denaturation on VOC detection, the quantitative relationship between protein concentration and internal standard response has not been established. Future studies should investigate this correlation to better understand the impact of protein levels on VOC analysis. Additionally, while our focus was on protein interactions, other biomolecules such as DNA and lipids are known to interact with aromatic compounds through various mechanisms. Further research examining the relationships between different biomolecule concentrations and VOC detection would provide a more comprehensive understanding of matrix effects in biological samples.
Nevertheless, the enhanced sensitivity and improved matrix effect uniformity achieved with Comb 1 address key challenges in blood VOC analysis. The method's stability across different sample volumes makes it particularly suitable for veterinary medicine where sample quantities may be limited or varies. Furthermore, the simplified sample preparation procedure, requiring only the addition of urea and NaCl, makes this method both practical and easily implementable in routine laboratory analysis.
5. Conclusions
In this study, we developed a standardized sample preparation method for VOC analysis in WB samples using a combination of urea and NaCl. This optimized method demonstrated significant improvements in both sensitivity and matrix effect uniformity, while maintaining consistent performance across varying sample volumes. This novel method's simplified procedure and enhanced analytical performance make it particularly suitable for VOC analysis in veterinary medicine.
Author Contributions
Conceptualization, KIM.J. and JANG.G.; investigation, A.K.G. and C.R.H.; resources, A.K.G., C.I.; writing—original draft preparation, A.K.G. and K.J.; writing—review and editing, K.J. and G.S.; visualization, K.J.; supervision, K.G.; project administration, K.G.; funding acquisition, K.J. and J.G. All authors have read and agreed to the published version of the manuscript.
Funding
This research was supported by Technology Incubator Program for Startups (TIPS) funded by the ministry of SMEs (RS-2024-00441828) and Startups (MSS, Korea) and Korea Institute of Startup and Entrepreneurship Development.
Acknowledgments
We thank all partner veterinary clinics and veterinarians for collecting our data.
Conflicts of Interest
The authors declared no conflict of interests in this study.
Abbreviations
CPDA: Citrate-Phosphate-Dextrose-Adenine
SDS: Sodium Dodecyl Sulfate
VOC: Volatile Organic Compound
NaCl: Sodium Chloride
K2SO4: Potassium Sulfate
Na2SO4: Sodium Sulfate
GC-MS: Gas Chromatography-Mass Spectrometry
H/S: Headspace
SIM: Selective Ion Monitoring
References
- Chen, J.-J.; Wang, T.B.; Chang, L.-T.; Chuang, K.-J.; Chuang, H.-C.; Chang, T.-Y. Exposure and health risk assessment of volatile organic compounds among drivers and passengers in long-distance buses. Environ. Res. 2024, 252, 118959. [Google Scholar] [CrossRef] [PubMed]
- Tan, T.; Xu, X.; Gu, H.; Cao, L.; Liu, T.; Zhang, Y.; Wang, J.; Chen, M.; Li, H.; Ge, X. The Characteristics, Sources, and Health Risks of Volatile Organic Compounds in an Industrial Area of Nanjing. Toxics 2024, 12, 868. [Google Scholar] [CrossRef] [PubMed]
- Alsaadi, D.; Clements, N.; Gabuniya, N.; Francis, N.; Chand, M. EXHALED VOLATILE ORGANIC COMPOUNDS IN THE DETECTION OF COLORECTAL CANCER: A SYSTEMATIC REVIEW AND META-ANALYSIS. 2024; 23, 795–810. [Google Scholar] [CrossRef]
- Dawson, J.; Green, K.; Lazarowicz, H.; Cornford, P.; Probert, C. Analysis of urinary volatile organic compounds for prostate cancer diagnosis: A systematic review. BJUI Compass 2024, 5, 936–947. [Google Scholar] [CrossRef] [PubMed]
- Khalid, T.; Aggio, R.; White, P.; De Lacy Costello, B.; Persad, R.; Alkateb, H.; Jones, P.; Probert, C.S.; Ratcliffe, N. Urinary Volatile Organic Compounds for the Detection of Prostate Cancer. PLoS ONE 2015, 10, e0143283. [Google Scholar] [CrossRef] [PubMed]
- Perera, T.R.; Skerrett-Byrne, D.A.; Gibb, Z.; Nixon, B.; Swegen, A. The Future of Biomarkers in Veterinary Medicine: Emerging Approaches and Associated Challenges. Animals 2022, 12, 2194. [Google Scholar] [CrossRef] [PubMed]
- Amor, R.E.; Levy, J.; Broza, Y.Y.; Vangravs, R.; Rapoport, S.; Zhang, M.; Wu, W.; Leja, M.; Behar, J.A.; Haick, H. Liquid Biopsy-Based Volatile Organic Compounds from Blood and Urine and Their Combined Data Sets for Highly Accurate Detection of Cancer. ACS Sensors 2023, 8, 1450–1461. [Google Scholar] [CrossRef] [PubMed]
- Williams, M.L.; Olomukoro, A.A.; Emmons, R.V.; Godage, N.H.; Gionfriddo, E. Matrix effects demystified: Strategies for resolving challenges in analytical separations of complex samples. J. Sep. Sci. 2023, 46, e2300571. [Google Scholar] [CrossRef] [PubMed]
- Hosseinzadeh, R.; Moosavi-Movahedi, A.A. Human hemoglobin structural and functional alterations and heme degradation upon interaction with benzene: A spectroscopic study. Spectrochim. Acta Part A: Mol. Biomol. Spectrosc. 2016, 157, 41–49. [Google Scholar] [CrossRef] [PubMed]
- Shao, J., et al., The Role of Tryptophan in pi Interactions in Proteins: An Experimental Approach. J Am Chem Soc 2022, 144, 13815–13822. [CrossRef] [PubMed]
- Crowley, P.B.; Golovin, A. Cation-pi interactions in protein-protein interfaces. Proteins 2005, 59, 231–239. [Google Scholar] [CrossRef] [PubMed]
- Poulson, S.; Harrington, R.; Drever, J. The solubility of toluene in aqueous salt solutions. Talanta 1999, 48, 633–641. [Google Scholar] [CrossRef] [PubMed]
- Yang, X.; Wang, C.; Shao, H.; Zheng, Q. Non-targeted screening and analysis of volatile organic compounds in drinking water by DLLME with GC–MS. Sci. Total. Environ. 2019, 694, 133494. [Google Scholar] [CrossRef] [PubMed]
- Cervera, M.; Beltran, J.; Lopez, F.; Hernandez, F. Determination of volatile organic compounds in water by headspace solid-phase microextraction gas chromatography coupled to tandem mass spectrometry with triple quadrupole analyzer. Anal. Chim. Acta 2011, 704, 87–97. [Google Scholar] [CrossRef] [PubMed]
Figure 1.
Distribution of fluorobenzene matrix effects with or without the application of Comb 1. Matrix effects ranged from 25% to -35.5%, indicating enhanced uniformity and reduced variability (1b) compared to the control (1a).
Figure 1.
Distribution of fluorobenzene matrix effects with or without the application of Comb 1. Matrix effects ranged from 25% to -35.5%, indicating enhanced uniformity and reduced variability (1b) compared to the control (1a).
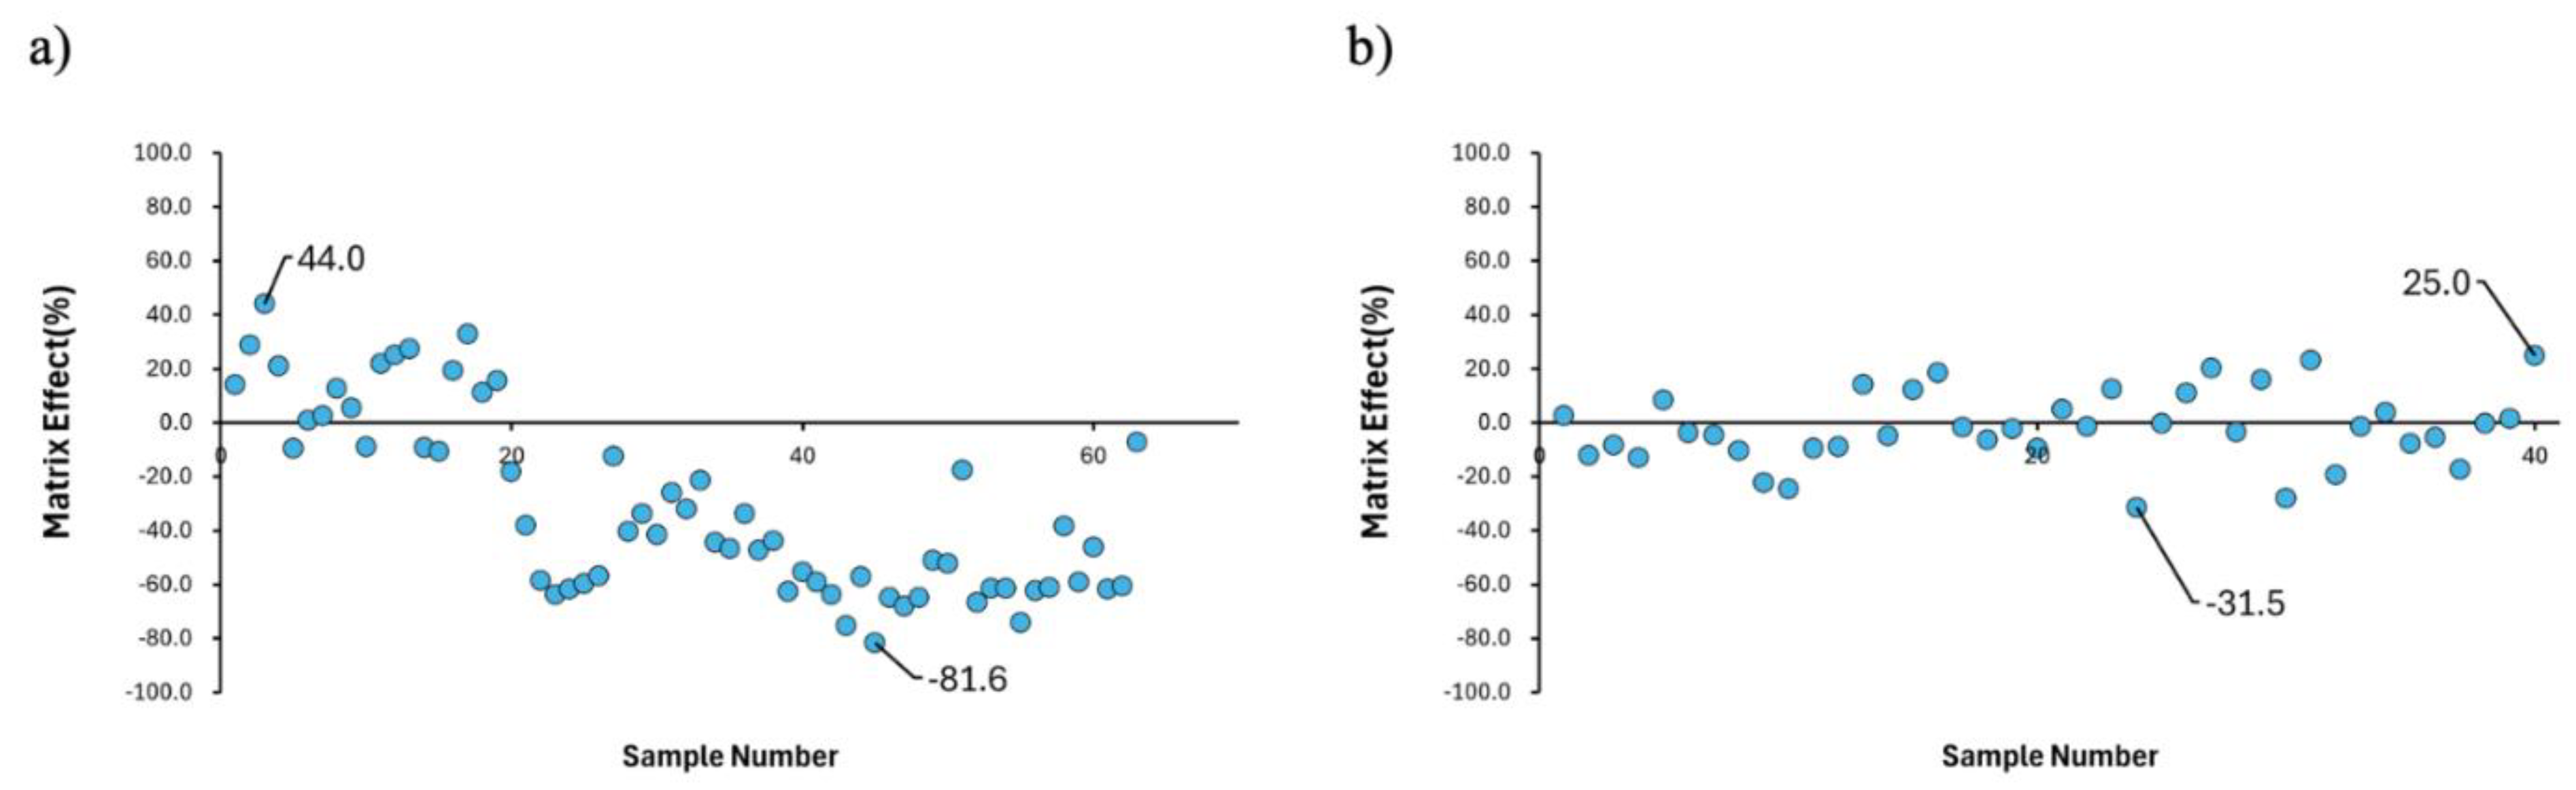
Figure 2.
Variance in matrix effects depending on the sample volume according to the combinations.
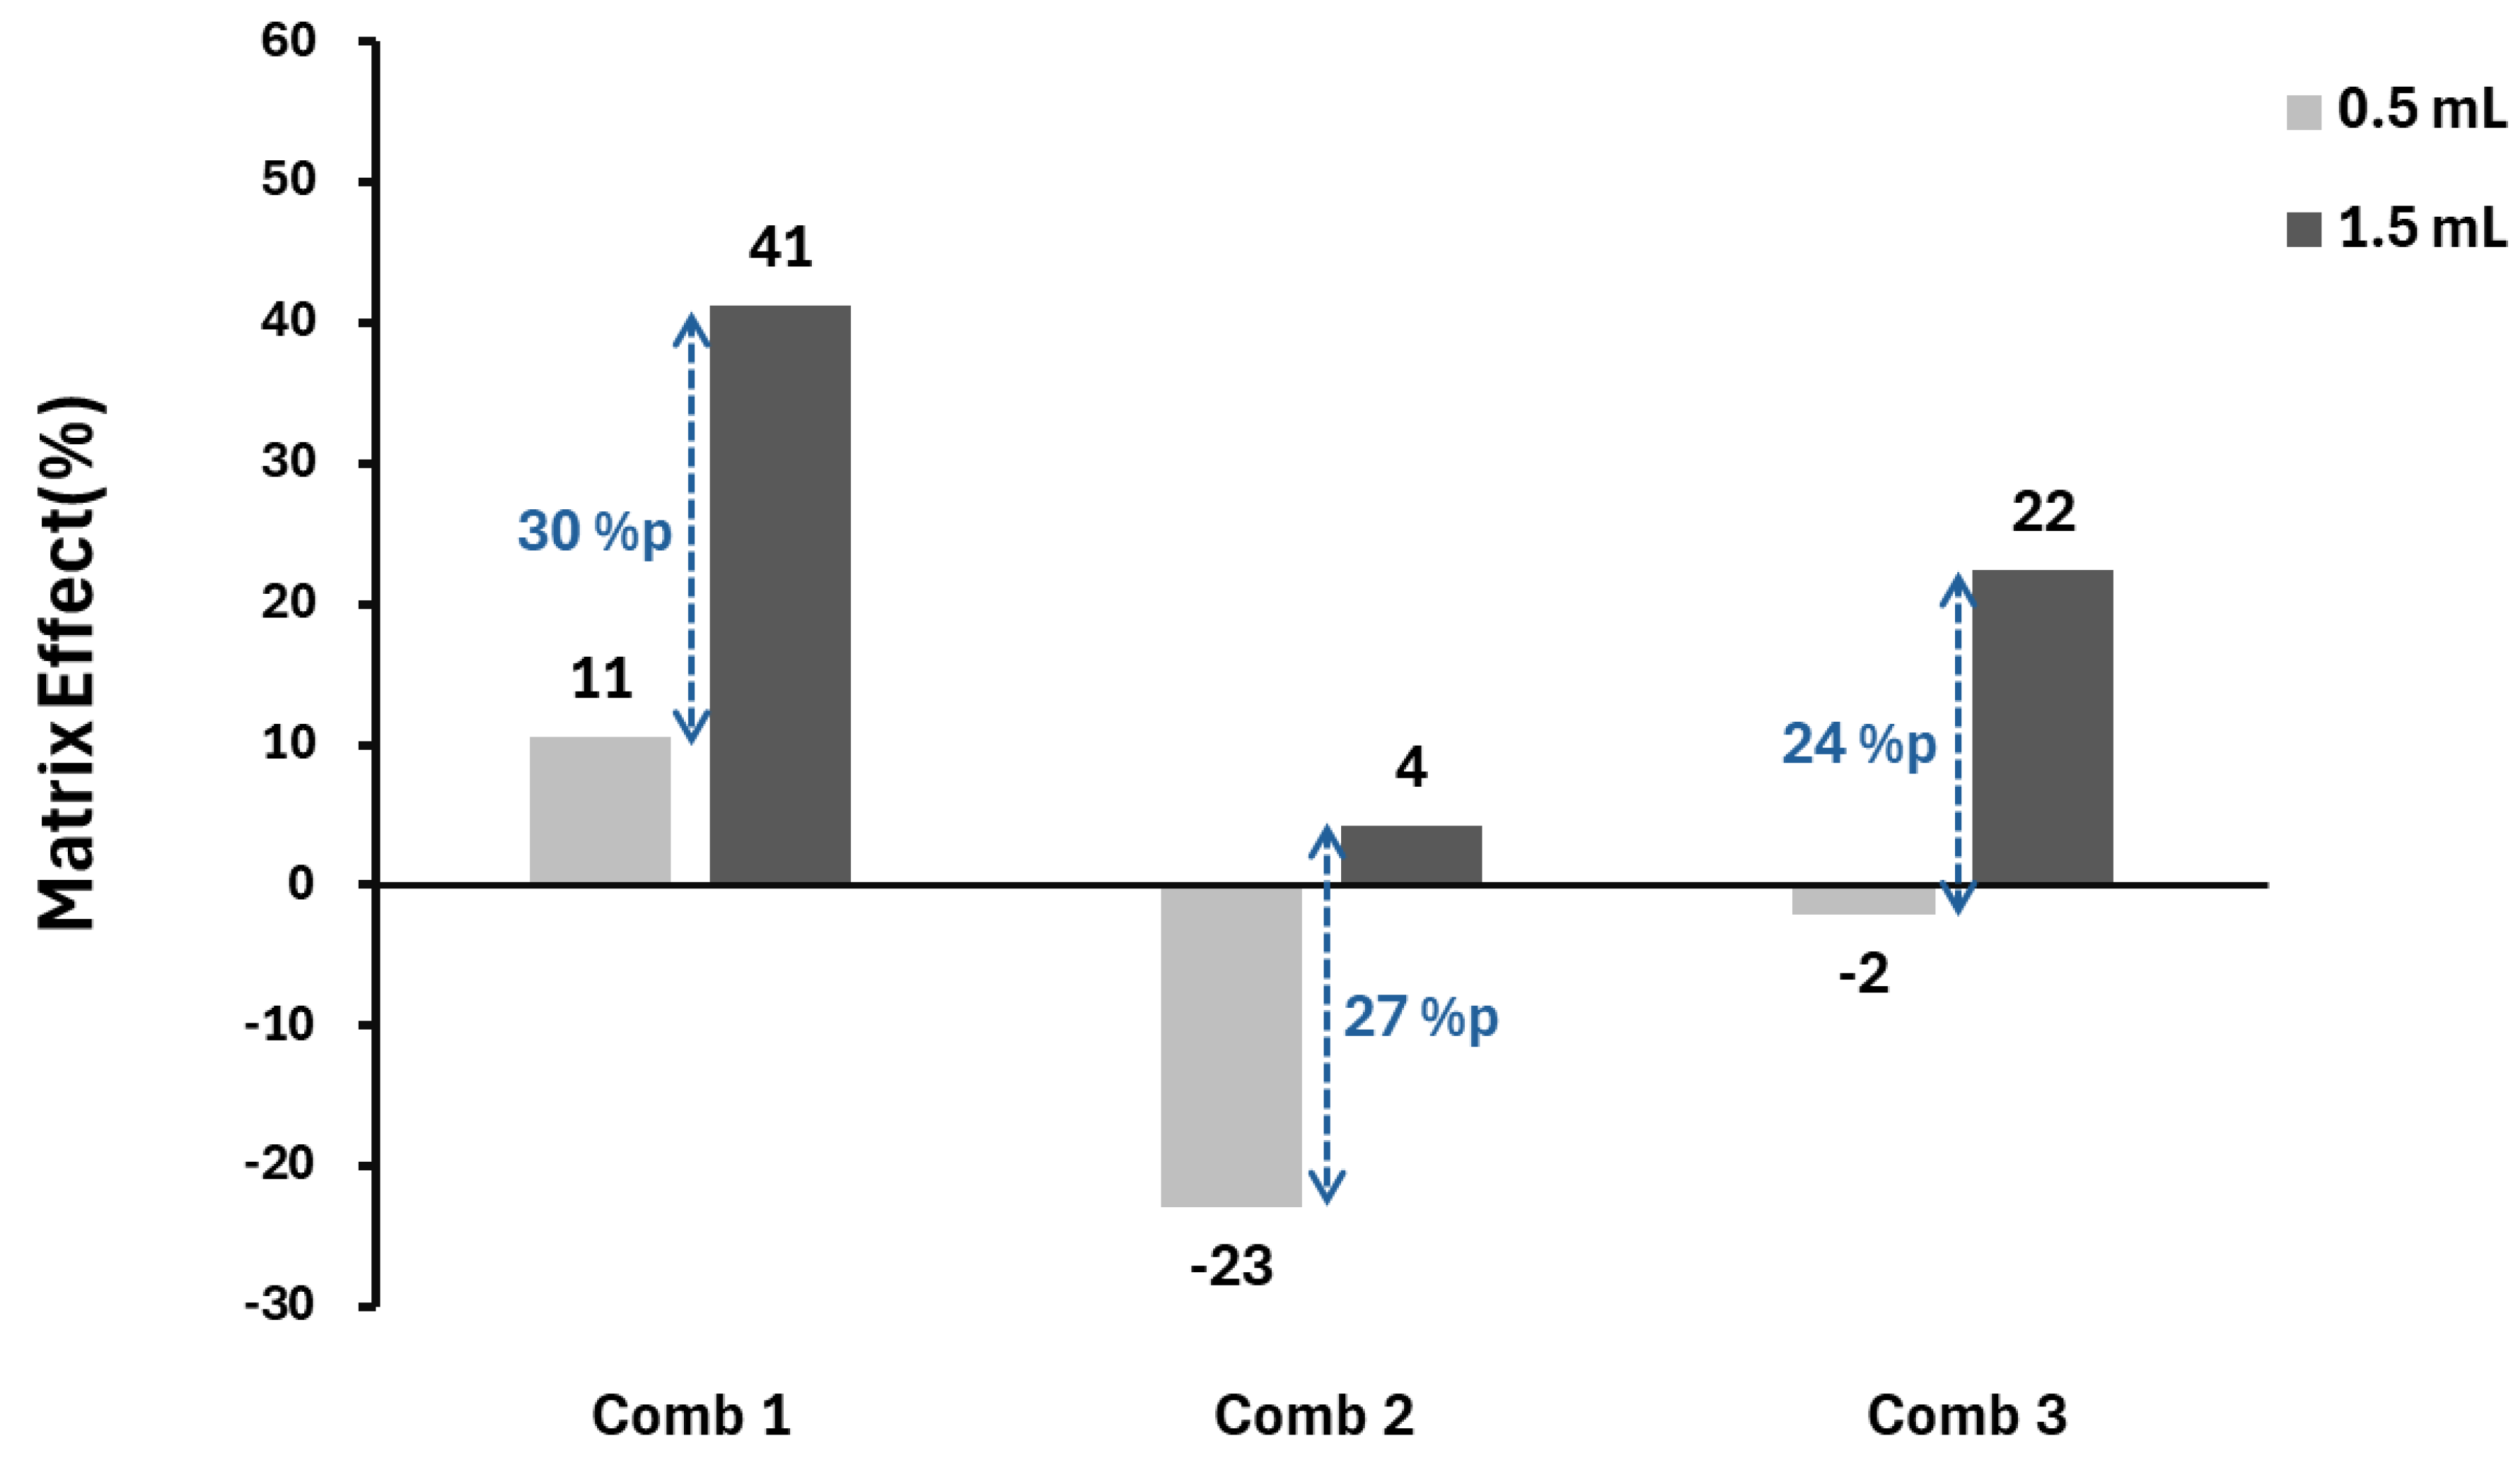

Table 1.
Combination of PDRs and salts used in this study.
| Combination(s) | PDR | Salt |
|---|---|---|
| Comb 1 | Urea | NaCl |
| Comb 2 | Urea | K2SO4 |
| Comb 3 | Urea | Na2SO4 |
| Comb 4 | SDS | NaCl |
| Comb 5 | SDS | K2SO4 |
| Comb 6 | SDS | Na2SO4 |
| Comb 7 | H2O | NaCl |
| Comb 8 | H2O | K2SO4 |
| Comb 9 | H2O | Na2SO4 |
| Comb 10 | Urea | H2O |
| Comb 11 | SDS | H2O |
| Cont. | H2O | H2O |
Table 2.
The retention time and targeted ions analyzed in this study.
| Compound | Molecularweight | Rt. | Quantificationion(m/z) | Qualificationion(m/z) | |
|---|---|---|---|---|---|
| Benzene | 78.11 | 4.78 | 78 | 77 | |
| Toluene | 92.14 | 8.08 | 91 | 92 | |
| Ethylbenzene | 106.17 | 10.48 | 91 | 106 | |
| m-/p-xylene | 106.16 | 10.68 | 106 | 105 | |
| o-xylene | 106.16 | 11.16 | 91 | 106 | |
| Styrene | 104.15 | 11.24 | 104 | 78 |
Table 3.
The sensitivity comparison results across the 12 combinations.
| Combination | Benzene | Toluene | Ethylbenzene | m-/p-xylene | o-xylene | Styrene |
|---|---|---|---|---|---|---|
| Comb 1 | 153.6 | 75.3 | 160.2 | 165.5 | 176.1 | 178.6 |
| Comb 2 | 92.3 | 72.6 | 111.0 | 111.4 | 111.5 | 102.2 |
| Comb 3 | 104.0 | 59.2 | 95.8 | 94.6 | 102.3 | 104.5 |
| Comb 4 | 80.4 | 70.7 | 42.6 | 40.8 | 42.4 | 46.0 |
| Comb 5 | 120.2 | 85.1 | 114.3 | 112.6 | 114.5 | 89.7 |
| Comb 6 | 91.9 | 56.2 | 43.6 | 41.7 | 45.4 | 42.5 |
| Comb 7 | 105.7 | 90.0 | 91.9 | 90.3 | 96.9 | 112.2 |
| Comb 8 | 116.8 | 100.7 | 108.7 | 110.4 | 112.6 | 109.6 |
| Comb 9 | 106.3 | 85.5 | 65.1 | 63.6 | 74.8 | 99.6 |
| Comb 10 | 67.1 | 55.3 | 72.2 | 70.7 | 70.9 | 70.0 |
| Comb 11 | 90.4 | 92.9 | 89.6 | 88.0 | 83.2 | 68.1 |
| Cont. | 100.0 | 100.0 | 100.0 | 100.0 | 100.0 | 100.0 |
Table 4.
Comparison of sensitivity variations across sample volumes for 12 combinations.
| Combination | Benzene | Toluene | Ethylbenzene | m,p-xylene | o-xylene | Styrene |
|---|---|---|---|---|---|---|
| Comb 1 | 31.4 | 34.8 | 7.7 | 8.9 | 9.6 | 20.0 |
| Comb 2 | 9.4 | 50.9 | 9.7 | 8.9 | 7.1 | 9.2 |
| Comb 3 | 19.2 | 44.0 | 10.9 | 9.4 | 2.2 | 8.0 |
| Comb 4 | 14.7 | 102.8 | 24.3 | 23.9 | 27.8 | 32.8 |
| Comb 5 | 45.8 | 119.0 | 36.4 | 38.0 | 38.1 | 15.5 |
| Comb 6 | 7.5 | 75.3 | 16.9 | 15.1 | 16.1 | 28.8 |
| Comb 7 | 18.0 | 50.2 | 33.3 | 35.9 | 36.2 | 31.0 |
| Comb 8 | 1.6 | 62.7 | 27.5 | 27.2 | 28.1 | 26.6 |
| Comb 9 | 43.0 | 24.9 | 58.5 | 60.2 | 59.7 | 57.3 |
| Comb 10 | 32.0 | 22.6 | 48.0 | 48.9 | 47.6 | 42.7 |
| Comb 11 | 11.2 | 107.6 | 18.7 | 19.3 | 22.6 | 31.1 |
| Cont. | 6.0 | 111.5 | 29.1 | 29.4 | 28.1 | 29.3 |
Disclaimer/Publisher’s Note: The statements, opinions and data contained in all publications are solely those of the individual author(s) and contributor(s) and not of MDPI and/or the editor(s). MDPI and/or the editor(s) disclaim responsibility for any injury to people or property resulting from any ideas, methods, instructions or products referred to in the content. |
© 2025 by the authors. Licensee MDPI, Basel, Switzerland. This article is an open access article distributed under the terms and conditions of the Creative Commons Attribution (CC BY) license (http://creativecommons.org/licenses/by/4.0/).
Copyright: This open access article is published under a Creative Commons CC BY 4.0 license, which permit the free download, distribution, and reuse, provided that the author and preprint are cited in any reuse.


