
Submitted:
21 January 2025
Posted:
22 January 2025
You are already at the latest version
Abstract
Background: Transitioning to clean energy at the household level has been challenging for most households in Low—and Middle-Income Countries. However, there is a dearth of research on what informs the choice of cleaner fuel for cooking. Therefore, this study examined the predictors of cleaner household cooking fuel in rural and peri-urban set-tings among primary cooks in Ghana.
Methodology. Data for this study were drawn from the Briquette for Cooking Fuel Project (B4CcokingF) launched in 2018 by the Volta River Authority and the University of Ghana School of Public Health to manage invasive aquatic weeds. Data were collected on the primary, secondary and tertiary fuel used, sociodemographic characteristics, and waste management measures from two riparian communities. With an analytical sample of 420, we used multinomial logistic regression to assess the determinants of clean fuel choices.
Results: Of the 420 primary cooks interviewed, 59.2% were below 40 yrs, 79% had primary school education, and 78.8% lived in peri-urban settings. Most households used charcoal as their primary fuel (64.49%), wood fuel (44.29%) as secondary fuel, and liquefied petroleum gas (LPG) as the primary tertiary fuel (48.84%). Using bivariate and multivariable models, household heads with tertiary education, waste collection by waste management companies, and increased household wealth were identified as significant predictors of cleaner cooking fuel choice.
Conclusion: Policies that focus on advancing higher education, increasing environmental consciousness, and transitioning people out of poverty are necessary to reduce the use of solid fuels and transition most households to using cleaner and sustainable cooking en-ergy sources.
Keywords:
cooking fuel choice
; primary cook
; rural setting
; peri-urban setting
; biomass briquette.
; clean fuel
; riparian communities
1. Introduction
Globally, households decide on energy consumption by choosing a mix of diverse energy sources simultaneously due to changes in socioeconomic conditions, settings, and varying end uses [1].
In Ghana, due to a lack of access to clean and reliable sources of energy, the cost of clean fuel or the quantity of inexpensive wood fuel in the surrounding area, many households rely extensively on energy sources derived from solid fuels [2]. Solid fuels are a type of fuel that can be comprised of coal, biomass, charcoal, wood, straw, animal dung, and/or crop waste [3]. They are utilized for domestic activities such as cooking, heating, lighting, boiling water, and generating income. Three billion of the world’s poorest people live in developing countries, primarily in rural regions, and rely on solid fuels as a primary source of energy [4,5]. Wood fuel is the primary source of energy for the household (mostly for cooking), despite the possible health concerns that this form of energy can potentially bring, especially when it is used inside with microscopic soot particles that travel deep into the lungs [6]. More than 60% of households in Africa and Southeast Asia rely on solid fuels for home cooking. In Sub-Saharan Africa, about 80% of the population uses biomass for energy [7].
There are several potential benefits to households transitioning to modern clean fuels, including reduced time spent on cooking and cleaning [8]. This can be explained by the higher opportunity cost of gathering and producing fuelwood. Studies have shown that households use more wood fuel when they don’t have difficulty fetching it [9]. The energy ladder hypothesis postulates that when a family’s income rises, it will switch from using traditional biomass fuels to more contemporary alternatives. The term “energy transition” describes this change [10], which forms the basis for household fuel choice.
1.1. Energy Ladder & Fuel Stacking Concepts
The idea of the energy ladder started to emerge in parallel to the fuel-wood crisis in the 1970s and 1980s [11]. Scholars and energy experts all over the world have employed it to explain the transition in household fuel choices. The energy ladder was designed to depict a hierarchical relationship between household economic status and fuel choice for cooking and heating [12]. As a household’s income and socio-economic situation improve, it switches from dirty fuels (biomass) to intermediate fuels (charcoal, kerosene), and finally adopts cleaner and modern fuels [13]. However, the situation is quite different from the ideal in the developing world. Households do not linearly transition from biomass fuels to modern fuels, as accentuated by the energy ladder model [14,15]. Energy (fuel) stacking is a common practice in the world [16,51]. The findings from these contemporary studies are an indication that household fuel choices are influenced by a myriad of economic and non-economic factors [15].
Masera and Navia originated the concept of energy stacking as a critique of the energy ladder theory in rural Mexico [16]. The consumer economic theory recognizes that higher income necessitates higher energy consumption and vice versa. The advantages and disadvantages of fuel stacking and energy laddering are, therefore relative rather than absolute. Biomass occupies the lowest part of the energy ladder. Biomass refers to any naturally occurring combustible material. Woodfuel is a major component within this classification, but grass, crop residues, or dung also fall under biomass and are easily accessible [17,18].Charcoal is a solid fuel derived from wood through a process called pyrolysis. It involves heating the wood to burn off most of the material, leaving pure carbon [19]. Consequently, charcoal shares several advantages and disadvantages with biomass. As a historical and cultural fuel, charcoal preserves the taste of food in contrast to modern energy [20]. Like biomass, charcoal emits organic and nonorganic compounds that are harmful both to human health and the environment [19].
Kerosene is ranged above charcoal. Kerosene is derived from petroleum and is produced during the distillation of crude oil [21]. Compared to its immediate predecessor and biomass, kerosene burns more cleanly and more efficiently and is of an advantage in terms of both user health and the environment. In urban and other resource scarce settings, obtaining kerosene may require less time than gathering biomass [22]. Liquefied petroleum gas (LPG) comes next after kerosene. It is derived from petroleum. It contains propane, butane, or a combination of the two. In particular, LPG releases much less sulphur dioxide than kerosene or biomass [22]. LPG stove presents an “investment barrier” due to the cost of the equipment [16]. Households must additionally pay a deposit for the cylinders that contain the gas [23]. To combat the risks associated with distribution, a household may purchase multiple canisters, increasing the uptake costs of LPG further (Heltberg 2005). After these initial fixed costs, however, the cost of LPG every month may be less than the cost of purchasing biomass [23,24]. In this study, LPG is used as a clean fuel.
At the top of the energy ladder is electricity. In Ghana, about 85% of the population has access to electricity, but very few use it as cooking fuel despite it being clean and the most efficient source of energy for cooking, with minimal health implications with all safety precautions in place. Electricity can be generated from large-scale sources such as nuclear, water, gas, or coal (grid-based) or non-grid sources such as small-scale oil generators or renewable energy [25]. The tasks of collecting, purchasing, or replenishing supplies largely do not apply, except for prepaid electricity, for which users must visit a utility to make payments or purchase online [23,26].
Many people continue to use cooking fuel concurrently even those who have access to clean cooking continue in a practice known as “fuel stacking”. To understand why people, use multiple fuels concurrently, a study reviewed 100 articles and concluded that fuel stacking is largely driven by the Physical Opportunity domain of the COM-B model [51]. This suggests that the persistence of biomass cooking is less culturally anchored than has previously been assumed, and highlights the importance of providing reliable, affordable access to clean fuels.
1.2. Health, Economic and Environmental Risks Associated with Cooking Fuels
The dependence on less clean fuels for cooking and heating is a major source of House Air Pollution (HAP) globally. This phenomenon is significantly associated with respiratory and cardiovascular morbidities, widening the global mortality rate [27]. Major health issues mediated by pollutants from biomass consumption include upper and lower respiratory tract infections, lung cancer, stroke, obstructive pulmonary diseases, burn injuries and premature deaths.
According to the World Bank’s 2020 report, 4 billion people worldwide lack access to clean, efficient, convenient, safe, reliable, and affordable cooking energy [28]. In low- and middle-income countries, poorly constructed cookstoves and open fires give rise to about 95% of the 300,000 global cooking-related mortalities annually [29]. Women and children bear a disproportionate share of the burden of collecting and processing firewood in developing countries [2,30]. This cultural practice takes away from productive time and reduces opportunities for women’s engagement in beneficial economic endeavours [31].
According to the 2022 world outlook energy report, the world produces 37 billion tonnes carbon dioxide (CO2) emission yearly of which household cooking fuel combustion is thought to produce 25% of global emissions – black carbon, the second largest contributor to climate change after CO2 [27,32]. Black carbon absorbs a million times more energy per unit mass than CO2 but has a shorter half-life, and its effects are amplified on a regional scale in areas close to the source of emissions [27], causing global warming and disrupting regional environmental systems. According to the International Energy Agency (IEA), more than half of all wood harvested globally is used for fuel [33] and is harvested from nearby forests, depleting our forest area of some species and causing deforestation.
Governments in developing countries have enacted policy interventions focused on promoting the transition from traditional fuels by households towards the adoption of cleaner and modern fuels for HAP reduction. The promotion of LPG access, increased electricity consumption, and the adoption of improved cookstoves with chimneys are some of the interventions aimed at reducing HAP exposure [34]. Nonetheless, most people in sub-Saharan Africa are caught in a dilemma in terms of fuel choice due to socio-economic reasons [4,35,36,37,38]. The cost of using a cleaner and more sustainable source of energy plus maintaining a particular cooking culture culminates in the fuel choices made for cooking. With limited information on what may influence these choices, this study focuses on examining the determinants of cleaner fuel choice for cooking in Ghana.
2. Materials and Methods
2.1. Study Setting, Sampling, and Sample Size Calculation
The data presented here is a component of the baseline study of the Briquette for Cooking Fuel Project (B4CcokingF), a cluster randomized controlled trial in two riparian towns in the Eastern (Kpong) and Greater Accra (Asutuare) regions (Figure 1). Kpong is one of the main towns in the Lower-Manya Krobo Districts with 16 communities and mostly dominated by the Krobos, but there are also Akans, Ewes, Hausas, and Gas. Asutuare is in the Greater Accra region's Shai-Osudoku District. Six communities divide the town; the Ga-Adangme and Ga tribes make up most of the population with other tribes rediding there. Farming, fishing, or fish mongering are the main sources of income for the communities. Most households (HHs) use open fires, or charcoal stoves, or a combination of open fires and charcoal stoves, or LPG cookstoves for cooking and warming food.
The Lower Volta Lake (LVL) extends from the Akosombo Dam in southeastern Ghana to the town of Yapei in the Central Gonja District, Northern Region of Ghana, some 400 kilometres (250 miles) to the north. The southern end of the LVL is home to Asutuare and Kpong. Aquatic weeds cover about 70% of the entire LV basin. Kpong and Asutuare areas, thus disrupting the water ecosystem, social, cultural, and economic activities, as well as the education of the girl child.
In 2018, the Volta River Authority and the School of Public Health at the University of Ghana launched the B4CcokingF with the goals of (i) managing invasive aquatic weeds through the production of biomass briquettes for cooking/heating and (ii) offering the communities an alternative fuel source and livelihood (i.e., biomass briquettes from aquatic weeds) to minimize the reliance on wood fuel. In 2019, we conducted a baseline census of all 22 communities in Kpong and Asuture towns. We identified 8,825 HHs, totaling 1907 compound houses. A " household" is a collective of individuals who share the same space, eat from the same pot, adhere to the same housekeeping practices, and receive care as a single unit. We used the term "compound house" to refer to HHs that share a common space. We restricted the B4CcokingF study to compound houses with a maximum of four households, to prevent air pollution from nearby HHs from contaminating the study houses. This restriction will enable us to supply briquettes to each HH in a compound house during the project's intervention period. Therefore, we considered 1104 of the 1907 compound houses that met the above requirement.
We estimated the sample size by considering the following factors: a 30% decrease in PM2.5 levels from 850 g/m3 [39]; a 0.1 cluster effect; an intra-cluster correlation of 0.25; a 95% confidence interval; 5% type I error rate; 80% power; 359 variability; and a 15% rate of respondents who did not respond or dropped out. We determined the sample size for the RCT to be 210 for each group (420 overall) using a method described in [40]. In the current analysis, all 420 baseline participants were considered. Ethical approval for this study was obtained from the Ethics Review Committee, Ghana Health Service through School of Public Health, University of Ghana and community leaders of Asutuare and Kpong township (GHS-ERC:015/03/21).
2.2. Data Collection
Trained field workers, led by a community representative, visited eligible HHs in each community and conducted survey interviews with primary cooks with a REDCap (Research Electronic Data Capture) device to gather data from participants using Android phones. Participants were interviewed with a slightly modified WHO questionnaire [41]. The online questionnaire is divided into six sections: HH characteristics, HH socioeconomic characteristics, water and sanitation, fuel storage for cooking, fuel devices for heating and lighting, and health outcomes. 2
2.2.1. Measures
Outcome Variables
The outcome variable was primary household fuel type / choice- the use of charcoal (yes, no), or wood fuel (yes, no), or LPG (yes, no) as a primary fuel. This was transformed into a nominal variable, where 0 was coded as wood fuel, 1 as charcoal and 2 as LPG. The use of wood fuel served as the base or reference category for the model.
Explanatory Variables
The explanatory variables are age (coded as <40, 41-64, >65), sex (coded as 0=male, 1=female), education (coded as 0=primary, 1=secondary, 2=tertiary), civil status (coded as 0=single, 1=married, 2=ever married), religion (coded as 0=Christian, 1=Muslim, 2=Agonist), ethnicity (coded as 1=Ga-Adangbe, 2=Ewe, 3=Akan, 4=others), age of household head (coded as 0=<40, 1=41-64, 2=>65), household head education (coded as 0=primary, 1=secondary, 2=tertiary), family size (coded as 0= <3, 1=3-5,2=>5), dwelling type (coded as 0=Urban, 1= Peri-urban), toilet facility type (coded as 0=improved, 1=unimproved), water source (coded as 0=improved, 1=unimproved), waste disposal method (coded as 0=burning, 1=indiscriminate disposal, 2=collection), wealth index (coded as 0=Lower class, 1= middle class, 2=upper class), and household average monthly income.
2.3. Data Analysis
Descriptive, bivariate and multivariate analyses were used to identify the predictors of cleaner cooking fuel choice. Descriptive statistics were used to report the frequency of the socio-demographic characteristics of participants (e.g., primary cook, household head and household characteristics) and cooking systems (e.g., stove and fuel usage, fuel usage by primary, secondary and tertiary fuel choice). This was followed by a bivariate analysis that assessed the relationship between household demographics by fuel type. Due to the nominal nature of the outcome variable, a multinomial logistic regression model was used to compute a multivariable model for the determinants of fuel choices. Multicollinearity was not an issue as all the model covariates had a variance inflation factor of less than 10 (The range of VIF from the model was 1.5 - 4.7) [42].
3. Results
3.1. Characteristics of Study Participants
Table 1 is a summary table of the characteristics of study participants. A descriptive analysis of the data shows that most of the participants were below 40 yrs (59.2%), females (93.5%), had primary education (79.0%), married (50.6%), belonged to the Christian religion (92.1%), and had a normal BMI (38.1%). Also, most of the household heads were above 65 yrs (94%) and were male (67.1%). The majority of the households (78.8%) were situated in peri-urban settings, with family sizes exceeding six (39.6%). Additionally, 96.1% had improved water sources, 80.2% had improved toilet facilities, and 53.7% disposed of their waste indiscriminately. The households belonged to the lower-class wealth index, accounting for 67.8%.
3.2. Bivariate Association Between Participant Characteristics and Fuel Type
Table 2 is a description of the bivariate association between participant characteristics and use of fuel type. The results from Table 2 shows that the sex of the participants was significantly associated with household fuel types (p=0.019). That is, the highest (64.6%) and lowest (15.0%) fuel types used by female participants were wood fuel and LPG respectively. The marital status of the participants was significantly associated to household fuel types (p=0.001). That is, the highest (61.5%) and lowest (10.3%) fuel types used by married participants were wood fuel and LPG respectively. The educational level of the participants was significantly associated to household fuel types (p<0.001). That is, the highest (69.8%) and lowest (11.2%) fuel types used by participants who had primary education were wood fuel and LPG respectively. The ethnicity of the participants was significantly associated to household fuel types (p=0.024). That is, the highest (58.7%) and lowest (17.5%) fuel types used by Ewe participants were wood fuel and LPG respectively.
The sex of the household head was significantly associated to household fuel types (p=0.016). That is, the highest (61.0%) and lowest (13.1%) fuel types used in houses with male household heads were wood fuel and LPG respectively. The educational level of the household head was significantly associated to household fuel types (p<0.001). That is, the highest (74.5%) and lowest (9.8%) fuel types used in houses with household heads having primary education were wood fuel and LPG respectively.
The income level of households was significantly associated to household fuel types (p=0.022). That is, the highest (61.4%) and lowest (15%) fuel types used in households with a monthly income of GHC 501-1000 were wood fuel and LPG respectively. The household ownership status was significantly associated to household fuel types (p=0.004). That is, the highest (64.0%) and lowest (8.6%) fuel types used by participants who live in rented houses were wood fuel and LPG respectively. Household dwelling type was significantly related to household fuel types (p=0.001). That is, the highest (75.0%) and lowest (8.3%) fuel types used by participants who live in houses occupied by multiple households were wood fuel and LPG respectively. Family size was significantly associated to household fuel types (p<0.001). That is, the highest (69.7%) and lowest (10.1%) fuel types used by participants whose family size was 4-6 were firewood and LPG respectively.
3.3. Predicting the Association Between Study Characteristics and Fuel Choice
Table 3 presents the results of the multinomial logistic regression estimate of household characteristics by fuel type. In this model, being ever married decreased the likelihood of using LPG (adjusted odds ratio (AOR) = 0.12, confidence interval (CI), 0.02 – 0.71) and charcoal (AOR: 0.18, 0.04-0.83) compared to wood fuel. Household head having a tertiary education increases the likelihood of utilizing LPG (AOR: 11.66, 95%CI: 1.57,12.08). Having waste collected by a waste management company increases the likelihood of using LPG (AOR: 8.95 ,95%CI: 1.20- 66.48). Having 6 or more family members in a household decreases the likelihood of using LPG (AOR: 0.18, 95%CI: 0.06-0.51). Relatively, rich households are more likely to use LPG (AOR: 3.65, 95%CI: 1.489.03) and charcoal (AOR: 11, 95%CI: 2.62-46.26).
4. Discussion
This study aimed to examine the determinants of cleaner cooking fuel choice among two riparian peri-urban communities in Ghana. Findings from this study show that most households used charcoal as their primary fuel (64.49%), followed by LPG (20.77%) and wood fuel (14.73%). A family size of 6 or more and having been previously married reduced the likelihood of using LPG as the primary fuel. Household heads with tertiary education increased the likelihood of utilizing LPG and having or being relatively rich, as indicated by the wealth tertile increased the likelihood of using LPG and charcoal compared to wood fuel as a primary fuel. Additionally, the majority of rich households with heads having tertiary education and having their waste collected by waste management companies increased the likelihood of using LPG. It is worth noting that although increasing wealth increased the likelihood of using cleaner fuel (LPG), this did not stop the wealthy from using dirty fuels such as charcoal more extensively. The findings from this study highlight the challenge of fuel stacking, where changes in behavior towards the use of only clean sources of fuel do not hold for most households.
This study has several strengths. First, data were derived from a baseline of a cluster randomized control trial, which randomly assigned households to the intervention and control arms. Thus, each household, or participant by inference, had an equal chance of recruitment into any of the arms. Second, a census was taken of all the communities to ensure representativeness, thus, reducing selection bias. Finally, this study employed a structured questionnaire on RedCapp using a slightly modified version of the WHO questionnaire as such information bias may not explain these findings. The WHO questionnaire for monitoring household energy use and SDG indicators has been used in several studies across the Africa region, an example is Parvizi et al., 2024.
The study findings showed that most households used charcoal as their primary and secondary cooking fuel and LPG as their main tertiary fuel. This result is consistent with a study among urban households in Ghana, which established that most households rely largely on wood and charcoal and occasionally on LPG or electricity [43]. Also, relying on aggregate data using the GLSS, it was reported that wood fuels continue to be the most common energy source used for cooking by households in Ghana [44,49]. In Nigeria, a population-based research report suggests that almost 70% of households rely on biomass for cooking [45].
The novelty of this study lies in the findings that demographic factors such as higher educational level, having waste collected by waste management companies, and relatively rich households are the main determinants of LPG use. This is analogous to a study among households in Malawi, which showed that families choose one type of cooking fuel over another depending on the age of the household head, income, location and household head education status [48]. Another related study in Uganda showed that demographic characteristics such as level of education, age, and income influence a family’s choice of cooking fuel [50]. Furthermore, corroborating studies conducted among households in China and Kenya found that family size, economic status, prices of fuel, gender and education are the determinants of household fuel choices in urban settings [46,47}. In sum, the extant literature has emphasized general household fuel choice and not cleaner sources of energy. Thus, this study shows that such factors may similarly influence the use of cleaner sources of energy, such as liquified petroleum gas.
5. Conclusions
The findings from this study highlight the need for important policy and programmatic changes aimed at increasing education on the use of cleaner fuels and resourcing households with the means to follow through with this education. Education should focus on enabling household heads to make fuel substitutions that will improve energy efficiency and have fewer negative effects on the environment, society, and people’s health. Effective interventions should include the advancement of the Government of Ghana’s efforts to raise the overall level of education, education on environmental risk factors, and support the most vulnerable transition out of poverty. This will contribute to a reduction in the use of charcoal from wood, which will indicate a reduction in the pressure that is placed on wood supplies and will help contribute towards mitigating deforestation. Furthermore, stakeholders and policies in the energy sector should advance and promote the use of renewable, clean technologies to reduce the impact on the ecosystem, reduce pollution, and meet household demand. This should include enhancing initiatives such as the National LPG Promotion Program and the Rural LPG Promotion Program, increasing subsidies for LPG, extending the LPG Cylinder Recirculation Model to rural regions, and addressing the issue of LPG supply bottlenecks [52].
Author Contributions
Conceptualization, methodology, investigation, writing-original draft, funding A.B.C; conceptualization, methodology, review, editing, funding acquisition and supervision R.Q; conceptualization, visualization, review, editing, methodology and supervision G.O.B. All authors have read and agreed to the published version of the manuscript.
Funding
This study was supported by the Volta River Authority of Ghana under the Environmental Sustainability Department and the Canada Research Chairs Programme in support of Dr. Godfred Boateng, Canada’s Research Chair in Global Health and Humanitarianism.
Institutional Review Board Statement
Ethical review and clearance were obtained from the Ethics Review Committee, Ghana Health Service through the School of Public Health, University of Ghana and community leaders of Asutuare and Kpong township (GHS-ERC:015/03/21).
Informed Consent Statement
Informed consent was obtained from all participants before they took part in the study.
Data Availability Statement
The data presented in this study are available on a reviewed request from the authors.
Acknowledgments
We appreciate the support from our funders, chiefs, community leaders and all participants.
Conflicts of Interest
The authors declare that they have no known competing financial interests or personal relationships that could have appeared to influence the work reported in this paper.
Abbreviations
The following abbreviations are used in this manuscript:
| B4CooingF | Briquette for cooking fuel |
| CO2 | Carbon dioxide |
| HH | Household |
| LPG | Liquified petroleum gas |
| LVL | Lower volta lake |
| REDCap | Research electronic device capture |
| WHO | World Health Organisation |
References
- World Health Organization. Household Air Pollution and Health. Geneva, Switzerland. Available online: http://www.who.int/mediacentre/factsheets/fs292/en/ (accessed on 20 December 2023).
- Baiden, P.; Boateng, G.O; Dako-Gyeke, M.; Acolatse, C.K.; Peters, K.E. Examining the effects of household food insecurity on school absenteeism among Junior High School students: findings from the 2012 Ghana global school-based student health survey, African Geographical Review,2019,. [CrossRef]
- Acharya, B.; Marhold, K. Determinants of household energy use and fuel switching behavior in Nepal. Energy, 2019 169, 1132–1138. [CrossRef]
- Rahut, D. B.; Das, S.; Groote, H.; Behera, B. Determinants of household energy use in Bhutan. Energy, 2014 69, 661–672. [CrossRef]
- Karimu, A. ; Cooking fuel preferences among Ghanaian Households: An empirical analysis. Energy for Sustainable Development, 2015, 27, 10–17. [Google Scholar] [CrossRef]
- Behera, B.; Ali, A. Household energy choice and c intensity: Empirical evidence from Bhutan. Renewable and Sustainable Energy Reviews, 2016, 53, 993–1009. [Google Scholar]
- Liao, H.; Tang, X.; Wei, Y. M. Solid fuel use in rural China and its health effects. Renewable and Sustainable Energy Reviews, 2016, 60, 900–908. [Google Scholar] [CrossRef]
- Joshi, J.; & Bohara, A. K. Household preferences for cooking fuels and inter-fuel substitutions: Unlocking the modern fuels in the Nepalese household. Energy Policy, 2017, 107, 507–523.
- Muller, C.; Yan, H. Household fuel use in developing countries: Review of theory and evidence. Energy Economics, 2018, 70, 429–439. [Google Scholar] [CrossRef]
- Meried, E. W. Rural household preferences in transition from traditional to renewable energy sources: the applicability of the energy ladder hypothesis in North Gondar Zone. Heliyon, 2021, 7(11), 08418. [Google Scholar] [CrossRef]
- Toole, R. The Energy Ladder: A Valid Model for Household Fuel Transitions in Sub-Saharan Africa? Master of Science in Urban and Environmental Policy and Planning and Economics http://hdl.handle.net/10427/012067 (accessed on 10 February 2020).
- Karimu A., Mensah J.T., Adu G. Who Adopts LPG as the Main Cooking Fuel and Why? Empirical Evidence on Ghana Based on National Survey. World Dev. 2016; 85:43–57. [CrossRef]
- Smith, K.R.; McCracken, J.P.; Thompson, L.; Edwards, R.; Shields, K.N.; Canuz, E.; Bruce, N. Personal child and mother carbon monoxide exposures and kitchen levels: Methods and results from a randomized trial of woodfired chimney cookstoves in Guatemala (RESPIRE). J. Exp. Sci. Environ. Epidemiol. 2010, 20, 406–416. [Google Scholar] [CrossRef] [PubMed]
- Dendup N., Arimura T.H. Information leverage: The adoption of clean cooking fuel in Bhutan. Energy Policy. 2018; 125:181–195 . [CrossRef]
- Ogwumike, F. O.; Ozughalu, U. M.; Abiona, G. A. Household energy use and determinants: Evidence from Nigeria. International Journal of Energy Economics and Policy, 2014, 4, 248–262. [Google Scholar]
- Masera, O. R.; Navia, J. Fuel switching or multiple cooking fuels? Understanding inter-fuel substitution patterns in rural Mexican households. Biomass and Bioenergy, 1997, 12, 347–361. [Google Scholar] [CrossRef]
- Bonjour, S.; Adair-Rohani, H.; Wolf, J.; Bruce, N.G.; Mehta, S.; Prüss-Ustün, A.; Lahi, M.; Rehfuess, E.A.; Mishra, V.; Smith, K.R. Solid fuel use for household cooking: Country and regional estimates for 1980–2010. Environ. Health Perspect. 2013, 121, 784–790. [Google Scholar] [CrossRef]
- Twumasi, M.A. The impact of credit accessibility on rural households clean cooking energy consumption: The case of Ghana. Energy Rep. 2020; 6:974–983. [CrossRef]
- McCarron A., Uny I., Caes L., Lucas S.E., Semple S., Ardrey J., Price H. Solid fuel users’ perceptions of household solid fuel use in low- and middle-income countries: A scoping review. Environ. Int. 2020; 143:105991. doi: 10.1016/j.envint.2020.105991. [CrossRef]
- Nansaior, A.; Patanothai, A.; Rambo, A. T.; Simaraks, S. Climbing the energy ladder or diversifying energy sources? The continuing importance of household use of biomass energy in urbanizing communities in Northeast Thailand. Biomass and Bioenergy, 2011 35(10), 4180-4188.
- Lam, N. L.; Smith, K. R.; Gauthier, A.; Bates, M. N. Kerosene: a review of household uses and their hazards in low-and middle-income countries. Journal of Toxicology and Environmental Health, Part B, 2012, 15, 396–432. [Google Scholar] [CrossRef]
- Goldemberg, J. Pesquisa e desenvolvimento na área de energia. São Paulo em perspectiva, 2000, 14, 91–97. [Google Scholar] [CrossRef]
- Heltberg, R. Household fuel and energy use in developing countries: A multi-country study. The World Bank, 2005, 1–87.
- Gould C.F., Schlesinger S.B., Molina E., Bejarano M.L., Valarezo A., Jack D.W. Household fuel mixes in peri-urban and rural Ecuador: Explaining the context of LPG, patterns of continued firewood use and the challenges of induction cooking. Energy Policy. 2020; 136:111053. [CrossRef]
- Van der Kroon, B.; Brouwer, R.; Van Beukering, P. J. The energy ladder: Theoretical myth or empirical truth? Results from a meta-analysis. Renewable and sustainable energy reviews, 2013, 20, 504–513. [Google Scholar] [CrossRef]
- Ma, W. , Zhou X., Renwick A. Impact of off-farm income on household energy expenditures in China: Implications for rural energy transition. Energy Policy. 2018; 127:248–258. [CrossRef]
- WHO (2016). Clean Household Energy for Health, Sustainable Development, and Wellbeing of Women and children. In WHO Guide. Available online: http://apps.who.int/iris/bitstream/10665/204717/1/9789241565233_eng.pdf?ua=1 (accessed on 6 December 2023).
- Sharma, D.; Ravindra, K.; Kaur, M.; Prinja, S.; Mor, S. Cost evaluation of different household fuels and identification of the barriers for the choice of clean cooking fuels in India. Sustainable Cities and Society, 2020, 52, 101825. [Google Scholar] [CrossRef]
- Gallagher, M.; Beard, M.; Clifford, M. J.; Watson, M. C. An evaluation of a biomass stove safety protocol used for testing household cookstoves, in low and middle-income countries. Energy for Sustainable Development, 2016, 33, 14–25. [Google Scholar] [CrossRef]
- Ali, A.; Mottaleb, K. A.; Aryal, J. P. Wealth, education and cooking-fuel choices among rural households in Pakistan. Energy Strategy Reviews, 2019, 24, 236–243. [Google Scholar]
- Ndiritu, S. W.; Nyangena, W. Environmental goods collection and children’s schooling: Evidence from Kenya. Regional Environmental Change, 2011, 11(3), 531–542.
- World Energy Outlook 2022. www.iea/org/weo. Accessed on 15th December, 2025.
- World Energy Outlook 2019. www.iea.org/weo. Accessed on 7th January, 2022.
- Burwen, J.; Levine, D. I. A rapid assessment randomized-controlled trial of improved cookstoves in rural Ghana. Energy for Sustainable Development, 2012, 16(3), 328–338.
- Adeyemi, P. A.; Adereleye, A. Determinants of household choice of cooking energy in Ondo state, Nigeria. Journal of Economics and Sustainable Development, 2016, 7, 131–142. [Google Scholar]
- Jaiswal, V. B.; Meshram, P. U. Behavioral Change in Determinants of the Choice of Fuels amongst Rural Households after the Introduction of Clean Fuel Program: A District-Level Case Study. Global Challenges, 2021, 5, 2000004. [Google Scholar] [CrossRef]
- Mperejekumana, P.; Li, H.; Wu, R.; Lu, J.; Tursunov, O.; Elshareef, H.; Dong, R. Determinants of household energy choice for cooking in Northern Sudan: A multinomial logit estimation. International Journal of Environmental Research and Public Health, 2021; 18, 21, 11480. [Google Scholar]
- Endalew, M.; Belay, D. G.; Tsega, N. T.; Aragaw, F. M.; Gashaw, M.; Asratie, M. H. Household Solid Fuel Use and Associated Factors in Ethiopia: A Multilevel Analysis of Data From 2016 Ethiopian Demographic and Health Survey. Environmental Health Insights, 2022, 16, 11786302221095033. [Google Scholar] [CrossRef] [PubMed]
- Quansah, R.; Semple, S.; Ochieng, C. A.; Juvekar, S.; Armah, F. A.; Luginaah, I.; Emina, J. Effectiveness of interventions to reduce household air pollution and/or improve health in homes using solid fuel in low-and-middle income countries: A systematic review and meta-analysis. Environ Int. 2017, 103:73-90. [CrossRef]
- Rutterford, C.; Copas, A; Eldridge, S. Methods for sample size determination in cluster randomized trials. Int J Epidemiol. 2015, 44:1051-67. [CrossRef]
- World Health Organization Questionnaire on Health Survey. 2019.(2_harmonized_household_energy_survey_questions long_roster_final_nov2019.pdf). (accessed on 30 November 2019).
- Thompson, C. G.; Kim, R. S.; Aloe, A. M.; Becker, B. J. Extracting the variance inflation factor and other multicollinearity diagnostics from typical regression results. Basic and Applied Social Psychology,2017 39(2), 81–90. [CrossRef]
- Meng, T.; Florkowski, W.J.; Sarpong, D.B.; Chinnan, M.; Resurreccion, A.V. Cooking fuel usage in sub-Saharan urban households, Energies 2021, 14(15), 4629.
- Kutortse, D.K. Residential energy demand elasticity in Ghana: an application of the quadratic almost ideal demand systems (QUAIDS) model. Cogent Economics & Finance, 2022 10(1).
- Ifegbesan, A.P.; Rampedi, I.T.; Annegarn, H. Nigerian households' cooking energy use, determinants of choice, and some implications for human health and environmental sustainability. Habitat International, 2016, 55, 17-24.
- Zhang, X.-B.; Hassen, S. Household fuel choice in urban China: evidence from panel data. Environment and Development Economics, 2017, 22(4), 392–413. [CrossRef]
- Waweru, D.; Mose, N. Fuel Choices in Urban Kenyan Households. Journal of Economics and Sustainable Development. 2022, 2021. [CrossRef]
- Assa, M.; Maonga, B.; Gebremariam, G. Non-price determinants of household’s choice of cooking energy in Malawi. International Journal of Development and Sustainability, 2015, 4 (1).
- Immurana, M.; Kisseih, K.; Yakubu, M.; Yusif, H. Financial inclusion and households’ choice of solid waste disposal in Ghana. BMC Public Health. 2022, 22. 10.1186/s12889-022-13512-2.
- Katutsi, V.; Dickson, T.; Migisha, A. Drivers of Fuel Choice for Cooking among Uganda's Households. Open Journal of Energy Efficiency. 2020, 9. 111-129. Open Journal of Energy Efficiency. [CrossRef]
- Perros, T.; Allison, A.L.; Tomei, J. Behavioural factors that drive stacking with traditional cooking fuels using the COM-B model. Nat Energy. 2022 ,7. 886–898. [CrossRef]
Figure 1.
Map showing the Lower Volta and the study areas: Kpong in the Eastern and Asutuare in the Greater Accra regions respectively.
Figure 1.
Map showing the Lower Volta and the study areas: Kpong in the Eastern and Asutuare in the Greater Accra regions respectively.
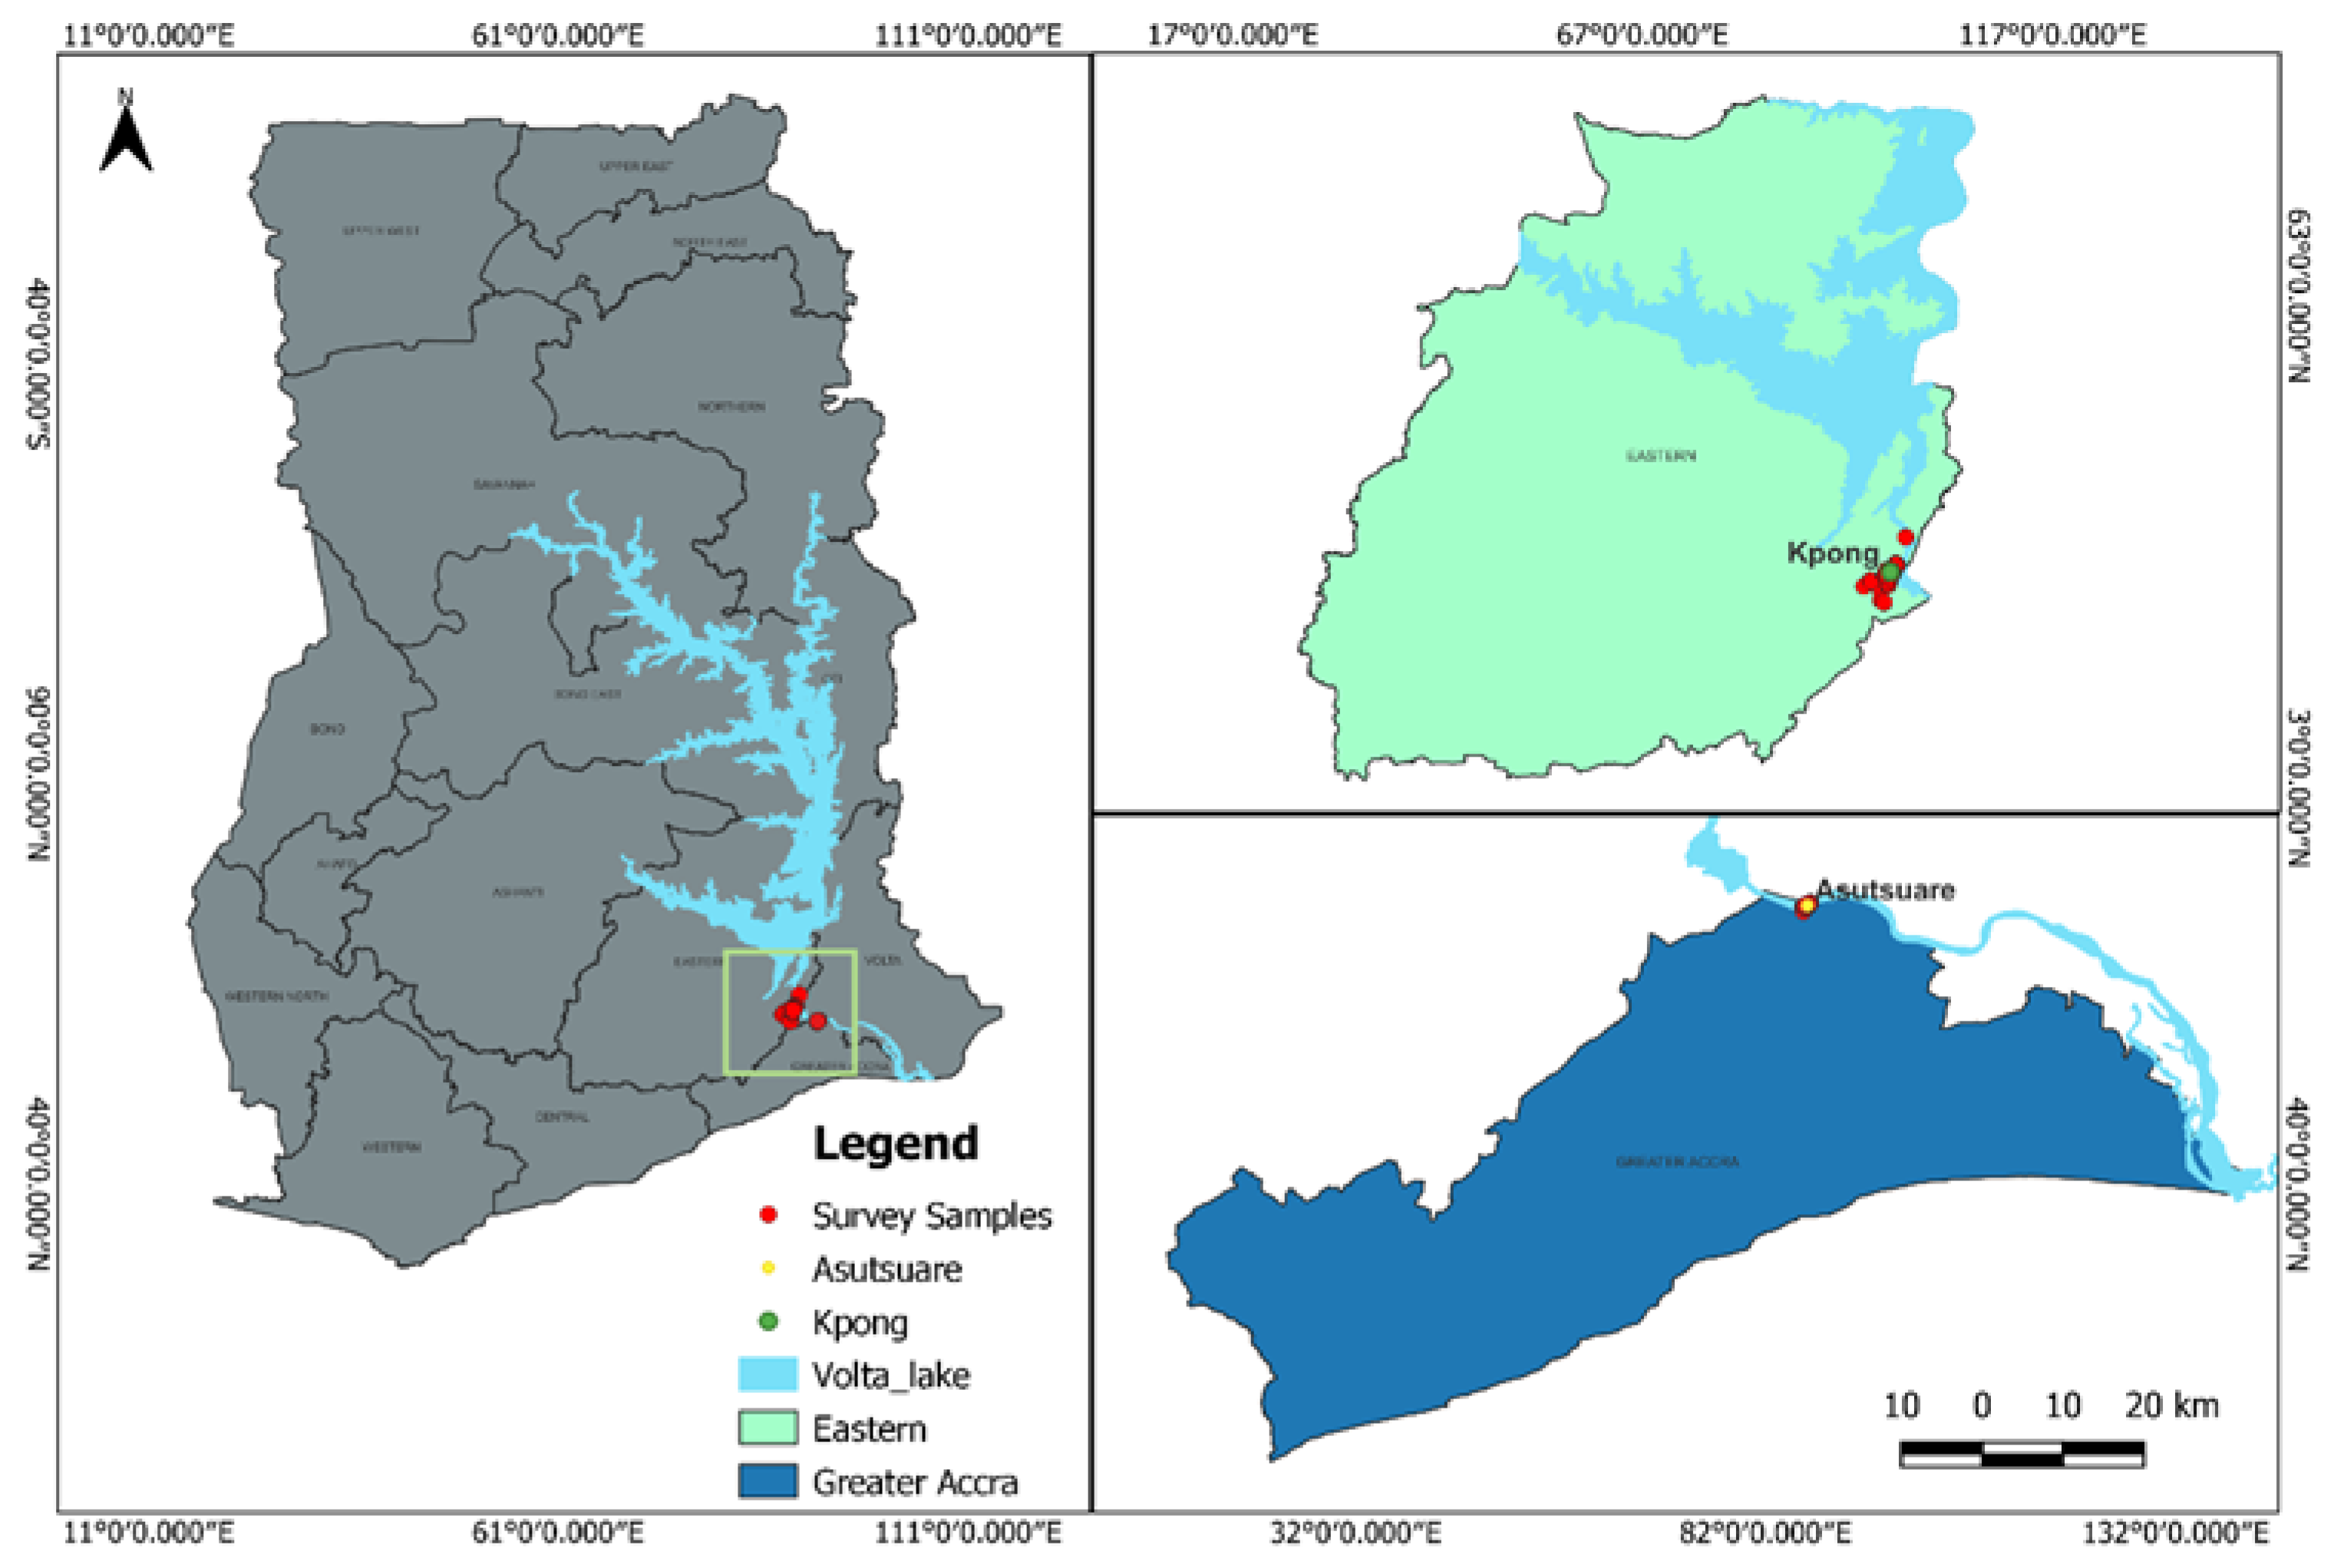

Table 1.
Primary cook, head of household, and household characteristics (n=420).
| Study population characteristics | Frequency | Percent | ||
| Characteristics of primary cook | ||||
| Age | 248 160 12 |
59.20 38.20 2.60 |
||
| Less than 40years | ||||
| 41 - 64years 65years and above |
||||
| Sex of primary cook Male Female |
27 393 |
6.40 93.50 |
||
| Educational level of primary cook Primary Secondary Tertiary |
331 68 21 |
79.00 16.20 4.80 |
||
| Civil status of primary cook Single Married Ever Married |
81 212 127 |
19.10 50.60 30.30 |
||
| Religion of primary cook Christian Muslim Agonist |
386 25 9 |
92.10 6.00 1.90 |
||
| Ethnicity of Primary Cook Ga-Adambge Ewe Akan Others |
83 239 19 79 |
19.80 57.00 4.50 18.60 |
||
| BMI category Under weight (<18.5) Normal (18.5- 24.9) Over weight (25.0-29.9) Obese (≥ 29,9) |
27.0 ±6.7 19 137 99 103 |
5.30 38.10 27.70 28.90 |
||
| Characteristics of household head | ||||
| Age of household head | 8 18 394 |
1.70 4.30 94.00 |
||
| Less than or equal to 40years | ||||
| 41 - 64years 65 years and above | ||||
| Sex of household head Male Female |
282 138 |
67.1032.90 | ||
| Educational level of household head Primary Secondary Tertiary |
296 93 30 |
70.60 22.20 7.20 |
||
| Characteristics of household | ||||
| Community type Peri urban Rural |
331 89 |
78.80 21.20 |
||
| Size of family Less than 3 3-5 6 or more |
112 142 166 |
26.70 33.70 39.60 |
||
| Toilet facility type *Improved Toilet Facility *Unimproved Toilet Facility |
336 84 |
80.20 19.80 |
||
| Water source ^Improved Water Source ^Unimproved water Source |
404 16 |
96.20 3.82 |
||
| Waste disposal Burning Indiscriminate Disposal Collection. |
156 225 36 |
37.20 53.70 8.60 |
||
| Wealth index Lower class Middle class Upper class |
284 107 29 |
67.80 25.30 6.90 |
||
1 Note: Primary here refers to no education and primary, secondary is JHS and SHS. *Improved toilet facility refers to flush latrine/Water closet, ventilated improved. * Unimproved toilet facility refers to other pit latrines, open field, and others. ^Improved water source refers to pipe at home, public taps and treated sachet water. ^Unimproved water source refers to stream/river, rainwater.
Table 2.
Bivariate analysis of primary cook, household head and household characteristics by fuel types (n=420).
Table 2.
Bivariate analysis of primary cook, household head and household characteristics by fuel types (n=420).
| Charcoal | Wood fuel | LPG | Chi-square | P-value | |
| N (%) | N (%) | N (%) | |||
| Characteristics of Primary Cook | |||||
| Sex | |||||
| Male | 12 (44.4) | 13 (48.2) | 2 (7.4) | 8.7782 | 0.019b** |
| Female | 80 (20.4) | 254 (64.6) | 59 (15.0) | ||
| Age of primary cook | |||||
| Less than 40 | 4 (23.5) | 10 (58.8) | 3 (17.7) | 11.1562 | 0.427b |
| 41-64years | 24 (25.0) | 60 (62.5) | 12 (12.5) | ||
| 65 years and above | 7 (26.9) | 14 (53.9) | 5 (19.2) | ||
| Civil Status | |||||
| Single | 32 (15.5) | 136 (65.7) | 39 (18.8) | 14.2701 | 0.001a** |
| Married | 60 (28.2) | 131 (61.5) | 22 (10.3) | ||
| BMI | |||||
| Underweight | 4 (15.4) | 16 (61.5) | 6 (23.1) | 9.146 | 0.204b |
| Normal BMI | 27 (17.9) | 99 (65.5) | 25 (16.6) | ||
| Overweight | 31 (25.8) | 70 (58.4) | 19 (15.8) | ||
| Obese | 30 (24.4) | 82 (66.7) | 11 (8.9) | ||
| Education level of primary cook | |||||
| Primary | 22 (19.0) | 81 (69.8) | 13 (11.2) | 30.5222 | <0.001b |
| Secondary | 19 (33.9) | 33 (59.0) | 4 (7.1) | ||
| Tertiary | 8 (66.7) | 3 (25.0) | 1 (8.3) | ||
| Religion of primary cook | |||||
| Christianity | 35 (30.2) | 63 (54.3) | 18 (15.5) | 12.1612 | 0.075b |
| Muslim | 52 (19.2) | 178 (65.7) | 41 (15.1) | ||
| Agonist | 3 (12.0) | 21 (84.0) | 1 (4.0) | ||
| Ethnicity of primary cook | |||||
| Ga Adagmbe | 21 (16.3) | 91 (70.5) | 17 (13.2) | 16.0099 | 0.024b |
| Ewe | 57 (23.8) | 141 (58.7) | 42 (17.5) | ||
| Akan | 9 (40.9) | 12 (54.5) | 1 (4.6) | ||
| Others | 5 (17.2) | 23 (79.3) | 1 (3.5) | ||
| Household Head Characteristics | |||||
| Sex of household head | |||||
| Male | 73 (25.9) | 172 (61.0) | 37 (13.1) | 9.2732 | 0.016a |
| Female | 19 (13.8) | 95 (68.8) | 24 (17.4) | ||
| Educational level of household head | |||||
| Primary | 16 (15.7) | 76 (74.5) | 10 (9.8) | 59.3349 | <0.001b |
| Secondary | 27 (36.0) | 43 (57.3) | 5 (6.7) | ||
| Tertiary | 16 (57.1) | 11 (39.3) | 1 (3.6) | ||
| Household Characteristics | |||||
| Household average monthly income | |||||
| Less or equal GHS 250-500 | 15 (15.0) | 62 (62.0) | 23 (23.0) | 18.8999 | 0.022b |
| GHS 501-GHS 1000 | 37 (23.4) | 97 (61.4) | 24 (15.2) | ||
| GHS 1001 and above | 13 (36.1) | 20 (55.6) | 3 (8.3) | ||
| House ownership | |||||
| Sole Ownership | 23 (18.8) | 71 (58.2) | 28 (23.0) | 16.4935 | 0.004a |
| Family house | 21 (17.1) | 84 (68.3) | 18 (14.6) | ||
| Rented | 48 (27.4) | 112 (64.0) | 15 (8.6) | ||
| Dwelling | |||||
| Single | 20 (13.8) | 9 (62.1) | 35 (24.1) | 23.2729 | 0.001b |
| Multiple | 2 (16.7) | 90 (75.0) | 1 (8.3) | ||
| Enclosed | 11 (29.7) | 24 (64.9) | 2 (5.4) | ||
| Size of family | |||||
| Less than 3 | 37 (32.7) | 65 (57.5) | 11 (9.7) | 29.9784 | <0.001a |
| 5-Mar | 40 (20.2) | 138 (69.7) | 20 (10.1) | ||
| 6 or more | 15 (13.8) | 64 (58.7) | 30 (27.5) | ||
* a=Pearson Chi-square Test, b=Fisher Exact Test, **p<0.05.
Table 3.
Multinomial logistic regression of household characteristics by fuel type (LPG and charcoal) having wood fuel as the reference (n=419).
Table 3.
Multinomial logistic regression of household characteristics by fuel type (LPG and charcoal) having wood fuel as the reference (n=419).
| Study population characteristics |
LPG OR (95% CI) |
P-value |
Charcoal OR (95% CI) |
P-value |
| Sex of primary cook | ||||
| Male | 1.00 | 1.00 | ||
| Female | 0.12 (0.01, 2.54) | 0.175 | 0.35 (0.02, 5.70) | 0.462 |
| Age range of primary cook | ||||
| 40years and less | 1.00 | 1.00 | ||
| 41 – 59years | 0.69 (0.21, 2.22) | 0.530 | 0.77 (0.30, 1.97) | 0.581 |
| 60years and above | 0.53 (0.05, 6.10) | 0.610 | 0.67 (0.09, 5.22) | 0.705 |
| Marital status of primary cook | ||||
| Married | 1.00 | 1.00 | ||
| Single | 0.56 (0.13, 2.38) | 0.436 | 0.62 (0.19, 1.99) | 0.426 |
| Ever married | 0.12 (0.02, 0.71) | 0.020 | 0.18 (0.04, 0.83) | 0.027 |
| Religion of primary cook | ||||
| Christian | 1.00 | 1.00 | ||
| Moslem | 0.25 (0.00, 112.20) | 0.657 | 0.64 (0.00, 2.31) | 0.883 |
| Agnostic | 0.96 (0.04, 21.84) | 0.980 | 1.40 (0.09, 21.93) | 0.810 |
| Ethnicity of primary cook | ||||
| Ga Adamgbe | 1.00 | 1.00 | ||
| Ewe | 0.73 (0.18, 2.88) | 0.648 | 0.43 (0.14, 1.30) | 0.136 |
| Krobo | 0.19 (0.02, 1.62) | 0.129 | 0.53 (0.10, 2.77) | 0.451 |
| Other | 5.09 (0.01, 2084.02) | 0.596 | 4.98 (0.01, 17.16) | 0.590 |
| Dwelling | ||||
| Single Occupancy | 1.00 | 1,00 | ||
| Multiple Occupancy | 2.06 (0.68, 6.20) | 0.200 | 1.36 (0.55, 3.35) | 0.505 |
| Enclosed Dwelling | 2.37 (0.36, 15.37) | 0.367 | 1.64 (0.33, 8.08) | 0.541 |
| Educational level of primary cook | ||||
| Primary | 1.00. | 100. | ||
| Secondary | 1. 70 (0.54, 5.33) | 0.363 | 2.11 (0.79, 5.56) | 0.132 |
| Tertiary | 0.047 (0.00, 3.63) | 0.168 | 0.012 (0.000, 1.033) | 0.052 |
| Relationship to household head | ||||
| Head of house | 1..00 | 1.00 | ||
| Married to household head | 0.70 (0.12, 4.10) | 0.696 | 1.35 (0.28, 6.52) | 0.711 |
| Partner | 0.39 (0.03, 5.88) | 0.499 | 0.64 (0.07, 6.41) | 0.708 |
| Other relative | 1.04 (0.04, 24.19) | 0.982 | 0.97 (0.05, 17.61) | 0.981 |
| Age of household head | ||||
| 40years and less | 1.00 | 1.00 | ||
| 41 – 59years | 0.99 (0.03, 36.44) | 0.995 | 15.00 (0.36, 62.07) | 0.154 |
| 60years and above | 0.74 (0.06, 8.56) | 0.811 | 12.93 (0.79, 21.26) | 0.073 |
| Sex of household head | ||||
| Male | 1.00 | 1.00. | ||
| Female | 0.85 (0.14, 5.29) | 0.858 | 2.41 (0.52, 11.08) | 0.260 |
| Educational level of household head | ||||
| Primary | 100. | 100 | ||
| Secondary | 2.38 (0.69, 8.11) | 0.167 | 0.91 (0.34, 2.45) | 0.853 |
| Tertiary | 11.66 (1.57,12.08) | 0.031 | 12.76 (0.16, 97.09) | 0.252 |
| House ownership | ||||
| Sole Ownership | 1.00 | 1.00 | ||
| Family house | 1.12 (0.29, 4.30) | 0.867 | 2.05 (0.71, 5.88) | 0.183 |
| Rented | 1.51 (0.44, 5.19) | 0.514 | 2.07 (0.74, 5.80) | 0.164 |
| Occupation of household head | ||||
| Trader | 1.00. | 1.00 | ||
| Farmer | 0.22 (0.05, 1.04) | 0.057 | 0.44 (0.13, 1.51) | 0.191 |
| Artisan | 0.55 (0.10, 2.94) | 0.482 | 0.61 (0.14, 2.63) | 0.509 |
| Employed | 0.63 (0.01, 3.97) | 0.622 | 0.96 (0.19, 4.98) | 0.963 |
| Unemployed | 0.92 (0.18, 4.53) | 0.920 | 0.50 (0.13, 1.96) | 0.319 |
| Household average monthly Income | ||||
| Ghc 250 or less | 1.00 | 1.00 | ||
| Ghc 251 – 1000 | 0.84 (0.12, 5.87) | 0.860 | 0.46 (0.11, 1.99) | 0.300 |
| Greater than or equal to Ghc 1001 | 3.18(0.29, 34.51) | 0.341 | 2.64 (0.39, 17.89) | 0.319 |
| Reluctant | 0.09 (0.00, 2.93) | 0.177 | 0.36 (0.04, 3.58) | 0.386 |
| Waste disposal | ||||
| Burning | 1.00 | 1.00 | ||
| Indiscriminate disposal | 1.07 (0.38, 3.00) | 0.894 | 1.14(0.49, 2.66) | 0.768 |
| Collection | 8.95 (1.20, 66.48) | 0.032 | 0.94 (0.16, 5.66) | 0.947 |
| Family size | ||||
| 5members or less | 1.00 | 1.00 | ||
| 6 members or more | 0.18 (0.06, 0.51) | 0.001 | 0.48 (0.21, 1.09) | 0.081 |
| ^Water sources | ||||
| Improved water source | 1.00 | 1.00 | ||
| Unimproved water source | 0.53 (0.07, 3.79) | 0.524 | 0.17 (0.03, 0.98) | 0.047 |
| *Toilet facilities | ||||
| Improved toilet facility | 1.00 | 1.00 | ||
| Unimproved toilet facility | 0.23(0.06,0.86) | 0.028 | 0.46(0.17,1.25) | 0.130 |
| #Wealth Index | ||||
| Relatively poor household | 1.00 | 1.00 | ||
| Relatively rich household | 3.65 (1.48,9.03) | 0.005 | 11(2.62,46.26) | 0.001 |
1 Note: Primary refers no education and primary, secondary is JHS and SHS. ^Improved water source refers to pipe at home, public taps and treated sachet water. ^Unimproved water source refers to stream/river, rainwater. *Improved toilet facility refers to flush latrine/Water closet, ventilated improved * Unimproved toilet facility refers to other pit latrines, open field, and others. #Relatively poor household refers to lower class. #Relatively rich households refer to middle/upper class. Most of them are from the middle class.
Disclaimer/Publisher’s Note: The statements, opinions and data contained in all publications are solely those of the individual author(s) and contributor(s) and not of MDPI and/or the editor(s). MDPI and/or the editor(s) disclaim responsibility for any injury to people or property resulting from any ideas, methods, instructions or products referred to in the content. |
© 2025 by the authors. Licensee MDPI, Basel, Switzerland. This article is an open access article distributed under the terms and conditions of the Creative Commons Attribution (CC BY) license (http://creativecommons.org/licenses/by/4.0/).
Copyright: This open access article is published under a Creative Commons CC BY 4.0 license, which permit the free download, distribution, and reuse, provided that the author and preprint are cited in any reuse.


