
Submitted:
21 January 2025
Posted:
22 January 2025
You are already at the latest version
Abstract
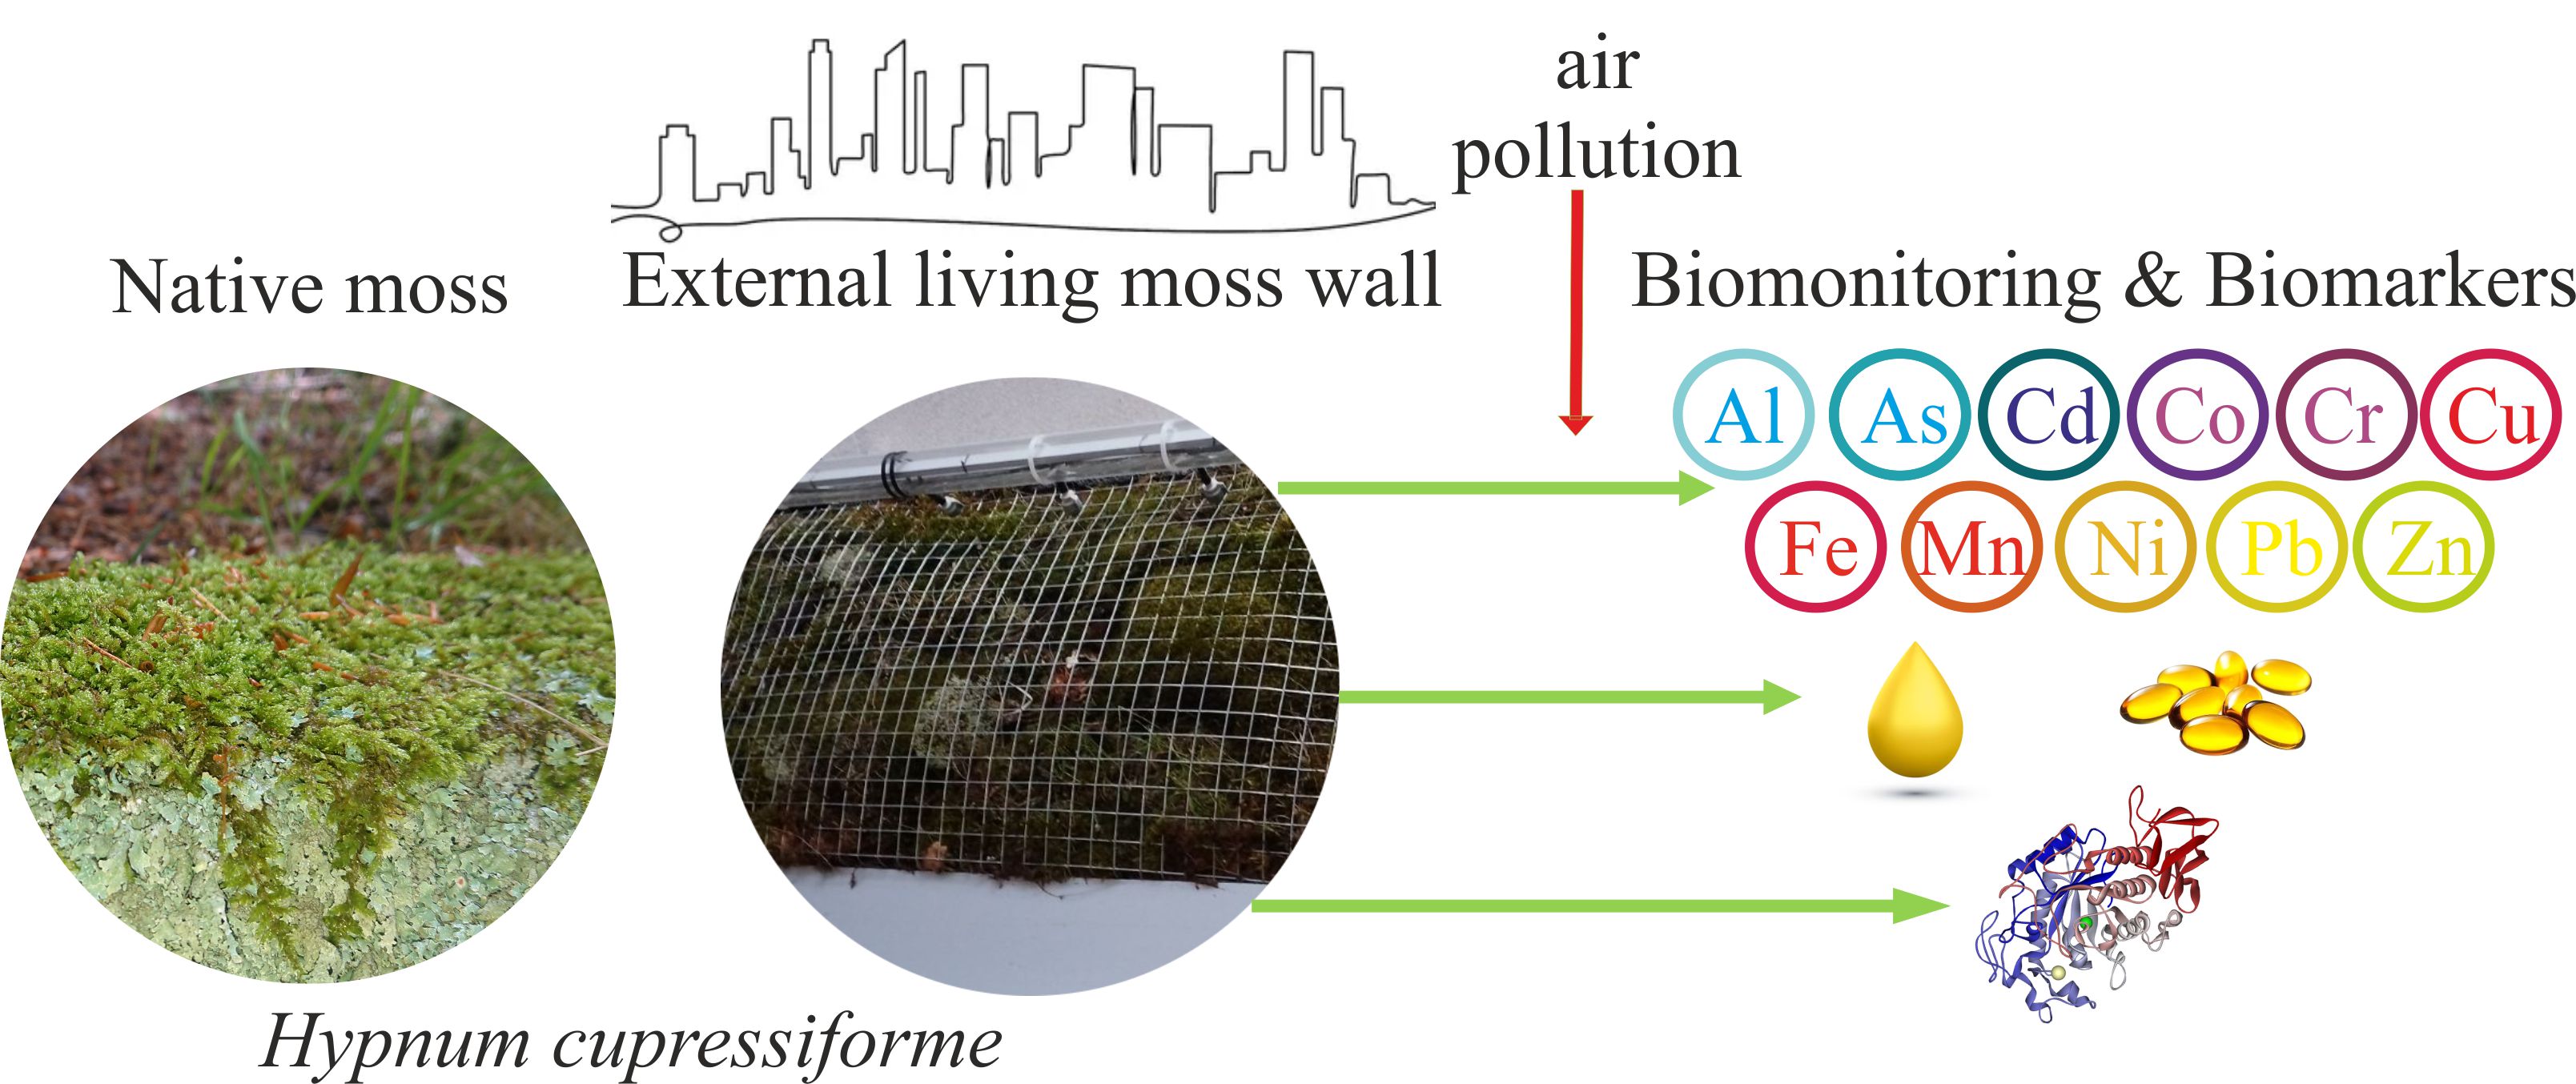
Moss walls are acknowledged, though not widely, for their urban environmental benefits: humidity control, noise reduction, and air filtration. In this pioneering study, three outdoor living moss walls were installed in separate urban green spaces in Plovdiv, Bulgaria. One and five months later, the primary moss species used, Hypnum cupressiforme, a well-established biomonitor, was analyzed for 12 potentially toxic elements. The content of all measured elements increased, with zinc (Zn) and cadmium (Cd) showing the most significant rises - 17-fold and 3-fold, respectively. The element accumulation is believed to originate from industrial activities related to non-ferrous metals. In addition to accumulating toxic elements, the moss exhibited physiological responses to environmental stress. Total lipids and tocopherols, lipophilic antioxidants produced exclusively by photosynthetic organisms, showed adaptive changes. As a molecular biomarker, the expression of the rbcL gene, which encodes the largest subunit of Rubisco, was analyzed and showed a correlation with the Ecological Risk Index derived from the moss wall data. While living moss walls have been used to some extent to enhance urban aesthetics and improve air quality, this study is the first to highlight their potential as tools for air quality monitoring.
Keywords:
Hypnum cupressiforme
; biomonitoring
; biomarkers
; air pollution
1. Introduction
Green walls are regarded as one of the foremost greenery systems in architectural design [1]. They benefit the urban environment in many ways: soften the urban landscape, transform it into a more natural, park-like environment, and function as a thermal insulator. Two main groups are green facades and living walls. As a component of living walls, bryophytes as non-vascular plants, have many advantages: absorption through leaves, resistance to freezing, predation, and disease, colony living to retain humidity and tolerance to air pollutants. Thus, mosses have been common on walls, embankments, and roofs in Japan for decades as they reduce heat loss in winter and air conditioning needs in summer [2]. Hypnum cupressiforme Hedw. is among the most common mosses in many regions, which thrive on various structures and contribute to the aesthetic of architecture and landscape design.
There is a significant variation in the understanding of moss walls and the methods used for their construction. Preserved moss walls use mosses preserved with natural glycerine or paraffin [1]. Living moss wall panels apply pre-grown moss mats installed both in interiors and exteriors. Seven moss species were recently tested for indoor living moss walls [3]. Mosses survived for up to six months, with H. cupressiforme and Ceratodon purpureus performing best. Moss walls are also described as systems that filter polluted air using ventilation fans installed within the wall [4]. The natural fiber used in the study was the moss fibber of Sphagnum. Biotech products such as moss filter (e.g., CityTree) were developed recently. The “moss wall” industry is growing, driven by urban demand for cleaner air.
Urban air pollution is directly linked to public health with the increasing number of illnesses and premature deaths. This problem seemed to have a simple solution based on findings that a 1% increase in green space per capita leads to a 0.4941% reduction in population mortality [5]. However, alternative green solutions should be considered in rebuilt cities where there is no opportunity to add green spaces like parks. If this green alternative also provides a chance to monitor air quality, the benefit is twofold.
Particulate matter (PM) is among the major air pollutants in cities and has been globally regulated. Studies have shown that PM can be highly enriched with various heavy metals [6]. The Convention on Long-Range Transboundary Air Pollution (CLRTAP), adopted under the auspices of the United Nations Economic Commission for Europe (UNECE), focuses on controlling and reducing air pollution, including harmful elements and compounds. In the context of CLRTAP, among elements and compounds are priority heavy metals cadmium (Cd), lead (Pb) and mercury (Hg) and toxic elements such as arsenic (As) and nickel (Ni).
Regulatory air monitoring provides data collection of a limited number of pollutants at a limited number of stations. In this context, moss biomonitoring could fill gaps in the regulatory monitoring network. In urban areas, where mosses are often scarce or even absent, the “moss bag technique” has been developed to assess air pollution [7]. H. cupressiforme is cosmopolitan, has wide ecological amplitudes and grows on many substrates. The species is a proven biomonitor applied both in passive and active (moss bags) monitoring [7,8]. It is also among the key species within the European moss survey, which provides data on heavy metal concentrations (As, Cd, Cr, Cu, Fe, Hg, Ni, Pb, V, Zn) and toxic elements (Al, Sb) in naturally growing mosses [9]. Here, we combine the moss wall technique as a green urban alternative with air pollutant biomonitoring.
In addition, air pollution introducing various environmental stressors, such as heavy metals, can have detrimental effects on plant physiology. Lipids are among the most essential metabolites in bryophytes, playing a key role in their functioning and environmental adaptation [10]. Exposure to heavy metals like Pb, Cd, or Hg can interfere with cellular functions, including lipid metabolism, resulting in a lipid decline. As lipid-soluble bioactive components tocopherols (vitamin E compounds) are important antioxidants that protect cells from oxidative stress, their production may be affected by conditions that induce stress responses or pathways involved in plant secondary metabolism. Rubisco (Ribulose-1,5-bisphosphate carboxylase/oxygenase) is particularly sensitive to these stressors, as it is a key enzyme in the Calvin cycle, directly responsible for carbon fixation in photosynthesis [11,12]. For example, heavy metals like Cd, Cu and Pb have been linked to reduced Rubisco content and activity in several plant species, ultimately impairing the rate of photosynthesis [13,14,15,16]. The inhibition of Rubisco is often associated with down-regulation of its encoding genes (rbcL and rbcS), which diminishes the enzyme’s overall efficiency under stress conditions [17,18,19].
The main objective of the research was to evaluate the potential of outdoor living moss walls, specifically the moss species H. cupressiforme, as tools for monitoring air quality in urban environments. To achieve this, we integrated data on bioaccumulation, lipid content, and molecular biomarkers collected over one and five months of exposure. Our findings demonstrate the feasibility of using living moss walls for air quality monitoring, extending their utility beyond traditional aesthetic and environmental roles.
2. Materials and Methods
2.1. Moss Collection and Moss Wall Location
H. cupressiforme Hedw. was collected from an unpolluted area in Strandja Mountain, within protected territories, Bulgaria, in 2023. It was then used to construct three living moss walls installed in three separate urban locations in Plovdiv, Bulgaria (Figure 1, Table 1).
Figure 1.
Layout of locations.
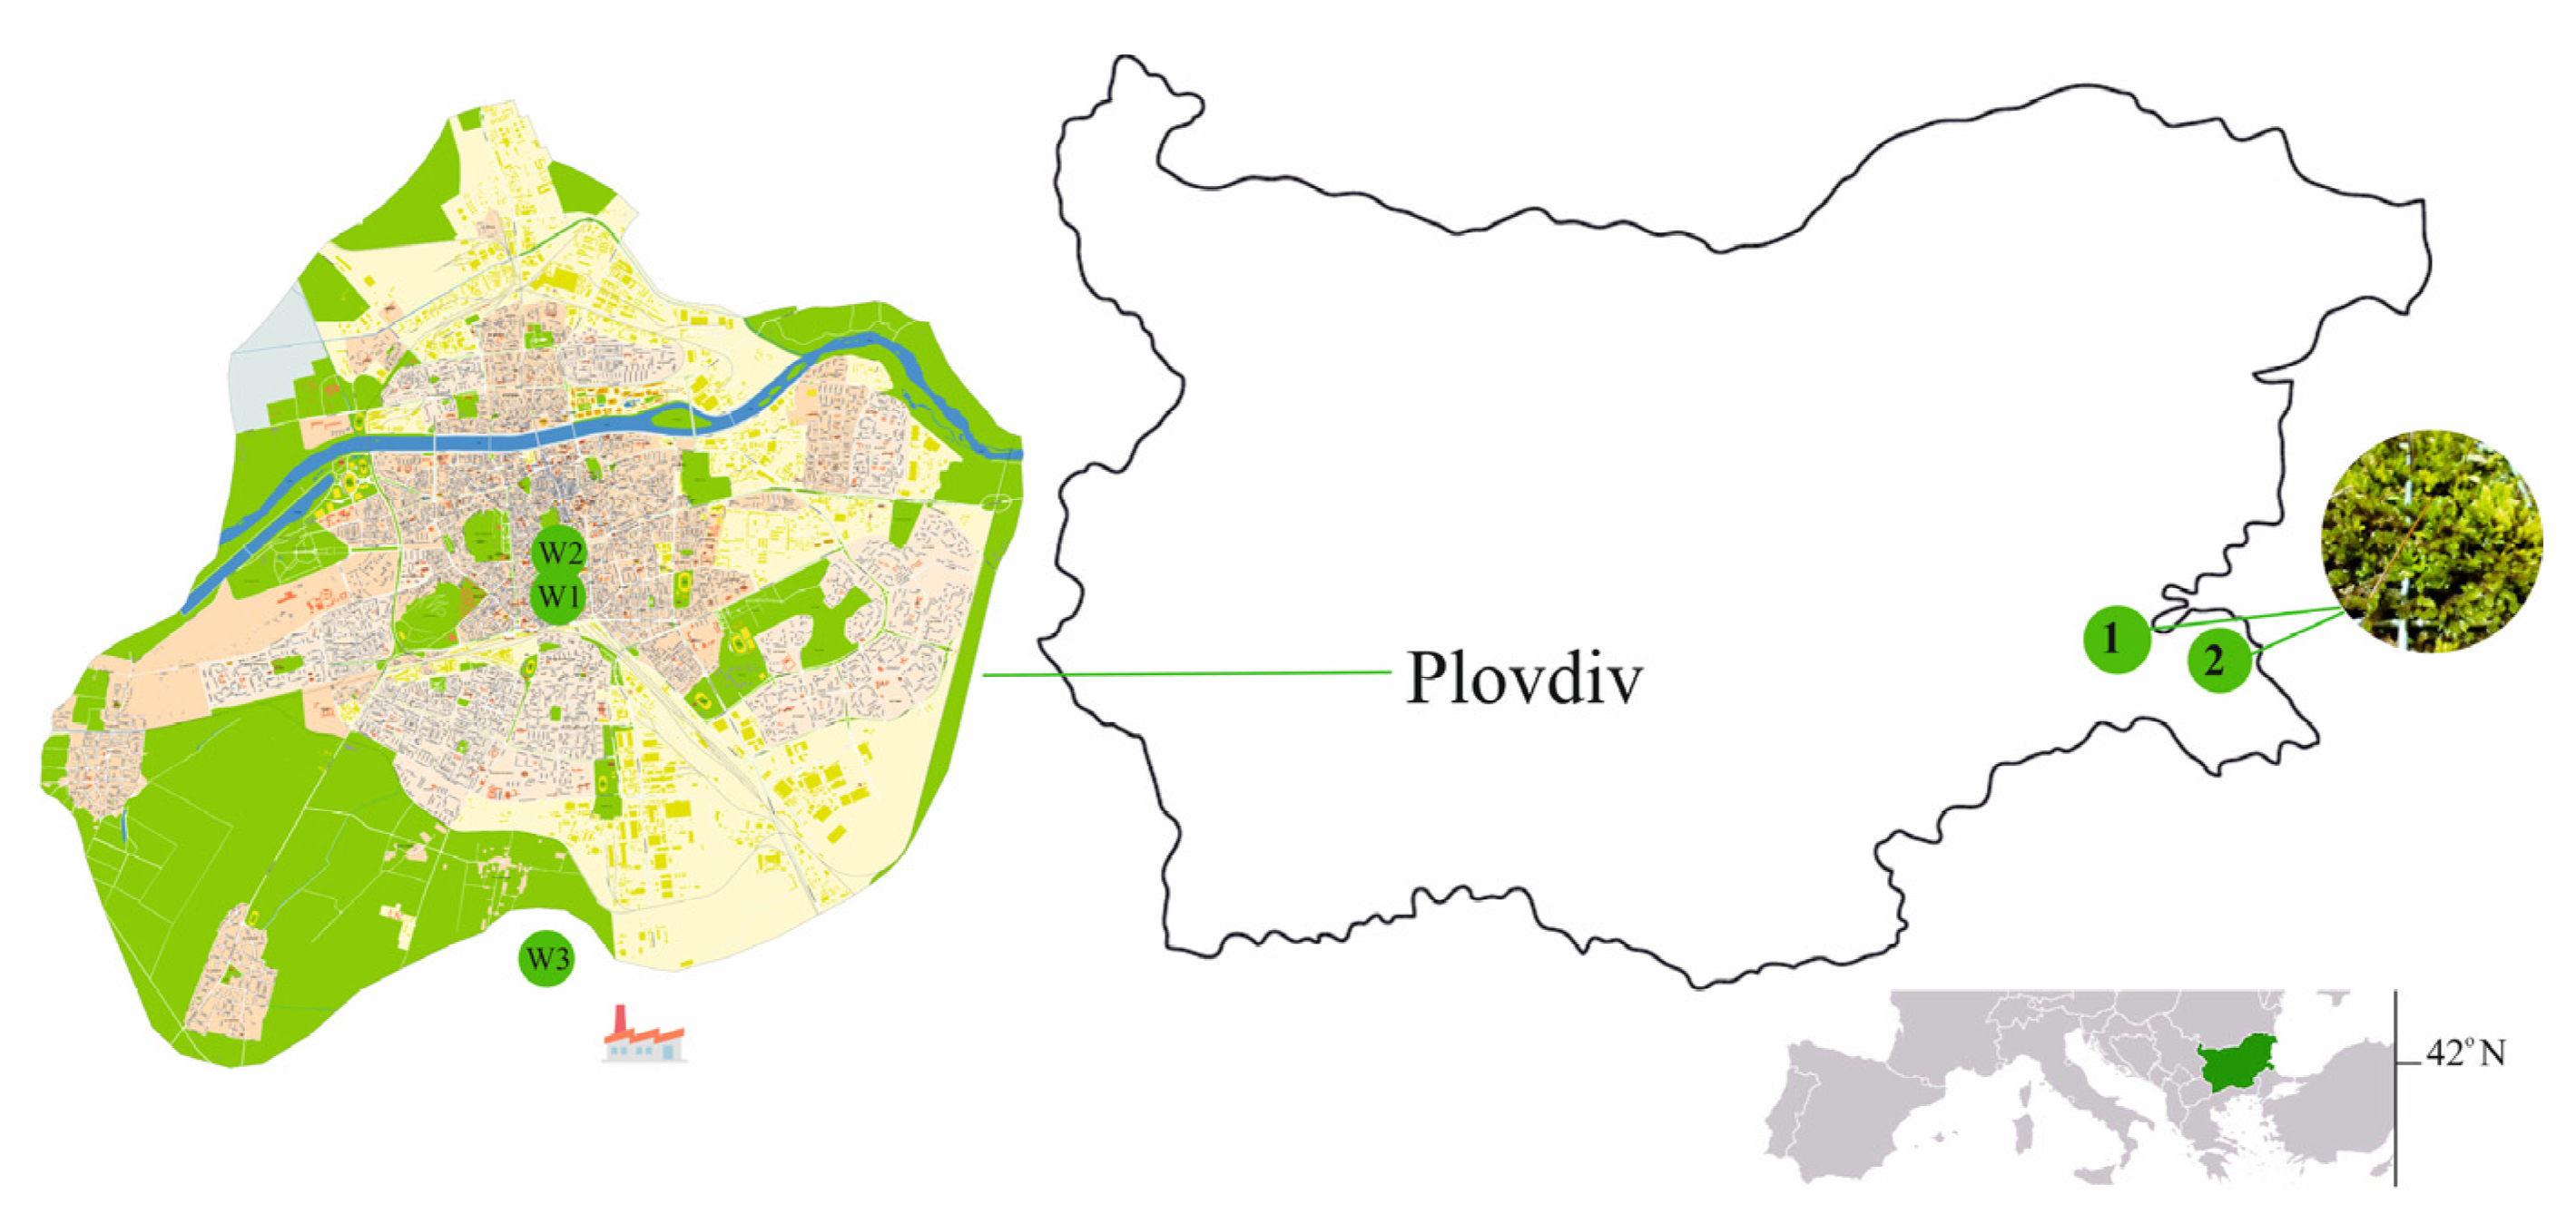

Table 1.
Locations and their characteristics.
| Location | Name | Coordinates | Characteristics | |
|---|---|---|---|---|
| 1 | Strandja Mountain | Protected area Mouth of Izvorska River | 42.400833, 27.431306 | A low-stemmed oak plantation. |
| 2 | Strandja Mountain | Ropotamo Reserve | 42.315225, 27.754692 | Maslen nos region. A coppiced oak plantation. |
| 3 | Plovdiv | Moss wall 1 (MW1) | 42.13747, 24.75123 | A transport-oriented site in the center of the city. Close to a central hub for major traffic flows. |
| 4 | Plovdiv | Moss wall 2 (MW2) | 42.14758, 24.75089 | An urban background location within Plovdiv’s old city. |
| 5 | Kuklen village | Moss wall 3 (MW3) | 42.03388, 24.77881 | Approximately 15 km south of Plovdiv. Close to the KCM 2000 industrial complex, Bulgaria’s largest non-ferrous metal production company, situated within the Kuklen Industrial Zone. |
2.2. Technical Solution: Moss Walls with Self-Sustaining Systems for Moss Communities
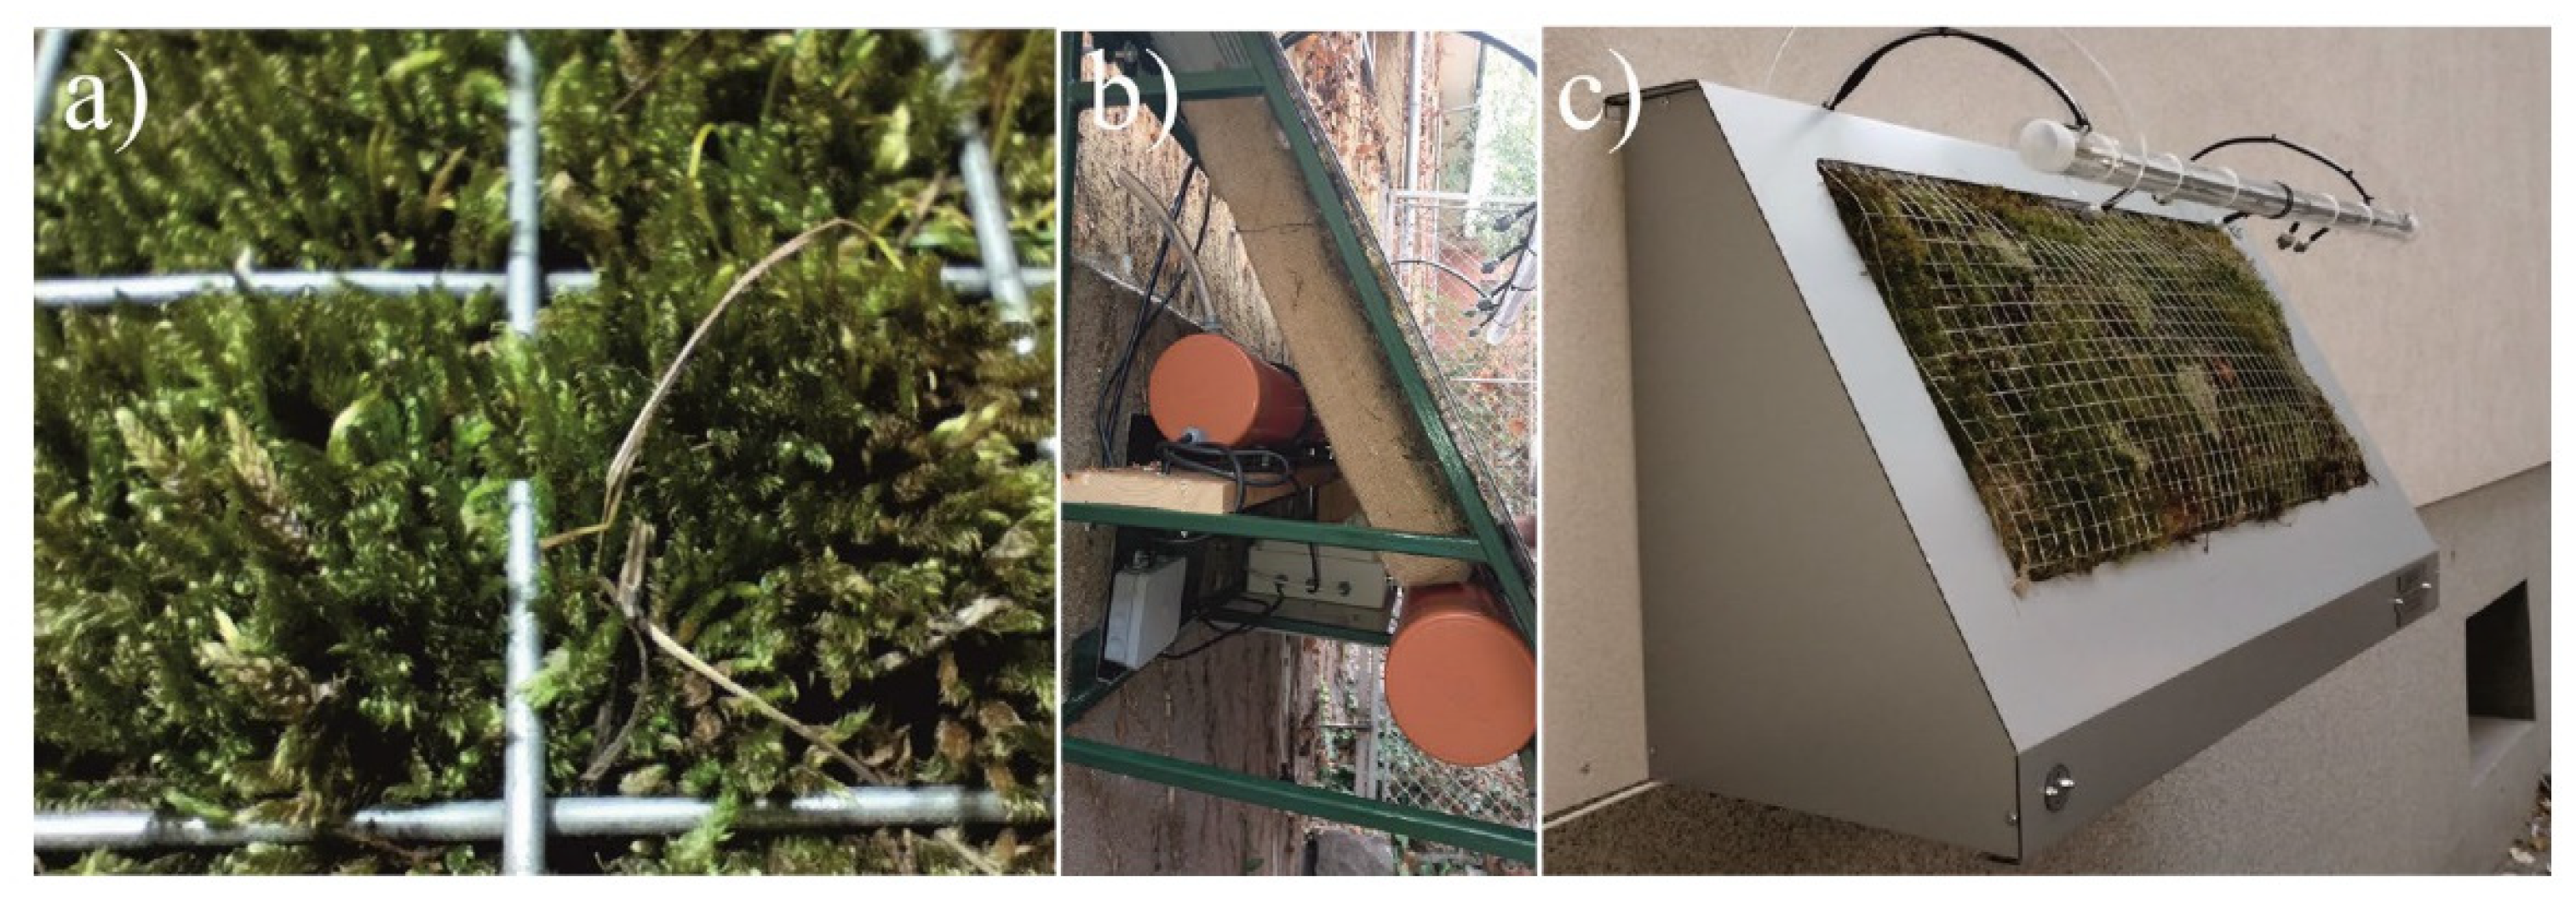
Each pilot moss wall consists of a metal supporting structure with cladding made of composite material (Figure 2). The panel on which the moss is placed has a thermally insulated back. It is followed by three textile layers of different structures for moisture retention and securing the moss to the panel. The necessary water is provided by two systems for humidification with distilled water stored in two separate tanks, each with 11 L volume. One system uses capillary humidification with wicks, and the other operates through “sprinkling.” The “sprinkling” system, controlled by an electronic device, allows adjustment of the time and duration of spraying on any day of the year. It can also be adjusted and managed remotely via the Internet, with the set parameters valid for the entire year. The panel is inclined at 27 degrees to capture rainwater and condensed water more effectively, such as morning dew. The lighting system is also remotely controlled and adjusted to change the illumination intervals following the natural seasonal light levels. The light intensity was calibrated to match the measured light levels from the location where the moss was collected.
Figure 2.
Moss wall: (a) H. cupressiforme, (b) panel, (c) installation.
2.3. Experiment Design
Three pilot moss walls were installed in September 2023. They were exposed at a height of approximately 2 m following the described prevailed lack of vertical patterns of moss bag concentrations in previous studies [25]. The second largest city in Bulgaria is known for its air quality issues [35], suffering from all pollution sources: local industry, domestic heating, and traffic [36]. The city hosts several metal smelting and refining operations (KCM AD, Laki 131, Katinobel Ltd.), which contribute significantly to the region’s industrial landscape, focusing on the processing and refinement of various metals. The prevailing meteorological conditions (low wind speeds and frequent temperature inversions) favor high pollutant levels.
Wall №1 (MW1, Figure 3, Table 1) is located at a transport-oriented site, wall №2 (MW2) in an urban background location, and wall №3 (MW3) in the village of Kuklen. The last site is under the influence of KCM (Non-Ferrous Metal Works)—the largest Pb and Zn production company in South Eastern Europe. Two Automatic Measuring Stations (AMS of MEW-BG) operate in Plovdiv. The AMS continuously monitor air quality, specifically the concentration of PM2.5, PM10, SO2, NO, NO2, CO, O3. According to the latest published report on the state of the environment in Bulgaria (https://eea.government.bg/bg/dokladi/Greenbook_2024.pdf) Plovdiv recorded the highest number of exceedances of the daily limit value (DLV) for PM10 in 2022 at AMS “Plovdiv—Trakia”. At the same station, an exceedance of the annual limit value for NO2 was also recorded. This indicates a significant level of air pollution, as NO2 is a harmful gas primarily emitted from traffic and industrial processes, contributing to respiratory problems and environmental degradation. According to the 2022 report from the Regional Inspectorate of Environment and Water (https://plovdiv.riosv.com/files/godishni_dokladi/Godishen_doklad_2022.pdf), Cd average annual level in AMS “Plovdiv—Trakia” was 0.364 ng m-3; in the Kuklen station, it was 1.88 ng m-3, respectively, while the Pb average level in Kuklen was 0.06 µg m-3.
Samples from the moss walls were taken at the end of the first and fifth months of exposure.
2.4. Analytical Methods
2.4.1. Toxic Elements
Plant samples, consisting of 5-10 subsamples, were collected from each moss wall and processed for instrumental analysis using a microwave-assisted acid digestion method previously detailed [37]. In summary, approximately 0.5 g of the homogenized sample was treated with 8 mL of concentrated HNO3 (69% Tracemetal Grade, Thermo Fisher Scientific) and left overnight. The addition of 2 mL H2O2 (pa 35%, Sigma Aldrich) preceded microwave-assisted digestion (Ethos 1, Milestone, Denmark). The digested material was then diluted with ultrapure water (PURELAB Chorus 2+, ELGA Veolia) to achieve a primary dilution factor (DF) of ~100.
Analytes were categorized based on their concentration levels in the sample solutions. Al, Fe, Mn, and Zn concentrations were measured using ICP-OES (iCAP 6300 Duo, Thermo Scientific, Waltham, MA, USA) with radial and axial observation modes, respectively, after an additional 20-fold dilution. Trace elements, including As, Cd, Co, Cr, Cu, Hg, Ni, and Pb, were quantified using ICP-MS (Agilent 7700, Agilent Technologies, Tokyo, Japan).
To mitigate spectral matrix interferences in the ICP-OES method, two emission wavelengths were monitored for each element: Al (309.271 and 396.152 nm), Fe (259.94 and 238.204 nm), Mn (259.37 and 259.373 nm), and Zn (213.856 and 202.548 nm). Similarly, in ICP-MS analysis, two isotopes per element were analyzed—except for monoisotopic elements such as 75As and 59Co—including isotopes like 111,113Cd; 52,53Cr; 63,65Cu; 201,202Hg; 60,62Ni; and 206,208Pb. To address potential polyatomic interferences during the determination of As, Cr, Cu, Co, and Ni, measurements in collision gas mode (He at 4.8 mL/min) were employed. Further, samples were diluted by an additional factor of 5 to minimize matrix effects and ensure low quantification limits for trace elements. For ICP-MS analysis, 103Rh was used as an internal standard to correct for non-spectral matrix effects and instrument drift.
Analytical results were validated through the analysis of moss reference materials (M2 and M3) [38,39] and certified reference material “Bush Branches and Leaves” (NCS DC 73348). Blank samples were included in each batch to monitor potential contamination from reagents or sample preparation procedures.
2.4.2. Lipids and Tocopherols
The total lipid content in moss samples was analyzed through Soxhlet extraction using n-hexane, following the ISO 9936:2016 standard for determining tocopherol and tocotrienol levels in animal and vegetable fats and oils. High-performance liquid chromatography (HPLC) was applied to quantify total tocopherols. Specifically, a 2% solution of the extracted oil in n-hexane was prepared, and 20 μL of this solution was injected into the HPLC system (Merck-Hitachi, Burladingen, Germany) with fluorescence detection at an excitation wavelength of 290 nm and an emission wavelength of 330 nm. The separation was performed using a Nucleosil Si 50-5 column (250 × 4 mm, 5 μm particle size). A mobile phase composed of a 96:4 (v/v) mixture of hexane and dioxane was utilized at a flow rate of 1 mL/min.
2.4.3. Nucleic Acid Extraction
Total RNA was isolated using the NucleoSpin miRNA kit (Macherey-Nagel, Germany) combined with QIAzol Lysis Reagent (Qiagen, Germany). The RNA concentration and integrity were evaluated with a Qubit 4 Fluorometer (Invitrogen™, Thermo Fisher Scientific, Waltham, USA) and further verified on a 1% agarose gel.
2.4.4. RT-qPCR
For the analysis of rbcL gene expression, 1 µg of total RNA was reverse transcribed into cDNA using Script cDNA polymerase (Jena Bioscience, Germany) following the manufacturer’s protocol. RT-qPCR was conducted in triplicate using an Applied Biosystems 7500 Real-Time PCR System and the Green Master Mix Kit (Genaxxon Bioscience) in a reaction volume of 25 µL. The thermal cycling program included an initial step at 95 °C for 10 minutes, followed by 40 cycles of 95° C for 10 seconds and 60° C for 1 minute. Expression levels of the rbcL gene were normalized to the endogenous reference gene EF1a. Relative quantification (RQ) of gene expression was determined using the 2−ΔΔCT method [40].
2.5. Data Analysis
The Ecological Risk Index (ERI) developed by Swedish scientist Lars Hakanson in 1980 was applied to assess the potential ecological harm posed by air pollutants, that could have long-term, detrimental effects on ecosystems, mainly through their persistence and bioaccumulation in organisms. The ERI calculation involves a previous calculation of the ecological Risk Factor (RF) for each of the elements determined at each site, which is the multiplication of the Contamination Factor (CF) of each component and its toxicity factor (Ftox). CF is a measure of the concentration of a given pollutant (e.g., a heavy metal) in the moss walls relative to a background concentration. Toxicity factor that accounts for the toxicology of the pollutant and its biological effect on the environment are Zn = 1; Cr = 2; Co, Cu, Ni, and Pb = 5; As = 10; and Cd = 30 [24,41]. The RI is the sum of the RFs of all the elements determined at this site. The element and combined risk are assessed following the scales [41]:
RF < 40 low; 40–80 moderate; 80–160 considerable; 160–320 high, and > 320 very high
and
ERI < 150 low ecological risk; 150 < RI < 300 moderate ecological risk; 300 < 600 considerable ecological risk; RI >600 very high ecological risk.
The distribution of elements in moss samples from different locations and periods were examined by unconstrained ordination (PCA) via Canoco software [42].
3. Results
3.1. Moss Walls and Toxic Element Bioaccumulation
Water consumption in capillary humidification of moss walls was minimal, adjusting to the level of dryness based on ambient temperature, wind, and humidity. The “injection” system uses approximately 80 ml per cycle, with up to three cycles during the hottest periods in summer.
The most notable increase during the second exposure period, 17 times higher than the background level, was measured for Zn (Table 2). Cd levels increased threefold, while the levels of other elements rose by up to twofold. Most of the element maximums were measured in second moss wall (MW2), except for Cd, Pb, and Zn, whose maximums were reached in samples from MW3.
Table 2.
Background and maximum concentrations of 12 toxic elements. RSD—relative standard deviation.
Table 2.
Background and maximum concentrations of 12 toxic elements. RSD—relative standard deviation.
| Background | RSD% | Maximum | RSD% | |
|---|---|---|---|---|
| Al, % | 0.35 | 4.7 | 0.60 | 7.4 |
| As, mg kg-1 | 1.21 | 6.2 | 1.62 | 9.9 |
| Cd, mg kg-1 | 0.08 | 15 | 0.24 | 9.6 |
| Co, mg kg-1 | 1.95 | 6.2 | 3.61 | 6.0 |
| Cr, mg kg-1 | 8.58 | 5.1 | 10.1 | 5.0 |
| Cu, mg kg-1 | 24.0 | 5.3 | 30.0 | 4.5 |
| Fe, % | 0.44 | 2.7 | 0.92 | 7.3 |
| Mn, mg kg-1 | 126 | 4.9 | 193 | 7.5 |
| Ni, mg kg-1 | 3.86 | 4.6 | 5.37 | 7.5 |
| Pb, mg kg-1 | 7.0 | 4.8 | 13.4 | 6.1 |
| Zn, mg kg-1 | 26.7 | 6.7 | 456 | 6.0 |
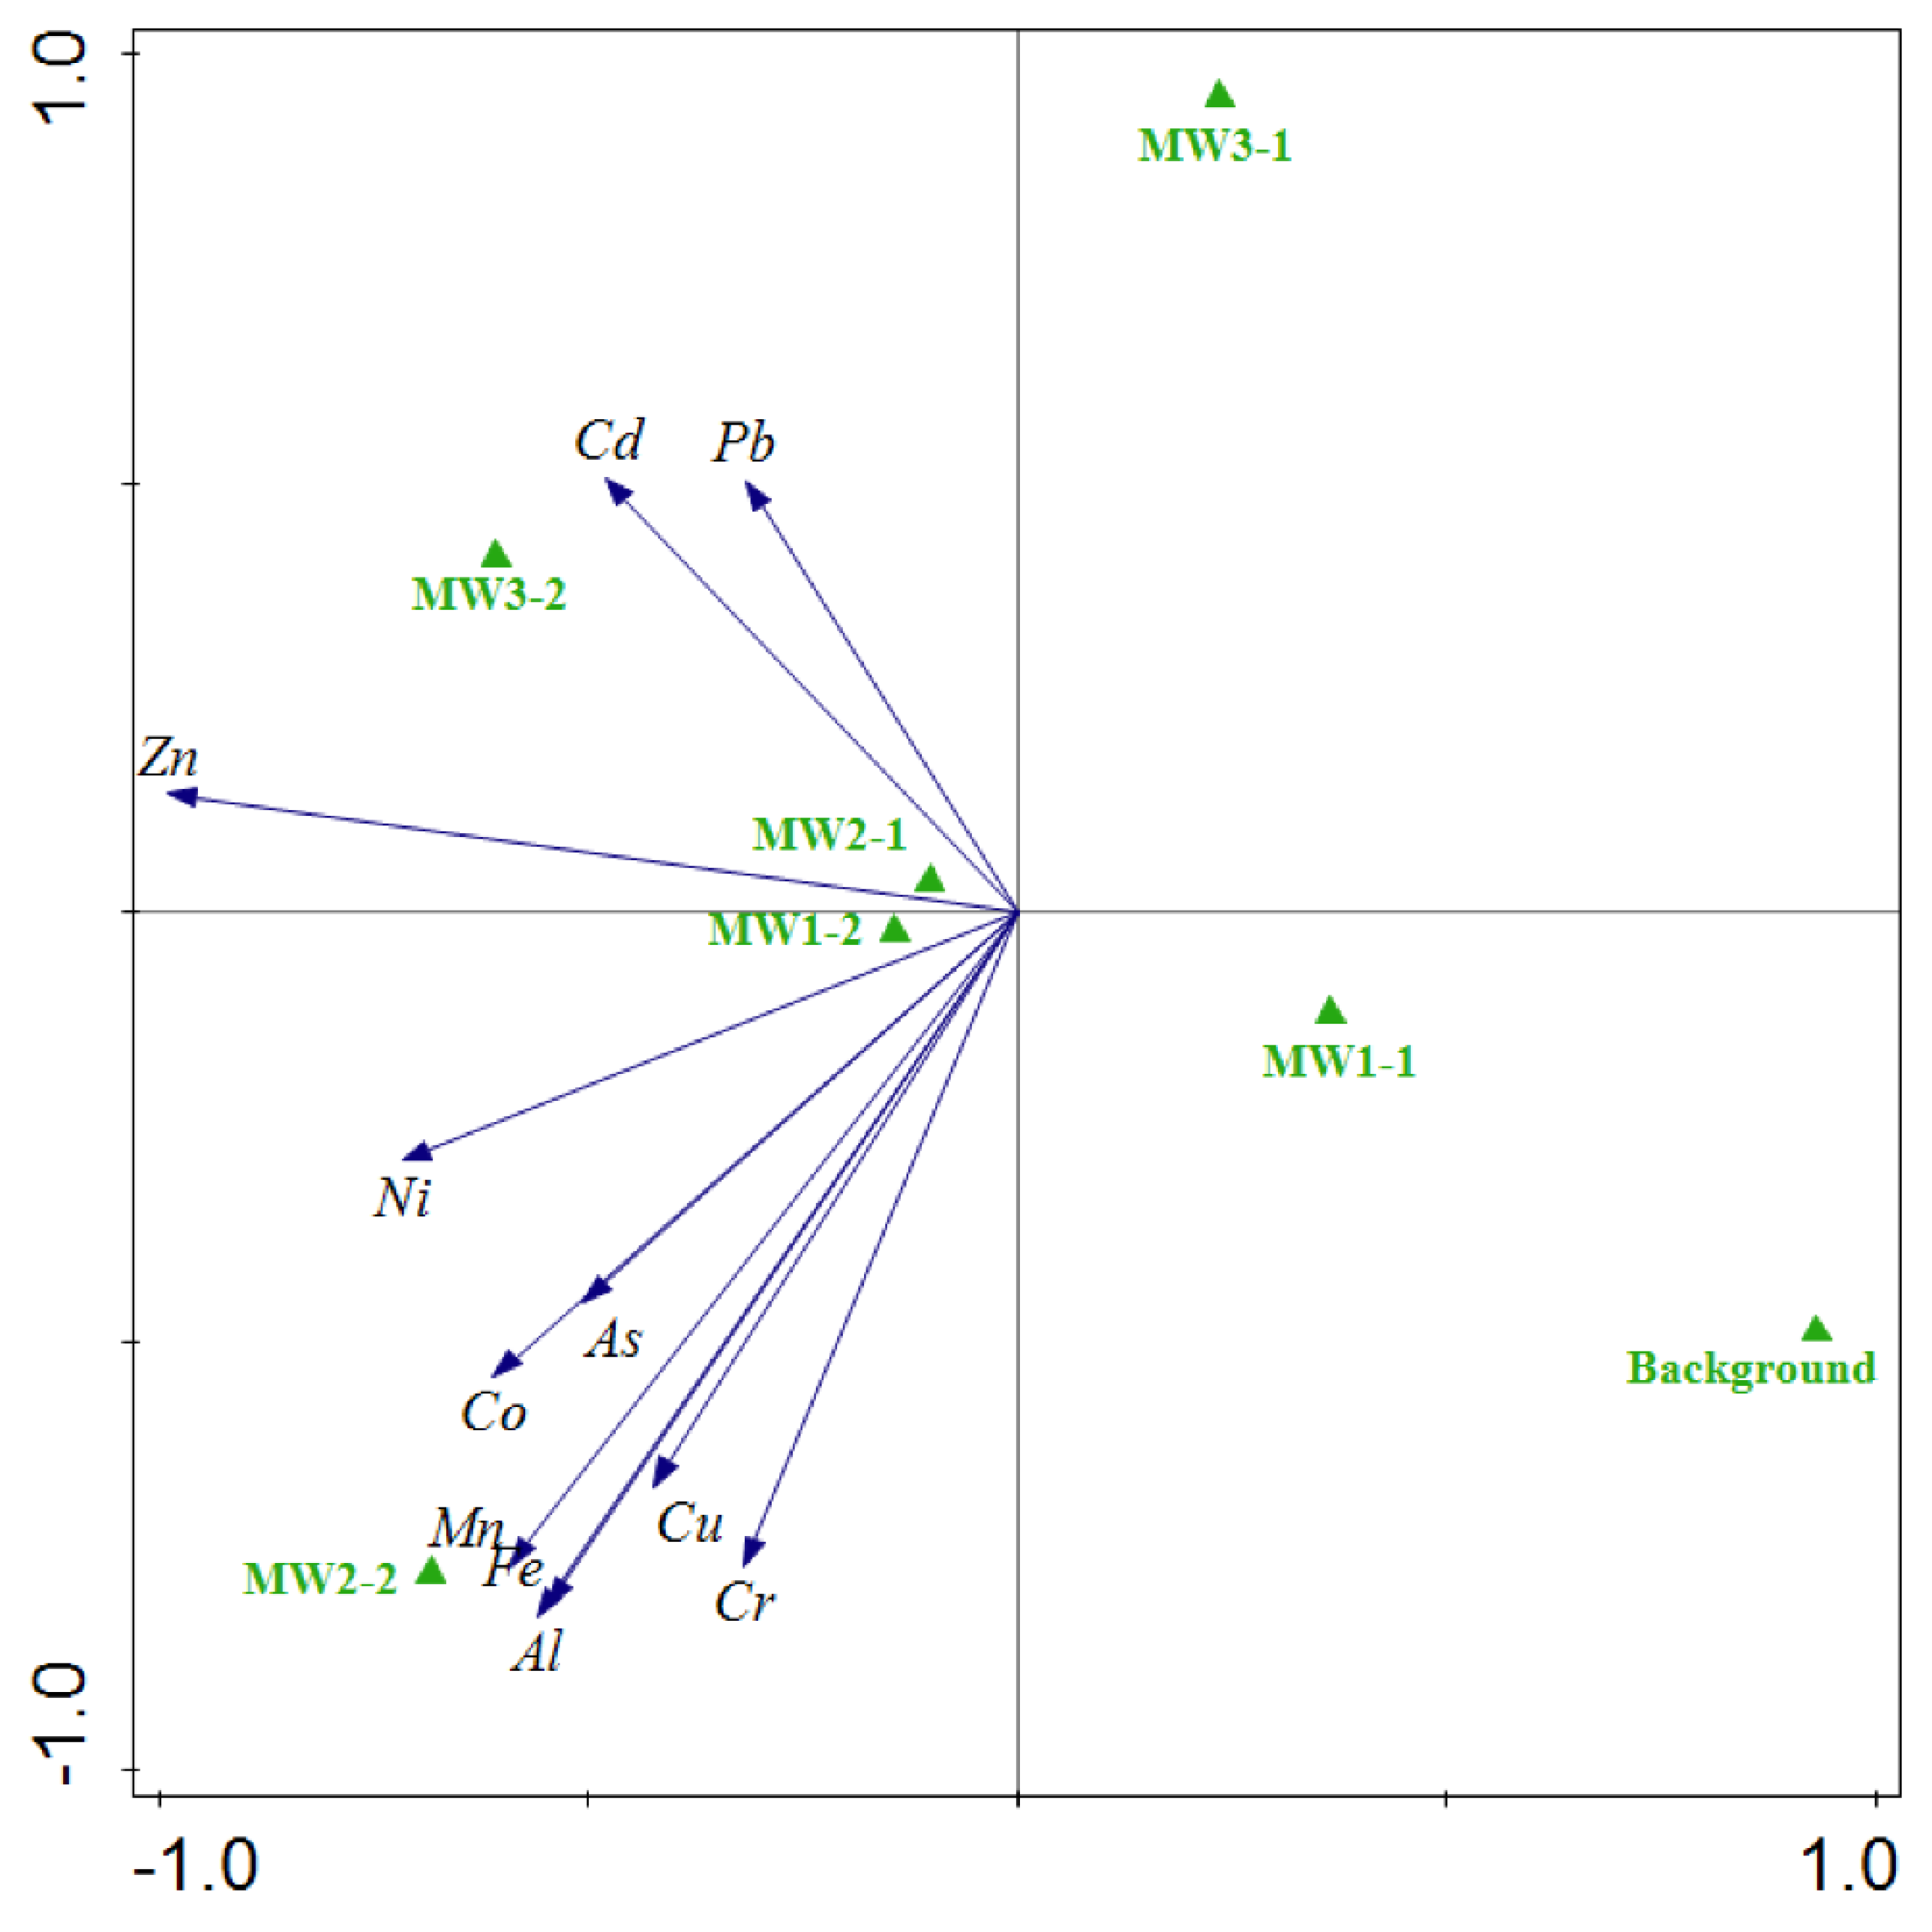
The received results from moss wall samples reflected their potential to address a series of air quality issues regarding human health (Figure 3). Most elements (Zn, Ni, As, Co, Mn, Fe, Al, Cu, Cr) were negatively correlated with PC1. Among elements there was a clear positive correlation between Cd and Pb. The background sample located on the positive side of PC1, bottom right quadrant, reflected its contrast with the high levels of the analyzed elements. The bottom-left quadrant indicated sample MW2-2 higher association with elements like Mn, Fe, and Al. Samples from Kuklen village from the two exposure periods (MW3-1 and MW3-2), which had the highest levels of Cd and Pb, were located at the top of the plot.
Figure 3.
PCA plot of analyzed elements and samples. Eigenvalues of PC1 and PC2: 0.729 and 0.186, respectively, together accounting for 91.57% of the total variation.
Figure 3.
PCA plot of analyzed elements and samples. Eigenvalues of PC1 and PC2: 0.729 and 0.186, respectively, together accounting for 91.57% of the total variation.
By examining the RF values for each site and period we can conclude that moderate to considerable contamination was found only for Cd in the third moss wall (Table 3). Between the first and fifth exposition month there are doubled risk factors for Zn, and Cr at the three locations, and for Pb at the third one, which appear to be related to atmospheric emissions. The third site, Kuklen village, approaches the moderate risk category. Bearing in mind that the exposure period coincided with the heating season, the airborne Cr could be a result of fossil fuel combustion, while high Zn CFs (between 8 and 17) are more likely to be connected to metal smelting and refining operations.
Table 3.
Risk factors (RF) and Ecological Risk Index (ERI) for the three moss walls during the two exposure periods.
Table 3.
Risk factors (RF) and Ecological Risk Index (ERI) for the three moss walls during the two exposure periods.
| RF | ERI | ||||||||
|---|---|---|---|---|---|---|---|---|---|
| Zn | Cr | Co | Ni | Cu | As | Cd | Pb | ||
| MW1-1 | 7 | 1 | 7 | 6 | 5 | 8 | 24 | 4 | 63 |
| MW1-2 | 15 | 2 | 9 | 7 | 6 | 13 | 35 | 5 | 93 |
| MW2-1 | 3 | 1 | 7 | 6 | 5 | 8 | 23 | 4 | 57 |
| MW2-2 | 8 | 2 | 6 | 5 | 5 | 9 | 37 | 5 | 75 |
| MW3-1 | 5 | 1 | 5 | 5 | 5 | 9 | 49 | 6 | 85 |
| MW3-2 | 17 | 2 | 6 | 6 | 5 | 11 | 92 | 10 | 147 |
3.2. Lipids and Tocopherols
Total lipids (Table 4) were reduced by approximately half after the first month of exposure and remained within the range of 0.5-0.8% across all samples and periods. At the same time, tocopherol levels doubled and even tripled, with the most significant increase observed in the MW1. Tocopherol synthesis is often upregulated as a protective response to environmental stresses including desiccation, but also exposure to air pollutants.
Table 4.
Total lipids and tocopherols content in H. cupressiforme samples from background and moss walls during the two exposure periods. The results are mean with the corresponding standard deviation (n=3). Different small letters in a column represent significant differences in the results (p<0.05, Duncan test).
| Sample | Total lipids % |
Tocopherols mg kg-1 |
|---|---|---|
| Background | 1.34±0.02a | 1921±18e |
| MW1-1 | 0.70±0.01c | 7277±332a |
| MW1-2 | 0.74±0.02c | 7066±140a,b |
| MW2-1 | 0.62±0.03d | 5111±208c |
| MW2-2 | 0.53±0.02e | 6722±439b |
| MW3-1 | 0.71±0.04c | 5543±371c |
| MW3-2 | 0.84±0.01b | 4545±127d |
3.3. The rbcL Gene Expression in MWs
Rubisco consists of eight large subunits (LSUs) encoded by the chloroplast (cp) gene rbcL and eight small subunits (SSUs) encoded by the nuclear gene rbcS [20,21]. In our previous study, we established a correlation between the expression of rbcL in the aquatic moss Fontinalis antipyretica and the pollution degree [19].
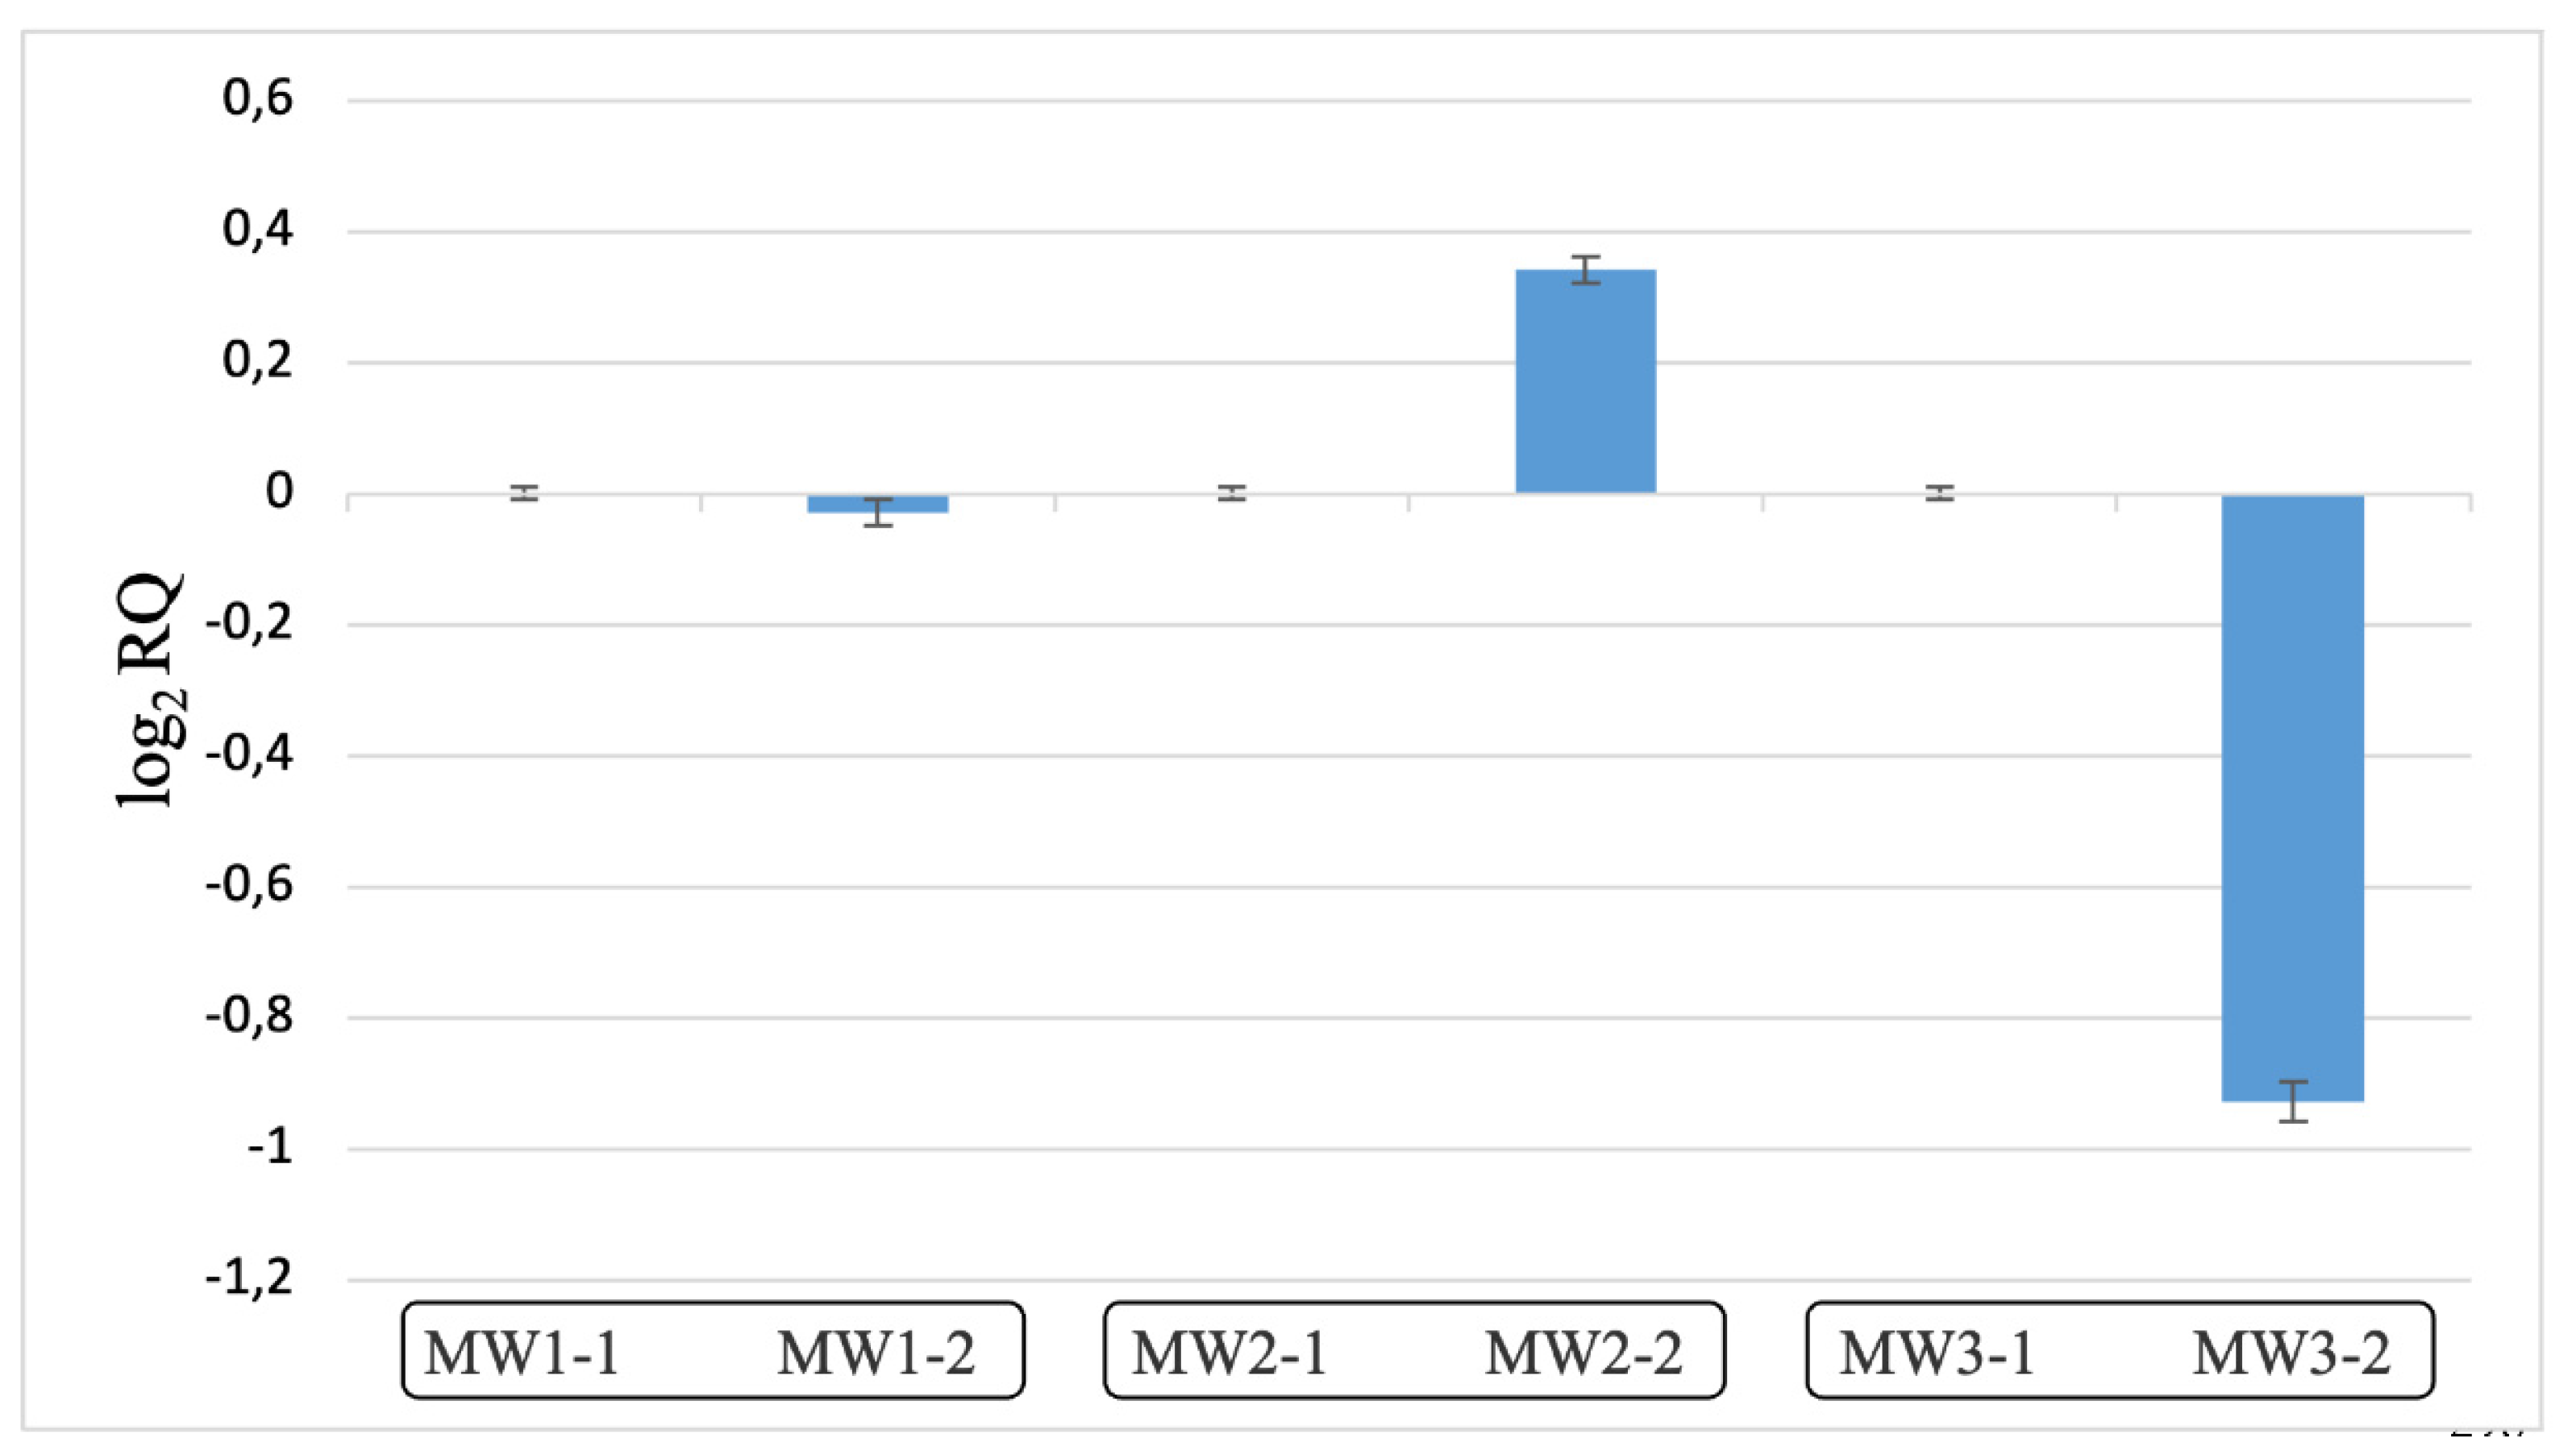
To assess the impact of air pollution on the expression of the rbcL gene in H. cupressiforme, we conducted an analysis of the three MWs at the initiation of their installation and again after a five-month exposure period. The complete coding sequence (cds) of the rbcL gene from H. cupressiforme (Acc. AB039674) was retrieved from the NCBI database and aligned with the cds of F. antipyretica rbcL (Acc. AB050949). The alignment of the rbcL coding sequences from different moss species (H. cupressiforme and F. antipyretica) indicates a high degree of similarity, which supports the use of specific primers [19] for quantitative RT-PCR analyses. This methodological rigor ensures that any observed changes in expression levels are reliable and attributable to the experimental conditions rather than technical artifacts. For each MW, the relative rbcL gene expression was compared between the initial installation phase and the five-month exposure period, as depicted in Figure 4. Notably, while transcript levels of rbcL remained relatively stable in MW1 and MW2, a statistically significant reduction in rbcL transcripts was observed in MW3-5 by the end of the exposure period. Furthermore, MW3-5 exhibited the highest ERI compared to the other MWs, indicating a pronounced response to air pollution exposure over time.
Figure 4.
Relative expression of the chloroplast rbcL gene in H. cupressiforme moss walls over a five-month exposure period. Relative expression levels were assessed using RT-qPCR with three independent replicates, normalized to EF1-α, and presented as log2RQ. The rbcL gene expression was compared between the initial installation phase and the five-month exposure period. Error bars represent the standard deviation (SD) of the replicates.
4. Discussion
Over a period of one year (September 2023-October 2024), H. cupressiforme demonstrated good resistance and vitality in an urbanized environment. This confirmed H. cupressiforme performance in indoor walls [3] and as suitable species for moss walls in general.
Background values of Cd and Zn corresponded to the average geometric mean values in mosses in Europe [22]. The remaining analyzed elements have higher concentrations than the values found in mosses throughout Europe: the content of Ni and Pb is about 2 times higher, of Cu—3 times, of Al—4 times, of As and Cr—almost 6 times and of Fe—9 times. Hg concentrations were under the methodological limit of determination (<0.1 mg kg-1) in all samples. Comparison with average Bulgarian moss data showed similar levels of As and Cr, but Pb levels in moss from Strandja Mountain were even half as much [23]. Cd, Mn, Ni, Pb and Zn had similar concentrations also with background levels for H. cupressiforme reported from Spain [24]. Lower levels in Spain were detected for Al, Co, Cr, Fe—about 10 times, for As and Cu—5 times.
The comparison of the results is somewhat challenging because, in an urban environment, it is often difficult to find the biomonitor in sufficient quantities. In such cases, moss bags (dry moss or devitalized cloned moss grown in vitro) have been employed as an alternative [25]. However, H. cupressiforme from the same city used in passive biomonitoring in 2010 [26] showed that Pb and Cd levels had decreased, with Cd showing a reduction of over 10-fold. The reduction in fossil fuel combustion for domestic heating in the city over the past decade could provide an explanation.
Elements Co, Cr and Fe had lower levels of accumulation in moss bags with H. cupressiforme exposed in ten South Eastern Europe cities including Bulgaria (Sofia) around dense traffic, urban and industrial areas [27]. Their maximum content in moss bags (Co—0.8 mg kg-1, Cr—3.87 mg kg-1, Fe—1129 mg kg-1) were 4 to 8 times lower than in moss wall samples. These three crustal elements in moss walls may have originated from soil dust and could be assigned as a geogenic.
The recorded maximum levels of eight elements in MW2, an urban background location, demonstrated that even in areas with regulated traffic, proximity to intense traffic flow and related vehicular emissions raises concerns about air quality. For instance, analyzed Cu maximum could be associated with brake linings, which are the main source of Cu in a heavy traffic environment [27].
Total lipids in background moss sample were within the range for bryophytes, from 1 to 9.1% of dry weight, depending on the region and growth condition [28]. Scarce data are available on pollutant effects on bryophyte lipid metabolism. The documented reduction by approximately half in pilot moss walls was in line with reported metal sensitivity of Rhytidiadelphus squarrosus in its lipid metabolism [29]. Our hypothesis that antioxidant mechanisms (tocopherols) play a key role in adaptation to pollution stress was confirmed by increased tocopherol content in H. cupressiforme. Moreover, tocopherol content as a plant functional trait biomarker in bryophytes adapted to heavy metal polluted habitats was reported recently [30].
The rbcL gene, typically found as a single, highly conserved copy in the chloroplast genome, serves as a reliable marker for comparative studies across plant species. In contrast, rbcS belongs to a multigene family within the nuclear genome, resulting in greater genetic diversity and variation among species due to multiple copies and potential functional redundancy [31,32,33]. The rbcL consistency across sequences suggests that any significant changes in expression levels may indicate stress responses that are universally applicable across taxa. Our results highlight the potential of using rbcL expression as a biomarker for assessing the impact of air pollution on plant health, particularly in sensitive ecosystems like moss walls. In addition, as rbcL encodes the large subunits of Rubisco, which is crucial for carbon fixation during photosynthesis, its expression can be directly linked to the physiological state of the plant [34]. Under stress conditions alterations in Rubisco activity may reflect the plant’s ability to cope with environmental challenges. The observed reduction in gene expression could reflect broader ecological consequences, such as impaired photosynthesis and reduced carbon fixation capabilities.
5. Conclusions
The constructed external moss walls were successfully maintained for over a year. Using calculated RF and ERI metrics, an industrially influenced site (Kuklen village) was identified as polluted, highlighting the environmental risks associated with Cd. This insight could assist environmental managers in mitigating areas of ecological concern. The study documented the activation of antioxidant defence mechanisms in the moss walls which resulted in increased tocopherol content in the three installations. The responsiveness of Rubisco and its associated genes to pollutants suggests their potential integration into biomonitoring programs for air quality assessment. By measuring changes in Rubisco activity or rbcL expression levels, researchers could effectively assess the impact of air pollution on plants.
Pilot external moss walls not only contribute to the building design and microclimate, but benefit monitoring of air pollution. In the coming decades, moss walls with H. cupressiforme, and mosses in general, will certainly be a sustainable solution for urban environment and will represent attractive source for air biomonitoring.
Author Contributions
Conceptualization, G.G., S.D. and G.Y.; methodology, Z.P., D.G., V.B.; software, G.G. and V.B.; validation, E.A. and M.G.; formal analysis, Z.P., D.G. and G.Y.; investigation, G.G. and S.D.; resources, S.D.; data curation, Z.P., D.G. and G.Y.; writing—original draft preparation, G.G. and G.Y.; writing—review and editing, G.G. and G.Y.; visualization, G.G. and V.B.; supervision, G.G. and G.Y.; project administration, Z.P.; funding acquisition, G.G. and Z.P. All authors have read and agreed to the published version of the manuscript.
Funding
This research was funded by European Union-NextGeneration EU, through the National Recovery and Resilience Plan of the Republic of Bulgaria, grant number BG-RRP-2.004-0001-C01.
Data Availability Statement
The raw data supporting the conclusions of this article will be made available by the authors on request.
Conflicts of Interest
The authors declare no conflicts of interest.
Abbreviations
The following abbreviations are used in this manuscript:
| ERI | Ecological Risk Index |
| MW | Moss wall |
| RF | Risk factor |
References
- Julinova, P.; Beckovsky, D. Perspectives of moss species in urban ecosystems and vertical living-architecture: A review. In Advances in Engineering Materials, Structures and Systems: Innovations, Mechanics and Applications; Zingoni, A., Ed.; CRC Press: London, UK, 2019. [Google Scholar] [CrossRef]
- Glime, J.M. Adaptive Strategies: Growth and Life Forms. In: Bryophyte Ecology, Glime, J.M. Ed.; Michigan Technological University, International Association of Bryologists, 2013; Volume 1, pp.1-25.
- Zechmeister, H.G.; Möslinger, L.; Korjenic, A.; Streit, E.; Sulejmanovski, A.; et al. Viability of Living Moss for Indoor Green Walls: A Study on Temperature, Humidity, and Irrigation. Sustainability (Switzerland) 2023, 15, 15625. [Google Scholar] [CrossRef]
- Alvarez Gutiérrez, R.; Blom, J.; Belmans, B.; De Bock, A.; Van den Bergh, L.; et al. Preliminary Research on Moss-Based Biocomposites as an Alternative Substrate in Moss Walls. Sustainability (Switzerland) 2023, 15, 16500. [Google Scholar] [CrossRef]
- Sun, M.; Li, X. Air pollution and public health: an empirical study based on inter-provincial panel data. Population Journal 2017, 39, 5–13. (In Chinese) [Google Scholar]
- Mohsen, M.; Ahmed, M.B.; Zhou, J.L. Particulate matter concentrations and heavy metal contamination levels in the railway transport system of Sydney, Australia. Transp. Res. D: Transp. Environ. 2018, 62, 112–124. [Google Scholar] [CrossRef]
- Ares, A.; Aboal, J.R.; Carballeira, A.; Giordano, S.; Adamo, P.; et al. Moss bag biomonitoring: A methodological review. Sci. Total Environ. 2012, 432, 143–158. [Google Scholar] [CrossRef]
- Gribacheva, N.; Gecheva, G.; Zhiyanski, M.; Pavlova-Traykova, E.; Yaneva, R. Active and passive moss monitoring of trace elements in urban and mountain areas, Bulgaria. For. Ideas 2021, 27, 309–317. [Google Scholar]
- Schröder, W.; Nickel, S.; Schönrock, S.; Meyer, M.; Wosniok, W.; et al. Spatially valid data of atmospheric deposition of heavy metals and nitrogen derived by moss surveys for pollution risk assessments of ecosystems. Environ. Sci. Pollut. Res. 2016, 23, 10457–10476. [Google Scholar] [CrossRef]
- Lu, Y.; Eiriksson, F.F.; Thorsteinsdóttir, M.; Simonsen, H.T. Valuable fatty acids in bryophytes—production, biosynthesis, analysis and applications. Plants 2019, 8, 524. [Google Scholar] [CrossRef]
- Amari, T.; Ghnaya, T.; Abdelly, C. Nickel, cadmium and lead phytotoxicity and potential of halophytic plants in heavy metal extraction. S. Afr. J. Bot. 2017, 11, 99–110. [Google Scholar] [CrossRef]
- Abdulbaki, A.S.; Alsamadany, H.; Alzahrani, Y.; Olayinka, B.U. Rubisco and abiotic stresses in plants: Current assessment. Turk. J. Bot. 2022, 46, 541–552. [Google Scholar] [CrossRef]
- Sandalio, L.M.; Dalurzo, H.C.; Gómez, M.; Romero-Puertas, M.C.; Del Río, L.A. Cadmium-induced changes in the growth and oxidative metabolism of pea plants. J. Exp. Bot. 2001, 52, 2115–2126. [Google Scholar] [CrossRef] [PubMed]
- Galmés, J.; Aranjuelo, I.; Medrano, H.; Flexas, J. Variation in Rubisco content and activity under variable climatic factors. Photosynth. Res. 2013, 117, 73–90. [Google Scholar] [CrossRef] [PubMed]
- Huihui, Z.; Xin, L.; Zisong, X.; Yue, W.; Zhiyuan, T.; et al. Toxic effects of heavy metals Pb and Cd on mulberry (Morus alba L.) seedling leaves: Photosynthetic function and reactive oxygen species (ROS) metabolism responses. Ecotoxicol. Environ. Saf. 2020, 195, 110469. [Google Scholar] [CrossRef] [PubMed]
- Kaur, H.; Hussain, S.J.; Al-Huqail, A.A.; Siddiqui, M.H.; Al-Huqail, A.A.; et al. Hydrogen sulphide and salicylic acid regulate antioxidant pathway and nutrient balance in mustard plants under cadmium stress. Plant Biol. 2022, 24, 660–669. [Google Scholar] [CrossRef]
- Marraccini, P.; Freire, L.P.; Alves, G.S.C.; Vieira, N.G.; Vinecky, F.; et al. RBCS1 expression in coffee: Coffea orthologs, Coffea arabica homeologs, and expression variability between genotypes and under drought stress. BMC Plant Biol. 2011, 11, 85. [Google Scholar] [CrossRef]
- Lü, F.; Dind, G.; Liu, W.; Zhan, D.; Wu, H.; et al. Comparative study of responses in the brown algae Sargassum thunbergii to zinc and cadmium stress. J. Oceanol. Limnol. 2018, 36, 933–941. [Google Scholar] [CrossRef]
- Gecheva, G.; Mollov, I.; Yahubyan, G.; Gozmanova, M.; Apostolova, E.; et al. Can biomarkers respond upon freshwater pollution?—a moss-bag approach. Biology 2021, 10, 3. [Google Scholar] [CrossRef]
- Andersson, I.; Backlund, A. Structure and function of Rubisco. Plant Physiol. Biochem. 2008, 46, 275–291. [Google Scholar] [CrossRef]
- Pottier, M.; Gilis, D.; Boutry, M. The Hidden Face of Rubisco. Trends Plant Sci. 2018, 23, 382–392. [Google Scholar] [CrossRef]
- Harmens, H.; Norris, D.A.; Sharps, K.; Mills, G.; Alber, R.; et al. Heavy metal and nitrogen concentrations in mosses are declining across Europe whilst some “hotspots” remain in 2010. Environ. Pollut. 2015, 200, 93–104. [Google Scholar] [CrossRef]
- Yurukova, L.; Gecheva, G.; Popgeorgiev, G. “Ecological hot spots” atmospheric assessment with mosses in Bulgaria. C. R. Acad. Bulg. Sci. 2014, 67, 683–686. [Google Scholar]
- Fernández, J.A.; Carballeira, A. Evaluation of contamination, by different elements, in terrestrial mosses. Arch. Environ. Contam. Toxicol. 2001, 40, 461–468. [Google Scholar] [CrossRef] [PubMed]
- Capozzi, F.; Giordano, S.; Aboal, J.R.; Adamo, P.; Bargagli, R.; et al. Best options for the exposure of traditional and innovative moss bags: A systematic evaluation in three European countries. Environ. Pollut. 2016, 214, 362–373. [Google Scholar] [CrossRef] [PubMed]
- Hristeva, Y.; Gecheva, G.; Yurukova, L. Bryophytes in Protected Territories of Plovdiv City (Bulgaria): Preliminary Species List and First Data of Air Pollution Monitoring. Ecol. Balk. 2011, 3, 89–94. [Google Scholar]
- Urošević, M.A.; Lazo, P.; Stafilov, T.; Nečemer, M.; Andonovska, K.B.; et al. Active biomonitoring of potentially toxic elements in urban air by two distinct moss species and two analytical techniques: a pan-Southeastern European study. Air Qual. Atmos. Hlth. 2023, 16, 595–612. [Google Scholar] [CrossRef]
- Dembitsky, V.M. Lipids of bryophytes. Prog. Lipid Res. 1993, 32, 281–356. [Google Scholar] [CrossRef]
- Guschina, I.A.; Harwood, J.L. Lipid metabolism in the moss Rhytidiadelphus squarrosus (Hedw.) Warnst, from lead-contaminated and non-contaminated populations. J. Exp. Bot. 2002, 53, 455–463. [Google Scholar] [CrossRef]
- De Agostini, A.; Cogoni, A; Cortis, P. ; Vacca, A.; Becerril, J.M.; et al. Heavy metal tolerance strategies in metallicolous and non-metallicolous populations of mosses: Insights of γ+β-tocopherol regulatory role. Environ. Exp. Bot. 2022, 194, 104738. [Google Scholar] [CrossRef]
- Clegg, M.T.; Cummings, M.P.; Durbin, M.L. The evolution of plant nuclear genes. Proc. Natl. Acad. Sci. U.S.A. 1997, 94, 7791–7798. [Google Scholar] [CrossRef]
- Schwarte, S.; Tiedemann, R. A gene duplication/loss event in the ribulose-1,5-bisphosphate-carboxylase/ oxygenase (Rubisco) small subunit gene family among accessions of Arabidopsis thaliana. Mol. Biol. Evol. 2011, 28, 1861–1876. [Google Scholar] [CrossRef]
- Gruber, A.; Feiz, L. Rubisco assembly in the chloroplast. Front. Mol. Biosci. 2018, 5. [Google Scholar] [CrossRef]
- Spreitzer, R.J.; Salvucci, M.E. Rubisco: Structure, regulatory interactions, and possibilities for a better enzyme. Annu. Rev. Plant Biol. [CrossRef]
- Chonova, P.; Gecheva, G.; Gribacheva, N. Air pollution biomonitoring in urban ecosystems with Aesculus hippocastanum. Ecol. Balk. 2019, 11, 85–92. [Google Scholar]
- Nagl, C.; Schneider, J.; Thielen, P. Implementation of the Ambient Air Quality Directive; European Parliament: Brussels, 2016. [Google Scholar]
- Gribacheva, N.; Gecheva, G.; Stefanova, V. Air pollution monitoring with mosses in Western Rhodopes, Bulgaria. Bulg. Chem. Commun. 2019, 51, 256–260. [Google Scholar] [CrossRef]
- Harmens, H.; Norris, D.A.; Steinnes, E.; Kubin, E.; Piispanen, J. Mosses as biomonitors of atmospheric heavy metal deposition: Spatial patterns and temporal trends in Europe. Environ. Pollut. 2010, 158, 3144–3156. [Google Scholar] [CrossRef]
- Steinnes, E.; Rühling, Å.; Lippo, H.; Mäkinen, A. Reference materials for large-scale metal deposition surveys. Accredit. and Qual. Assur. 1997, 2, 243–249. [Google Scholar] [CrossRef]
- Livak, K.J.; Schmittgen, T.D. Analysis of relative gene expression data using real-time quantitative PCR and the 2(-Delta Delta C(T)) Method. Methods 2001, 25, 402–408. [Google Scholar] [CrossRef]
- Hakanson, L. An ecological risk index for aquatic pollution control. A sedimentological approach. Water Res. 1980, 14, 975–1001. [Google Scholar] [CrossRef]
- ter Braak, C.J.F.; Šmilauer, P. CANOCO Reference Manual and CanoDraw for Windows User’s Guide: Software for Canonical Community Ordination (Version 4.5). Section on Permutation Methods; Microcomputer Power: Ithaca, New York, 2002. [Google Scholar]
Disclaimer/Publisher’s Note: The statements, opinions and data contained in all publications are solely those of the individual author(s) and contributor(s) and not of MDPI and/or the editor(s). MDPI and/or the editor(s) disclaim responsibility for any injury to people or property resulting from any ideas, methods, instructions or products referred to in the content. |
© 2025 by the authors. Licensee MDPI, Basel, Switzerland. This article is an open access article distributed under the terms and conditions of the Creative Commons Attribution (CC BY) license (https://creativecommons.org/licenses/by/4.0/).
Copyright: This open access article is published under a Creative Commons CC BY 4.0 license, which permit the free download, distribution, and reuse, provided that the author and preprint are cited in any reuse.


