
Submitted:
21 January 2025
Posted:
22 January 2025
You are already at the latest version
Abstract
We report on arc melt syntheses of HoB2 and Nb-substituted HoB2 polycrystalline ingots and their magnetocaloric and microstructural properties. XRD data and microstructural analysis reveal that a nominal 10% Nb addition during synthesis results in changes to unit cell parameters and grain morphology. Interpretation of refined cell parameters using Vegard’s law shows that Nb substitutes into HoB2 with stoichiometry Ho0.93Nb0.07B2. Arc melted products are polycrystalline bulk samples containing minor phases such as Ho2O3, Ho and HoB4. Nb substitution results in a smaller grain size (~sub-micron) and a higher Curie temperature, TC, compared to HoB2. With a 10 T applied field, the maximum magnetic entropy, ΔSM, for HoB2 and for Ho0.93Nb0.07B2 is 46.8 Jkg-1K-1 and 38.2 Jkg-1K-1, at 18 K and 21 K, respectively. Both samples show second order phase transitions. Despite high totals of minor phases (e.g. ~10 wt.% and ~25 wt.%), calculated relative cooling powers are greater than 1,300 Jkg-1 and 600 Jkg-1, at 10 T and 5 T, respectively. Magnetocaloric properties of both samples are consistent with Holmium boride compounds prepared by alternative methods.
Keywords:
Magnetocaloric materials
; Holmium diboride
; Niobium diboride
; Curie temperature
; magnetic entropy
1. Introduction
The global demand for reduced CO2 emissions has increased attention on the use of renewable energy including green hydrogen as an energy vector. Energy storage is a key issue to be addressed for widespread adoption of renewable energy in domestic or export markets [1,2,3]. In this regard, liquid hydrogen is a likely medium for storing, transporting and use of renewable energy [4]. Typical industrial liquefaction methods for hydrogen involve a combination of compression, expansion, and throttling processes such as with the Linde-Hampson cycle [5,6]. In these cases, cyclic gas compression techniques are predominant cooling methods and contribute to high operational and capital costs for many installations [6,7]. To address these operational costs, recent attention has been directed at magnetic refrigeration (MR) methods as succinctly described in the review article by Kitanovski [8].
Magnetocaloric (MC) materials show properties that invoke an isothermal magnetic entropy change or an adiabatic temperature change with application or removal of an external magnetic field. This phenomenon is known as a magnetocaloric effect (MCE) with key applications in MR. Use of MCE has been demonstrated for room temperature applications with compounds such as Gd5Si2Ge2, (Mn,Fe)2P, La(Fe,Si)13H and Gd0.8875Ce0.1025Si0.84Cr0.19 [9,10,11,12,13]. MR research has also focused on cryogenic temperatures [14,15,16,17,18], especially for hydrogen liquefaction which occurs at 20 K at atmospheric pressure. Bykov et al. [16] and Tang et al. [18] have shown that combinations of stacked MC materials are suitable for cooling from 77 K to liquid hydrogen temperature. Material combinations include first order (FOPT) and second order phase transition (SOPT) MCE compounds such as ErCo2 and HoB2 [18] or by tuning the Curie temperature, TC, with various substituent elements (e.g., Ho1-xDyxAl2 or Ho1-xGdxB2) [16,19].
A giant MCE reported for the rare-earth diboride, HoB2, shows strong potential for low-temperature applications at, or near the Curie temperature, TC, of ~15 K [20].The maximum change in magnetic entropy, ΔSM, for HoB2 at 5 T is 40.1 Jkg-1K-1 [20] and is of optimum practical use near 15 K. Other Ho-based compounds such as HoAl2 and Ho1-xGdxB2 show maximum ΔSM values above and below 20 K at 5 T [16,19]. In this work, we consider combinations of Ho-based compounds that may be suitable for MR at temperatures < 77 K. For hydrogen liquefaction plants at industrial scale, superconducting magnets are considered a highly effective choice [16,17], not only for large-scale production [16] but also because fields 10 T or higher are attainable. We explore applied magnetic fields up to 10 T combined with an increase in TC by compatible element substitution into HoB2. In this study, we report on Nb substitution in the Ho-B alloy system and effects on microstructure and magnetocaloric properties.
2. Materials and Methods
Polycrystalline samples of Ho-B compounds are prepared on a water-cooled copper hearth by arc melting using a tungsten electrode and high-purity Ar. Stochiometric amounts of Ho (95 % purity, supplied by Sigma Aldrich), and nano boron powder (99.8% purity, supplied by Pavezynum Turkey are weighed and pressed into a pellet of weight 2 g. Details of impurities detected in the Ho powder using ICP-OES analysis are provided in Supplemental Materials Table S1. For substituted samples, molar ratios of Ho, B, and Nb are weighed (for nominal 10% of a substituent element), mixed and pressed into a pellet of weight 2 g. In order to ensure element homogeneity in the mixed material, the ingot is turned and remelted four times.
Microstructural and compositional analyses were performed using standard metallographic practices on polished samples mounted in conductive resin. The crystal structure and phase identification were analysed using X-ray diffraction (XRD), scanning electron microscopy (SEM), and EDS microanalysis using secondary X-rays. XRD patterns of samples were measured using Co Kα1 radiation in Bragg Brentano geometry, with 2θ steps of 0.02° and a counting time of 10 seconds per step, utilizing D8 Bruker X-ray diffractometers. The diffraction patterns are refined and indexed using the software program Topas [21]. Detailed analyses using XRD patterns and SEM+EDS indicate that all synthesized samples are multiphase, with HoB2 the predominant phase.
Electron Backscatter Diffraction (EBSD) data were obtained using a field emission scanning electron microscope (FESEM, JEOL 7001 SEM) with automated feature detection and equipped with an Oxford Instruments SDD XMax 50 mm2 detector, pattern analyzer and Channel 5 analysis software. EBSD mapping was conducted at an accelerating voltage of 20 kV and a step size of 0.2 µm.
The temperature and field dependence of dc magnetization measurements were conducted using the Physical Property Measurement System (PPMS, Dynacool) by Quantum Design with a Vibrating Sample Magnetometer (VSM), in the temperature range of 5-71 K and a dc magnetic field from 0 T to 10 T. Temperature dependence of magnetization (M(T)) was measured under zero field cooled (ZFC) and field cooled (FC) protocols. The magnetic entropy change is calculated from the isothermal field dependent magnetization curves using Maxwell’s relation [22]:
where Hi is the initial magnetic field and Hf is the final magnetic field.
3. Results
Summary details of physical and chemical properties and respective magnetic properties of HoB2 and Nb-substituted HoB2 are provided below.
3.1. Structural and Microstructural Analysis
Table 1 lists starting materials, ratios and proportions of synthesized products using data from XRD measurements. Phase analyses using Rietveld refinements of XRD data show that HoB2 is the major phase with a maximum yield of 92%. A minor amount of unreacted Ho (3.9 %) is also present along with Ho2O3 (4.0%) despite processing explicitly aimed at minimizing potential for oxidation. Table 1 shows that Nb addition reduces the proportion of HoB2 – in this case, with nominal 10% Nb addition – to 72.1%. Minor proportions of HoB4, HoB12, and NbB2 (less than 10 % of each) are detected with addition of Nb (Table 1).
Figure 1 shows XRD patterns for the products listed in Table 1. Peaks are well matched to, and indexed for, HoB2 based on space group P6/mmm and previously determined cell parameters using powder diffraction file PDF# 04-003-0232. Trace amounts of unreacted Ho and Ho2O3 (< 5%) are also present for synthesis without Nb addition as noted in Table 1. For both samples, powder diffraction file (PDF) data are used to identify the presence of other minor phases such as HoB4, Ho2O3 and NbB2. Figure 1 shows XRD data for both samples with minor impurities identified and indexed peaks for HoB2 and Ho1-xNbxB2.
With diffraction peaks and minor phases identified, unit cell parameters for the primary phase, HoB2 were refined to a = 3.28296(2) Å, c = 3.814454(4) Å. Refinement of unit cell parameters for the sample with Nb in the synthesis resulted in shifts in values to a = 3.268009(6) Å and c = 3.784152(1) Å as shown in Table 2. These changes in cell parameters are reflected in the clear shift of the (1-10) and (1-11) peaks to higher two-theta angles with Nb addition, as shown in Figure 1. Additional plots of XRD data, for the intervals 30o < 2θ < 50o and 60o < 2θ < 80o, highlighting this shift to higher 2θ with Nb substitution, are shown in Figures S1 and S2 of Supplementary Materials. Figure S1 clearly shows the shift to higher 2θ values for peaks and Figure S2 highlights peak broadening commonly associated with a smaller grain size (compared to HoB2). These data are consistent with substitution of Nb into HoB2 and microstructural changes as confirmed using Vegard’s law.
Methods to establish the level of substitution of soluble elements into metals or minerals of a known structure include single crystal and powder X-ray or neutron diffraction [24,25]. Vegard’s law [26,27] attributes a linear relationship of end member unit cell parameters to the mixing of components in a substitutional solid solution, particularly for metals and alloys of similar structure. Supplemental Figure S3 shows a plot of a and c cell parameters for end-members HoB2 and NbB2 as well as for the (Ho,Nb)B2 sample prepared in this work. Cell parameter values used for HoB2 and for NbB2 are as shown in Table 2. We conclude from Figure S3 that Nb is soluble in HoB2 . and is less than the nominal 10 % proportion used during synthesis. Using the Vegard plot (Figure S3), we estimate the relative percentages of Ho and Nb are 92.6(6) and 7.4(6), respectively. For convenience, we show the stoichiometry as (Ho0.93Nb0.07)B2.
Backscattered electron (BSE) images from polished samples of HoB2 and Ho0.93Nb0.07B2 are shown in Figures 2 (a) and (d), respectively. BSE images show that aggregates contain different phases as indicated by the bright and dark grey image contrast, which typically corresponds to variations in atomic number. In general, these images are consistent with phase abundances obtained by Rietveld refinement of XRD data shown in Table 1. The small white spots in BSE images correspond to Ho2O3. Compared to HoB2, polished samples for Ho0.93Nb0.07B2 show fewer voids.
Euler maps and EBSD images in Figure 2 show the crystal orientation and structure of component alloys using known crystallographic data for HoB2, HoB4, Ho, Ho2O3 and NbB2. EBSD analyses are presented in Figures 2 (b) and (e) without the use of noise reduction software applied to the maps. Figures 2 (c) and (f) show that HoB2 is a major phase for both samples (blue coloured grains) and confirm the XRD data shown in Table 1. Ho2O3 is present in all samples (indicated by yellow grains in Figure 2c and 2f) although the size and relative abundance of the oxide varies between samples. Figures 2(d-f) show that grains produced via mixing Nb with Ho and B during arc melting are significantly smaller than those in HoB2.
3.2. Magnetocaloric Properties
Figures 3(a-b) show the temperature dependence of magnetization (M-T) for both synthesized alloys under an applied field of 100 Oe. For Ho0.93Nb0.07B2, the divergence between the zero-field cooled (ZFC) and field cooled (FC) M-T curves is more pronounced than for HoB2. For ZFC conditions, the magnetization slowly increases and then rises sharply between 15–18 K, exhibiting typical paramagnetic to ferromagnetic transitions. To evaluate the magnetic transition temperature, TC, the temperature dependent derivatives of the FC curves are shown in Figures 3c-3d. The TC is defined as the minimum in dM/dT and is 15.8 K for HoB2. This value for TC is similar to that reported by de Castro et al., [20] (15 K) for arc melted HoB2. For Ho0.93Nb0.07B2, Figure 3d shows an increase in TC to 17.5 K. All M-T curves exhibit a kink anomaly around 11 K (T*), which is associated with a spin-reorientation phenomenon [28].
Figures 4a and 4b show isothermal magnetization curves measured to the maximum magnetic field of 10 T around TC using a temperature difference interval of 2 K. Magnetization increases rapidly with increasing magnetic field for temperatures below the Curie temperature, TC, for both samples and tends to be saturated above 5 T. This response is typical ferromagnetic behaviour for intermetallic alloys. For temperatures above TC, for example at 20 K, the magnetization increases almost linearly with increasing magnetic field. This linear behaviour indicates that these Ho diboride samples are paramagnetic above the Curie temperature.
Figure 4.
Field dependence of magnetization for (a) HoB2 and (b) Ho0.93Nb0.07B2 at several temperatures below and above the Curie temperature. Arrot plots for (c) HoB2 and (d) (Ho0.93Nb0.07)B2 are obtained from the isothermal magnetization curves of Figure 4a and 4b, respectively.
Figure 4.
Field dependence of magnetization for (a) HoB2 and (b) Ho0.93Nb0.07B2 at several temperatures below and above the Curie temperature. Arrot plots for (c) HoB2 and (d) (Ho0.93Nb0.07)B2 are obtained from the isothermal magnetization curves of Figure 4a and 4b, respectively.
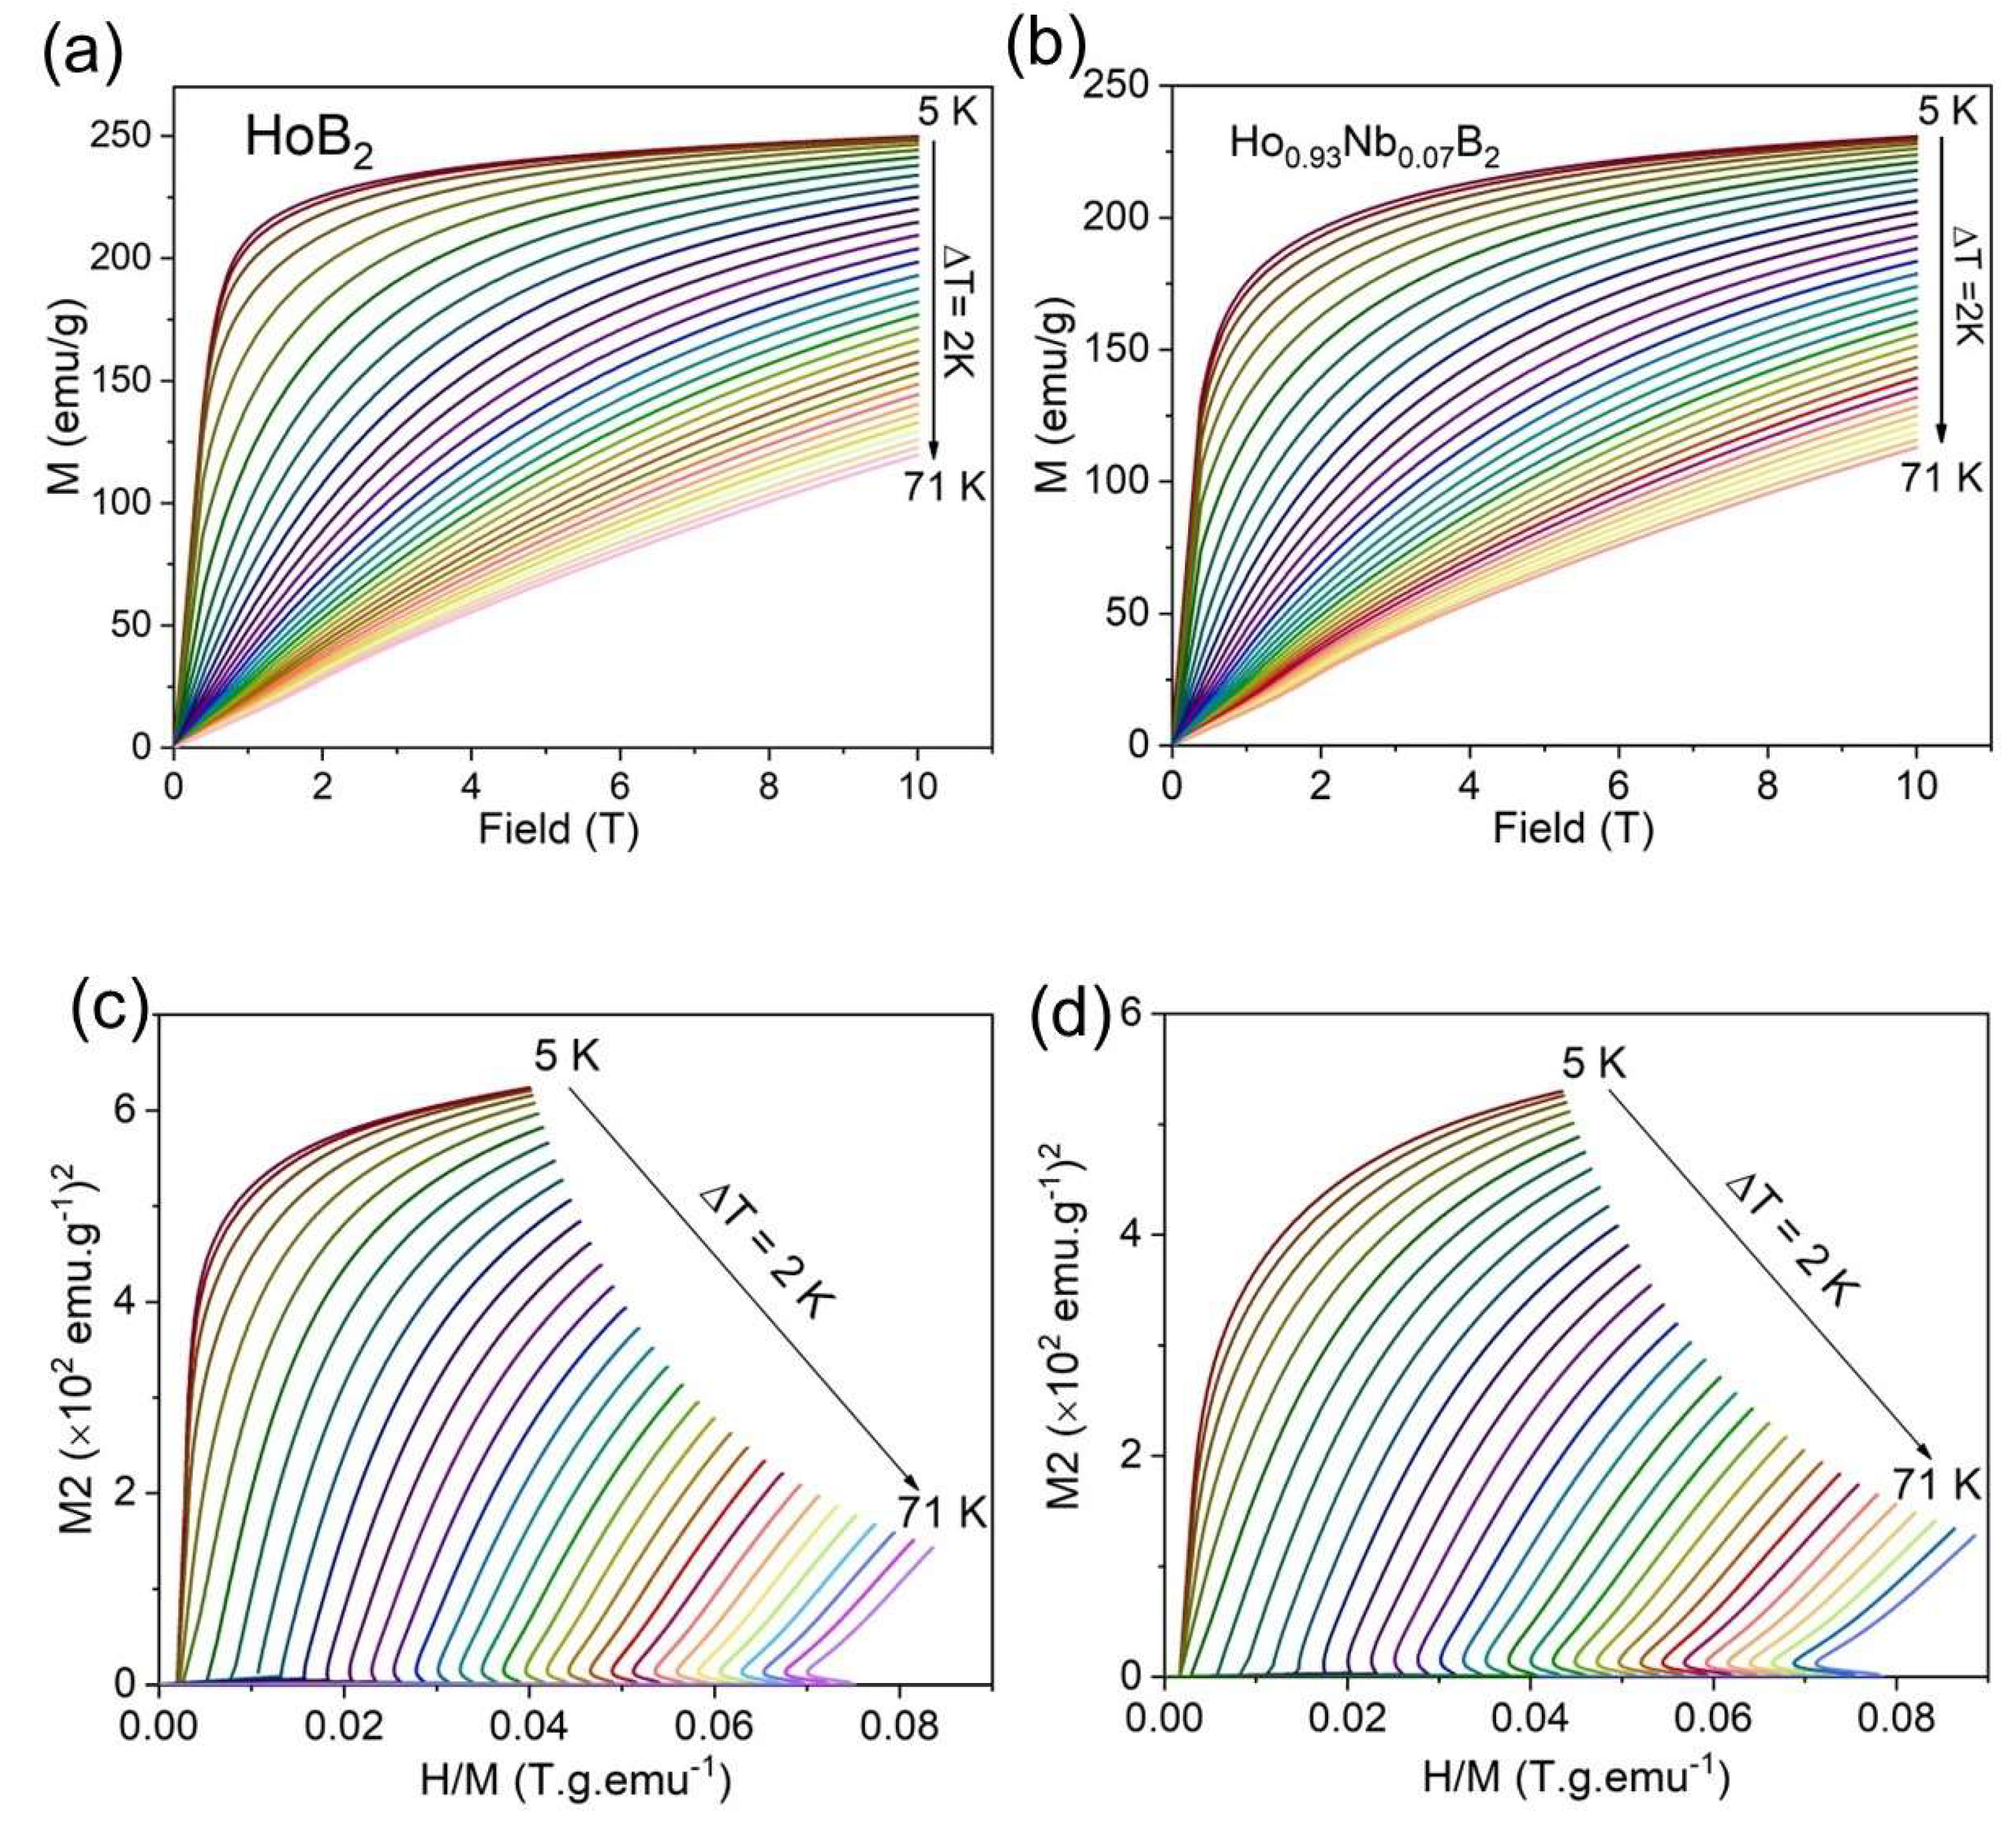
A plot of H/M versus M2, known as the standard Arrott plot, is shown in Figures 4c and 4d for HoB2 and Ho0.93Nb0.07B2, respectively. According to the criterion proposed by Banerjee [29] the order of magnetic field can be determined from the slope of the isothermal plot. If the H/M vs M2 curve shows a negative slope, the transition is first order (FOPT) while a positive slope corresponds to a second order phase transition (SOPT). For both HoB2 and Ho0.93Nb0.07B2, neither a negative slope nor an inflection can be observed in these Arrott plots. Thus, these Ho diboride samples show a SOPT in good agreement with the study on Gd substituted HoB2 [19].
Figure 5a shows the calculated magnetic entropy change, ΔSM, for applied magnetic fields, ΔH, up to 10 T with change in temperature for HoB2 and Ho0.93Nb0.07B2. For magnetic fields between 1–10 T, the maximum value of magnetic entropy change is 46.8 Jkg-1K-1 for HoB2 at 10 T and 18 K. Note that the maximum value for ΔSM occurs at temperature(s) slightly higher than the TC value (e.g., 15.8 K for HoB2 in this study).
The maximum ΔSM decreases to 38.2 Jkg-1K-1 for Ho0.93Nb0.07B2 at 10 T and 21 K. This reduction in ΔSM value with element substitution is in good agreement with earlier work by de Castro et al., [19,30] on substitution of Gd and Dy in HoB2. The reduction in ΔSM with increased TC for Nb-substituted HoB₂ is also consistent with the first rule proposed by Liu et al. [31] which states that the maximum magnetic entropy change in a rare-earth-based intermetallic series increases as the Curie temperature decreases. The horizontal dotted line in Figure 5a represents a minimum value for ΔSM considered a viable MCE for MR utilised by de Castro et al. [20] for machine learning discovery of HoB2.
The relative cooling power (RCP) of magnetocaloric materials is a key parameter for evaluating performance in a magnetic refrigerator. In an ideal refrigeration cycle, RCP is the amount of heat transferred between hot and cold reservoirs and can be estimated using the following equation [32]:
where is the maximum magnetic entropy change value and is the full width at half maximum of the magnetic entropy curve. Figure 5b shows RCP values for HoB₂ and Ho0.93Nb0.07B2 which increase linearly with applied magnetic field. Ho0.93Nb0.07B2 shows lower RCP values compared to HoB₂ at high field strengths (i.e., > 3 T). RCP values for other SOPT Ho-based compounds are also shown in Figure 5b.
4. Discussion
Liquefaction is important for gas storage and transportation, as is evident for the natural gas industry [33] and for specific existing uses of hydrogen [6]. Broadened utilisation of liquid hydrogen for “hard-to-abate” industry sectors [34] as well as for transportation [34] may be rapidly effected by more compact and efficient technologies such as MR [8]. Continuous cooling using magnetocaloric materials requires both rapid variation of magnetic fields [35] and use of magnetic material as a regenerator in an Active Magnetic Regenerative Refrigerator (AMRR) [8,17]. A large entropy change for magnetocaloric materials is preferably obtained at magnetic fields above 2 T [15] most effectively deployed with superconducting magnets [35]. In general, the value for magnetic enthalpy, |ΔSM|, increases with increased applied magnetic field [36] as shown in Figure 5a for both Ho diboride compounds up to 10 T and for other Ho compounds to 5 T [19,20,30].
As shown by de Castro et al., [20] the magnetic entropy change for HoB2 is at a maximum value of 40.1 J. kg-1K-1 near the Curie temperature (TC~15 K) for a magnetic field change of 5 T [18,36,37,38,39]. Because the Curie temperature for HoB2 is close to the temperature for liquid hydrogen (20.3 K), this compound is a promising candidate for AMRR [20,36]. However, the maximum change in entropy, ΔSM, for HoB2 decreases with increasing temperature for the same applied field, so is of optimum practical use at, or near, 15 K. Hence, a range of elements have been substituted into HoB2 [19,30,37] in order to either (i) increase the TC and/or to (ii) increase ΔSM across a broad temperature range.
Iwasaki et al., [37] show that, in the absence of a solid solution between end member alloys (e.g., HoB2 and HoAl2), the MCE is only due to that of the dominant magnetocaloric material. As a result, it is important to establish the solubility limit(s) of potential substituents to HoB2 or similar alloys. For other substituted alloys, such as Ho1-xDyxB2 [30], TC increases with increased Dy substitution up to x=1 for an applied field of 5 T. However, with increased TC, the magnitude of |ΔSM| decreases, although the temperature range of the |ΔSM| curve increases [30]. Similarly, for Ho1-xGdxB2 alloys (for 0 < x < 0.4) an applied field of 5 T results in an increase in TC and broadens the |ΔSM| curve(s) without the magnetic hysteresis effects of the Dy analog [19]. For the Gd substituted series, the TC increased to between 17 K and 30 K, respectively [19]. This increase in TC offers the potential to deliver relatively high refrigerant capacity across a wide temperature range (e.g., from 15 K to 30 K or higher) with HoB2 and appropriate stoichiometric substitutions of soluble elements.
The phase field for Ho with B shows that HoB2 forms at a peritectic due to decomposition of solid HoB4 and a Ho-rich liquid at 2200 oC with complete formation at 2350 oC [40]. Noting the relatively low purity of Ho starting material at 95 % (Supplemental Table 1), we suggest that the presence of impurities in the final product may be reduced with higher quality Ho. We have considered the potential for impurity phases, such as Ho2O3 and HoB4, to affect the magnetocaloric properties of HoB2 and Nb-substituted HoB2. For HoB4, the presence of antiferromagnetic transitions at 7.1 K and 5.7 K [41,42] are a proxy indicator for effect(s) on the magnetocaloric properties of HoB2 samples. Similarly, an antiferromagnetic transition occurs for amorphous and crystalline Ho2O3 at 2.1 K and 5.2 K, respectively [43,44]. As shown in Figure 3(a-b), such anomalies are not observed for HoB2 and Ho0.93Nb0.07B2. Therefore, we suggest that the minor amounts of HoB4 and Ho2O3 have limited, or no, effect on the magnetic transition temperature of these arc melted samples.
Both Ho-boride samples show a pronounced peak at or near the Curie temperature, TC. The TC increase to 17.5 K for Ho0.93Nb0.07B2 is due to successful substitution of Nb into the HoB2 structure. A second magnetic transition marked by T* at 11 K is observed for both HoB2 and Nb-substituted HoB2. The origin of T* is likely due to a spin reorientation mechanism as identified for Dy- and Gd-substituted HoB2 [19,30]. The addition of a spherical S7/2 Gd3+ moment in HoB2, induces an enhancement in Curie temperature and a reduction in the peak value of ΔSM and a broadening of ΔSM curves [19]. The values for Ho0.93Nb0.07B2 show a similar trend with an increase in TC and reduction of ΔSM for all applied fields up to 10 T. We suggest that increased substitution of Nb into HoB2 will further increase TC with a consequent increase in the temperature range at which ΔSM is viable for effective MR.
The relative reduction in RCP for Ho0.93Nb0.07B2 compared with HoB2 can also be attributed to the substitution of Nb for Ho, which alters magnetic interactions and the structural ordering within the material. Nb substitution weakens the overall magnetic moment and decreases the MCE efficiency, thereby reducing the RCP. Despite the lower RCP, the linear trend in Figure 5b suggests that both materials maintain a predictable response to increasing fields, suggesting that Nb-substituted HoB2 compounds are candidates for further exploration in field-dependent cooling applications.
Table 3 summarises the magnetocaloric properties of HoB2 and Ho0.93Nb0.07B2 from this study as well as for other SOPT Ho compounds [8,19]. The maximum ΔSM value for HoB2 in this work under an applied field of 5 T (34.3 Jkg-1K-1) is comparable with the value of 40.1 Jkg-1K-1 for arc melted samples reported by de Castro et al., [20]. The ΔSM value reported for gas-atomized particles of HoB2 near the TC of 15 K is also 40.1 Jkg-1K-1 [47] and slightly lower in the data reported by Yamomoto et al. [39]. In these cases, XRD data show that the HoB2 samples contain minimal, or no, impurities [20,39,47] unlike that noted in Table 1 for HoB2 in this work and for Ho0.93Nb0.07B2.
For HoB2 produced in this study and shown in Table 1, impurities account for ~9 % of the final ingot and thus, a lower weight fraction of HoB2. Similarly, for Ho0.93Nb0.07B2, the reduction in weight fraction of other Ho compounds is ~25 %. Adjusting the weight-dependent values for both samples suggests that at an applied field of 5 T, the maximum ΔSM for HoB2 and Ho0.93Nb0.07B2 from this study would be ~38 Jkg-1K-1 and ~35 Jkg-1K-1, respectively. This approach is consistent with estimates of ΔSM by Iwasaki et al. [37] when evaluating the impact of Al substitution into HoB2. For an applied field of 10 T, weight adjusted values of a maximum ΔSM are ~52 Jkg-1K-1 and ~49 Jkg-1K-1 for HoB2 and Ho0.93Nb0.07B2, respectively.
For both examples of HoB2 in Table 3, the RCP values are similar at 5 T and suggest that marginal differences in magnetic parameters (e.g., TC and ΔSM) and/or a modest level of impurities may enable comparable refrigeration capacity in an operating system. In practice, the data in Table 1 and Table 3 imply that low levels of impurities are unlikely to substantially affect ΔSM at high applied fields (i.e., > 2 T). This implication is consistent with a detailed study on the presence of non-stoichiometric phases formed by inductive melting gas atomization [39]. The work by Yamomoto et al. [39] showed that the presence of up to 20 wt. % impurity phases has minimal effect on the physical properties of HoB2 particles while retaining a value for ΔSM well above 30 Jkg-1K-1 at 5 T. Comparing maximum values of ΔSM for HoB2 at 5 T from earlier work [20,28,39,47] and this study, we estimate an average value of 39.1 (±1.5) Jkg-1K-1 suggesting that sample preparation for HoB2 may have limited influence on magnetic properties. Nevertheless, for HoNi synthesis, Rajivghandi et al. [45] have shown a difference of 8 K in TC values between melt-spun and arc melted samples. Values for HoNi in Table 3 are for an arc melt sample [45].
Identification of Nb solubility in HoB2, suggests that higher proportions of Nb, or other Group 5 elements may enable a family of Ho1-xMxB2 compounds (where M=Gd, Nb), suited to hydrogen liquefaction. With a combination of SOPT compounds as noted above or of similar analogues, an AMRR system based only on Ho compounds may be a realisable goal. SOPT magnetic materials, which include compounds listed in Table 3 and now, including Ho0.93Nb0.07B2, are without thermal hysteresis and offer capacity for reversibility and mechanical stability in a system undergoing cyclic performance [18]. While temperatures from 77–20 K are not completely covered by the combination of compounds in Table 3, there is potential to extend the TC range from 15–36 K. Use of Ho compounds with additional element substitutions (e.g., HoCo1.8Ni0.15Al0.05) as exemplified by Tang et al. [18] and/or including Group 5 elements show promise.
Superconducting magnets are necessary to achieve and maintain a higher field strength compared to magnetic field(s) from permanent magnets. This distinction is crucial for some practical applications, particularly for MR at cryogenic temperatures below 113 K [6] and as shown in this and previous work [16,18,19,20]. The reduction in ∆SM with Nb substitution in HoB2 suggests a trade-off between increasing the TC and maintaining a high magnetocaloric effect as noted by others [19]. Table 3 shows that for SOPT polycrystalline Ho compounds both ∆SM and RCP values increase with an increased applied field up to 10 T. These data also suggest that despite a drop in ΔSM value with higher TC for a particular compound, the range of values for δTFWHM available at higher magnetic fields (i.e., > 5 T) provides an effective RCP using SOPT Ho-based magnetocaloric materials.
5. Conclusions
We have synthesized an alloy of composition Ho0.93Nb0.07B2 using arc melting and compared magnetic and microstructural properties with HoB2 prepared by the same technique. Substitution of Nb in HoB2 results in an increased TC and a decrease in ΔSM and RCP in response to changes in magnetic field up to 10 T. Arrott plots confirm a second-order phase transition in these Ho compounds. The maximum ΔSM values for HoB2 and Ho0.93Nb0.07B2 measured from this study are 34.3 Jkg-1K-1 and 26.4 Jkg-1K-1, at 5 T and 46.8 Jkg-1K-1 and 38.2 Jkg-1K-1 at 10 T, respectively. These polycrystalline samples contained other impurity phases such as unreacted Ho and Nb, Ho2O3 and HoB4. Adjusting for impurity phases in both samples indicates that higher values of ΔSM and RCP may be achievable. This work adds another compound, Ho0.93Nb0.07B2, to the metal diboride class of magnetocaloric materials with potential for additional and commensurate properties suited to magnetic refrigeration.
Supplementary Materials
The following supporting information can be downloaded at the website of this paper posted on Preprints.org, Table S1: ICP-OES Analysis of starting Ho powder; Figure S1: Powder XRD patterns for 25o < 2θ < 50o for HoB2 and Ho0.93Nb0.07B2; Figure S2: Powder XRD patterns for 60o < 2θ < 83o for HoB2 and Ho0.93Nb0.07B2; Figure S3: Plot of unit cell parameters for HoB2, Ho0.93Nb0.07B2 and NbB2 delineating Vegard’s law.
Author Contributions
Conceptualization, MS, IM. methodology, MS, ADM; validation, MS, IM, and ADM; formal analysis, MS, IM ADM and KS; data curation, MS, IM, and ADM; writing—original draft preparation, MS; writing, review and editing, MS, IM, KS and ADM.
Funding
This work received partial funding from the Australian Government agency ARENA as part of Contract no. 2018/ RND012 as well as from the Future Energy Exports CRC via a Foundation Fellowship to MS. The views expressed herein are not necessarily the views of the Australian Government, and the Australian Government does not accept responsibility for any information or advice contained herein.
Data Availability Statement
The authors declare that the data supporting the findings of this study are available within the paper and the supplementary information file.
Acknowledgments
We also thank staff from the Central Analytical Research Facility at QUT for ICP analysis as well as access to equipment and facilities used in this work. KS gratefully acknowledges advice and support from Ki Buem Kim.
Conflicts of Interest
The authors declare no conflicts of interest.
References
- Jafari, M., Botterud, A., et al., Decarbonizing power systems: A critical review of the role of energy storage, Renew. Sustain. Energy Rev. 158 2022 112077 1-20. [CrossRef]
- Golombek, R., Lind, A., et al., The role of transmission and energy storage in European decarbonization towards 2050, Energy 239 2022 122159 1-13. [CrossRef]
- Oskouei, M.Z., Şeker, A.A., et al., A Critical Review on the Impacts of Energy Storage Systems and Demand-Side Management Strategies in the Economic Operation of Renewable-Based Distribution Network, Sustainability 14 2022 2110 1-34. [CrossRef]
- Ishaq, H., Dincer, I., et al., A review on hydrogen production and utilization: Challenges and opportunities, Int. Jour. Hydrogen Energy 47 2022 62 26238-26264. [CrossRef]
- Ratnakar, R.R., Gupta, N., et al., Hydrogen supply chain and challenges in large-scale LH2 storage and transportation, Int. Jour. Hydrogen Energy 46 2021 47 24149-24168. [CrossRef]
- Al Ghafri, S.Z.S., Munro, S., et al., Hydrogen liquefaction: a review of the fundamental physics, engineering practice and future opportunities, Energy & Environ. Sci. 15 2022 7 2690-2731. [CrossRef]
- Cipriani, G., Di Dio, V., et al., Perspective on hydrogen energy carrier and its automotive applications, Int. Jour. Hydrogen Energy 39 2014 16 8482-8494. [CrossRef]
- Kitanovski, A., Energy Applications of Magnetocaloric Materials, Adv. Energy Mater. 10 2020 1903741 1-34. [CrossRef]
- Zhang, F., Taake, C., et al., Magnetocaloric effect in the (Mn,Fe)2(P,Si) system: From bulk to nano, Acta Materialia 224 2022 117532 1-13. [CrossRef]
- Belo, J.H., Pereira, A.M., et al., Phase control studies in Gd5Si2Ge2 giant magnetocaloric compound, Jour. Alloys and Compounds 529 2012 89-95. [CrossRef]
- Zeng, H., Kuang, C., et al., Magnetocaloric effect of Gd5Si2Ge2 alloys in low magnetic field, Bull. Mater. Sci. 34 2011 4 825-828. [CrossRef]
- Wang, G.F., Mu, L.J., et al., Hydriding and dehydriding kinetics in magnetocaloric La(Fe,Si)13 compounds, Jour. Appl. Phys. 115 2014 143903 1-8. [CrossRef]
- Adapa, S.R., Feng, T.S., et al., Optimisation of a packed particle magnetocaloric refrigerator: A combined experimental and theoretical study, Int. Jour. Refrigeration 159 2024 64-73. [CrossRef]
- Zhu, Y., Asamoto, K., et al., Magnetocaloric effect of (ErxR1_x)Co2 (R = Ho, Dy) for magnetic refrigeration between 20 and 80 K, Cryogenics 51 2011 494-498.
- Terada, N., Mamiya, H., High-efficiency magnetic refrigeration using holmium, Nat. Comm. 12 2021 1212 1-6. [CrossRef]
- Bykov, E., Liu, W., et al., Magnetocaloric effect in the Laves-phase Ho1−xDyxAl2 family in high magnetic fields, Phys. Rev. Materials 5 2021 095405 1-9. [CrossRef]
- Park, I., Jeong, S., Development of the active magnetic regenerative refrigerator operating between 77 K and 20 K with the conduction cooled high temperature superconducting magnet, Cryogenics 88 2017 106-115. [CrossRef]
- Tang, X., Sepehri-Amin, H., et al., Magnetic refrigeration material operating at a full temperature range required for hydrogen liquefaction, Nat. Comm. 13 2022 1817 1-8. [CrossRef]
- de Castro, P.B., Terashima, K., et al., Enhancement of giant refrigerant capacity in Ho1-xGdxB2 alloys (0.1 ≤ x ≤ 0.4), Jour. Alloys and Compounds 865 2021 158881 1-6. [CrossRef]
- de Castro, P.B., Terashima, K.T., et al., Machine-learning-guided discovery of the gigantic magnetocaloric effect in HoB2 near the hydrogen liquefaction temperature, NPG Asia Materials 12 2020 1-7. [CrossRef]
- Bruker, K., Technical Reference Manual Bruker AXS, Germany 2014.
- Franco, V., Blázquez, J.S., et al., Magnetocaloric effect: From materials research to refrigeration devices, Prog. Mater. Sci. 93 2018 112.
- Kravchenko, S.E., Kovalev, D.Y., et al., Synthesis and Thermal Oxidation Stability of Nanocrystalline Niobium Diboride, Inorg. Mater. 57 2021 10 1005-1014. [CrossRef]
- Moze, O., Kockelmann, W., et al., Neutron diffraction study of CeNi5Sn, Jour. Alloys and Compounds 279 1998 2 110-112. [CrossRef]
- Whittle, K.R., Hyatt, N.C., et al., Combined neutron and X-ray diffraction determination of disorder in doped zirconolite-2M, Amer. Mineral. 97 2012 2-3 291-298. [CrossRef]
- Vegard, L., Die Konstitution der Mischkristalle und die Raumfüllung der Atome, Zeit. für Physik 5 1921 1 17-26. [CrossRef]
- Zhao, L., Goldbach, A., et al., Structural and Permeation Kinetic Correlations in PdCuAg Membranes, ACS Appl. Mater. & Interfaces 6 2014 24 22408-22416. [CrossRef]
- Terada, N., Terashima, K., et al., Relationship between magnetic ordering and gigantic magnetocaloric effect in HoB2 studied by neutron diffraction experiment, Phys. Rev. B 102 2020 094435 1-8. [CrossRef]
- Banerjee, S.K., On a generalised approach to 1st and 2nd order magnetic transitions, Phys. Lett. 12 1964 1 16-17. [CrossRef]
- de Castro, P.B., Terashima, K., et al., Effect of Dy substitution in the giant magnetocaloric properties of HoB(2), Sci Technol Adv Mater 21 2021 1 849-855. [CrossRef]
- Liu, W., Bykov, E., et al., A study on rare-earth Laves phases for magnetocaloric liquefaction of hydrogen, Appl. Mater. Today 29 2022. [CrossRef]
- Mohamed, A.E.-M., Hernando, B., Self-assembled impurity and its effect on magnetic and magnetocaloric properties of manganites, Ceramics International 44 2018 14 17044.
- Mokhatab, S., Mak, J.Y., et al., Chapter 3 - Natural Gas Liquefaction, in: Mokhatab, S., et al. (Eds.), Handbook of Liquefied Natural Gas, Gulf Professional Publishing, Boston, 2014, pp. 147-183. [CrossRef]
- Yang, X., Nielsen, C.P., et al., Breaking the hard-to-abate bottleneck in China’s path to carbon neutrality with clean hydrogen, Nat. Energy 7 2022 10 955-965. [CrossRef]
- Park, I., Lee, C., et al., Performance of the Fast-Ramping High Temperature Superconducting Magnet System for an Active Magnetic Regenerator, IEEE Trans. Appl. Superconductivity 27 2017 4601105 1-5.
- Zhou, X., Shang, Y., et al., Large rotating magnetocaloric effect of textured polycrystalline HoB2 alloy contributed by anisotropic ferromagnetic susceptibility, Appl. Phys. Lett. 120 2022 132401 1-6. [CrossRef]
- Iwasaki, S., Yamamoto, T.D., et al., Al substitution effect on magnetic properties of magnetocaloric material HoB2, Solid State Communications 342 2022 114616 1-5. [CrossRef]
- Lai, J., Bolyachkin, A., et al., Machine learning assisted development of Fe2P-type magnetocaloric compounds for cryogenic applications, Acta Materialia 232 2022 117942 1-9. [CrossRef]
- Yamamoto, T.D., Takeya, H., et al., Effect of Non-Stoichiometry on Magnetocaloric Properties of HoB2 Gas-Atomized Particles, IEEE Transactions on Magnetics 58 2022 6 1-6. [CrossRef]
- Okamoto, H., Schlesinger, M.E., et al., Ho (Holmium) Binary Alloy Phase Diagrams, Alloy Phase Diagrams, ASM International 2016.
- Kim, J.Y., Cho, B.K., et al., Anisotropic magnetic phase diagrams of HoB4 single crystal, Journal of Applied Physics 105 2009 07E116 1-4. [CrossRef]
- Fisk, Z., Maple, M.B., et al., Multiple phase transitions in rare earth tetraborides at low temperature, Solid State Communications 39 1981 11 1189-1192. [CrossRef]
- Boutahar, A., Moubah, R., et al., Large reversible magnetocaloric effect in antiferromagnetic Ho2O3 powders, Scientific Reports 7 2017 13904 1-7. [CrossRef]
- Shinde, K.P., Nana, W.Z., et al., Magnetocaloric effect in rare earth Ho2O3 nanoparticles at cryogenic temperature, Jour. Magnet. Magnetic Mater. 500 2020 166391 1-5. [CrossRef]
- Rajivgandhi, R., Chelvane, J.A., et al., Effect of rapid quenching on the magnetism and magnetocaloric effect of equiatomic rare earth intermetallic compounds RNi (R = Gd, Tb and Ho), Journal of Magnetism and Magnetic Materials 433 2017 169-177. [CrossRef]
- Yamamoto, T.A., Nakagawa, T., et al., Magnetocaloric effect of rare earth mono-nitrides, TbN and HoN, Journal of Alloys and Compounds 376 2004 1-2 17-22. [CrossRef]
- Yamamoto, T.D., Takeya, H., et al., Gas-atomized particles of giant magnetocaloric compound HoB2 for magnetic hydrogen liquefiers, Applied Physics A 127 2021 1-8. [CrossRef]
Figure 1.
Powder XRD patterns for HoB2 (black) and Ho0.93Nb0.07B2 (red) produced by arc melting as listed in Table 1. Peaks for the HoB2 structure are indexed. Peaks for minor impurity phases are identified as: + Ho; * Ho2O3; ◊ HoB4.
Figure 1.
Powder XRD patterns for HoB2 (black) and Ho0.93Nb0.07B2 (red) produced by arc melting as listed in Table 1. Peaks for the HoB2 structure are indexed. Peaks for minor impurity phases are identified as: + Ho; * Ho2O3; ◊ HoB4.
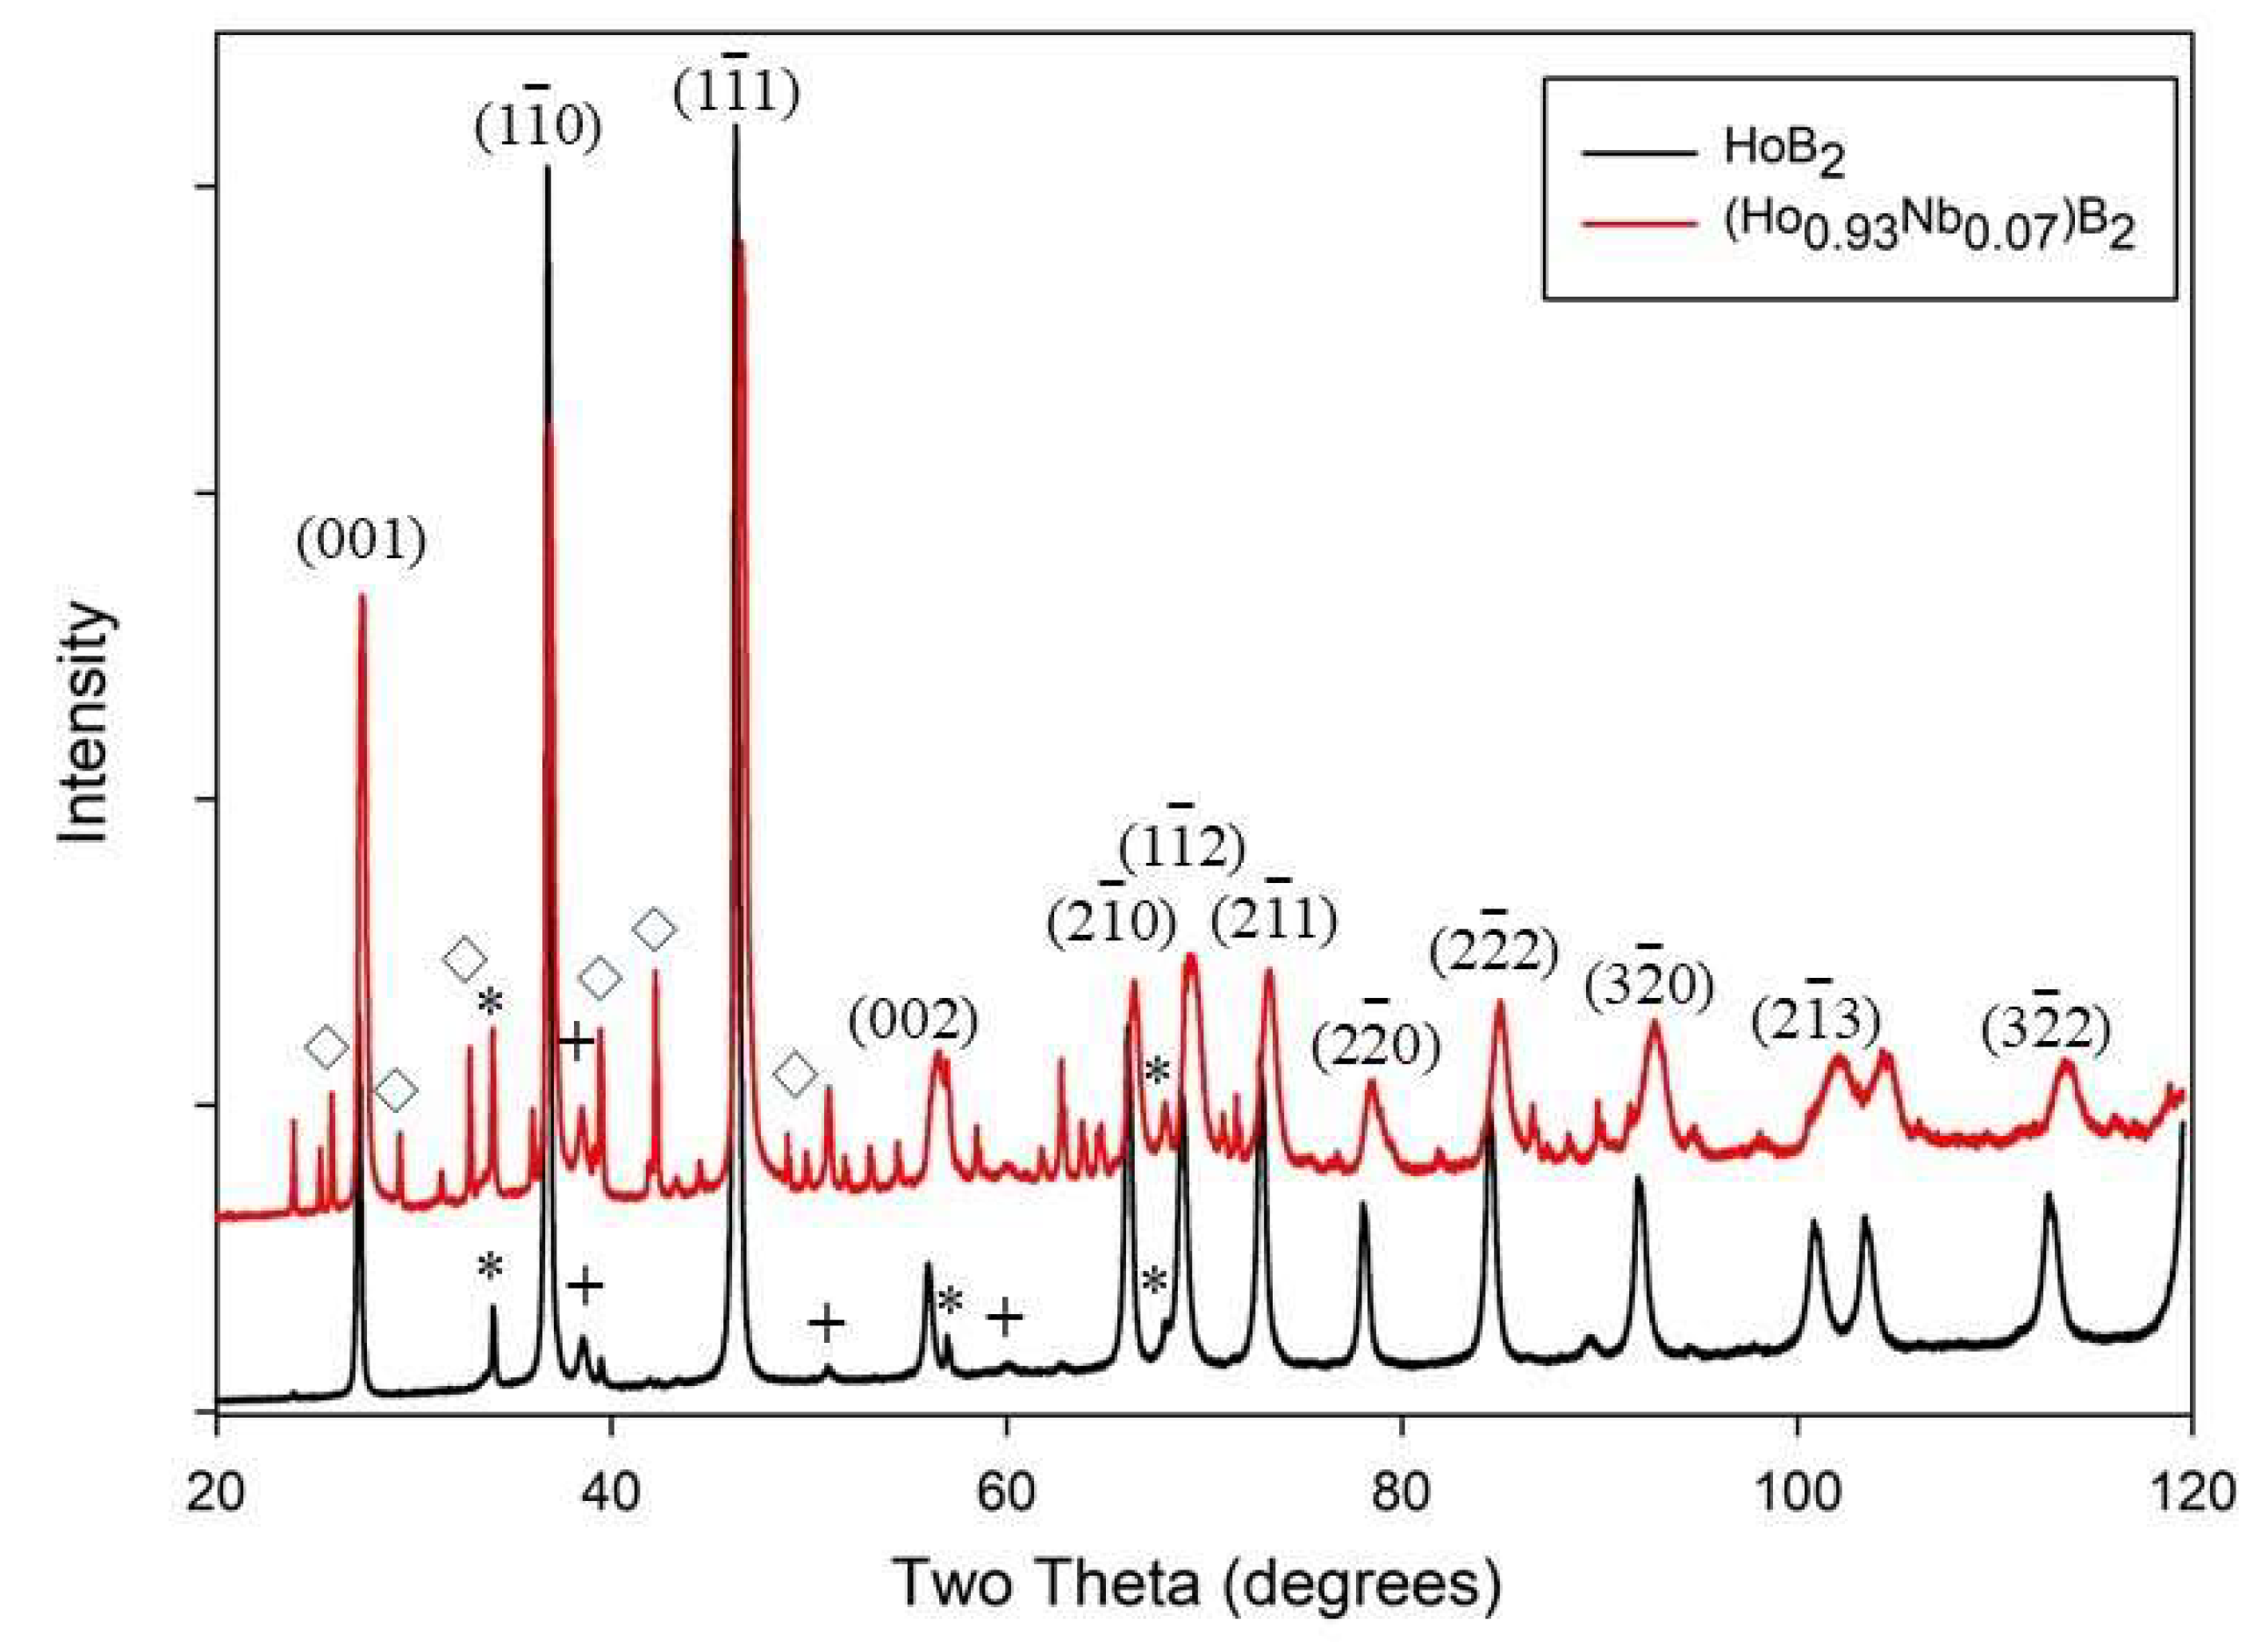
Figure 2.
(a, d) BSE images of aggregates in polished sections, (b, e) Euler maps of these aggregates showing the preferred polar orientation of grains for HoB2 and Ho0.93Nb0.0.07B2, respectively. (c, f) EBSD images for aggregates from the same areas in (b, e) showing HoB2 (blue), Ho2O3 (yellow), Ho (green), NbB2 (orange) and void (black). Note the substantial difference in grain sizes for each sample. All images are at the same magnification (white scale bar = 50 µm).
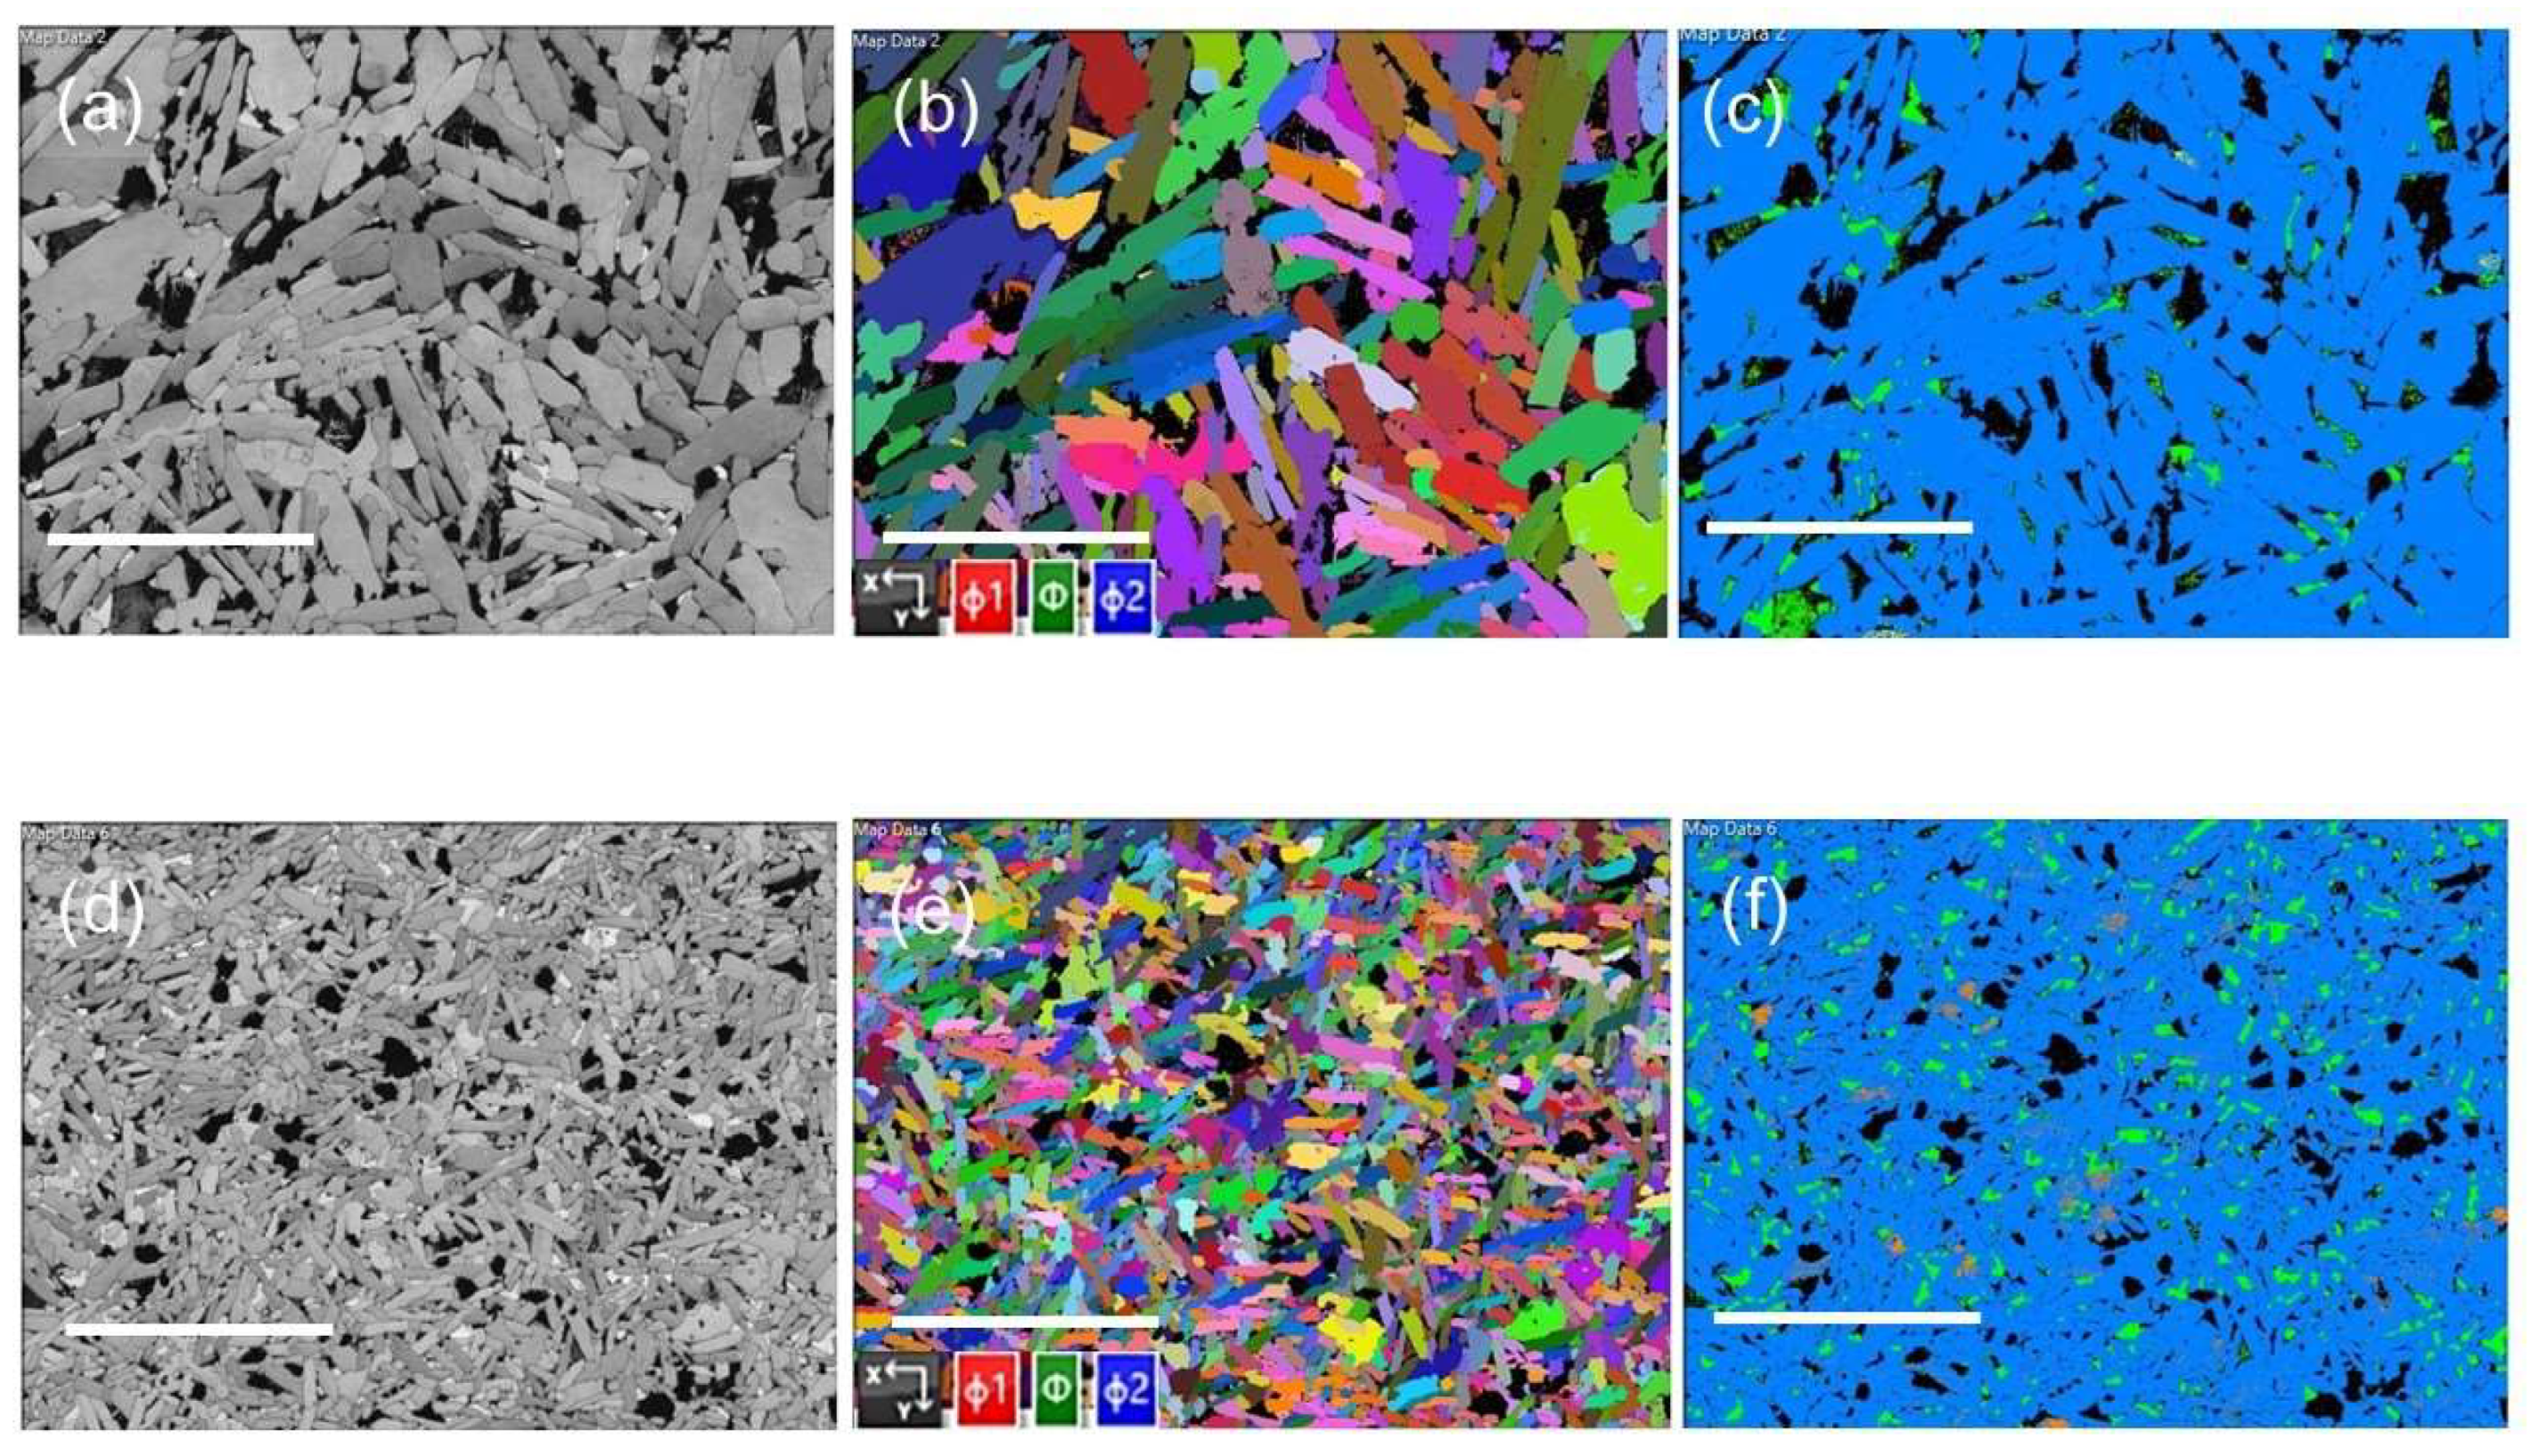
Figure 3.
(a-d) Temperature dependence of sample magnetization under an applied magnetic field of 0.01 T using ZFC and FC protocols and temperature dependence of .
Figure 3.
(a-d) Temperature dependence of sample magnetization under an applied magnetic field of 0.01 T using ZFC and FC protocols and temperature dependence of .
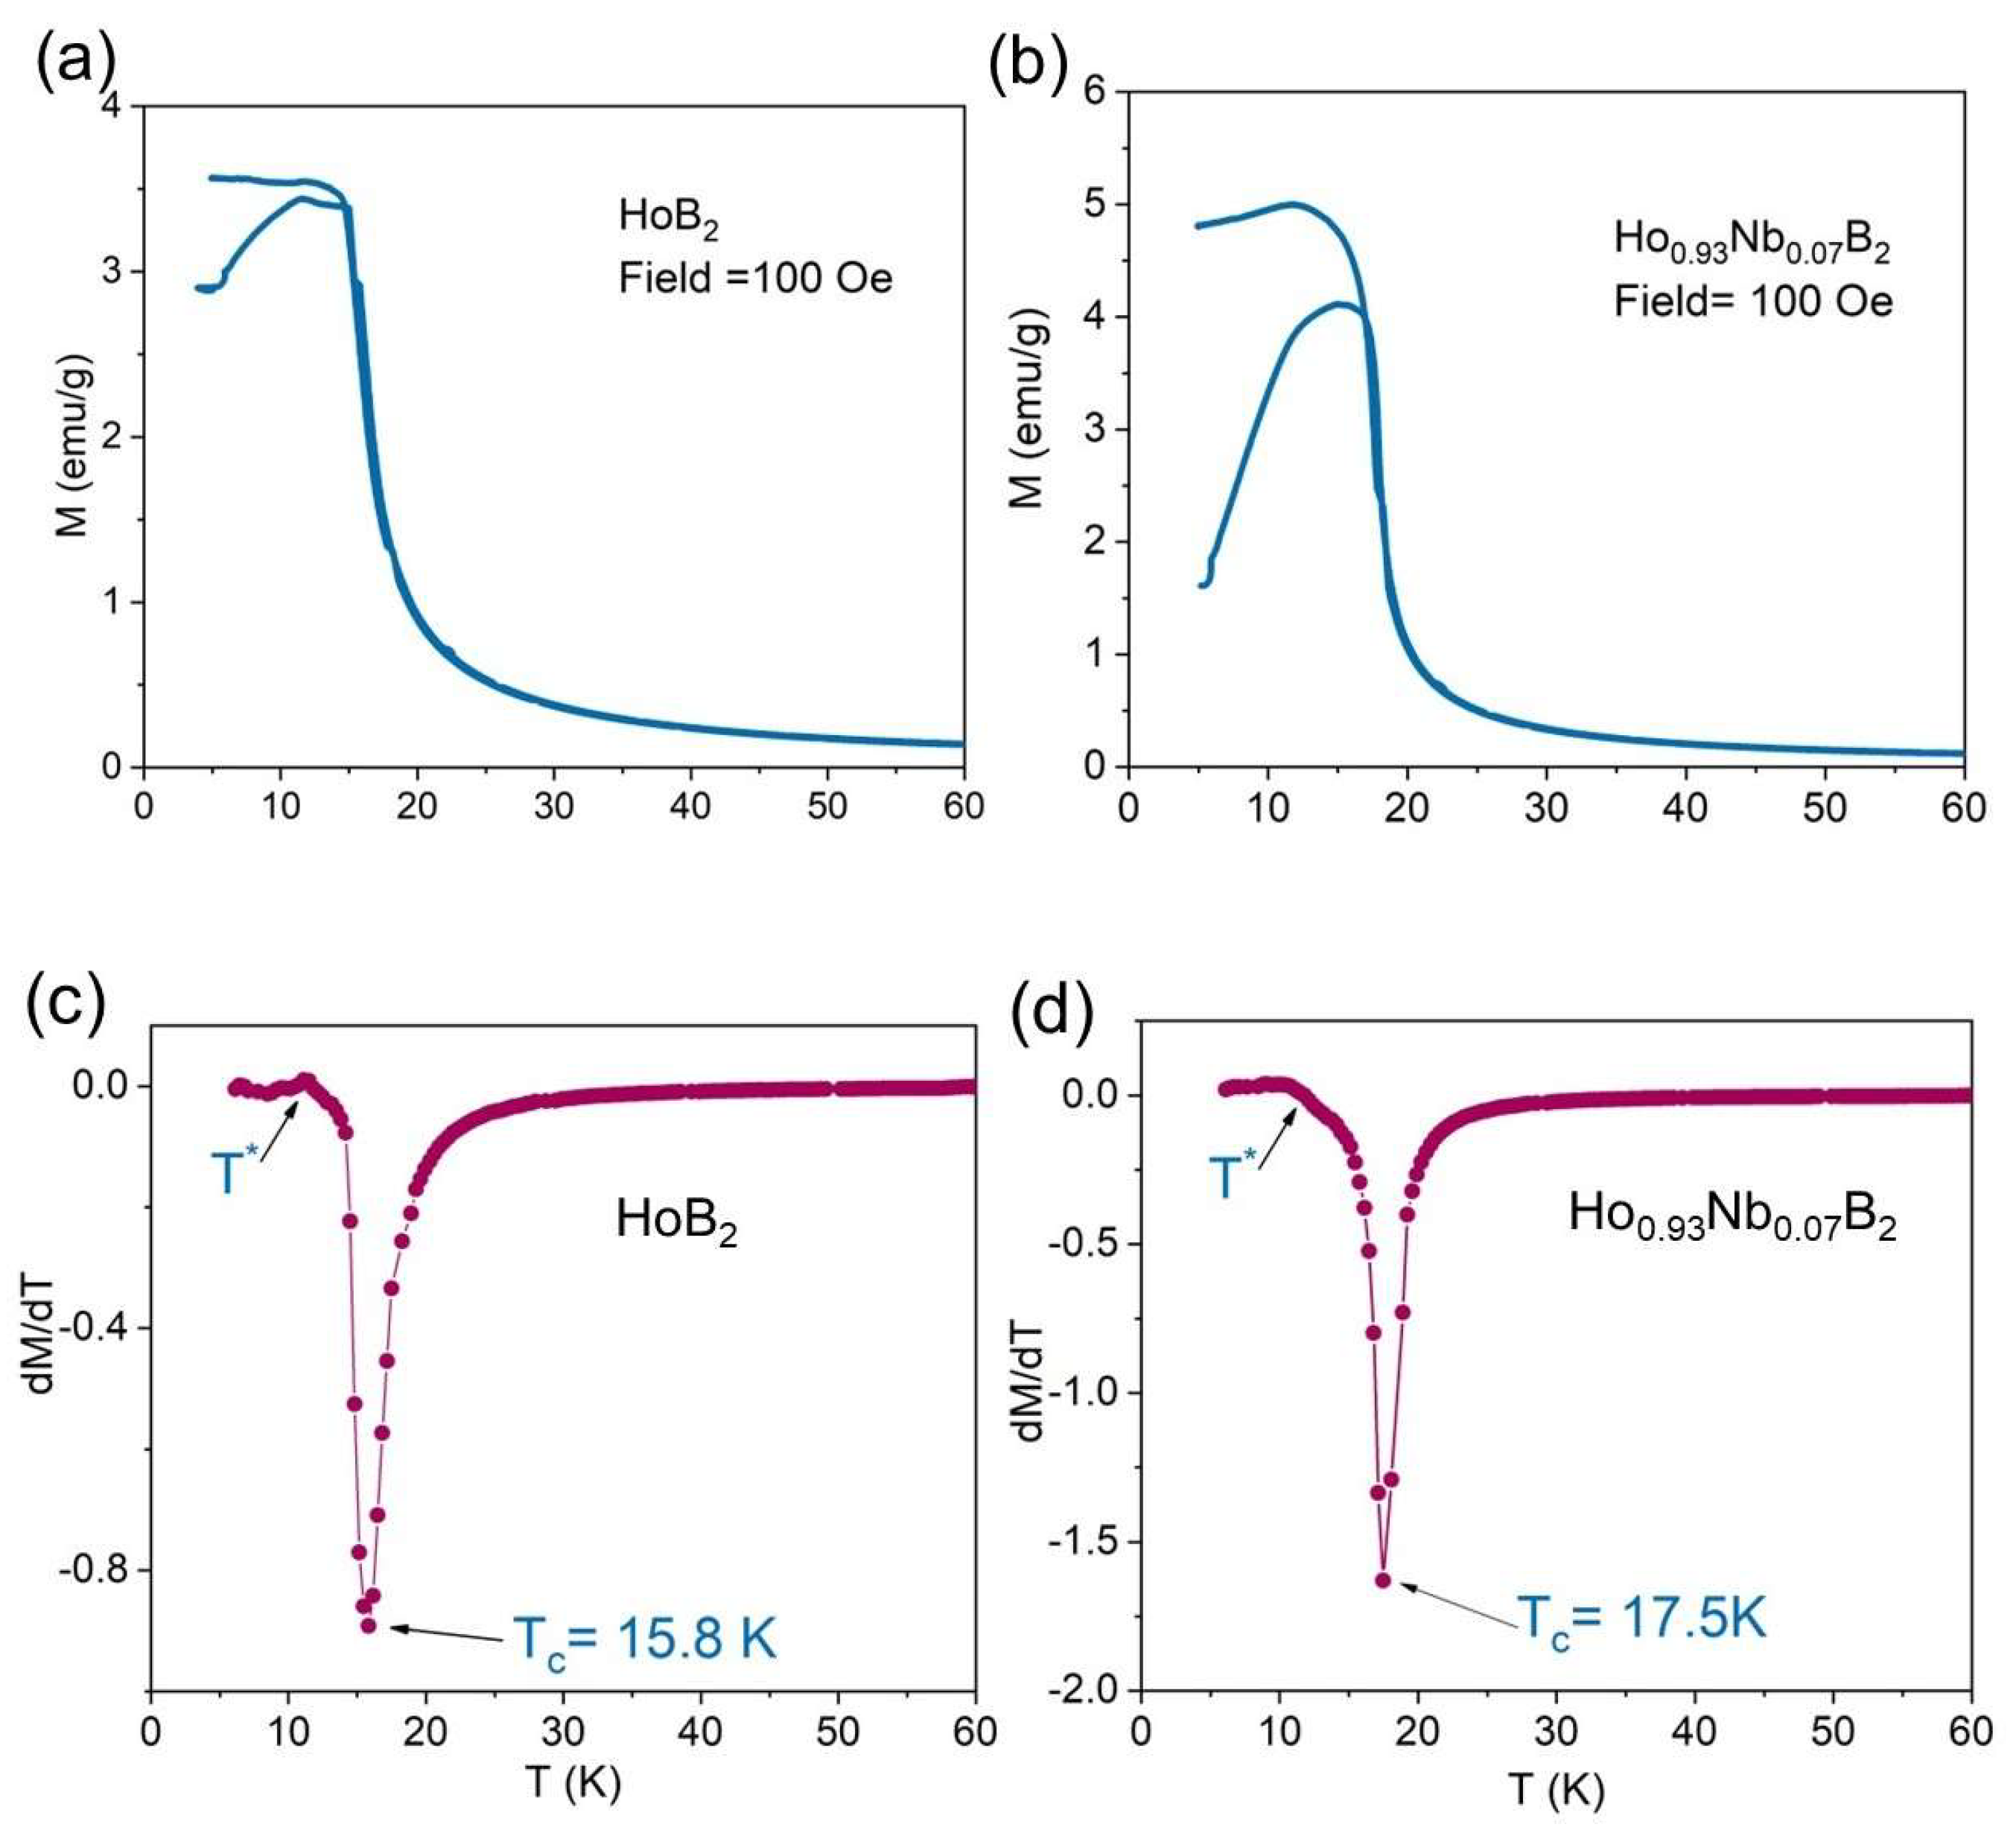
Figure 5.
(a) Magnetic entropy change, ΔSM, for selected applied magnetic fields up to ΔH=10 T; horizontal dotted line represents a minimum value for a viable MCE at low temperatures [20] and (b) Field dependence of RCP for HoB2 and Ho0.93Nb0.07B2 for applied magnetic fields up to 10 T as well as other Ho compounds at 5 T and 10 T.
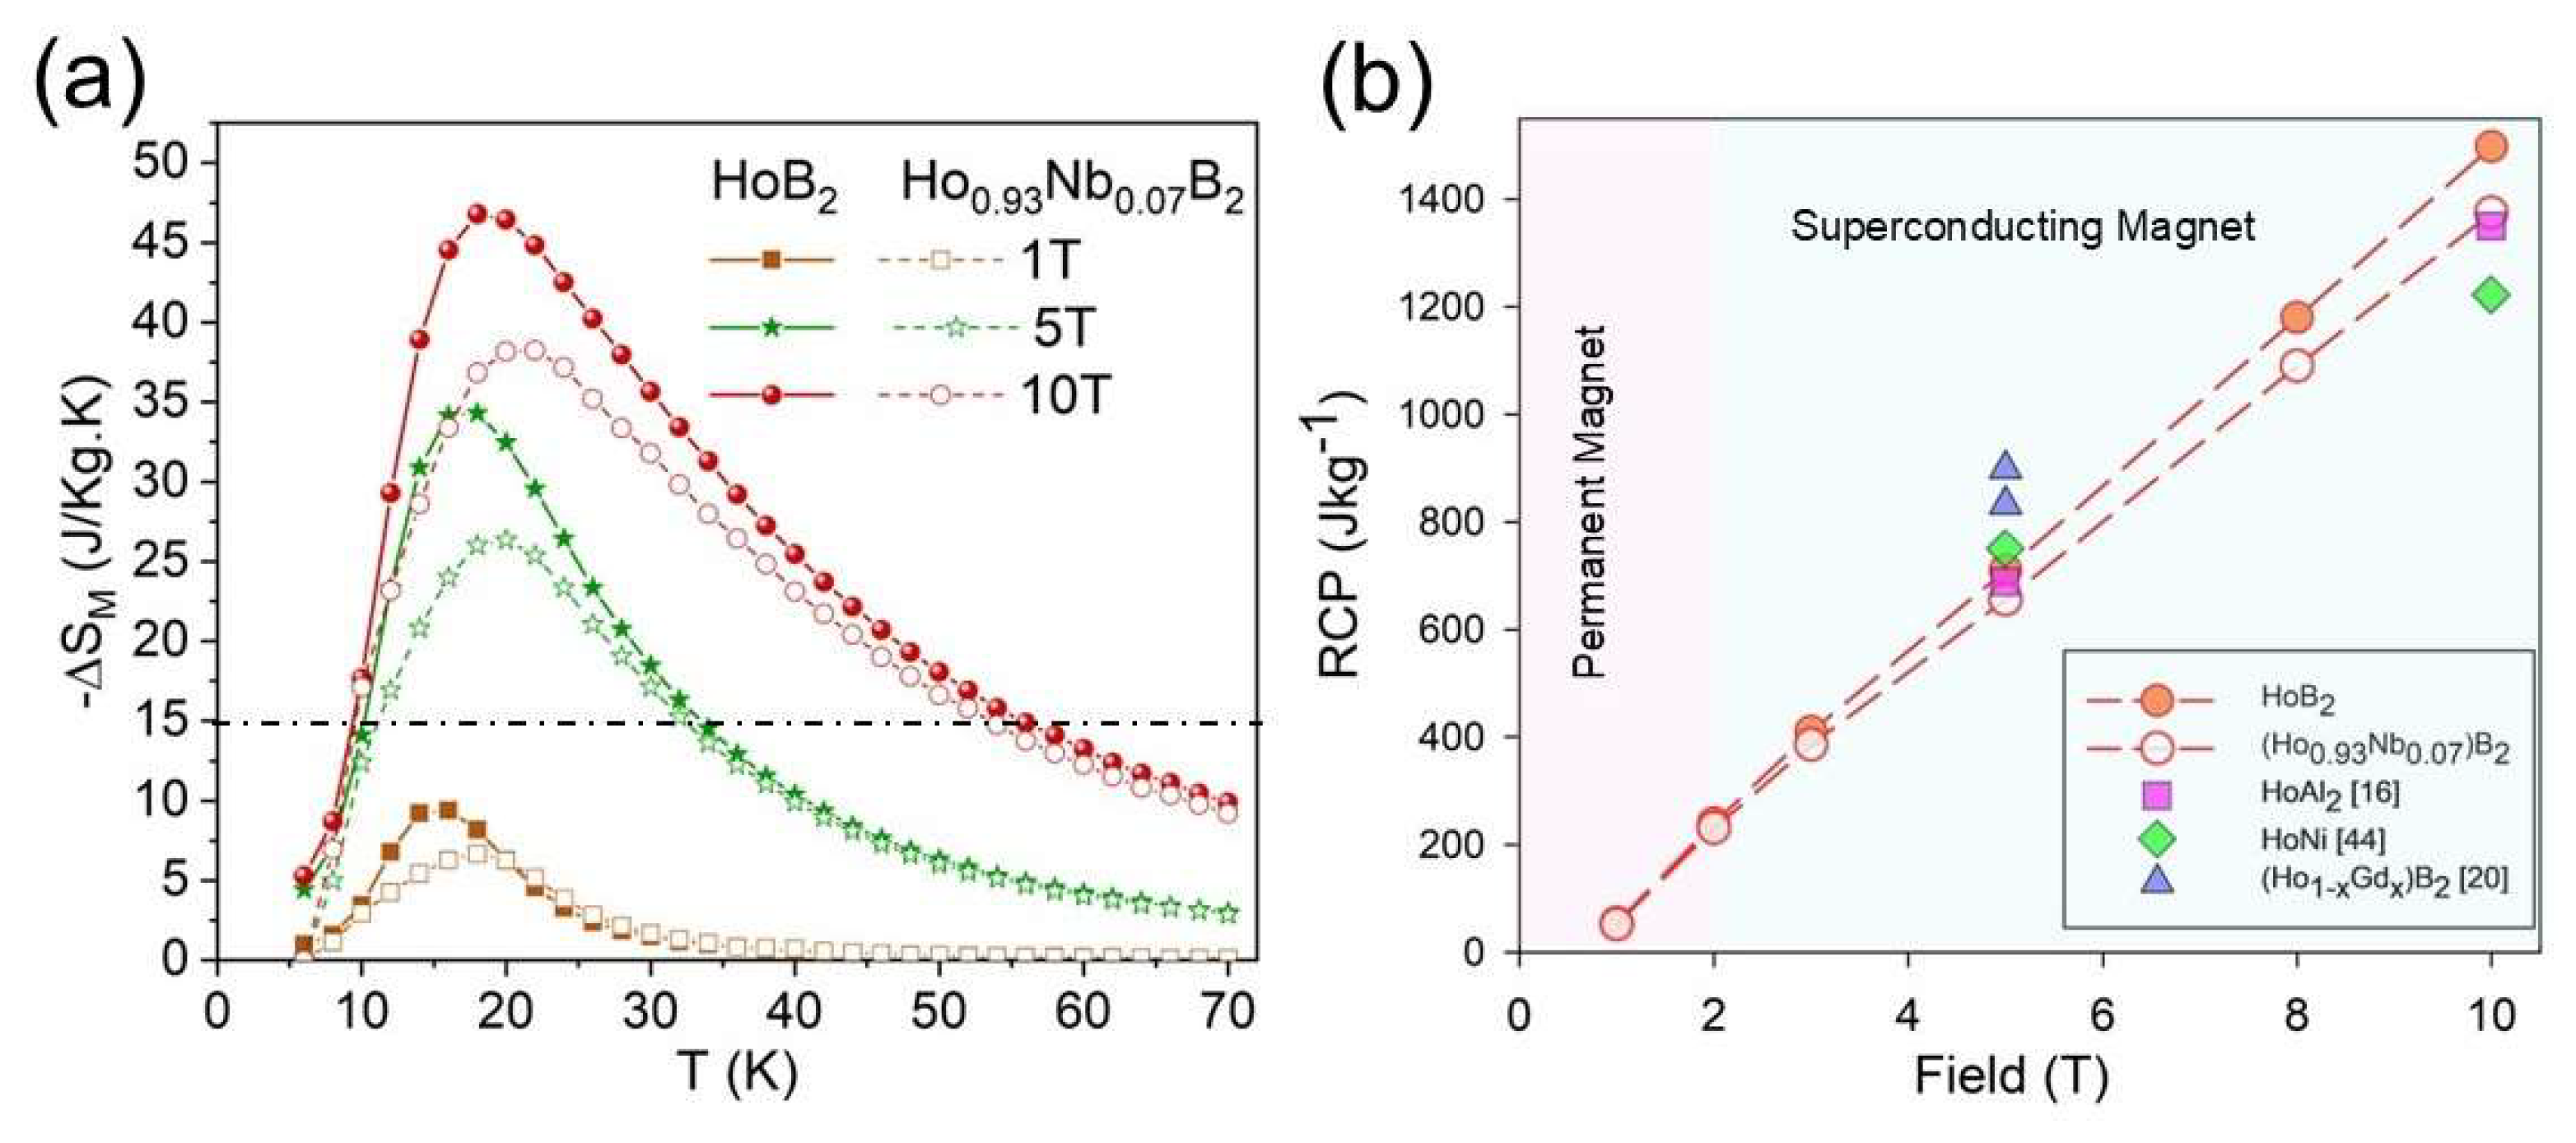

Table 1.
Synthesis conditions and products.
| Sample ID | Starting materials | Reactant ratio | Products |
|---|---|---|---|
| HoB2 | Ho:B | 1:2 | HoB2 (92.1%), Ho2O3 (4.0%), Ho (3.9%) |
| (Ho,Nb)B2 | Ho:Nb:B | 0.9:0.1:2 | HoB2 (72.1%), HoB4 (9.2%), Ho2O3 (4.6%), Ho (4.6%), HoB12 (3.8%), NbB2 (3.2%) |
Table 2.
Cell parameters for selected metal diborides.
| Sample | a (Å) | c (Å) | Reference |
|---|---|---|---|
| HoB2 | 3.28296(2) | 3.814454(4) | This work |
| Ho1-xNbxB2 | 3.268009(6) | 3.784152(1) | This work |
| HoB2 | 3.2835(4) | 3.8186(14) | PDF# 04-003-0232 |
| *NbB2 | 3.1049(3) | 3.2990(2) | PDF# 04-014-5978 |
* Estimated errors based on data from ref [23].
Table 3.
Magnetocaloric properties for selected SOPT Ho compounds.
| Alloy | TC (K) |
(Jkg-1K-1) | RCP (Jkg-1) |
Reference | ||
|---|---|---|---|---|---|---|
| at 5 T | at 10 T | At 5 T | At 10 T | |||
| HoB2 | 15 | 39.2 | - | 706* | - | [39] |
| HoB2 | 15.8 | 34.3 | 46.8 | 720 | 1,474 | This work# |
| Ho0.93Nb0.07B2 | 17.5 | 26.4 | 38.2 | 673 | 1,337 | This work# |
| Ho0.9Gd0.1B2 | 19 | 34.6 | - | 833 | - | [19] |
| Ho0.6Gd0.4B2 | 30 | 20.2 | - | 889 | - | [19] |
| HoAl2 | 29 | 21.5 | 30* | 688* | 1,350* | [16] |
| HoNi | 36 | 17.4 | ~26* | 750 | 1,222* | [45] |
| HoN | 18 | 28.2 | - | 846* | - | [46] |
*values estimated from δTFWHM data in reference; #without weight-dependent correction (see below).
Disclaimer/Publisher’s Note: The statements, opinions and data contained in all publications are solely those of the individual author(s) and contributor(s) and not of MDPI and/or the editor(s). MDPI and/or the editor(s) disclaim responsibility for any injury to people or property resulting from any ideas, methods, instructions or products referred to in the content. |
© 2025 by the authors. Licensee MDPI, Basel, Switzerland. This article is an open access article distributed under the terms and conditions of the Creative Commons Attribution (CC BY) license (https://creativecommons.org/licenses/by/4.0/).
Copyright: This open access article is published under a Creative Commons CC BY 4.0 license, which permit the free download, distribution, and reuse, provided that the author and preprint are cited in any reuse.


