
Submitted:
20 January 2025
Posted:
21 January 2025
You are already at the latest version
Abstract
A simple, sensitive, and repeatable high-performance liquid chromatographic method using fluorescence detection was developed and validated for quantifying of mixed tocotrienols (α-, γ-, δ-) in human plasma. After deproteinization with a mixture of acetonitrile: tetrahydrofuran (3:2, v/v), the supernatant was directly injected into the HPLC system. The mobile phase was comprised of methanol. Analyses were conducted at a flow rate of 1.5ml/min with the detector operating at excitation wavelength of 296nm and emission wavelength of 330nm. The quantification limit is 4.6ng/ml for δ-T3, 19.2ng/ml for γ-T3, and 12.7ng/ml for α-T3, respectively. The mean absolute recovery values ranged from 85.0% to 111.2%, while the intra-day and inter-day relative standard deviations were all below 15%. The calibration curve was linear for α-, γ-, and δ-T3, at a concentration range of 12.7-2538.6ng/ml, 19.2-3839.3ng/ml, and 4.6-923.1ng/ml respectively. Moreover, only a small sample plasma volume (250µl) is required for the analysis, Overall, this method is validated with acceptable precision and accuracy, and can be used to analyse tocotrienol samples obtained from preclinical and clinical studies in a speedy and reproducible manner.
Keywords:
Fluorescent detection
; HPLC
; Plasma
; Blood
; Tocotrienol
; Vitamin E
1. Introduction
Vitamin E, an essential organic oil-soluble micronutrient crucial for maintaining normal physiological functions and offering numerous benefits to the human body [1,2], naturally occurs in two main forms: tocotrienols (T3s) and tocopherols (Tocs). Each of these forms has four isoforms (α-, β-, γ-, δ-) [2,3], as illustrated in Figure 1. While early studies primarily focused on the benefits of Tocs, the current trend has shifted towards T3s, which have been found to possess superior therapeutic potential. Consequently, T3s are gaining more attention in the context of noncommunicable diseases, with recent research highlighting their significant antioxidant, antiapoptotic, and antinecrotic properties, with α-T3 leading the way [3,4].
Figure 1.
Molecular Structure of Vitamin E forms (Tocopherol and Tocotrienol). Created with ChemDraw Professional 15.0.
Figure 1.
Molecular Structure of Vitamin E forms (Tocopherol and Tocotrienol). Created with ChemDraw Professional 15.0.
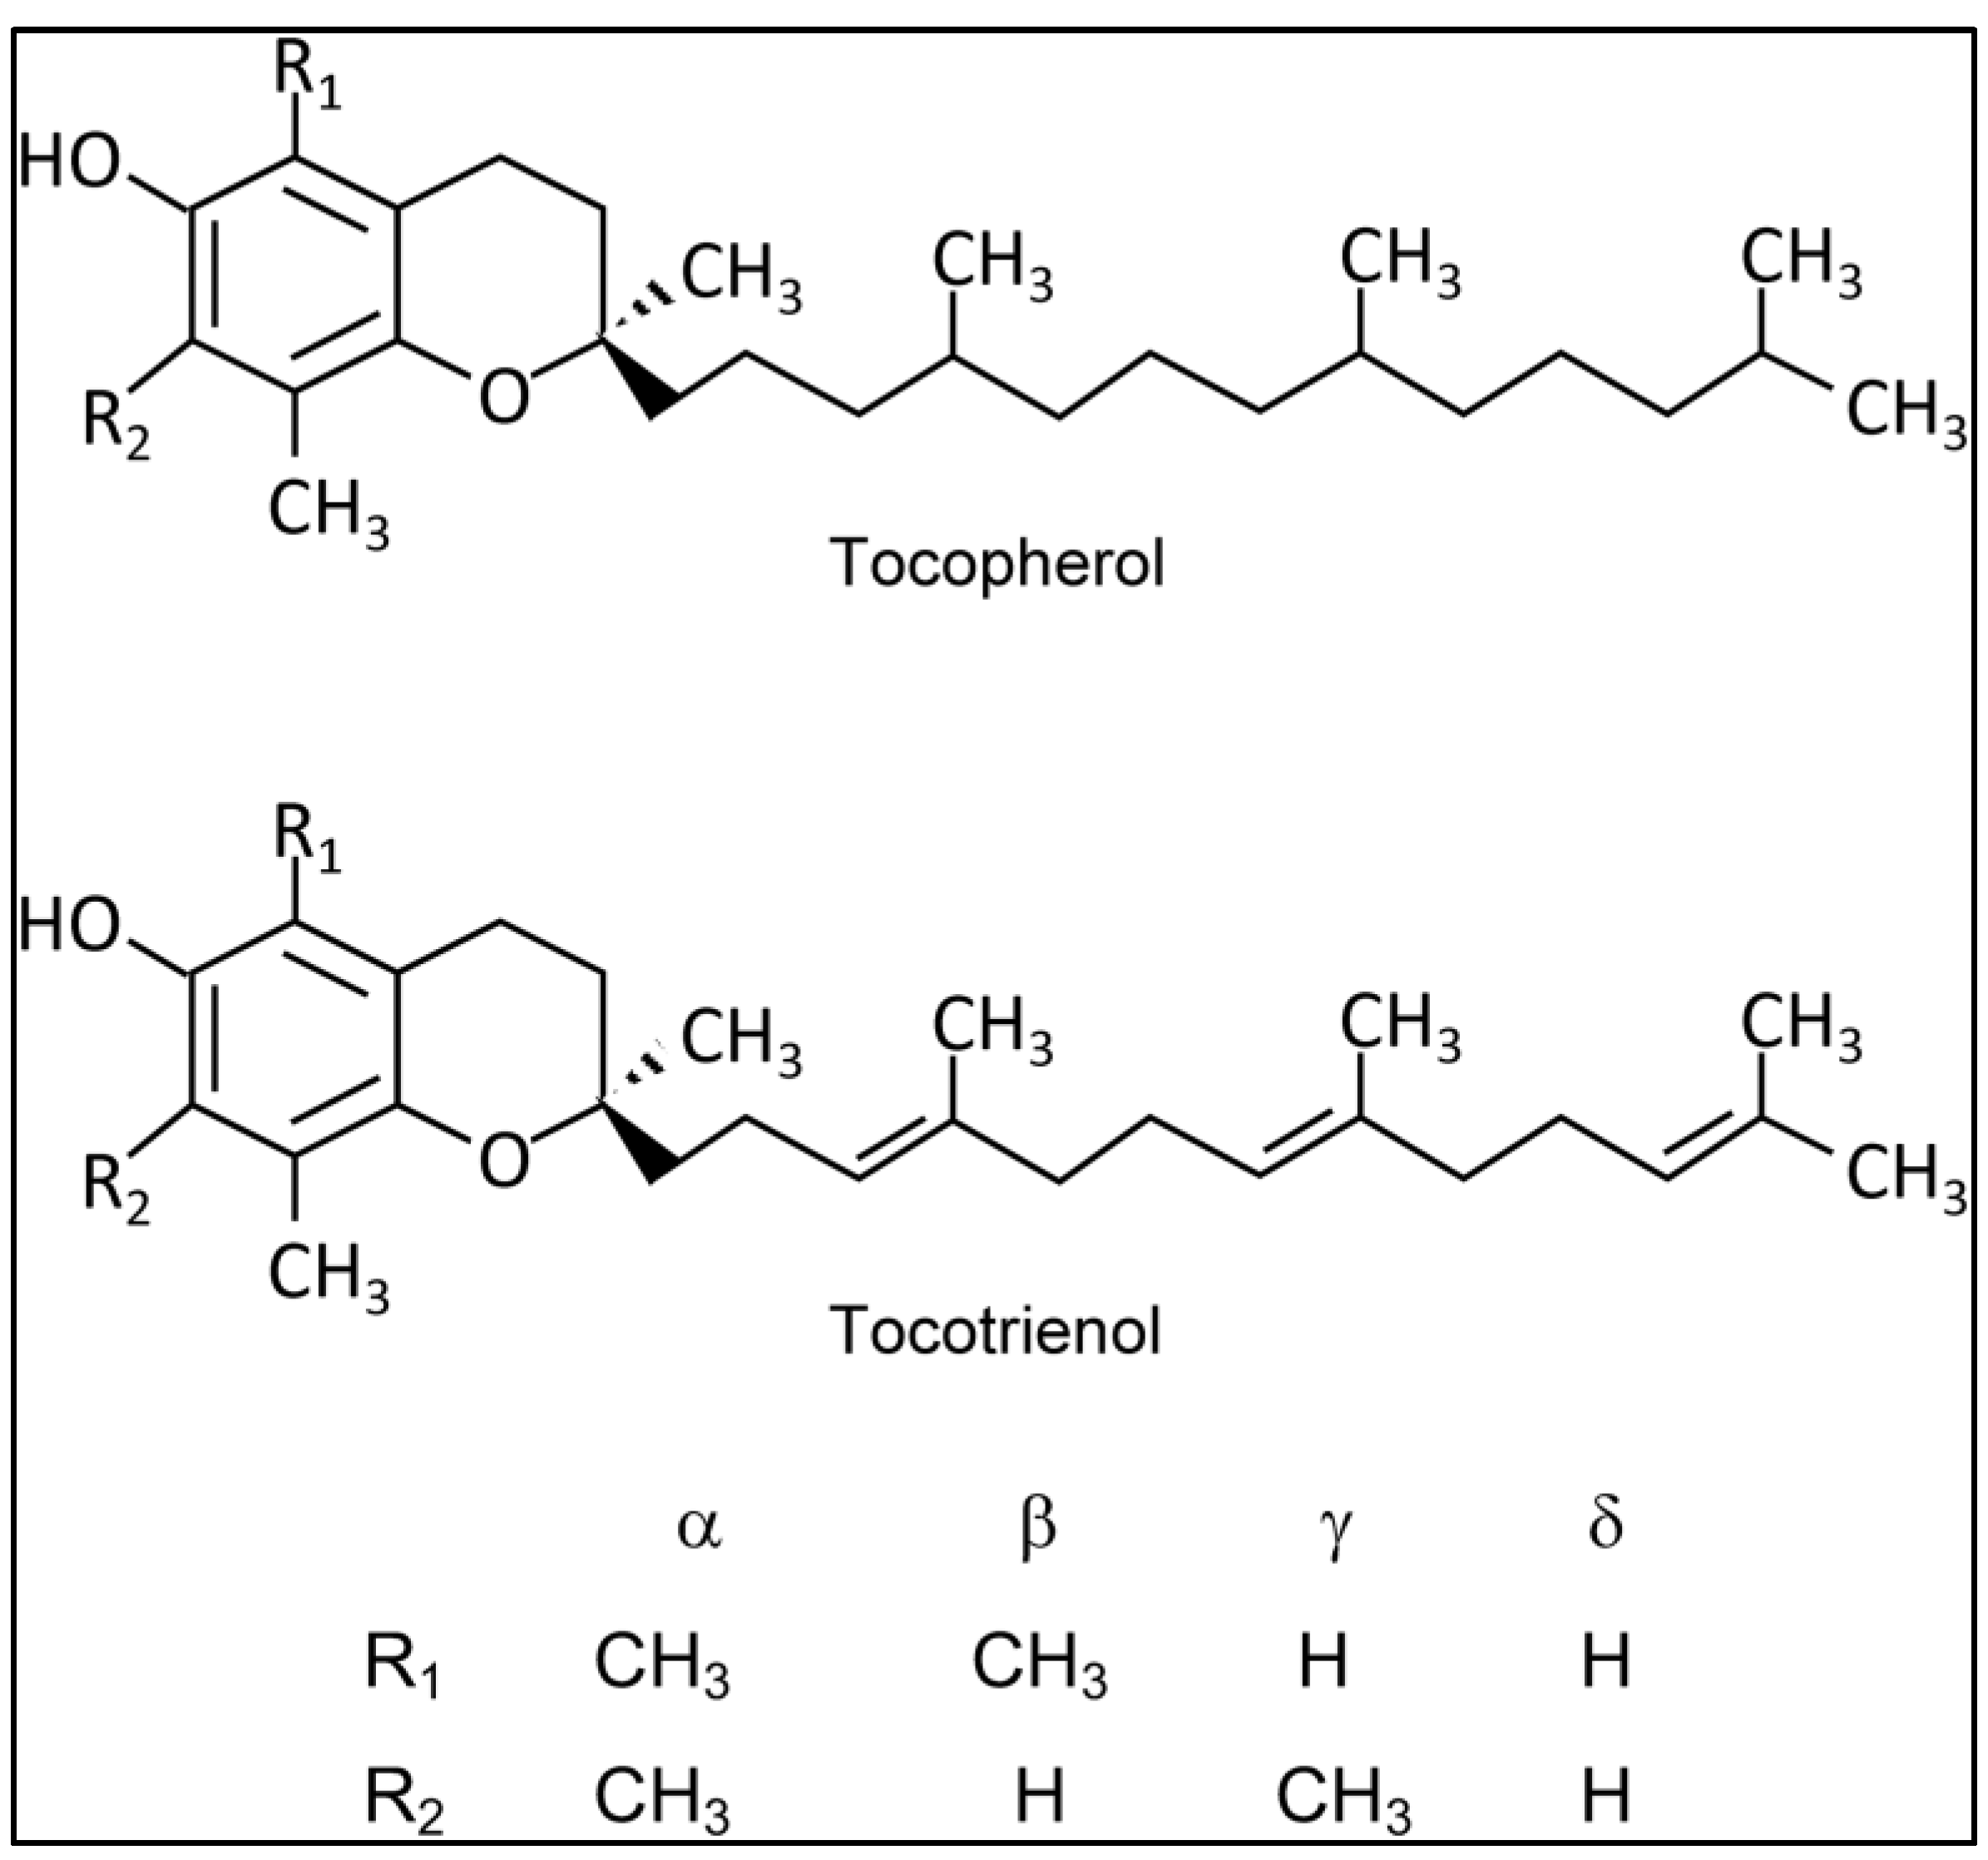
Palm oil stands out as a major source of tocotrienols, comprising 30% Tocs and 70% T3s, with α, γ, and δ as the principal constituents. The recommended dosages for potential health benefits range from 100–200 mg/day for neuro and renal protection, anti-inflammatory, and anti-aging related diseases. For cardio protection, the suggested dosage varies from 100–960 mg/day [4].
The literature describes various high-performance liquid chromatographic methods for determining tocotrienols in biological samples. However, many of these methods focus on only one T3 isoform [5,6]. Methods capable of detecting multiple T3 isoforms often lean towards mass spectrometry (MS), occasionally coupled with atmospheric-pressure chemical ionization (APCI), but the associated technology is costly, impeding reproducibility [7,8,9]. Lee [10] introduced a method for quantifying T3s using electrochemical detection, but it involves a time-consuming preparation procedure, requiring overnight incubation and drying of serum samples before injection into HPLC.
Fluorescence detection in HPLC offers several advantages over other detection methods, particularly in terms of sensitivity, selectivity, and specificity [11], with significantly lower detection limits, allowing for detection of low abundance compound in complex biological samples [12,13]. Additionally, the ability to acquire complete fluorescence spectra provides a significant advantage for qualitative examination compared to single-wavelength measurements [11,14]. Only two validated methods for T3 analysis in blood plasma, utilizing fluorescence detection, have been previously described [12,15]. Yap ‘s [15] method has lower sensitivity despite an appropriate retention period of 12 minutes and a straightforward sample preparation procedure. Che’s [12] approach involves normal-phase columns, an extended retention time of 30 minutes, and a more complex sample preparation method, including two rounds of vortexing, addition of NaCl, ethanol, and n-hexane, followed by shaking for 1 hour and drying with nitrogen gas before reconstitution with mobile phase for analysis, requiring multiple chemicals and equipment.
In this paper, we present a rapid, specific, and sensitive HPLC method with a simple sample preparation step for determining mixed tocotrienols in human plasma using fluorescent detection.
2. Materials and Methods
Materials
All solvents (Acetonitrile, Methanol, Tetrahydrofuran) used were of HPLC grade and were purchased from DUKSAN pure Chemicals (Korea). Tocotrienol rich fraction (TRF50) secondary standard which contains of α-, γ-, and δ-T3 at 12.1%, 18.3%, and 4.4%, respectively, was obtained from SOP Green Energy Sdn. Bhd. (Malaysia) and blank human blood plasma was obtained from blood bank Hospital Pulau Pinang (Malaysia).
Instrumentation
The Alliance HPLC system from Waters Corporation (United States) comprised of a e2695 separations module and a 2475 Fluorescent detector. A refillable guard column filled with Partisil-10 ODS-3 (Whatman, United States) was installed on a C18 column (250x4.6mm, 4µm, Hichrom, Singapore). The detector was operated on. The mobile phase consisted of 100% methanol. Analysis was run on a flow rate of 1.5ml/min at 28±2℃ and the samples quantified using peak area.
Sample Preparation
250µl of human plasma sample was pipetted into a microcentrifuge tube and 500µl of acetonitrile: tetrahydrofuran (3:2, v/v) mixture was added to deproteinize the sample. The sample was then vortexed for 2min and centrifuged at 12,800xg for 15min. The supernatant was then transferred into an HPLC vial and 50µl of sample was injected for HPLC analysis.
Assay Validation
Stock solution was prepared in methanol and standard calibration curves were created by adding known amounts of α-, γ-, and δ-T3 to filtered blood plasma in the ranges of 12.7-2538.6ng/ml, 19.2-3839.3ng/ml, and 4.6-923.1ng/ml, respectively. Likewise, plasma standards were used to assess the method’s inter-day and intra-day precision (n=6) which was established using the coefficient of variation (C.V.). Absolute recovery (n=3) was calculated through comparison of peak areas with T3s solutions at equivalent concentration following the same treatment with the deproteinizing mixture as used for plasma samples. Endogenous T3s from human blank plasma have been subtracted from all the data obtained for data calculation purposes.
Stability
The lowest and highest concentration of the calibration curve were used to assess the tocotrienols stability (n=3) in both human plasma and stock solution. The acceptance criteria are 85% to 115% for plasma samples and 98% to 102% for drug solution samples. The data were reported as mean percentages.
Plasma samples underwent a freeze-thaw stability assessment, involving two cycles of freezing and thawing, followed by examination. Short-term stability was evaluated by thawing at room temperature for 8 hours before processing and analysis. Additionally, stability samples were stored at -20°C for two months to confirm the long-term stability of T3s in blood plasma. For the post-operative stability test, samples were placed in the autosampler for 8 hours before re-injection and comparison with a freshly prepared counterpart. The stability of the T3 stock solution was also assessed through short- and long-term stability tests, mirroring the procedures described above for T3s in plasma.
3. Results & Discussion
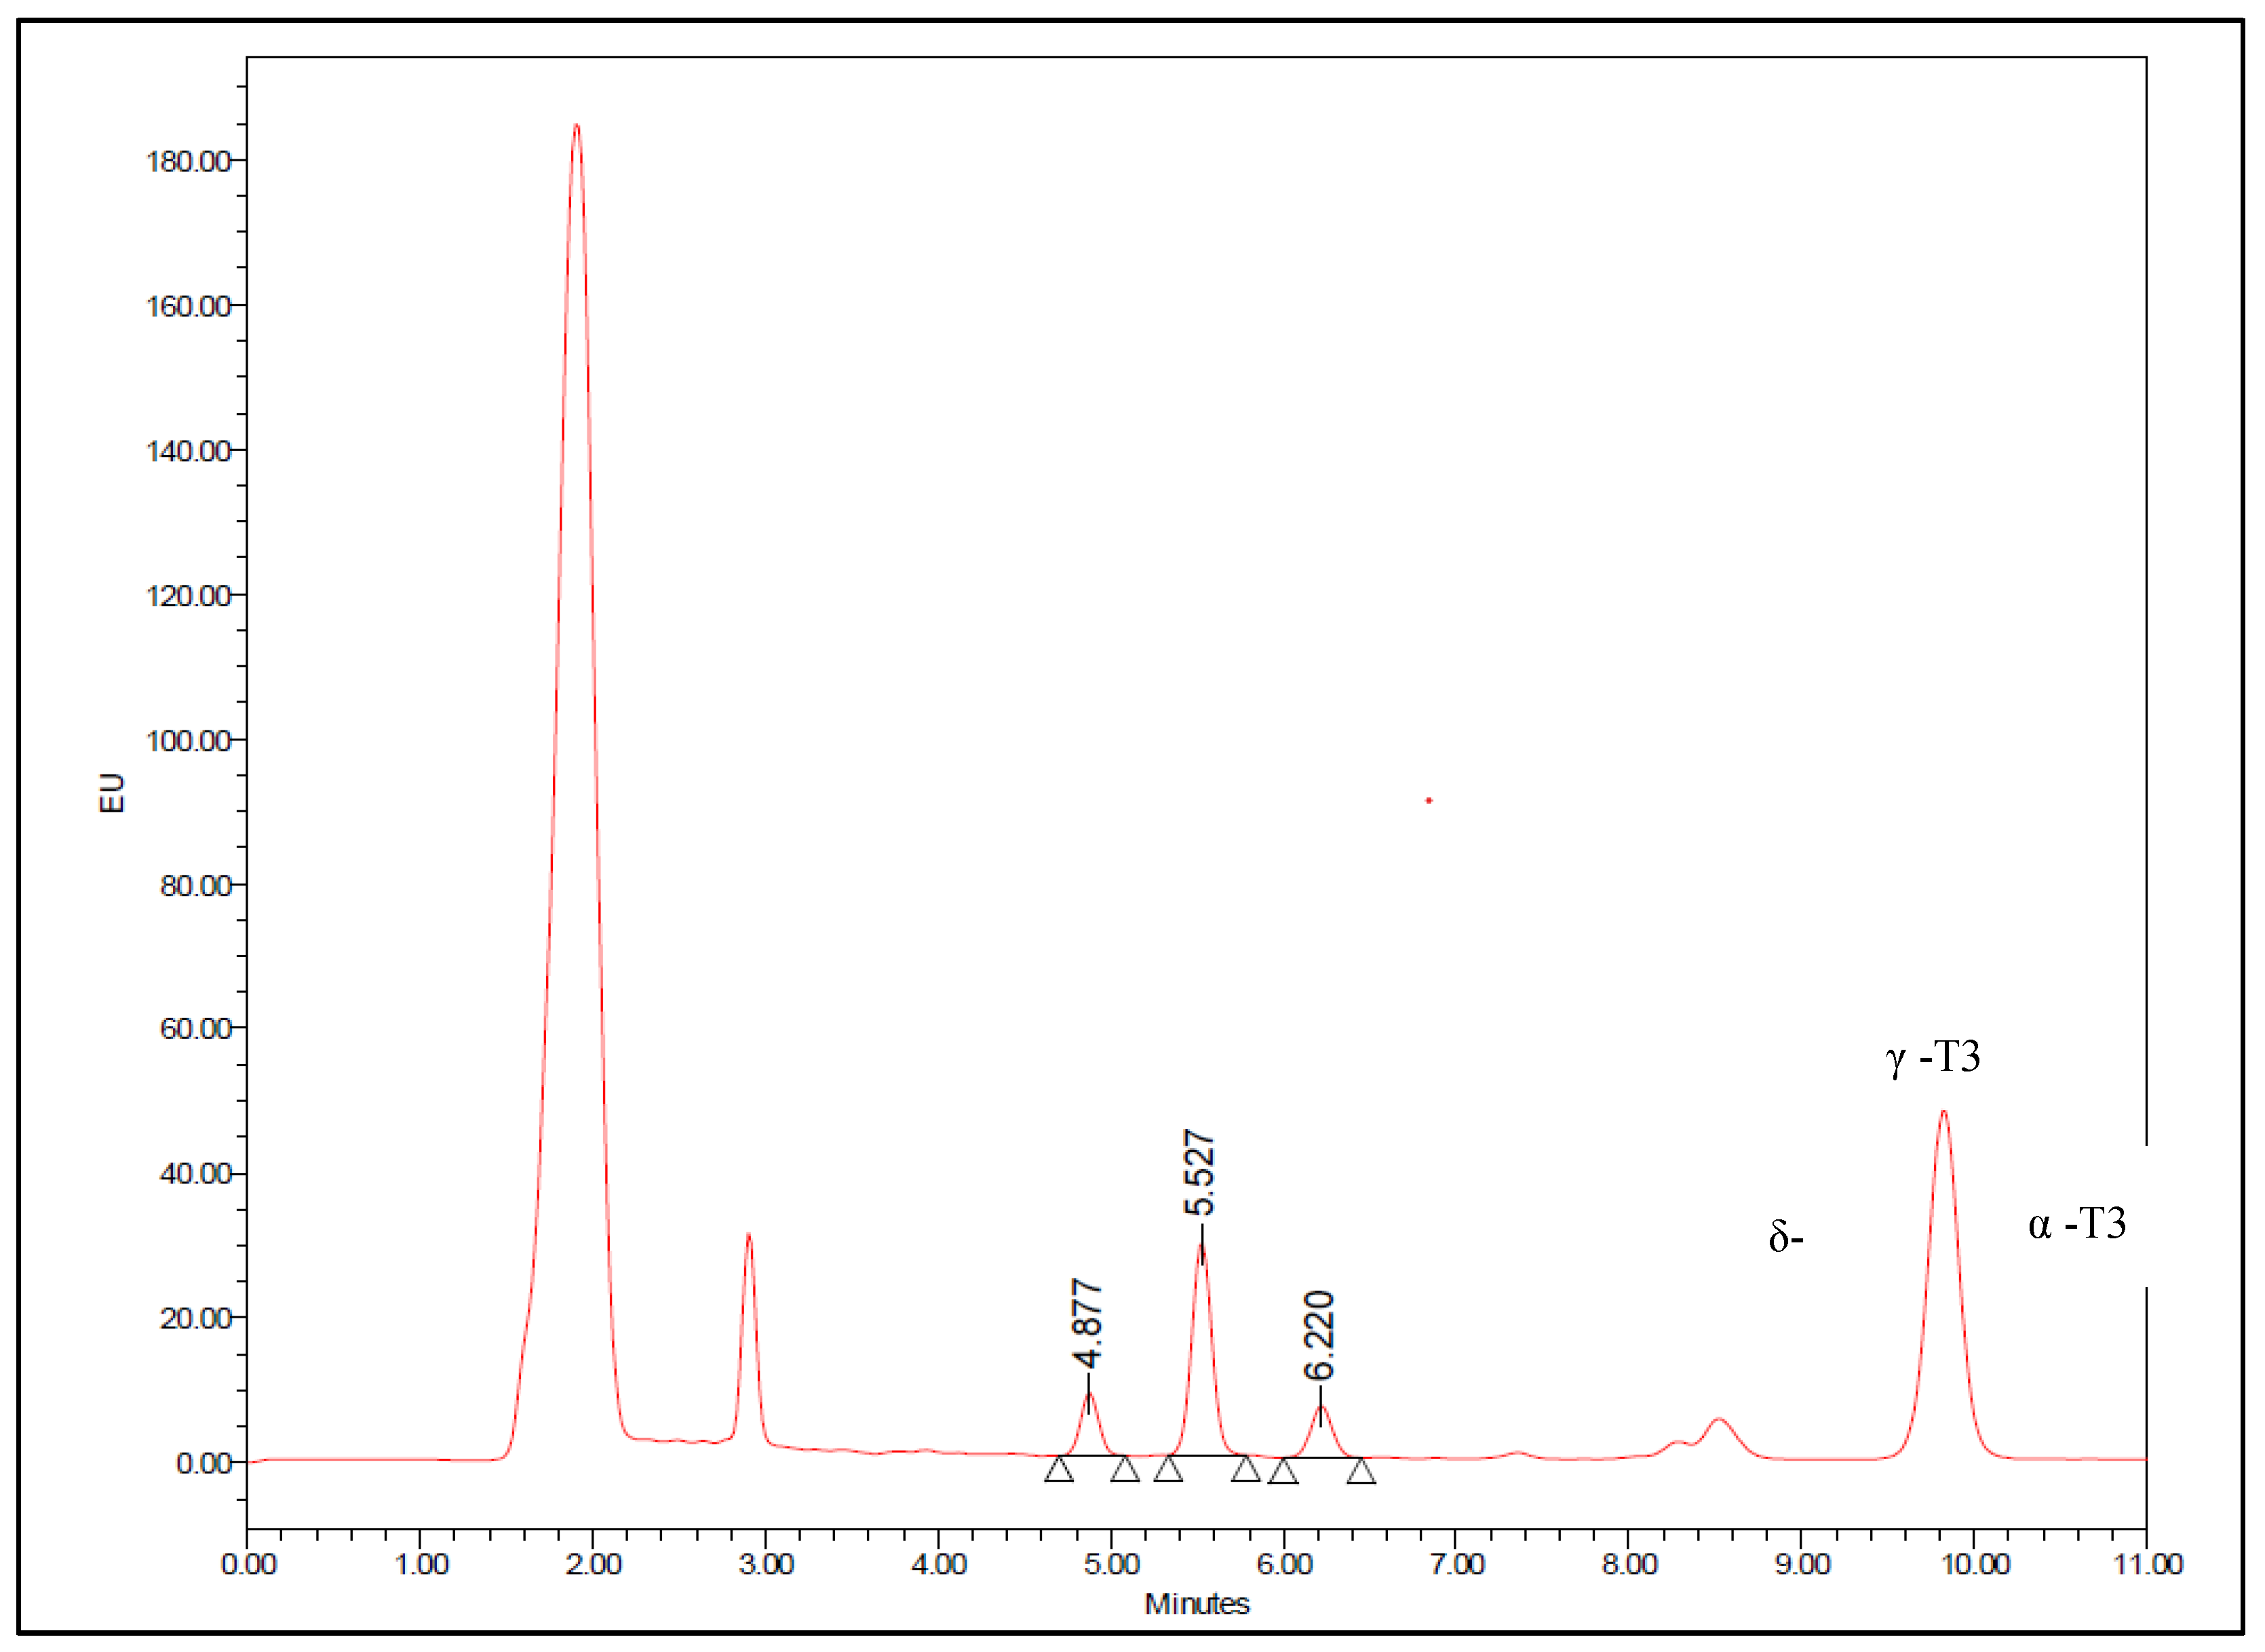
Figure 2 and Figure 3 displays chromatograms obtained with blank plasma and plasma spiked with mixed tocotrienols, respectively. Upon referencing Figure 2, it is evident that endogenous T3 was present in the pooled blank plasma, with concentrations approximately at 2.36 ng/ml for δ-T3, 21.60 ng/ml for γ-T3, and 21.71 ng/ml for α-T3. These values were estimated through extrapolation of the standard curve using the standard addition method [16]. The peaks exhibit retention times of approximately 4.9 minutes, 5.5 minutes, and 6.2 minutes for δ-T3, γ-T3, and α-T3, respectively, and are well-resolved from other interfering peaks. Therefore, this method allows for the detection of most T3s within a relatively short run time, making it suitable for the analysis of numerous samples.
Figure 2.
Chromatogram of T3 endogenous level in blank human plasma.
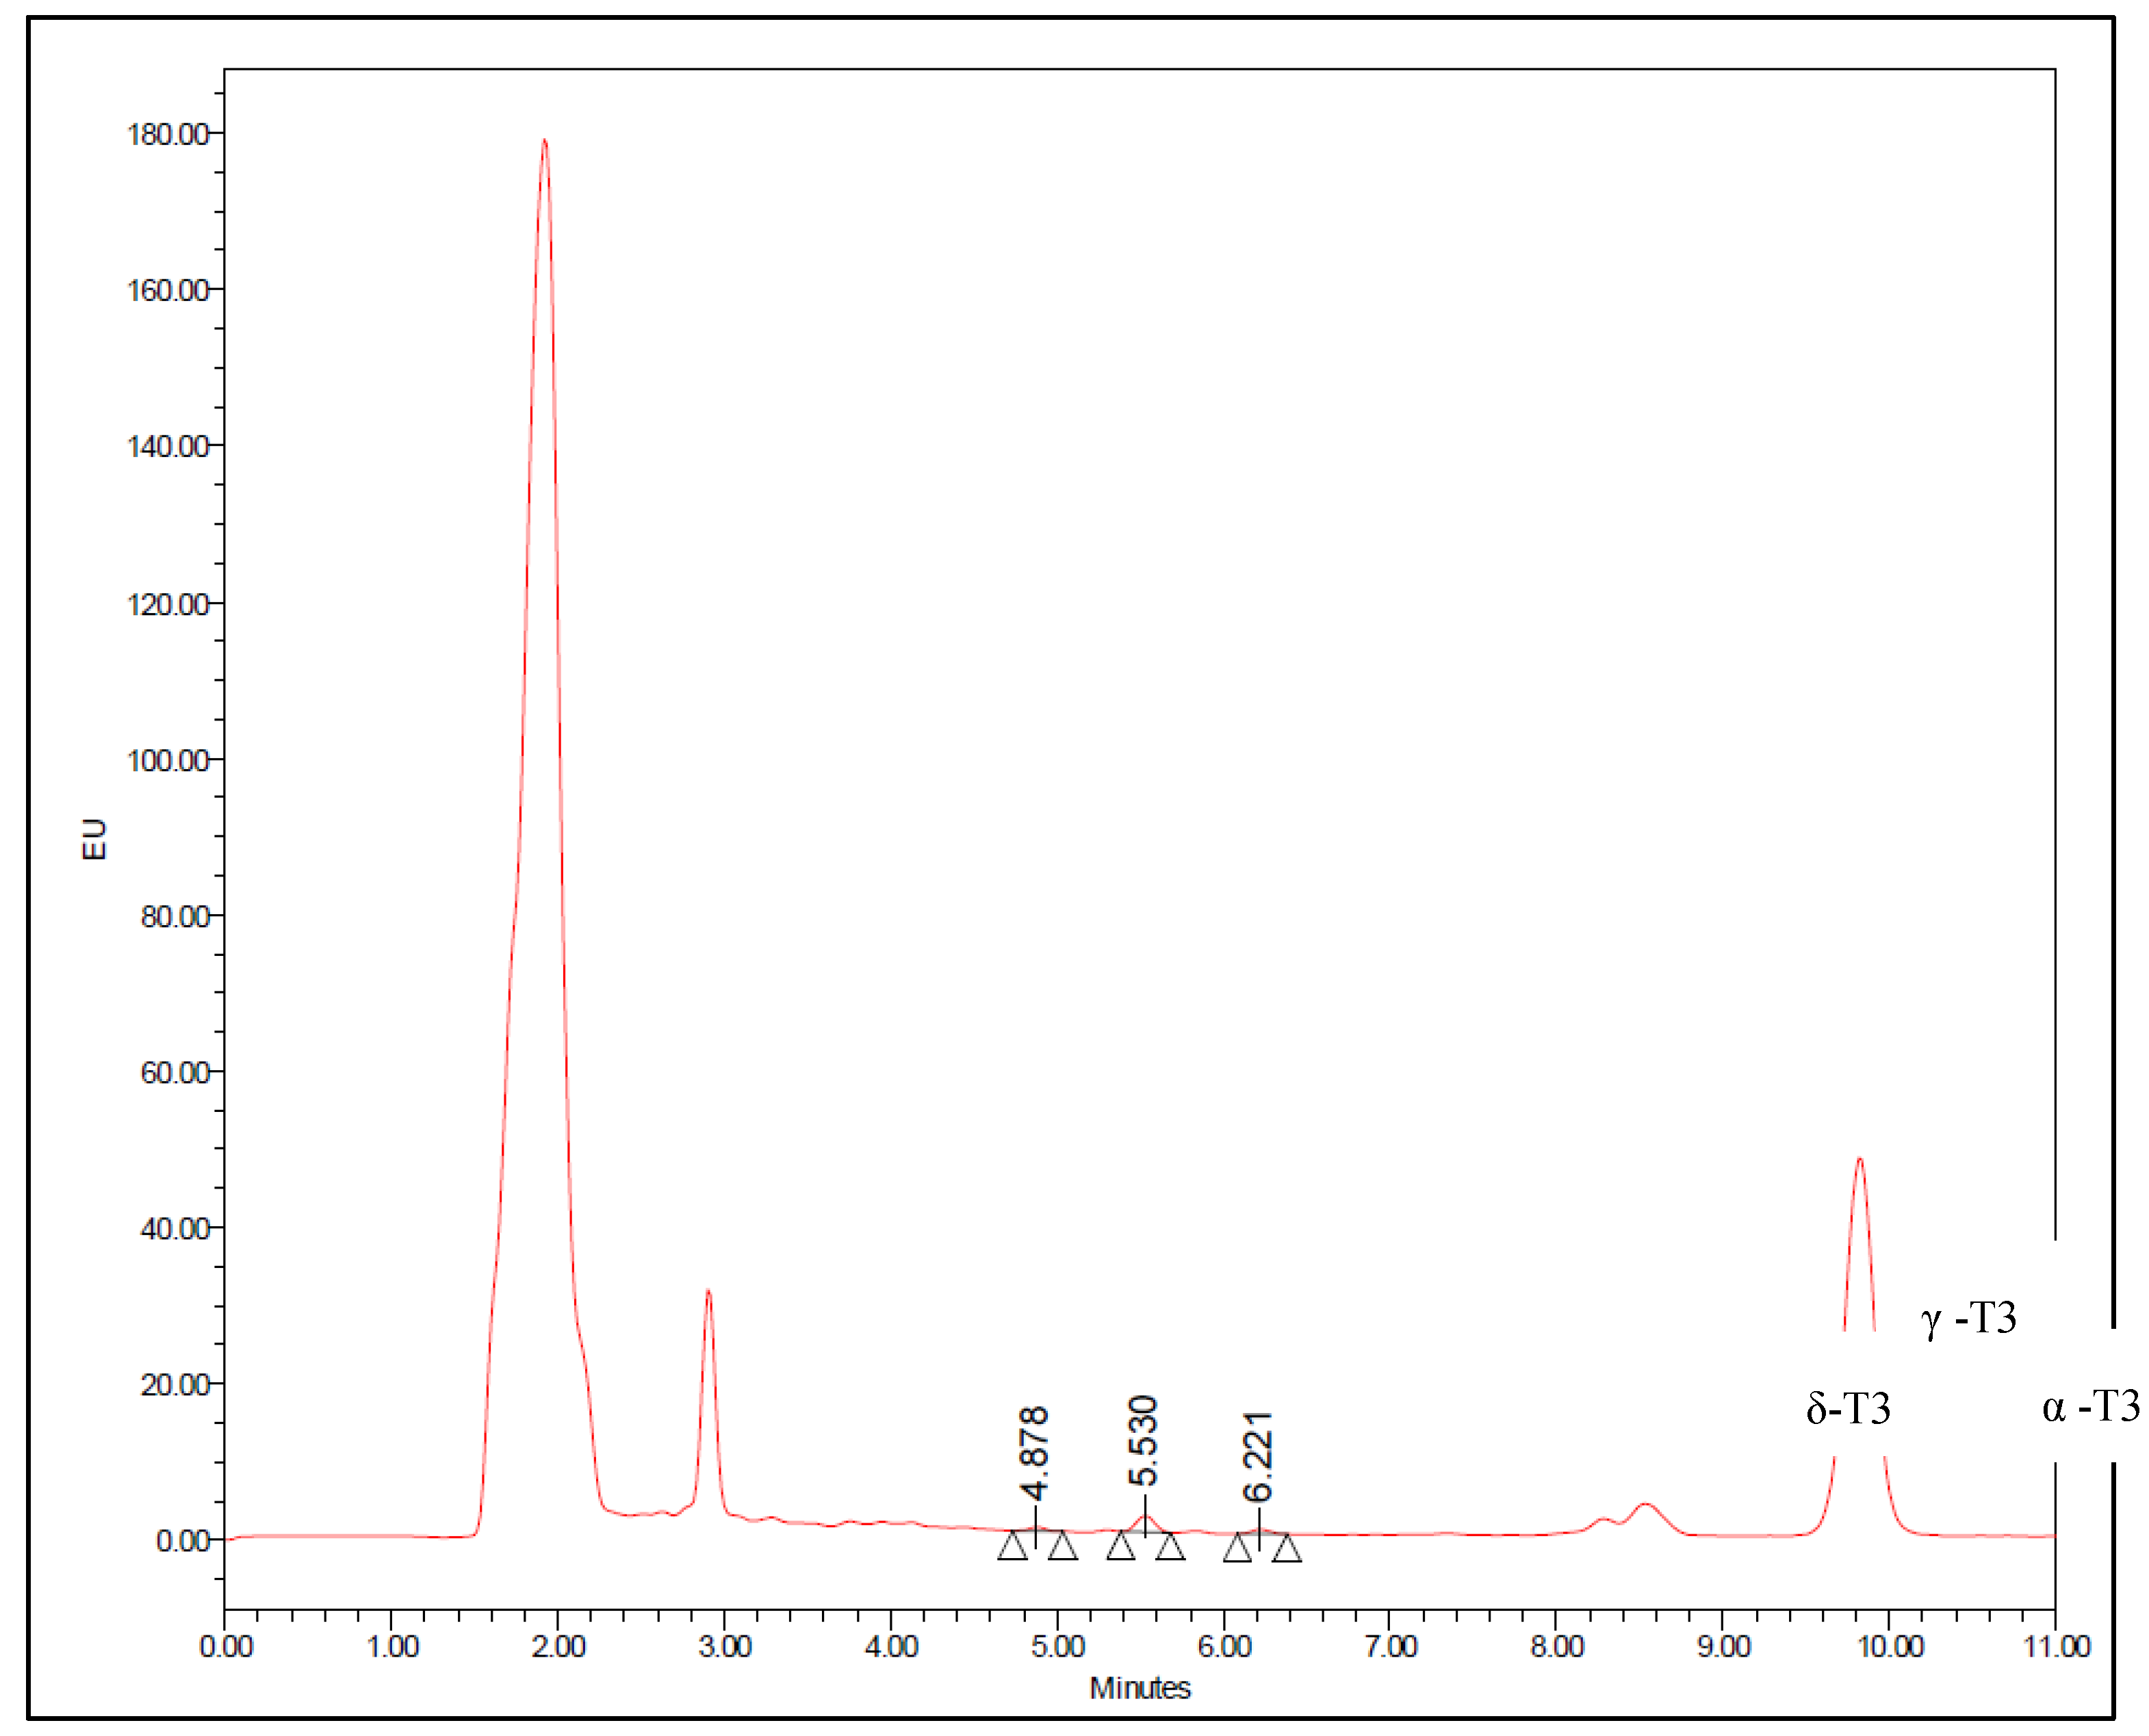
Figure 3.
Chromatogram of T3 spiked human plasma with δ-T3 (230.8ng/ml), γ-T3 (959.8ng/ml), and α-T3 (634.6ng/ml).
Figure 3.
Chromatogram of T3 spiked human plasma with δ-T3 (230.8ng/ml), γ-T3 (959.8ng/ml), and α-T3 (634.6ng/ml).
Many reported methods employ normal-phase columns for separation, a choice influenced by the lipophilic nature of T3s. However, ODS columns, being more widely used, make reversed-phase conditions preferable for LC separation [5]. In contrast to normal-phase, the reversed-phase mode offers shorter analysis times, improved retention time repeatability, and greater robustness, stability, and compatibility with biological samples [12,17,18]. Reversed-phase has also been noted to achieve higher sensitivity for tocochromanols compared to normal-phase [17].
This method was developed based in the physiochemical properties of T3s, such as its separation, dissociation, solubility, and pH [19]. Separation was achieved with a flow rate of 1.5 ml/min and a mobile phase of 100% methanol. Methanol was optimized as the mobile phase due to the highly lipophilic nature of T3, making them highly soluble in methanol. The decision against adding water to the mobile phase was based on the observation that a higher water content increases separation time and causes tailing [14,17]. Additionally, there were no reported overlapping or interfering peaks due to the column's particle size of 4µ, resulting in superior separation compared to its 5µ counterpart, rendering the addition of water unnecessary.
This method does not account for the detection of β-T3s. This omission is due to the standard used for method validation lacking quantifiable amounts of β-T3s, and current research primarily focusing on the other three isoforms.
The standard calibration curve demonstrated linearity with a correlation coefficient value of >0.999 across the concentration range used for all T3 isoforms tested. A linear calibration curve (Figure 4) was established for δ-T3 (4.6-923.1 ng/ml), γ-T3 (19.2-3839.3 ng/ml), and α-T3 (12.7-2538.6 ng/ml).
Figure 4.
Calibration curve of T3s in Human Spiked Plasma (n=3).
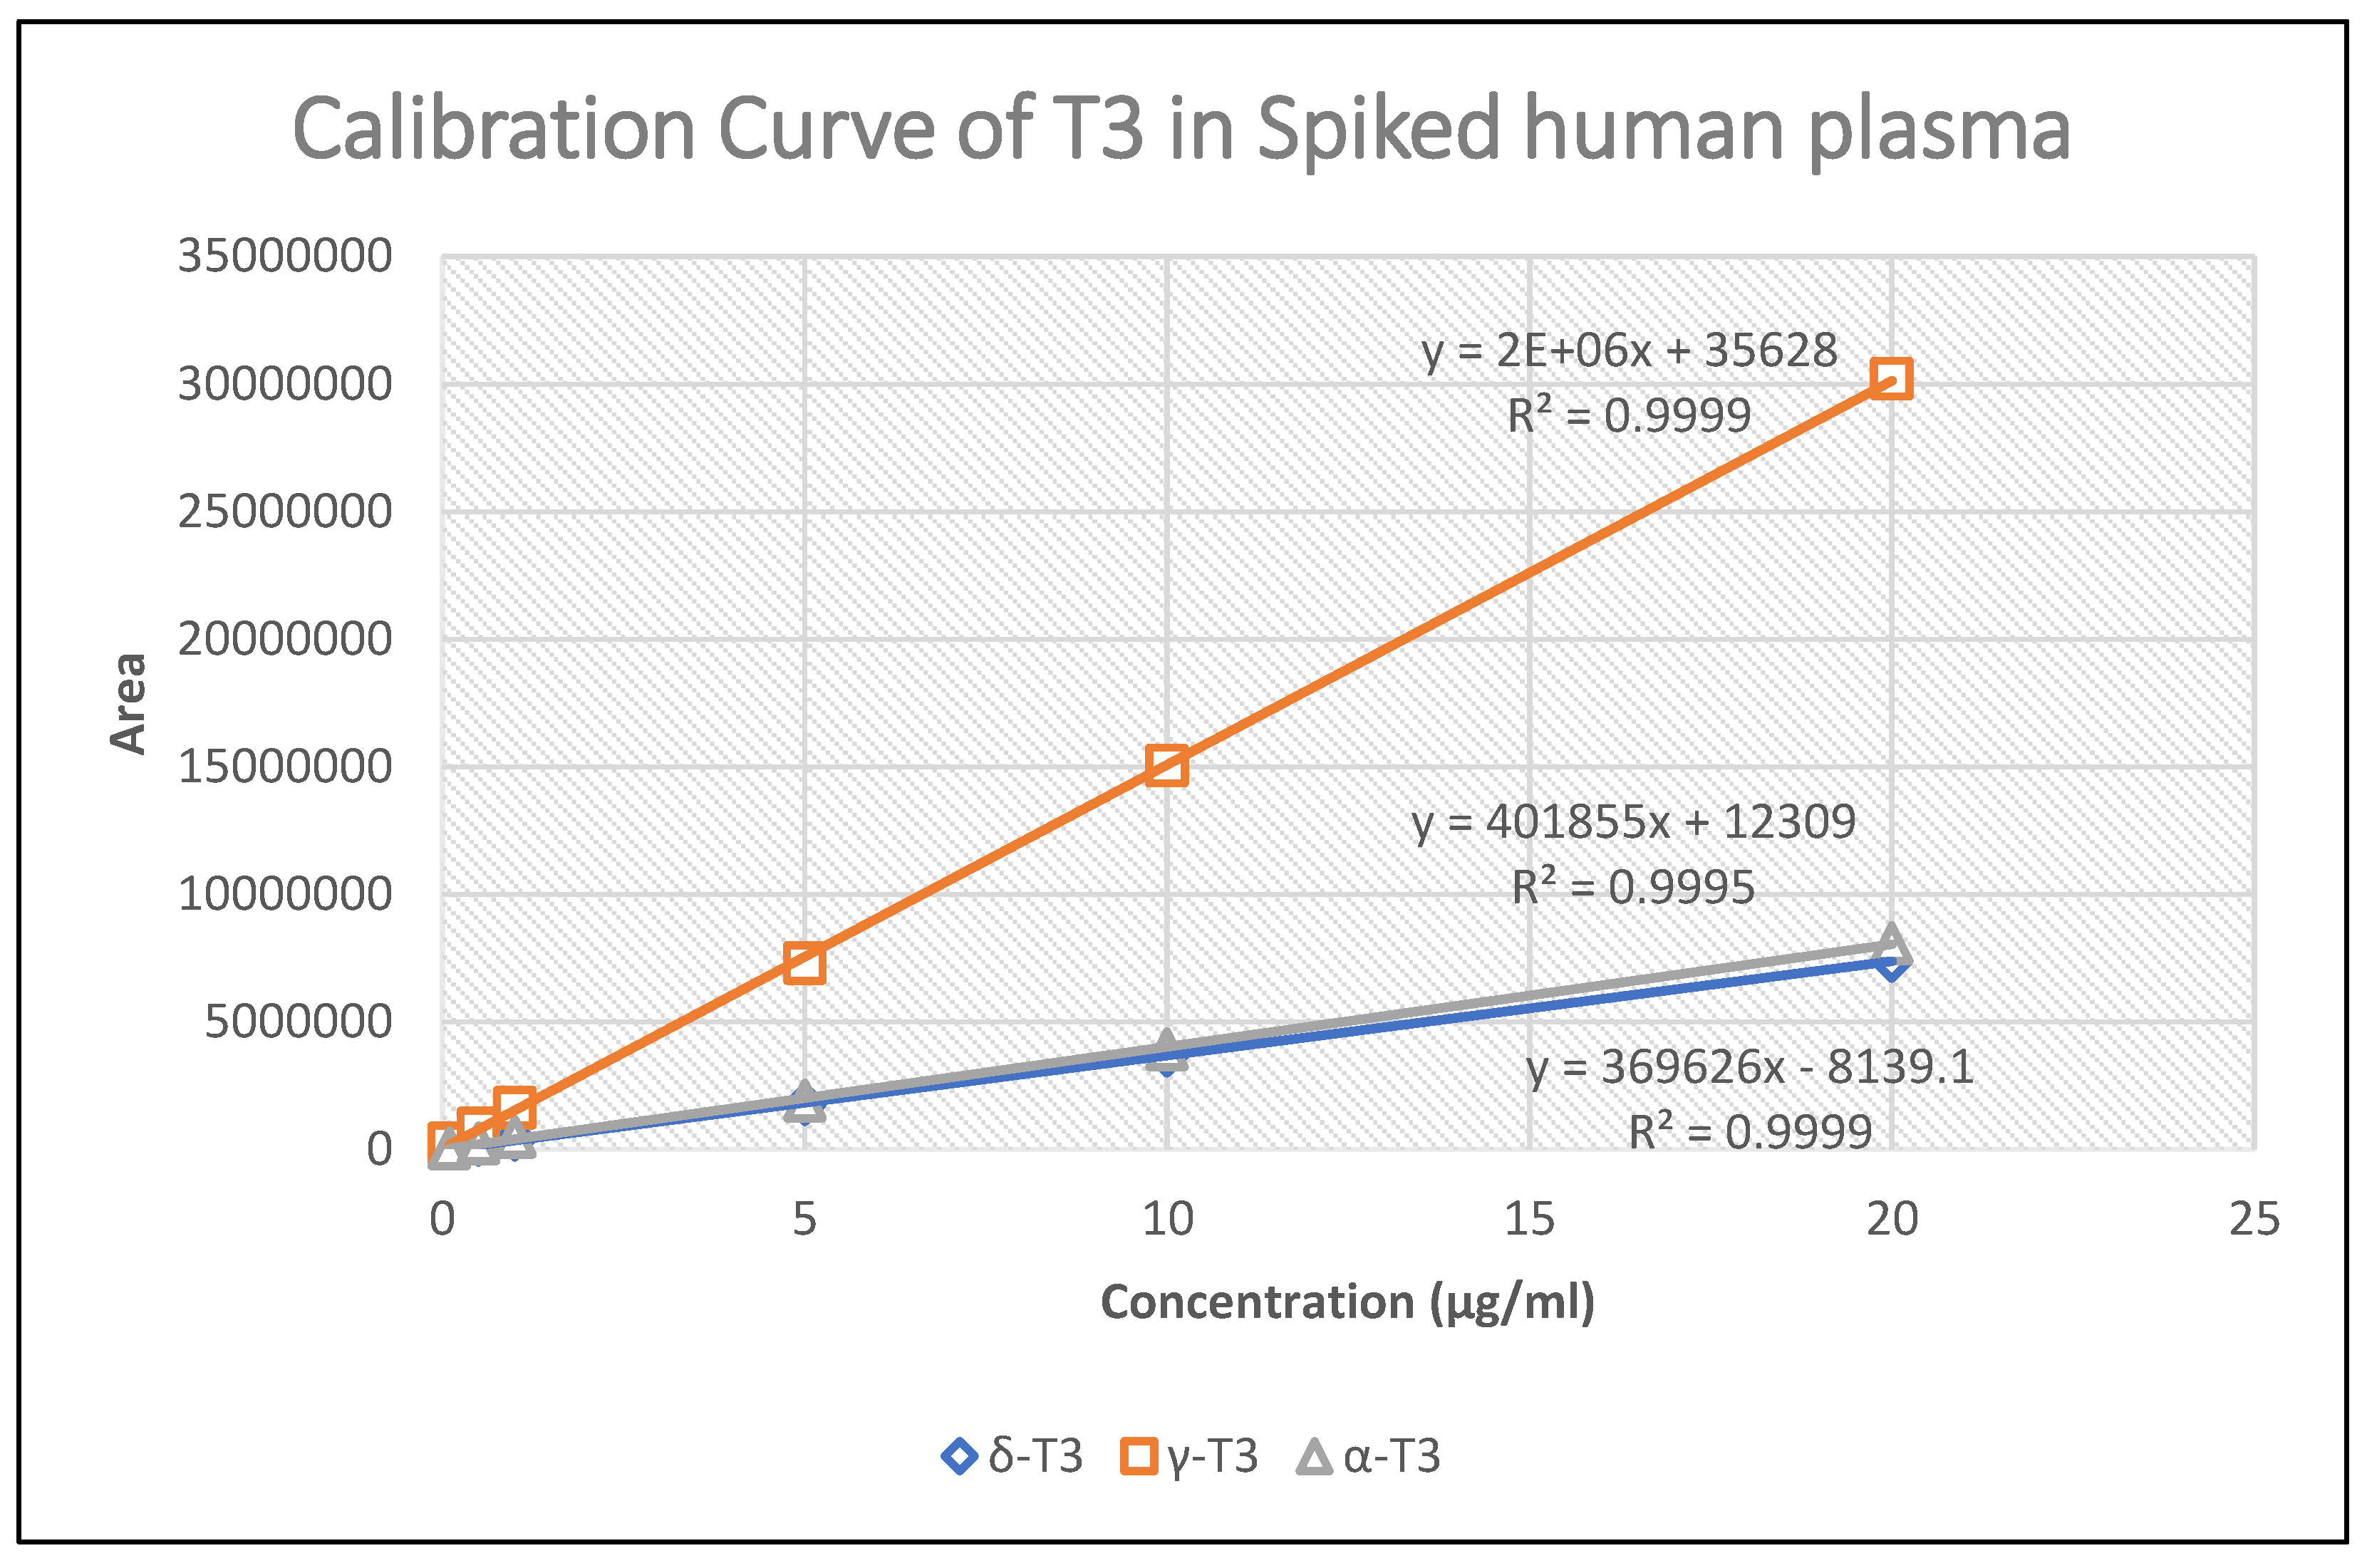
Table 1, Table 2, and Table 3 presents the absolute recovery, within-day and between-day accuracy, and precision values. The coefficient of variation (C.V.) values for both intra-day and inter-day assessments were all below 15%, while the accuracy, indicated by the percentage error values, was also less than 15%. These results signify that the assay procedure demonstrates satisfactory accuracy and precision. Furthermore, the method has a limit of quantification of 4.6 ng/ml for δ-T3, 19.2 ng/ml for γ-T3, and 12.7 ng/ml for α-T3, comparable to values reported in the literature [12,15].
Our study employed a method involving the direct injection of plasma samples after a simple one-step deproteinization procedure. The recovery of T3 at various concentration values is detailed in Table 1, Table 2, and Table 3, where all concentrations exhibit a recovery value greater than 85%. The stability of the column was unaffected by direct deproteinization with the current procedure. The resolution and retention time of the drug peak remained consistent even after analyzing over 300 samples.

Table 1.
Absolute recovery precision and accuracy, intra-day and inter-day precision (n=6) for δ-T3.
Table 1.
Absolute recovery precision and accuracy, intra-day and inter-day precision (n=6) for δ-T3.
| Concentration (ng/ml) | Recovery | Intra-day (Within) | Inter-day (Between) | |
|---|---|---|---|---|
| C.V. | Accuracy (%) | Precision (C.V.) | Precision (C.V.) | |
| 4.6 | 4.3 | 102.8 | 4.7 | 12.5 |
| 23.1 | 1.7 | 108.8 | 1.6 | 12.8 |
| 46.2 | 2.7 | 97.7 | 2.9 | 5.9 |
| 230.8 | 4.3 | 99.6 | 5.4 | 5.8 |
| 461.6 | 2.9 | 109.1 | 6.1 | 8.3 |
| 923.1 | 0.8 | 108.2 | 3.0 | 6.4 |
Table 2.
Absolute recovery precision and accuracy, intra-day and inter-day precision (n=6) for γ-T3.
Table 2.
Absolute recovery precision and accuracy, intra-day and inter-day precision (n=6) for γ-T3.
| Concentration (ng/ml) | Recovery | Intra-day (Within) | Inter-day (Between) | |
|---|---|---|---|---|
| C.V. | Accuracy (%) | Precision (C.V.) | Precision (C.V.) | |
| 19.2 | 1.3 | 94.7 | 7.7 | 12.7 |
| 96.0 | 2.0 | 104.4 | 1.6 | 6.3 |
| 192.0 | 3.5 | 90.9 | 2.7 | 6.2 |
| 959.8 | 4.3 | 97.6 | 6.3 | 7.1 |
| 1919.7 | 3.0 | 106.3 | 7.4 | 8.6 |
| 3839.3 | 0.8 | 106.2 | 1.7 | 7.0 |
Table 3.
Absolute recovery precision and accuracy, intra-day and inter-day precision (n=6) for α-T3.
Table 3.
Absolute recovery precision and accuracy, intra-day and inter-day precision (n=6) for α-T3.
| Concentration (ng/ml) | Recovery | Intra-day (Within) | Inter-day (Between) | |
|---|---|---|---|---|
| C.V. | Accuracy (%) | Precision (C.V.) | Precision (C.V.) | |
| 12.7 | 1.3 | 102.1 | 7.0 | 10.2 |
| 63.5 | 0.2 | 111.2 | 1.8 | 10.2 |
| 126.9 | 0.8 | 91.1 | 1.9 | 6.4 |
| 634.6 | 1.6 | 85.0 | 4.9 | 8.5 |
| 1269.3 | 1.2 | 97.1 | 4.9 | 10.9 |
| 2538.6 | 0.1 | 93.5 | 2.0 | 8.3 |
Following post-operative, freeze-thaw, short-term, and long-term stability tests, and with a stability mean percentage ranging between 85% and 115% for all plasma stability analyses, and 98% to 102% for stock drug solution analyses, it was concluded that the analyzed T3s exhibited stability in both the drug solution and spiked plasma.
Table 4.
Stability Test for T3 spiked human plasma.
| Concentration (µg/ml) | Stability mean percentage (%) | |||
|---|---|---|---|---|
| Freeze and Thaw | delta | gamma | alpha | |
| 0.1 | 111.3 | 109.5 | 111.6 | |
| 20 | 104.6 | 100.7 | 101.9 | |
| Short-term | delta | gamma | alpha | |
| 0.1 | 109.8 | 112.3 | 103.0 | |
| 20 | 104.1 | 104.2 | 100.1 | |
| Long-term | delta | gamma | alpha | |
| 0.1 | 107.2 | 113.5 | 111.0 | |
| 20 | 100.9 | 103.7 | 102.7 | |
| Post-operative | delta | gamma | alpha | |
| 0.1 | 107.1 | 114.6 | 114.4 | |
| 20 | 100.6 | 100.2 | 101.1 | |
Table 5.
Stability Test for T3 drug solution.
| Concentration (µg/ml) | Stability Mean Percentage (%) | |||
|---|---|---|---|---|
| Short-term | delta | gamma | alpha | |
| 0.1 | 98.8 | 100.9 | 98.9 | |
| 20 | 101.8 | 101.9 | 101.8 | |
| Long-term | delta | gamma | alpha | |
| 0.1 | 98.3 | 102.0 | 101.2 | |
| 20 | 98.9 | 102.0 | 99.3 | |
T3s, a form of vitamin E, is fat-soluble, which results in poor, low, and erratic bioavailability. Numerous studies have focused on improving its formulation. Consequently, the assay used must be precise to accurately measure blood levels and assess bioavailability. The current approach was employed to assess plasma samples collected from a healthy adult volunteer participating in a bioavailability study involving 200mg of mixed T3. The plasma concentration profiles of the volunteer are depicted in Figure 5.
Figure 5.
Plasma tocotrienol concentration versus time profiles after oral administration of 200mg mixed tocotrienol.
Figure 5.
Plasma tocotrienol concentration versus time profiles after oral administration of 200mg mixed tocotrienol.
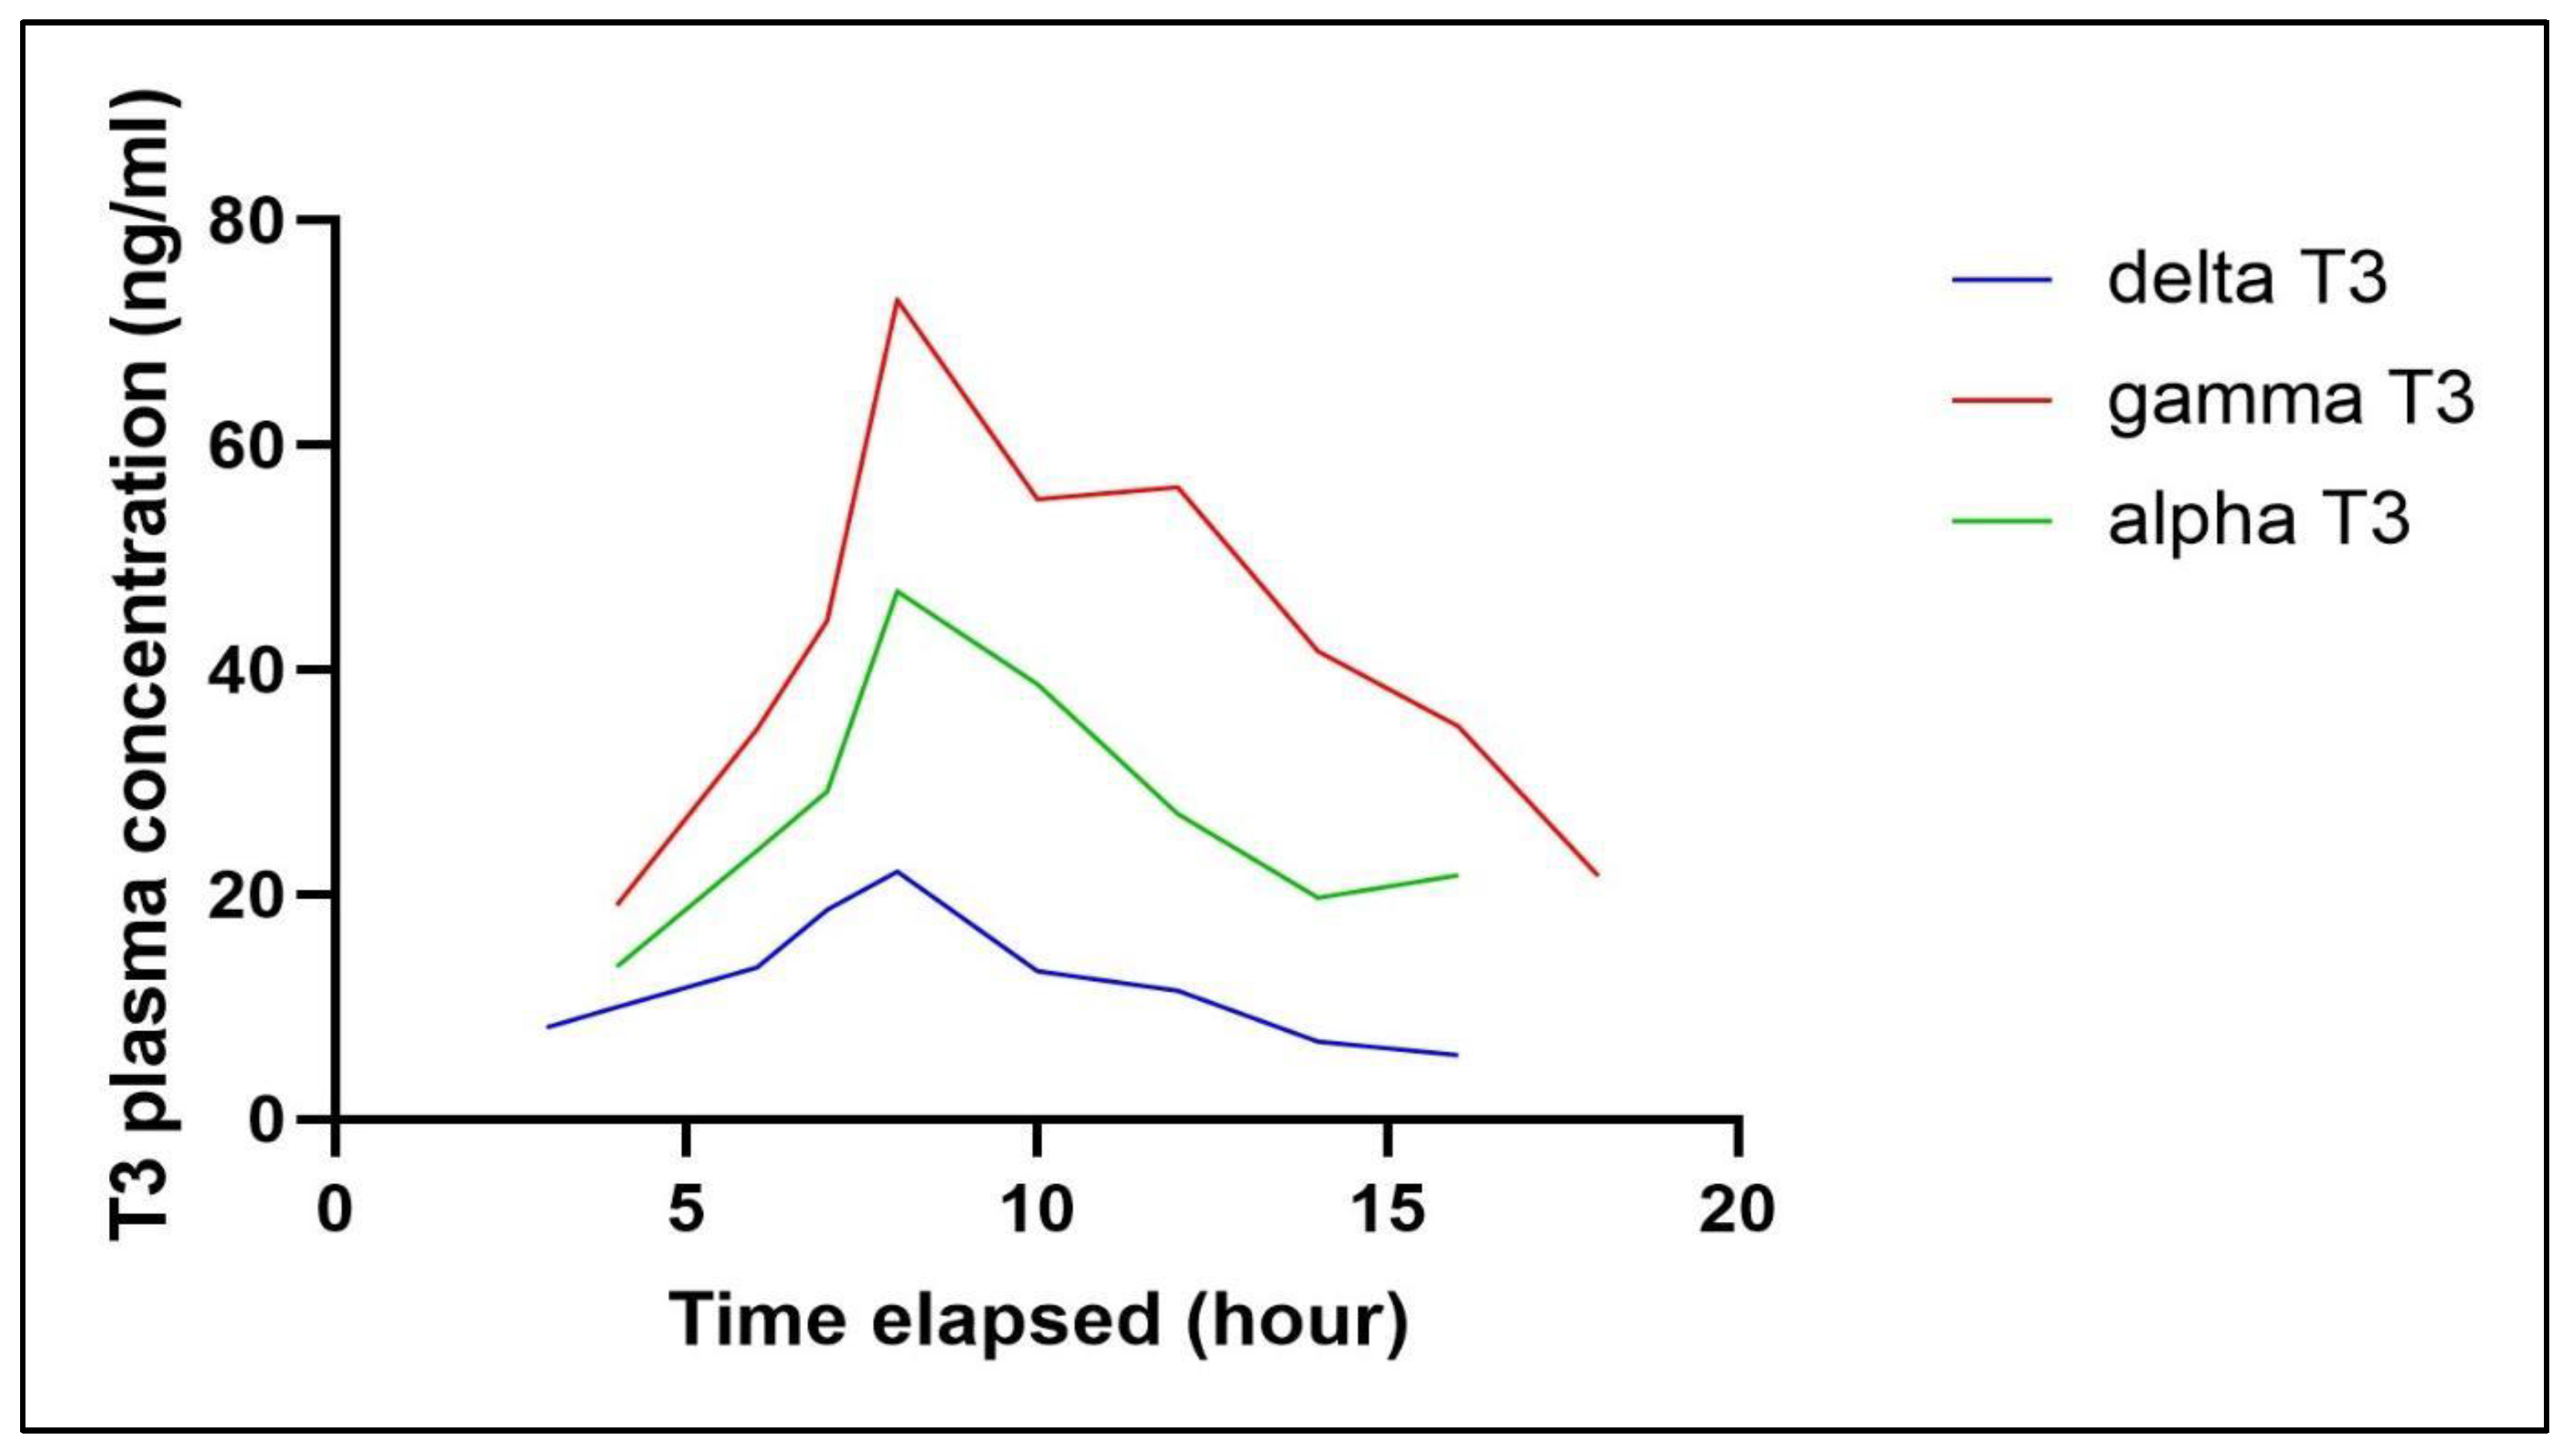
We acknowledge certain limitations and variations in the results, which can be attributed to dietary differences. The postprandial levels of tocotrienols in the blood plasma vary among individuals, leading to inconsistencies in the results depending on the batch of blood samples analysed. Additionally, tocotrienols were detected in fasted plasma for up to 8 hours, as the clearance rates of circulating tocotrienols differ between individuals and their diet [20].
In summary, the HPLC method described herein is straightforward, specific, sensitive, and well-suited for the routine measurement of plasma T3, as well as for application in pharmacokinetic and bioavailability studies.
4. Conclusions
A simple, specific, sensitive, and reproducible HPLC method was developed and validated to determine T3s (alpha, gamma and delta) levels in human plasma. This method is validated with sufficient precision and accuracy, and the tocotrienols were found stable in various storage conditions. This HPLC method will be useful for preclinical and clinical studies to obtain accurate and sensitive detection of T3s in blood plasma in an easy and reproducible manner.
Author Contributions
Conceptualization, K.H.Y. and S.T.G.; methodology, S.T.G. and J.K.K.M.; validation, J.K.K.M. and T.G.T.; resources, K.H.Y and S.Y.C.; writing—original draft preparation, J.K.K.M..; writing—review and editing, K.H.Y.; supervision, K.H.Y and S.Y.C.; All authors have read and agreed to the published version of the manuscript.
Funding
This research did not receive any specific grant from funding agencies in the public, commercial, or not-for-profit sectors.
Data Availability Statement
The original contributions presented in this study are included in the article/supplementary material. Further inquiries can be directed to the corresponding author(s).
Acknowledgments
In this section, you can acknowledge any support given which is not covered by the author contribution or funding sections. This may include administrative and technical support, or donations in kind (e.g., materials used for experiments).
Conflicts of Interest
The authors declare no conflicts of interest. The funders had no role in the design of the study; in the collection, analyses, or interpretation of data; in the writing of the manuscript; or in the decision to publish the results.
References
- Garg, A.; Lee, J.C.Y. Vitamin E: Where Are We Now in Vascular Diseases? Life 2022, 12. [Google Scholar] [CrossRef] [PubMed]
- Zainal, Z.; Khaza’ai, H.; Kutty Radhakrishnan, A.; Chang, S.K. Therapeutic potential of palm oil vitamin E-derived tocotrienols in inflammation and chronic diseases: Evidence from preclinical and clinical studies. Food Research International 2022, 156, 111175. [Google Scholar] [CrossRef] [PubMed]
- Ismail, M.; Alsalahi, A.; Imam, M.U.; Ooi, D.J.; Khaza’ai, H.; Aljaberi, M.A.; Shamsudin, M.N.; Idrus, Z. Safety and Neuroprotective Efficacy of Palm Oil and Tocotrienol-Rich Fraction from Palm Oil: A Systematic Review. Nutrients 2020, 12, 521. [Google Scholar] [CrossRef] [PubMed]
- Ranasinghe, R.; Mathai, M.; Zulli, A. Revisiting the therapeutic potential of tocotrienol. BioFactors 2022, 48, 813–856. [Google Scholar] [CrossRef] [PubMed]
- Abuasal, B.; Thomas, S.; Sylvester, P.W.; Kaddoumi, A. Development and validation of a reversed-phase HPLC method for the determination of γ-tocotrienol in rat and human plasma. Biomedical Chromatography 2011, 25, 621–627. [Google Scholar] [CrossRef]
- Beretta, G.; Gelmini, F.; Fontana, F.; Moretti, R.M.; Montagnani Marelli, M.; Limonta, P. Semi-preparative HPLC purification of δ-tocotrienol (δ-T3) from Elaeis guineensis Jacq. and Bixa orellana L. and evaluation of its in vitro anticancer activity in human A375 melanoma cells. Nat Prod Res 2018, 32, 1130–1135. [Google Scholar] [CrossRef]
- Bartosińska, E.; Jacyna, J.; Borsuk-De Moor, A.; Kaliszan, M.; Kruszewski, W.J.; Jankowski, Z.; Siluk, D. HPLC-APCI-MS/MS method development and validation for determination of tocotrienols in human breast adipose tissue. Talanta 2018, 176, 108–115. [Google Scholar] [CrossRef] [PubMed]
- Nagy, K.; Courtet-Compondu, M.C.; Holst, B.; Kussmann, M. Comprehensive analysis of vitamin E constituents in human plasma by liquid chromatography-mass spectrometry. Anal Chem 2007, 79, 7087–7096. [Google Scholar] [CrossRef] [PubMed]
- Strohschein, S.; Rentel, C.; Lacker, T.; Bayer, E.; Albert, K. Separation and identification of tocotrienol isomers by HPLC-MS and HPLC-NMR coupling. Anal Chem 1999, 71, 1780–1785. [Google Scholar] [CrossRef]
- Lee, M.J.; Feng, W.; Yang, L.; Chen, Y.K.; Chi, E.; Liu, A.; Yang, C.S. Methods for efficient analysis of tocopherols, tocotrienols and their metabolites in animal samples with HPLC-EC. J Food Drug Anal 2018, 26, 318–329. [Google Scholar] [CrossRef]
- Shelly, D.C.; Warner, I.M. Fluorescence Detectors in High-Performance Liquid Chromatography. In Liquid Chromatography Detectors; CRC Press: Boca Raton, FL, USA, 2020; pp. 87–123. [Google Scholar]
- Che, H.L.; Tan, D.M.Y.; Meganathan, P.; Gan, Y.L.; Abdul Razak, G.; Fu, J.Y. Validation of a HPLC/FLD Method for Quantification of Tocotrienols in Human Plasma. Int J Anal Chem 2015, 2015, 5–12. [Google Scholar] [CrossRef] [PubMed]
- Katsanidis, E.; Addis, P.B. Novel HPLC analysis of tocopherols, tocotrienols, and cholesterol in tissue. Free Radic Biol Med 1999, 27, 1137–1140. [Google Scholar] [CrossRef] [PubMed]
- Ali, H.; Nazzal, S. Development and validation of a reversed-phase HPLC method for the simultaneous analysis of simvastatin and tocotrienols in combined dosage forms. J Pharm Biomed Anal 2009, 49, 950–956. [Google Scholar] [CrossRef] [PubMed]
- Yap, S.P.; Julianto, T.; Wong, J.W.; Yuen, K.H. Simple high-performance liquid chromatographic method for the determination of tocotrienols in human plasma. J Chromatogr B Biomed Sci Appl 1999, 735, 279–283. [Google Scholar] [CrossRef] [PubMed]
- Skoog, D.A.; West, D.M.F.; Holler, J.; Crouch, S.R. Fundamentals of Analytical Chemistry, 10th ed.; Cengage Learning: Boston, MA, USA, 2021. [Google Scholar]
- Górnaś, P.; Siger, A.; Czubinski, J.; Dwiecki, K.; Segliņa, D.; Nogala-Kalucka, M. An alternative RP-HPLC method for the separation and determination of tocopherol and tocotrienol homologues as butter authenticity markers: A comparative study between two European countries. European Journal of Lipid Science and Technology 2014, 116, 895–903. [Google Scholar] [CrossRef]
- Grebenstein, N.; Frank, J. Rapid baseline-separation of all eight tocopherols and tocotrienols by reversed-phase liquid-chromatography with a solid-core pentafluorophenyl column and their sensitive quantification in plasma and liver. J Chromatogr A 2012, 1243, 39–46. [Google Scholar] [CrossRef] [PubMed]
- Gupta, S.; Verma, P.; Mishra, A.P.; Omar, N.; Mathur, R. A Review on Novel Analytical Method Development and Validation by RP-HPLC Method. Indian Journal of Forensic Medicine & Toxicology 2021, 15, 3476–3486. [Google Scholar]
- Fairus, S.; Nor, R.M.; Cheng, H.M.; Sundram, K. Postprandial metabolic fate of tocotrienol-rich vitamin E differs significantly from that of α-tocopherol. American Journal of Clinical Nutrition 2006, 84, 835–842. [Google Scholar] [CrossRef]
Disclaimer/Publisher’s Note: The statements, opinions and data contained in all publications are solely those of the individual author(s) and contributor(s) and not of MDPI and/or the editor(s). MDPI and/or the editor(s) disclaim responsibility for any injury to people or property resulting from any ideas, methods, instructions or products referred to in the content. |
© 2025 by the authors. Licensee MDPI, Basel, Switzerland. This article is an open access article distributed under the terms and conditions of the Creative Commons Attribution (CC BY) license (https://creativecommons.org/licenses/by/4.0/).
Copyright: This open access article is published under a Creative Commons CC BY 4.0 license, which permit the free download, distribution, and reuse, provided that the author and preprint are cited in any reuse.


