
Submitted:
20 January 2025
Posted:
21 January 2025
You are already at the latest version
Abstract
The contemporary electric distribution grid landscape witnesses a growing integration of diverse components, including distributed renewable energy sources, electric vehicles (EVs), and Bitcoin mining operations. This integration signals a significant shift in energy management and consumption paradigms. The increased presence of solar and wind power contributes to a diversified and sustainable energy mix, while the incorporation of EVs marks a substantial stride toward sustainable transportation. However, the introduction of Bitcoin mining operations introduces complex dynamics, raising concerns about energy consumption and grid stability. To effectively address these challenges, this study focuses on conducting 24-hour load flow analyses on a power system integrating intermittent renewable sources, Bitcoin mining farms, and EVs, considering the variability in power demand conditions. The analysis explores changes in bus voltage and power factor throughout the day. Notably, the integration of renewable distributed sources maintains voltage-level stability by preserving energy balance. To ensure power factor stability, the study emphasizes the importance of limiting reactive power production from local renewables during high production conditions. The findings underscore the necessity of detecting unfavorable system conditions and implementing necessary safeguards to ensure reliable resource management in the evolving landscape of electric distribution grids.
Keywords:
bitcoin mining operations
; distributed source
; electric vehicles
; load flow analysis based on daily hours
; renewable power sources
1. Introduction
The intersection of renewable energy systems, Bitcoin production, and electric vehicles (EVs) has sparked a multifaceted discussion concerning environmental sustainability, energy efficiency, and the evolving technological landscape [1].
Renewable energy systems, including solar, wind, and hydroelectric power, have emerged as essential alternatives to fossil fuels with the aim of mitigating climate change. However, the rapid expansion of Bitcoin mining, a process integral to cryptocurrency creation, has raised concerns regarding its substantial energy consumption [2]. In this context, integrating renewable energy sources into Bitcoin mining operations can help alleviate the environmental footprint. By utilizing excess energy generated from renewables during off-peak periods for mining activities, the energy demand of Bitcoin production can be better balanced with the intermittent nature of renewable sources.
Simultaneously, electrification of transportation through EVs is gaining momentum as a means of reducing carbon emissions from the transportation sector. The synergy between renewable energy and EVs presents a promising solution to address both the growth of sustainable transportation and the energy grid's challenges [3]. EVs can act as mobile energy storage units, enabling the storage of surplus energy from renewables and feeding it back to the grid during peak demand. This bidirectional energy flow not only supports grid stability but also maximizes the utilization of renewable energy.
The convergence of renewable energy systems, Bitcoin mining, and electric vehicles highlights the intricate balance between technological advancement and environmental responsibility [4]. Leveraging renewable energy sources to power Bitcoin mining and charging EVs offers a path toward reducing carbon emissions and optimizing energy utilization. As these sectors continue to evolve, it is imperative to strike a harmonious equilibrium that embraces innovation while prioritizing the health of our planet.
However, it's important to acknowledge that while renewable energy integration with cryptocurrency mining farm and EVs can potentially yield positive outcomes, there are complexities to consider [4]. The decentralized and global nature of Bitcoin mining makes it challenging to direct energy sourcing. Additionally, scaling up renewable energy systems to meet both transportation and Bitcoin mining demands requires substantial infrastructure investments.
The confluence of renewable energy systems, Bitcoin production, and electric vehicles (EVs) has introduced challenges and opportunities to electric grid system [4].Renewable energy systems, such as solar and wind, contribute to cleaner grids by reducing the reliance on fossil fuels. However, their intermittent nature can strain the grid stability. Integrating these sources effectively requires advanced grid management techniques and energy storage solutions to balance the supply and demand.
The energy-intensive nature of Bitcoin production can exacerbate grid stress. The high energy consumption associated with mining can lead to increased electricity demand during peak times, potentially causing strain on the local grids. Coordinating Bitcoin mining operations with renewable energy generation can alleviate this burden and promote sustainable practices.
Crypto mining demands substantial power, with the consumption varying based on several factors like the cryptocurrency being mined, the mining hardware used, its efficiency, and the scale of operations. Bitcoin mining, for instance, is known for its high energy consumption. As of my last update, the estimated annual electricity consumption for Bitcoin mining alone was in the tens of terawatt-hours, rivalling the energy usage of some small countries. According to its use in the energy sector, the power consumption of block chain technology is examined in study [5]. Additionally, an analysis is conducted on the growth in energy consumption in the particular case study and the ensuing rise in carbon emissions. In order to protect against cyber-attacks and guarantee secure transactions, a decentralized review system is suggested in [6]. Furthermore, the suggested system is built on the Ethereum blockchain and smart contracts are used to create its regulations. To meet the need for electricity, smart contracts are created using blockchain technology [7].
The widespread adoption of EVs has also introduced another layer of complexity. Although EVs offer reduced emissions, their charging patterns can strain local grids if not managed properly. Smart charging, coupled with renewable energy integration, can mitigate these challenges. EVs can act as distributed energy storage, assist the grid during peak demand and support renewable energy utilization.
Electric vehicles (EVs) have a notable impact on energy consumption, both in terms of their own energy needs and their potential effects on the broader energy infrastructure. The energy consumption effects of EVs are intertwined with broader discussions on sustainable transportation and energy management. Efforts to optimize charging infrastructure, improve battery technology, and transition toward renewable energy sources are essential to mitigate any adverse energy consumption effects from widespread EV adoption. Electric load on electrical networks is rising as a result of the growing popularity of EVs, and EV charging presents new difficulties for the networks' safe and dependable operation [8]. The largest challenge for EVs is first and foremost figuring out a sustainable way to have a steady supply of electricity because, when charging, an EV may appear to be a load on the grid [9]. This additional load has the potential to raise demand and significantly strain the grid's current capacity. Particularly during peak hours, moderate to high EV penetrations may result in unacceptably large voltage swings, poor grid performance, and problems with power quality [10].
In conclusion, the interplay between renewable energy systems, Bitcoin production, and EVs necessitates a comprehensive approach to grid management. As these technologies advance, proactive measures must be taken to ensure a resilient and efficient electric grid system. The most important difficulty in integrating such structures into a traditional power system is production discontinuity and uncertainties [11]. Production uncertainties and discontinuities can cause instantaneous changes in system load. It is necessary to detect the negative effects of these changes on the system in advance, implement preventive measures and plans, and ensure a healthy and effective distribution of power. Therefore, it is important to examine the effects of the uncertain characteristics of such systems on the load flow stability of an electrical grid system [12].
Various mathematical techniques are employed in load flow analysis, including well-known algorithms such as Newton-Raphson [13], Fast-Decoupled [14,15], and Gauss-Seidel [16]. Alongside these traditional mathematical approaches, contemporary heuristic methods like particle swarm optimization [17], fuzzy logic algorithm [18], differential evolution algorithm [19], taboo search algorithm [20], and bacterial colony optimization [21] have also found application.
In the 1960s, with the invention and widespread use of digital computers, many methods were developed for load flow problems [13]. In particular, numerical methods have been studied and different versions of Newton's method such as fast-decoupling have been widely used [15]. Zimmerman and Chiang performed load flow studies on unbalanced radial distribution systems using this method [14]. Numerical methods, especially Newton-Raphson method analysis, have become the most widely used basic method in terms of convergence speed and accuracy to the solution. The Newton-Raphson method is a widely used analytical method for solving multivariate nonlinear equations. According to this method, the values of the variables were initially determined randomly. New values are generated using these values. The run was iteratively continued until an acceptable small difference is achieved between the two most recently generated values. The purpose of the Newton-Raphson load flow is to determine the voltage amplitude values of all load buses and the angle values of all buses except the swing bus. D. Shirmohammadi, H. W. Hong, A. Semlyen, and G.X. Luo [22] in 1988 described a load flow method for the solution of weakly meshed distribution and transmission networks using the multi-input compensation technique and the basic formation of Kirchoff's law. The aforementioned method has excellent convergence and a computer program applying this method has been developed and successfully applied to several distribution and transmission networks with weak radial networks. This method can be applied to a solution for three-phase (unbalanced) networks as well as single-phase (balanced) networks. Mohammad, Md Fokhul and Ashik investigated, the enhancement of power quality in a grid-integrated renewable hybrid power system by incorporating a Static VAR Compensator (SVC) [23]. During the inactive periods of one or both renewable sources, critical system parameters such as bus voltage, power transfer capacity, and power losses were analyzed. A comparison was made between the results obtained without the presence of SVC and with SVC. The findings demonstrated that the utilization of SVC led to an improvement in the voltage profile, a reduction in branch loss and an enhancement in power transfer capability. The compensation idea was successfully implemented to eliminate voltage amplitude mismatches in the generation buses in this study. At this point, the analysis of the effects of energy sources with energy production discontinuity and uncertainty (such as solar and wind energy) and variable loads (such as EVs and Bitcoin mining farms) on the power distribution network becomes important. Analysis and management methods must to be developed to ensure that network conditions operate within acceptable limits in the case of production fluctuations caused by these systems. As the global energy landscape evolves, the integration of renewable energy systems, the rise of Bitcoin mining operations, and the increasing prevalence of electric vehicles present multifaceted challenges to power systems. By evaluating the interactions between renewable energy sources, energy-intensive Bitcoin mining, and the growing demand for electric vehicles, we seek to provide valuable insights into the dynamic complexities and potential synergies that arise within the modern power grid. This study aims to conduct a load flow analysis to comprehensively examine the impacts of these factors on the power system using Newton-Raphson method. For this purpose, renewable resources exhibiting power production uncertainty and discontinuity were identified based on their 24-hour average production profiles. These resources were distributed to the IEEE 14 bus power system and the load flow analysis of the power system was conducted on an hourly and daily basis. In these analyses, the loads connected to the buses were dynamically modeled using 24-hour average power demand profiles to accurately represent the variable power demand conditions that the power system, containing the electric car and Bitcoin mining farm systems, may encounter throughout the day. In this research, hourly sampled load flow analyses for various scenarios were carried out on the basis of Newton-Raphson numerical solutions, and thus fast and low-convergence error load flow analyses could be obtained [24]. Statistical analyzes were performed on the obtained solutions, intra-day bus voltage level changes and bus power factor changes were examined, and variability factor (standard deviation/ average (σ/µ) analyses were made.
The implications of this research extend far beyond the immediate context. As the global transition toward sustainable transportation gains momentum and the cryptocurrency landscape continues to evolve, understanding the cumulative impact of these disruptive forces on power systems becomes increasingly paramount. The load flow analysis serves as a valuable tool to comprehend the intricate interactions between renewable energy, emerging technologies, and the power grid, providing essential information for decision-makers in the energy sector. Insights derived from this study will inform the development of adaptive grid management strategies, guiding infrastructure upgrades essential for accommodating the growing demands of EVs and cryptocurrency mining operations. Ultimately, this study aspires to contribute nuanced insights into the evolving energy landscape, facilitating the formulation of robust policies, innovative technologies, and resilient infrastructure crucial for navigating the complexities posed by the integration of EVs and crypto farms within the power grid. Embracing these challenges presents an opportunity to engineer more sustainable, efficient, and adaptable energy ecosystems capable of accommodating the evolving demands of a rapidly changing technological landscape.
The remainder of this paper is organized as follows: In the following section the authors mention the numerical analysis method used to solve equations in power flow analysis. A summary of the commonly used Newton-Raphson method for solving load flow equations is presented, followed by its implementation in 24-hour dynamic load flow analysis. In the next section, intra-day dynamic load flow analyses are conducted, considering intermittent distributed generation and fluctuating power demand scenarios. Alterations in the electrical parameters of the buses were computed on an hourly basis. Finally, a brief conclusion of the study is provided in the Conclusion section.
2. Materials and Methods
2.1. Numerical Analysis Method
Nonlinear equations are used to solve problems encountered in the analysis of power systems. Numerical methods are used to solve these equations. The main purpose of load flow analysis is to determine the complex voltage on the buses and the complex power values flowing on the lines for production and consumption values in a given power system.
The load flow problem solution helps identify the voltage magnitude, phase angle, and the active and reactive power flowing through each transmission line in every bus. When solving the load flow problem, it is presumed that the system operates under normal, well-balanced conditions and is represented by a single-line diagram. The essential variables at each bus include voltage magnitude (|V|), voltage phase angle (δ), active power (P), and reactive power (Q). Certain buses are supplied by generators, known as production buses, in which the voltage magnitude and active power are considered constant. Other buses that are not linked to the generator are termed load buses. It is assumed that the complex load power is known for all the buses. In summary, buses in a power system are classified into three groups:
i. Oscillation bus, also referred to as the reference bus, is where the voltage magnitude (|V|) and phase angle (δ) are known, and the active (P) and reactive power (Q) are determined. This bus assesses the difference between the generated power and the planned load caused by the power system losses.
ii. Load buses, also known as P-Q buses, are where the active (P) and reactive power (Q) are known, and the voltage magnitude (|V|) and phase angle (δ) of the bus are sought. As power is consumed in these buses, the values of the active and reactive power become negative.
iii. Generation buses, also known as P-V buses or voltage-controlled buses are where the active power (P) and voltage magnitude (|V|) are known, and the voltage phase angle (δ) and reactive power (Q) are determined.
2.1.1. Newton-Raphson Method
Comparing to iterative methods (e.g., Gauss and Gauss-Seidel), Newton methods demonstrate a quadratic convergence characteristic when solving load flow equations [25]. Particularly in the context of large-scale power systems, the Newton-Raphson method is notably more efficient and practical. One of its primary advantages is that the number of steps required to reach a solution remains independent of system size. However, the computational workload per step is high during solution processing. In load flow analysis solved using Newton-Raphon method, when dealing with voltage-controlled buses, the load flow equations are represented in a polar form, with the active power and voltage magnitude being already known. In this study, Newton-Raphson Methodology will be used to solve the non-linear equations we encounter.
Considering a bus and the lines connected it, expression (1) from Kirchhoff’s current law is obtained as polar.
The complex power in bus i is expressed as (2).
Using (1) and (2), (3) is attained.
Here, Yij represents the admittance value between buses i and j. The admittance values between buses are defined in the Bus Admittance Matrix (YBUS), which is established for the power system load flow analysis. The complex power expression in (3) can be separated into its real and imaginary components as shown in (4) and (5).
(4) and (5) are the components of the nonlinear equation system that needs to be resolved, encompassing independent variables, namely, the voltage magnitude and voltage phase angle. Equations Pi and Qi are applied to each load bus, whereas equation Pi is utilized for each generator bus. These equations are then converted into a linear equation system denoted by (6), through an expansion around the initial value, with higher-order terms being neglected.
In the equation below (7), J is referred to as the Jacobian matrix. The Jacobian matrix determines the relationship between the rate of change in the voltage phase angle and voltage magnitude and the rate of change in the active and reactive power. The Jacobian matrix consists of partial derivatives with respect to the angle and magnitude changes of the active and reactive power equations above.
The system of linear equations expressed in (8) is calculated iteratively using the following solution steps.
Calculations are continued within one iteration step until the changes in voltage and phase angle (ΔV and Δδ) are smaller than a predefined error threshold.
2.1.2. 24 Hour Dynamic Load Flow Analysis Based on the Newton-Raphson Method
The Newton-Raphson load flow analysis method briefly summarized in the previous section was employed to conduct 24-hour dynamic load flow analyses. The calculation steps for the 24-hour load flow analysis are illustrated in Figure 1.
For this purpose, distributed resources were modeled as two different types: continuous and intermittent. Continuous resources were assumed to have active and reactive power values that remained approximately constant at an average value over the course of 24 h. For instance, hydroelectric and thermal power plants have output power. Intermittent resources, on the other hand, were represented by 24-component GP and GQ vectors, which represent the active and reactive power generation profiles for different resource types (e.g., wind and solar) over 24 h. It was assumed that the active and reactive power values of these resources varied throughout the 24-hour period.
Similarly, load profiles at buses were modeled in two different types to match their power demand characteristics: low-variable and variable power demand profiles. Low-variable loads, such as Bitcoin mining farms and industrial areas with night shifts, were used for load models that exhibited minimal fluctuations at 24 h. Variable power demand profiles, on the other hand, were employed for load models that experienced significant fluctuations over a 24-hour period, such as residential consumers, electric vehicles. Variable loads were defined using 24-component PL and QL vectors. Daily hourly load flow analyses were conducted by retrieving the relevant source and load values for each hour of the day (from 1 to 24) from pre-defined GP, GQ, PL, and QL vectors, and the Newton-Raphson method was applied. Following the dynamic load flow analyses for the assessment of voltage and power factor variations at each load bus, the voltage values (Vd) and power factor (cos θd) for each load bus were obtained on an hourly basis. The voltage and power factor variations occurring throughout the day at the load buses were used to calculate the statistical coefficient variation as shown (11)
In this context, σ(.) and µ(.) represent the daily standard deviation and mean daily voltage of the bar's voltage. The variability factor provides statistical data comparable to the daily voltage fluctuations in the bars. Similarly, the variability in power factor of the bars is expressed in (12).
By calculating these formulas, we can analyze the changes in power factor and voltage values at each bus over a 24-hour period. This is important for examining the impact of changes in the load structure within the grid system, as well as variations in the power generation within the grid system include renewable energy sources.
3. Results and Discussion
3.1. 24-Hour Dynamic Load Flow Analyses on the IEEE 14-Bus Test System
Hourly load flow analysis tests were conducted on a frequently used IEEE 14-bus test system for energy market problems in an exemplary application [26]. The IEEE 14-bus test system is a widely recognized and standardized benchmark system in the field of power systems. 14-bus system strikes a good balance between simplicity and complexity. It is complex enough to capture important aspects of a real power system but simple enough to facilitate analysis and understanding. Load structures and power systems are attached to the IEEE 14-Bus test system as shown in Figure 2.
Different test scenarios were constructed by adding electric cars, Bitcoin mining facilities, and renewable distributed resources to this test system. To this end, two types of dynamic load profiles were defined. The first, representing load demand profiles with relatively low power consumption variability, such as Bitcoin mining operations, was represented by vectors PL1 and QL1 as shown in Figure 3(a). The other load model, which exhibits high variability in power consumption, such as the charging status of electric cars, is represented by vectors PL2 and QL2, as shown in Figure 3(b). In this study, the power demand profiles were hypothetically determined based on the power demand behaviors of these systems.
In the load analysis test simulation, three source profiles supplying energy to the power system were defined. The production profiles GP1, GQ1 vectors were defined for continuous energy sources (hydro, thermal, nuclear, etc.). The production profiles GP2, GQ2 vectors were defined for intermittent and highly uncertain renewable sources of wind energy and the solar energy production profile was defined by vectors GP3 and GQ3. Figure 4 shows the production profiles used in the analysis of the three types of energy production sources. These profiles are designed hypothetically to align with the power consumption profiles of these power sources.
The effects of renewable distributed resources on bus voltage and power factor stability were examined hourly using two test scenarios. The first test scenario is made for the centralized generation situation where renewable distributed resources are not available. This test scenario is called the current state (CS), and the loads are dispersed in the power system, as shown in Figure 2. To better examine the impact of Bitcoin mining operations and EVs on the network, two different load demand scenarios (LDx3and LDx7) were studied, with the load power demand increased by tree and seven times, respectively. The second test scenario was devised to analyze the circumstances arising from the integration of renewable distributed resources into the system. This test case is referred to as the distributed generation case (DG). In this scenario, to more effectively assess the impact of renewable energy resources on the grid, comparisons are drawn between test conditions (DGx5, DGx8), where the energy level of renewable distributed resources increases by five and eight times. Figure 5 shows the 24-hour load flow analysis results for the CS scenario.
In Fig. 5(b), because the buses with bus numbers 1 to 3 are only production buses, the voltage variability remains at the zero level. In buses with larger numbers, there are load buses and transition buses that are not connected to the load. In this analysis, the highest daily voltage variability was observed at Bus-13, at a level of %0.8. Fig. 5(c) shows a maximum power factor variability of %12. Because no load or source is connected to the transition buses, the power factors were not calculated. This situation can be seen in the characteristics in Fig. 5(c) for buses whose power factor value has not been calculated.
In Table 1, a comparison is shown between the current situation (CS), where the load value connected to the network is at a minimum level (LD), and the LDx3 and LDx7 scenarios, which represent test conditions in which the load demand increases to three times and seven times, respectively.
As seen in Table 1, increase in load demand significantly affects the daily variability of bus voltage levels (Vσ). The highest intra-day voltage change values in all buses were observed in the LDx7 scenario. Voltage deviations vary across buses and scenarios. Buses 4, 5, 6, 8, 9, 11, and 12 seem to have some voltage deviation in certain load scenarios. In addition, the highest Vσ value was measured at bus number 7 with %51. Power factors also exhibit variations. Buses 1, 2, and 3 experience significant power factor changes in LDx7, indicating a considerable impact on the balance between real and reactive power. The cosθσ value in the production buses varied between %30 and %98 in the LDx7 scenario. On the other hand, an increase of around %1-3 in the daily average variability (cosθσ) in load buses is noteworthy. It has been analyzed from the results given in Table 1 that increasing the load value added to the system by 3 and 7 times has no effect on the daily power factor change in the load buses.
As shown in Table 2, the integration of distributed renewable power generation systems with the grid was investigated in three different scenarios (DG, DGx5, and DGx8). Here, the DGx5 and DGx8 scenarios represent test conditions where the energy levels of the renewable distributed sources reach five times and eight times the level in DG, respectively. Accordingly, DG represents low-power renewable energy production conditions; DGx5 represents moderate-level renewable energy production conditions, and DGx8 represents high-level renewable energy production conditions, capable of meeting almost all local demand. In all three scenarios, the power values of the loads added to the grid, as shown in Fig. 2, were at a minimum level (LD).
When Table 2 is analyzed, most buses (1-14) do not experience significant voltage deviation in the DGx5 and DGx8 scenarios. Power factor variations are observed across buses and scenarios. Bus 6 stands out with a relatively high power factor under the DG scenario, which increases significantly under DGx5 and decreases under DGx8. This suggests a notable impact on the balance between real and reactive power at this bus. Bus 11 experiences a substantial increase in power factor under DGx5 and a further increase under DGx8, indicating an improvement in power consumption efficiency. Bus 13 shows a decrease in power factor under DGx8, suggesting a change in the balance of real and reactive power consumption.
The intricate dynamics of contemporary power systems, influenced by the integration of renewable energy systems, Bitcoin mining operations, and electric vehicles (EVs), require a meticulous analysis to understand their impact on various nodes within the network. The load at Bus-7, exclusively influenced by the Bitcoin mining operation consumption model (PL1, QL1), becomes a focal point for examination. The analysis reveals that in scenarios DGx5 and DGx8, where wind energy resources in the form of DG (Distributed Generation) are integrated at Bus-7, the impact is significant. Wind energy production at this node increases by five and eight times, respectively, reflecting a noteworthy shift in the power profile.
Simultaneously, at Bus-8, a more complex scenario unfolds. This bus accommodates dynamic loads representing both the Bitcoin mining operation consumption model and the EVs consumption model (PL2, QL2). In addition to these dynamic loads, renewable energy sources, including a wind generation model (GP3, GQ3) and a solar generation model (GP2, GQ2), have been seamlessly integrated into the bus for sustainable power generation. This integration marks a step toward a diversified and environmentally conscious power grid.
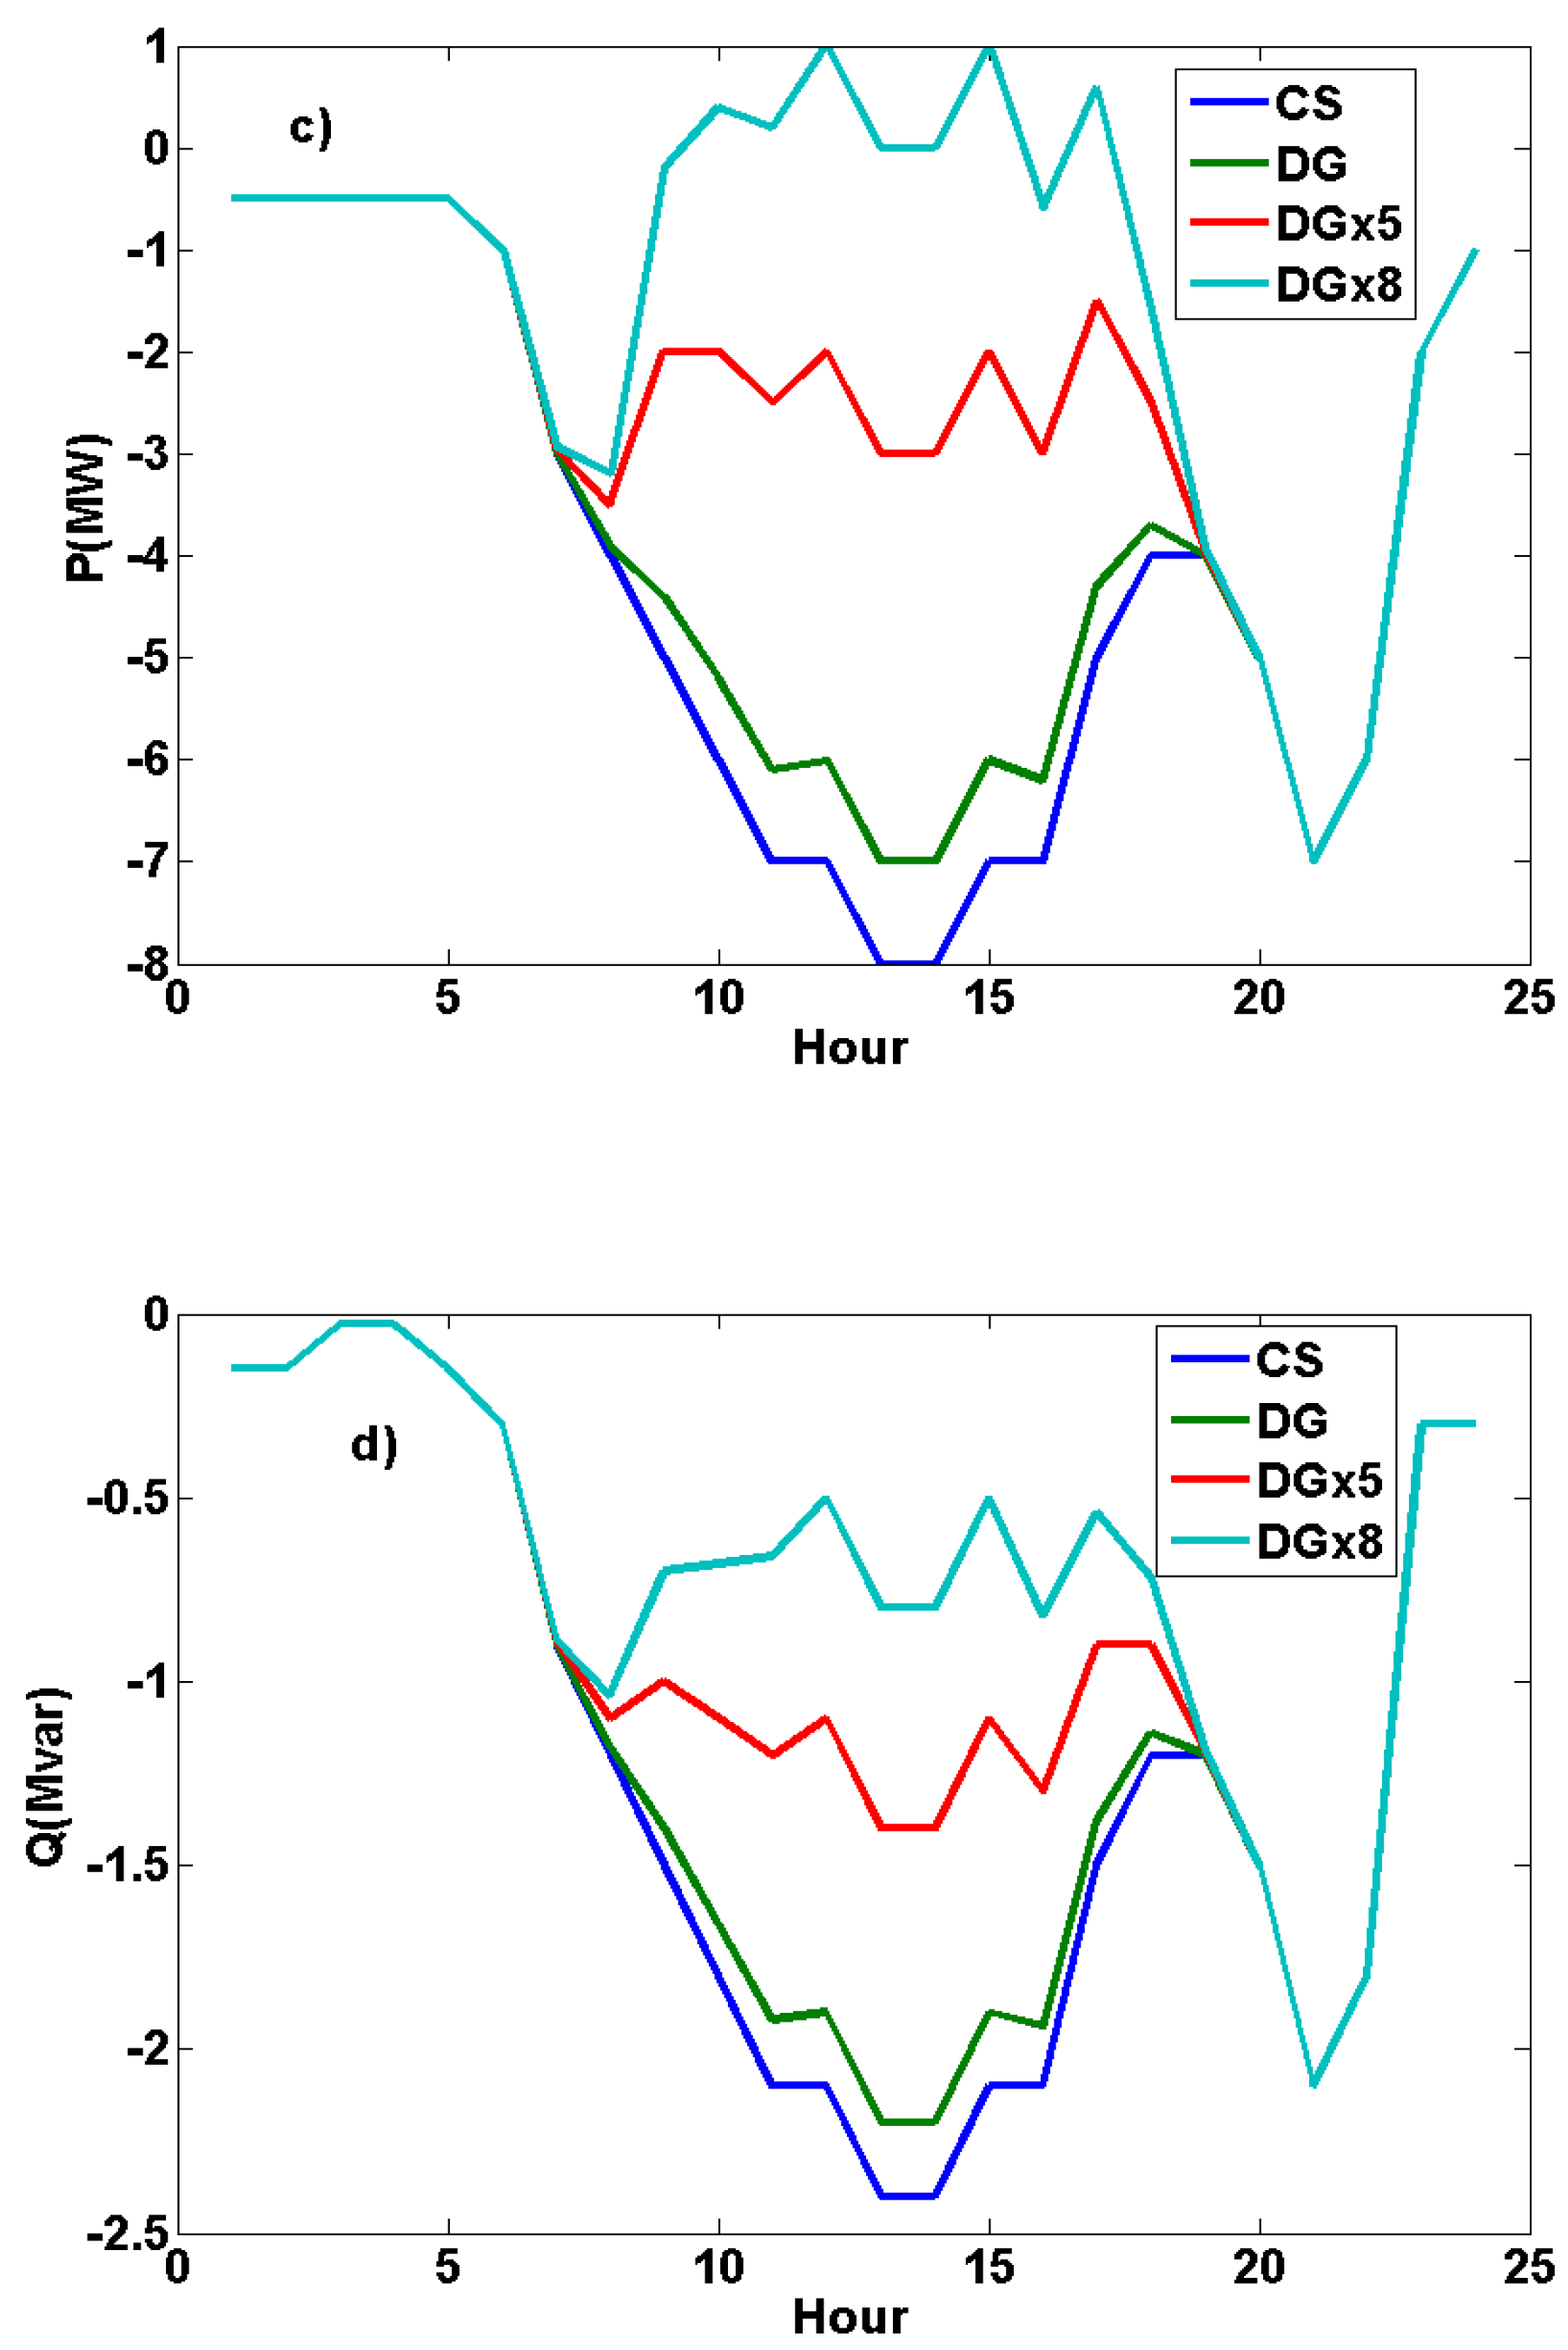
The analysis unravels the intricate relationship between renewable energy production and power system parameters. High power production from renewable sources triggers a nearly 10% change in voltage levels, a crucial metric for assessing the stability of the power system. The increase in reactive power production, in turn, results in a decrease in the power factor—a phenomenon illustrated in Figure 6 (a-b), 7 (a-b), and 8 (a-b). The volatility in these parameters is particularly pronounced during specific time periods, such as the peak wind energy production from 4:00 to 7:00, under medium and high wind power production conditions (DUx5 and DUx8).
Analyzing the results for Bus-7 and Bus-8 during these peak wind energy production hours reveals sharp declines in the power factor. More intriguingly, in the DUx8 scenario, the high wind energy production during these hours allows Bus-7 and Bus-8 to become self-sufficient, operating in what is termed an "Islanded Operation." This implies that the local demand can be met without drawing power from the generation buses, signifying a unique operational state where these nodes can even become power producers. The positive power values observed in the DUx8 scenario during these hours highlight the potential for local energy autonomy under certain conditions.
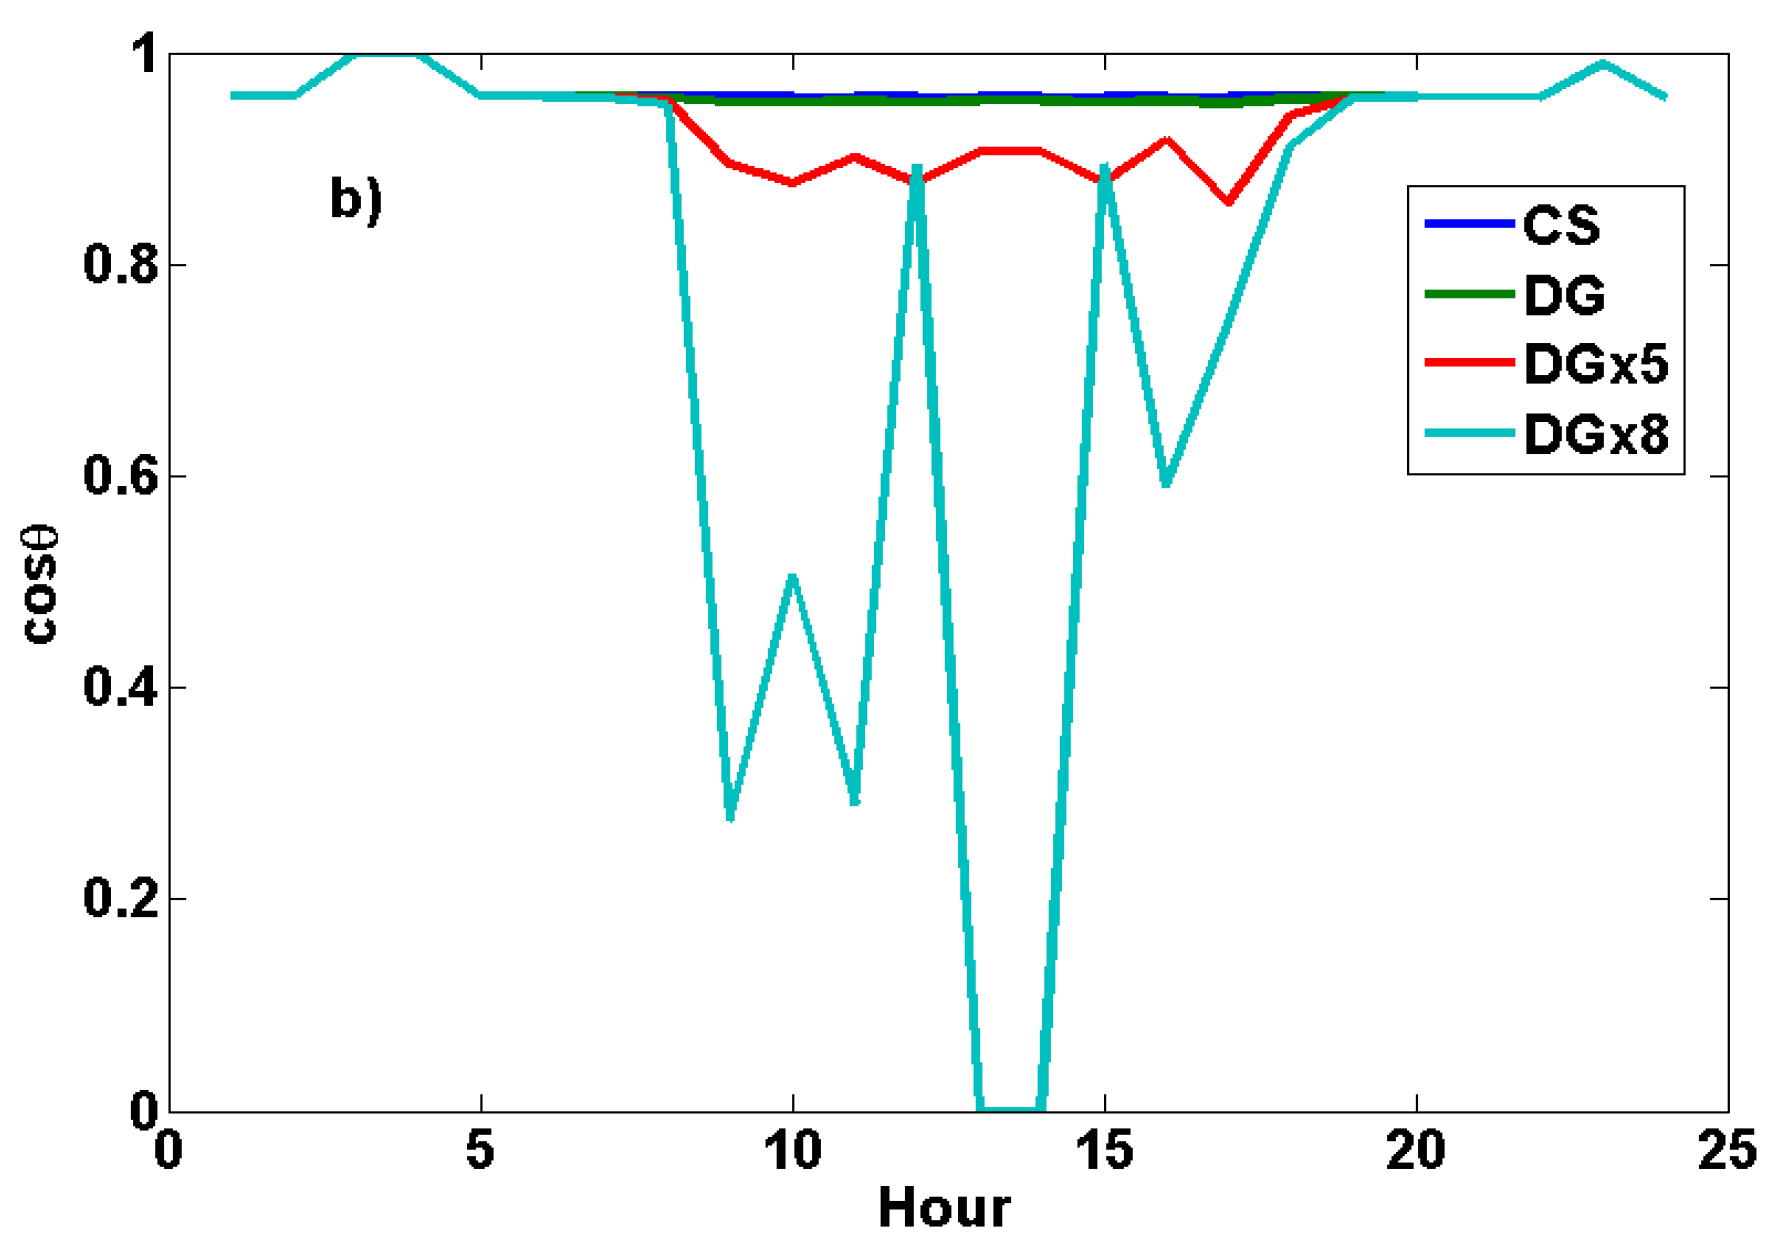
Turning attention to Bus-10, which operates with a load connected to the EVs consumption model and incorporates a solar generation model, a distinct pattern emerges. During periods of high solar energy production from 9:00 to 16:00 in the DUx8 scenario, a clear decrease in the power factor is evident, particularly at 13:00 and 14:00, as depicted in Fig. 8(b). However, this effect is notably weaker under low production conditions (DG). The findings emphasize the need for proactive measures to mitigate the impact on power factor during high solar energy production hours, making the energy distribution and consumption at Bus-10 more stable and reliable.
A crucial observation arises from the system that includes a load with minimal daily energy consumption changes, specifically the Bitcoin mining operation in the CS scenario where no renewable energy production occurs. In this scenario, stability prevails in power factor and active/reactive power values. The system's resilience to variations in renewable energy production highlights the unique dynamics introduced by the Bitcoin mining operation, which operates with a consistent energy consumption pattern throughout the day.
Figure 6.
(a) 24-hour voltage levels, (b) power factors (c,d) active and reactive power profiles calculated for Bus-7.
Figure 6.
(a) 24-hour voltage levels, (b) power factors (c,d) active and reactive power profiles calculated for Bus-7.

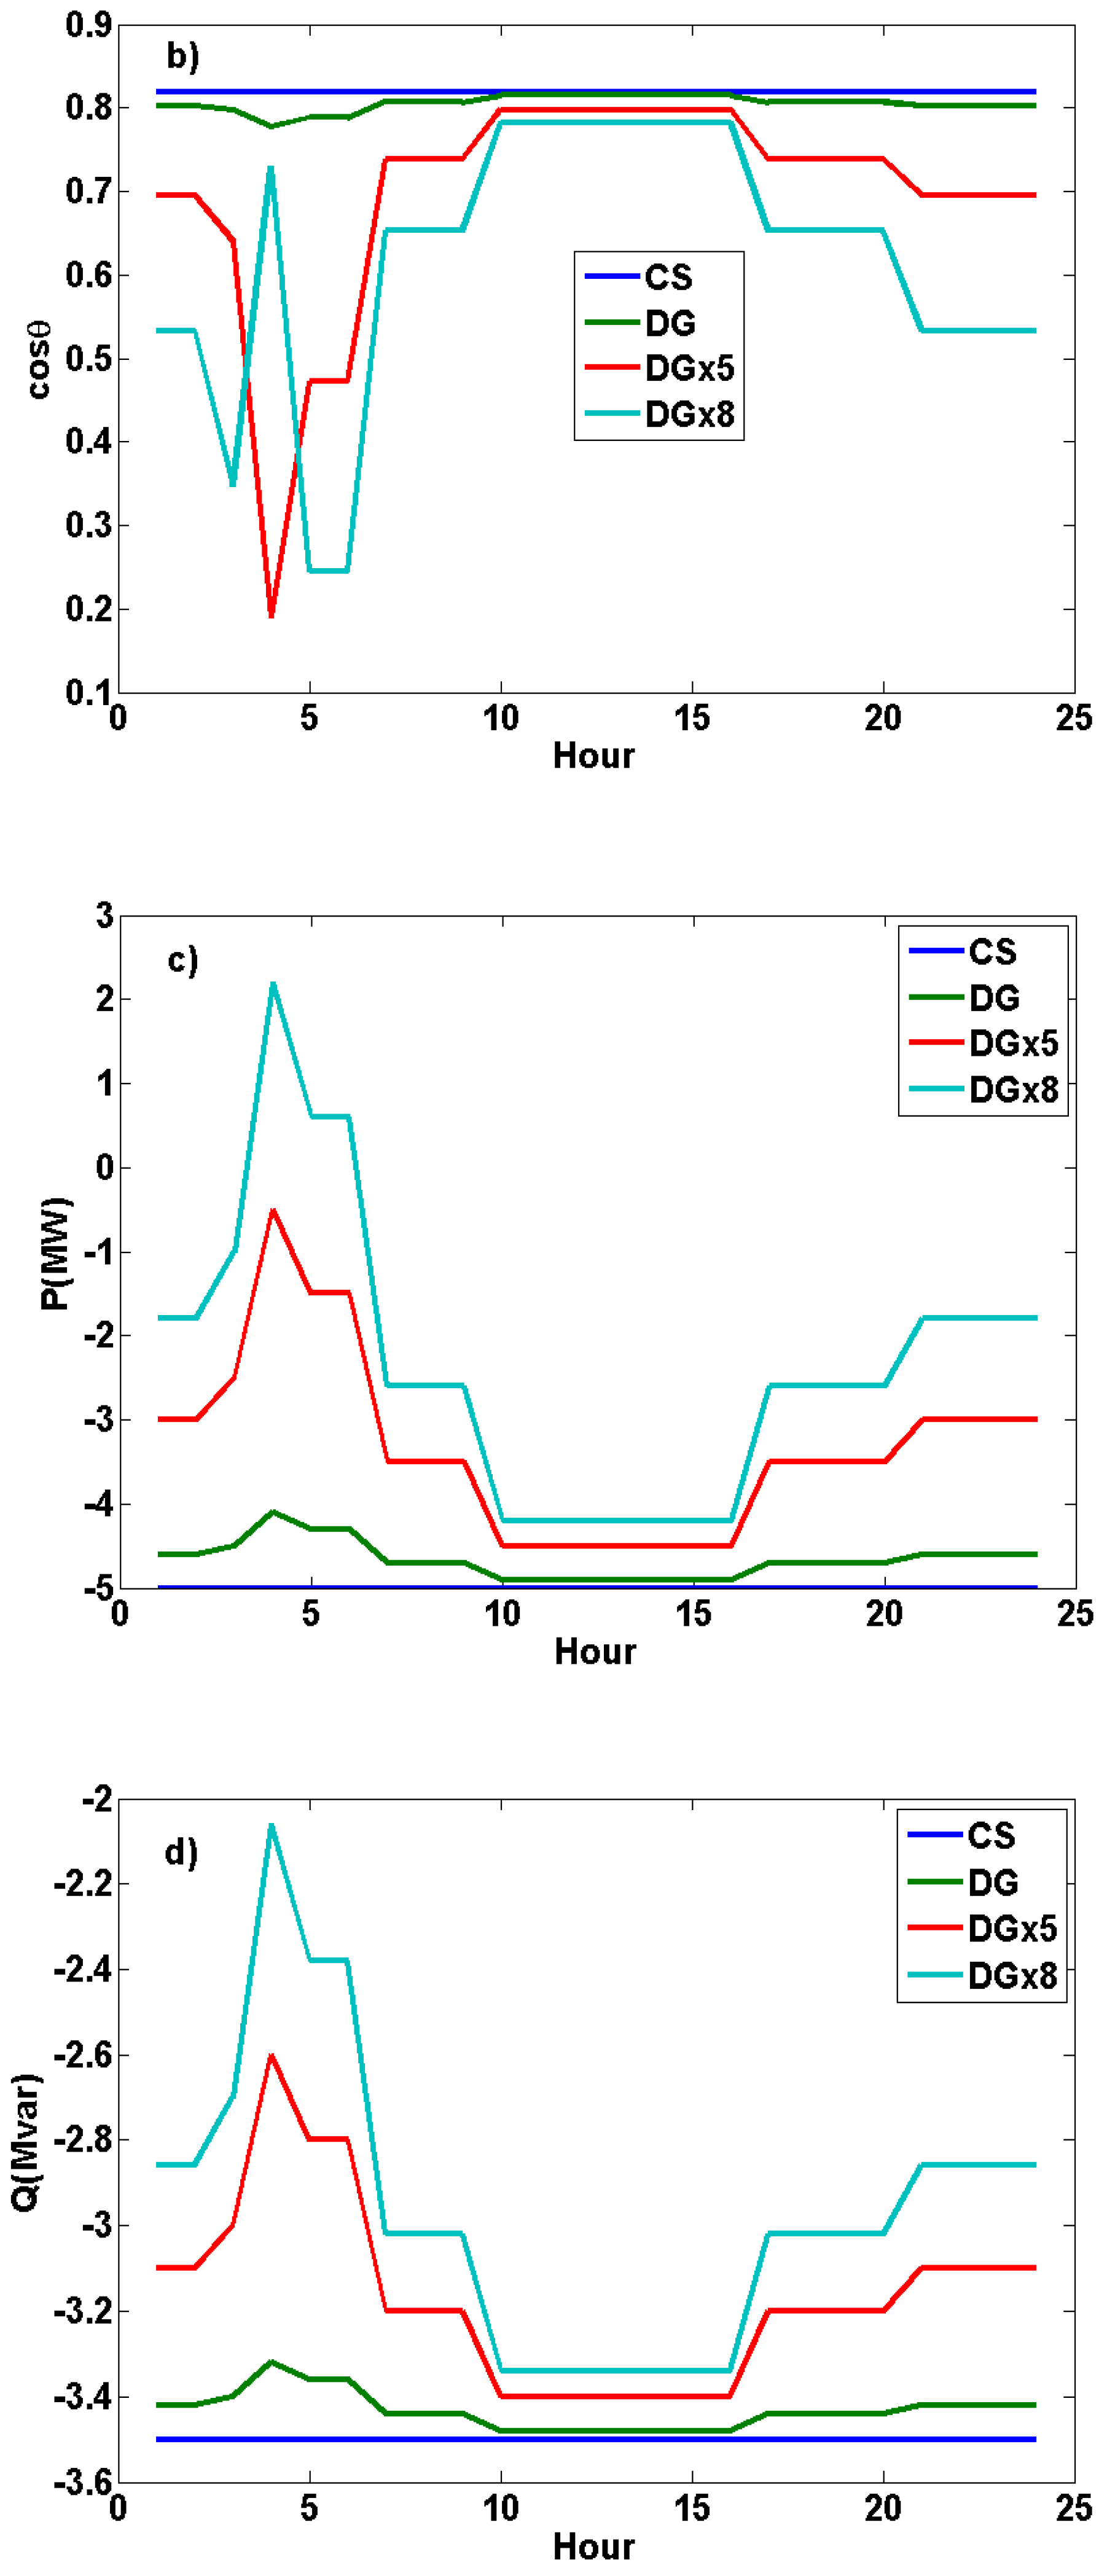
Figure 7.
(a) 24-hour voltage levels, (b) power factors (c,d) active and reactive power profiles calculated for Bus-8.
Figure 7.
(a) 24-hour voltage levels, (b) power factors (c,d) active and reactive power profiles calculated for Bus-8.
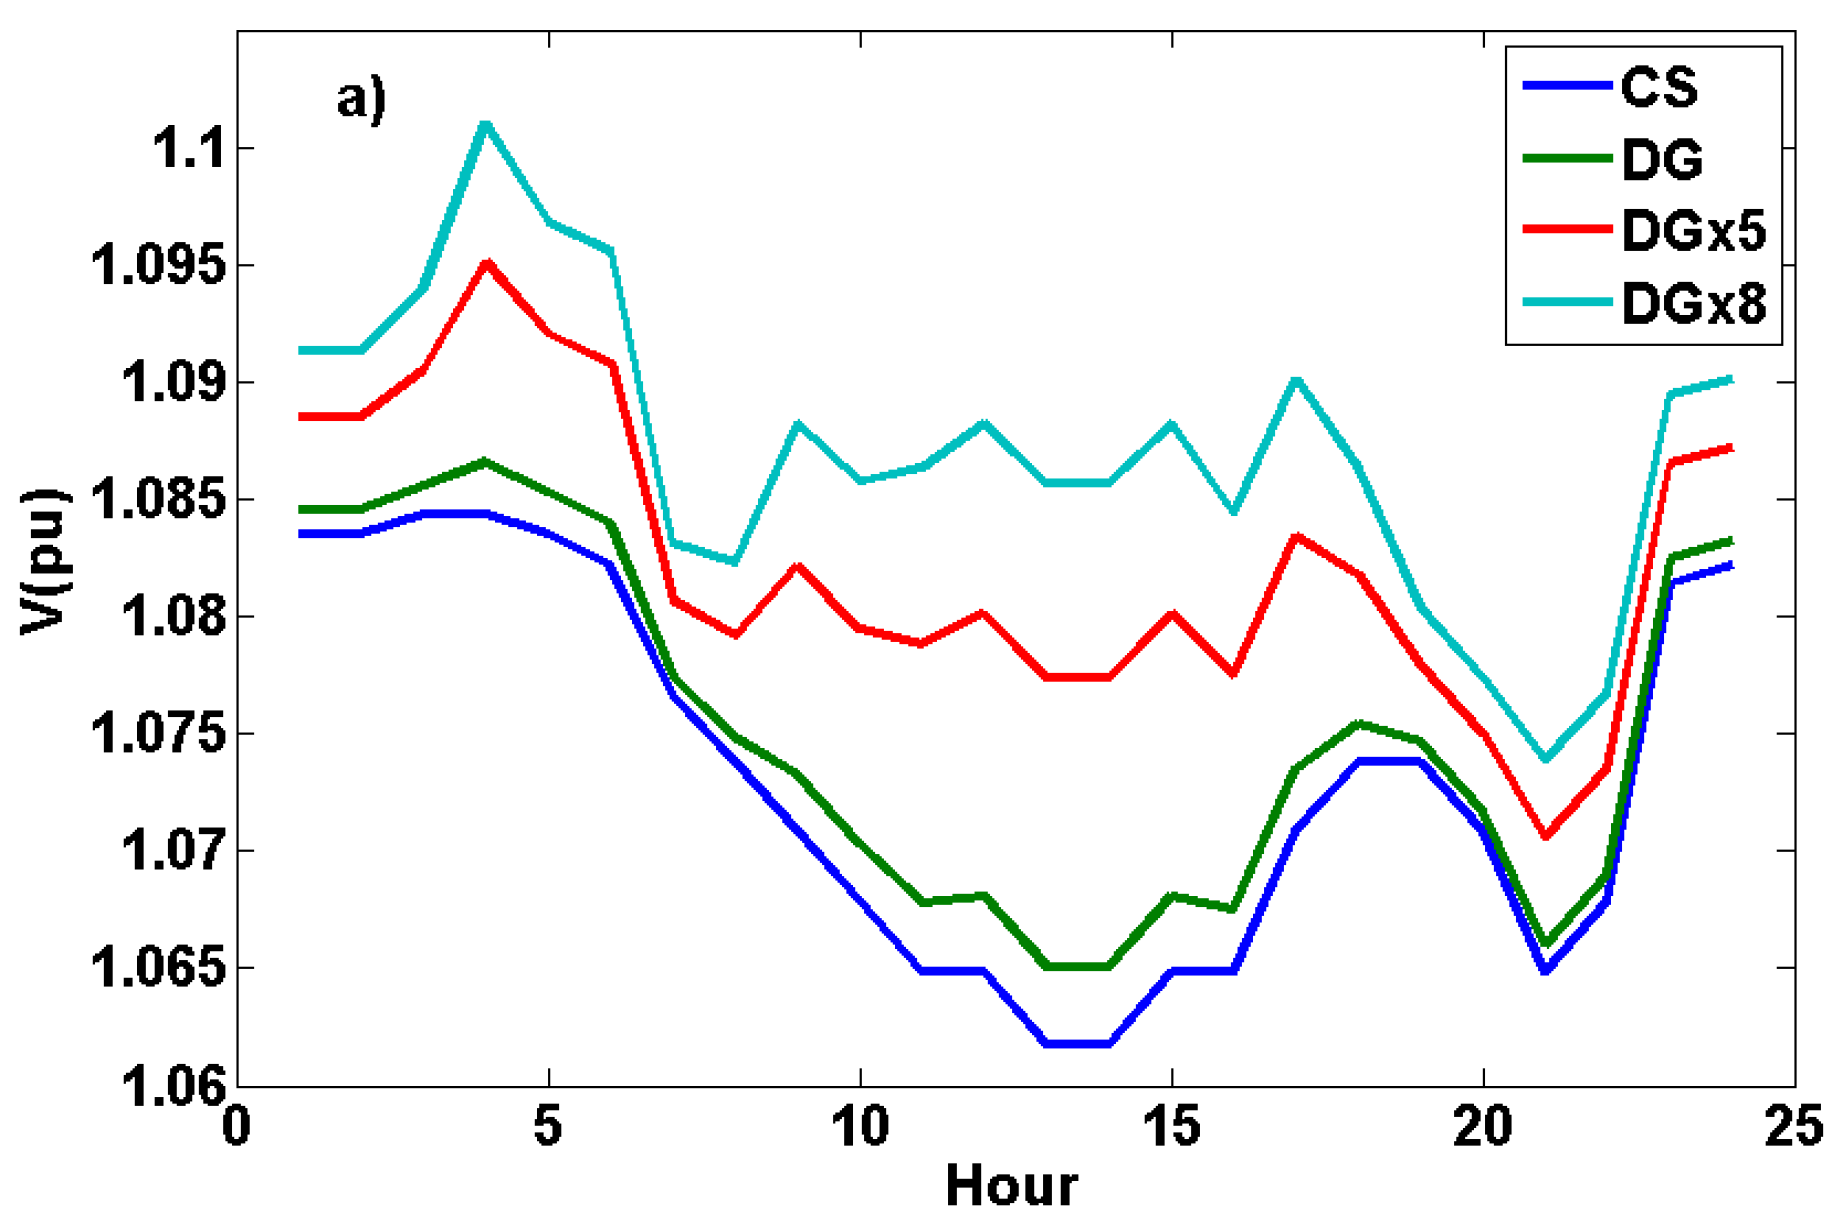
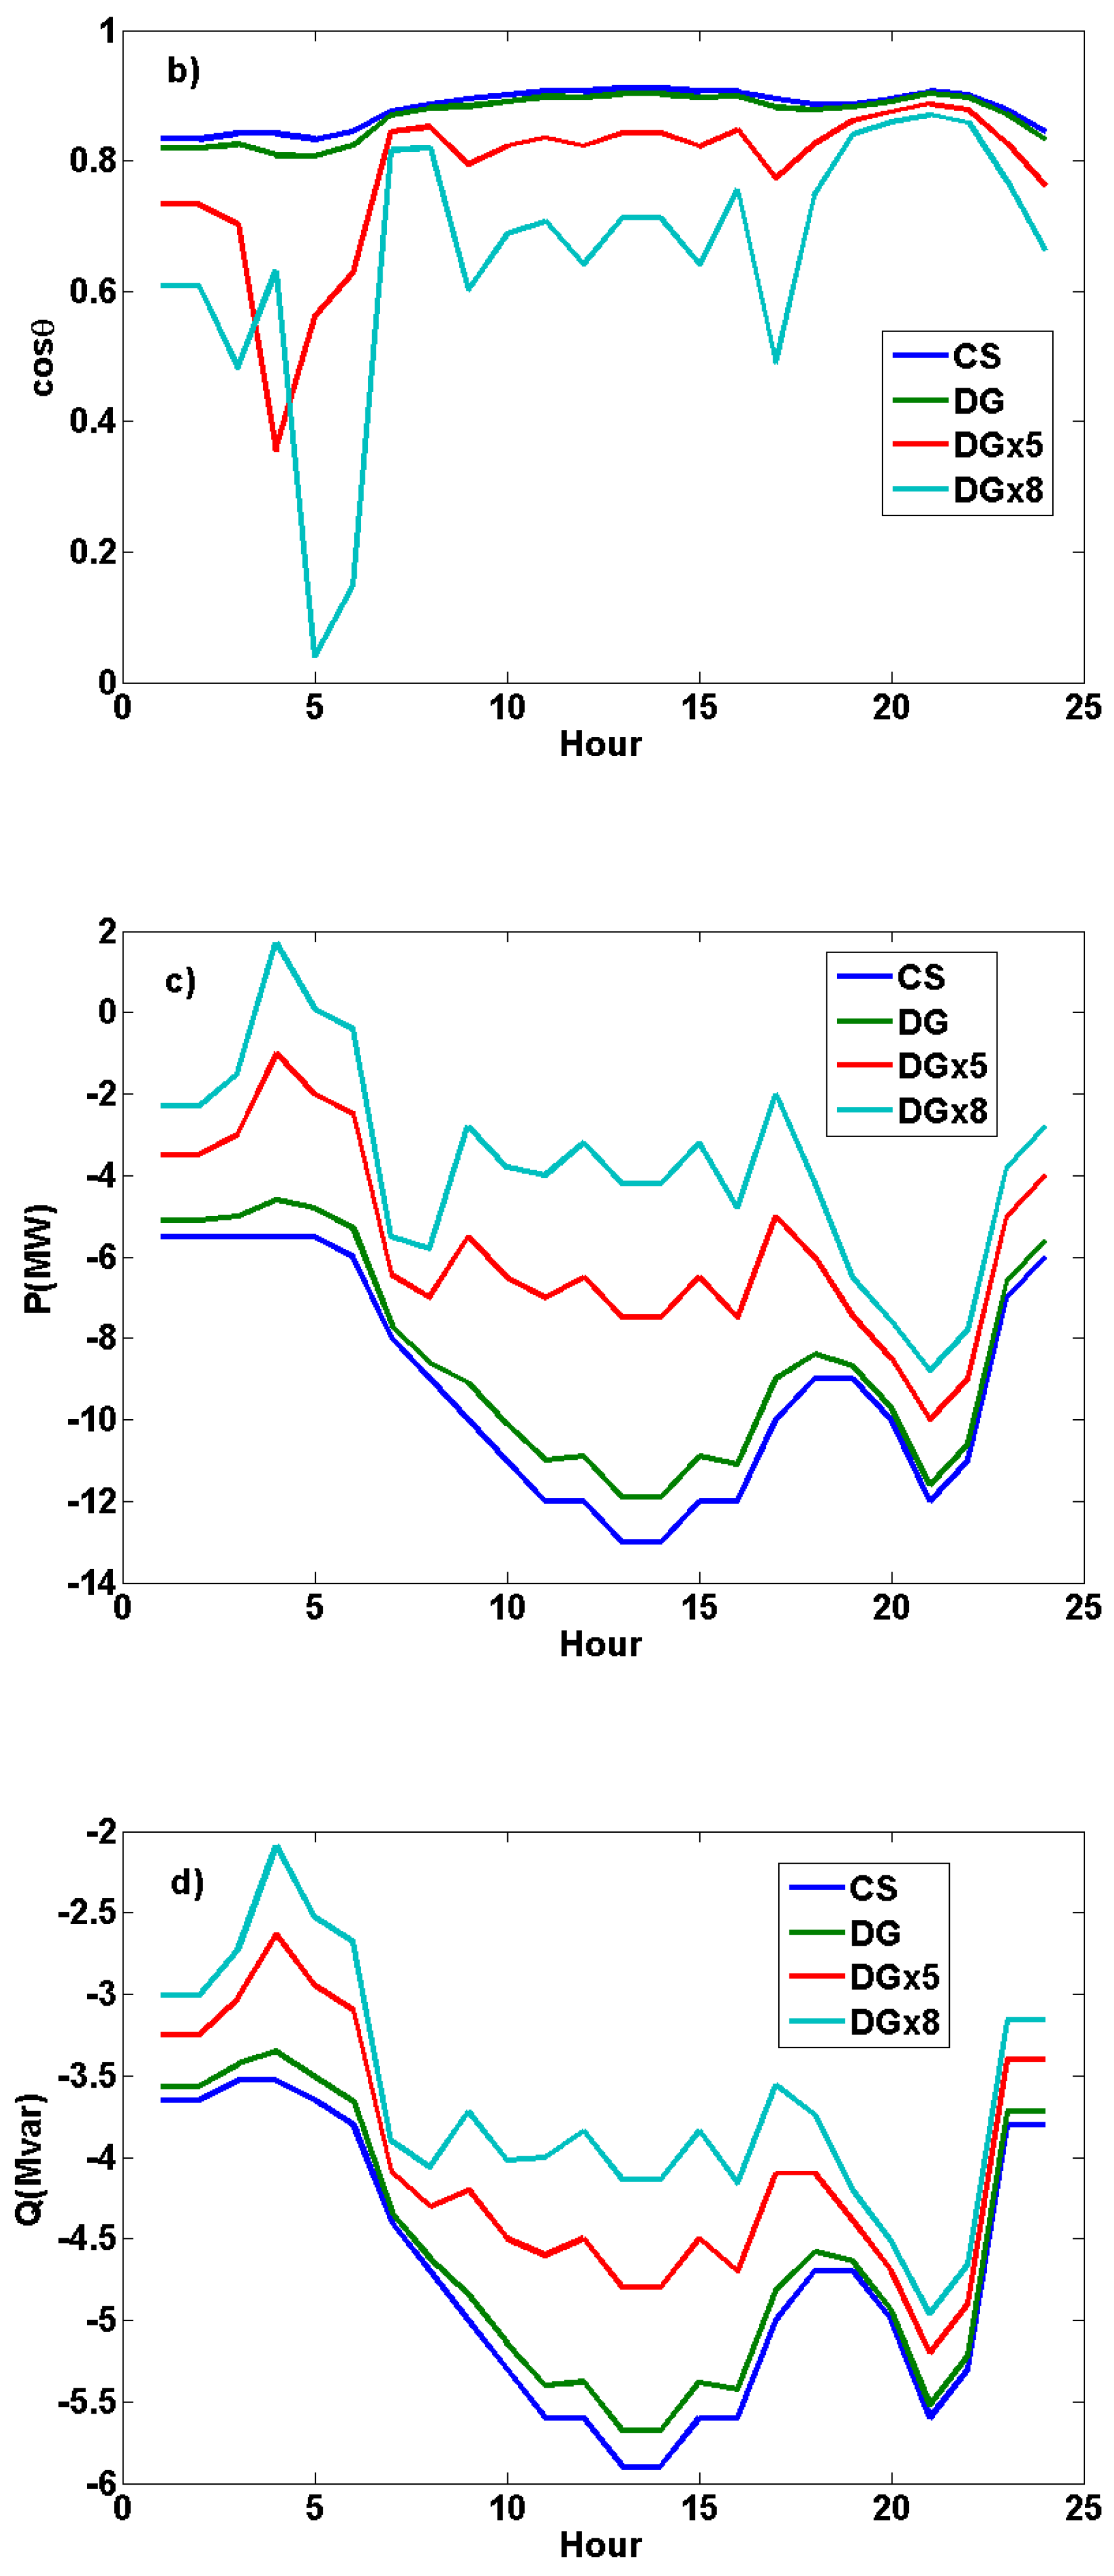
Figure 8.
(a) 24-hour voltage levels, (b) power factors (c,d) active and reactive power profiles calculated for Bus-10.
Figure 8.
(a) 24-hour voltage levels, (b) power factors (c,d) active and reactive power profiles calculated for Bus-10.
5. Conclusions
In this study, dynamic load flow analyses were performed throughout the day under conditions of intermittent distributed generation and variable electricity demand, and hourly changes in the electrical parameters of the buses were calculated. Thus, the effects of intermittent generation from sources with interruptions on the stability of the voltage and power factor of the buses against the varying electricity demand during the day were analyzed.
In these analyses, it was observed that renewable distributed sources had no significant adverse effect on voltage-level stability. This was because the energy balance was maintained throughout the entire system. Energy balance refers to the condition under which the power consumed in the system, including losses, is equal to the power drawn from the generators. The addition of distributed renewable sources to the bus has only reduced the power flow from other source buses to this bus because of this energy balance. Thus, the preservation of the bus voltage level was ensured. However, when the local renewable source meets a significant portion of the consumption, it may affect the total active and reactive bus power of the connected bus and cause instantaneous changes in the bus power factor owing to its active and reactive power characteristics. Taking measures to compensate for the power factor changes during periods when intermittent local sources provide high production will be sufficient to maintain bus power factor stability. For this purpose, limiting the reactive power production of renewable local sources under high production conditions can maintain power factor stability.
This study also indicates that as the power demand from the grid increases, the rate of change in voltage throughout the day also increases at the load buses and transition buses. On the other hand, while the increase in the power demand from the grid significantly increases the intra-day power factor change rate in the production buses, it does not affect the intra-day power factor change rate in the other buses. Additionally, the bars containing Bitcoin mining operations, which experience low fluctuations in power consumption throughout the day, have been observed to exhibit the lowest intra-day power factor change values.
These types of analysis methods are crucial for solving problems that may arise during the management of power systems with intermittently distributed sources. In dynamic power system models defined by average production and power demand profiles, it may be possible to predict load flow imbalances and quality disturbances in power distribution in advance through hourly or even lower sampling period load flow analyses. Thus, 24-hour power management plans involving preventive measures can be made more reliable.
Author Contributions
Conceptualization, O. G.; methodology, software, validation, formal analysis, investigation, resources, writing—original draft preparation, writing—review and editing. All authors have read and agreed to the published version of the manuscript.
Funding
This research received no external funding.
Data Availability Statement
Data are available upon reasonable request.
Conflicts of Interest
The author declare no conflicts of interest.
References
- Treiblmaier, H. A comprehensive research framework for Bitcoin’s energy use: Fundamentals, economic rationale, and a pinch of thermodynamics. Blockchain:Research and Applications, 2023. [CrossRef]
- Lotfi, R.; Zare, S. G.; Gharehbaghi, A.; Nazari, S.; Weber, G-W. Robust optimization for energy-aware cryptocurrency farm location with renewable energy. Computers & Industrial Engineering, 2023, 177. [CrossRef]
- Yin, W.; Ji J.; Qin, X. Study on optimal configuration of EV charging stations based on second-order cone. Energy, 2023, 284. [CrossRef]
- Tabar, V.S.; Ghassemzadeh, S.; Tohidi, S. Risk-based day-ahead planning of a renewable multi-carrier system integrated with multi-level electric vehicle charging station, cryptocurrency mining farm and flexible loads. Journal of Cleaner Production, 2022 380(1). [CrossRef]
- Peças Lopes, J.A.; Hatziargyriou N.; Mutale, J.; Djapic, P.; Jenkins, N., Integrating distributed generation into electric power systems: A review of drivers, challenges and opportunities. Electric Power Systems Research, 2006, 7(9), pp.1189-1203. [CrossRef]
- Wang, K.; Zhang, Z.; Kim HS. ReviewChain: Smart Contract Based Review System with Multi-Blockchain Gateway. 2018 IEEE International Conference on Internet of Things (iThings) and IEEE Green Computing and Communications (GreenCom) and IEEE Cyber, Physical and Social Computing (CPSCom) and IEEE Smart Data (SmartData); 2018.
- Wang, X.; Yang, W.; Noor, S.; Chen, C.; Guo, M.; Dam Khv. Blockchain-based smart contract for energy demand management, Energy Procedia, 2019, 168, 2719-2724. [CrossRef]
- Shafiei, M.; Ghasemi-Marzbali, A. Fast-charging station for electric vehicles, challenges and issues: a comprehensive review. J. Energy Storage, 2022, 49. [CrossRef]
- García-Villalobos, J.; Zamora, I.; San Martín, J.L.; Asensio F.J; Aperribay, V. Plug-in electric vehicles in electric distribution networks: A review of smart charging approaches. Renew. Sustain. Energy Rev. 2014, 38, 717–731. [CrossRef]
- Rodriguez-Calvo, A.; Cossent R.; Frías, P. Integration of PV and EVs in unbalanced residential LV networks and implications for the smart grid and advanced metering infrastructure deployment. Int. J. Electr. Power Energy Syst. 2017, 91, 121–134. [CrossRef]
- Li, J.; Li, N.; Peng, J.; Cui, H.; Wu, Z. Energy consumption of cryptocurrency mining: A study of electricity consumption in mining cryptocurrencies. Enegry, 2019, 168, 1189-1203. [CrossRef]
- Kaygusuz, A.; Gül, O.; Alagöz, B.B. An analysis for impacts of renewable distributed generation conditions on the load flow stability of electrical power system. EMO Bilimsel Dergi: Elektrik, Elektronik, Bilgisayar, Biyomedikal Mühendisliği Bilimsel Dergi. 2012, 2(4), 77-85.
- Tinney, W. F.; Hart, C. E. Power Flow Solution by Newton's Method, 1967, IEEE Trans. Power App. Syst., 86, 1449-1460.
- R. D. Zimmerman, R. D.; Chiang, H. D. Fast Decoupled Power Flow for Unbalanced Radial Distribution Systems, 1995 IEEE PES Winter Meeting, New York, 95, 1995.
- Stott B.; Alsaq, O. Fast Decoupled Load Flow. IEEE Transactions on Power Apparatus and Systems, 1974, 3, 859-869.
- Moorthy, S.; Al-Dabbagh, M.; Vawser, M. Improved Phase–Cordinate Gauss-Seidel Load Flow Algorithm,, 1995, Electric Power System Research, 34, 91- 95.
- Zang W.; Liu, Y. Reactive Power Optimization Based on PSO in a Partical Power System. Power Engineering Society General Meeting, 2004 IEEE, Denver, CO, USA, 2004, 1, 239-243.
- Vlachogiannis, J. Q. Fuzzy Logic Application in Load Flow Studies. IEE Proc. Generation, Transmission and Distribution, 2001, 148, 1, 34-40. [CrossRef]
- Storn R.; Price, K. Differential Evolution-a Simple and Efficient Heuristic for Global Optimization over Continuous Spaces, 1997, Journal of Global Optimization, 11, 341-359.
- Li, Z.; Shi, J.; Liu, Y. Distributed Reactive Power Optimization and Programming for Area Power System. International Conference on Power System Technology, POWERCOM 2004, Singapore, 2004, 2, 1447-1450.
- Wei, H.; Cong, Z.; Jingyan, Y.; Jianhua, Z.; Zifa, L.; Zhilian, W.; Dongli, P. Using Bacterial Chemotaxis Method for Reactive Power Optimization. 2008 IEEE/PES Transmission and Distribution Conference and Exposition, Chicago, Illinois, USA, April 2008, 1-7.
- Shirmohammadi, D.; Hong, H. W. ; Semlyen, A.; Luo, G. X. Compensation-Based Power Flow Method for Weakly Meshed Distribution and Transmission Networks. IEEE Transactions on Power Systems, 1988, 3, 753-762.
- Absar, M. N.; Islam, M. F.; Ahmed, A. Power quality improvement of a proposed grid-connected hybrid system by load flow analysis using static var compensator, Heliyon, 2023, 9(7). [CrossRef]
- Saadat, H. Power Systems Analysis, McGraw Hill, Boston, 1999.
- Bayat, M.; Koushki, M. M.; Ghadimi, A. A.; Véliz, M. T.; Jurado, F. Comprehensive enhanced Newton Raphson approach for power flow analysis in droop-controlled islanded AC microgrids. 2022, International Journal of Electrical Power & Energy Systems, 143. [CrossRef]
- Zhong, X.; Xin Li, G.; Zhng, C. False data injection in power smart grid and identification of the most vulnerable bus; a case study 14 IEEE bus network. Energy Reports, 2021,7, 8476-8484. [CrossRef]
Figure 1.
Calculation steps flow diagram for 24-Hour load flow analysis.
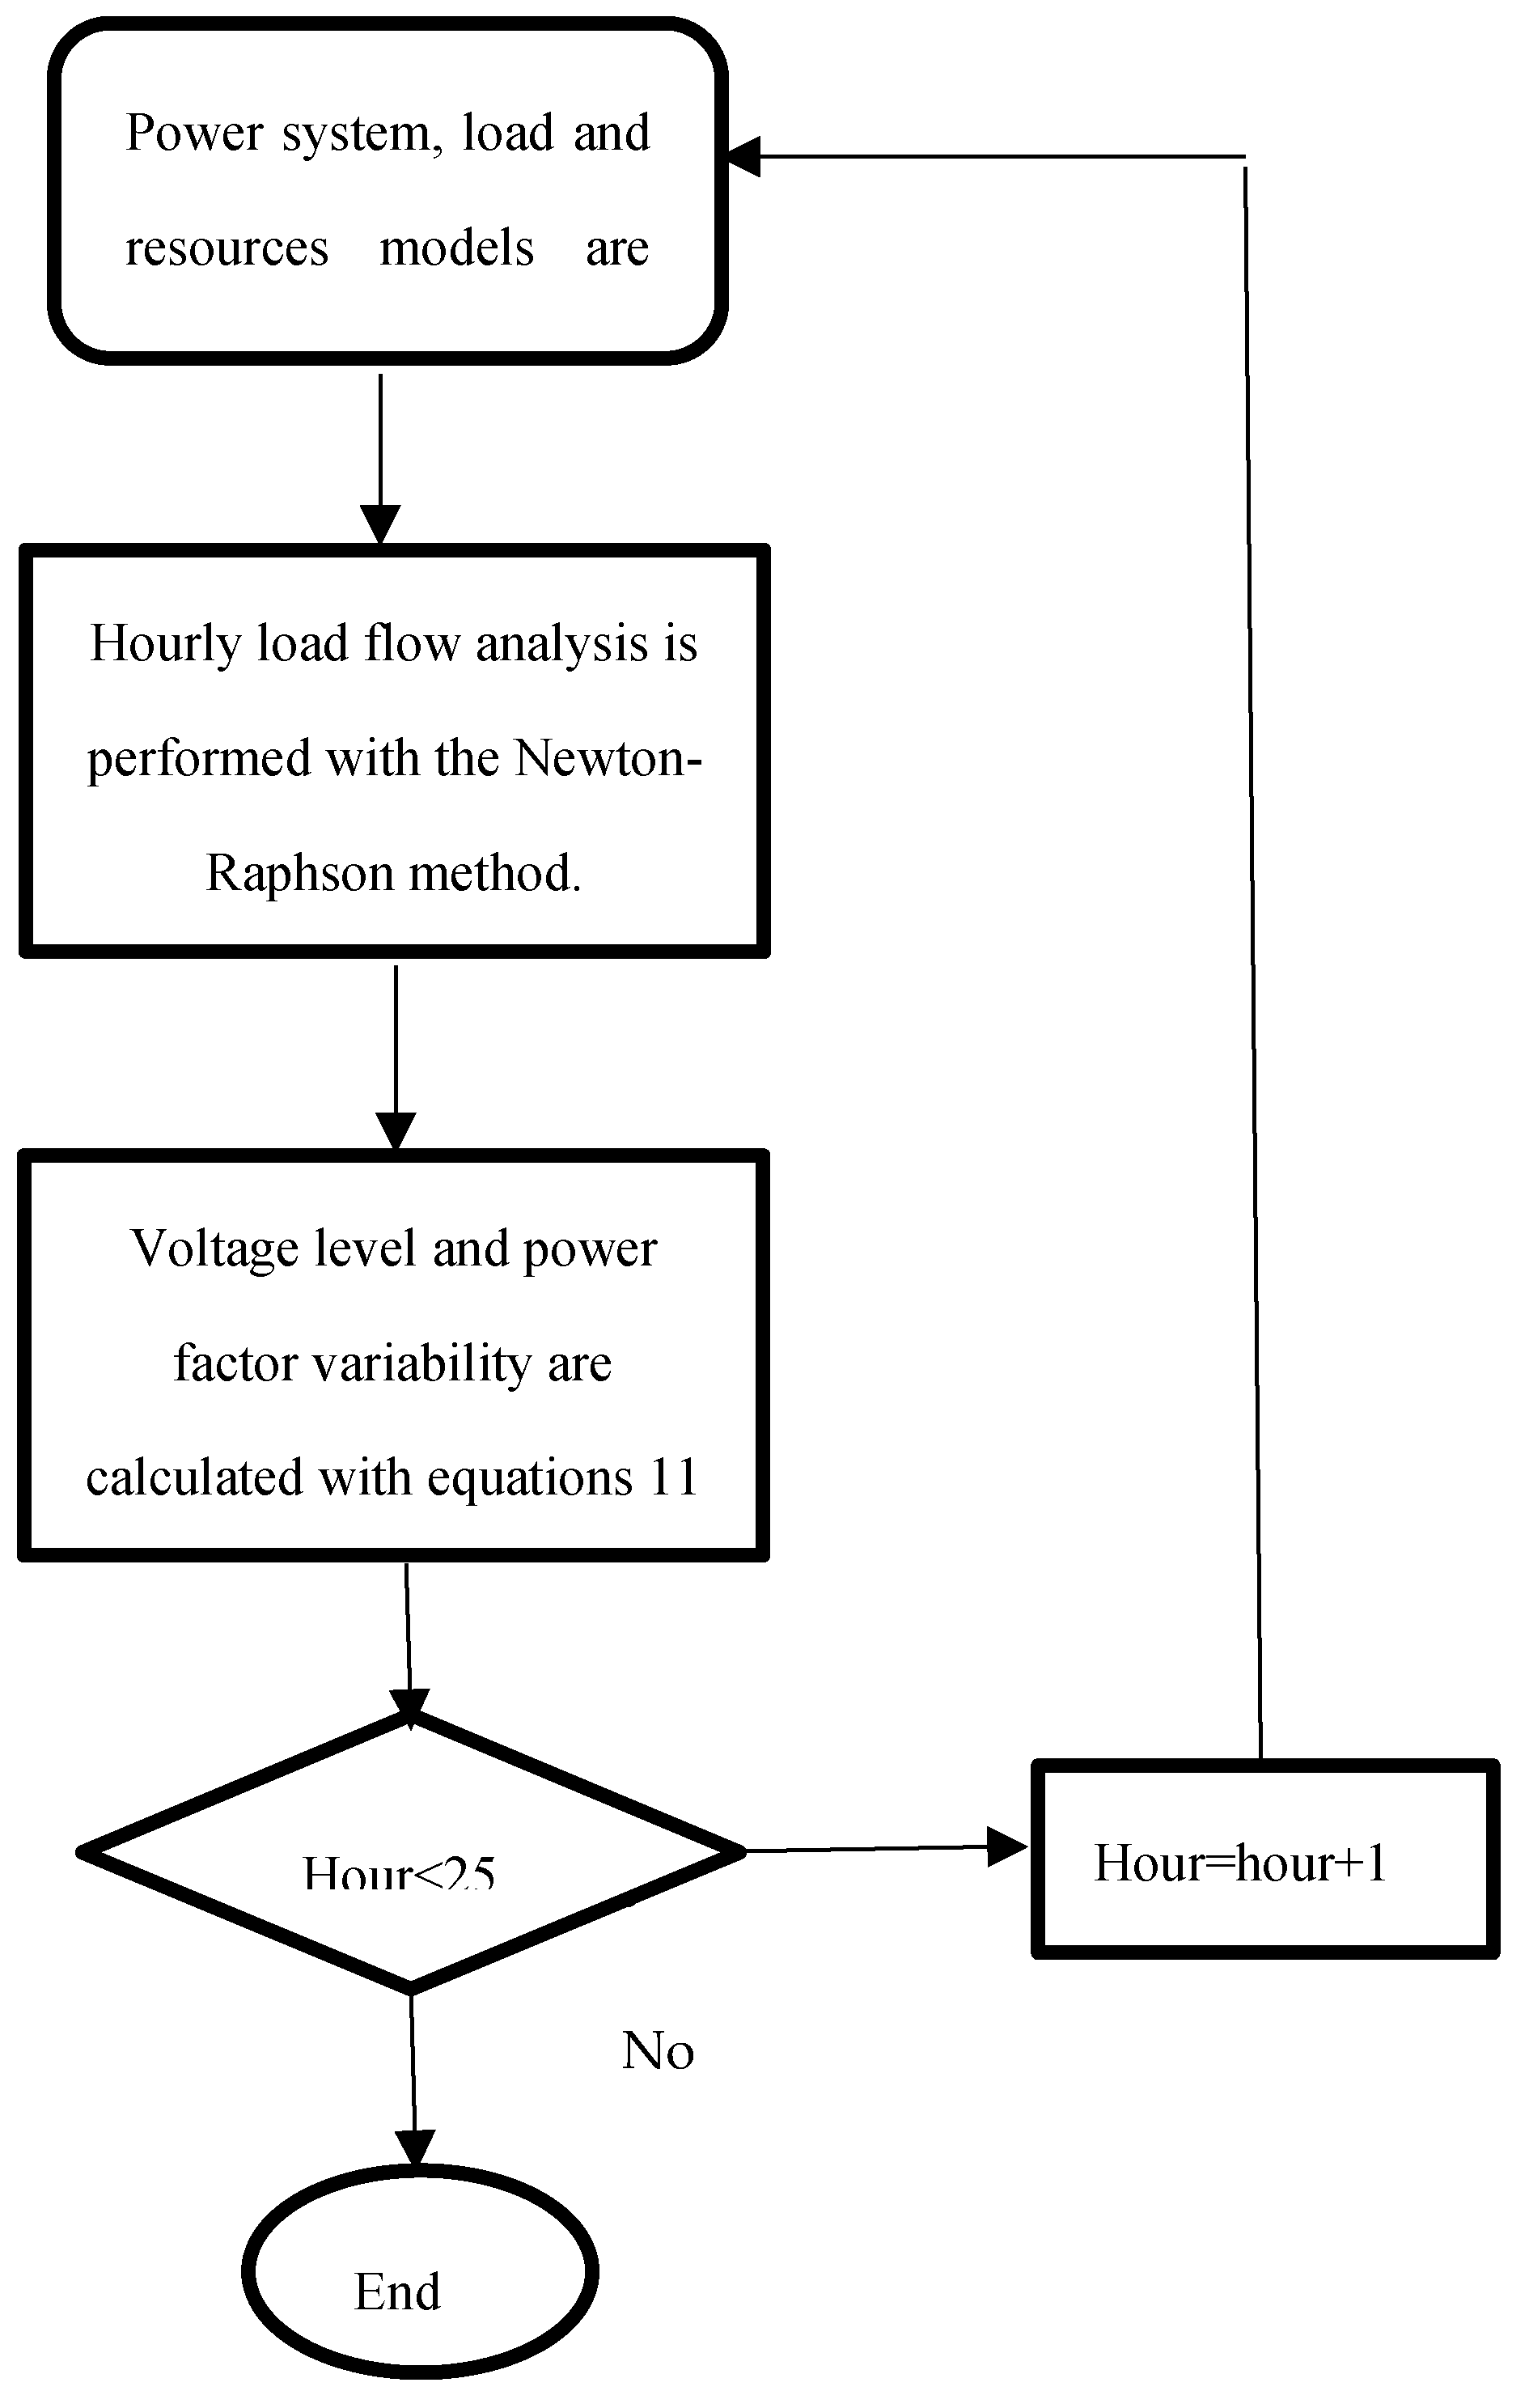
Figure 2.
IEEE 14-bus test system for example application.
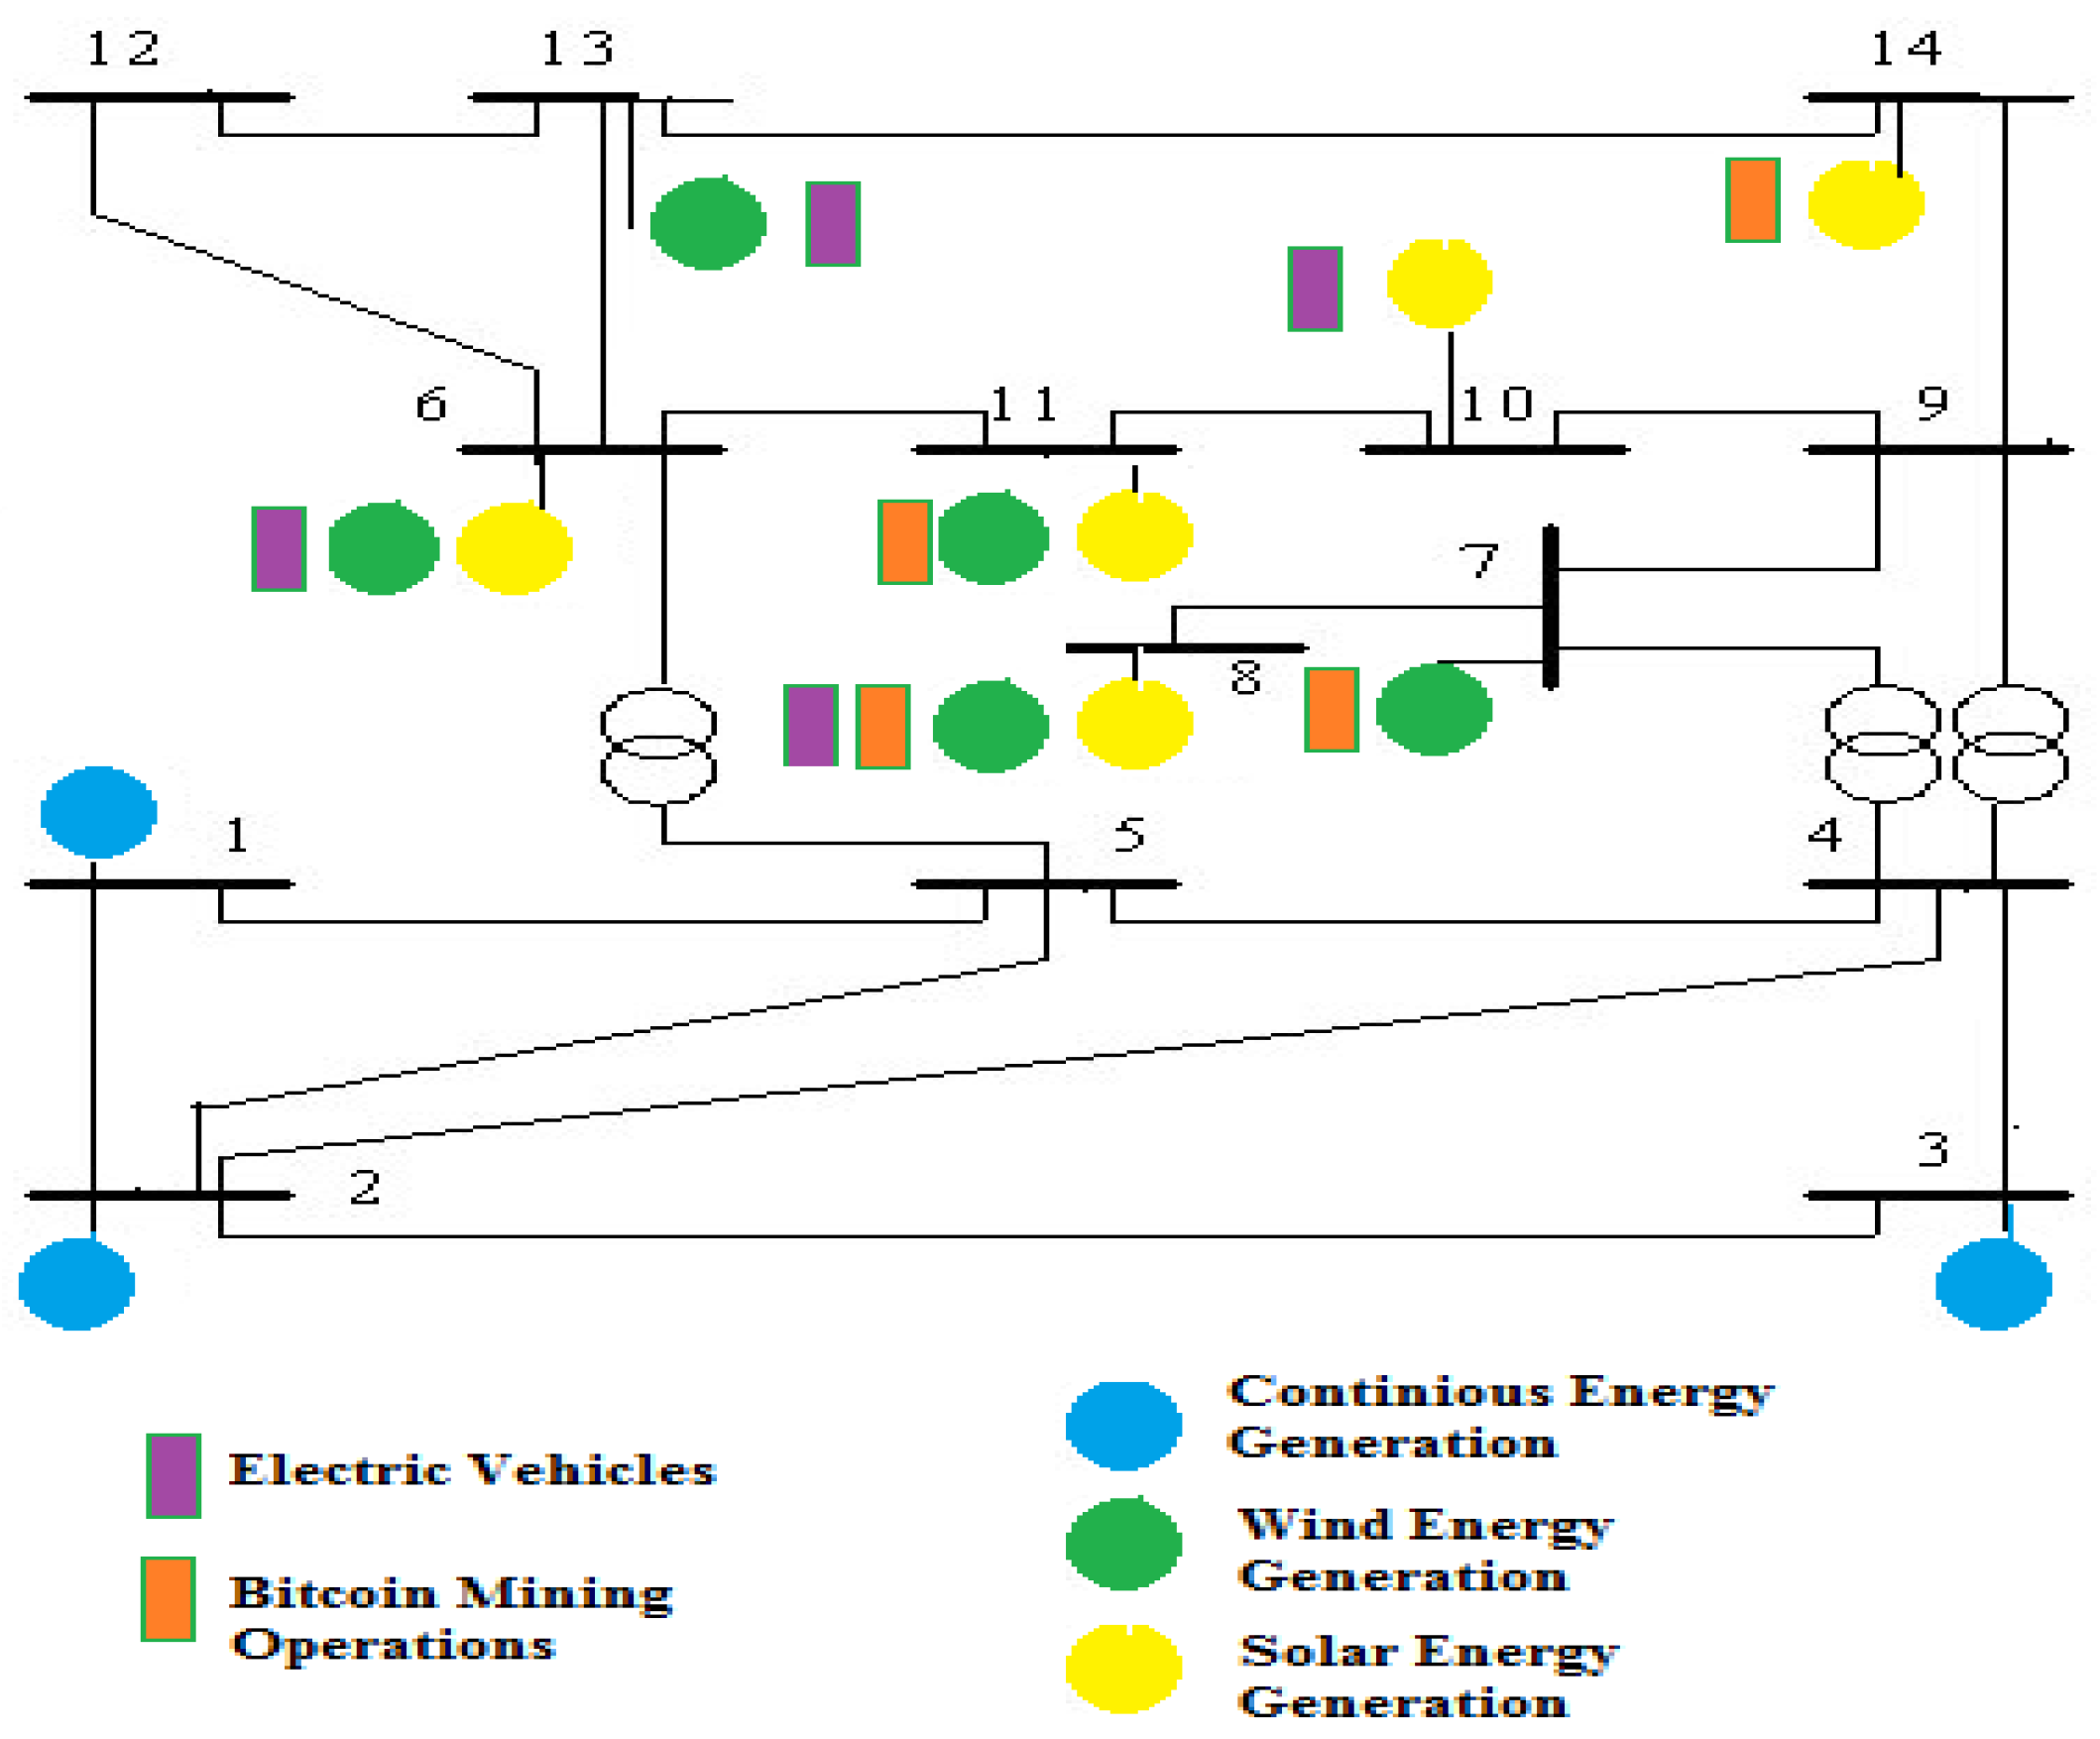
Figure 3.
(a) Low-variation load demand profile (PL1, QL1) that models the power consumption of Bitcoin mining operation. (b) High variability load demand profile (PL2, QL2), modeling EV power consumption.
Figure 3.
(a) Low-variation load demand profile (PL1, QL1) that models the power consumption of Bitcoin mining operation. (b) High variability load demand profile (PL2, QL2), modeling EV power consumption.
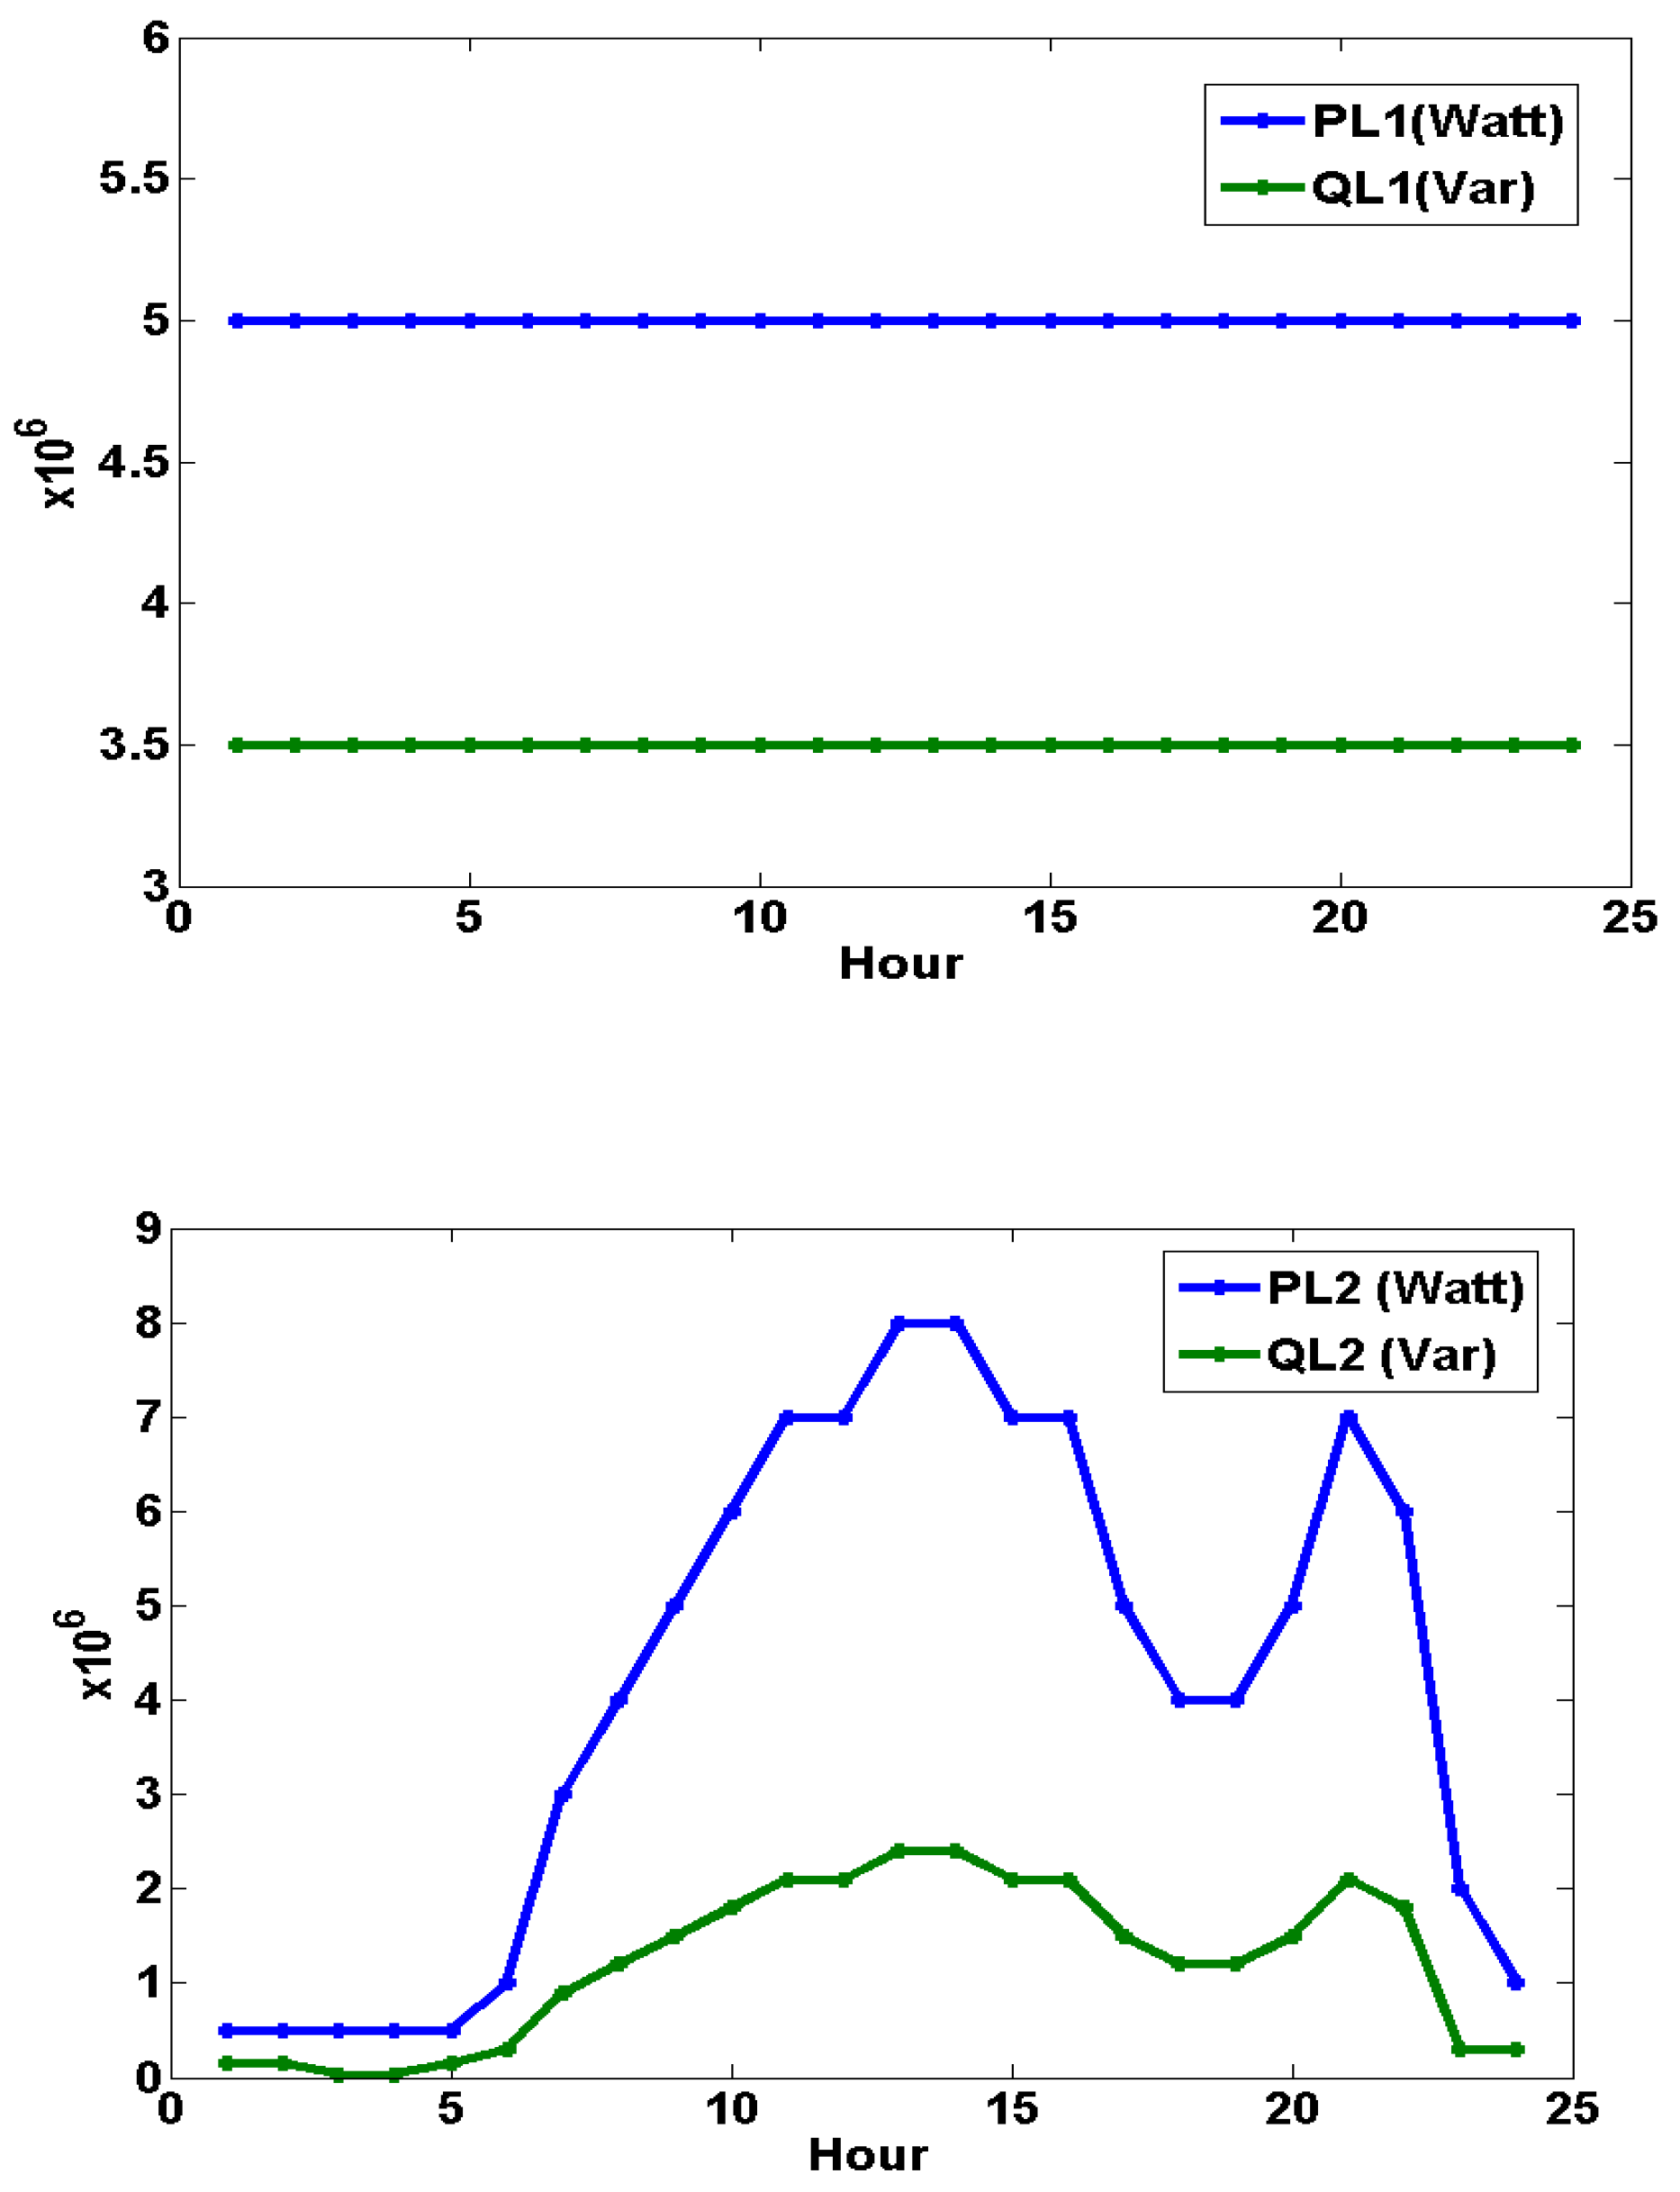
Figure 4.
(a) Continuous energy resources production profile (GP1, GQ1) (b) Solar energy resources production profile (GP2, GQ2) (c) Wind energy resources production profile (GP3, GQ3.
Figure 4.
(a) Continuous energy resources production profile (GP1, GQ1) (b) Solar energy resources production profile (GP2, GQ2) (c) Wind energy resources production profile (GP3, GQ3.
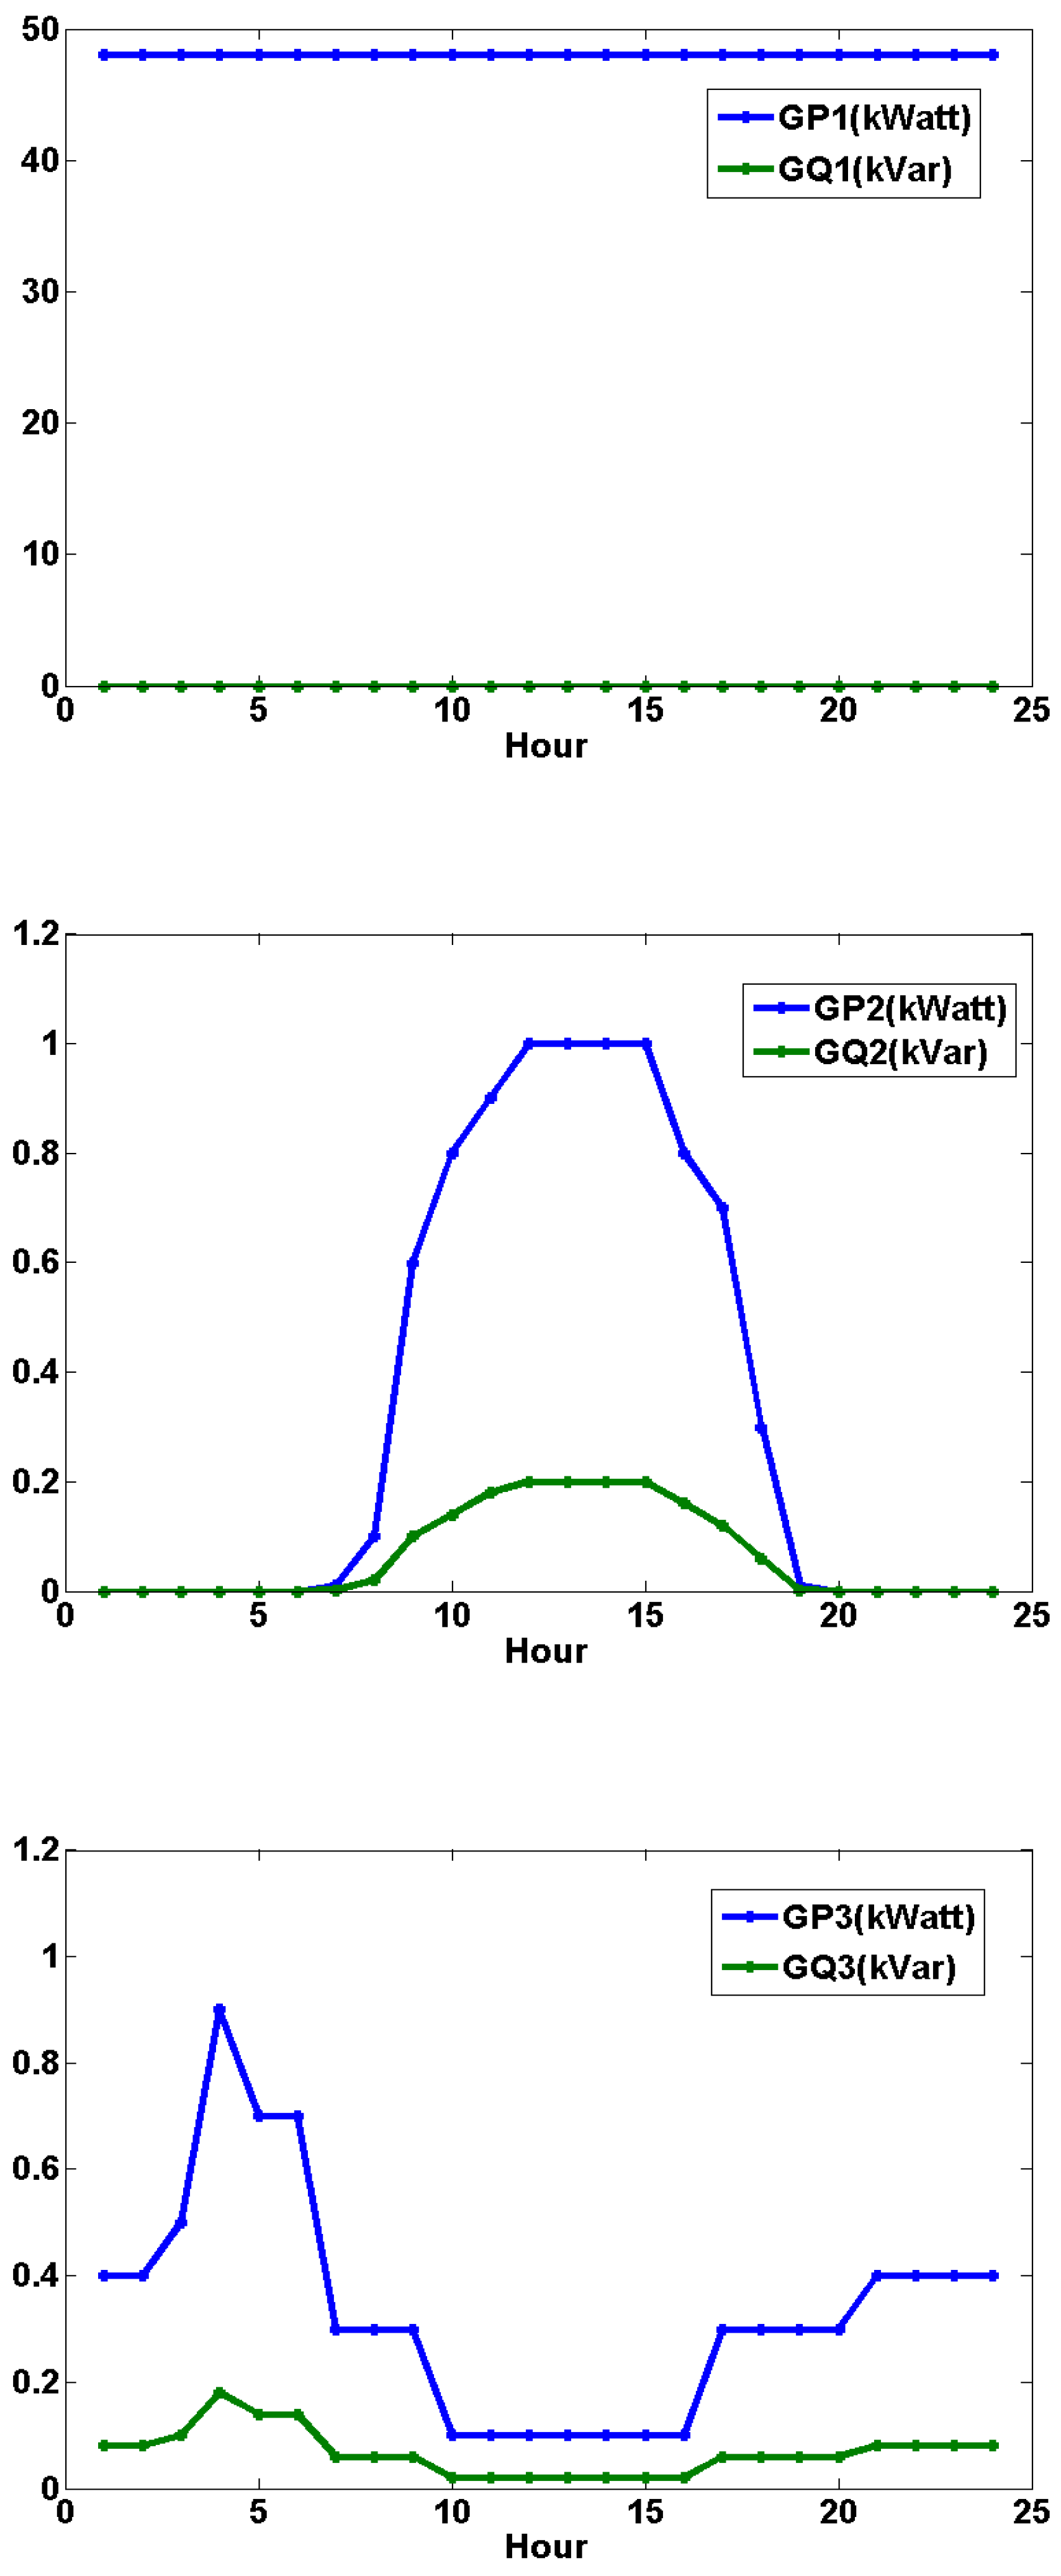
Figure 5.
(a) 24-hour profiles of bus voltage levels obtained in the CS scenario analysis of the IEEE-14 bus test system. (b) Daily voltage variations of the buses. (c) Daily power factor variations of the buses.
Figure 5.
(a) 24-hour profiles of bus voltage levels obtained in the CS scenario analysis of the IEEE-14 bus test system. (b) Daily voltage variations of the buses. (c) Daily power factor variations of the buses.
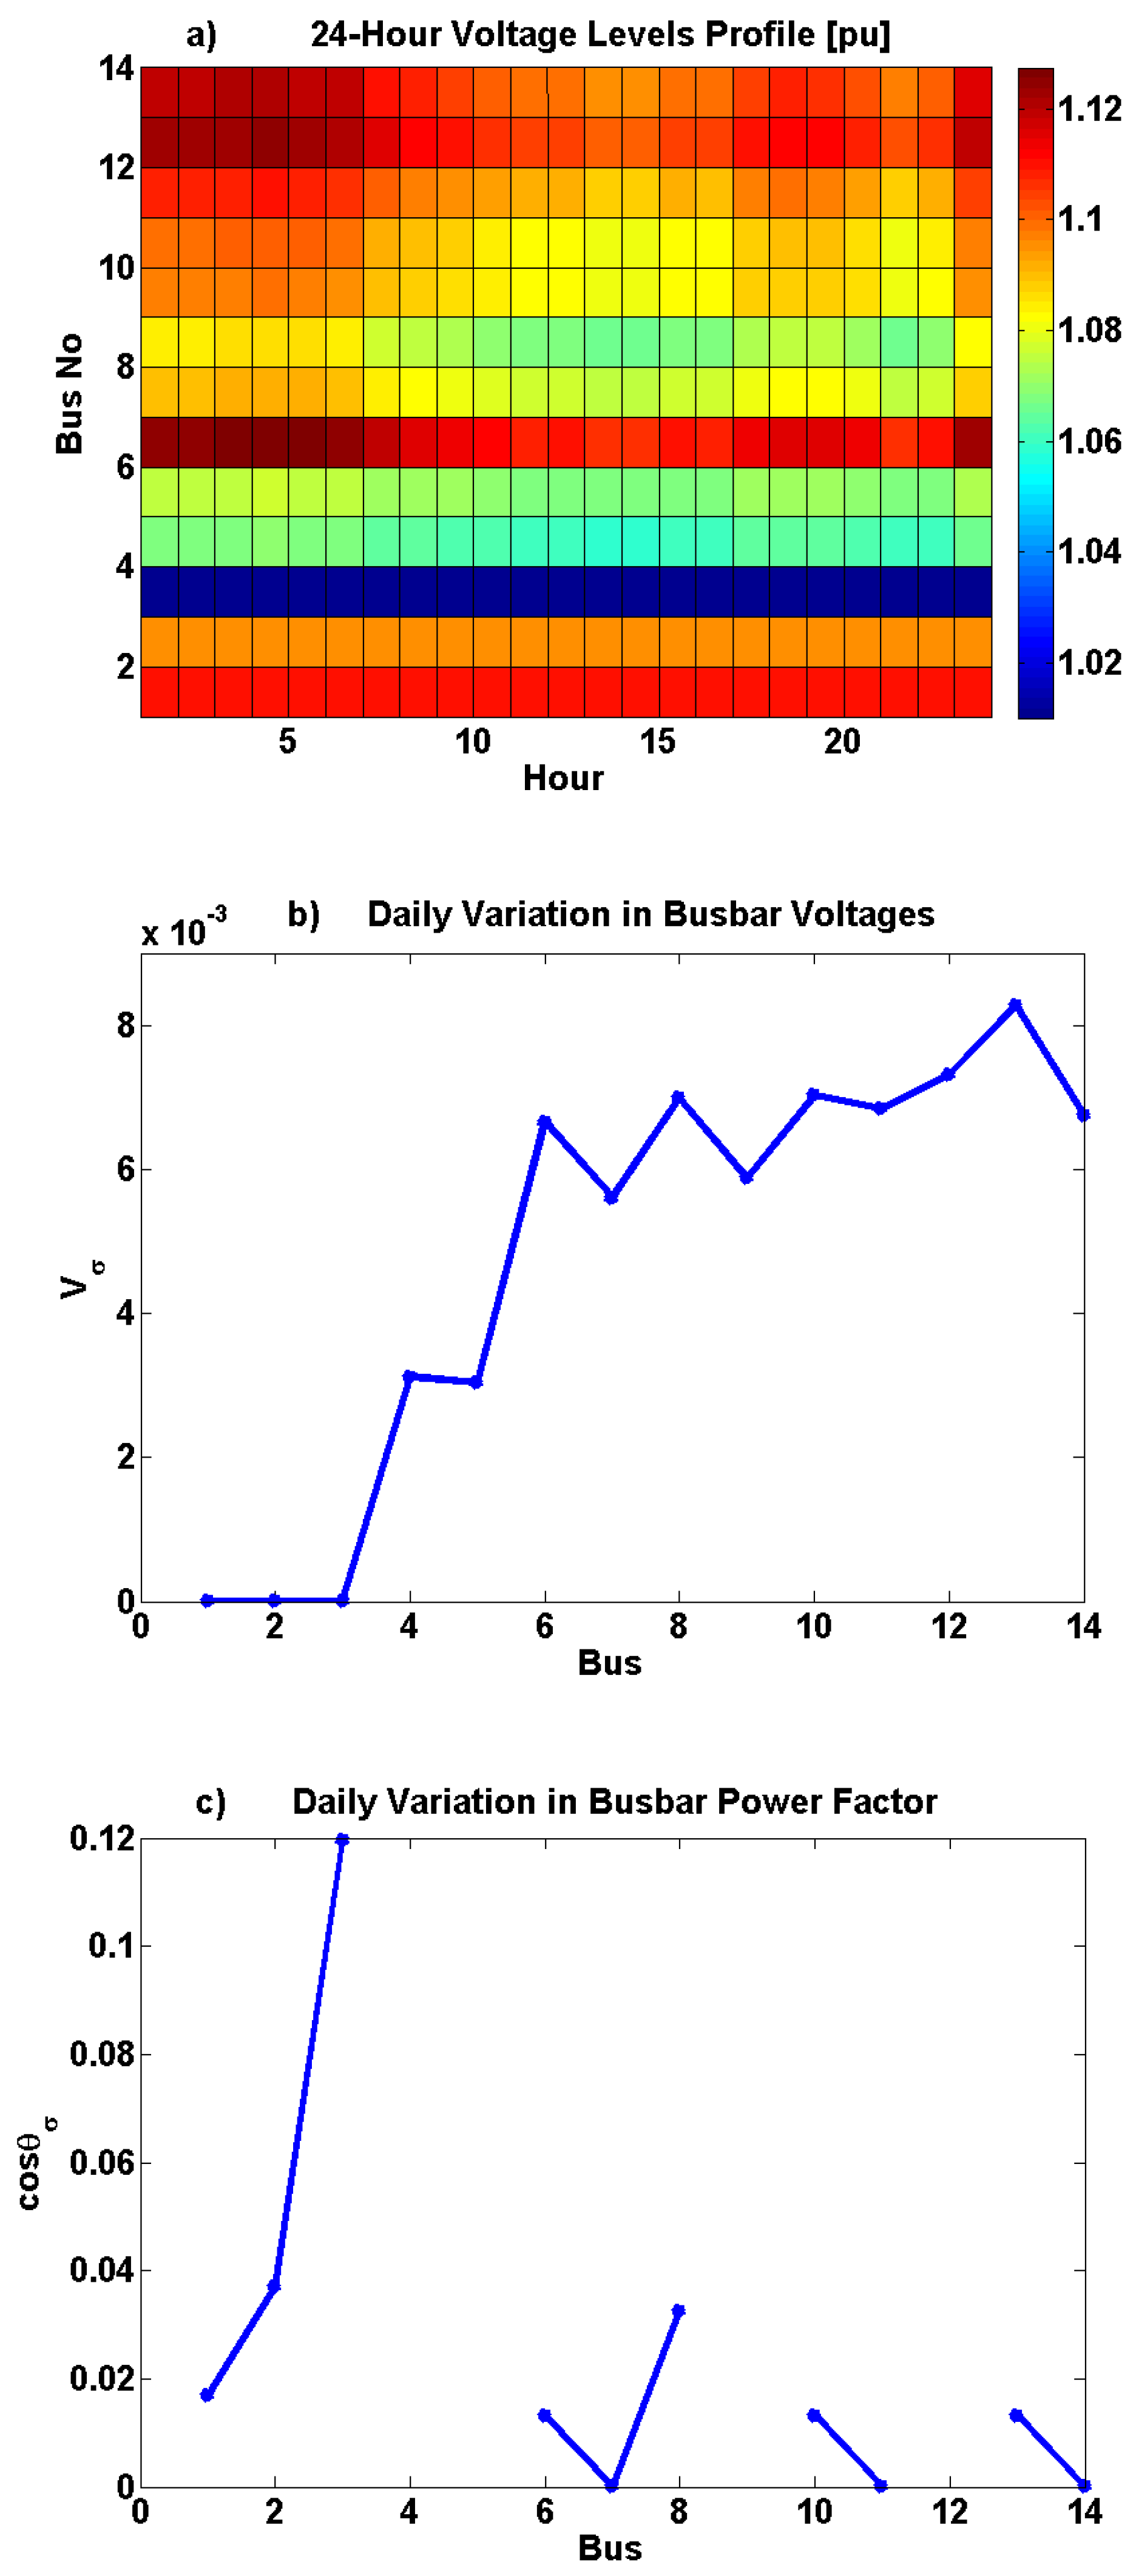

Table 1.
Comparison of daily voltage variations and power factor variations obtained in the 24-hour load flow analysis for CS, LDx3 and LDx7 energy status scenarios in the IEEE 14-bus power system.
Table 1.
Comparison of daily voltage variations and power factor variations obtained in the 24-hour load flow analysis for CS, LDx3 and LDx7 energy status scenarios in the IEEE 14-bus power system.
|
Bus No |
Vσ(CS--LDx3--LDx7) | cosθσ(CS--LDx3--LDx7) |
| 1 | %0--%0--%0 | %1.6--%13--%68 |
| 2 | %0--%0--%0 | %3.6--%16--%98 |
| 3 | %0--%0--%0 | %12--%50--%30 |
| 4 | %0.35--%2--%10.6 | %--%--%-- |
| 5 | %0.32--%2.5--%11.2 | %--%--%-- |
| 6 | %0.7--%4.6--%8.3 | %1.3--%1.3--%1.3 |
| 7 | %0.6--%4.3--%51.7 | %0.01--%0.01--%0.01 |
| 8 | %0.7--%5.2--%22.05 | %3.2--%3.2--%3.2 |
| 9 | %0.6--%4.4--%32.57 | %--%--%-- |
| 10 | %0.7--%5--%7.89 | %1.3--%1.3--%1.3 |
| 11 | %0.68--%5--%6.89 | %0.01--%0.01--%0.01 |
| 12 | %0.77--%4.9--%8.8 | %--%--%-- |
| 13 | %0.87--%5.36--%31.3 | %1.3--%1.3--%1.3 |
| 14 | %0.75--%5.16--%31.4 | %0.01--%0.01--%0.01 |
Table 2.
Comparison of daily voltage variations and power factor variations obtained in the 24-hour load flow analysis for DG, DGx5 and DGx7 energy status scenarios in the IEEE 14-bus power system.
Table 2.
Comparison of daily voltage variations and power factor variations obtained in the 24-hour load flow analysis for DG, DGx5 and DGx7 energy status scenarios in the IEEE 14-bus power system.
|
Bus No |
Vσ(DG—DGx5—DGx8) | cosθσ(DG—DGx5—DGx8) |
| 1 | %0--%0--%0 | %1.5--%1.3--%1.3 |
| 2 | %0--%0--%0 | %3.3--%2.5--%2.5 |
| 3 | %0--%0--%0 | %9.8--%6.0--%5.8 |
| 4 | %0.31--%0.26--%0.27 | %--%--%-- |
| 5 | %0.30--%0.25--%0.26 | %--%--%-- |
| 6 | %0.66--%0.56--%0.56 | %21.8--%32.5--%16.4 |
| 7 | %0.56--%046--%0.48 | %1.2--%20--%26.3 |
| 8 | %0.69--%0.58--%059 | %3.9--%15.4--%31.2 |
| 9 | %0.58--%0.48--%0.49 | %--%--%-- |
| 10 | %0.70--%0.56--%0.59 | %1.4--%4.3--%41.2 |
| 11 | %0.68--%0.57--%0.63 | %2--%59.5--%36.6 |
| 12 | %0.73--%0.62--%0.62 | %--%--%-- |
| 13 | %0.82--%0.72--%0.71 | %21.3--%21.3--%3.8 |
| 14 | %0.67--%0.54--%0.63 | %2.5--%55.5--%27.5 |
Disclaimer/Publisher’s Note: The statements, opinions and data contained in all publications are solely those of the individual author(s) and contributor(s) and not of MDPI and/or the editor(s). MDPI and/or the editor(s) disclaim responsibility for any injury to people or property resulting from any ideas, methods, instructions or products referred to in the content. |
© 2025 by the authors. Licensee MDPI, Basel, Switzerland. This article is an open access article distributed under the terms and conditions of the Creative Commons Attribution (CC BY) license (http://creativecommons.org/licenses/by/4.0/).
Copyright: This open access article is published under a Creative Commons CC BY 4.0 license, which permit the free download, distribution, and reuse, provided that the author and preprint are cited in any reuse.


