Submitted:
24 January 2025
Posted:
26 January 2025
Read the latest preprint version here
Abstract
Copper Mountain Mine tailings dam slope stability research based on recommendations of the 2021 Tetra Tech Dam Safety Review, including computation of tailings dam factors of safety, satellite imagery, steady state and transient seepage analyses, assessment of internal erosion risk, and flow liquefaction hazard analysis. Dam topographic information provided by foundation investigation and annual dam safety inspection reports is used to specify 3D dam models and compute dam factors of safety that satisfy normal operating requirement but are in possible violation of post-seismic requirement.
Keywords:
tailings dam
; foundation investigation
; seepage analysis
; internal erosion
; flow liquefaction
1. Introduction
BRITISH Columbia (BC) has 86 mining sites containing a tailings storage facility (TSF), including 57 sites that are closed or under maintenance, 18 in operation, and 11 with planned future storage facility usage [Emerman, 2022a]. While annual productivity of BC’s mining industry, valued at 7.3 billion Canadian dollars in 2023 according to the BC Government, remains a vital source of wealth for various communities within the province, previous tailings storage facility breaches in Canada and elsewhere provide examples of the human and environmental consequences that can result from TSF failures [Office of the Premier, 2024]. These examples include the breach of the Mount Polley Mine tailings dam in BC in 2014 resulting in 40 million dollars of cleanup work without charges or financial penalties being levied against Mount Polley Mine owner/operator Imperial Metals, and the failure of the Fundao tailings dam in Brazil in 2015 which resulted in the death of 19 people and charges of manslaughter against 21 executives of Vale and BHP Billiton [Morrison, 2021]. The Fundao tailings dam failure also spread iron ore tailings into the Doce River watershed across 40 municipalities, causing economic and environmental damages approximated at 43.8 billion United States (US) dollars by a public civil action, which might serve as warning to BC residents about the economic and environmental consequences of a tailings dam failure along the Fraser River for which financial insurance does not exist [Foy, 2016, Scarpelin, 2022].
Appreciating that productivity is the first priority of BC’s mining industry, and tailings dam failure is a financial liability for BC residents irrespective of whether or not they work in the mining industry, effective regulation of tailings dam safety standards is all important to ensuring the wealth of the province as a whole. These safety standards, such as the requirement that each tailings dam should have a factor of safety (FoS) no less than 1.5, are provincially legislated by the Health, Safety, and Reclamation Code for Mines in BC, and regulated through Dam Safety Reviews (DSRs) and
Independent Third Party Reviews (ITPRs) [Ministry of Energy, Mines, and Petroleum Resources, 2008]. However, not all Canadian Dam Association TSF safety guidelines are provincially legislated TSF operation requirements, such as the guideline that any dam whose failure is predicted to result in loss of more than 100 human lives should have an annual risk of failure no greater than 0.001 percent, as determined by a professional geophysicist using the Silva-Lambe-Marr method [Emerman, 2022b]. As a result, there exists at least one example of an extreme consequence TSF, namely the Copper Mountain Mine TSF near Princeton BC, for which continued usage is planned to increase the the TSF height through 2027, despite the fact the facility’s annual risk of dam failure has been estimated at 0.1-1 percent. Moreover, the upstream construction of the Copper Mountain Mine TSF dams presents is an established risk factor for dam liquefaction failure, as exemplified by the fact that countries such as Chile have outlawed upstream construction of sand tailings dams [Villavicencio, 2014].
Given the possible consequences of tailings dam failure in BC, it is important for the province’s academic faculty to support ITPRs in regulation of BC Mining Law so BC residents do not assume unreasonable human and economic risks from mining activities and industrial relevance of university geotechnical research is ensured. To this end, it is logical that ITPRs, authorized by the BC Government and tailings dam Engineers of Record based on new information regarding TSF dam slope stability obtained during 5 year periods between consecutive DSRs, allow for involvement of Canadian university faculty with relevant tailings dam engineering specialization. Such ITPR academic involvement could, if financed by the BC public rather than mine owners, allow for more transparent and robust adherence to provincially legislated tailings dam safety standards [Tetra Tech, 2021]. Therefore, the purpose of this article is to provide an example of how academic research, based on DSR recommendations and information regarding TSF dam slope stability obtained between DSR reports, is of value to BC public interests.
The outline of the article is as follows:
- Chapter 2 reviews the Copper Mountain Mine TSF safety record, as documented by the provincially legislated 2021 Tetra Tech DSR and annual dam safety inspections (ADSIs) conducted by the Engineer of Record.
- Chapter 3 reviews the history of TSF foundation investigations, calculates the time required for foundation clay consolidation, and presents Morgenstern-Price FoS computations for West and East Dam cross sections.
- Chapter 4 presents an assessment of TSF beach lengths based on Sentinel-2 satellite image processing.
- Chapter 5 presents TSF drain seepage history, 2023 piezometer data, 2D steady state seepage analyses, and 2D probable maximum flood transient seepage analyses.
- Chapter 6 presents an assessment of TSF dam internal erosion failure modes.
- Chapter 7 presents a 2D analysis of East Dam inclinometer meaurements.
- Chapter 8 presents flow liquefaction hazard analyses for the TSF dams.
- Chapter 9 concludes by discussing whether or not current Copper Mountain Mine TSF dam operation is in compliance with the Health and Reclamation Code for Mines in BC, and the possible utility of different dam rehabilitation operations going forward.
2. TSF Safety Record
This section contains a summary of possible dam safety concerns obtained from the 2021 Tetra Tech dam safety review, with reference to chapters of the current document addressing these possible dam safety concerns [Tetra Tech, 2021]. A list of all items of possible dam safety concern obtained directly from ADSI reports 2014 onwards is also presented.
2021 Tetra Tech DSR Summary:
- Investigations which penetrated into the foundation upstream of the Starter Dam are more limited, with only one or two boreholes which penetrate the foundation materials to a relatively limited depth (less than 10 m). Bechtel (1971) advanced several boreholes in the foundation material prior to the start of mining upstream of the Starter Dams, but it is unclear if these are incorporated into the geologic model used for design. Additional foundation investigation upstream of starter dams would be a benefit to improving accuracy of the foundation material model in these locations. Chapter 3
- Dam stability analyses should use most recent material parameter information, consider impact of ponded water against dam crest during flood event (i.e. beach loss), account for seepage monitoring data suggesting phreatic surface upstream of starter dams is above the tailings/cycloned sand interfaces, account for 3D effect of East Dam valley buttressing on dam stability as necessary to select a representative 2D model cross section of the dam for stability analysis, account for possibility that dams may not be as stable at intermediary stages of construction as they are at their ultimate elevation. Chapters 3, 4, 5, 7, and 8
- No operational piezometers at crests of West or East Dams as necessary for measuring current location of phreatic surface level at dam crests which was increasing prior to 2016. Chapter 5
- Liquefaction hazard presented by water saturation of cycloned sands in downstream slopes should be reviewed. Chapter 8
- Potential for concentrated leaks should be further reviewed. Chapter 6
- Potential for backward erosion piping should be further reviewed. This includes backward erosion piping initiating at dam toes and at dam abutment contacts where internal erosion has been identified as a credible failure mode. Chapter 6
- Potential for contact erosion at West Dam historic rock crest drain and tailings tunnel should be further reviewed. Chapter 6
- Potential for suffusion of foundation material via exit pathways downstream of the dam should be assessed. Chapter 6
- No explanation for inclinometer movements in East Dam since 2018 has been documented. Chapter 7
2014-2022 ADSI Reports Items:
- East Dam rock crest drain pipe is partially buried and clogged with sand at toe area outlet (2014).
- Tailings slimes on East Dam crest drain fabric at north end of drain (2014).
- Borehole drilling indicated lacustrine silt present in West Dam foundation is not continuous as previously assumed, and lacustrine silt is present at East Dam toe (2016).
- East Dam rock crest drain damage scheduled for investigation and repair (2016).
- Minor transverse crack observed on West Dam crest near north abutment (2016).
- Piezometer located in north abutment toe of East Dam shows artesian pressures (2016).
- West Dam toe scheduled for excavation to clean toe drain outlets (2016).
- East Dam seepage water noted 30m downstream of toe drain outlet (2016).
- Minor settlement cracking observed at upstream side of the south abutment of the West Dam (2017).
- Several small sinkholes, less than 0.5m in diameter, were observed at the West Dam where the downstream sand shell contacts the coarse rockfill of the Fresh Water Booster access road (2017).
- West Dam south abutment tunnel plug face half submerged by water, water dripping from the ceiling (2017).
- Dam safety review recommends installing drain at crests of both dams that should be connected to slope drains, and developing beach at West Dam south abutment to prevent ponding of water against dam crest (2017).
- Turbid seepage observed flowing out of East Dam historic rock crest drain outlet pipe where it terminates on top of the sand and gravel filter of the dam toe drain (2018).
- Sand boils observed in the foundation sand and gravel downstream of the end of the toe West Dam drain, indicative of artesian pressures in the sand and gravel foundation (2018).
- Sonic drilling of a single hole in West Dam foundation and two holes in East Dam foundation. Normally consolidated silts and clays verified to exist upstream and downstream of the starter dam (up to 6.9m thick) which represent lacustrine sediments deposited in the original Smelter Lake (2019).
- Tension cracking along north abutment of downstream slope (2019).
- Cycloned sand deposition on West Dam caused gullying and partial burying of sand berm. Slope required regrading to 2:1 (2019).
- Seepage observed on West Dam seepage collection pond slope upstream of monitoring station (2019).
- West Dam rock crest drain flow decreasing indicating that the outlet pipe may be becoming crushed within the dam (2020).
- Observed depression and tension cracking at West Dam south abutment (2020).
- Seepage flow of approximately 40L/s into channel downstream of the West Dam toe drain outlet reported for the first time (2020).
- TSF pond volume measured at 2.5 million cubic meters in December 2021 that exceeds target maximum of 2 million cubic meters (2021).
- More water dripping from ceiling of West Dam tunnel plug than previous inspections (2021).
- East Dam south abutment upstream crest depression and cracking (2021).
- Oversteepened 1.5:1 slopes above East Dam toe drain collector (2021).
- During the onset of 2021 freshet conditions, flow loss observed into the base of the Wolfe Creek Realignment channel within the Upper Wolfe Creek section, downstream of the Copper Mountain Road culvert crossing. The flow loss observation led to channel upgrades to include a liner in a previously unlined area, and localized liner repair work along the channel.
- Increased toe drain flows at both dams observed during January and February (2022).
- Wet spot located on filter material 50m from East Dam collector inlet (2021).
- Depression observed on the East Dam toe drain collector near the inlet with radial cracks in April (2022).
- Localized water saturated zone of cycloned sand observed over the East Dam toe drain collector in May (2022).
- East Dam terminus pond showing silt build up September (2022).
- Downstream slopes of both West and East Dams have oversteepening in localized areas (2023).
- Shotcrete broken off and debris floating in water inside the West Dam tunnel plug (2023).
- Cyclone sand fines observed accumulating at a low point of the East Dam toe drain collector (2023).
- Erosion and sediment deposition into the East Dam seepage collection ditch observed (2023.)
- Seepage observed on West Dam access road below collection pond, indicating seepage is bypassing lower collection pumping system (2023).
- Depression observed at north abutment talus slope of West Dam (2023).
- Cracking at north abutment upstream slope (2023).
- Sudden 20L/s decrease in average East Dam toe drain seepage flow starting in September (2023).
3. Foundation Investigation
With reference to current Engineers and Geoscientists of BC (EGBC) TSF foundation investigation guidelines, the preconstruction foundation investigation of Copper Mountain Mine TSF performed in the years 1968-1971 has been reviewed for completeness [Bechtel Ltd, 1971, EGBC, 2014]. In total, 19 and 21 boreholes were drilled at the West and East Dams and core sampled, of which 9 and 7 were drilled down through bedrock. This foundation investigation does not report that a geophysical survey (e.g. seismic reflection) was conducted for the purpose of characterizing foundation material between boreholes, possibly due to a difference in TSF foundation investigation standards and practices at the time of the report. In November 1970, the foundation investigation concluded that upstream of the planned locations for the West and East starter dams the foundation consists of loose to compact sand and silt with layers of organic silt, underlying the existing Smelter Lake, that is not capable of supporting a dam without removal of silt, flattening of dam slopes, and/or berm construction. This structural concern appears to have been addressed in 1971 by locating starter dams west and east of organic silt deposits and imposing constraints on the upstream slopes of the tailings dams constructed on top of these starter dams.
In 2010, as part of mine reactivation, seismic reflection, seismic refraction, and multi-channel analysis of surface waves (MASW) tests were conducted to map the material structure of existing dams and downstream foundations [AMEC, 2011]. Lacustrine clay was not detected by any of these geophysical surveys, perhaps for the following reasons:
- The clay layer, being at most 6m thick, was too thin to be detected by seismic reflection with quarter wavelength resolution.
- The clay layer, being of higher P-wave velocity than the material layer below it, could not be defected by seismic refraction.
- The overburden of the clay layer was too thick for the clay to be detected by MASW.
Additional borehole drilling was conducted between 2011 and 2015 to locate glaciolacustrine and lacustrine material layers in the West and East Dam foundations [AMEC, 2011, AMECFW, 2015]. In 2019, additional borehole drilling was conducted for the purpose of investigating the foundation required for West Dam extension and piezometer/inclinometer installation in both dams, with 3 holes drilled in the West Dam downstream slope and 2 holes drilled in the East Dam downstream slope. This 2019 drilling confirmed the presence of lacustrine clay in the East Dam foundation.
3.1. 1D Consolidation Calculation
Given the extent of lacustrine clay present in the West and East Dam foundations according to the 2021 ADSI, a 1D consolidation calculation has been performed to determine an appropriate material model of foundation clay to be used in 2D and 3D limit equilibrium dam slope stability analyses. As input to this calculation, the foundation clay is assumed to be 1.5m thick in the West Dam foundation and 6.9m thick in the East Dam foundation based on the 2021 ADSI, and a coefficient of consolidation of cv = 2.28m2/year is assigned to the clay based on literature [Schneider,2022]. With these assumptions, the primary consolidation time factors for 1 month and 1 year for the West and East Dams are 0.34/0.016 and 4.05/0.19, corresponding to 65/10 and 100/50 percent complete consolidation. This implies that while excess pore pressure in the West Dam foundation clay layer dissipates during dam construction, the East Dam foundation clay should be treated as an undrained material, and for this reason the SHANSEP material model has been selected to model foundation clay for conservative computation of dam 2D and 3D limit equilibrium FoS values [Ladd, 1974, Zabolotnii, 2022].
3.2. 2D Limit Equilibrium Analysis (2020)
Figure 1-left shows the FoS=1.6 result of applying the 2D Morgenstern-Price limit equilibrium method in Rocscience Slide2 to West Dam cross section B1 using a 2D model approximating the 2020 KCB model, including the 2020 KCB reported phreatic surface level, assignment of drained Mohr-Coulomb material shear strengths to all materials except lacustrine clay which is assigned an undrained SHANSEP material shear strength, and using an approximation of the minimal slip surface identified by KCB. Material models/parameters used are listed in Table 1, in which the Mohr-Coulomb and SHANSEP models are abbreviated as MC and S. In this table, the densities of the sand and gravel foundation, lacustrine clay, starter dam, and old/new tailings are water saturated densities, while the density of cycloned sand is an unsaturated wet density.
Figure 1-right shows the FoS=1.7 result of applying the 2D Morgenstern-Price limit equilibrium method to compute the 2020 FoS of dam cross section A2 using a model approximating the 2020 KCB model, including the KCB reported phreatic surface level, assignment of drained Mohr-Coulomb material shear strengths to all materials except lacustrine clay which is assigned an undrained SHANSEP material shear strength, and using an approximation of the minimal slip surface identified by KCB. It is important to note that neither of the 2D FoS computations utilize a computer search algorithm to determine the dam minimal slip surface, which could imply these 2D FoS values are significantly overreported. For comparison with Engineer of Record results, it is noted that in 2016, AMEC reported an end-of-construction FoS of 1.3 for a model of East Dam cross section A2 in which a continuous lacustrine clay layer was present, while in 2020, KCB reported an FoS of 1.9 for the same cross section at time-of-construction.
3.3. 3D Limit Equilibrium Analysis (2025)
Figure 2 shows the result of computing 3D FoS values for models of the West Dam and East Dam using Rocscience Slide3. The 3D models are based on valley topographic data provided by the foundation investigation documentation and 2016/2023 ADSI reports, and dam construction projections based on the 2023 ADSI report. Because the foundation investigation documentation showed boreholes in the vicinity of the West and East starter dams having average surface/bedrock elevations of 810.4m/795.4m and 811.8m/781.6m elevations, while the 2023 ADSI indicates the West and East starter dam base elevations for sections B1 and A2 are 800m, foundation topography was simplified to have uniform surface/bedrock elevations of 800m/780m, since the sand and gravel material in the foundation below the elevation of the surface lacustrine clay layers is not anticipated to affect slip surface geometry. Model phreatic surfaces are based on calibration of FEFLOW 2D seepage analyses to 2023 piezometer data, assuming water is ponded against dam crests during probable maximum flood events. For minimal slip surfaces determined by the Slide3 classic ellipsoidal particle swarm search, the Morgenstern-Price FoS value is 1.6 for the West Dam is 1.6, and 1.9 for the East Dam. The fact that neither 3D slip surface passes through the tailings and clay foundation demonstrates the importance of the narrowness of dam valley geometry to enhancing stability of the dam slopes.
4. Tailings Beach Lengths
Measurements of the East and West Dam tailings beach lengths provided in ADSI reports suggest the tailings beach lengths exceed minimum design specifications for each year from 2014 through 2023, as shown in Table 2. These beach lengths, which have a direct influence on phreatic surface levels within the dams, depend on various factors including the water content of the tailings, the rate of tailings deposition, the seepage flow out of the TSF, and the pumping rate of reclaim water.
As verification of reported beach lengths, beaches can be imaged with Sentinel-2 satellites and beach images can be processed to display normalized difference water index (NDWI):
to detect presence of surface water [Du, 2016, O’Donovan, 2022]. Figure 3-top shows images of the Copper Mountain Mine TSF on September 14, 2023, filtered in the red band B4 (left) and binary processed to display NDWI > 0.2 to identify presence of surface water. Figure 3-bottom shows an image of the TSF on July 5, 2024, filtered through band B2 (blue-490nm), in which circular surface structures of approximate diameter 60 and 100km with optical reflectivity less than surrounding dam material are visible on the West and East dam downstream slopes. A hypothesis offered for presence of the structures in accordance with the 2021 DSR is that they were formed by sprinkler systems to limit dust generation.
5. Seepage Analysis
In this chapter, ADSI reported drain seepage flows and piezometer readings are reviewed, and used to calibrate steady state and transient seepage analyses. The purpose of the steady state seepage analyses is to determine whether or not tailings beach lengths meet design specifications, dam drains are working as designed, and what phreatic surface levels and water pore pressures should be used in 2025 limit equilibrium analyses. The purpose of the transient seepage analysis is to determine the increase in phreatic surface level and pore pressure within the dams occurring with a probable maximum flood for use in 2025 limit equilibrium analyses
A list of the TSF dam drains constructed with an approximate date of construction is listed in Table 3. Not included in this list is an East Dam chimney drain which is not included in the AMEC2016 seepage analysis of the dam [Golder Associates, 1979]. An important detail of the starter dam toe drain and starter dam drainage blanket construction is that while the starter dam toe drains were constructed with both coarse and fine filters to avoid clogging with silt and/or clay, the drainage blankets were, according to foundation investigation documentation, constructed with a coarse filter only [Bechtel Ltd, 1971]. Previous engineering reports also suggest the finger drains constructed before mine deactivation in 1996 were constructed with coarse filters only. This information is important because it points to the possibility of gradual clogging of the drainage blankets and/or finger drains in the West and/or East Dams by silt and/or clay existing in the foundation.
Annually averaged seepage flows through rock crest and toe drain outlets of the West and East Dams are shown in Table 4. Noticeable from this table is that after 2020, both the West and East Dam rock crest drain outlets show close to zero seepage flow each year, as attributed by ADSI reports to possible damage to the West Dam rock crest drain outlet pipe and cement grouting of the East Dam rock crest drain outlet. This drain malfunction is important, because in the 1980s, when dam upstream construction began and dam centerlines began moving upstream of the starter dam centerlines, the rock crest drains were constructed in accordance with an engineering report stating rock crest drain construction would be essential for avoiding water saturation of cycloned sand prone to liquefaction [Golder Associates, 1981].
Another observation about Table 4 is that the West drain seepage flows include seepage into a ‘West Dam recycle sump’, as stated in ADSI reports. The fact that the inlet to this sump is not identified as either the West Dam rock crest drain outlet or West Dam toe drain outlet suggests the sump may be a collector for seepage flow through the West Dam foundation with unfiltered exit [Klohn, 1979]. This possibility is also evidenced by ADSI reported seepage into the sump steadily increasing between 2014 and 2019, as might occur with enlargement of one or more high permeability channels within the foundation due to internal erosion, before suddenly decreasing in 2019, at which point in time significant seepage into a newly created flow channel downstream of the West Dam toe drain outlet is reported to have begun.
To quantify the origin of West Dam recycle sump seepage, it is noted that based on the 2014 ADSI reported min/max readings 835.6m/837.4m and 820.5m/822.5m of piezometers VWP10-05W-3 and VWP10-04W-3 installed in the West Dam foundation immediately upstream of the starter dam, the approximate gradient in total hydraulic head in the starter dam foundation was 15m over a length of 70m, which for a fluvial sand and gravel foundation of permeability 1e−3m/s and approximate cross sectional area of 1000m2 beneath the starter dam amounts to a foundation flow of:
(15m/75m) · (1e−3m/s) · (1000m2) = 200L/s.
This calculated flow is sufficient to account for the increasing West Dam recycle sump seepage flow rates reported before 2020.
5.1. 2023 Dam Crest Piezometer Data
In accordance with 2021 DSR recommendations, the 2023 ADSI indicates piezometers have been installed at both West and East Dam crests. Piezometer VWP22-02W-3 installed at elevation 899.9m approximately 100m upstream of the West starter dam recorded min/max total head read- ings of 900.2m/900.4m, and piezometer VWP23-01E-3 installed at elevation 903.0m approximately 200m upstream of the East starter dam recorded min/max total head readings of 909.9m/914.3m. For comparison across time, in 2015, piezometer VWP10-05W-2 installed at elevation 845m ap- proximately 100m upstream of the West starter dam recorded min/max total head readings of 851.7m/854.4m (2015 red light > 902m), and piezometer PZ12-05E installed at elevation 845m approximately 100m upstream of the East starter dam recorded min/max total head readings of 859.5m/860.1m (2015 red light > 875m).
5.2. 2D Steady State Seepage Analysis (2023)
2D steady state seepage analyses of West and East Dams have been computed with FEFLOW to investigate:
- Relative size of seepage flows above starter dams and below starter dams through foundation.
- Whether or not dam blanket and/or finger drains are clogged.
- Phreatic surface levels and pore pressures calibrated to 2023 piezometer readings.
- The extent to which downstream slopes of the West/East Dams are saturated with water.
Figure 4 shows the FEFLOW computed 2023 phreatic surface level and hydraulic head isolines for the entire TSF and its foundation analyzed as a simplified 2 dam system in which drainage systems are ignored, beach lengths are 0m, and the material permeabilities listed in Table 5 have been used. This analysis indicates the 2023 hydraulic head in TSF foundation upstream of West and East starter dams is approximately constant at 810m. The total seepage flows out of the West and East Dams are computed to be 1.4L/s/m and 1.2L/s/m, and in both cases more than 90 percent of this flow passes through the foundation. These seepage analysis results are in contrast to 2014 piezometer readings of VWP10-05W-3/VWP10-01E-3 in West/East Dam upstream foundations in excess of 835m/845m, pointing to the importance of considering the effect of 3D TSF geometry on seepage flow, and accounting for any low permeability path from the TSF pond through the TSF abutments into the foundation as previously reported to be of concern [Klohn Crippen, 1998].
Figure 5 shows West/East Dam FEFLOW steady state seepage analyses with drain function and boundary conditions adjusted to obtain approximate agreement of hydraulic heads with 2023 readings of West/East Dam piezometer readings. For both dams, an upstream foundation total head of 830m was assigned based on readings of piezometer VWP12-01E-2 and results of analyzing the 2 dam system. For the West Dam, to obtain agreement with downstream piezometer VWP22-04W-1 and VWP22-03W-3 readings of 811m and 827.5m, it was necessary to assume 100m of the blanket/finger drain system downstream of the starter dam has been clogged, and to obtain agreement with piezometer VWP10-04W-1 and VWP22-02W-3 readings of 859.5m and 900m it was necessary to assume a beach length of 0m. For the East Dam, to obtain agreement with downstream piezometer VWP23-04E-2 and VWP19-01E-3 readings of 815.3m and 834m, it was necessary to assume 200m of the blanket/finger drain system downstream of the starter dam has been clogged, and to obtain agreement with piezometer VWP23-03E-2 and VWP23-01E-3 readings of 855m and 911.5m it was necessary to assume a beach length of 0m. After this initial adustment of drain permeability and seepage flow boundary conditions, material and drain permeabilities were calibrated to 2023 piezometer readings using FePEST. For both West/East Dam FePEST permeability calibrations, the effect on phreatic surface position was not substantial, but returned cycloned sand permeability 5e7m/s was two orders of magnitude lower than reported in the 2021 DSR, and permeabilities ranging from 3.3e−5m/s to 5.8e−3m/s for sections of drain 0-100 and 100-200 meters downstream of the starter dams were returned. The low value of cycloned sand permeability is attributed to the presence of a structural zone intermediate between tailings and cycloned sand downstream slopes in which tailings and sand materials by 2 percent of waves are 1.7m and 1.3m. The setups for these waves, defined by the formula:
are interbedded.
Figure 6 shows the degree of water saturation of West/East Dam slopes output by FEFLOW unsaturated steady state seepage analyses. These analyses used the same boundary conditions and saturated material permeabilites as saturated seepage analyses, but solved Richard’s equation in unsaturated zones using max/min saturations of 0.5/0.0025 and Van Genuchten parameter α = 0.021/n = 1.20 and α = 0.035/n = 3.19 for tailings and sand materials.
5.3. Probable Maximum Flood Analysis (2023)
The 2021 DSR provided hydrologic loading analysis of the Copper Mountain Mine TSF in accordance with EGBC dam hydrologic loading guidelines. The 2021 DSR determined the probable maximum flood to occur with an all-season 72-hour probable maximum precipitation of 540 mm for the TSF catchment of 5.25km2. The DSR also recommended:
- Calculation of wind/wave effects specified in the Canadian Dam Association 2013 Dam Safety Guidelines
- Stability analyses to identify what minimum beach widths are required per Canadian Dam Association 2019 Application of Dam Safety Guidelines to Mining Dams to maintain stability under inflow design flood conditions.
According to the Canadian Dam Association 2013 Dam Safety Guidelines, extreme consequence dam freeboards should be sufficient so that [Canadian Dam Association, 2013]:
- No overtopping by 95 percent of the waves caused by the most critical wind with a frequency of 1/1000 year when the reservoir is at its maximum normal elevation.
- No overtopping by 95 percent of waves caused by the 1/100 year critical wind when the reservoir is at its maximum extreme level during passage of the probable maximum flood.
In turn, minimum freeboard requirements can be determined based on United States Army Corps of Engineers Hydrologic Engineering Requirements for Reservoirs [United States Army Corps of Engineers, 2018]. Specifically, if the 1/1000 and 1/100 year critical winds at Copper Mountain Mine TSF, corrected to 10 meter elevation, are taken to be 160.9 km/hr (100 miles/hr) and 128.7 km/hr (80 miles/hr), and the effective fetch length of the TSF is taken to be 1.6km (1 mile), the significant wave heights are 1.2m (4ft) and 0.9m (3ft). These significant wave heights are the average height of the highest 1/3 of waves, whereby the wave heights exceeded are 0.26m and 0.17m assuming a depth of 2.5m, which summed with the respective 2 percent wave heights yield values of 1.96m and 1.47m, both less than the 2m of wave run up allowed for by the KCB design [Klohn Crippen Berger, 2021].
The design minimum freeboard of 2m assumes an initial freeboard of 5m is decreased by occurrence of a probable maximum flood. Because the 2023 ADSI reports a freeboard of 10m, transient seepage analysis has been performed assuming an increase in water level of 3m takes place with occurrence of a probable maximum flood of duration 72 hours, and that a month is required to pump the flood water out of the reservoir to return the pond height to its original level. Figure 7 shows the West/East Dam transient seepage analysis in which phreatic surfaces are not significantly changed from steady state levels, but the hydraulic head of water saturated cycloned sand and tailings in vicinity the dam crests is increased by 10-20m in parts.
6. Erosion Failure Modes
D15 and D85 measurements of foundation sand and gravel, impounded copper tailings, and cycloned sand are shown in Table 6. The foundation sand and gravel measurements are for a soil sample from borehole SL-9, copper tailings measurements are reference values, and the cycloned sand measurements are for a sample of cycloned sand located 200 feet upstream of the West Dam starter dam [Bechtel Ltd, 1971, Golder Associates, 1981, Wang, 2018].
6.1. Backward Erosion Piping
According to Table 6, the piping compatibility condition:
is satisfied for all pairs of materials listed. However, these compatibility conditions do not rule out backward erosion piping of foundation material due to unfiltered seepage exit points [Klohn Leonoff, 1990]. Based on ADSI report concerns, different possible pathways for backward erosion piping through foundation material have been evaluated below.
D15(f ) < 5 · D85(s),
- Piping through foundation from unfiltered vertical or horizontal exit downstream of dam toe: (West Dam) Foundation toe piezometer PZ10-02W shows a marked decrease in total head reading from 806.6m/806.9m min/max in 2016 to 801.7m/803.3m in 2017 before increasing to 803.3m/804.6m in 2020 after a marked decrease in seepage flow into the West Dam recycle sump is reported starting in 2020. This data suggests an internal erosion pipe may have formed through the West Dam foundation beneath the toe before collapsing in 2020. Increases in 2020 total head readings of piezometers PZ12-04W and PZ12-05W to maxima 820.2m and 820.8m passed design threshold also suggest blockage of an internal erosion pipe in 2019. (East Dam) 2023 ADSI reports direct observation of sediment deposition in East Dam seepage collection area due to internal erosion. East Dam toe Piezometer PZ15-02E shows a marked increase in total head reading from 809.7m/813.5m min/max in 2022 to 821.3m/821.3m in 2023 after a marked decrease in seepage flow from the East toe drain outlet is reported starting in 2023. This data suggests an internal erosion pipe may have formed through the East Dam foundation beneath the toe before collapsing in 2023.
- Piping through embankment and/or foundation from unfiltered exit at dam abutment: (West Dam) 2023 ADSI reports direct observation of unfiltered exit point for West Dam seepage beyond abutments.
- Seepage exiting downstream slope causing pipe formation through embankment and/or foundation: (East Dam) 2022 ADSI reports observation of water saturated zone of East Dam cycloned sand observed on downstream slope. Probability of initiation of backward erosion piping asserted to be 1 if seepage is observed exiting dam downstream slope [United States Army Corps of Engineers, 2025].
- Seepage exiting damaged drain outlet initiating pipe formation: (West Dam) Damage to the rock crest drain outlet may initiate formation of soil erosion and cavity formation depending on hydraulic gradient in the soil, size of the defect in the pipe, and the size of soil particles surrounding the defect [Dave, 2023].
6.2. Concentrated Leak Erosion
Based on ADSI reports, the following possible locations for concentrated leak erosion of the West Dam embankment have been identified
- Leak at West/East Dam abutments: Multiple ADSI reports describe observation of cracks at dam abutments, but it was not reported that abutment material was water saturated or seepage exited the cracks as necessary for initiation of concentrated leak erosion.
- Leak into plugged West Dam tunnel: 2023 ADSI suggests shotcrete tunnel lining, intended to control water inflow into the tunnel, is partially broken. Therefore, if material constituting the tunnel is fractured to the point of permitting seepage to exit through the tunnel, concentrated leak erosion may be occurring along the exit path. Depending on the extent of the damage to the shotcrete lining, the tunnel may be structurally damaged and/or at risk of collapse [Dean Brox Consulting Ltd, 2024].
6.3. Soil Contact Erosion
Based on Table 6, foundation sand/gravel, copper tailings, and cycloned sand grain size distributions satisfy:
so soil contact erosion is not predicted to initiate at the interfaces between these materials within the West or East Dam [Robbins, 2018].
D15(f ) < 7.5 · D85(s),
6.4. Suffusion
A condition on grain size distribution of a material indicating initiation of suffusion is the Kezdi criterion, which states suffusion may initiate if the difference in percent fines content between grain sizes D and 4D is less than 15 percent [Kezdi, 1979]. Based on the grain size distribution curve for silty gravelly sand recovered from borehole SL-9 in the East Dam foundation and the Kezdi criterion, the foundation material is susceptible to suffusion because of the gap in grading between 2 and 20mm grain sizes. In principle, this suffusion could result in clogging of the gravel by transported fines and a decrease in permeability over time [Fry, 2016].
7. East Dam Inclinometer Measurements
According to the 2021 DSR, inclinometer 12-02E has shown minimal displacement in the East Dam lower foundation, but in the upper foundation, tailings, and cycloned sand, material displacement rates have remained between 0.02 and 0.03mm/day from 2018 onward. In 2021, when Wolfe Creek was realigned with construction of an attenuation berm, inclinometer displacement rates temporarily decreased. A hypothesis offered for these observed displacements is that they are due secondary creep of lacustrine clay in the East Dam foundation stressed beyond its yield strength [Schneider, 2022]. Staged construction analysis of the dam is required to determine whether or not this hypothesis is consistent with inclinometer measurements. Ground-based radar and/or InSAR measurement of the East Dam surface during periods of non-construction might also detect if inclinometer measurements are correlated with displacement of the dam downstream slope.
8. Flow Liquefaction Hazard Analysis
For conservative limit equilibrium computation of West and East Dam FoS values accounting for liquefaction of tailings and cycloned sand, it is necessary to assign tailings and cycloned sand zones within the dams residual (i.e. post-liquefaction) undrained shear strengths. Since 3D dam FoS values are both less than 1.0 with assumption of complete liquefaction of cycloned sand, this chapter presents post-liquefaction analyses of the West/East dams to determine if ongoing dam construction and maximum flood conditions occurring during 2025 spring freshet could destabilize dam slopes with flow liquefaction of tailings/cycloned sand material [Ohio EPA, 2004].
Flow liquefaction hazard analysis starts with a review of cycloned sand deposition history and 2019 cone penetration testing to divide the West and East Dam embankments into starter dam, cycloned sand shell, intermediate structural, and tailings zones [International Commission on Large Dams, 2019]. Then, dam slope stability for assignment of residual undrained (i.e. post-liquefied) shear strengths to the intermediate structural zones is examined with the 3D limit equilibrium analysis program Slide3. These 2025 post- liquefaction stability analyses use the 2023 seepage analyses to approximate spring freshset 2025 dam phreatic surface and pore pressure states to determine what if any locations with the dams present conditions where a flow liquefaction slip surface could form.
8.1. Intermediate Structural Zones
The 1989 TSF Design Review assessed stability of the TSF dams against occurrence of a 1/1000 year magnitude 7.5 earthquake [Klohn Leonoff, 1989]. Based on tailings deposition method, sieve analyses, and the results of standard penetration tests (SPT) performed at different distances upstream of the starter dams, this review divided the tailings material used for dam construction into 4 zones, I:compacted cycloned sand, II:uncompacted cycloned sand, III:cycloned sand/slimes beach deposits,IV:tailings and slimes, with different effective internal friction angles of 36, 30, 28, and 26, and zone II / III / IV residual undrained shear strengths of 400psf / 200psf / 200psf. The review concluded that for both dams, dam stability or failure depended on the extent of zones III and IV undergoing seismic liquefaction, in that the 2D post seismic FoS values would be 1.6 / 0.8 / 0.5 in cases where material in these zones liquefied 400+ / 200+ / 0+ feet (122+/61+/0+ meters) upstream of the starter dam centerlines, and that the controlling factor in dam stability would be the extent to which the dams are built over liquefiable materials. For both West and East Dams, critical post-seismic slip surfaces were identified as passing through liquefied tailings above the starter dam, and through the dam downstream slope above the dam toe.
2019 CPT tests of the West Dam at 4 different locations at the crest and downstream slope indicate that for conservative assignment of the state parameter ψ to different parts of the dam, tailings/cycloned sand material above elevation 880m in the vicinity of the dam crest should be assigned a value of ψ between 0 and 0.1, while water saturated cycloned sand above and downstream of the West starter dam should be assigned a value of ψ between -0.05 and 0. Based on these 2019 CPT test results, the West Dam has been divided into 5 zones as shown in Figure 8, in which a liquefaction susceptible fifth zone consisting of water saturated cycloned sand has been added to the 1989 TSF Design Review zone division. In this figure, a similar zone division of the East Dam based on the 1989 TSF Design Review and 2019 CPT test results is also shown.
8.2. Post-Liquefaction Analysis (2025)
Post-liquefaction stability of the West and East Dams has been assessed by assigning residual undrained shear strength ratios of 0.22 and 0.07 to zones 4A and 4B, following the 2020 KCB stability analysis, and 0.055 to zones 3 and 5, assuming an SPT blow count value of 10 for water saturated cycloned sand based on the 1989 TSF Design Review and a residual undrained strength ratio multiplicative factor of 0.0055 [Klohn Leonoff, 1989, Stark, 1992]. Figure 9 shows the resulting Slide3 Morgenstern-Price 3D limit equilibrium analysis FoS values of 1.1 and 1.1 for the West and East Dams, and the associated slip surfaces. Table 7 shows FoS values similarly computed for different values of the unsaturated cycloned sand internal friction angle and water saturated sand SPT blow count. It is noted that while the assignment of residual undrained shear strength ratio of 0.055 to zone 5 is overly conservative based on 2019 CPT data, it is not known what post-2023 CPT data would show in regards to the current extent of water saturated cycloned sand and its liquefaction susceptibility [Robertson, 2010]. Moreover, it is not guaranteed Slide3 FoS computation is finding West/East Dam critical slip surfaces, although both intelligent search and addition of weak layers were attempted without lowering the returned Morgenstern-Price FoS. Slide3 allowance for tension cracking of the cycloned sand dam crests was not observed to have any effect on FoS or slip surface results.
9. Conclusions
2025 3D limit equilibrium analysis FoS values for Copper Mountain Mine West and East Dams are 1.6 and 1.9 with assumption of phreatic surface levels based on 2023 seepage analyses. Both these values are above the legal limit of 1.5, as specified by the Health and Reclamation Code for Mines in BC [Government of BC, 2018], but significantly lower than the values of 2.2 and 2.2 reported by KCB in 2020. These initial results support the 2021 DSR stated concerns regarding Copper Mountain Mine TSF dam FoS computation by the Engineer of Record, and suggest BC public access to tailings dam slope stability models would help minimize the chances of major tailings dam failures in the province going forward.
Of immediate concern is evidence for clogging of West and East finger drains leading to unfiltered seepage exit and the formation of internal erosion pipes through both West and East Dams. Specifically, marked decreases of the West Dam recycle sump seepage flow in 2020 and the East Dam toe drain seepage flow in 2023 correspond to marked increases in total head readings of piezometers PZ10-02W and PZ15-02E, pointing to collapse of internal erosion pipes that could have damaged the toe drain extensions. Historical examples of dam structural failure caused by internal erosion piping suggest TSF internal erosion investigation (e.g. electrical resistivity tomography) is warranted, and remedial drain construction could be required to avert TSF failure.
In addition, of immediate dam stability concern is 2023 ADSI piezometer data indicating parts of the West Dam cycloned sand overflow and/or underflow are water saturated, an occurrence highlighted as a liquefaction hazard by previous professional engineering investigations [Golder Associates, 1981]. This data suggests assumption of peak undrained shear strength for cycloned sand in 3D FoS computations is not conservative, and for this reason, residual undrained shear strengths should be assigned to parts of the West and/or East Dam cycloned sand downstream slopes in post-liquefaction analyses. With conservative assignment of these strengths based on previous SPT testing, 3D post-liquefaction FoS values for both dams are less than 1.2, which is a violation of the Health, Safety, and Reclamation Code for Mines in BC seismic stability requirement. This result suggests additional peak/residual undrained shear strength characterization of water saturated cycloned sand dam is warranted to specify the risk of dam flow liquefaction with improved precision.
The following itemized list identifies these and other tailings dam slope stability concerns by document chapter:
- Chapter 3 - 2020 KCB post-seismic liquefaction analyses do not account for liquefaction of water saturated cycloned sand, but 2023 piezometer data and more recent direct observation indicate cycloned sand is water saturated in parts. Slide3 computed dam 2025 FoS values for West and East Dams based on assigning peak drained shear stength to the cycloned sand are both greater than 1.5, but less than 2020 KCB values.
- Chapter 4 - Sentinel-2 satellite imagery provides evidence of water saturation of dam material at West Dam crest, implying West dam beach length is below design specified minimum.
- Chapter 5 - Water saturation of cycloned sand at East Dam toe reported in 2022 ADSI is possible evidence of finger drain clogging. Further evidence of water saturation of cycloned sand in both West and East Dams is provided by 2023 piezometer data indicating the water tables 100m upstream of the West Dam and 200m upstream of East Dam starter dams are at total heads 900.2m and 909.9m, which in the case of the West Dam is approximately 50m higher than measured to be in 2015. This water saturation presents a liquefaction hazard according to 1981 Golder Associates liquefaction assessment.
- Chapter 6 - Marked decreases in West Dam recycle sump and East Dam toe drain seepage flows in 2020 and 2023, corresponding to marked increase in toe drain piezometer total head readings, are possible evidence of internal erosion piping.
- Chapter 7 - Staged construction analysis, ground-based radar measurements, and/or InSAR analysis are required to determine if inclinometer measurements are consistent with yield of a portion of the East Dam lacustrine clay foundation.
- Chapter 8 - Conservative post-liquefaction analyses of West and East Damv2025 FoS values indicate these values are less than 1.2 with liquefaction of water saturated cycloned sand.
Although the 2021 DSR does not contain any recommendation to modify dam construction plans, based on the findings of this supplemental review, a professional engineering ITPR of West/East Dam internal erosion and liquefaction hazard is warranted, and necessary for any initiation of correct dam rehabilitation operations. Therefore, it is noted that if internal erosion is identified by professional engineers as an ongoing threat to dam stability, construction of conventional seepage cutoffs through the West and/or East Dam foundations may not be viable if this construction decreases dam stability by increasing phreatic surface levels and pore pressures within the dams. Rather, construction of barriers to internal erosion through the dam toe foundations that permit passage of seepage into existing and/or additional dam drainage systems may be considered necessary [Cedergren, 1997, Varnier, 2018]. In regards to whether or not additional dam construction is required to prevent flow liquefaction slope instability, it is noted that preventative best practice is to assume liquefaction could be triggered and design/construct dams to a post-liquefaction stability standard FoS > 1.1 [International Commission on Large Dams, 2019, O’Brien, 2020]. To this end, specifications on dam drainage and slope stabilization (e.g. flattening) necessary to achieve post-liquefaction slope stability could be considered deliverables of an ITPR dam failure mode assessment.
Statements and Declarations
- Funding: The author declares that they did not receive funding for this work
- Conflict of interest: The authors declare that there is no conflict of interest
- Ethics Approval: Not applicable
- Data Availability: Contact the author if you require the .stl or Slide3 model files used for this research
- Author’s Contribution: Not applicable
References
- AMEC Earth and Environmental (AMEC) (2011). Copper Mountain Mine Reactivation Tailings Management Facility: Final Design Reporting. Submitted to: Copper Mountain Mining Corporation., Doc. Ref.: VM00482.2011.500.
- Amec Foster Wheeler Environment & Infrastructure (AMECFW) (2015). Tailings Management Facility 2014 Annual Review & As-Built Report. Submitted to: Copper Mountain Mine (BC) Ltd., Doc. Ref.: VM00482D.1.200.
- Office of the Premier (2024) B.C. grows critical minerals sector, sustainable jobs. https://news.gov.bc.ca/releases/2024PREM0003-000063.
- Bechtel Ltd (1971). Design Report for Smelter Lake Tailings Dams. Prepared for: Similkameen Mining Company Ltd.
- Canadian Dam Association (2013). Dam Safety Guidelines 2007 (2013 Edition).
- Cedergren, H.R., (1997). Seepage, drainage, and flow nets. John Wiley and Sons.
- Dave, M.; Juneja, A. Erosion of soil around damaged buried water pipes—a critical review. Arab. J. Geosci. 2023, 16, 1–12. [CrossRef]
- Dean Brox Consulting Ltd, (2024). Key principles for hydropower tunnel design, construction and operation.
- Du, Y.; Zhang, Y.; Ling, F.; Wang, Q.; Li, W.; Li, X. Water Bodies’ Mapping from Sentinel-2 Imagery with Modified Normalized Difference Water Index at 10-m Spatial Resolution Produced by Sharpening the SWIR Band. Remote Sens. 2016, 8, 354. [CrossRef]
- Engineers and Geoscientists of B.C., (2016). Site Characterization for Dam Foundations in B.C.
- Emerman, S.H., (2022a). The Risk of Tailings Dam Failure in British Columbia: An Analysis of the British Columbia Existing and Future Tailings Storage Database. Report prepared for BC Mining Law Reform and Skeena Wild Conservation Trust.
- Emerman, S.H., (2022b). The Use of the Silva-Lambe-Marr Method for Estimating the Annual Probability ofFailure of the Tailings Dams at the Copper Mountain Mine, British Columbia, Canada. Report prepared for Confederated Tribes of the Colville Reservation.
- Foy, J., (2016). Mine pollution looms over BC’s rivers and salmon. Wilderness Committee 35(1).
- Fry, J. Lessons on internal erosion in embankment dams from failures and physical models. The 8th International Conference on Scour and Erosion. United Kingdom; 2016, pp. 41–58.
- Government of B.C., (2018). Dam Safety Guidelines: Inspection and Maintenance of Small Dams.
- Golder Associates, (1979). Report to Newmont Mines Ltd. (Similkameen Division) tailings dam construction location of dam centreline Smelter Lake tailings pond.
- Golder Associates, (1981). Report to Newmont Mines Ltd. (Similkameen Division) technical appraisal - tailings facilities Smelter Lake tailings pond.
- International Commission on Large Dams, (2019). Tailings Dam Design Technology Update.
- Klohn Leonoff, (1989). Similco Mines Ltd. - Design Review of Tailings Facility.
- Klohn Leonoff, (1990). Similco Mines Ltd. - Design Report Tailings Pond.
- Klohn Crippen, (1998). Similco Mines Ltd. - Tailings Pond - Annual Review 1998. Klohn Crippen.
- Klohn Crippen Berger, (2019). Copper Mountain Mine Tailings Management Facility 2019 Dam Safety Inspection and As-Built Report. Submitted to: Copper Mountain Mine (BC) Ltd., Doc. Ref.: M1006A09.730.
- Klohn Crippen Berger, (2019). Copper Mountain Mine Tailings Management Facility 2018 Dam Safety Inspection and As-Built Report. Submitted to: Copper Mountain Mine (BC) Ltd., Doc. Ref.: M1006A07.730.
- Klohn Crippen Berger, (2019). Copper Mountain Mine Tailings Management Facility Dam Safety Risk Assessment. Submitted to Copper Mountain Mine (BC) Ltd., Doc. Ref.: M1006A07.730.
- Klohn Crippen Berger, (2020). Copper Mountain Mine Tailings Management Facility 2019 Integrated Life of Mine Expansion Design. Submitted to: Copper Mountain Mine (BC) Ltd., Doc. Ref.: M10066A10.730.
- Klohn Crippen Berger, (2020). CMM Tailings Management Facility El. 962.5 m Raise Stability Report. Submitted to Copper Mountain Mine (BC) Ltd., Doc. Ref.: M1066A09.730.
- Klohn Crippen Berger, (2021). CMM Tailings Management Facility 2020 Dam Safety Inspection Report. Submitted to: Copper Mountain Mine (BC) Ltd., Doc. Ref.: CMMTMF-84431-EM-140-10000.
- Kezdi, A., (1979). Soil physics: selected topics. Elsevier.
- Klohn, E.J., (1979). Seepage control for tailings dams. Proceedings, First International Conference on Mine Drainage, Miller Freeman Publications, San Francisco, CA.
- Ladd, C.C.; Foott, R. New Design Procedure for Stability of Soft Clays. J. Geotech. Eng. Div. 1974, 100, 763–786. [CrossRef]
- Ministry of Energy, Mines, and Petroleum Resources, Division of Mines and Minerals, (2008). Health, Safety and Reclamation Code for Mines in British Columbia. Victoria, B.C.
- Morgenstern, N.R., Vick, S.G., Viotti, C.B., & Watts, B.D., (2016). Report on the Immediate Causes of the Failure of the Fundao Dam. Fundao Tailings Dam Review Panel.
- Morgenstern, N.R., Vick, S.G., & Van Zyl, D., (2015). Report on Mount Polley tailings storage facility breach. Report of Independent Expert Engineering Investigation and Review Panel to Province of British Columbia.
- Morrison, K.F., (2021). Tailings dam failures and regulatory or social response. Mining Engineering.
- O’Brien, K., O’Brien, T., & Robinson, B., (2020). Using the NorSand constitutive model as a tool in assessing the static and dynamic stability of tailings slopes containing contractive material. ICOLD Tailings Dam Safety Bulletin Draft.
- O'Donovan, C.; Adam, E.; Torres-Cruz, L. Remote sensing of the decant pond of tailings dams: Insights from a South African case study. J. South. Afr. Inst. Min. Met. 2022, 122, 167–172. [CrossRef]
- Ohio EPA, (2004). Geotechnical and Stability Analyses for Ohio Waste Containment Facilities. Geotechnical Resource Group, State of Ohio Environmental Protection Agency.
- Robbins, B.A.; Griffiths, D.V. Internal Erosion of Embankments: A Review and Appraisal. Rocky Mountain Geo-Conference 2018. LOCATION OF CONFERENCE, United StatesDATE OF CONFERENCE; pp. 61–75.
- Robertson, P.K. Evaluation of Flow Liquefaction and Liquefied Strength Using the Cone Penetration Test. J. Geotech. Geoenvironmental Eng. 2010, 136, 842–853. [CrossRef]
- Scarpelin, J.; Agostinho, F.D.R.; de Almeida, C.M.V.B.; Giannetti, B.F.; Dias, L.C.P. Valuation of losses and damages resulting from the Fundão's dam failure: An emergy perspective. Ecol. Model. 2022, 471. [CrossRef]
- Schneider, M.A.; Whittle, R.W.; Springman, S.M. Measuring strength and consolidation properties in lacustrine clay using piezocone and self-boring pressuremeter tests. Can. Geotech. J. 2022, 59, 2135–2150. [CrossRef]
- Stark, T.D., &Mesri, G., (1992). Undrained shear strength of liquefied sands for stability analysis. Journal of Geotechnical Engineering. 118(11):1727-47.
- Tetra Tech, (2021). Copper Mountain Mine Tailings Management Facility 2021 Dam Safety Review.
- United States Army Corps of Engineers, (2025). HEC-RAS Hydraulic Reference Manual: Estimating Breach Parameters.
- United States Army Corps of Engineers, (2018). Hydrologic Engineering Requirements for Reservoirs.
- Varnier, P.E., & Toro, J., (2018). Design of a Centerline Method Tailings Dam using Mine Waste Rockfill in Peru.
- Villavicencio, G.; Espinace, R.; Palma, J.; Fourie, A.; Valenzuela, P. Failures of sand tailings dams in a highly seismic country. Can. Geotech. J. 2014, 51, 449–464. [CrossRef]
- Wang, X.; Wei, Z.; Li, Q.; Chen, Y. Experimental research on the rheological properties of tailings and its effect factors. Environ. Sci. Pollut. Res. 2018, 25, 35738–35747. [CrossRef]
- Zabolotnii, E.; Morgenstern, N.R.; Wilson, G.W. Mechanism of failure of the Mount Polley Tailings Storage Facility. Can. Geotech. J. 2022, 59, 1503–1518. [CrossRef]
Figure 1.
Morgenstern-Price computed FoS for 2D models of cross sections based on 2020 KCB stability analyses and minimal slip surfaces [Tetra Tech, 2021].
Figure 1.
Morgenstern-Price computed FoS for 2D models of cross sections based on 2020 KCB stability analyses and minimal slip surfaces [Tetra Tech, 2021].
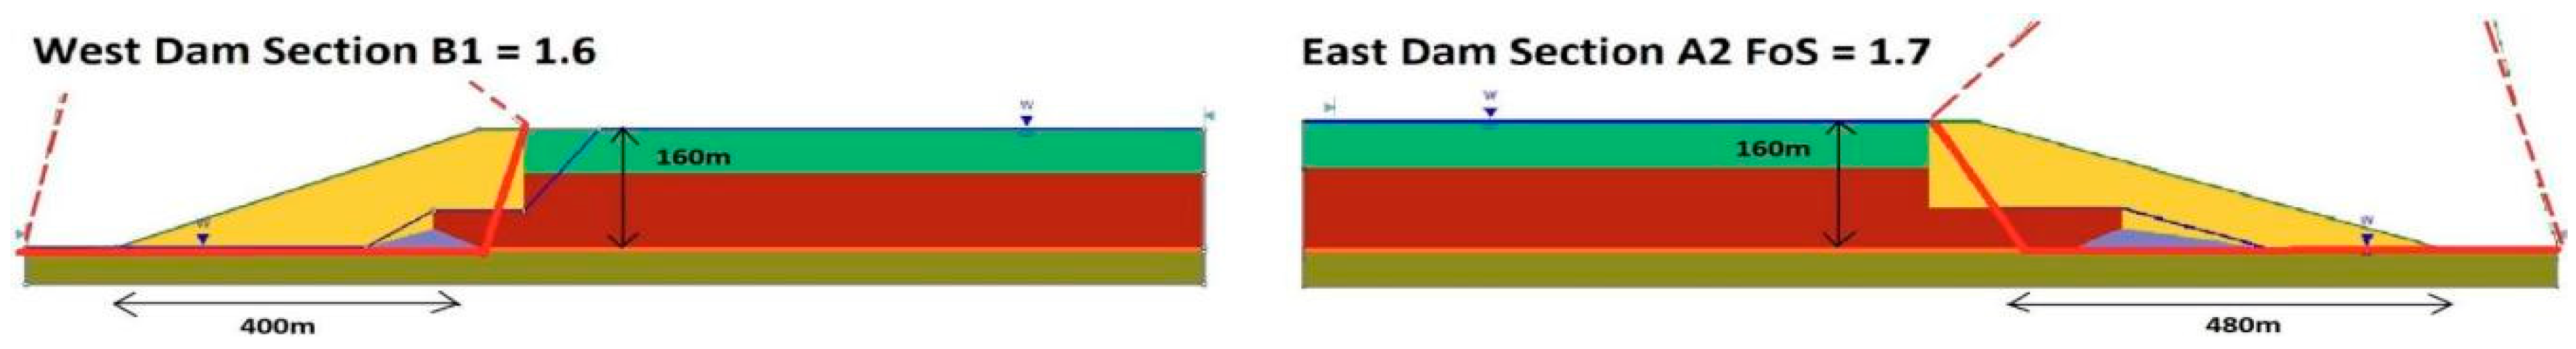
Figure 2.
West Dam and East Dam 2025 3D Morgenstern-Price FoS values computed for minimal spline slip surfaces determined by Rocscience Slide3 classic ellipsoidal particle swarm search. Phreatic surface based on 2D FEFLOW analysis of probable maximum flood conditions.
Figure 2.
West Dam and East Dam 2025 3D Morgenstern-Price FoS values computed for minimal spline slip surfaces determined by Rocscience Slide3 classic ellipsoidal particle swarm search. Phreatic surface based on 2D FEFLOW analysis of probable maximum flood conditions.
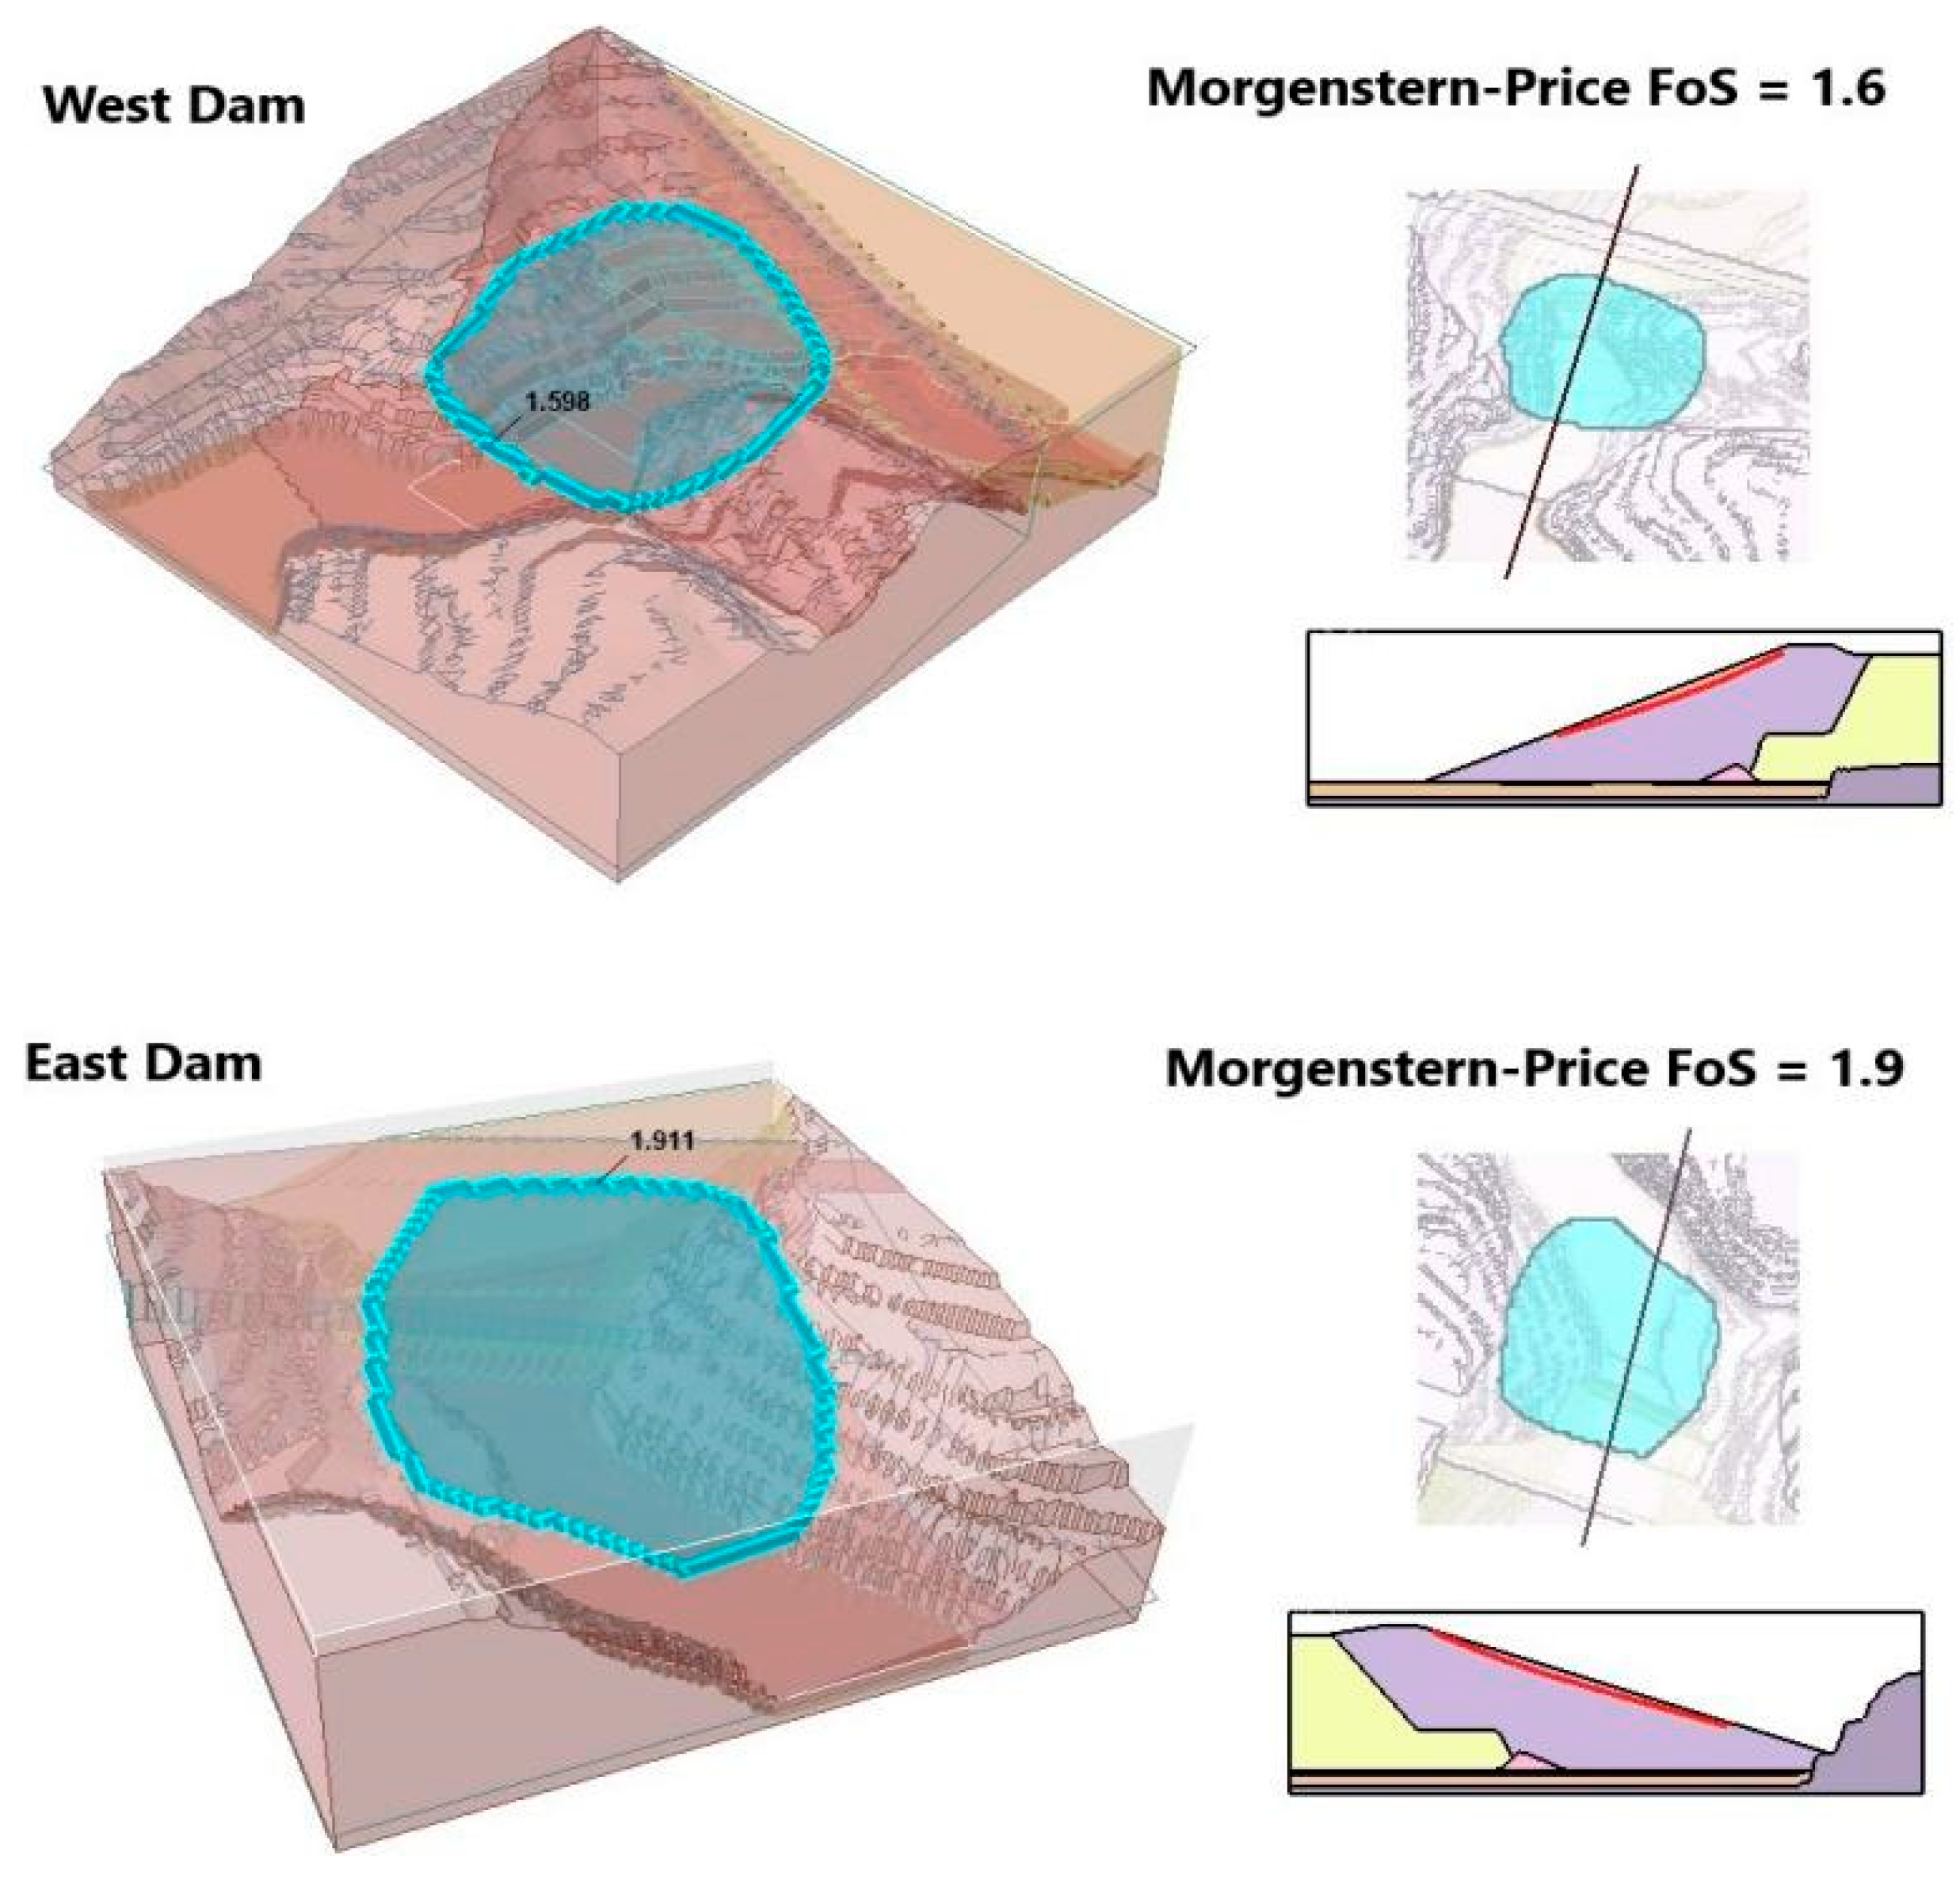
Figure 3.
Sentinel-2 images Copper Mountain Mine TSF, dated 09/14/2023 (top), and 07/05/2024 (bottom). Top images show the TSF in red band B4 (left), in which boundaries of the tailings pond are clear, and the same image binary processed for the condition NDWI>0.2 to identify presence of water at the surface of the TSF The bottom image shows the TSF in blue band (B2) in which 7 circular structures on the West Dam crest/downstream slope of approximate diameter 60km and 3 circular structures on the East Dam downstream slope of approximate diameter 100m are visible, and distinguishable from dam downstream slope, beach, and tailings pond materials by their reflectance in blue, red, and infrared bands.
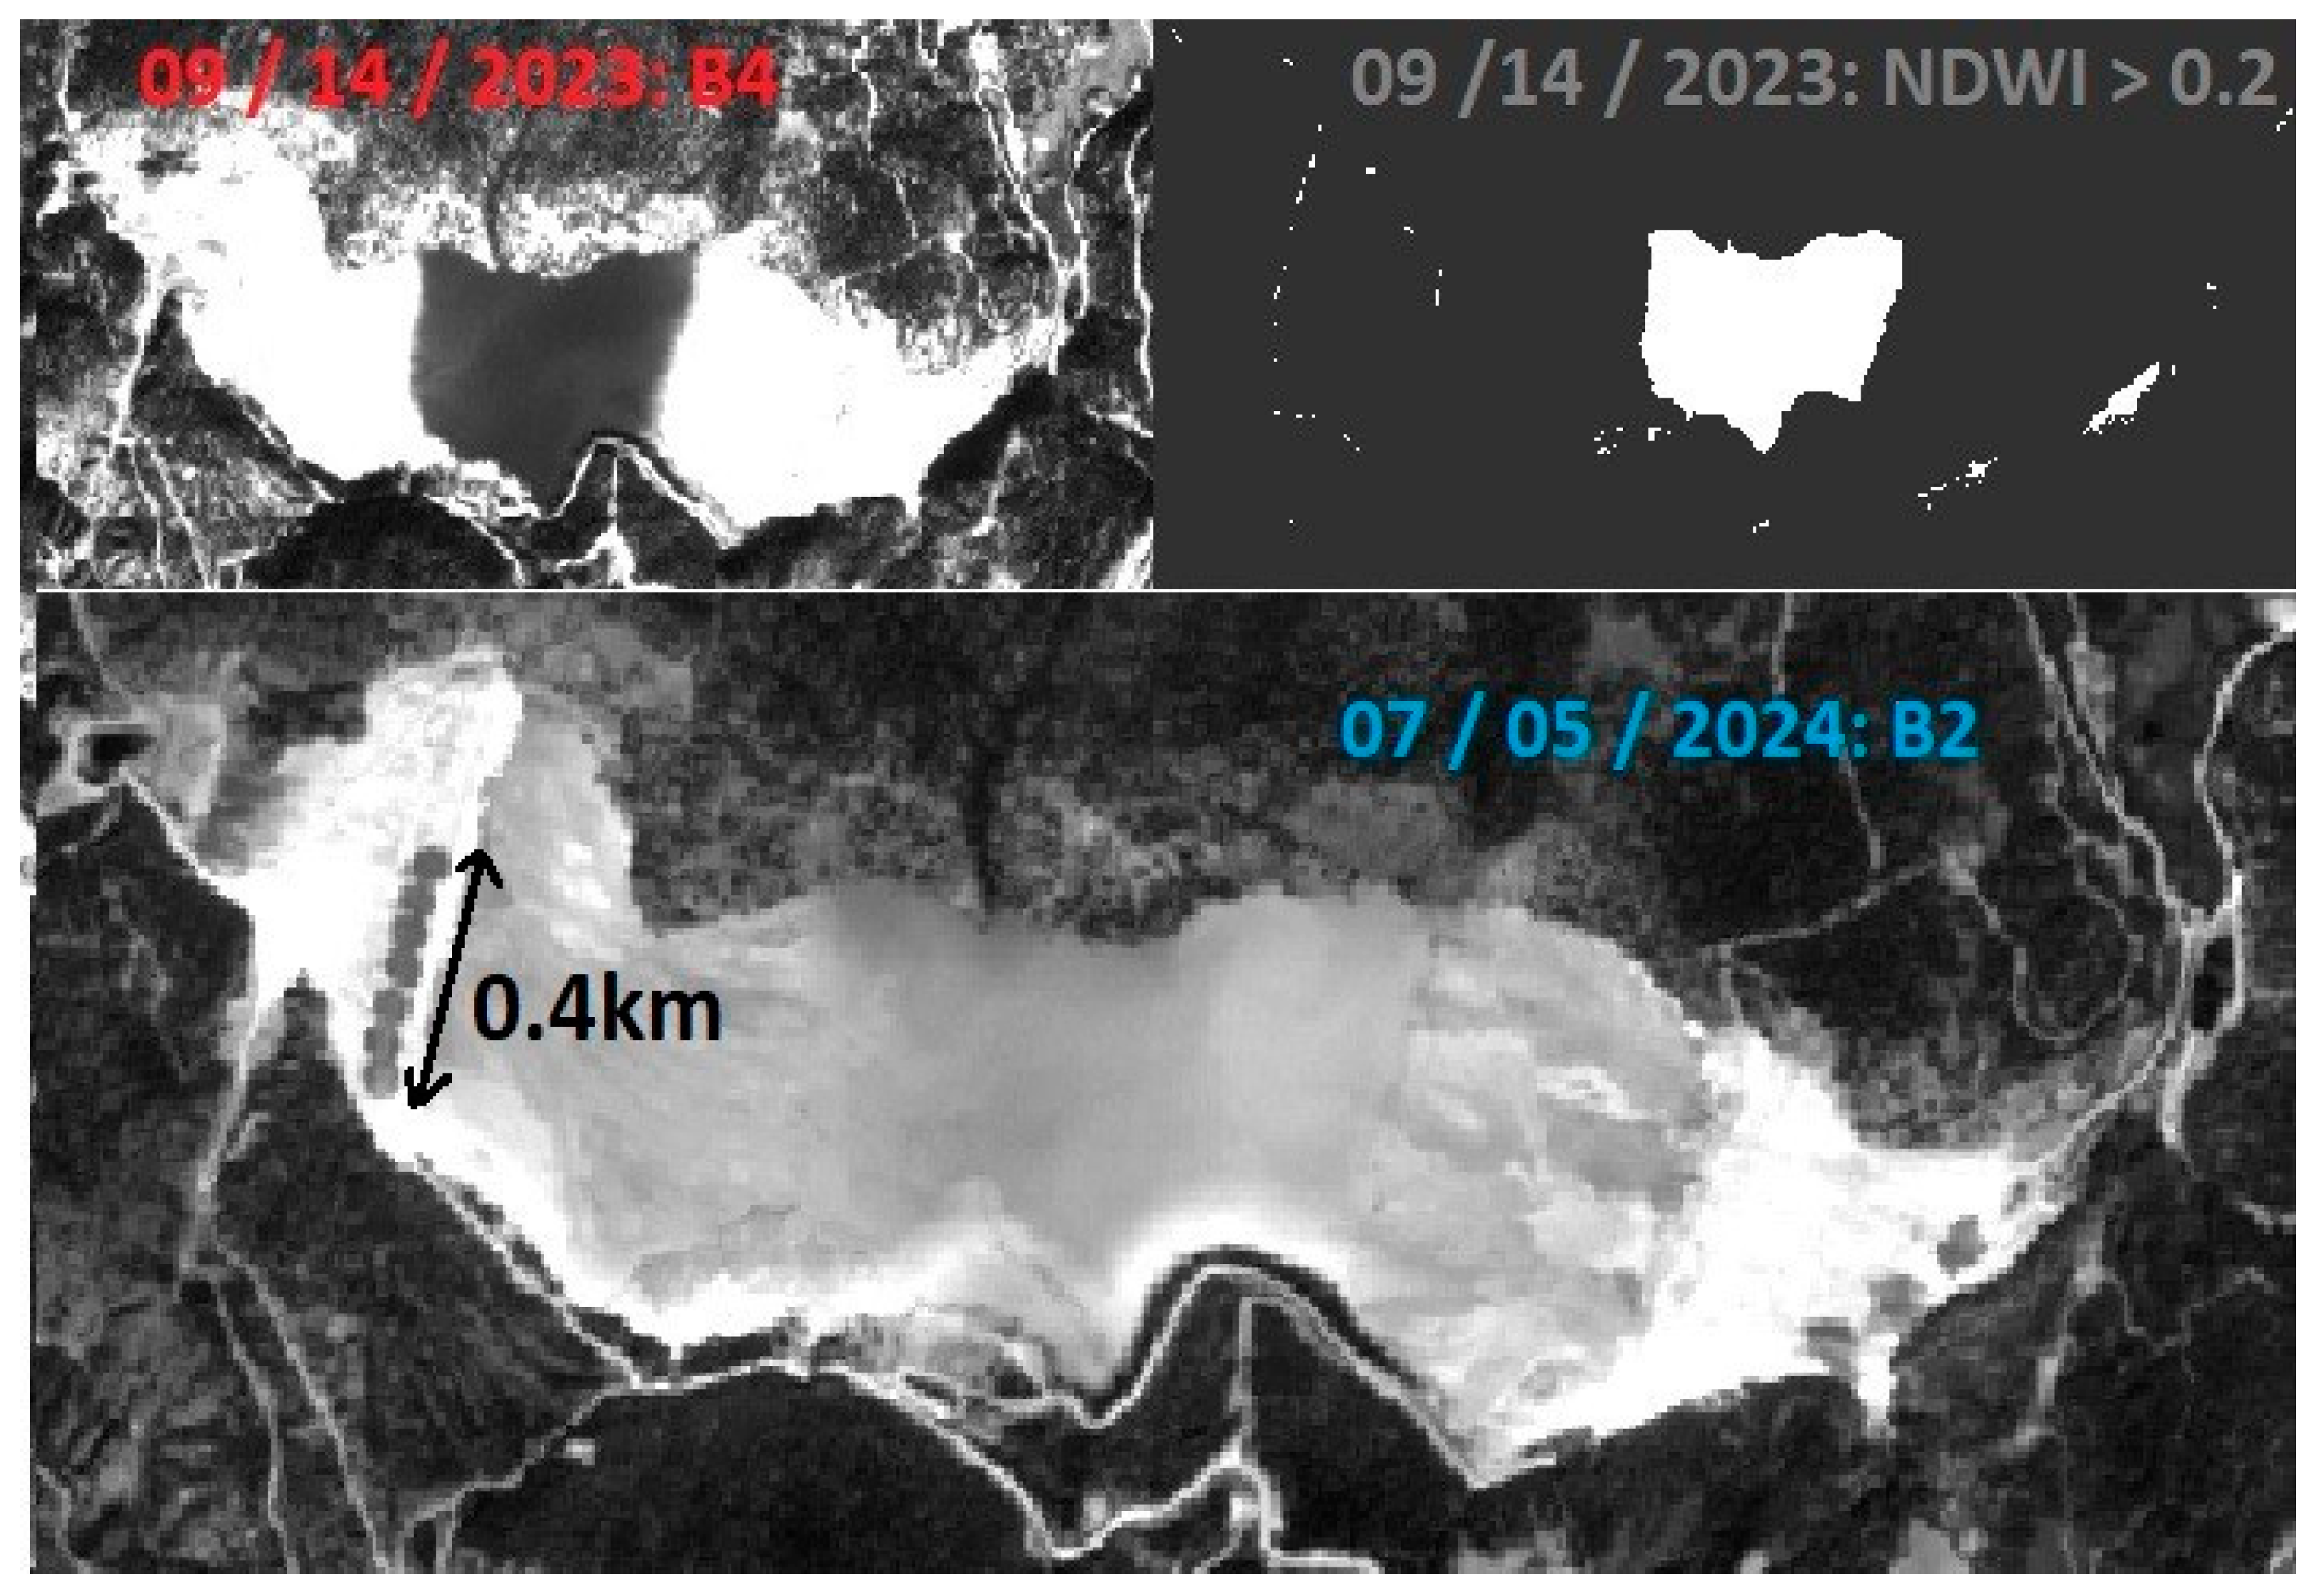
Figure 4.
West/East Dam FEFLOW analysis of 2023 2 dam system indicates hydraulic head in TSF foundation upstream of West and East starter dams is approximately constant at 810m, in contrast to 2014 piezometer readings of VWP10-05W-3/VWP10-01E-3 in West/East Dam upstream foundations in excess of 835m/845m.
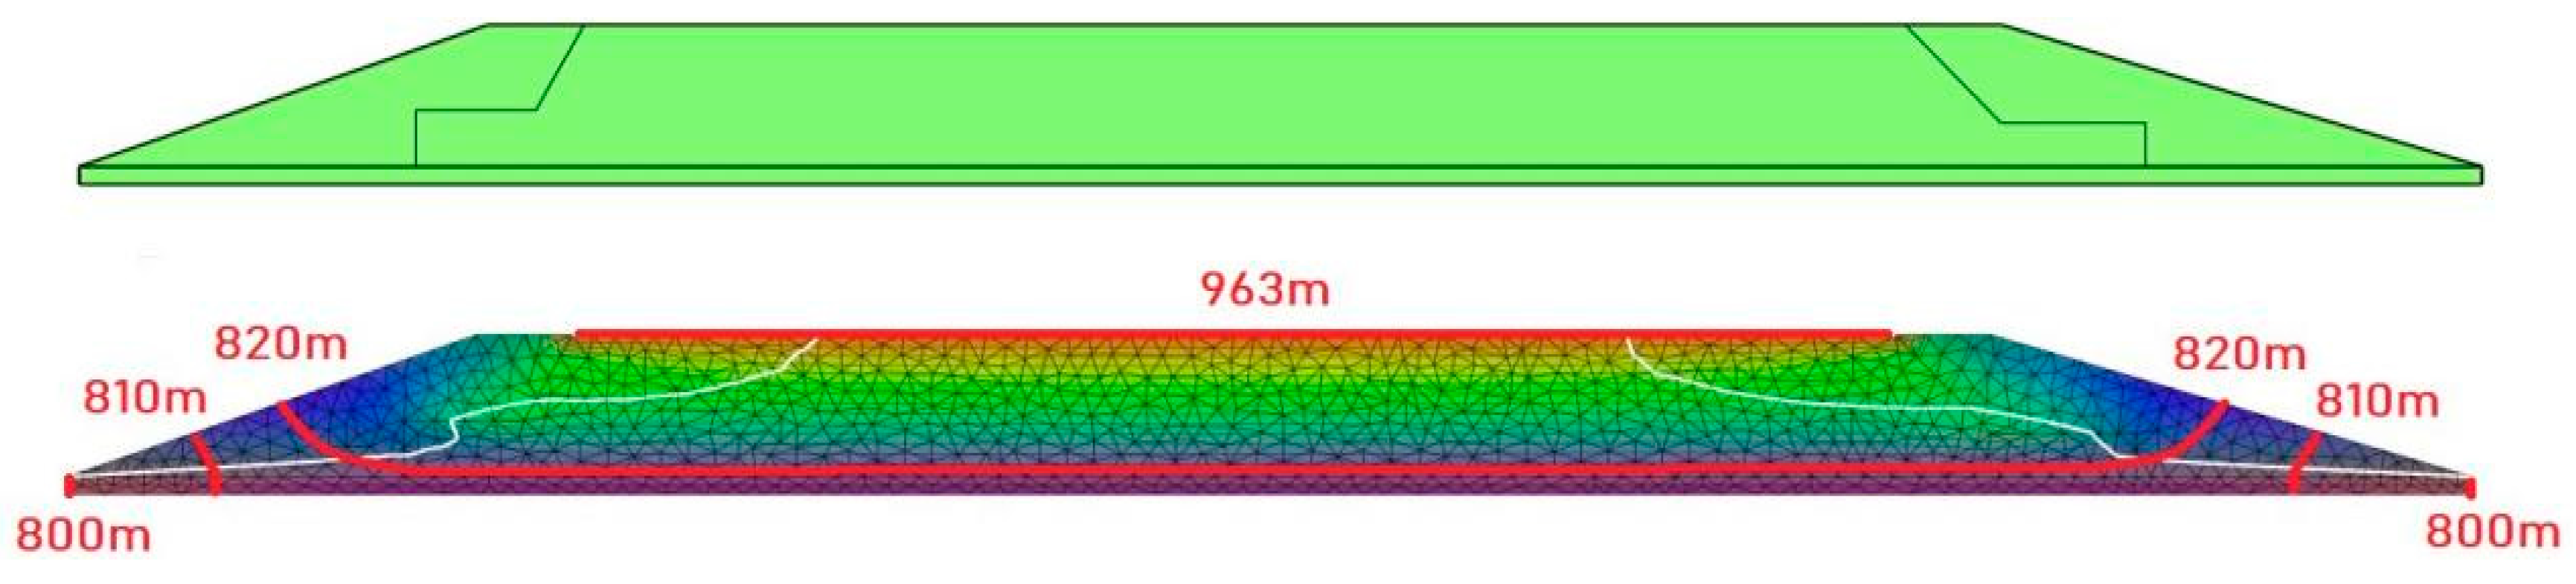
Figure 5.
West/East Dam FEFLOW 2023 steady state seepage analysis with drain function, boundary conditions, and material permeabilities adjusted so the analysis hydraulic heads are in approximate agreement with 2023 piezometer readings.
Figure 5.
West/East Dam FEFLOW 2023 steady state seepage analysis with drain function, boundary conditions, and material permeabilities adjusted so the analysis hydraulic heads are in approximate agreement with 2023 piezometer readings.
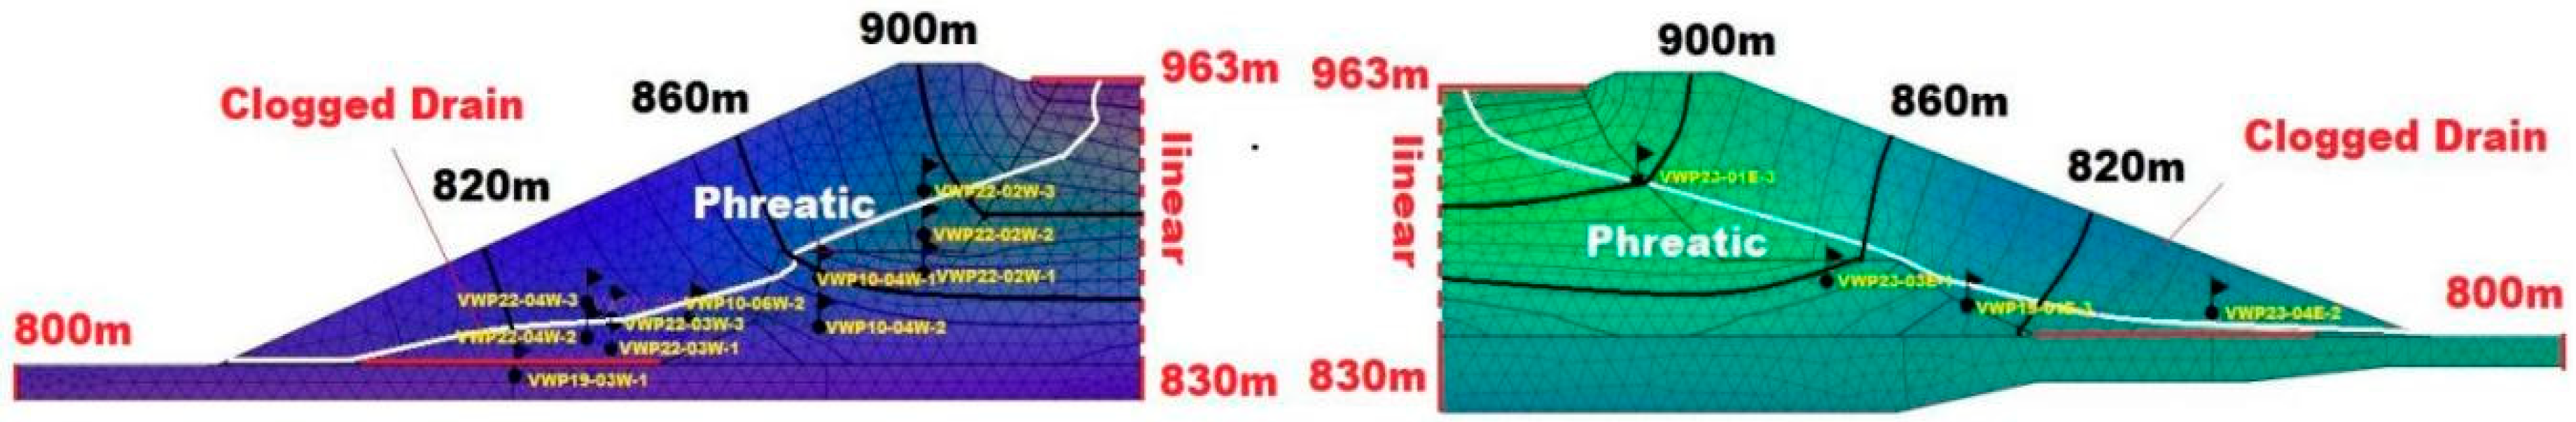
Figure 6.
West/East Dam FEFLOW 2023 steady state unsaturated seepage analyses showing degree of water saturation of downstream slopes.
Figure 6.
West/East Dam FEFLOW 2023 steady state unsaturated seepage analyses showing degree of water saturation of downstream slopes.
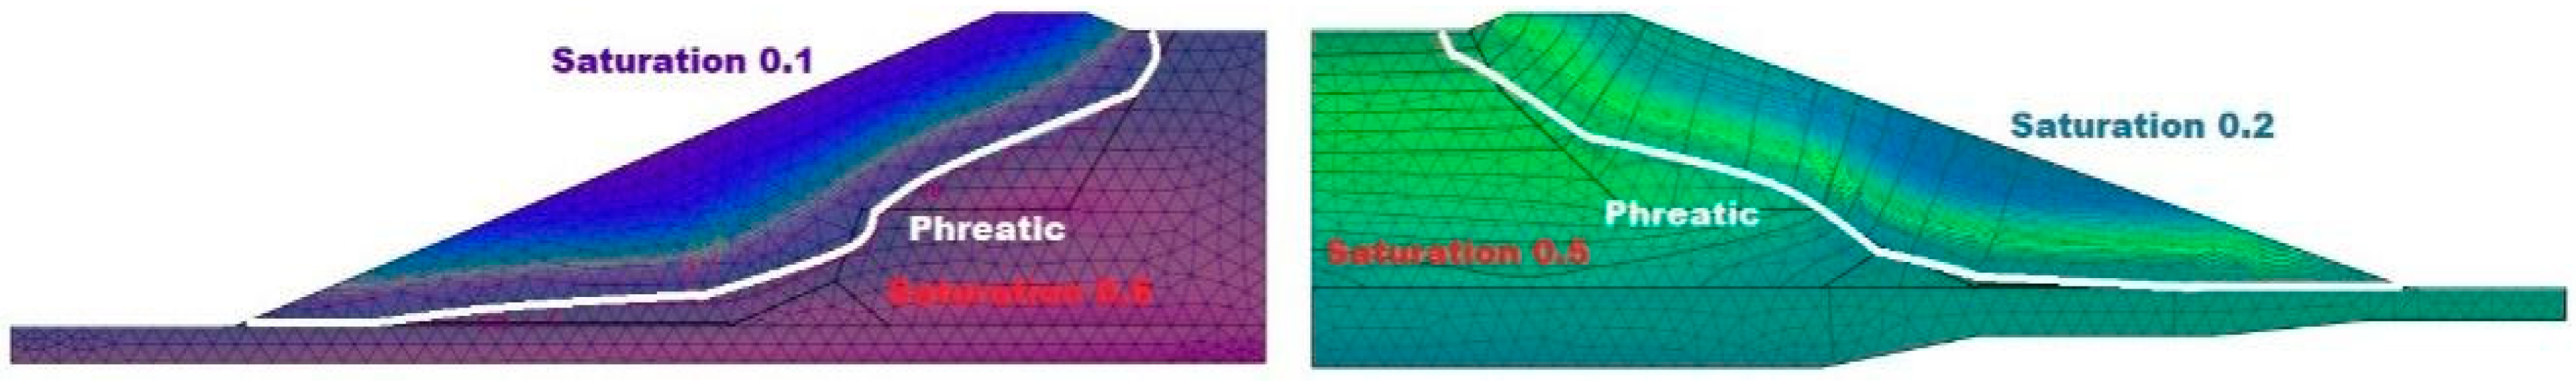
Figure 7.
West/East Dam FEFLOW 2023 transient seepage analysis results for 3 day probable maximum flood decreasing dam freeboard by 3m.
Figure 7.
West/East Dam FEFLOW 2023 transient seepage analysis results for 3 day probable maximum flood decreasing dam freeboard by 3m.
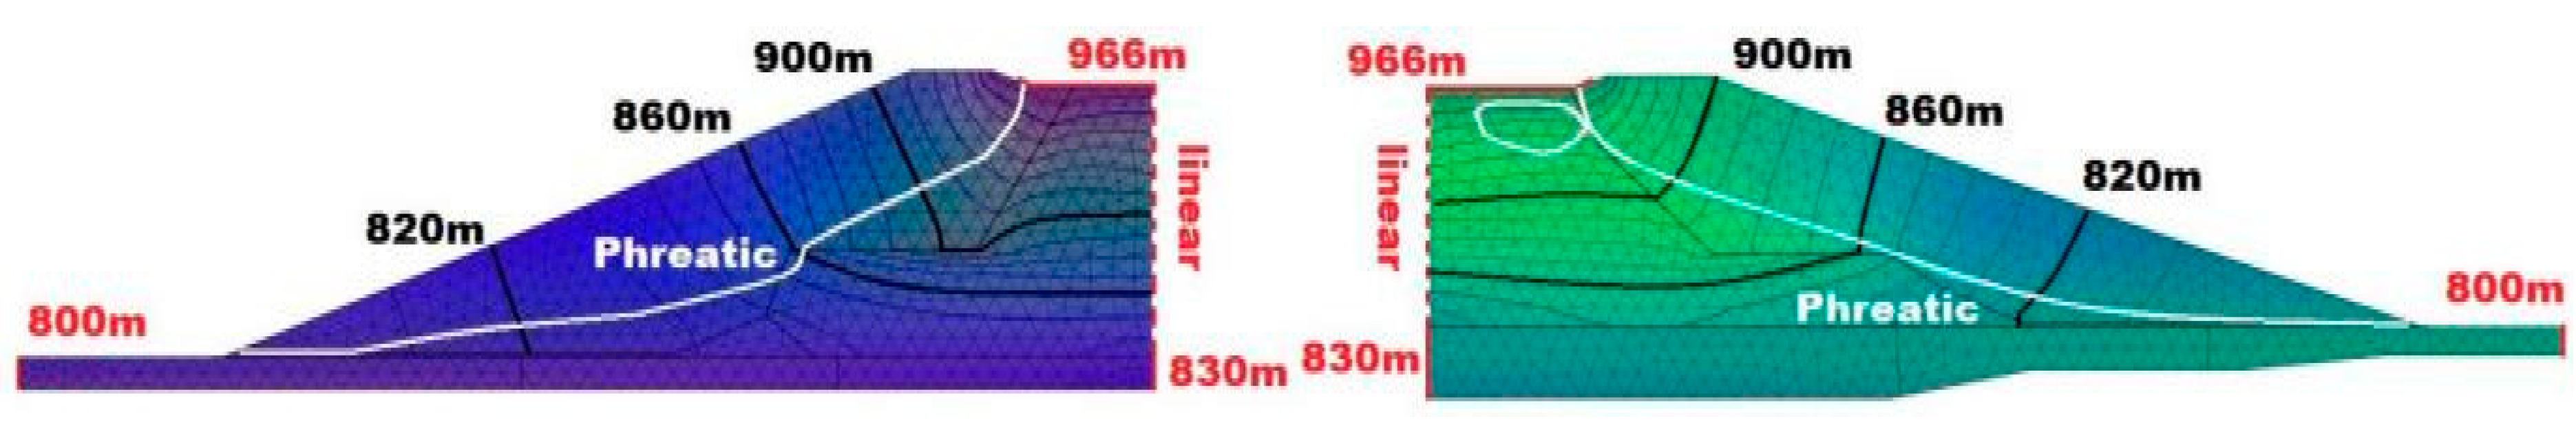
Figure 8.
FLAC2D sketch of above foundation tailings/cycloned sand material in 2025 West/East Dam cross sections B2/A1 divided into zones 1:compacted cycloned sand, 2:uncompacted cycloned sand, 3:cyclone overflow+tailings, 4:tailings, 5:water saturated cycloned sand based on the 1989 TSF Design Review, and the 2014 and 2023 ADSI reports. Zone 5 in each dam is distinguished from Zone 2 based on the results of 2019 CPT tests and 2023 piezometer data.
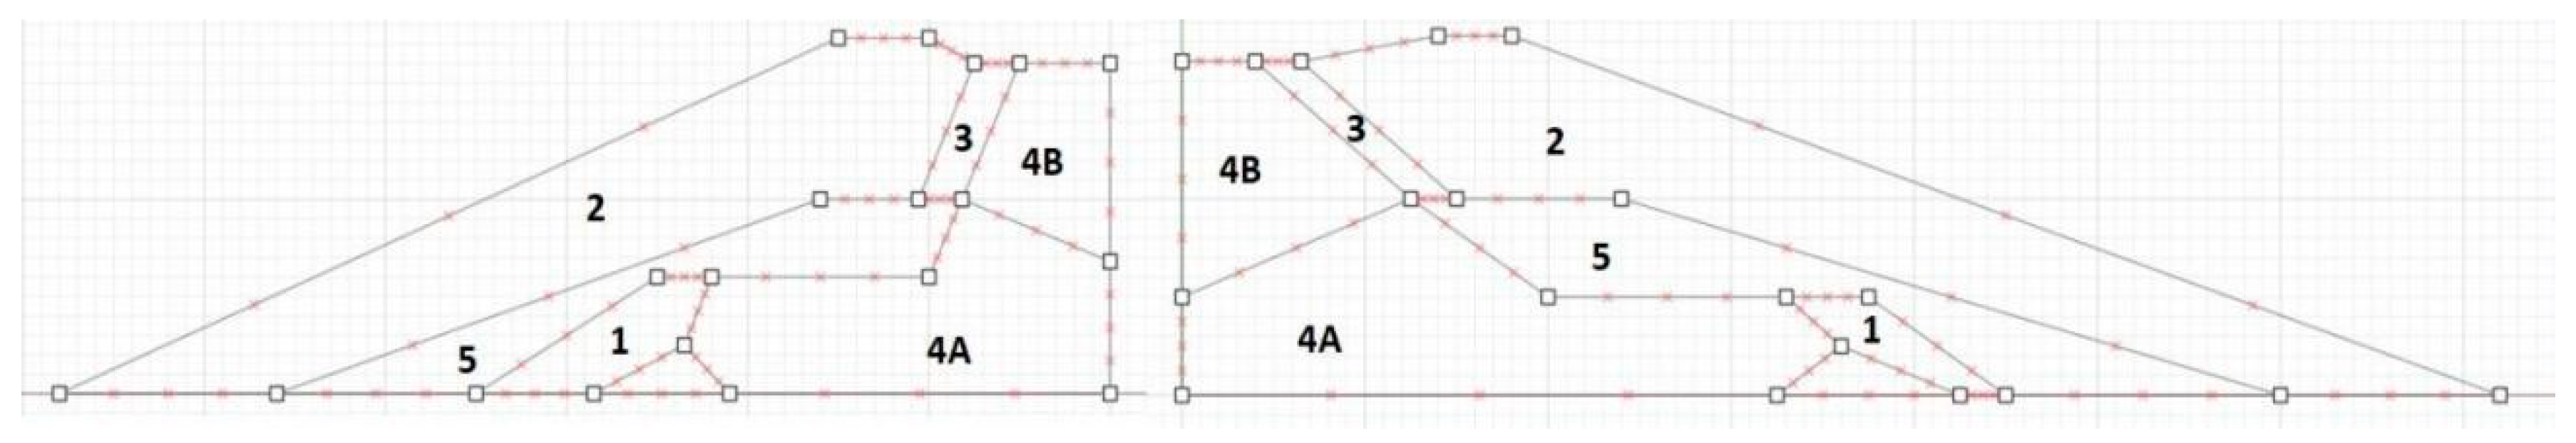
Figure 9.
Post-liquefaction FoS computation Slide3 results. Slip surfaces returned by classic ellipsoidal search with assignment of residual undrained shear strength ratios 0.22 to zone 4A, 0.07 to zone 4B, and 0.055 to zones 3 and 5.
Figure 9.
Post-liquefaction FoS computation Slide3 results. Slip surfaces returned by classic ellipsoidal search with assignment of residual undrained shear strength ratios 0.22 to zone 4A, 0.07 to zone 4B, and 0.055 to zones 3 and 5.
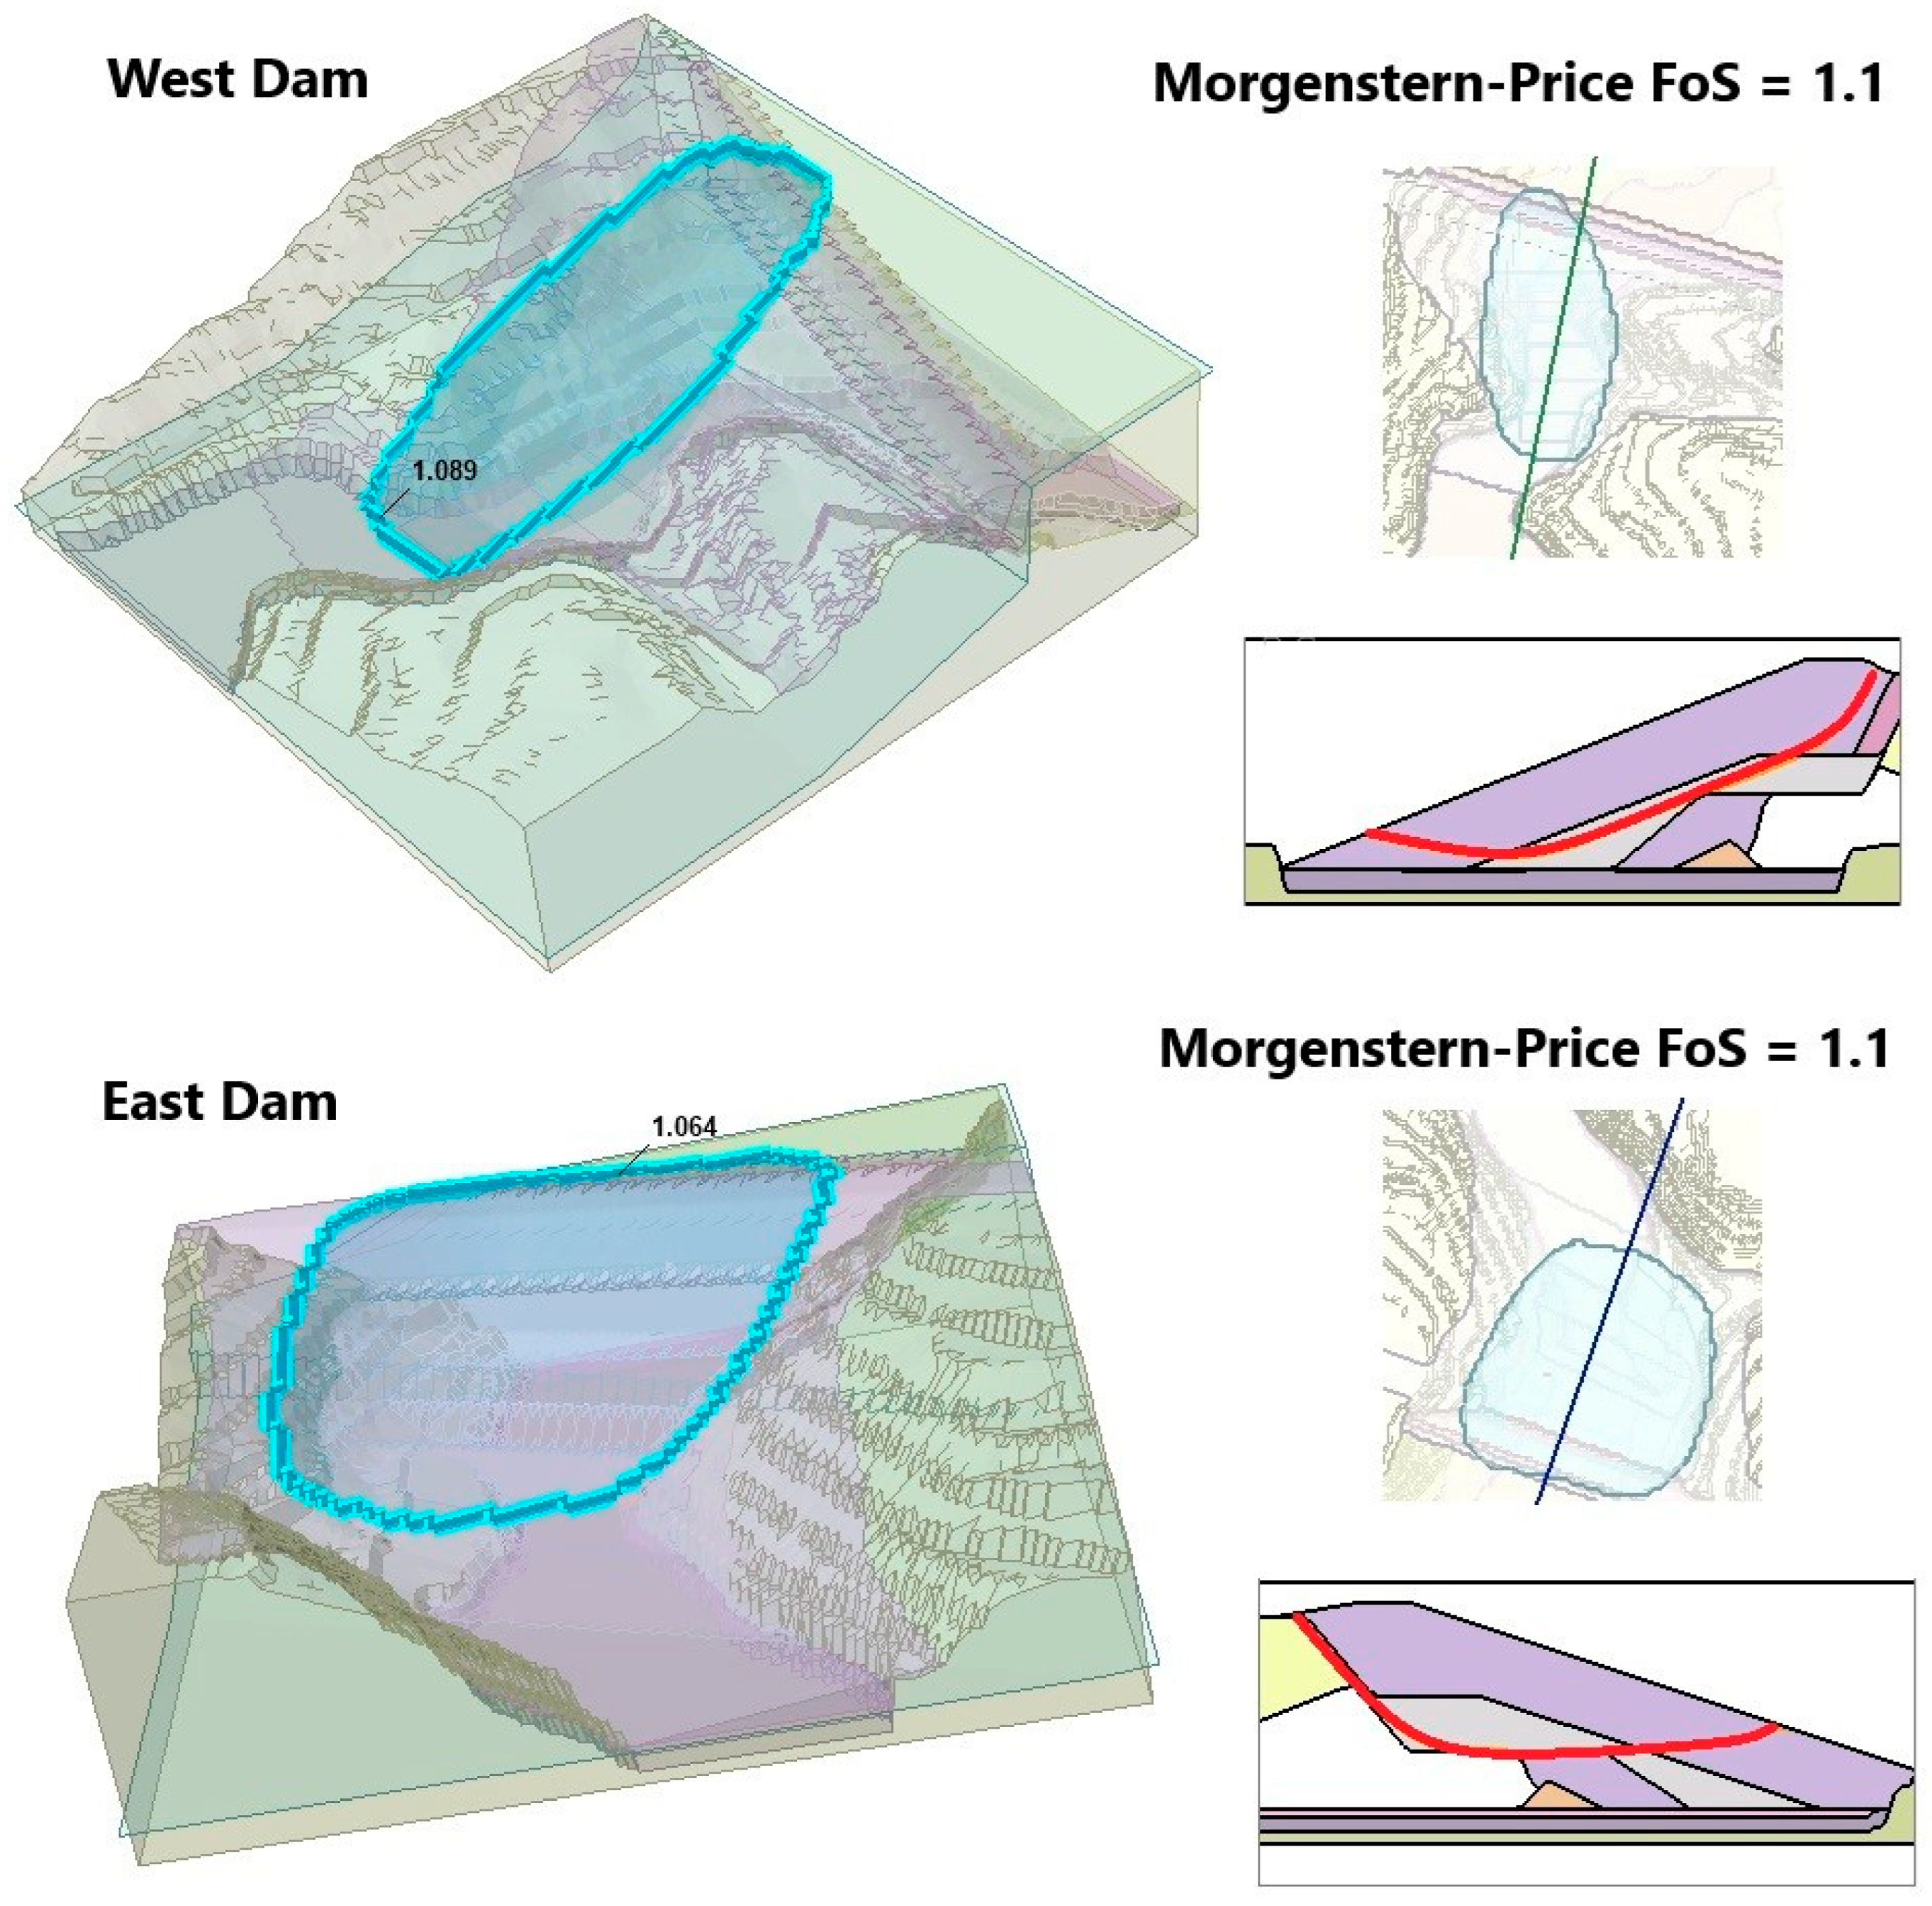

Table 1.
Slide2 model parameters.
| Material | Model | Parameters |
|---|---|---|
| cycloned sand new tailings lacustrine clay starter dam sand and gravel old tailings |
MC MC S MC MC MC |
c = 0, ϕ = 32, 18kN/m3 c = 0, ϕ = 27, 17kN/m3 Su/σv′= 0.24, 18kN/m3 c = 0, ϕ = 36, 21kN/m3 c = 0, ϕ = 36, 23kN/m3 c = 0, ϕ = 32, 20kN/m3 |
Table 2.
ADSI reported tailings beach lengths.
| Year | West/East Beach Length (m) |
|---|---|
| 2014 | > 500 / > 200 |
| 2015 | > 300 / > 100 |
| 2016 | > 500 / > 300 |
| 2017 | > 500 / > 300 |
| 2018 | > 500 / > 300 |
| 2019 | > 500 / > 400 |
| 2020 | > 300 / > 300 |
| 2021 | > 600 / > 500 |
| 2022 | > 300 / > 300 |
| 2023 | > 600 / > 500 |
Table 3.
TSF drains.
| Name | Time |
|---|---|
| Starter Dam Toe Drains | 1970s |
| Starter Dam Drainage Blankets | 1970s |
| Finger Drains | 1970s |
| Rock Crest Drains | 1980s |
| Draintube Crest Drains | 2014 |
| Toe Drain Extensions | 2017 |
Table 4.
ADSI reported drain seepage flows.
| Year | West: Sump/T/RC (L/s) | East: T/RC (L/s) |
|---|---|---|
| 2014 | ?/?/0.5 | 54/0 |
| 2015 | 20/3.4/0.3 | 19/0 |
| 2016 | 30/5/0.2 | 25/0 |
| 2017 | 40/6/0.2 | 24/0 |
| 2018 | 50/5/0.2 | 34/0 |
| 2019 | 60/?/0.1 | 30/0 |
| 2020 | 20/?/? | ?/? |
| 2021 | 15/?/0 | 26/0 |
| 2022 | 15/?/0 | 25/0 |
| 2023 | 10/?/0 | ?/0 |
Table 5.
Dam material permeabilities.
| Material | Ks (m/s) | Kv/Kh |
|---|---|---|
| fluvial sand/gravel | 1 · 10−3 | 1 |
| lacustrine clay | 2.5 · 10−7 | 1 |
| bedrock | 0 | 1 |
| starter dam | 1 · 10−6 | 1 |
| tailings | 1 · 10−7 | 0.05 |
| cycloned sand | 5 · 10−5 | 1 |
| drains | 1 | 1 |
Table 6.
Dam material grain sizes.
| Material | D15 (mm) | D85 (mm) |
|---|---|---|
| Foundation Sand/Gravel | 0.07 | 3 |
| Copper Tailings | 0.04 | 0.1-0.2 |
| Cycloned Sand | 0.05 | 0.1-0.3 |
Table 7.
Post-liquefaction FoS values.
| West Dam | N=8 | N=10 | N=20 |
| ϕ = 29◦ | 0.96 | 0.99 | 1.15 |
| ϕ = 30.5◦ | 1.01 | 1.04 | 1.20 |
| ϕ = 32◦ | 1.06 | 1.09 | 1.25 |
| ϕ = 33.5◦ | 1.11 | 1.15 | 1.31 |
| ϕ = 35◦ | 1.17 | 1.20 | 1.36 |
| East Dam | N=8 | N=10 | N=20 |
| ϕ = 29◦ | 0.95 | 0.99 | 1.21 |
| ϕ = 30.5◦ | 0.99 | 1.03 | 1.25 |
| ϕ = 32◦ | 1.04 | 1.06 | 1.30 |
| ϕ = 33.5◦ | 1.09 | 1.14 | 1.35 |
| ϕ = 35◦ | 1.14 | 1.20 | 1.41 |
Disclaimer/Publisher’s Note: The statements, opinions and data contained in all publications are solely those of the individual author(s) and contributor(s) and not of MDPI and/or the editor(s). MDPI and/or the editor(s) disclaim responsibility for any injury to people or property resulting from any ideas, methods, instructions or products referred to in the content. |
© 2025 by the authors. Licensee MDPI, Basel, Switzerland. This article is an open access article distributed under the terms and conditions of the Creative Commons Attribution (CC BY) license (http://creativecommons.org/licenses/by/4.0/).
Copyright: This open access article is published under a Creative Commons CC BY 4.0 license, which permit the free download, distribution, and reuse, provided that the author and preprint are cited in any reuse.


