
Submitted:
20 January 2025
Posted:
20 January 2025
You are already at the latest version
Preprints on COVID-19 and SARS-CoV-2
Abstract
Background/Objectives: Obesity is a rising public health concern in Africa, with aggravating effects on several diseases including the recent COVID-19 pandemic. We analyzed the epidemiology of bioimpedance analysis-based adipose obesity and evaluated its predictive potential and clinical value for SARS-CoV-2 infection. Methods: A one-year cross-section study was conducted at seven referral COVID-19 centers in the town of Douala, Cameroon. Demographic, anthropometric, and clinical data were obtained from each participant. Body composition was estimated using body mass index (BMI), body fat (BF), and visceral fat (VF). Results: The adipose obesity was evaluated using BF and VF. The overall prevalence of obesity was 27.1%, 46.2%, and 28.8% using BMI, BF, and VF, respectively. Discrepancies were noted between BMI, BF, and VF for identifying obese people. The strongest risk factors of BF-related obesity were BMI ≥ 30 Kg.m-2 (aOR = 25.32, p < 0.0001) and university level (aOR = 3.97, p = 0.02), while being male (aOR = 4.68, p < 0.0001), advanced age (aOR = 2.01 to 3.25, p < 0.05), university level (aOR = 4.14, p = 0.04), and BMI ≥ 30 Kg.m-2 (aOR = 4.38, p < 0.0001) were the strongest risk factors for high VF levels. VF was a consistent risk factor for SARS-CoV-2 infection, especially in women. BF and VF had AUC values < 0.75. Conclusions: This study outlined a high burden of adipose obesity with an interesting predictive potential, especially in women, but a poor clinical utility, for the screening of SARS-CoV-2 infection.
Keywords:
Adipose obesity
; bioelectrical impedance analysis
; reliability
; SARS-CoV-2 infection
; Cameroon
1. Introduction
Yet four years after the coronavirus disease 2019 (COVID-19) pandemic, caused by severe acute respiratory syndrome coronavirus-2 (SARS-CoV-2), there are still a great number of studies published on the virus thereby outlining the fact that unanswered questions need to be elucidated till now. COVID-19 imposed a high public health burden across the world, with high rates of morbidity and mortality, especially in developed countries (e.g., USA, Japan, European Union region) and some African countries (e.g., Nigeria, South Africa) [1]. In other African settings, the SARS-CoV-2 circulated at low rates, while other studies revealed its circulation at higher rates in asymptomatic individuals [2,3]. Also, COVID-19 has directly and indirectly provoked difficulties in combatting other major diseases such as malaria or cancer [4]. The future emergence and spread of benign and pathogenic microorganisms is highly probable given several favouring factors like anthropical activities and climate change [5,6,7].
Epidemiological and clinical studies on COVID-19 identified a large number of risk factors for morbidity and/or mortality. Cardiovascular and respiratory diseases and associated morbidities, e.g., obesity, diabetes mellitus, and metabolic syndrome, have been identified as one of the top risk factors for infection, morbidity, and fatality [8,9,10]. Given the upsurge of these comorbidities and the lack of preparedness of African countries this last decade, the majority of models had predicted COVID-19-induced hecatombs in the continent. Indeed, at the onset of the pandemic, an obvious disproportion between developing and developed countries regarding diagnostic tools (i.e., nucleic acid amplification tests, NAATs) has been observed. A handful of African countries, such as South Africa and those in the northern part of the continent, could afford such NAATs, while the bulk of countries were living off donations. Given, the high cost of these NAATs, the identification and validation of reliable and affordable tools such as biomarkers have been proposed as seen for other major diseases [11]. In this context, a panoply of biomolecules and conditions (e.g., blood parameters, immune biomolecules, hormones/hormone-like molecules, body mass index - BMI) have been investigated as potential biomarkers for the prognosis, diagnosis, therapy, and prediction of COVID-19 outcomes [12,13,14,15,16].
Some studies outlined that overweight (BMI 25 – 29.9 Kg.m-2) and obesity (BMI ≥ 30 Kg.m-2) were good predictors of COVID-19-related morbidity and mortality [14,17,18]. The prevalence of malnutrition, especially obesity, is dramatically high and alarming in Africa [19,20]. The mechanism (s) through which obesity exposes individuals to a higher risk of infection, morbidity, and mortality is not completely understood. Hypotheses such as endothelial dysfunction, immune response dysregulation, chronic inflammation, or synergistic effect with some established risk factors (e.g., diabetes, cardiovascular diseases) have been proposed to explain how obesity affects the clinical course of SARS-CoV-2 infection [21,22,23]. Obesity likely plays a role central in the pathophysiology of SARS-CoV-2 infection given the fact that the potential pathophysiological mechanisms are organised around the deleterious impact of adipose tissue. Unfortunately, studies on the effect of body composition mostly focused on BMI, without a glance at the presence and distribution of adipose tissue [24]. Again, there is a scarcity of studies on the relationship between adipose tissue and COVID-19, especially in African areas such as Cameroon.
In this context, the present study was designed to analyse the burden and clinical utility of adipose obesity in COVID-19 patients living in the town of Douala, Cameroon.
2. Materials and Methods
2.1. Study Population
This study is part of a research project ‘Severe Acute Respiratory Syndrome Coronavirus-2 in Cameroon: Epidemiology and impact on haematological, hormonal, and immunological profiles’, which was approved by the Department of Biochemistry, Faculty of Sciences, The University of Douala, Cameroon, and the Ethics board of the University of Douala (N◦ 2945 CEI-UDo/12/2021/T). The details of the study sites, eligibility, and procedures/experiments have been published earlier [2,12,25].
Briefly, a hospital-based cross-sectional was conducted from January to September 2022 at seven reference centers for COVID-19 management in the town of Douala, Cameroon. These consisted of Bangue District Hospital, Cite des Palmiers District Hospital, New-Bell District Hospital, Nylon District Hospital, Deido District Hospital, Bonassama District Hospital, and Boko Medico-Social Center. Patients of Cameroonian nationality, both genders, and aged ≥ 21 years old, and willing to take part in the study were enrolled.
2.2. Data Collection and Operational Definitions
The patients underscored a physical and clinical examination by skilled nurses and medical doctors. A pre-tested structured questionnaire was designed to capture demographical, clinical, and paraclinical data (e.g., gender, age, COVID-19 vaccination status). Blood samples were collected to perform to measure clinical parameters (i.e., vitamin D, glycaemia), while nasopharyngeal samples were used to detect SARS-CoV-2 via standard molecular tests.
Anthropometric measurements (weight, height) were made to compute BMI as the Quetelet’s formula: BMI (Kg.m-2) = BW/BH2, where BW and BH are the body weight (Kg) and height (m), respectively. Patients were categorised as underweight (BMI < 18.5 kg/m2), normal (BMI 18.5– 24.9 kg/m2), overweight (BMI 25.0 – 29.9 Kg.m-2), and obese (BMI ≥ 30 Kg.m-2) [26]. Bioelectrical impedance analysis (BIA) parameters, i.e., body fat (BF) and visceral fat (VF), were measured using a smart wireless scale coupled with an Android 11.1.1 smartphone as described elsewhere [27]. Briefly, each patient was asked to take off their shoes, remove any metal objects, empty their pockets, and then climb on the scale. Electrical impulses of low intensity and frequency (10-100 KHz) were sent by the scale through the patient’s body to assess the resistance/impedance of body tissues. The BIA results were transferred and processed to an Android smartphone using the New Iwellness application v3.0 (Apple Inc., Cupertino, California, USA). The cut-off values (i.e., low, normal, high, and very high) of BF were adjusted for age (i.e., 20 – 39 years, 40 – 59 years, and ≥ 60 years) and gender (i.e., female, male) as described elsewhere [24,28]. Regarding VF, the patients were categorised as follows: normal (1 ≤ VF ≤ 9), high (10 ≤ VF ≤ 14), and very high (VF ≥ 15) [24]. Based on these cut-off values, overweight and obesity are determined when values of BF or VF are high or very high, respectively.
2.3. Statistical Analysis
Data were keyed in a Microsoft Excel sheet, coded, checked for consistency, and then exported for statistical analysis. Variables are expressed as mean ± standard deviation (SD) or frequency and percentages where appropriate. Gaussian distribution of quantitative variables was assessed by the Kolmogorov–Smirnov test [29]. The one-way analysis of variance (ANOVA) and Duncan’s post-hoc tests were used to compare the mean values of quantitative variables (e.g., BF, VF) between the categories of independent variables (e.g., gender, age). Variables with skewed distribution were analysed with non-parametric tests (i.e., Kruskal-Wallis test, Mann–Whitney test). Pearson’s chi-square test was used to compare frequency distributions. The proportions of qualitative variables were compared using Pearson’s chi-square and Fisher’s exact tests. A simple correlation analysis was performed to analyse the link between BMI and BF or VF. Receiver operating curves (ROC) were constructed, and the area under the curve (AUC) was calculated to assess the clinical reliability of BF and VF in the screening of SARS-CoV-2 infection [30]. AUC analyses were also stratified by patients’ details (i.e., gender, age, BMI, vitamin D level, and COVID-19 vaccination) to assess the influence of these variables on the association between SARS-CoV-2 infection and BF or VF. An AUC ≥ 0.75 is considered to be of good clinical utility as proposed earlier [11]. No imputation was done to analyse data. Thus, patients with missing data were excluded from statistical analyses. All two-tailed p-value < 0.05 were considered statistically significant. Data analyses were done using StatView v5.0 (SAS Institute, USA), SPSS v16 (SPSS, IBM, Inc., CA, USA), and GraphPad v8.02 (GraphPad PRISM, IBM., CA, USA).
3. Results
3.1. Description of the Study Population
The characteristics of the 420 patients included here have been presented elsewhere [2,12,25]. Briefly, the patients were mainly represented by males (52.9%). Likewise, the majority of them were working in a non-medical formal sector (57.4%) and had completed university studies (60.5%). The mean age ± SD was 42.3 ± 14.4 years. Nearly 40% of them had at least one comorbidity, with hypertension and diabetes mellitus diagnosed in 6.4% and 11.2% of them. Only 18.6% of them had received COVID-19 vaccination. About 10.2% of the patients were suffering from vitamin D deficiency. SARS-CoV-2 infection was found in 8.1% (n = 34) of the participants.
3.2. Prevalence of Obesity
The prevalence of BMI-based obesity was 27.1% (n = 114, %95CI 23.1 – 31.6%) in the study (Figure 1A). Regarding adipose and visceral obesity, the prevalence rates were estimated at 46.2% (n = 194, %95CI 41.5 – 50.9%) and 28.8% (n = 121, %95CI 24.7 – 33.3%), respectively (Figure 3B and Figure 3C). Some discrepancies between BMI and BF or VF were observed. For instance, 4.3% and 22.7% of normal BMI patients had very high levels of BF and VF, respectively (Figure 1D and Figure 1E). Also, 10.5% of BMI-based obese patients had normal BF values. These discrepancies were reflected in the weak curvilinear correlation found between i) BMI and BF (r2 = 0.38, p < 0.0001, Figure 1F), and ii) BMI and VF (r2 = 0.25, p = 0.0004, Figure 1G).
3.3. Profile of Body Fat and Visceral Fat by Patients’ Characteristics
The BF- and VF-related body composition of participants stratified by demographical, anthropometric, and clinical characteristics is summarized in Figure 2. We observed that obesity according to BF was significantly more frequent in SARS-CoV-2 uninfected patients compared to their infected counterparts (47.4% vs 32.4%, p < 0.05) (Figure 2A). The highest level of obesity was found in those aged 40 – 59 years (61.2%), followed by those aged ≥ 60 years (42.6%) and 20 – 39 years (37.6%). Very high levels of BF were more frequently found in patients working in the medical sector (50.2%, p < 0.0001), having completed university studies (47.6%, p < 0.0001), and those with BMI ≥ 30 Kg.m-2 (87.7%, p < 0.0001) (Figure 2A). In contrast, the proportion of very high VF levels was higher in SARS-CoV-2 infected patients (50.0%, p = 0.003), males (41.9%, p < 0.0001), those aged ≥ 60 years (50.0%, p < 0.0001), married ones (40.4%, p < 0.0001), and those with BMI ≥ 30 Kg.m-2 (30.7%, p < 0.0001) (Figure 2B).
3.4. Variation of BF and VF by Patients’ Details
The variation of mean values of BF and VF with regard to demographical, anthropometric, and clinical characteristics is depicted in Figure 3. Overall, BF values varied significantly by gender, age group, marital status, occupation, and vitamin D deficiency (VDD) status (Figure 3A). Mean BF levels were significantly higher in females compared to males (37.20 ± 8.29% vs 26.57 ± 9.19%, p < 0.0001). The highest value of BF (33.50 ± 9.21%) was found in patients aged ≥ 60 years, with a significant difference compared to their younger counterparts aged 20 – 39 years (p < 0.0001), but not with those aged 40 – 59 years (p = 0.47). Not surprisingly, BF values were significantly higher in individuals with BMI-related obesity than those with normal BMI or overweight (39.44 ± 7.06% vs 28.65 ± 9.71%, p < 0.0001). Likewise, participants with VDD had higher BF compared to those with normal vitamin D levels (35.14 ± 8.68% vs 31.17 ± 10.35%, p = 0.01) (Figure 3A).
Figure 3.
Variation of body fat (A) and visceral fat (B) by patients’ details. Note. BMI: Body mass index, SARS-CoV-2: Severe acute respiratory syndrome coronavirus 2, COVID-19: Coronavirus disease 2019. One-way analysis of variance (ANOVA) and Duncan’s post-hoc tests were used to compare groups. Statistically significant at *p < 0.05, **p < 0.01, and ***p < 0.0001.
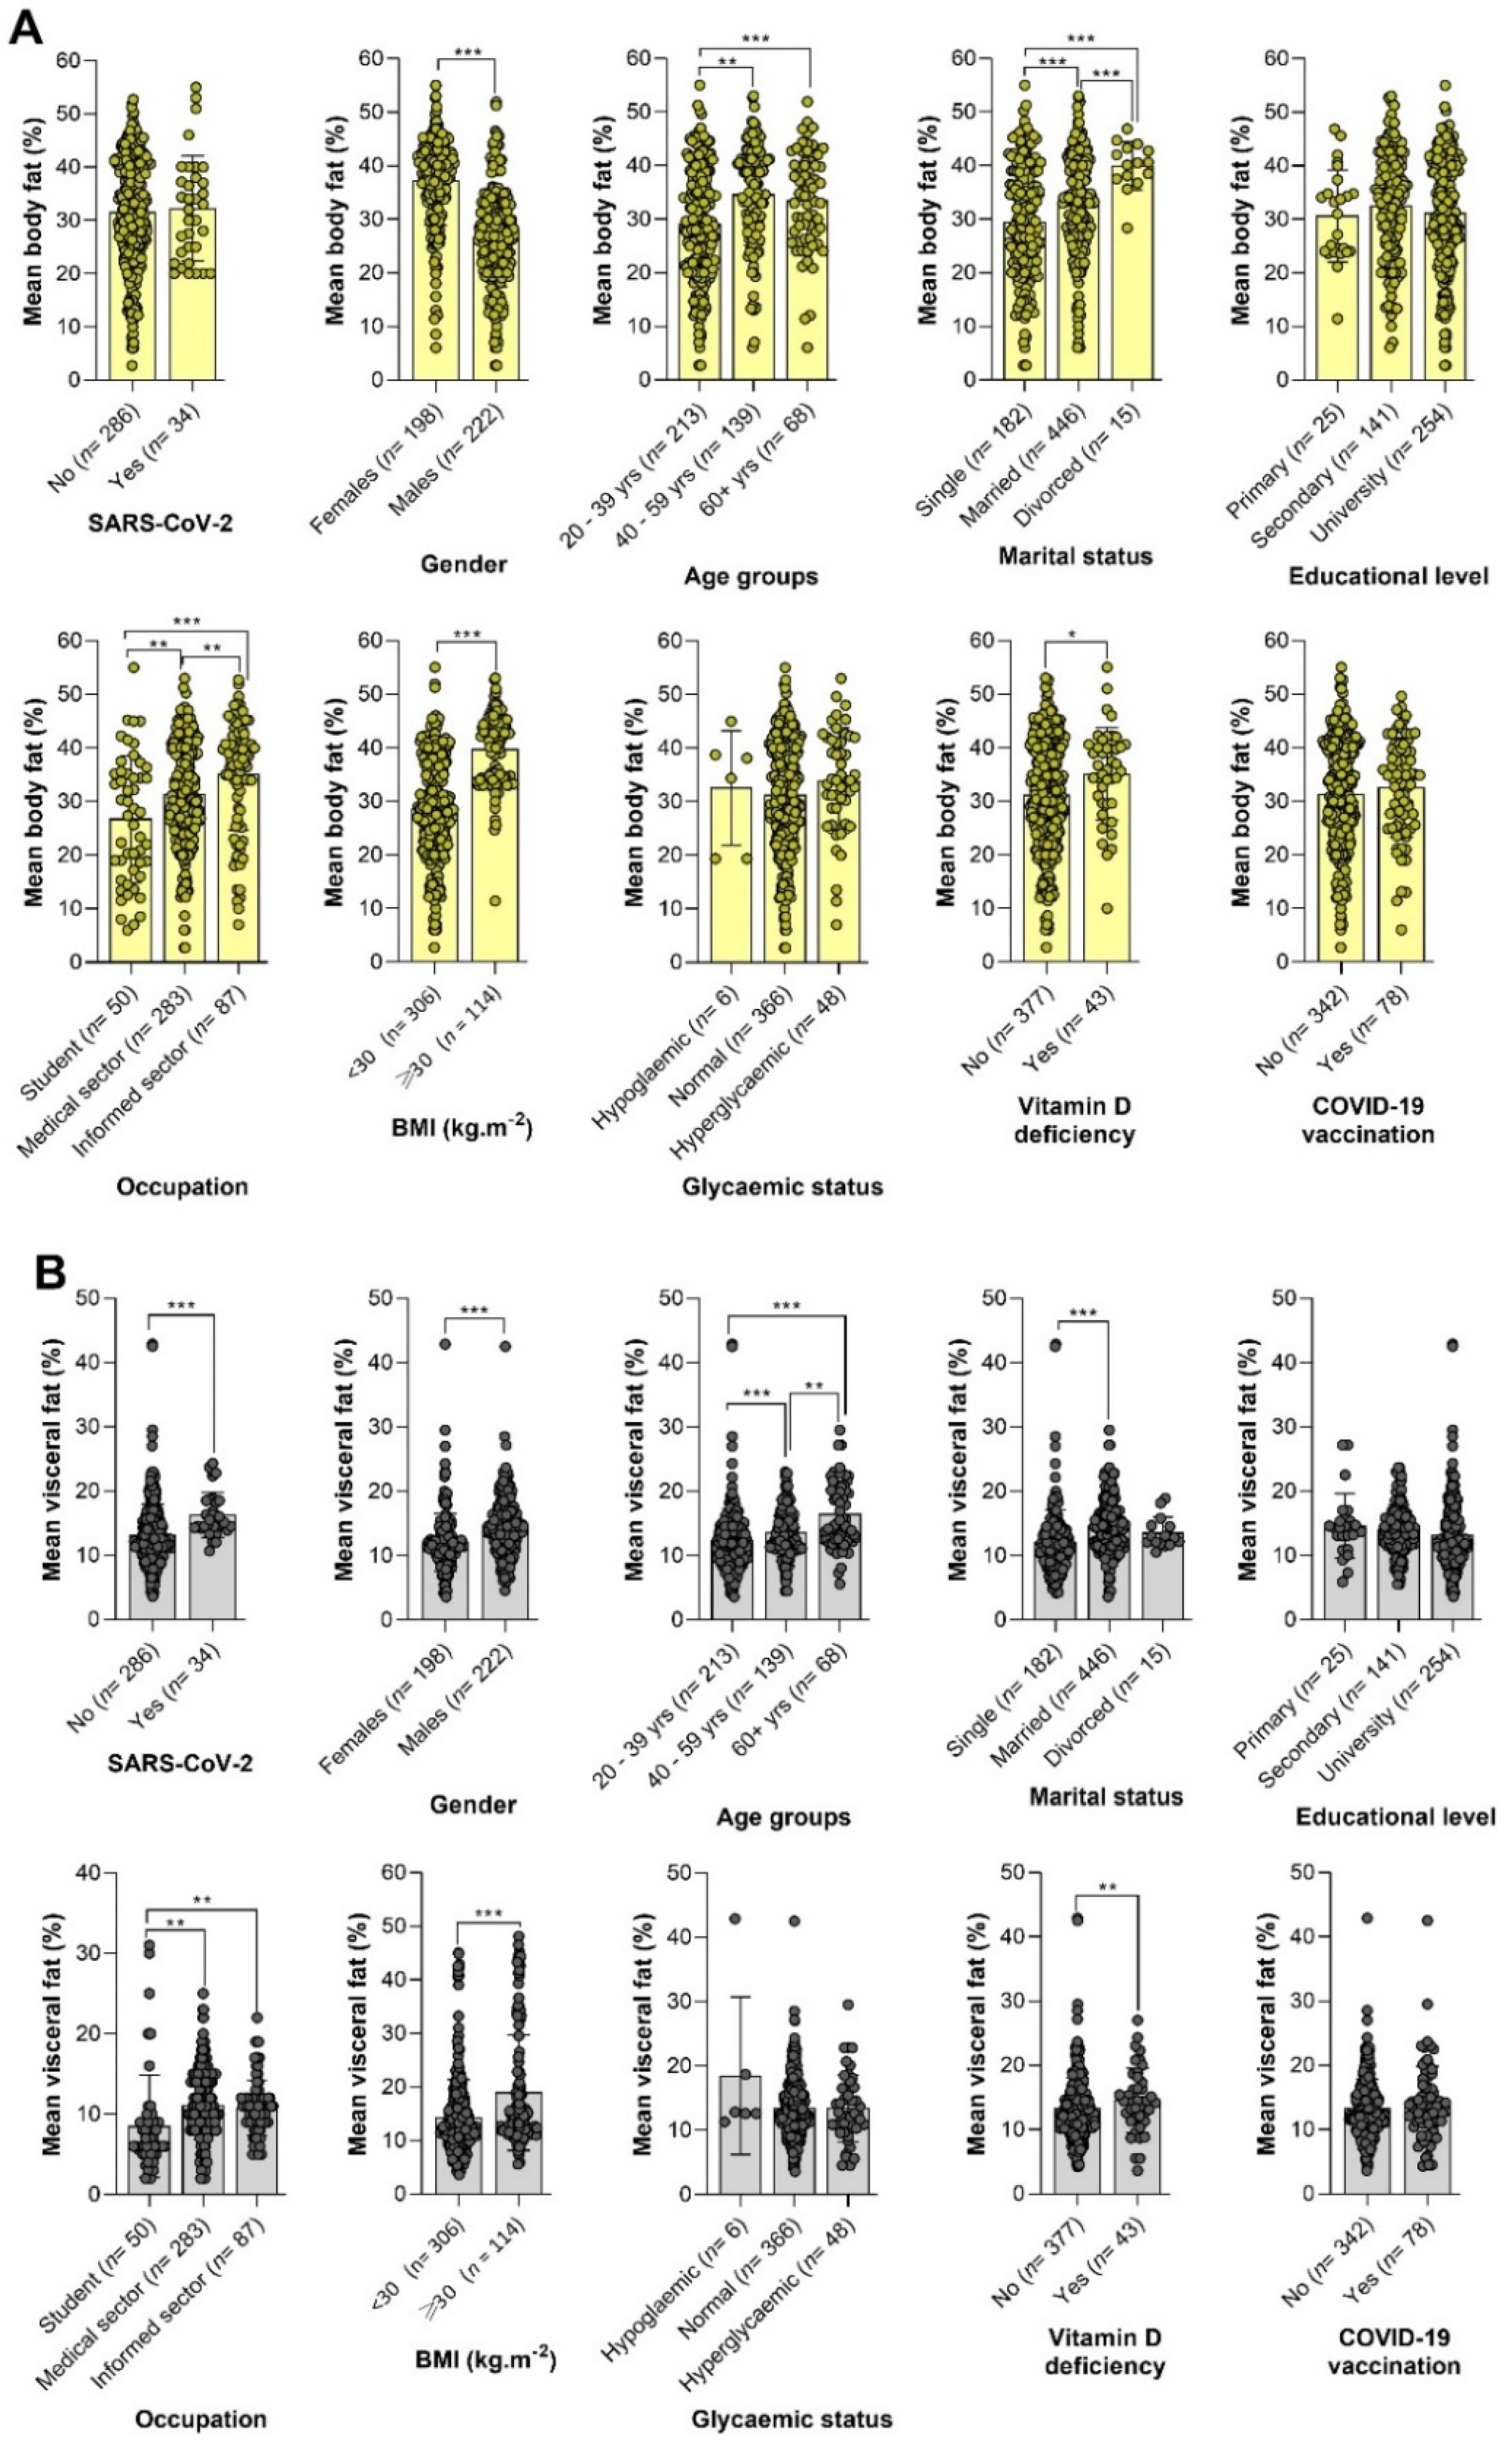
Variables included SARS-CoV-2 infection, gender, age group, marital status, occupation, BMI, and VDD status significantly modulated the values of VF (Figure 3B). Indeed, mean VF values were higher in SARS-CoV2-infected individuals compared to their negative counterparts (16.28 ± 3.50 % vs 13.17 ± 4.81%, p = 0.0001). Similarly to BF, levels of VF were significantly higher in participants aged ≥ 60 years (16.43 ± 5.11%) compared to those aged 20 – 39 years (12.37 ± 4.91%, p < 0.0001) and 40 – 59 years (13.57 ± 3.71 %, p = 0.02). Females had lower mean VF levels compared to males (12.07 ± 4.49% vs 14.64 ± 4.74%, p < 0.0001). Patients with BMI ≥ 30 %.m-2 had higher VF values compared to those with BMI < 30 %.m-2 (13.12 ± 4.00 % vs 9.79 ± 4.21 %, p < 0.0001) (Figure 3B).
3.5. Determinants of Body Fat-Based Adipose Obesity
The univariate logistic analysis identified four factors (i.e., age, marital status, occupation, and BMI ≥ 30 Kg.m-2) associated with adipose obesity (Table 1). The participants aged 40 – 59 years were more than twofold (cOR = 2.62, 95%CI 1.69 – 4.06, p < 0.0001) at risk of visceral obesity compared to those aged 20 – 39 years. The risk of obesity was higher in those working in the medical sector (cOR = 4.03, 95%CI 1.94 – 8.37, p = 0.0002) or the informal sector (cOR = 3.73, 95%CI 1.66 – 8.40, p = 0.001) compared to students. Likewise, the risk of obesity was three times higher (cOR = 2.81, 95%CI 1.87 – 4.23, p < 0.0001) in married and sixteen times higher (cOR = 16.11, 95%CI 8.75 – 29.64, p < 0.0001) in those with BMI ≥ 30 Kg.m-2 compared to singles and those with BMI < 30 Kg.m-2, respectively (Table 1).
Six associated factors were identified via the multivariate logistic model viz. gender, age, education, marital status, occupation, and BMI ≥ 30 Kg.m-2. For instance, the odds of obesity were higher in males (aOR = 2.47, 95%CI 1.43 – 4.25, p = 0.001) compared to females. Similarly, the risk of obesity was higher in those having completed university studies (aOR = 3.97, 95%CI 1.23 – 12.88, p = 0.02), married (aOR = 2.52, 95%CI 1.42 – 4.49, p = 0.001), in those working in the medical sector (aOR = 2.44, 95%CI 1.01 – 5.88, p = 0.04), and those with BMI ≥ 30 Kg.m-2 (aOR = 25.32, 95%CI 12.18 – 52.66, p < 0.0001). In contrast, the chances of obesity were reduced by 70% (aOR = 0.30, 95%CI 0.13 – 0.70, p = 0.005) in those aged ≥ 60 years compared to those aged 20 – 39 years (Table 1).
3.6. Determinants of Visceral Obesity
Six variables, i.e., gender, age, marital status, occupation, BMI, and VDD, were found to be associated with visceral obesity using univariate logistic regression analysis. The risk of visceral obesity was nearly four times higher (cOR = 2.71, 95%CI 1.33 – 5.51, p = 0.0005) in males compared to females. Similarly, being aged 40 – 59 years (cOR = 2.08, 95%CI 1.27 – 3.39, p = 0.0003), or more than 60 years (cOR = 4.20, 95%CI 2.34 – 7.53, p < 0.0001), working in the medical sector (cOR = 3.82, 95%CI 2.29 – 6.04, p = 0.003), being married (cOR = 3.72, 95%CI 2.29 – 6.04, p < 0.0001), having BMI ≥ 30 Kg.m-2 (cOR = 3.39, 95%CI 2.02 – 5.69, p < 0.0001), and suffering from VDD (cOR = 1.92, 95%CI 1.00 – 3.66, p = 0.04) were also risk factors of visceral obesity (Table 2).
In the multivariate analysis, six variables (e.g., gender, age, education, marital status, BMI, and VDD), were associated with visceral obesity. For instance, the odds of visceral obesity were higher (aOR = 4.14, 95%CI 1.07 – 17.71, p = 0.04) in those having completed university studies. As found in the univariate analysis, the risk of visceral obesity was higher in males (aOR = 4.68, 95%CI 2.65 – 8.27, p < 0.0001), those aged 40 – 59 years (aOR = 2.01, 95%CI 1.06 – 3.81, p = 0.03), those aged 60 years (aOR = 3.25, 95%CI 1.49 – 7.17, p < 0.0001), married people (aOR = 2.21, 95%CI 1.18 – 4.13, p = 0.03), those with BMI ≥ 30 Kg.m-2 (aOR = 4.38, 95%CI 2.22 – 8.64, p < 0.0001), and those diagnosed with VDD (aOR = 2.78, 95%CI 1.09 – 7.09, p = 0.03) (Table 2).
3.7. Predictive Analysis of Body Composition for SARS-CoV-2 Infection
Table 3 summarizes the logistic analysis of the predictive power of anthropometric metrics (BMI, BF, and VF) for screening for SARS-CoV-2 infection. Only VF was consistently found to be a risk factor for SARS-CoV-2 infection in both univariate analysis (cOR = 2.72, 95%CI 1.34 – 5.51, p = 0.0002) and multivariate analysis (cOR: 3.11, 95%CI 1.50 – 6.43, p = 0.002) (Table 3). We analysed the impact of gender and age on the predictive potential of adiposity indexes for the detection of SARS-CoV-2 infection. We observed confounding role of gender as a significant association was found between VF and SARS-CoV-2 infection, but not with BMI or BF, only in females both in univariate analysis (cOR = 6.75, 95%CI 2.22 – 20.52, p = 0.0008) and multivariate analysis (cOR = 6.96, 95%CI 2.26 – 21.37, p = 0.0001). Finally, the age of patients did not influence the association between adiposity indexes and SARS-CoV-2 risk.
3.8. Clinical Performances of BF and VF in the Screening of SARS-CoV-2 Infection
The AUC analysis revealed that neither BF nor VF reached a minimum AUC value of 0.75 (AUC = 0.43 for BF and AUC = 0.57 for VF) (Figure 4A). A more granular analysis revealed the impact of patients’ characteristics on the clinical reliability of BF and VF in the screening of SARS-CoV-2 infection. However, no noticeable improvement in the clinical value of BF and VF was observed after stratification of the analysis as per patients’ characteristics (i.e., gender, age, VDD, BMI, and COVID-19 vaccination) (Figure 4B-F).
4. Discussion
NAATs are the gold standard for the detection of SARS-CoV-2 infection, but these tools are costly and require a high level of expertise. In this regard, a large number of studies evaluated the predictive power and clinical utility of different molecules and parameters as potential biomarkers. BMI has been extensively studied, and the studies revealed a strong association between this anthropometric parameter and COVID-19 outcomes (e.g., severity, mortality) [17,18], but very fewer studies analysed the potential of BIA parameters, especially for the screening of SARS-CoV-2 infection. This study was conducted to analyse the predictive power and clinical utility of body and visceral fat for the detection of SARS-CoV-2 infection. Additionally, we analysed the profile and determinants of adipose obesity in Cameroonian patients.
The study revealed a high proportion of obese patients according to BF and VF, with respective rates of 46.2% and 28.8%. Stevanovic et al. reported higher estimates of BF (50.9%) and VF (38.4%) in COVID-19 patients from Serbia. Obesity is a rising public health problem in African and Asian settings such as Cameroon, Ethiopia, and India [31,32]. Several studies reported high rates of obesity in all strata of the Cameroonian population (e.g., children, and adults) [19,20].
It should be noted that we found some discrepancies between BMI and BF for the determination of obese status, even though we found a significant curvilinear correlation between these two parameters. Indeed, a non-negligible fraction (10.5%) of BMI-based obese patients had normal BF values. Such disagreement had already been reported elsewhere [24,33]. This may be explained by the fact that the measurement of BMI does not take into account parameters such as muscle mass or fat mass. BMI is not a perfect measure of fat composition. Also, the discrepancies observed between BMI and BF could be due to the influence of factors such as gender and age as shown earlier in Sri Lanka and India [33,34].
The present study revealed that males were more at risk of visceral obesity, and this is in line with previous studies in South Korea. In contrast, other studies found a higher risk of abdominal obesity in females [35,36]. Advanced age was another risk factor for visceral obesity. Similar findings have been reported in Africa (e.g., Ethiopia) and The Americas (e.g., Peru) [35,36]. Factors such as muscle loss, decrease in physical activity level, slower metabolism, and sex hormone changes with aging could explain the higher risk of visceral obesity in older patients. Indeed, the aging process is characterised by a redistribution of body adiposity, with a general increase in trunk fat (mostly visceral fat) coupled with a reduction in appendicular fat [37]. Besides, abdominal obesity was more pronounced in married people, and this finding supports that of a study conducted in Ethiopia [32], South Korea [38], and a recent systematic review and meta-analysis on the association between marital status and obesity [39].
Patients with VDD were more at risk of having visceral obesity. This is consistent with previous studies that reported a high prevalence of VDD in obese people [40,41,42,43]. Several mechanistic processes of the link between VDD and obesity have been proposed. Some of them include a higher sequestration of vitamin D in adipose tissue, impairment of the metabolism of vitamin D, reduced production and bioavailability of vitamin D in obese people [40]. In contrast, other studies revealed that VDD could contribute to higher body fat reserves via an increased uptake of calcium by adipocytes and/or the upregulation of parathyroid hormone, ultimately enhancing the cell production of lipids also known as lipogenesis [43,44].
Of the three anthropometric parameters, only BF was found to be a risk factor for SARS-CoV-2 infection. Such finding has been reported in Serbia, where the authors pinpointed that BF and VF were stronger risk factors for mortality or emergency admission [24]. Similarly, Malavazos et al. found that abdominal obesity was more correlated with X-ray chest, a strong predictor of COVID-19 severity, than observed with BMI-based obesity [14].
Finally, we found a poor clinical relevance of BF and VF for the screening of SARS-CoV-2 infection, even after adjustment for patients’ details, as witnessed by AUC values below 0.75. This finding seems to suggest that the link between adiposity and the risk of SARS-CoV-2 infection is not strong enough as seen between adiposity and COVID-19-related severity or mortality in previous investigations [45]. Our results do not stand for the utilisation of BF or VF for appraising SARS-CoV-2 infection risk in clinical practice in Douala, Cameroon.
Limitations
The present study stands out for its originality as the first of COVID-19 studies in Cameroon, offering baseline data to inform public health decision-makers about potential future viral pandemics. However, the fact that the study was conducted in Douala limits the generalisability of findings at the national level. Additionally, the cross-sectional nature of the study limited our ability to establish the temporality between body fat disturbances and SARS-CoV-2 infection.
5. Conclusions
This study aimed at evaluating the burden, patterns, and determinants of BIA-related adipose obesity, and evaluate its predictive potential and clinical utility for the screening of SARS-CoV-2 infection in patients living in the town of Douala, Cameroon. The study revealed a high prevalence of BF- and VF-related obesity, with varying prevalence rates according to demographical, anthropometric, and clinical characteristics (e.g., gender, age, marital status, educational level, occupation, body mass index, vitamin D deficiency). The strongest risk factors of BF-related obesity were BMI ≥ 30 Kg.m-2 and having a university education level, while being male, advanced, having a university education level, and BMI ≥ 30 Kg.m-2 were the strongest risk factors of high levels of VF. Interestingly, only VF was consistently found to be a risk factor for SARS-CoV-2 infection in both univariate and multivariate analyses, especially in women. In contrast, all adiposity indexes (i.e., BMI, BF, and VF) had low AUC values, thereby outlining their limited clinical utility for the detection of SARS-CoV- infection in the study population.
Author Contributions
Conceptualization, L.P.K.F. and M.L.K.M.; methodology, A.F.M.S., L.P.K.F., E.L.E.E., and M.L.K.M.; software, L.P.K.F.; validation, L.P.K.F., J.M.N., and M.L.K.M.; formal analysis, A.F.M.S., L.P.K.F., E.L.E.E., I.N.L., W.S.N.M., and M.L.K.M.; investigation, A.F.M.S., L.P.K.F., E.L.E.E., I.N.L., W.S.N.M., and M.L.K.M.; resources, A.F.M.S., and M.L.K.M.; data curation, A.F.M.S., and L.P.K.F.; writing—original draft preparation, L.P.K.F.; writing—review and editing, J.M.N., E.L.E.E., I.N.L., and M.L.K.M.; visualization, L.P.K.F. and M.L.K.M.; supervision, L.P.K.F. and M.L.K.M.; project administration, M.L.K.M.; funding acquisition, A.F.M.S., and M.L.K.M. All authors have read and agreed to the published version of the manuscript.
Funding
This study has received no external fund.
Institutional Review Board Statement
The study was conducted in accordance with the Declaration of Helsinki, and approved by the Institutional Review Board of the University of Douala (N◦ 2945 CEI-UDo/12/2021/T). In addition, administrative clearances were obtained from the Douala Laquintinie Hospital (N° 08179/AR/MINSANTE/DHL), and Littoral Health Regional Delegation (N° 0038/AAR/MINSANTE/DRSPL/BCASS).
Informed Consent Statement
Informed consent was obtained from all subjects involved in the study.”
Data Availability Statement
All data analyzed in the study are available upon reasonable request to the corresponding authors.
Acknowledgments
The authors are grateful to the patients for having accepted to participate in the study. We also acknowledge the support and technical assistance of managing authorities, medical doctors, and staff of health facilities.
Conflicts of Interest
The authors declare no conflicts of interest.
Abbreviations
The following abbreviations are used in this manuscript:
| 95%CI | Confidence interval at 95% |
| ANOVA | Analysis of variance |
| aOR | Adjusted odds ratio |
| AUC | Area under the curve |
| cOR | Crude odds ratio |
| BF | Body fat |
| BIA | Bioelectrical impedance analysis |
| BH | Body height |
| BMI | Body mass index |
| BW | Body weight |
| COVID-19 | Coronavirus disease 2019 |
| n.s | Not significant |
| ROC | Receiver operating curve |
| SARS-CoV-2 | Severe acute respiratory syndrome coronavirus 2 |
| SD | Standard deviation |
| VDD | Vitamin D deficiency |
| VF | Visceral fat |
References
- WHO Novel Coronavirus Disease (COVID‐19): Situation Update Report‐8; 2020.
- Moguem Soubgui, A.F.; Embolo Enyegue, E.L.; Kojom Foko, L.P.; Ndeme Mboussi, W.S.; Deutou Hogoue, G.; Mbougang, S.P.; Sanda, S.M.; Fotso Chidjou, I.U.; Fotso, V.F.; Nzogang Tchonet, S.A.; et al. Epidemiological Situation of SARS-CoV-2 Infection in Douala, the Most Populated and Highly Heterogeneous Town of Cameroon: A Post-Vaccination Update. Acta Trop. 2023, 241, 106864. [Google Scholar] [CrossRef] [PubMed]
- Moguem Soubgui, A.F.; Ndeme Mboussi, W.S.; Kojom Foko, L.P.; Embolo Enyegue, E.L.; Koanga Mogtomo, M.L. Serological Surveillance Reveals a High Exposure to SARS-CoV-2 and Altered Immune Response among COVID-19 Unvaccinated Cameroonian Individuals. PLOS Glob. Public Health. 2024, 4, e0002380. [Google Scholar] [CrossRef] [PubMed]
- Hogan, A.B.; Jewell, B.L.; Sherrard-Smith, E.; Vesga, J.F.; Watson, O.J.; Whittaker, C.; Hamlet, A.; Smith, J.A.; Winskill, P.; Verity, R.; et al. Potential Impact of the COVID-19 Pandemic on HIV, Tuberculosis, and Malaria in Low-Income and Middle-Income Countries: A Modelling Study. Lancet Glob. Health. 2020, 8, e1132–e1141. [Google Scholar] [CrossRef] [PubMed]
- Kojom, L.P.; Singh, V. A Review on Emerging Infectious Diseases Prioritized under the 2018 WHO Research and Development Blueprint: Lessons from the Indian Context. Vector Borne Zoonotic Dis. 2021, 21, 149–159. [Google Scholar] [CrossRef]
- Kojom Foko, L.P.; Kumar, A.; Hawadak, J.; Singh, V. Plasmodium Cynomolgi in Humans : Current Knowledge and Future Directions of an Emerging Zoonotic Malaria Parasite. Infection 2023, 51, 623–640. [Google Scholar] [CrossRef]
- Nova, N.; Athni, T.S.; Childs, M.L.; Mandle, L.; Mordecai, E.A. Global Change and Emerging Infectious Diseases. Annu. Rev. Resour. Econ. 2022, 14, 333–354. [Google Scholar] [CrossRef]
- Frühbeck, G.; Baker, J.L.; Busetto, L.; Dicker, D.; Goossens, G.H.; Halford, J.C.G.; Handjieva-Darlenska, T.; Hassapidou, M.; Holm, J.C.; Lehtinen-Jacks, S.; et al. European Association for the Study of Obesity Position Statement on the Global COVID-19 Pandemic. Obes. Facts 2020, 13, 292–296. [Google Scholar] [CrossRef]
- Centers for Disease Control and Prevention People Who Are at Higher Risk for Severe Illness | CDC. Centers Dis. Control Prev. 2020, 68, 703–710. [CrossRef]
- Virgilio, E.; Trevisan, C.; Abbatecola, A.; Malara, A.; Palmieri, A.; Fedele, G.; Stefanelli, P.; Leone, P.; Schiavoni, I.; Maggi, S.; et al. Diabetes Affects Antibody Response to SARS-CoV-2 Vaccination in Older Residents of Long-Term Care Facilities: Data from the GeroCovid Vax Study. Diabetes Care 2022, 45, 2935–2942. [Google Scholar] [CrossRef]
- Kojom Foko, L.P.; Narang, G.; Tamang, S.; Hawadak, J.; Jakhan, J.; Sharma, A.; Singh, V. The Spectrum of Clinical Biomarkers in Severe Malaria and New Avenues for Exploration. Virulence 2022, 13, 634–654. [Google Scholar] [CrossRef]
- Moguem Soubgui, A.F.; Ndeme Mboussi, W.S.; Kojom Foko, L.P.; Embolo Enyegue, E.L.; Koanga Mogtomo, M.L. Exploring Demographical, Clinical, and Dietary Determinants of Vitamin D Deficiency among Adults in Douala, Cameroon during the COVID-19 Era. Heliyon 2024, 10, e24926. [Google Scholar] [CrossRef]
- Moguem Soubgui, A.F.; Kojom Foko, L.P.; Embolo Enyegue, E.L.; Ndeme Mboussi, W.S.; Mbebi Enone, J.P.; Ntatou Lemouchele, I.; Koanga Mogtomo, M.L. Confounding Role of Comorbidities and COVID–19 Vaccination Uptake in Clinical Utility of Hematological Biomarkers in Cameroonian Patients Infected with SARS–CoV–2. IJID Reg. 2023, 8, 129–136. [Google Scholar] [CrossRef] [PubMed]
- Malavazos, E.A.; Secchi, F.; Basilico, S.; Capitanio, G.; Boveri, S.; Milani, V.; Dubini, C.; Schiaffino, S.; Morricone, L.; Foschini, C.; et al. Abdominal Obesity Phenotype Is Associated with COVID - 19 Chest X - Ray Severity Score Better than BMI - Based Obesity. Eat. Weight Disord. - Stud. Anorexia, Bulim. Obes. 2022, 27, 345–359. [Google Scholar] [CrossRef] [PubMed]
- Manolis, A.S.; Manolis, A.A.; Manolis, T.A.; Apostolaki, N.E.; Melita, H. COVID-19 Infection and Body Weight : A Deleterious Liaison in a J-Curve Relationship. Obes. Res. Clin. Pract. 2021, 15, 523–535. [Google Scholar] [CrossRef]
- Malik, J.; Malik, A.; Javaid, M.; Zahid, T.; Ishaq, U.; Shoaib, M. Thyroid Function Analysis in COVID-19 : A Retrospective Study from a Single Center. PLoS One 2021, 16, e0249421. [Google Scholar] [CrossRef]
- Pranata, R.; Lim, M.A.; Yonas, E.; Vania, R.; Lukito, A.A.; Siswanto, B.B.; Meyer, M. Body Mass Index and Outcome in Patients with COVID-19 : A Dose – Response Meta-Analysis. Diabetes Metab. 2021, 47, 101178. [Google Scholar] [CrossRef]
- Du, Y.; Lv, Y.; Zha, W.; Zhou, N.; Hong, X. Association of Body Mass Index (BMI) with Critical COVID-19 and in-Hospital Mortality : A Dose-Response Meta-Analysis. Metab. Clin. Exp. 2021, 117, 154373. [Google Scholar] [CrossRef]
- Nansseu, J.R.; Noubiap, J.J.; Bigna, J.J. Epidemiology of Overweight and Obesity in Adults Living in Cameroon: A Systematic Review and Meta-Analysis. Obesity 2019, 27, 1682–1692. [Google Scholar] [CrossRef]
- Kojom Foko, L.P.; Nolla, N.P.; Nyabeyeu Nyabeyeu, H.; Lehman, L.G. Prevalence, Patterns, and Determinants of Malaria and Malnutrition in Douala, Cameroon : A Cross-Sectional Community-Based Study. Biomed Res. Int. 2021, 2021, 5553344. [Google Scholar] [CrossRef]
- Karampela, Ι.; Vallianou, N.; Magkos, F.; Apovian, C.M.; Dalamaga, Μ. Obesity, Hypovitaminosis D, and COVID-19: The Bermuda Triangle in Public Health. Curr. Obes. Rep. 2022, 11, 116–125. [Google Scholar] [CrossRef]
- Warpechowski, J.; Leszczyńska, P.; Juchnicka, D.; Olichwier, A.; Szczerbiński, Ł.; Krętowski, A.J. Assessment of the Immune Response in Patients with Insulin Resistance, Obesity, and Diabetes to COVID-19 Vaccination. Vaccines 2023, 11, 1203. [Google Scholar] [CrossRef] [PubMed]
- Sudhakar, M.; Winfred, S.B.; Meiyazhagan, G.; Venkatachalam, D.P. Mechanisms Contributing to Adverse Outcomes of COVID-19 in Obesity; Springer US, 2022; Vol. 477; ISBN 1101002204.
- Stevanovic, D.; Zdravkovic, V.; Poskurica, M.; Petrovic, M.; Cekerevac, I.; Zdravkovic, N.; Mijailovic, S.; Todorovic, D.; Divjak, A.; Bozic, D.; et al. The Role of Bioelectrical Impedance Analysis in Predicting COVID-19 Outcome. Front. Nutr. 2022, 9, 906659. [Google Scholar] [CrossRef] [PubMed]
- Moguem Soubgui, A.F.; Kojom Foko, L.P.; Embolo Enyegue, E.L.; Ndeme Mboussi, W.S.; Koanga Mogtomo, M.L. Prevalence, Clinical Profile and Determinants of COVID-19 Vaccination and SARS-CoV-2 Breakthrough Infection in Douala, Cameroon. Trends Med. Res. 2023, 18, 122–135. [Google Scholar] [CrossRef]
- De Onis, M.; Onyango, A.W.; Borghi, E.; Siyam, A.; Nishida, C.; Siekmann, J. Development of a WHO Growth Reference for School-Aged Children and Adolescents. Bull. World Health Organ. 2007, 85, 660–667. [Google Scholar] [CrossRef]
- Loteri, O.; Moguem Sobgui, A.F.; Kojom Foko, L.P.; Ndeme Mboussi, W.S.; Medi Sike, C.; Embolo Enyegue, E.L.; Koanga Mogtomo, M.L. COVID-19 and Comorbidities in Douala, Cameroon. Int. J. Trop. Dis. Heal. 2022, 43, 21–38. [Google Scholar] [CrossRef]
- Dympna Gallagher; Steven B Heymsfield; Moonseong Heo; Susan A Jebb; Peter R Murgatroyd; Yoichi Sakamoto Healthy Percentage Body Fat Ranges: An Approach for Developing Guidelines Based on Body Mass Index. Am. J. Clin. Nutr. 2018, 694–701.
- Massey Jr, F.J. The Kolmogorov-Smirnov Test for Goodness of Fit. J. Am. Stat. Assoc. 1956, 46, 68–78. [Google Scholar] [CrossRef]
- Jones, C.M.; Athanasiou, T. Summary Receiver Operating Characteristic Curve Analysis Techniques in the Evaluation of Diagnostic Tests. Ann Thorac Surg 2005, 79, 16–20. [Google Scholar] [CrossRef]
- Chaudhary, M.; Sharma, P. Abdominal Obesity in India: Analysis of the National Family Health Survey-5 (2019–2021) Data. Lancet Reg. Heal. - Southeast Asia 2023, 14, 100208. [Google Scholar] [CrossRef]
- Bereka, S.G.; Demisse, A.W.; Getahun, G.K. Prevalence of Abdominal Obesity and Associated Risk Factors among Women Civil Servants in Addis Ababa, Ethiopia, 2021: An Institution-Based Study. BMC Nutr. 2022, 8, 119. [Google Scholar] [CrossRef]
- Ranasinghe, C.; Gamage, P.; Katulanda, P.; Andraweera, N.; Thilakarathne, S.; Tharanga, P. Relationship between Body Mass Index (BMI) and Body Fat Percentage, Estimated by Bioelectrical Impedance, in a Group of Sri Lankan Adults: A Cross Sectional Study. BMC Public Health 2013, 13, 797. [Google Scholar] [CrossRef] [PubMed]
- Rai, R.; Ghosh, T.; Jangra, S.; Sharma, S.; Panda, S.; Kochhar, K.P. Relationship between Body Mass Index and Body Fat Percentage in a Group of Indian Participants: A Cross-Sectional Study From a Tertiary Care Hospital. Cureus 2023, 15, 4–11. [Google Scholar] [CrossRef] [PubMed]
- Guerra Valencia, J.; Saavedra-Garcia, L.; Vera-Ponce, V.J.; Espinoza-Rojas, R.; Barengo, N.C. Factors Associated with Normal-Weight Abdominal Obesity Phenotype in a Representative Sample of the Peruvian Population: A 4-Year Pooled Cross-Sectional Study. J. Clin. Med. 2023, 12, 3482. [Google Scholar] [CrossRef] [PubMed]
- Yosef, T.; Sebeta, A.; Tekalign, E.; Sisay, B.G.; Bekele, B.B.; Tesfaw, A.; Shifera, N. Assessment of Abdominal Obesity Prevalence and Determinants among Adults in Southwest Ethiopia: A Cross-Sectional Study. Front. Public Health 2024, 12, 1400066. [Google Scholar] [CrossRef]
- Ponti, F.; Santoro, A.; Mercatelli, D.; Gasperini, C.; Conte, M.; Martucci, M.; Sangiorgi, L.; Franceschi, C.; Bazzocchi, A. Aging and Imaging Assessment of Body Composition : From Fat to Facts. Front. Endocrinol. (Lausanne). 2020, 10, 861. [Google Scholar] [CrossRef]
- Kim, G.; Woo, H.; Ji, Y.A. Factors Affecting Abdominal Obesity: Analyzing National Data. Healthc. 2024, 12, 827. [Google Scholar] [CrossRef]
- Nikolic Turnic, T.; Jakovljevic, V.; Strizhkova, Z.; Polukhin, N.; Ryaboy, D.; Kartashova, M.; Korenkova, M.; Kolchina, V.; Reshetnikov, V. The Association between Marital Status and Obesity: A Systematic Review and Meta-Analysis. Diseases 2024, 12, 146. [Google Scholar] [CrossRef]
- Vrani, Luka, Ivana Mikolassevic, S. M. Vitamin D Deficiency: Consequence or Cause of Obesity? Medicina (B. Aires). 2019, 55, 541. [Google Scholar]
- Alzohily, B.; AlMenhali, A.; Gariballa, S.; Munawar, N.; Yasin, J.; Shah, I. Unraveling the Complex Interplay between Obesity and Vitamin D Metabolism. Sci. Rep. 2024, 14, 7583. [Google Scholar] [CrossRef]
- Yao, Y.; Zhu, L.; He, L.; Duan, Y.; Liang, W.; Nie, Z.; Jin, Y.; Wu, X. A Meta-Analysis of the Relationship between Vitamin D Deficiency and Obesity. Int. J. Clin. Exp. Med. 2015, 8, 14977–14984. [Google Scholar]
- Vimaleswaran, K.S.; Berry, D.J.; Lu, C.; Tikkanen, E.; Pilz, S.; Hiraki, L.T.; Cooper, J.D.; Dastani, Z.; Li, R.; Houston, D.K.; et al. Causal Relationship between Bbesity and Vitamin D Status: Bi-Directional Mendelian Randomization Analysis of Multiple Cohorts. PLoS Med. 2013, 10, e1001383. [Google Scholar] [CrossRef] [PubMed]
- Pereira-Santos, M.; Costa, P.R.F.; Assis, A.M.O.; Santos, C.A.S.T.; Santos, D.B. Obesity and Vitamin D Deficiency: A Systematic Review and Meta-Analysis. Obes. Rev. 2015, 16, 341–349. [Google Scholar] [CrossRef] [PubMed]
- Favre, G.; Legueult, K.; Pradier, C.; Raffaelli, C.; Ichai, C.; Iannelli, A.; Redheuil, A.; Lucidarme, O.; Esnault, V. Visceral Fat Is Associated to the Severity of COVID-19. Metab. Clin. Exp. 2020, 115, 154440. [Google Scholar] [CrossRef] [PubMed]
Figure 1.
Prevalence of obesity based on BMI (A), BF (B), and VF (C); and association (D, E) and correlation (F, G) between BMI, BF, and VF. Note. BMI: Body mass index, BF: Body fat, VF: Visceral fat, r2 = Correlation coefficient. In Figure 1D and Figure 1E, the Pearson’s chi-square test was used to compare proportions. The differences were statistically significant at p < 0.05. In Figure 1F and Figure 1G, a simple correlational analysis was performed between BMI and BF or VF. BMI-based underweight individuals (n = 1) were excluded from the analysis. Each point corresponds to one individual included in the analysis (n = 420). Shaded areas present confidence interval limits for correlation line (solid line) and agreement limits (dotted lines).
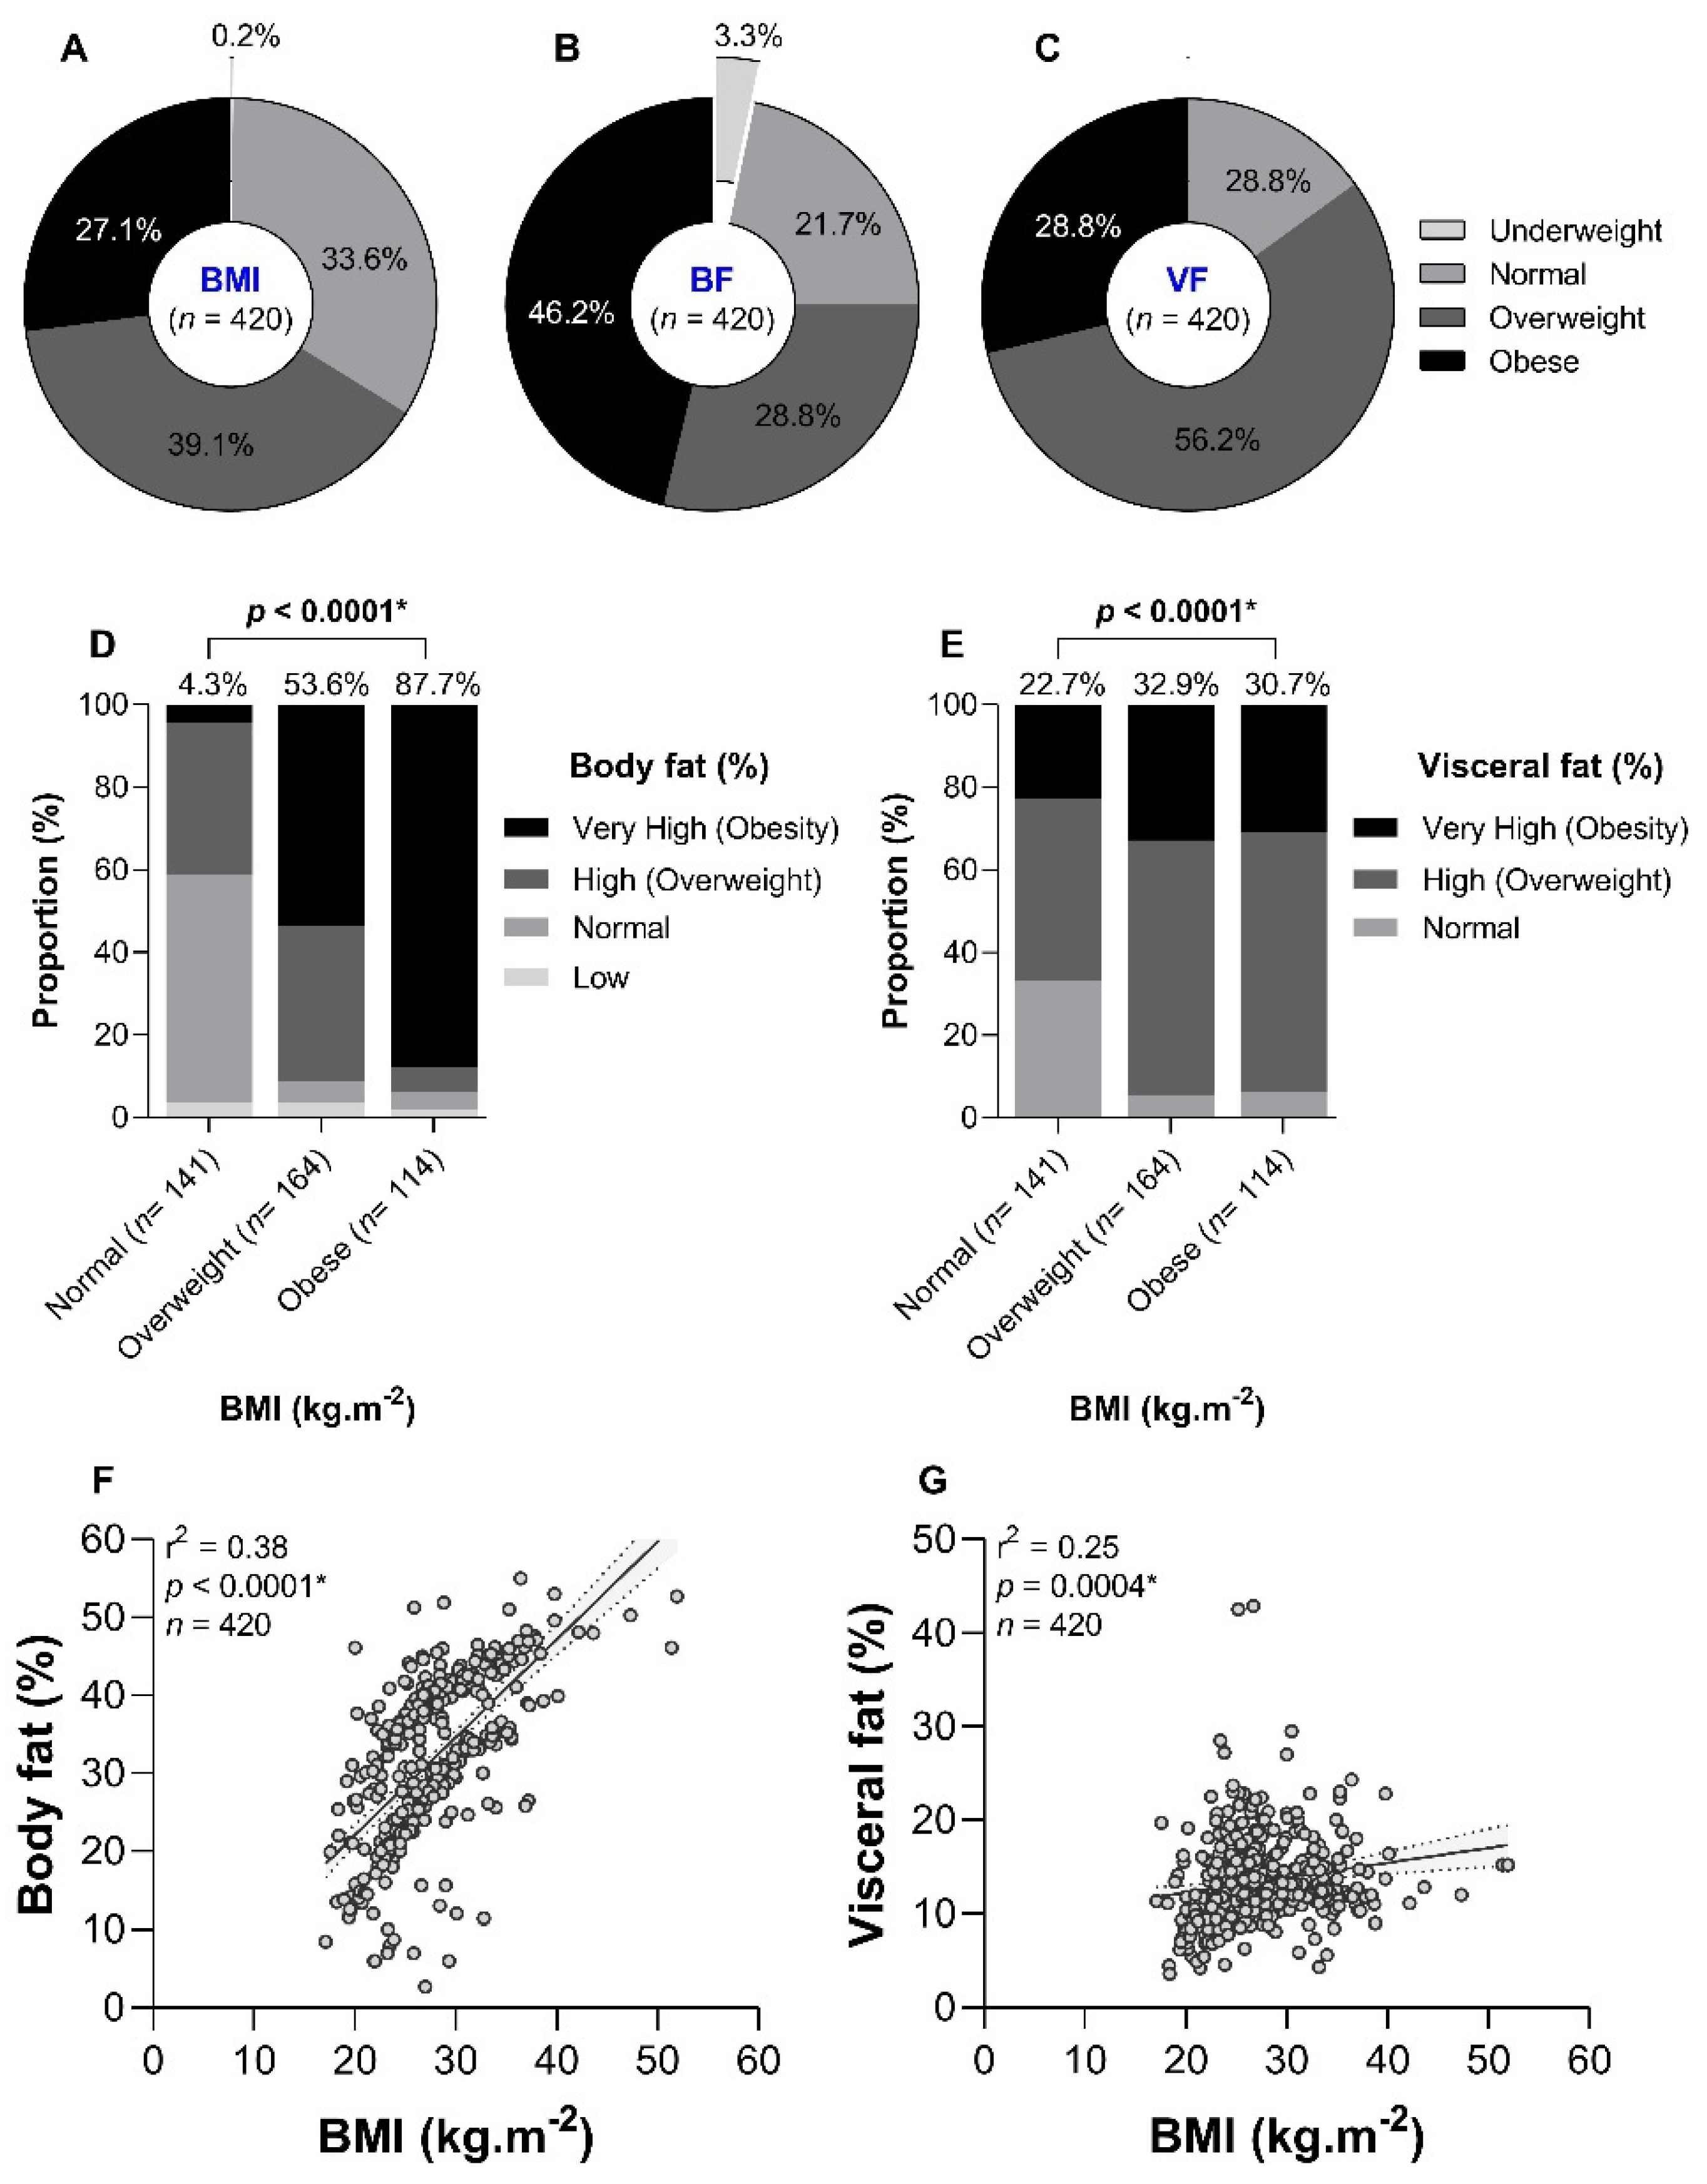
Figure 2.
Body composition categories for body fat (A) and visceral fat (B) by demographic, anthropometric, and clinical characteristics. Note. BMI: Body mass index, SARS-CoV-2: Severe acute respiratory syndrome coronavirus 2, COVID-19: Coronavirus disease 2019, ns: Not significant. The Pearson’s chi-square test was used to compare proportions. Statistically significant at *p < 0.05, **p < 0.01, and ***p < 0.0001.
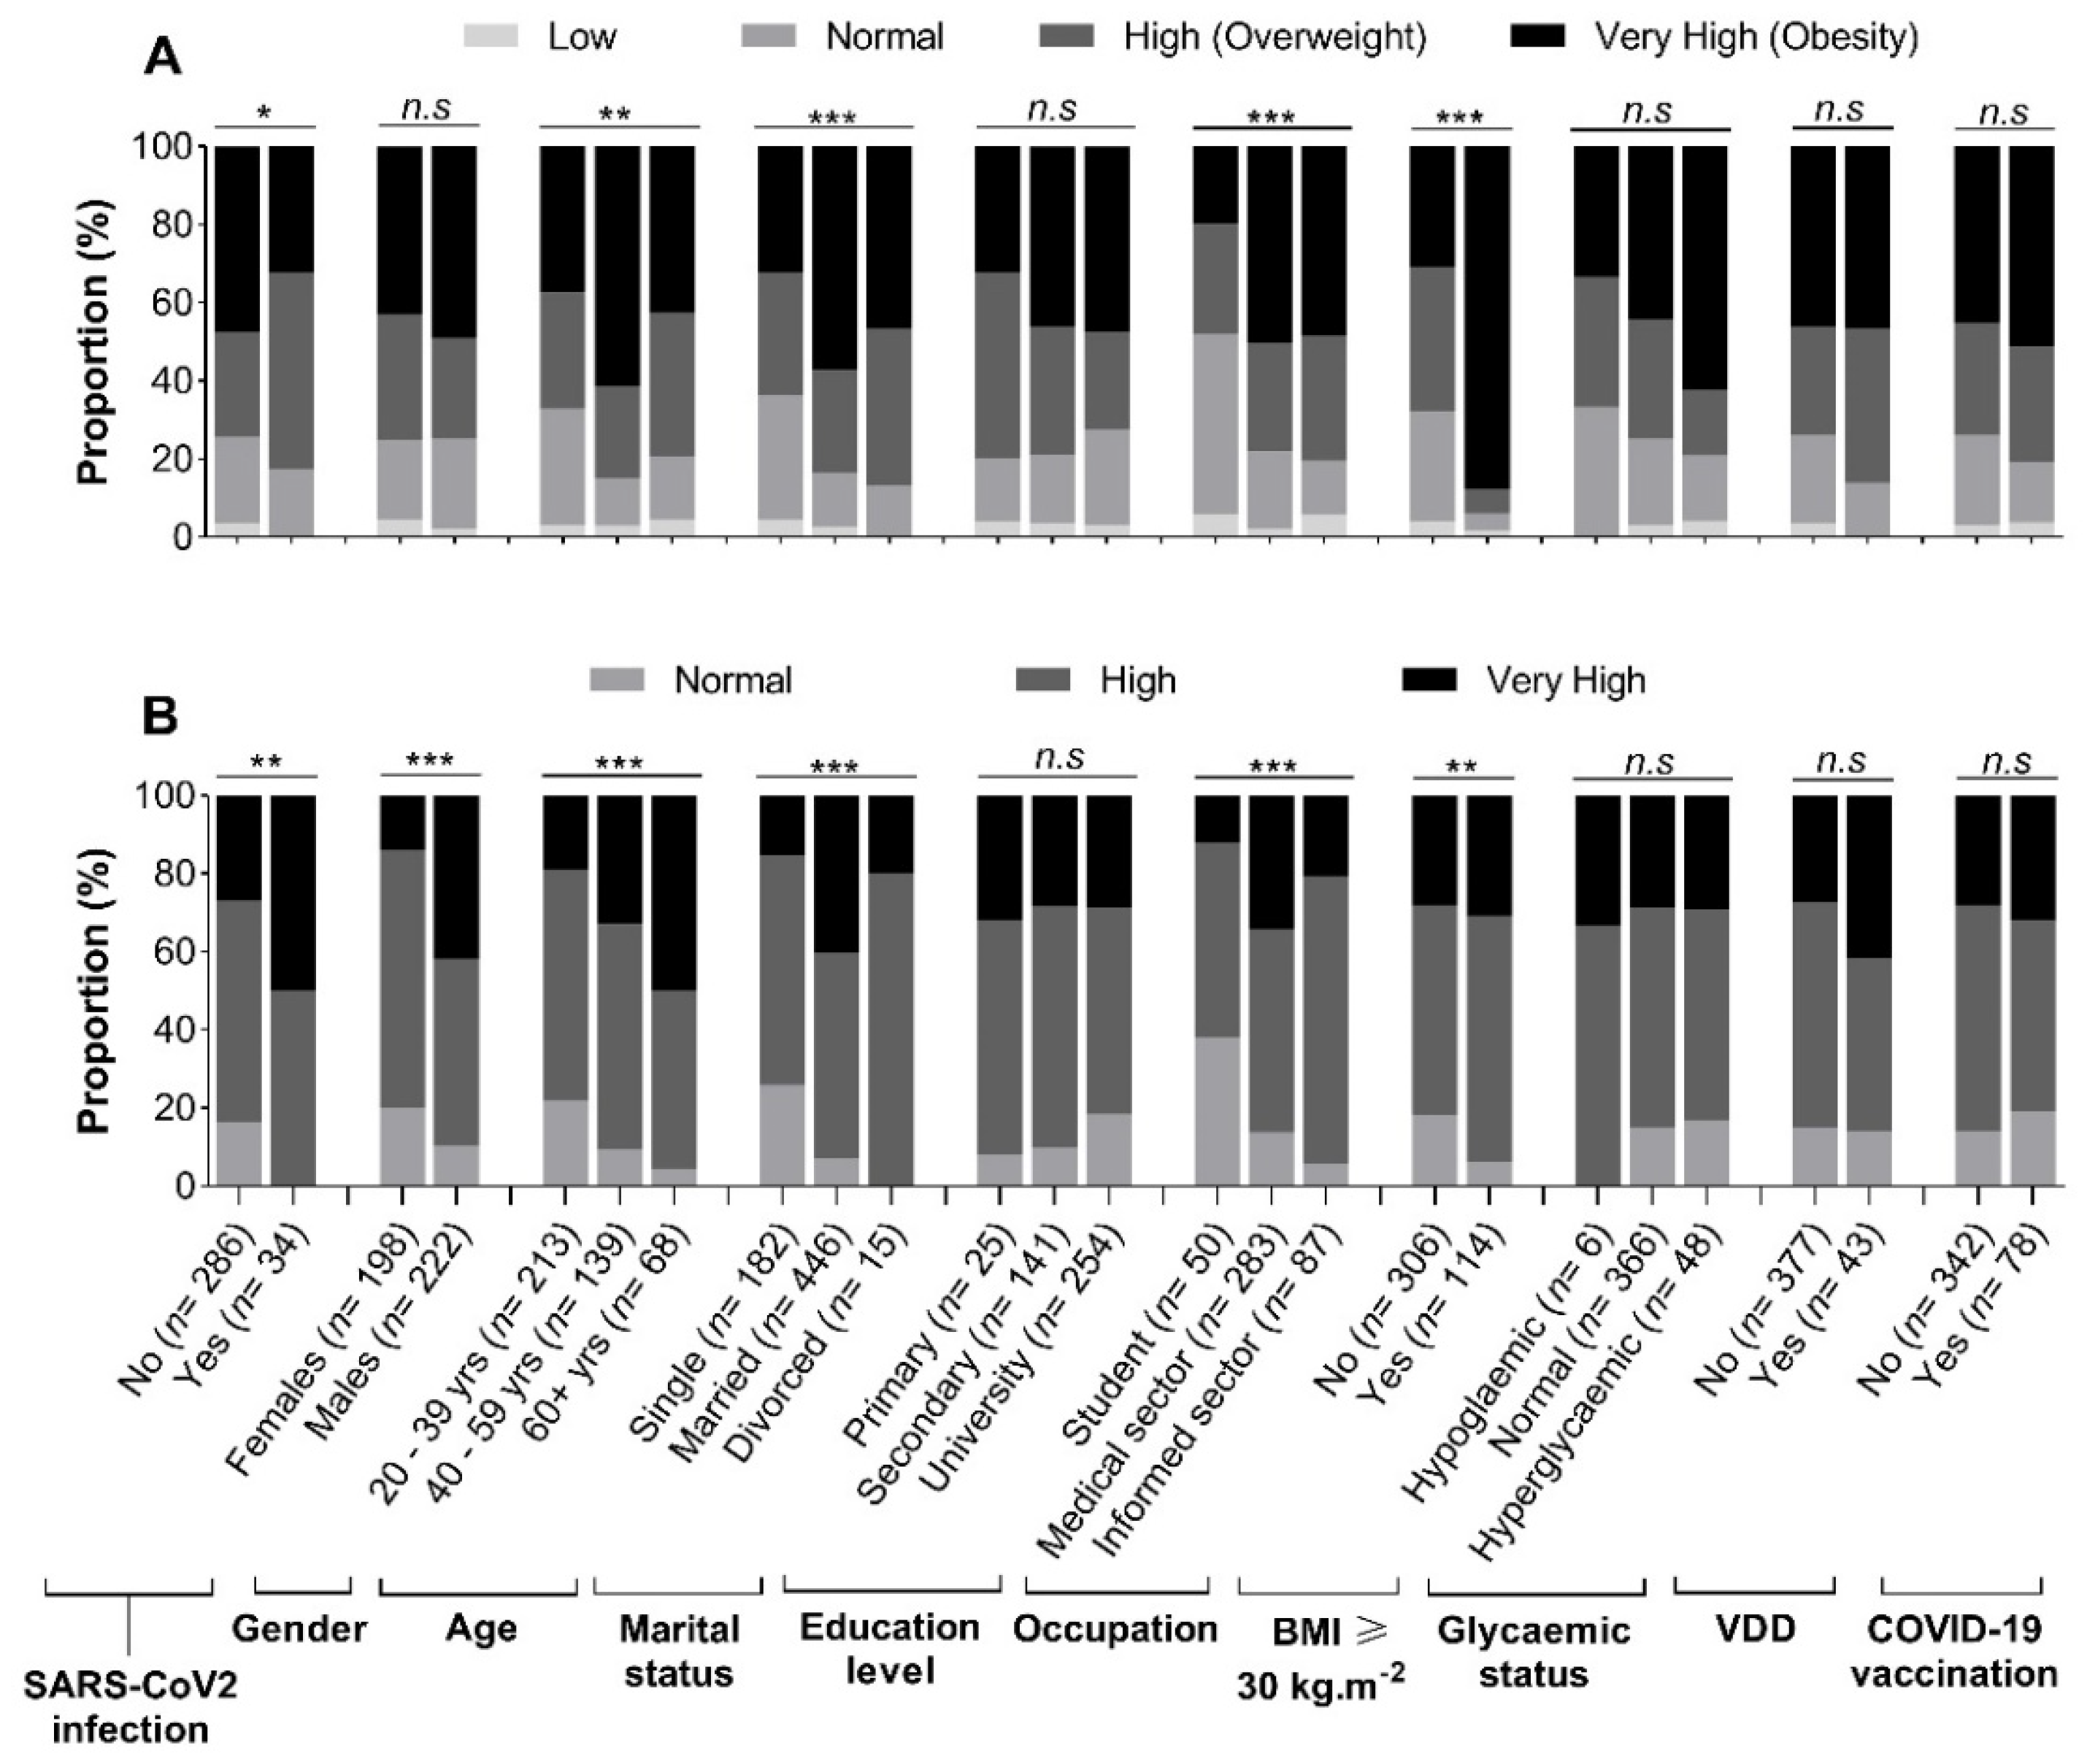
Figure 4.
Clinical value of body fat and visceral fat in the screening of SARS-CoV-2 infection (A) and impact of gender (B), age (C), vitamin D deficiency (D), body mass index (E), and COVID-19 vaccination (F). Note. BF: Body fat, VF: Visceral fat, SARS-CoV-2: Severe acute respiratory syndrome coronavirus 2, COVID-19: Coronavirus disease 2019. Receiver operating curves were constructed to evaluate the clinical utility of body fat and visceral fat in the screening of SARS-CoV-2 infection, and the impact of patients’ characteristics. The diagonal dotted line represents a test with AUC = 0.50.
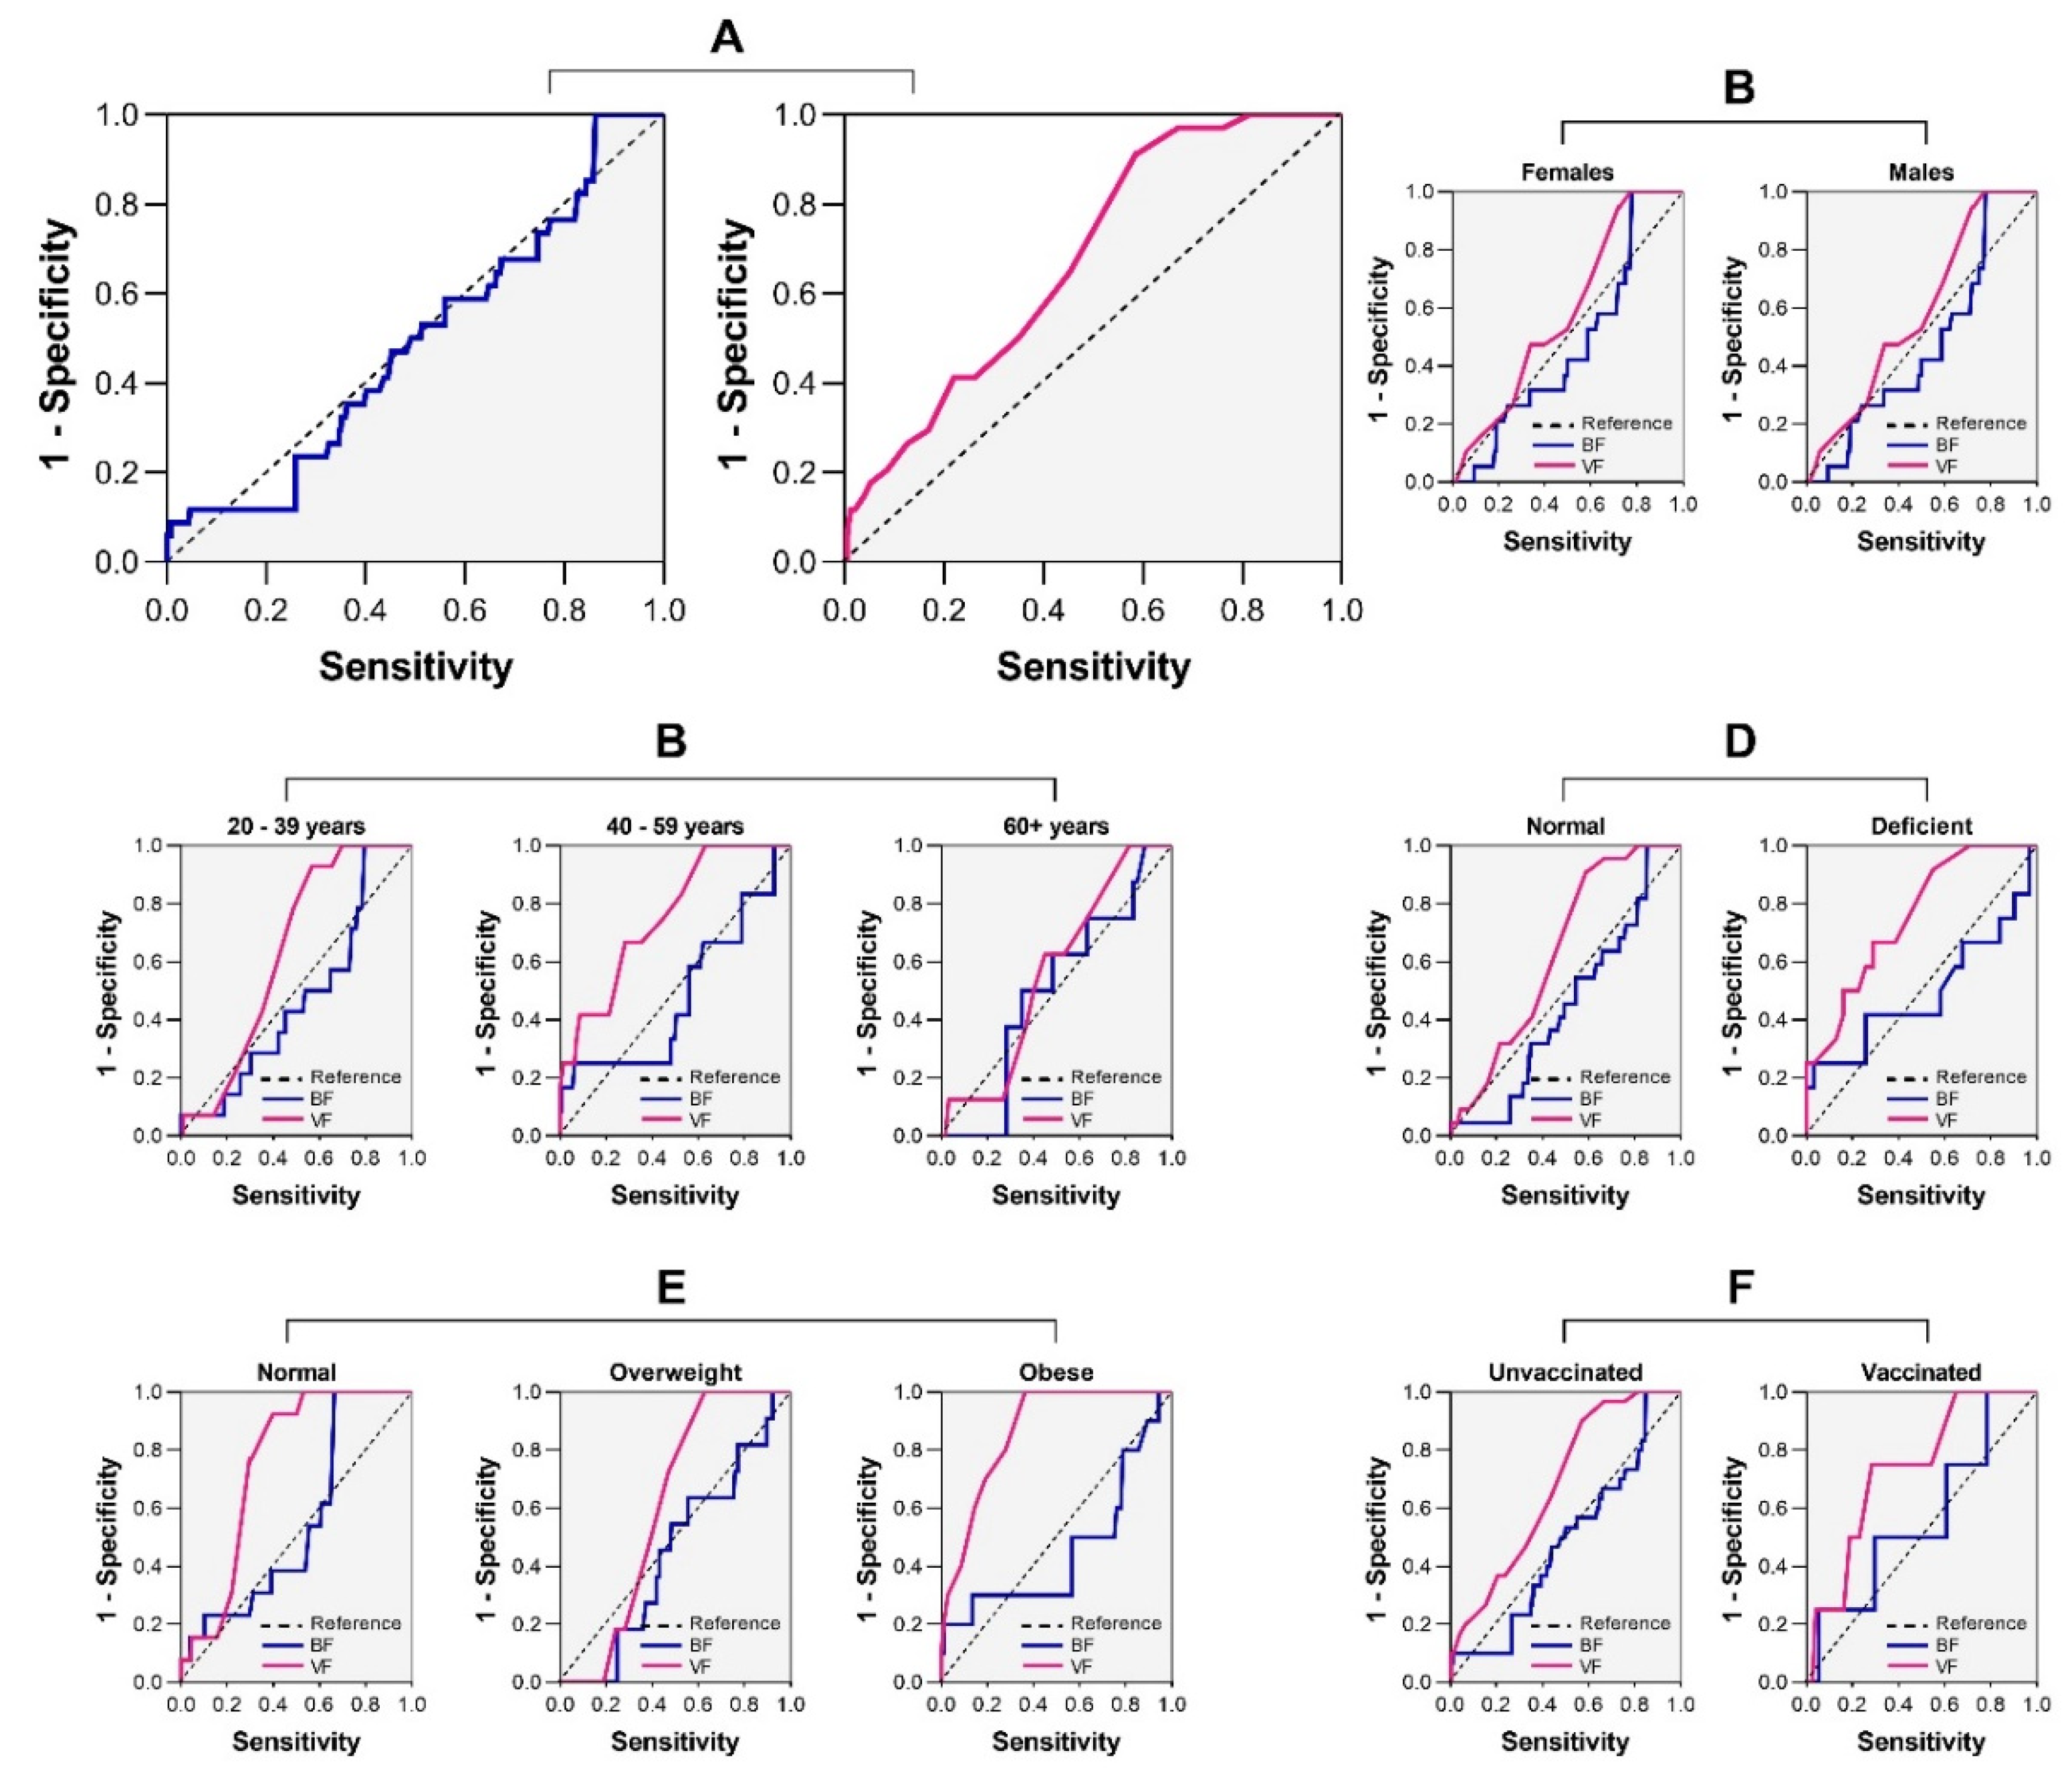

Table 1.
Univariate and multivariate logistic regression analyses of determinants of body fat-based adipose obesity in participants.
Table 1.
Univariate and multivariate logistic regression analyses of determinants of body fat-based adipose obesity in participants.
| Univariate analysis | Multivariate analysis | |||||||
|---|---|---|---|---|---|---|---|---|
| Variables | N | n (%) | cOR (95%CI) | p | aOR (95%CI) | p | ||
| Gender | ||||||||
| Females | 198 | 85 (42.9%) | 1 | 1 | ||||
| Males | 222 | 109 (49.1%) | 1.28 (0.87 - 1.89) | 0.21 | 2.47 (1.43 - 4.25) | 0.001* | ||
| Age (yrs) | ||||||||
| 20 - 39 | 213 | 80 (37.6%) | 1 | 1 | ||||
| 40 - 59 | 139 | 85 (61.2%) | 2.62 (1.69 - 4.06) | <0.0001* | 1.12 (0.60 - 2.08) | 0.71 | ||
| ≥ 60 | 68 | 29 (42.6%) | 1.24 (0.71 - 2.15) | 0.45 | 0.30 (0.13 - 0.70) | 0.005* | ||
| Education | ||||||||
| None/Primary | 25 | 8 (32.0%) | 1 | 1 | ||||
| Secondary | 141 | 65 (46.1%) | 1.82 (0.74 - 4.48) | 0.19 | 2.28 (0.72 - 7.20) | 0.15 | ||
| University | 254 | 121 (47.6%) | 1.93 (0.81 - 4.64) | 0.14 | 3.97 (1.23 - 12.88) | 0.02* | ||
| Marital status | ||||||||
| Single | 182 | 59 (32.4%) | 1 | 1 | ||||
| Married | 223 | 128 (57.4%) | 2.81 (1.87 - 4.23) | <0.0001* | 2.52 (1.42 - 4.49) | 0.001* | ||
| Divorced/Widowed | 15 | 7 (46.7%) | 1.82 (0.63 - 5.27) | 0.26 | 2.35 (0.53 - 10.47) | 0.26 | ||
| Occupation | ||||||||
| Student | 50 | 10 (20.0%) | 1 | 1 | ||||
| Medical sector | 283 | 142 (50.2%) | 4.03 (1.94 - 8.37) | 0.0002* | 2.44 (1.01 - 5.88) | 0.04* | ||
| Informal sector | 87 | 42 (48.3%) | 3.73 (1.66 - 8.40) | 0.001* | 2.27 (0.74 - 6.94) | 0.15 | ||
| BMI ≥ 30 Kg.m-2 | ||||||||
| No | 306 | 94 (30.7%) | 1 | 1 | ||||
| Yes | 114 | 100 (87.7%) | 16.11 (8.75 - 29.64) | <0.0001* | 25.32 (12.18 - 52.66) | <0.0001* | ||
| Vitamin D deficiency | ||||||||
| No | 377 | 174 (46.2%) | 1 | 1 | ||||
| Yes | 43 | 20 (46.5%) | 0.99 (0.52 - 1.86) | 0.96 | 1.13 (0.49 - 2.60) | 0.76 | ||
| Glycaemic status | ||||||||
| Hypoglycaemic | 6 | 2 (33.3%) | 1 | 1 | ||||
| Normal | 366 | 162 (44.3%) | 1.35 (0.11 - 11.20) | 0.89 | 1.36 (0.14 - 13.20) | 0.78 | ||
| Hyperglycaemic | 48 | 30 (62.5%) | 1.57 (0.13 - 15.87) | 0.33 | 1.55 (0.14 - 16.98) | 0.72 | ||
Note. 95%CI: Confidence interval at 95%, BMI: Body mass index, cOR/aOR: Crude/Adjusted odds ratio. Univariate and multivariate logistic regression analyses were performed to identify the determinants of adipose obesity in participants. *Statistically significant at p < 0.05.
Table 2.
Univariate and multivariate logistic regression analyses of determinants of visceral obesity in participants.
Table 2.
Univariate and multivariate logistic regression analyses of determinants of visceral obesity in participants.
| Univariate analysis | Multivariate analysis | |||||||
|---|---|---|---|---|---|---|---|---|
| Variables | N | n (%) | cOR (95%CI) | p | aOR (95%CI) | p | ||
| Gender | ||||||||
| Females | 198 | 17 (8.6%) | 1 | 1 | ||||
| Males | 222 | 58 (26.1%) | 2.71 (1.33 - 5.51) | 0.0005* | 4.68 (2.65 - 8.27) | <0.0001* | ||
| Age (yrs) | ||||||||
| 20 - 39 | 213 | 15 (7.0%) | 1 | 1 | ||||
| 40 - 59 | 139 | 32 (23.0%) | 2.08 (1.27 - 3.39) | 0.0003* | 2.01 (1.06 - 3.81) | 0.03* | ||
| ≥ 60 | 68 | 28 (41.2%) | 4.20 (2.34 - 7.53) | <0.0001* | 3.25 (1.49 - 7.17) | <0.0001* | ||
| Education | ||||||||
| None/Primary | 25 | 3 (12.0%) | 1 | 1 | ||||
| Secondary | 141 | 24 (17.0%) | 0.84 (0.34 - 2.10) | 0.71 | 0.87 (0.31 - 2.41) | 0.79 | ||
| University | 254 | 48 (18.9%) | 0.86 (0.35 - 2.07) | 0.73 | 4.14 (1.07 - 17.71) | 0.04* | ||
| Marital status | ||||||||
| Single | 182 | 14 (7.7%) | 1 | 1 | ||||
| Married | 223 | 59 (26.5%) | 3.72 (2.29 - 6.04) | <0.0001* | 2.21 (1.18 - 4.13) | 0.03* | ||
| Divorced/Widowed | 15 | 2 (13.3%) | 1.37 (0.36 - 5.19) | 0.44 | 1.45 (0.31 - 6.86) | 0.63 | ||
| Occupation | ||||||||
| Student | 50 | 6 (12.0%) | 1 | 1 | ||||
| Medical sector | 283 | 57 (20.1%) | 3.82 (1.57 - 9.29) | 0.003* | 1.63 (0.61 - 4.36) | 0.33 | ||
| Informal sector | 87 | 12 (13.8%) | 1.91 (0.70 - 5.19) | 0.20 | 1.18 (0.35 - 3.94) | 0.78 | ||
| BMI ≥ 30 Kg.m-2 | ||||||||
| No | 306 | 38 (12.4%) | 1 | 1 | ||||
| Yes | 114 | 37 (32.5%) | 3.39 (2.02 - 5.69) | <0.0001* | 4.38 (2.22 - 8.64) | <0.0001* | ||
| Vitamin D deficiency | ||||||||
| No | 377 | 62 (16.4%) | 1 | 1 | ||||
| Yes | 43 | 13 (30.2%) | 1.92 (1.00 - 3.66) | 0.04* | 2.78 (1.09 - 7.09) | 0.03* | ||
| Glycaemic status | ||||||||
| Hypoglycaemic | 6 | 2 (33.3%) | 1 | 1 | ||||
| Normal | 366 | 60 (16.4%) | 0.80 (0.15 - 4.46) | 0.80 | 0.48 (0.07 - 3.11) | 0.44 | ||
| Hyperglycaemic | 48 | 13 (27.1%) | 0.82 (0.14 - 5.02) | 0.83 | 0.30 (0.04 - 2.25) | 0.24 | ||
Note. 95%CI: Confidence interval at 95%, BMI: Body mass index, cOR/aOR: Crude/Adjusted odds ratio. Univariate and multivariate logistic regression analyses were performed to identify the determinants of visceral obesity in participants. *Statistically significant at p < 0.05.
Table 3.
Univariate and multivariate logistic regression analyses of determinants of visceral obesity in participants.
Table 3.
Univariate and multivariate logistic regression analyses of determinants of visceral obesity in participants.
| Univariate analysis | Multivariate analysis | ||||
|---|---|---|---|---|---|
| Variables | cOR (95%CI) | p | aOR (95%CI) | p | |
| BMI (Kg.m-2) | |||||
| Non-obese | 1 | 1 | |||
| Obese | 1.03 (0.97 - 1.10) | 0.31 | 2.28 (0.85 - 6.16) | 0.10 | |
| BF (%) | |||||
| Non-obese | 1 | 1 | |||
| Obese | 1.01 (0.97 - 1.04) | 0.67 | 0.30 (0.11 - 0.78) | 0.01* | |
| VF (Kg) | |||||
| Normal/High | 1 | 1 | |||
| Very high | 2.72 (1.34 - 5.51) | 0.0002* | 3.11 (1.50 - 6.43) | 0.002* | |
Note. 95%CI: Confidence interval at 95%, BMI: Body mass index, BF: Body fat, VF: Visceral fat, cOR/aOR: Crude/Adjusted odds ratio. Univariate and multivariate logistic regression analyses were performed. *Statistically significant at p < 0.05.
Disclaimer/Publisher’s Note: The statements, opinions and data contained in all publications are solely those of the individual author(s) and contributor(s) and not of MDPI and/or the editor(s). MDPI and/or the editor(s) disclaim responsibility for any injury to people or property resulting from any ideas, methods, instructions or products referred to in the content. |
© 2025 by the authors. Licensee MDPI, Basel, Switzerland. This article is an open access article distributed under the terms and conditions of the Creative Commons Attribution (CC BY) license (http://creativecommons.org/licenses/by/4.0/).
Copyright: This open access article is published under a Creative Commons CC BY 4.0 license, which permit the free download, distribution, and reuse, provided that the author and preprint are cited in any reuse.


