
Submitted:
03 November 2024
Posted:
05 November 2024
You are already at the latest version
Abstract
Background: Treatment outcomes are vital measures of the success of TB treatment programs, especially in areas with limited re-sources, as tuberculosis continues to be a major public health issue. The study aimed to evaluate clinical data from TB-infected pa-tients' clinic files in rural areas of the Olivier Reginald Tambo District Municipality, Eastern Cape, South Africa, to understand the treatment outcomes of tuberculosis in patients with drug-resistant tuberculosis, human immunodeficiency virus, and nutritional status.
Methods: The study analyzed 360 patient files to investigate the treatment outcomes of patients with drug-resistant tuberculosis (DR-TB) and HIV, as well as a body mass index (BMI) indicating moderate to severe classification. The data included patient de-mographics, clinical characteristics, and social history. The study also detailed and analyzed culture conversion, time in treatment, and treatment outcomes. Additionally, BMI data were presented using a scatter plot to display the distribution of BMI across different age groups and genders to identify patterns and trends in obesity prevalence.
Results: The study demonstrated the high rates of both overweight and underweight individuals among middle-aged and elderly people, emphasizing the need for personalized nutritional interventions. It found that Type 1 (RR-TB) and Type 2 (MDR-TB) were the most common forms of DR-TB, with a higher prevalence of HIV-positive individuals in Type 1 (RR-TB). The study also showed the distribution of different BMI categories among DR-TB types and HIV statuses. Overall, it suggests limited connections between DR-TB type, BMI category, and HIV status in the research.
Conclusion: It is imperative to prioritize the management of co-morbid conditions in DR-TB patients, as these conditions signifi-cantly influence treatment outcomes. Targeted interventions are essential for patients with severe or complex co-morbidities.
Keywords:
DR-TB
; HIV status
; BMI
; RR-TB Type
; TB-treatment outcomes
; overweight
; underweight
; nutritional status
1. Introduction
In 2022, the World Health Organization (WHO) proclaimed an encouraging message: drug-susceptible tuberculosis is not just a challenge, but a disease that can be definitively cured! This breakthrough offers hope and highlights the power of modern medicine in combating health threats [1]. One of the important global indicators for monitoring the implementation of WHO's End TB Strategy from 2015 is the treatment success rate, which encompasses both cure and treatment completion according to WHO's [2] report. In low-income nations, malnutrition and infectious diseases are significant health challenges. The interconnectedness of tuberculosis epidemiology with social and economic conditions has made its prevention and control a challenging goal to achieve [3]. Their coexistence is partly due to poverty being an important determinant of both problems, but also due to the two-way causal interactions between nutritional deficiencies and infections, whereby infections exacerbate nutritional deficiencies, which in turn increase infectious disease morbidity and mortality. Most research has been conducted on the relationship between generalized malnutrition or micronutrient deficiencies and childhood infections [4]. South Africa is in the grip of three concurrent epidemics, malnutrition, brought about by a conglomeration of socio-economic factors; HIV/AIDS, caused by the human immunodeficiency virus; and active TB, caused by progressive infection with Mycobacterium tuberculosis. Although caused by separate factors, there is evidence that each epidemic acts synergistically to aggravate the other two [5]. Tuberculosis is strongly influenced by nutritional status [6], with nutrition interventions being likely to affect the prevalence of active disease, response to drug therapy, and quality of life [7]. An understanding of the basic science of nutrition, immunity, and infectious disease pathogenesis is necessary for the rational identification of appropriate therapeutic interventions [8]. Recent studies investigating the pathogenesis of HIV infection have provided the exciting novel conceptual understanding that the gastrointestinal tract is a major anatomical front line of the disease, and that lymphocyte activation is a key step in the CD4+T cell depletion that defines AIDS. Together, these insights have major implications for our dawning understanding of the intersection between nutrition and HIV/AIDS, both in terms of the potential impact of HIV infection on nutritional status and in redefining our conceptions of how nutritional intervention might affect HIV/AIDS pathogenesis [5]. Adequate nutrition plays a critically important role in supporting the health and quality of life of people with TB and human immunodeficiency virus (HIV) [6,9]. In our study, the triple burden refers to the concurrent presence of drug-resistant tuberculosis (DR-TB), Human Immunodeficiency Virus (HIV), and obesity, where the combined effects of these conditions may synergistically worsen the patient's health. Each of these conditions in our study setting presents unique difficulties in terms of their co-occurrence and significantly challenging treatment outcomes. The interplay between TB and HIV creates a vicious cycle where each disease exacerbates the other, leading to faster progression of HIV and increased mortality risk, especially in people who are obese. The global proportion of people living with HIV who are overweight (BMI 25.0–29.9 kg/m²) or obese (BMI ≥30 kg/m²) has risen significantly [10]. While obesity does not directly increase the risk of contracting TB or HIV, it can complicate the course of these diseases by impairing the immune response crucial for effective TB and HIV treatment. Drug-resistant TB (DR-TB) arises when the Mycobacterium tuberculosis bacterium becomes resistant to commonly used treatments, often due to improper use of TB drugs, incomplete treatment courses, or natural genetic mutations [11]. The presence of DR-TB complicates TB control efforts and heightens the risk of transmission within communities, as observed in our study setting. Drug-resistant tuberculosis refers to TB that is resistant to isoniazid (isoniazid mono-resistance), rifampicin (rifampicin mono-resistance), or both, with the latter known as multidrug-resistant TB (MDR-TB) [12]. When fluoroquinolone resistance is added to MDR-TB, it is classified as pre-extensively drug-resistant TB (pre-XDR-TB), and with additional resistance to bedaquiline and linezolid, it becomes extensively drug-resistant TB (XDR-TB) [12]. DR- TB caused by MDR strains of Mycobacterium tuberculosis and extensively DR (XDR) TB strains are emergent problems. People with HIV face an increased risk of contracting TB, making co-infection a significant health concern, especially in areas where both diseases are widespread [13]. TB is a leading cause of death among people living with HIV, and co-infection significantly worsens the course of HIV, accelerating its progression to AIDS [14]. The TB-HIV coinfection is a dual epidemic as each speeds the other’s progress. HIV makes TB more difficult to diagnose and treat because the sputum of an HIV-positive person usually contains a lower concentration of TB bacteria, making it harder to detect in a sputum test [15]. HIV and ART drugs affect the partitioning and distribution of the adipose tissue compartment, which can lead to metabolic problems [10]. Obesity is a condition characterized by excessive body fat that increases the risk of several health conditions and it exacerbates the impact of TB and HIV. Obesity has a substantial impact on the course of tuberculosis in HIV-positive persons because it is associated with chronic low-grade inflammation that can impede the immunological response [16]. This may impair the body's ability to fight tuberculosis, resulting in more severe disease progression and consequences in HIV-positive patients [16]. Obesity can cause problems during tuberculosis treatment, such as the need for medication adjustments and increased monitoring for side effects, and this complexity can impede efficient treatment and increase healing timeframes [10]. Obesity increases the burden of metabolic disorders among HIV patients [17]. Obesity is associated with mental health challenges that can impair adherence to TB and HIV treatment regimens and alter the immune response needed for TB containment, while TB itself can disrupt neurotransmitter hormonal balance, further affecting mental health [18]. Poor mental health can lead to decreased motivation for maintaining a healthy lifestyle, increasing the risk of multi-morbidity in overweight and obese HIV patients [19,20]. The global triple burden pandemic of DR-TB, HIV, and obesity is a rising challenge in low and middle-income countries [10]. The co-occurrence of these diseases represents colliding pandemics, but analyzing TB treatment outcome, patient category, social history; type of regimen, age and gender influences, and clinical characteristics at the start of treatment for these three major diseases in rural areas of Eastern Cape has not been reported in the literature. The coexistence of these three conditions creates a complex web of challenges for healthcare providers as well. DR-TB and HIV require specialized treatments and monitoring, while obesity necessitates a focus on lifestyle and metabolic health. In rural areas of Eastern Cape TB-HIV, coinfection is very common [21]. HIV and obesity significantly influence DR-TB treatment outcomes, necessitating close coordination of treatment strategies and addressing the complex relationship between HIV and TB management [22]. The effect of comorbidities induced by both HIV and obesity on DR-TB treatment outcomes is not well established in rural areas of the Eastern Cape. Hence, the study was designed to assess the treatment outcome of patients with DR-TB comorbid with HIV and obesity in comparison with non-HIV and non-obesity-infected individuals.
2. Materials and Methods
2.1. Study Design
We retrospectively evaluated clinical data from TB-infected patient clinic files in four TB clinics and one referral hospital linked to the clinics in rural areas of Olivier Reginald Tambo District Municipality, Eastern Cape, South Africa.
2.2. Participant Selection Criteria
The study included all patient clinic files for individuals aged 18 and older who met the following criteria: they had complete information on drug-resistant tuberculosis (DR-TB) outcomes after starting a DR-TB treatment regimen, were HIV-positive and undergoing treatment, and had a Body Mass Index (BMI) classification ranging from moderate to severe according to BMI indicators.
2.3. Data Collection and Analysis
Baseline data was collected from the clinic files of patients. Out of 456 patient files reviewed, 360 contained complete information on multidrug-resistant tuberculosis (DR-TB), HIV status, and body mass index (BMI). This data was used to analyze various patient characteristics, including demographics, clinical features, patient categories, and social history. Additionally, analyses of culture conversion (n=212), time in treatment (n=207), and treatment outcomes (n=211) were conducted using data from the 360 patient files. The following formula was used to calculate BMI based on the measured weight and height recorded in the patient files: BMI = weight (kg) / [height (m)]².
2.4. Results
Age Distribution: Of the 360 participants in the study, the average age for the 17 individuals is 32. Distribution of Gender: Among the participants, 156 (43.3%) and 204 (56.7%) were women.
Figure 1.
The line chart showing BMI trends across age groups.

Most individuals tend to have a normal BMI range; however, during middle age (31-40), both overweight and underweight conditions become more common. This age group may be a critical target for specific nutritional interventions. Additionally, it is important to address underweight issues in older adults (51-60) to promote healthy aging.
Figure 2.
The bar chart illustrates the distribution of BMI categories across genders.
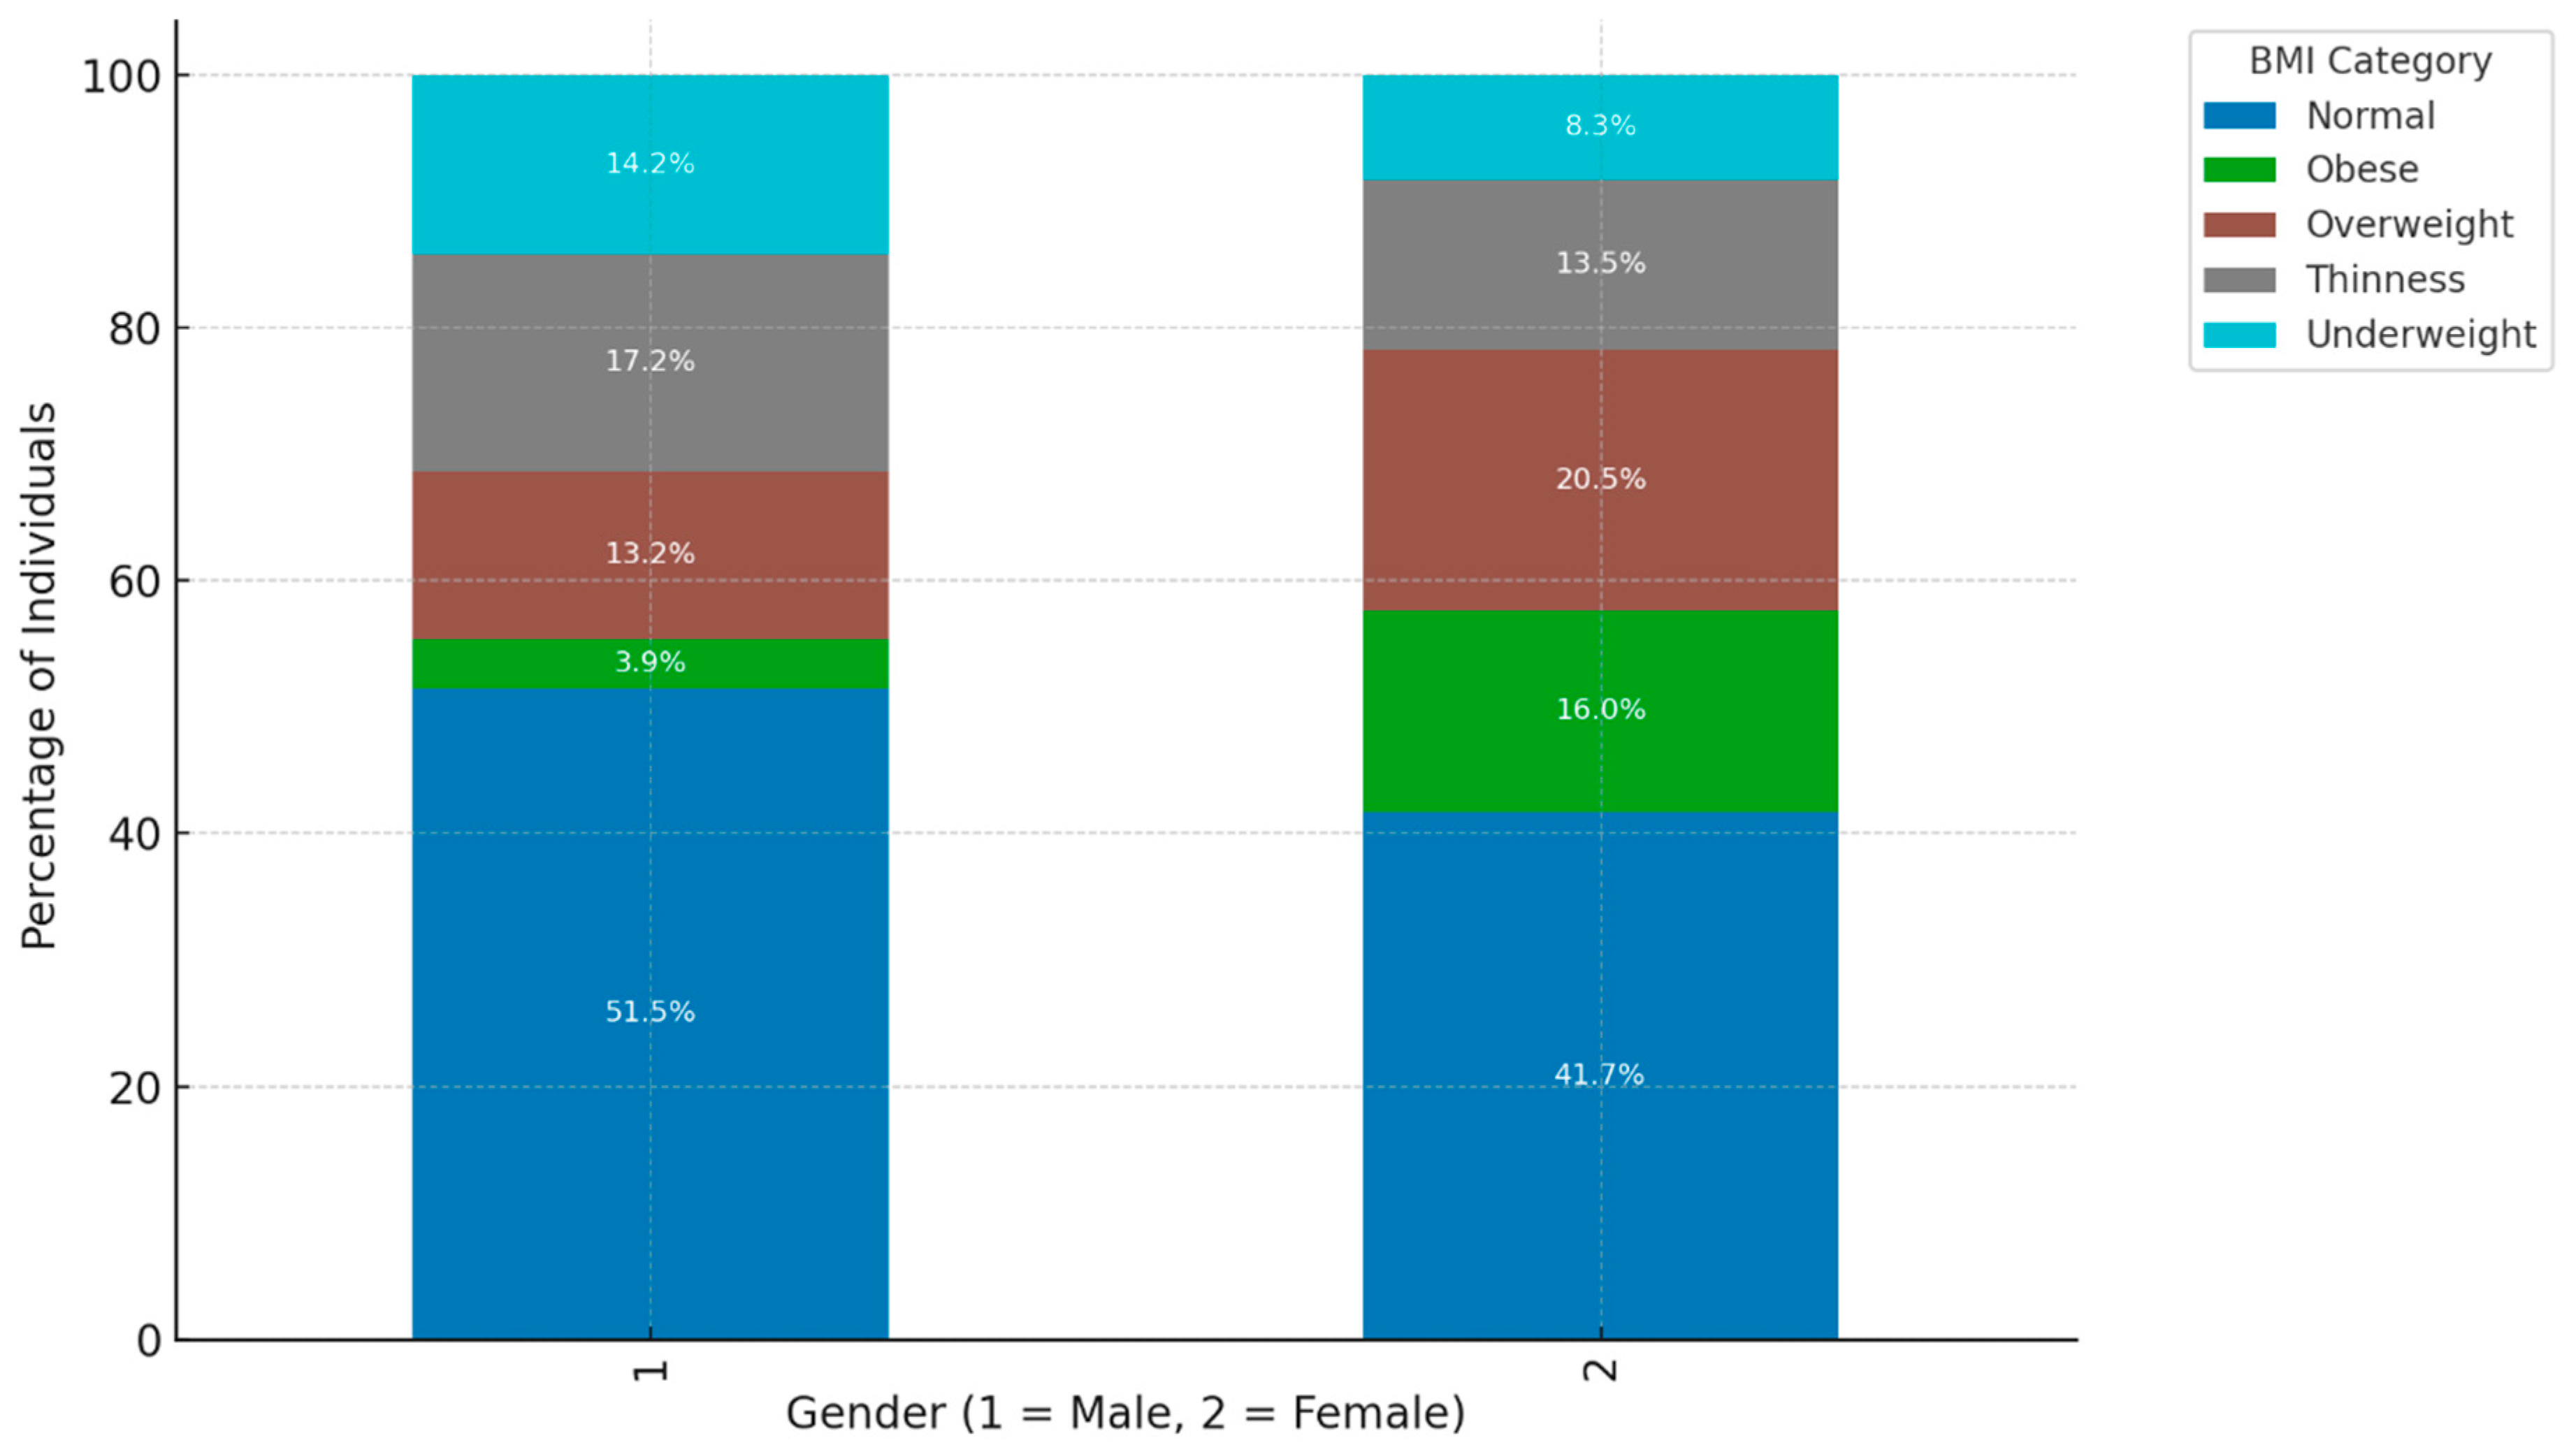
Higher Proportion of "Normal" BMI Among Males: Within the male demographic (Gender = 1), the predominant proportion (51.5%) is classified within the "Normal" BMI category. Conversely, females (Gender = 2) also exhibit a notable representation (41.7%) in the "Normal" BMI category, albeit at a lower rate compared to their male counterparts. This observation implies that males exhibit a higher likelihood of achieving a "Normal" BMI as compared to females, which may suggest underlying lifestyle or metabolic disparities between the sexes. Greater Representation of "Obese" and "Overweight" Categories Among Females: The female cohort demonstrates an elevated percentage within the "Obese" (16.0%) and "Overweight" (20.5%) classifications in contrast to males, who exhibit 3.9% and 13.2%, respectively, in these categories. This indicates that females within this sample are more prone to attaining higher BMI classifications, potentially attributable to a multitude of factors encompassing biological, lifestyle, or hormonal distinctions that influence body composition. "Underweight" Category More Common Among Males: Within the "Underweight" classification, males constitute a larger segment (14.2%) relative to females (8.3%). This observation may suggest that males are marginally more susceptible to being categorized as underweight within this sample, potentially reflecting variances in dietary practices, metabolic rates, or occupational influences that affect body weight differentially across genders. "Thinness" Category Shows Slight Gender Difference: Both male and female populations exhibit comparable percentages in the "Thinness" category, with males at 13.2% and females at 13.5%. This nearly equivalent distribution indicates that the incidence of thinness is evenly apportioned across genders, suggesting that being marginally below the "Normal" BMI threshold does not significantly diverge by gender within this particular group.
Figure 3.
The bar chart visualizes the distribution of different DR-TB types by HIV status.
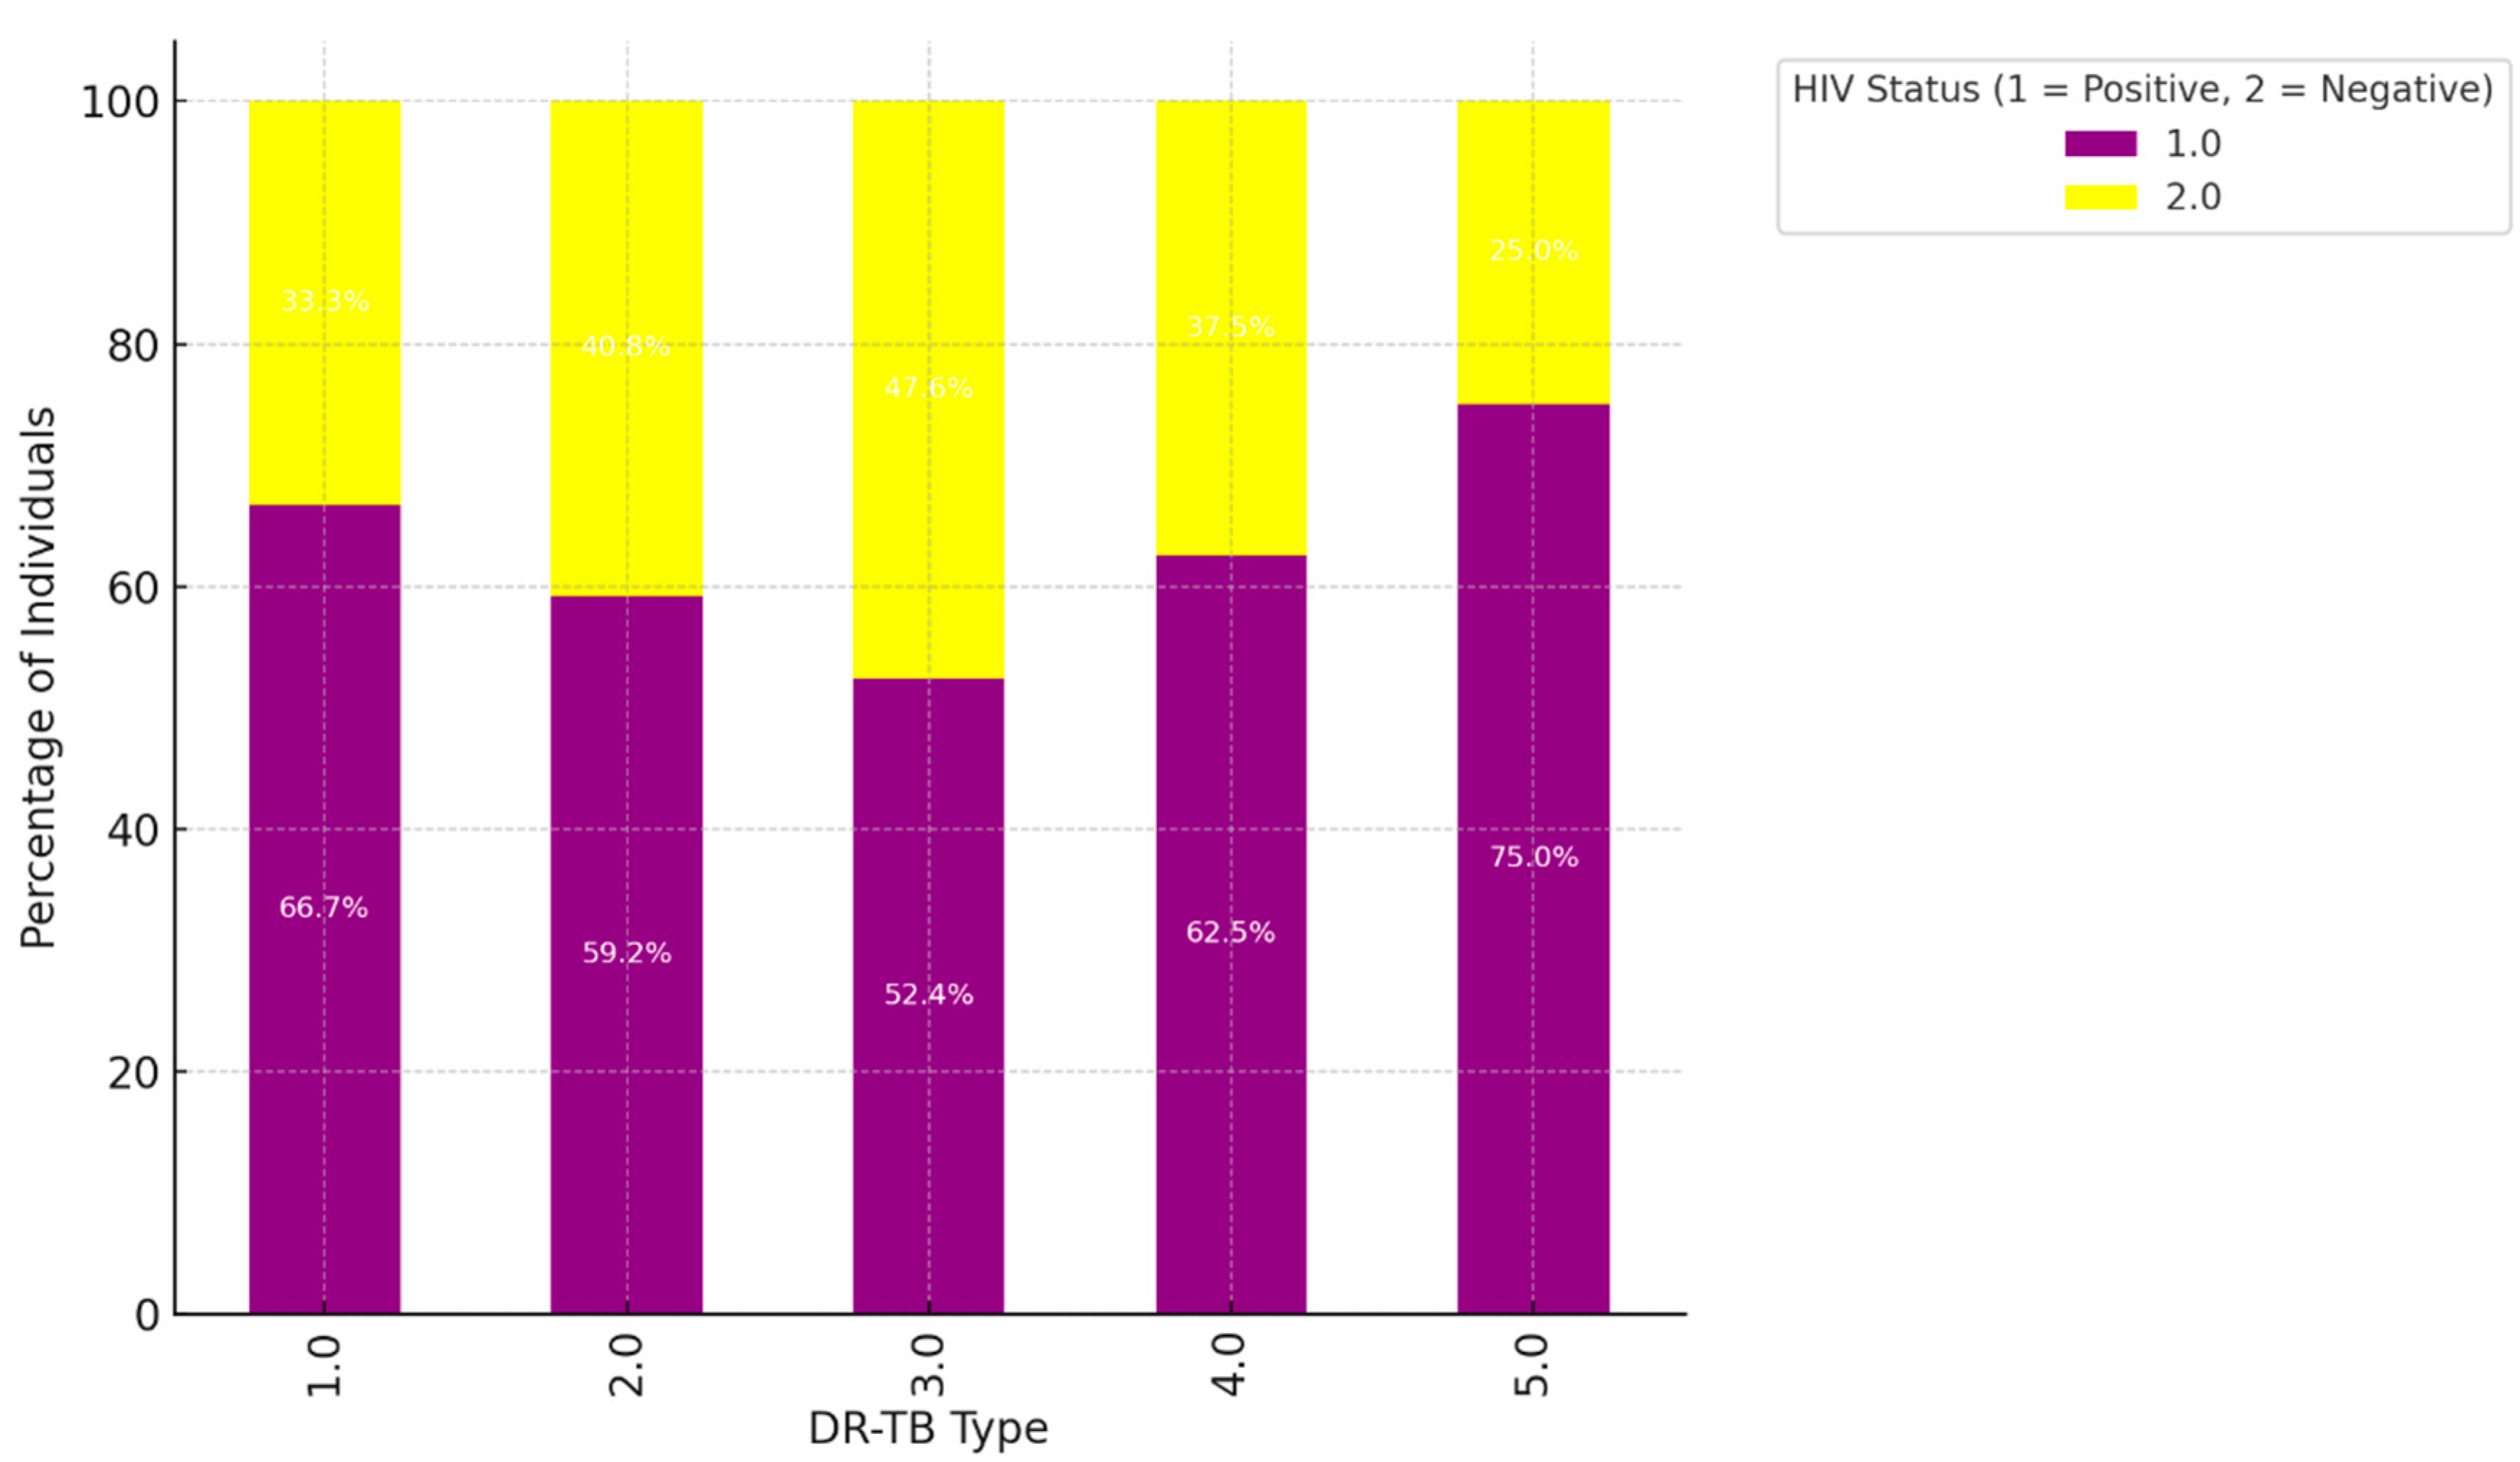
Higher HIV-Positive Representation in DR-TB Types 1.0 and 2.0: For DR-TB type 1.0, HIV-positive individuals make up 66.7% of cases, while HIV-negative individuals represent 33.3%. Similarly, in DR-TB type 2.0, 59.2% of cases are HIV-positive, and 40.8% are HIV-negative. These percentages indicate a strong association between HIV-positive status and DR-TB types 1.0 and 2.0. This could suggest that people living with HIV are more susceptible to these types of drug-resistant TB or that these types are more common among HIV-positive populations. Balanced Distribution in DR-TB Types 3.0 and 4.0: In DR-TB type 3.0, the distribution is nearly even, with 52.4% HIV-positive and 47.6% HIV-negative individuals. DR-TB type 4.0 also shows a closer balance, with 62.5% HIV-positive and 37.5% HIV-negative. The relatively balanced distribution in these types implies that HIV status is less of a distinguishing factor for these DR-TB types, and they affect both HIV-positive and HIV-negative populations in similar proportions. High HIV-Negative Representation in DR-TB Type 5.0: DR-TB type 5.0 has the highest percentage of HIV-negative individuals at 75.0%, with only 25.0% of cases being HIV-positive. This suggests a stronger association of DR-TB type 5.0 with the HIV-negative population, indicating that this type of drug-resistant TB may be less common among individuals living with HIV. Summary of Trends: Stronger Association of HIV-Positive Status with DR-TB Types 1.0 and 2.0: The higher percentages of HIV-positive individuals in these DR-TB types suggest that these drug-resistant TB strains are more prevalent among HIV-positive populations. This may be due to immune system vulnerabilities associated with HIV, making individuals more susceptible to these specific types of drug-resistant TB. More Balanced HIV Status in Types 3.0 and 4.0: The closer balance of HIV-positive and HIV-negative individuals in DR-TB types 3.0 and 4.0 indicates that these types do not show a strong preference for either group, affecting both populations relatively equally. Predominantly HIV-Negative in DR-TB Type 5.0: The high proportion of HIV-negative individuals in DR-TB type 5.0 could imply that this type is more likely to occur in individuals without HIV, suggesting different pathways or risk factors for this type of DR-TB.
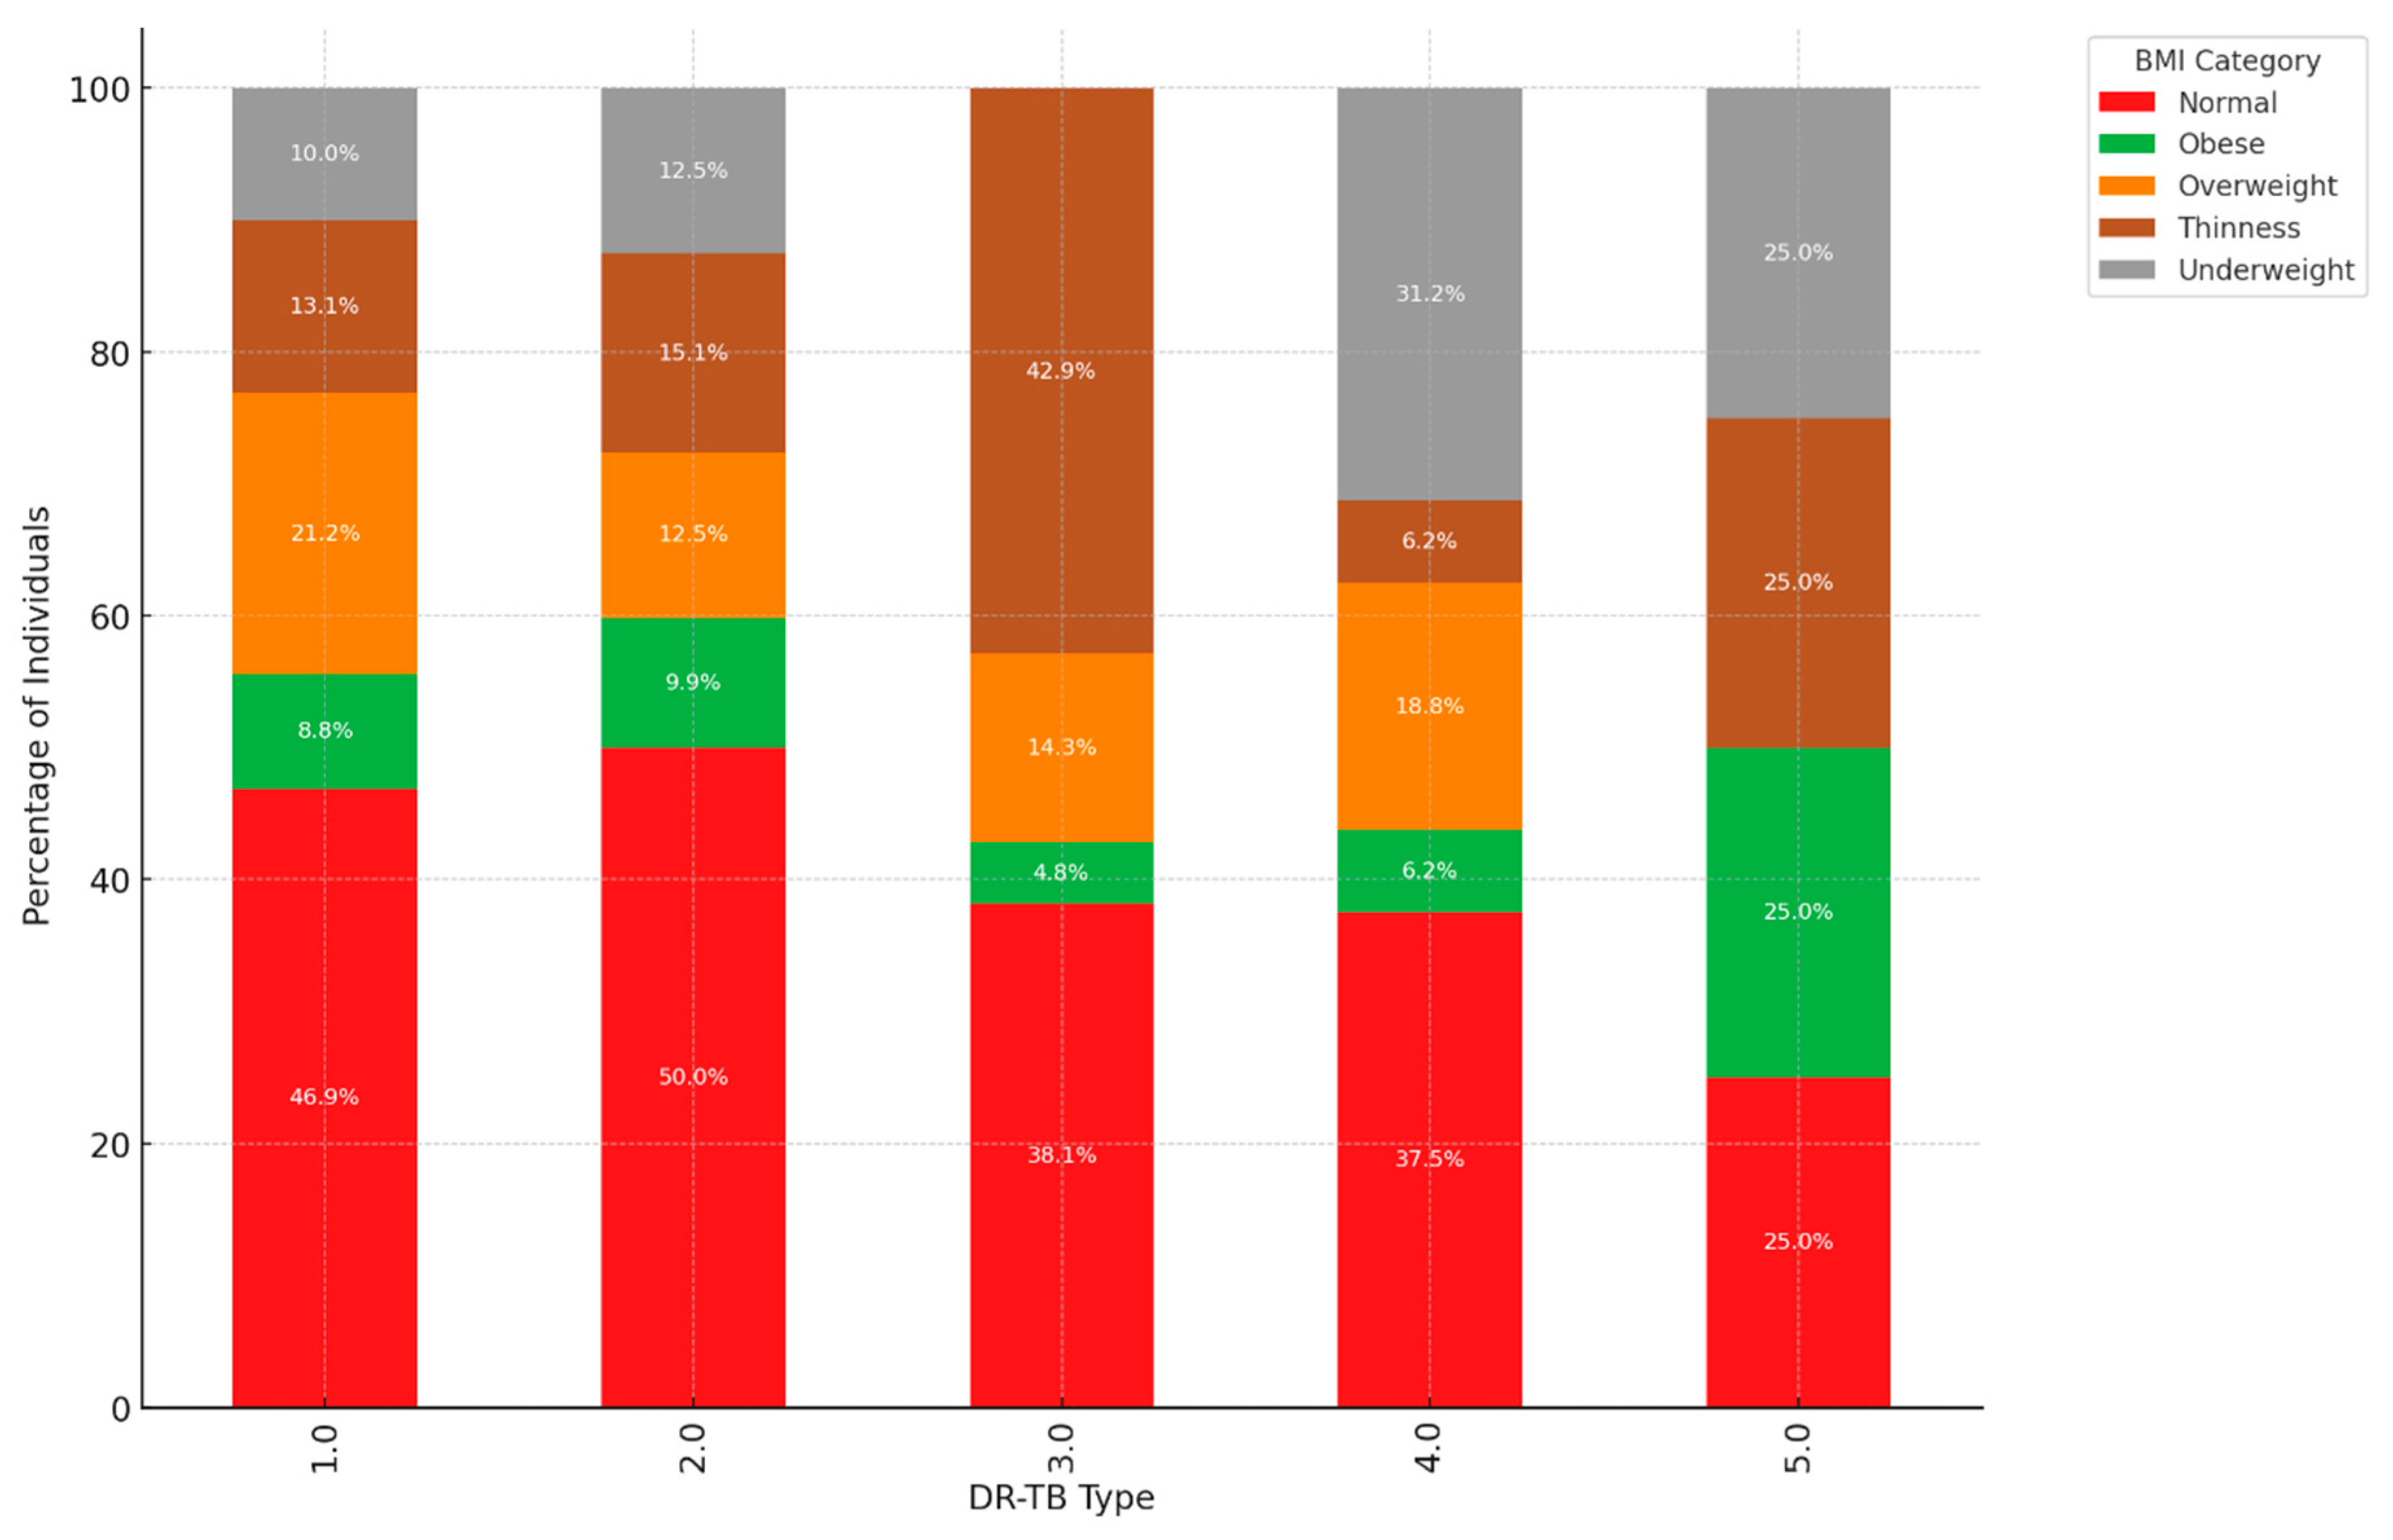
Figure 4.
The bar chart shows the DR-TB cure rates by gender.
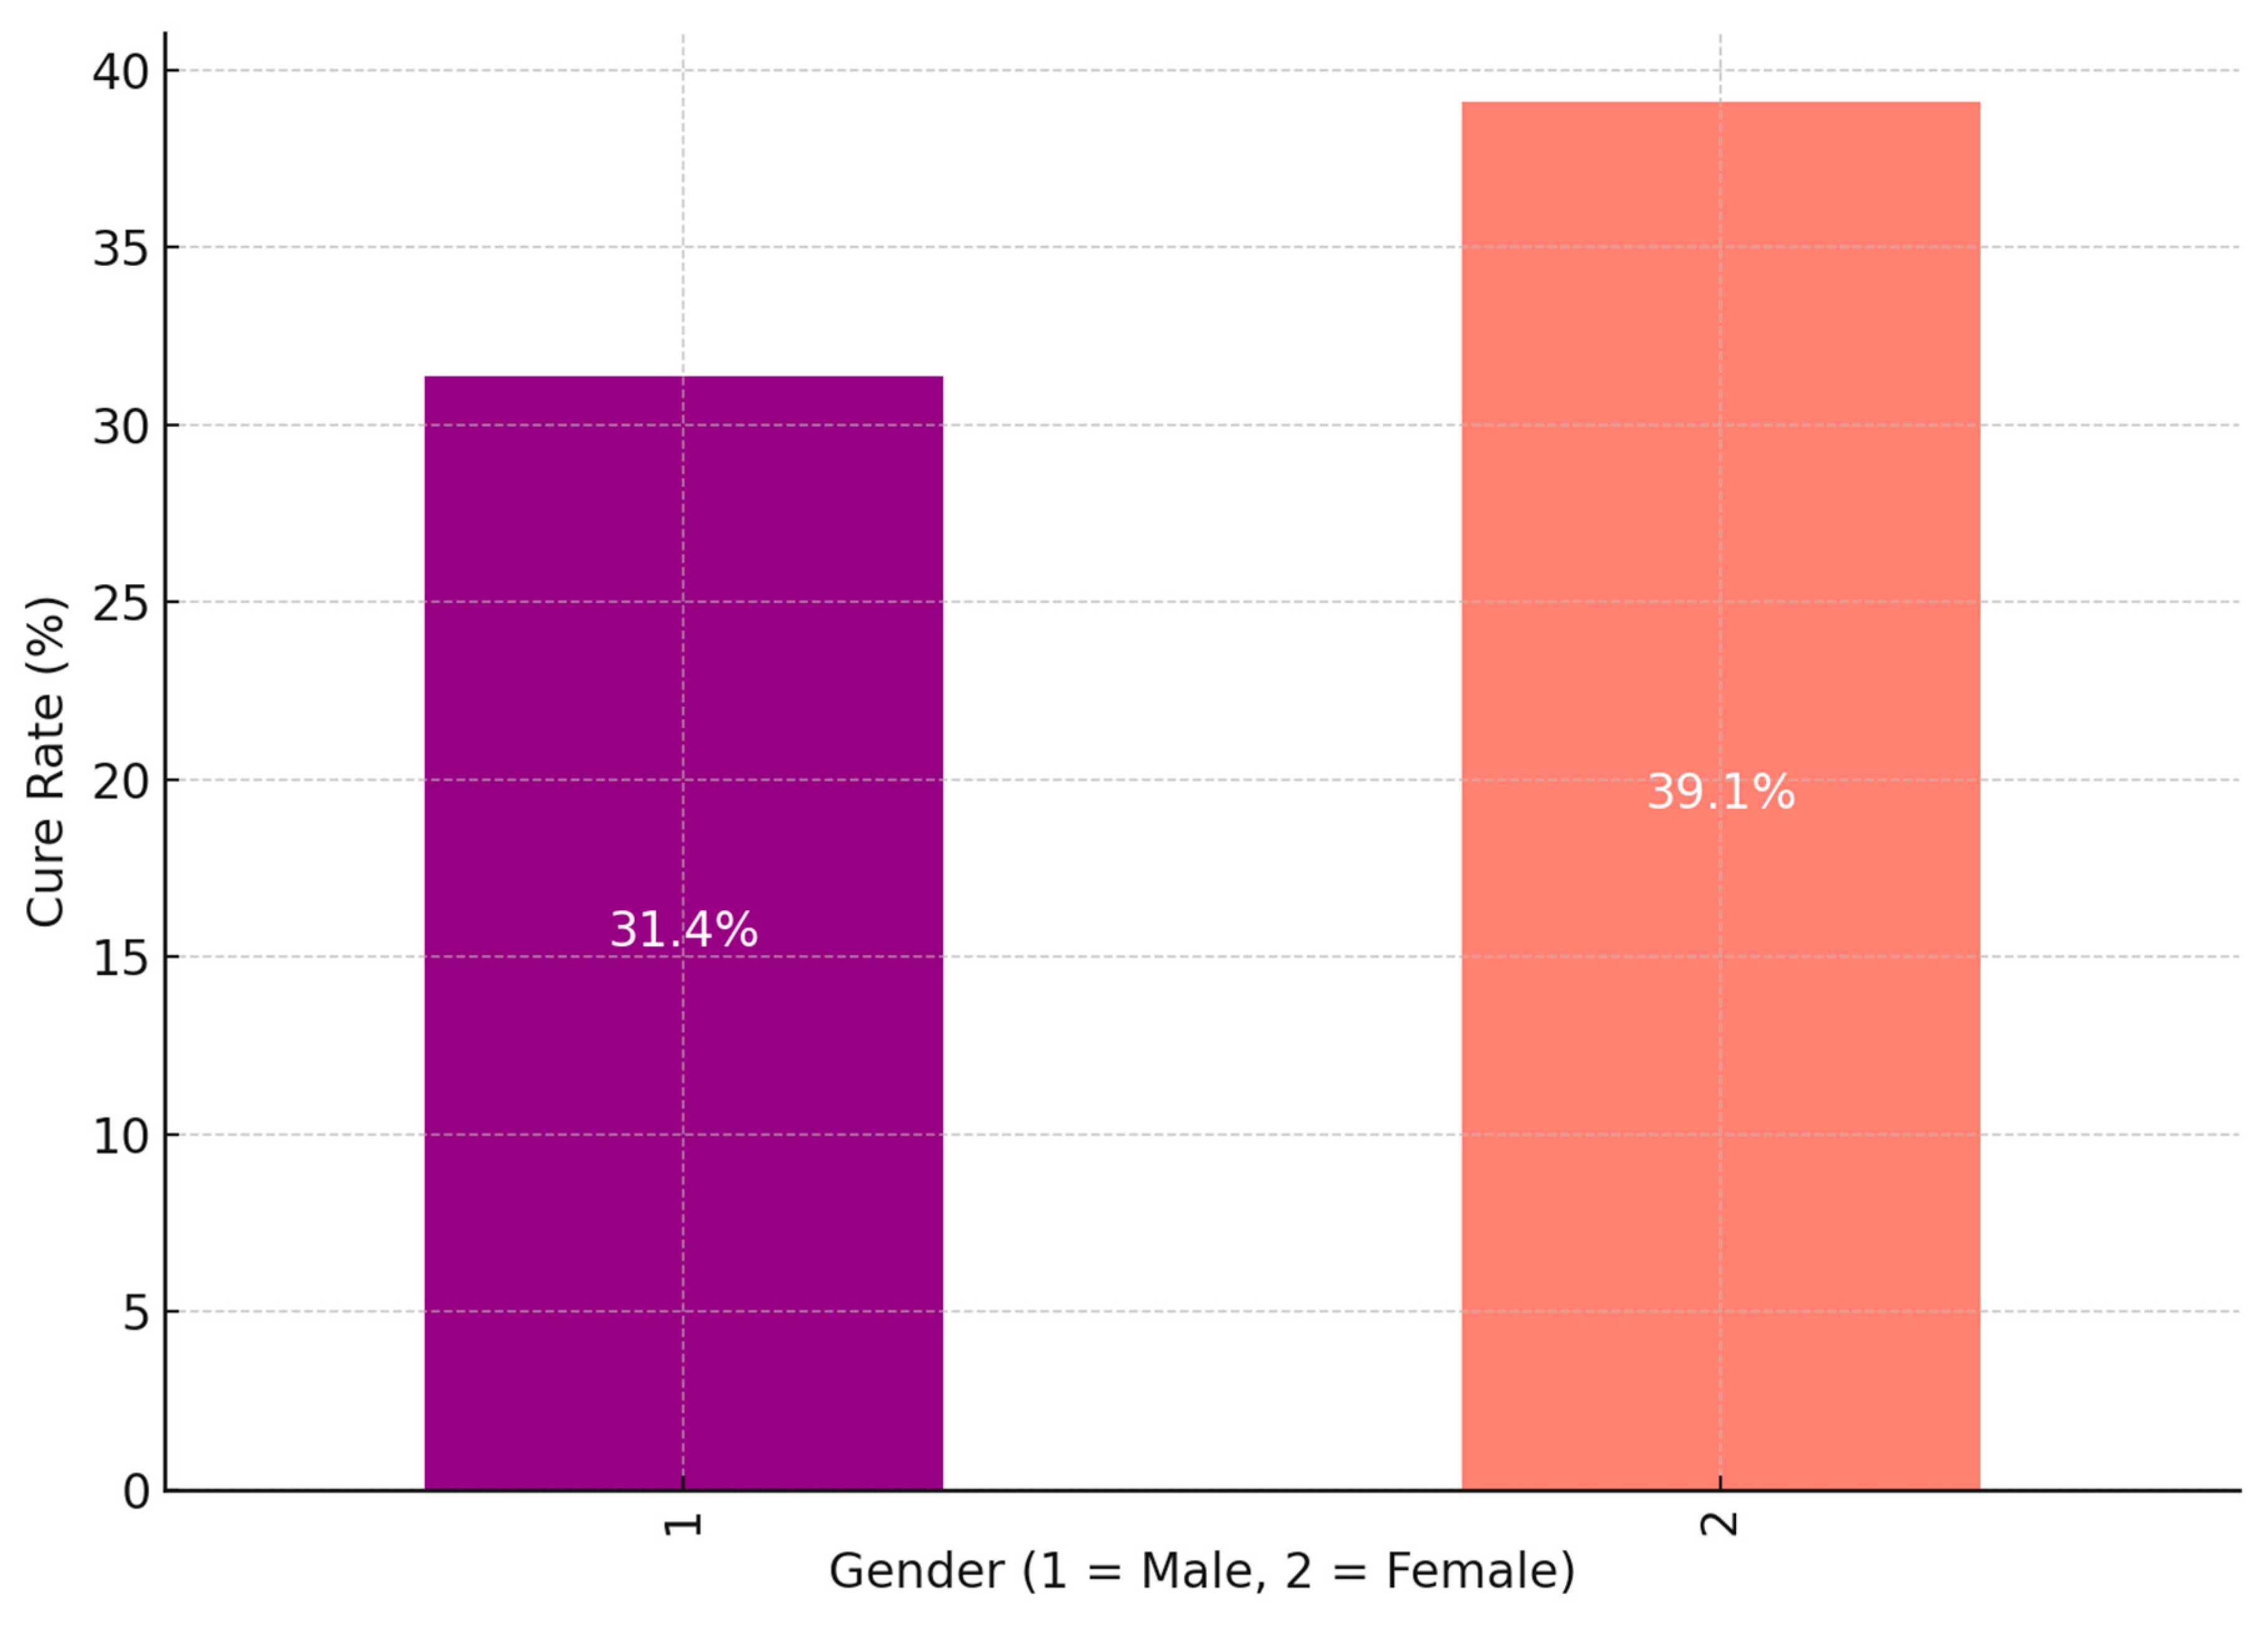
Greater Cure Rate for Female Patients: The cure rate for female patients (Gender = 2) is 39.1%, greater than the cure rate for male patients (Gender = 1), which is 31.4%.This implies that, in comparison to male patients, female patients may react more favourably to DR-TB therapy or may have greater treatment adherence or results. Several variables, including biological differences, social support, and health-seeking behaviour, may cause the variation in cure rates. Male Cure Rate: Although it is lower than that of female patients, the cure rate for male patients is still a respectable percentage of cases that are successfully treated, at 31.4%. Males had a lower cure rate, which would suggest that they face particular obstacles or difficulties in receiving effective therapy. Disparities in social variables that affect treatment adherence and results, greater incidence of comorbidities, or delayed healthcare-seeking behaviour are some potential causes. Possible Factors Influencing Gender Differences in Cure Rates: Biological and Immunological Differences: Females may possess specific biological or immunological advantages that enhance their responses to treatment. Empirical studies have demonstrated that gender-based variations in immune response can significantly affect susceptibility to and recovery from infections, including tuberculosis (TB). Health-Seeking Behaviour: It has been observed that females generally exhibit a propensity to seek healthcare more swiftly than their male counterparts, which may facilitate earlier diagnosis and treatment, ultimately leading to improved cure rates. Conversely, males may exhibit delays in seeking medical care, potentially resulting in adverse outcomes. Social and Economic Factors: Variations in social support networks or economic stability across genders can significantly influence treatment adherence. Females may benefit from more robust support systems that promote compliance with prolonged TB treatments, whereas males may encounter obstacles related to occupational responsibilities, financial pressures, or societal stigma that hinder their ability to complete treatment. Lifestyle and Comorbidities: Lifestyle determinants, including tobacco use, alcohol consumption, and the prevalence of comorbid conditions (e.g., diabetes), are generally more pronounced in males, which may negatively correlate with cure rates. Such factors can compromise immune function or adversely interact with TB pharmacotherapy, thereby diminishing treatment efficacy. Summary: The data presented in the chart reveals a significant gender disparity in drug-resistant tuberculosis (DR-TB) cure rates, with females demonstrating a superior cure rate (39.1%) in comparison to males (31.4%). This discrepancy may stem from an interplay of biological, social, and behavioral determinants that influence treatment adherence and overall success. Acknowledging this gender disparity could enable healthcare providers to customize interventions more effectively, such as by offering enhanced support for male patients to elevate their cure rates.
Figure 5.
The bar chart illustrates the impact of BMI on cure rates for patients with drug-resistant tuberculosis (DR-TB).
Figure 5.
The bar chart illustrates the impact of BMI on cure rates for patients with drug-resistant tuberculosis (DR-TB).
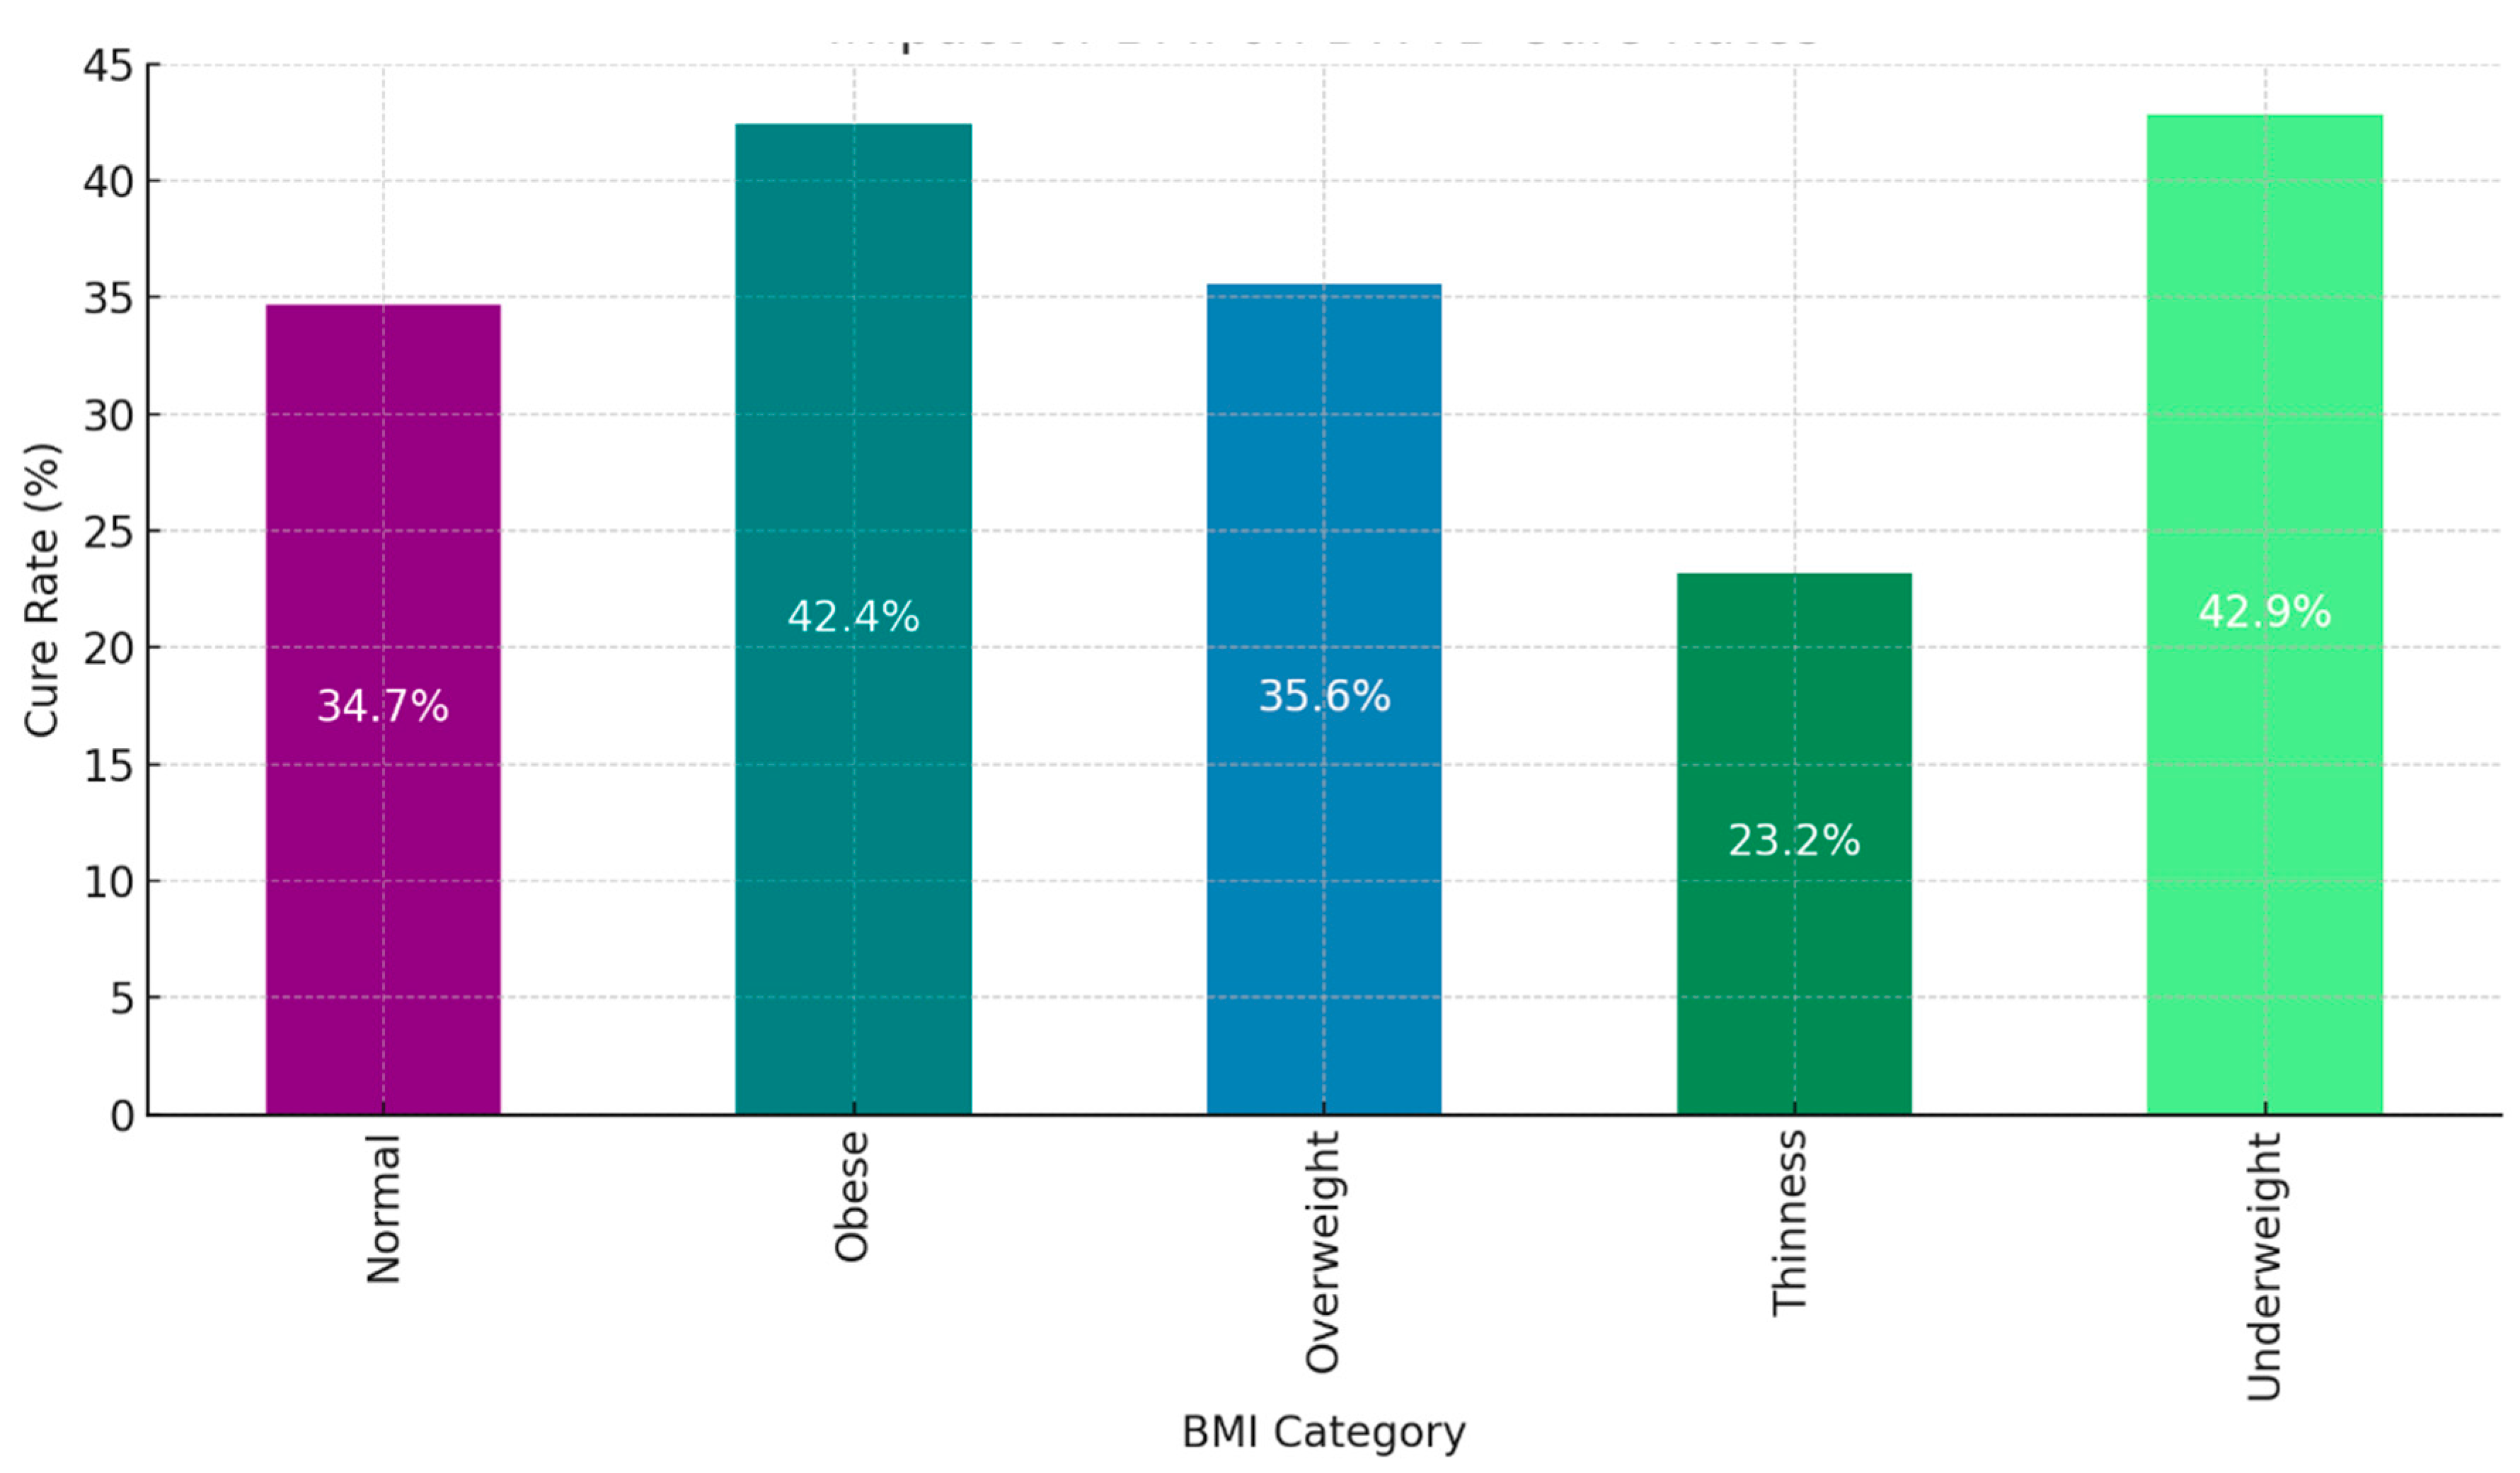
Individuals classified as "Obese" and "Underweight" demonstrate the highest cure rates among all BMI categories, with rates of 42.4% and 42.9%, respectively. These results clearly establish that both high and low extremes of BMI are linked to a significantly increased likelihood of successful treatment. It indicates that individuals with substantial body reserves (the obese) or those who are more likely to adhere to medical treatments (the underweight) are better positioned to respond favorably to DR-TB therapy, although the precise reasons behind this relationship warrant further investigation. In contrast, individuals in the "Normal" BMI category achieve a cure rate of 34.7%, while those in the "Overweight" category display a slightly higher rate of 35.6%. These moderate figures reveal that those within the "Normal" or "Overweight" BMI ranges do not experience the same level of treatment success as those who fall at the extremes of the BMI spectrum. This asserts that factors beyond BMI play a more decisive role in influencing cure rates for these individuals.The "Thinness" category exhibits the lowest cure rate at 23.2%, significantly trailing the rates of other BMI groups. This strongly suggests that individuals with low body weight, indicative of malnutrition or other health complications, face substantial obstacles in achieving successful DR-TB treatment outcomes. Their low body weight critically impacts their immune response and tolerance to intensive TB medications, which directly contributes to their lower cure rates.In summary, the trends are clear: both "Obese" and "Underweight" individuals achieve the highest cure rates, demonstrating that BMI extremes positively influence treatment outcomes. More research is necessary to uncover the underlying mechanisms at play. Individuals categorized as "Normal" and "Overweight" exhibit only moderate cure rates, emphasizing that average body weight alone is not a significant factor in DR-TB treatment success. The "Thinness" group, with the lowest cure rate, underscores the increased vulnerability of low-BMI individuals in managing DR-TB. Underweight individuals must receive additional nutritional or supportive care to improve their outcomes. This analysis unequivocally illustrates that BMI is a crucial predictive factor for DR-TB treatment success. Patients at the BMI extremes ("Obese" and "Underweight") benefit from higher cure rates, while those in the "Thinness" category face formidable challenges. Healthcare providers must consider BMI as an essential component of patient assessments when developing DR-TB treatment plans. For those identified as "Thin," implementing further nutritional support or specialized care is imperative to enhance their treatment success.
Figure 6.
The bar chart illustrates the relationship between BMI, age groups, and treatment outcomes for DR-TB patients.
Figure 6.
The bar chart illustrates the relationship between BMI, age groups, and treatment outcomes for DR-TB patients.
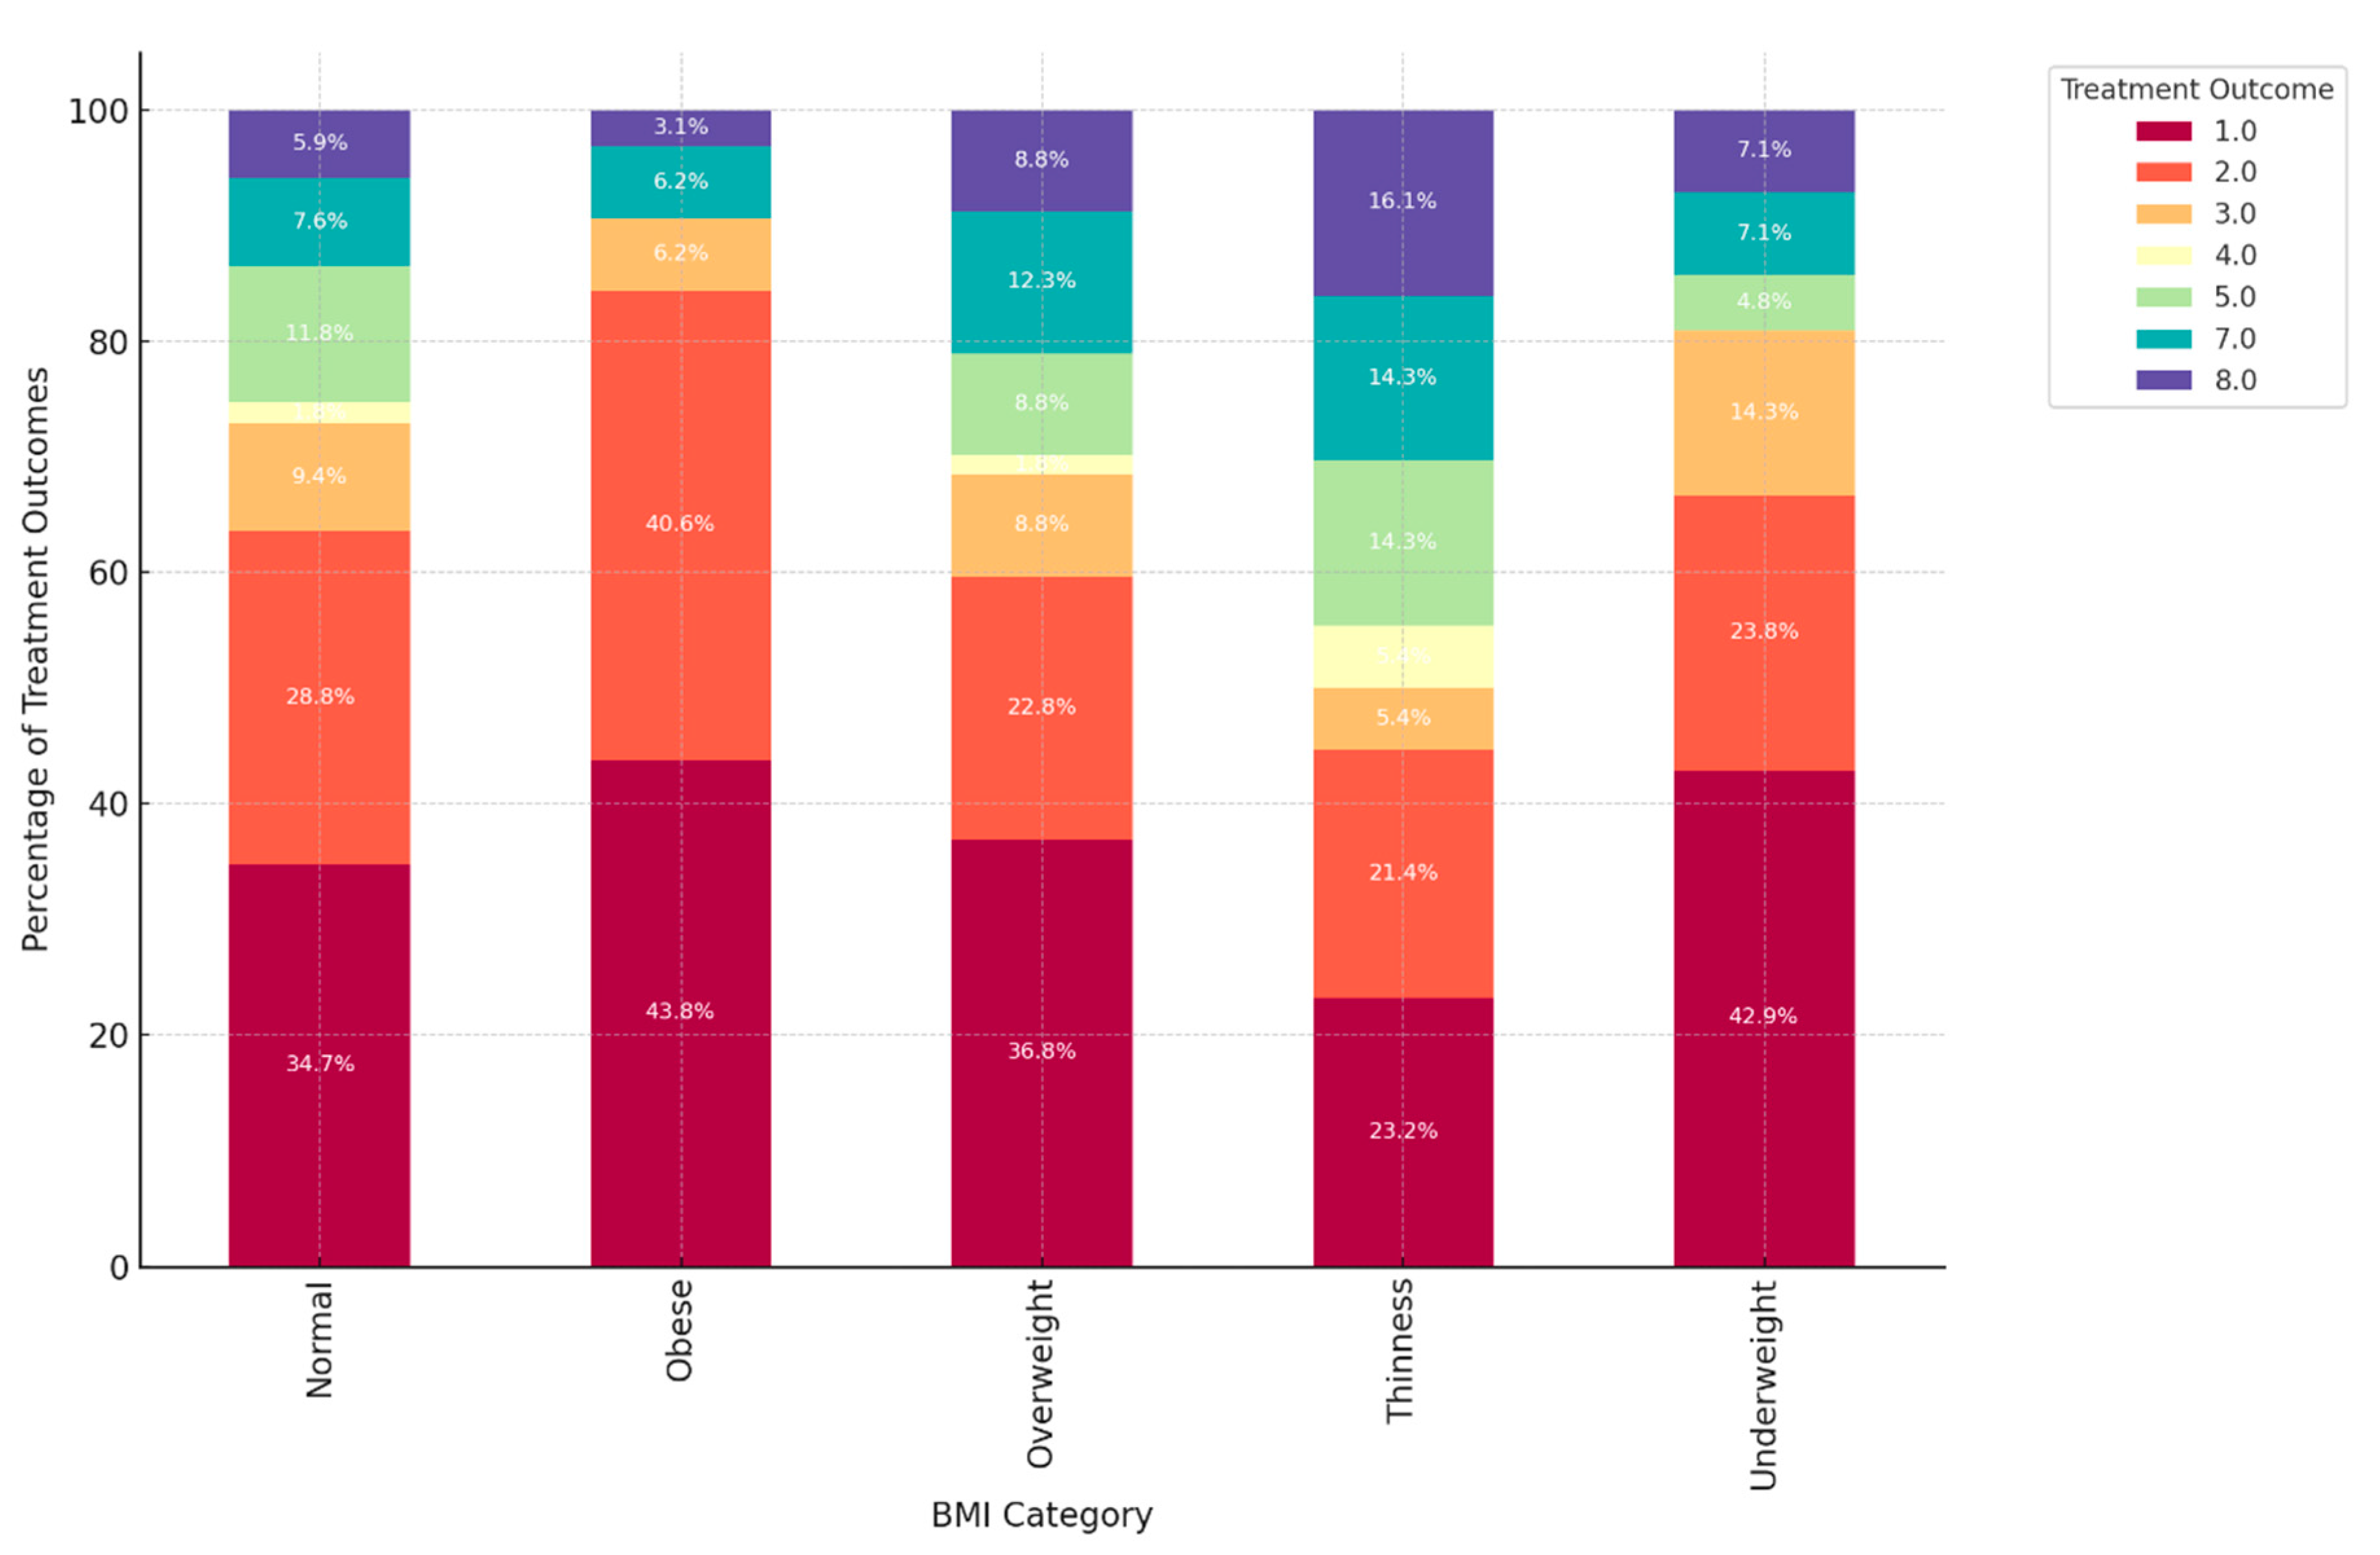
Prevalence of "Normal" BMI Across Most DR-TB Types: The "Normal" BMI category undeniably constitutes a significant portion of each type of DR-TB, particularly in DR-TB types 1.0 and 2.0. In these categories, individuals with a "Normal" BMI account for nearly half of the population, with 46.9% in DR-TB type 1.0 and 50.0% in DR-TB type 2.0. This clearly indicates that individuals with a "Normal" BMI are prominently represented among most DR-TB types, reflecting the widespread nature of DR-TB among those with average body weight ranges. Underweight Individuals Prominent in Specific DR-TB Types: In DR-TB types 3.0 and 4.0, there is a marked prevalence of individuals categorized as "Underweight," making up 31.2% and 25.0%, respectively. This strong correlation suggests a direct link between these DR-TB types and lower body weight, likely due to the severity of the disease or related nutritional challenges. Underweight individuals are particularly susceptible to these specific forms of drug-resistant TB. Obese and Overweight Categories in DR-TB Types 1.0 and 2.0: DR-TB types 1.0 and 2.0 distinctly showed significant proportions of individuals classified as "Obese" and "Overweight." For instance, in DR-TB type 1.0, 13.1% fall into the obese category, while 21.2% are classified as overweight. Similarly, DR-TB type 2.0 reveals 9.9% of individuals as obese and 12.5% as overweight. This evidence strongly suggests that higher BMI categories, such as obesity and overweight, are more prevalent in these DR-TB types, indicating that individuals with increased body weight experience unique interactions with these forms of drug-resistant TB. Thinness Category Shows Variability: The "Thinness" category clearly exhibited varied representation across different DR-TB types. DR-TB type 2.0 stands out with the highest rate of "Thinness" at 15.1%, while this category is less significant in others. This strongly indicates that thin individuals have a greater association with DR-TB type 2.0, though they are not widely represented in other DR-TB types, revealing the variability in the relationship between thinness and specific types of drug resistance. Balanced Distribution in DR-TB Type 5.0: DR-TB type 5.0 presents an almost equal distribution across several BMI categories, with "Normal," "Obese," and "Underweight" each comprising 25.0%. This balanced distribution suggests that DR-TB type 5.0 does not correlate strongly with any specific BMI category, affecting individuals of diverse body weights more evenly. This data unequivocally reveals a connection between BMI and certain DR-TB types: Normal BMI stands out as the most common across all DR-TB types, indicating a baseline vulnerability to DR-TB, regardless of BMI. Underweight individuals are particularly prominent in DR-TB types 3.0 and 4.0, demonstrating that these types disproportionately impact those with lower body weight. Furthermore, those categorized as Obese and Overweight have a higher representation in DR-TB types 1.0 and 2.0, confirming the stronger association of these bodyweight categories with these specific DR-TB types. In contrast, DR-TB type 5.0 shows an even distribution of BMI, asserting a potentially equal impact across various BMI categories.
Figure 7.
The synergy between DR-TB type, BMI category, and HIV status.
Dominance of "Normal" BMI: A significant portion of individuals diagnosed with Drug-Resistant Tuberculosis (DR-TB) fall within the "Normal" BMI range. For instance, in DR-TB types 1.0 and 2.0, individuals with a "Normal" BMI represent 46.9% and 50.0%, respectively. This prevalence suggested that "Normal" BMI may serve as an important baseline for understanding patient demographics across various DR-TB types. Variation in Obesity and Overweight: The presence of "Obese" and "Overweight" individuals was noteworthy, especially in DR-TB types 1.0, 2.0, and 3.0. In DR-TB type 2.0 alone, 9.9% of individuals are classified as obese, while 12.5% were categorized as overweight. These figures pointed to a substantial cohort affected by heightened BMI in these specific DR-TB types, highlighting the need for tailored treatment strategies that consider these patients' unique health profiles. Underweight Prevalence in DR-TB Types 3.0 and 4.0: There was a concerning trend of higher underweight proportions in DR-TB types 3.0 and 4.0, with figures of 31.2% and 25.0%, respectively. This observation suggested a potential link between these types of DR-TB and lower body weight, which could stem from the disease's severity or related factors that contribute to weight loss. Understanding this relationship can help inform better nutritional support and management strategies for affected individuals. Thinness Across DR-TB Types: The "Thinness" category was particularly prominent in DR-TB type 2.0, with 15.1% of individuals affected. Conversely, other types displayed a lower prevalence of thin individuals. This pattern points to the possibility that thinness may be more closely associated with DR-TB type 2.0, emphasizing the need for focused research and intervention efforts in this area. Insights on DR-TB Type 5.0: In striking contrast, DR-TB type 5.0 demonstrates an even distribution across all BMI categories, with each category representing either 25.0% or no presence. This balanced distribution may suggest that DR-TB type 5.0 affects individuals across a diverse range of body weights, indicating the importance of broadening our understanding of how various factors influence susceptibility to different DR-TB types. Summary: The findings highlight that individuals with a "Normal" BMI are the most prevalent among all DR-TB types, serving as a key focus for further study. However, the higher percentages of underweight individuals in DR-TB types 3.0 and 4.0 merit attention, as they suggest a potential connection between these TB types and reduced body weight. Meanwhile, the prevalence of higher BMIs in types 1.0 and 2.0 reinforces the importance of tailored approaches to treatment. By carefully examining the distribution of BMI categories, health professionals can better devise strategies to address the unique needs of individuals affected by drug-resistant tuberculosis, ultimately improving patient outcomes and care.
Figure 8.
The heatmap visualization of the Cramér's V values for the association between each pair of variables (DR-TB type, BMI, and HIV status).
Figure 8.
The heatmap visualization of the Cramér's V values for the association between each pair of variables (DR-TB type, BMI, and HIV status).
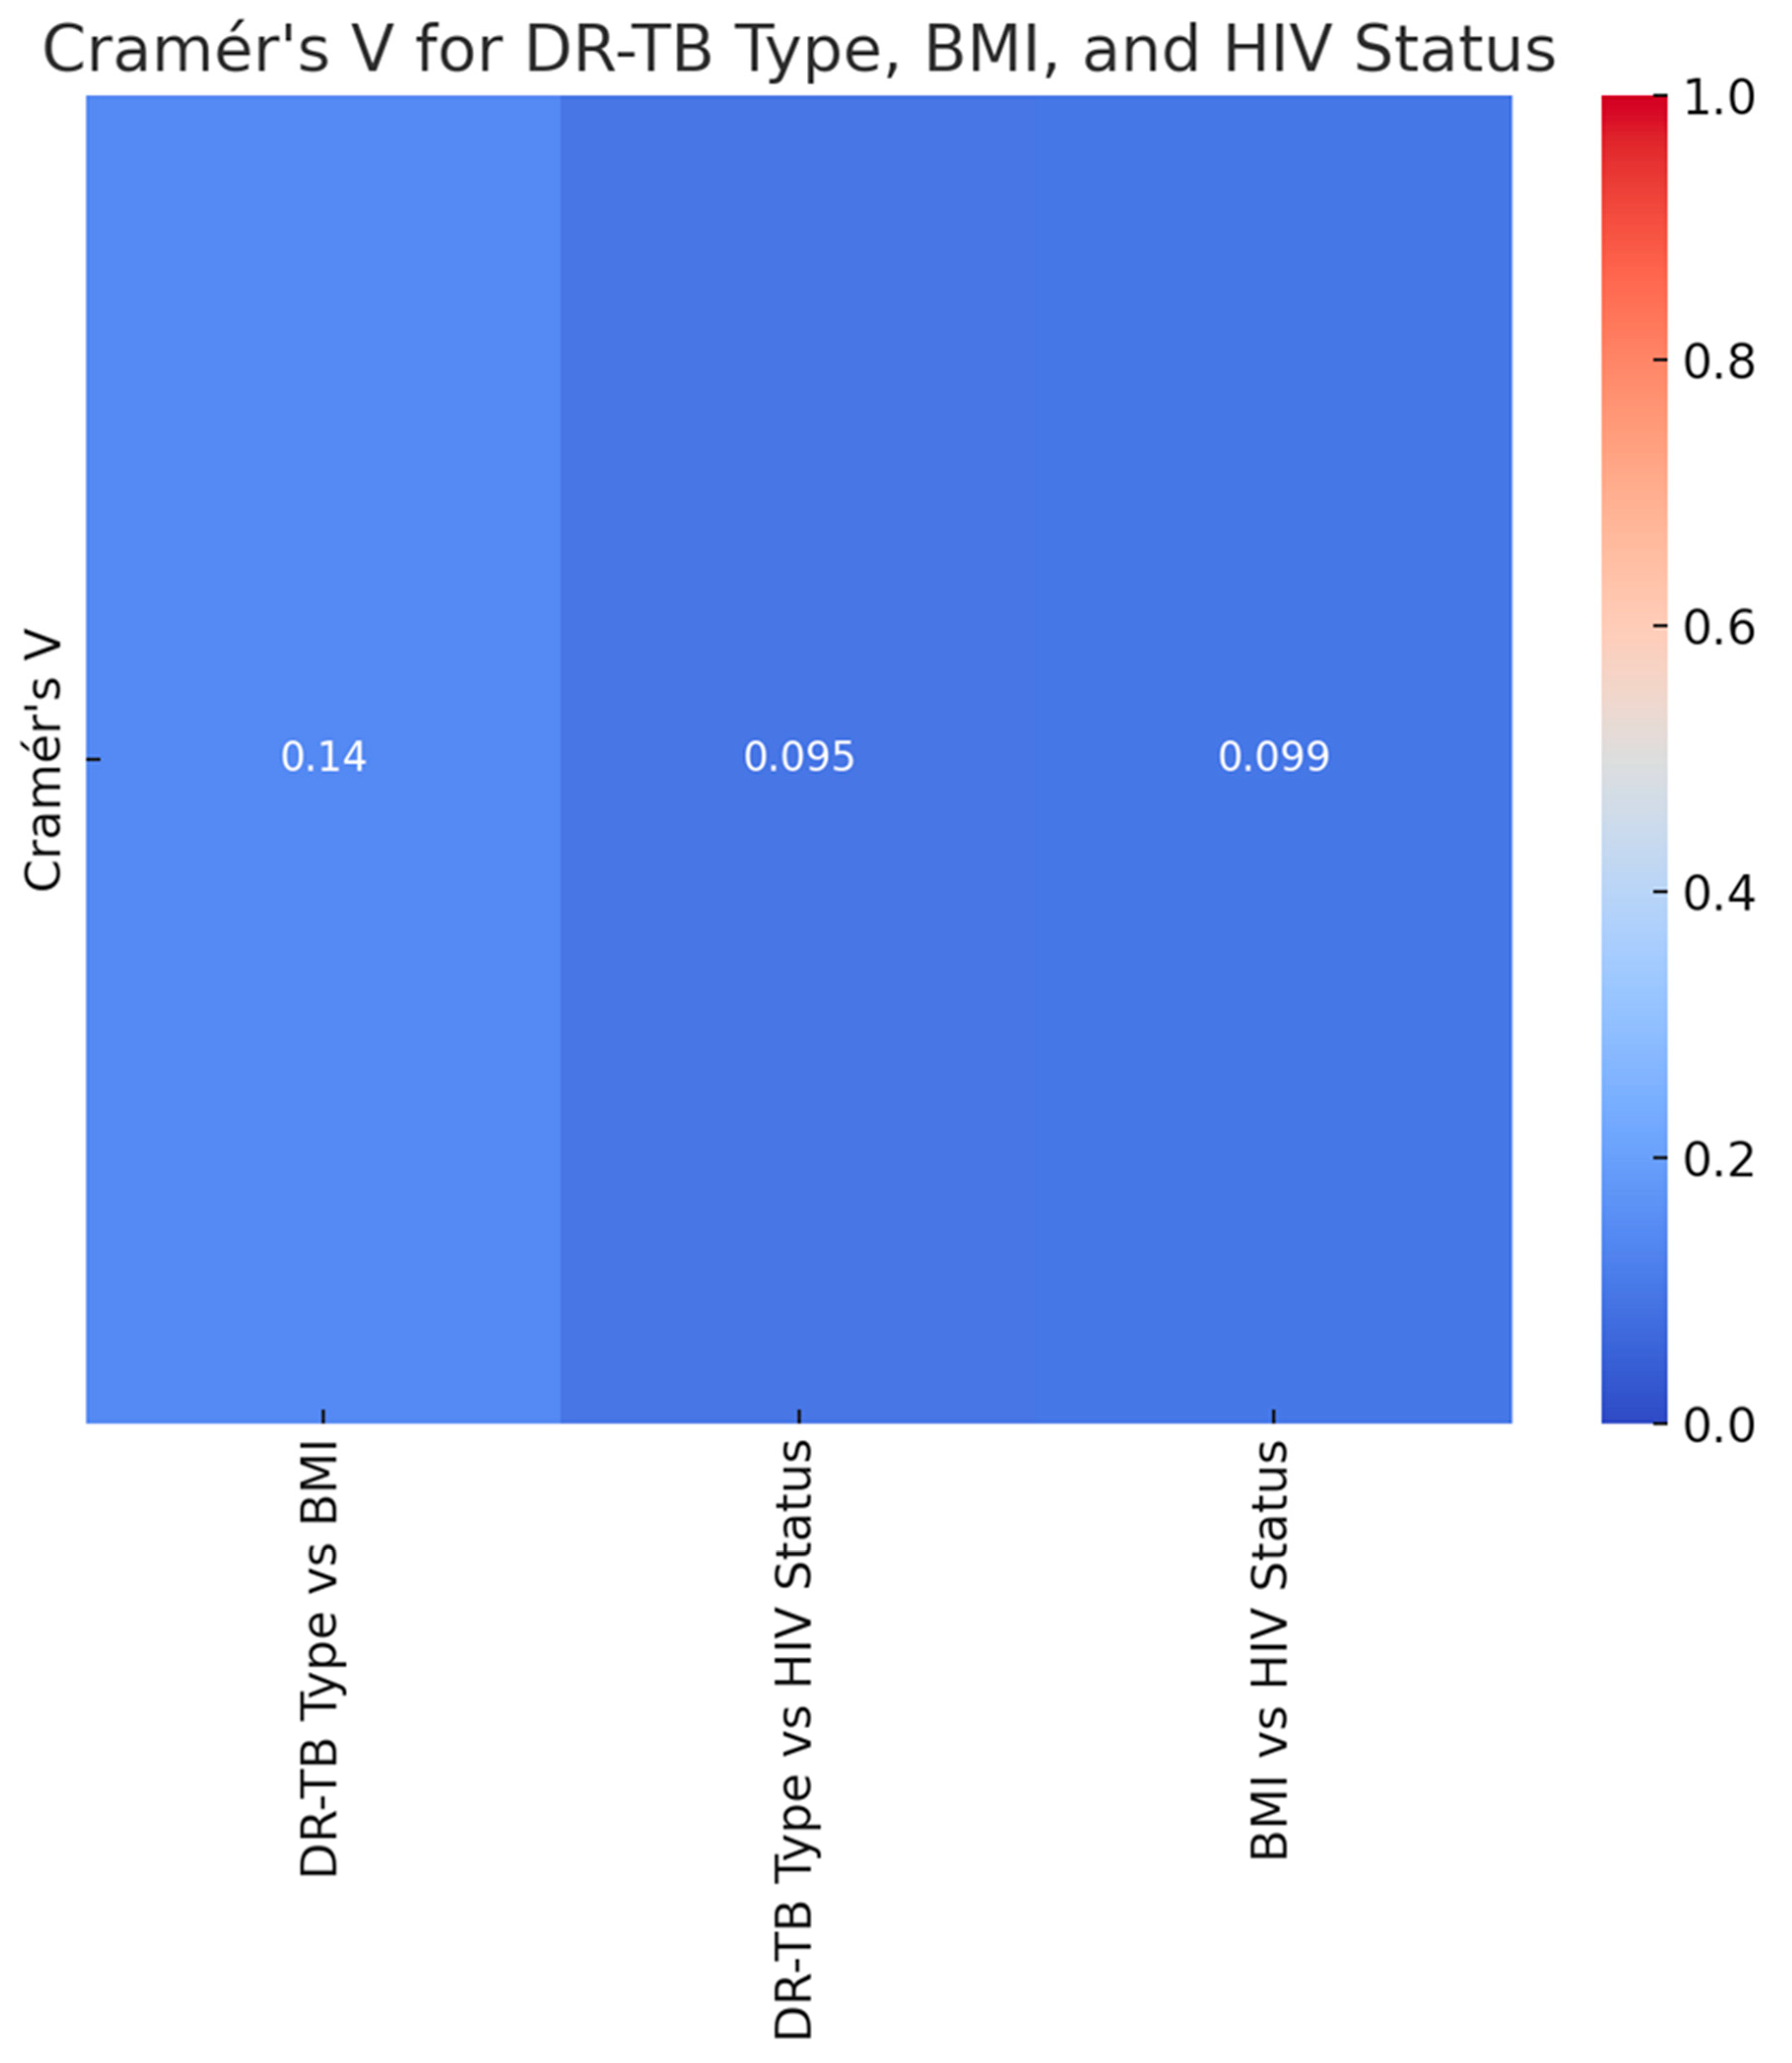
The heatmap displays the Cramér V values representing the associations between DR-TB type, BMI, and HIV status. The Cramér V values indicate weak associations between DR-TB type and BMI category, DR-TB type and HIV status, and BMI category and HIV status. Overall, the analysis suggests that these factors do not have a strong interrelationship in the study.
2.5. Definition of Operational Terms
A heatmap is a two-dimensional visualization of data that uses color to represent numerical values. This can be either different intensities of the same hue, or different colors from a palette [23].
Cramer's V is a crucial metric in statistics and data analysis that evaluates the degree of correlation between two categorical variables. This coefficient, which derives from the chi-square statistic, returns a normalized value in the range of 0 to 1, where 1 denotes an ideal link and 0 denotes no association [23].
The following definitions were defined according to Merriam-Webster Medical Dictionary [24]:
"Nutritional status refers to evaluating an individual's health in terms of their diet, body weight, and biochemical data. It is commonly assessed using clinical indicators such as body weight, BMI, and the rate of unintentional weight loss
Overweight and obesity are defined as abnormal or excessive fat accumulation that presents a health risk. A body mass index (BMI) over 25 is considered overweight, and over 30 is obese.
Synergy In medicine, the interaction of two or more drugs is described when their combined effect is greater than the sum of the effects seen when each drug is given alone.
Thinness is generally defined as a physical condition in which the body mass index (BMI) is below 18.5.
Hypertension (high blood pressure) is when the pressure in your blood vessels is too high (140/90 mmHg or higher). It is common but can be serious if not treated.
Diabetes mellitus is impaired insulin secretion and variable degrees of peripheral insulin resistance leading to hyperglycemia.
Cancer is a large group of diseases with one thing in common: They happen when normal cells become cancerous cells that multiply and spread.
Kidney disease means your kidneys aren't working properly and are beginning to lose their function.
Liver disease refers to liver disease, they’re usually referring to chronic conditions that do progressive damage to your liver over time. Viral infections, toxic poisoning, and certain metabolic conditions are among the common causes of chronic liver disease.
Mental illness, also called mental health disorders, refers to a wide range of mental health conditions — disorders that affect your mood, thinking, and behavior.
Coinfection is the simultaneous infection of a host by multiple pathogen species. In virology, coinfection includes the simultaneous infection of a single cell by two or more virus particles [25]
Comorbidities are medical conditions that coexist alongside a primary diagnosis and affect your health, including your treatment and outlook. Common comorbidities among hospitalized people include TB and HIV [25]
The National TB and Leprosy Control Program standard [1,25], World Health Organization (WHO) definitions and the 2021 modification of the WHO definitions and reporting framework for TB treatment outcomes used the following definitions:
Cured: A TB patient who started treatment with bacteriologically verified TB and finished the treatment as advised by a national policy with evidence of a bacteriological response but no signs of failure.
Treatment completed: A TB patient who followed the national policy suggested a course of therapy but whose results did not fulfill the criteria for cure or treatment failure.
Treatment failure: A TB patient whose treatment plan required being stopped or permanently switched to another treatment plan.
Died: A TB patient who passed away for whatever reason, either before beginning treatment or while receiving it.
Lost to follow-up: A TB patient who has not started therapy or whose regimen has been stopped for eight or more weeks in a row after starting treatment at least four weeks previously.
Not evaluated: A TB patient for whom no treatment result has been established. This applies to situations where the reporting unit is unsure of the treatment outcome and situations where the case has been transferred to another treatment facility.
New patients: Patients with TB who have never undergone TB therapy or who have just started receiving anti-TB drugs. New patients may have positive or negative bacteriology and may have disease in any area of the body.
Previously treated: A TB patient may have the disease at any anatomical site, positive or negative bacteriology, and have taken anti-TB medications for at least one month in the past.
The following two treatment outcomes are classified by World Health Organization standards [2]:
Successful treatment outcome: If TB patients finished therapy with symptom clearance or were cured (i.e., had a negative smear microscopy at the end of treatment and on at least one prior follow-up test).
Unsuccessful treatment outcome: If TB patients had treatment but had treatment failure (i.e., were still smear-positive after five months), lost to follow-up (i.e., patients who stopped taking their medication for two or more months consecutively after registering), or died.
2.6. Abbreviations
MDR-TB: Multidrug-Resistant TB
XDR-TB: Extensively Drug-Resistant Tuberculosis
RR-TB: Rifampicin-Resistant Tuberculosis
DR-TB: Drug-Resistant Tuberculosis
HIV: Human Immunodeficiency Virus
BMI: Body Mass Index
2.7. Discussion
We conducted a retrospective review of clinical data from the files of TB-infected patients aged 18 and older who had completed treatment and were co-infected with HIV. These patients had a body mass index (BMI) that indicated a moderate to severe classification. The baseline data was meticulously collected from patient files at four TB clinics and a referral hospital associated with these clinics in the rural areas of the Olivier Reginald Tambo District Municipality in the Eastern Cape, South Africa. We carefully analyzed patient demographics, clinical characteristics, and social history from the collected data. Additionally, we thoroughly examined culture conversion rates, treatment duration, and treatment outcomes based on the data from 360 patient files. The study revealed that while most individuals had a normal BMI, middle-aged patients (31-40 years old) were more likely to exhibit both overweight and underweight conditions. This age group could be important for targeted nutritional interventions [26,27]. Additionally, thinness in older adults (51-60) may require further attention to ensure healthy aging [28,29]. The study demonstrated a clear association between DR-TB types and HIV status, with HIV-positive individuals being more affected by DR-TB, especially the more common RR and MDR types [30]. The DR-TB patients demonstrated successful higher percentages of treatment outcomes in those patients co-infected with Hypertension and Type 2 Diabetes Mellitus, and the majority of those were cured or treatment completed, these findings are consistent with a study conducted in India [31]. DR-TB patients co-infected with mental illness and liver disease showed less favorable outcomes, with lower percentages of successful treatments. Furthermore, they were associated with higher rates of adverse outcomes, death, and loss of follow-up [32]. The DR-TB with Cancer and kidney disease (KD) also demonstrated significant challenges, with higher rates of non-successful treatment outcomes [33]. Therefore, the study demonstrated that overall trends demonstrated that the presence of co-morbidity with conditions generally leads to a more complex treatment landscape for DR-TB, with some conditions like mental illness and liver disease significantly affecting the likelihood of a successful outcome. This variability in outcomes was based on different comorbidity conditions suggesting that these health issues should be carefully managed alongside DR-TB treatment. The study analysis suggested that gender plays a role in DR-TB treatment outcomes, with females showing a marginally better cure rate compared to males. This difference could be influenced by a variety of factors, including biological, social, or treatment-related variables [34]. Evaluation of drug-resistant tuberculosis treatment the study clearly showed that patients with a normal BMI have the best cure rates. At the same time, those who are underweight or suffering from thinness are at a disadvantage in terms of treatment success [35,36]. Therefore, this highlights the importance of maintaining adequate nutritional status during DR-TB treatment, especially for patients with lower BMI, as malnutrition could adversely affect their recovery. The study noted a mix of successful and adverse outcomes, with a significant portion of HIV-positive males achieving a cure or completing treatment. However, the rates of loss to follow-up and death are notable, indicating areas where additional support and intervention might be needed as indicated. These findings are similarly shared by other studies elsewhere [37,38]. The study highlighted that normal BMI generally correlates with better treatment outcomes across all age groups. However, older patients showed a gradual increase in adverse outcomes. Further, the Underweight and Thinness categories in the study consistently showed poorer outcomes across all age groups, with the risk increasing with age [39,40]. The Overweight and Obese individuals show varied outcomes depending on age, with older individuals facing more challenges that are significant. This analysis highlighted the compounded effect of age and BMI on DR-TB treatment outcomes, particularly emphasizing the vulnerability of older, underweight individuals, this study is consistent with those of the findings from other studies [41,42]. Nutritional interventions and age-specific strategies may be crucial in improving treatment success. There was a Synergy of DR-TB Type, BMI Category, and HIV Status [35]. The study showed the distribution of different BMI categories across the DR-TB types (RR, MDR, Pre-XDR) and highlighted how these categories are split between HIV-positive and HIV-negative individuals. This phenomenon was demonstrated by studies elsewhere [35,44]. The key insight in the study is that Normal BMI dominates across all DR-TB types, particularly in HIV-positive individuals with RR-TB [45,46]. Thinness and Underweight were more prevalent among HIV-positive individuals, especially in the RR-TB type. In addition, the Overweight and Obese categories have a smaller representation but are present across different DR-TB types and HIV statuses. In our study, HIV-positive individuals tended to have a higher representation in most DR-TB types, especially within the normal and thin BMI categories [47]. HIV-negative individuals are fewer in number but still present across all DR-TB types and BMI categories [46]. The interaction between these factors is clear, showing that the distribution of individuals varies significantly based on both BMI and HIV status across different types of DR-TB. The heat map visualizes the Cramer’s V values for the association between each pair of variables (DR-TB type, BMI, and HIV status) all three pairs demonstrated a weak association, suggesting that these factors do not have a strong interrelationship [28].
2.8. Limitations
It is important to acknowledge that our study has some limitations. We only had access to clinical data from TB-infected patients collected from the files at four TB clinics and one referral hospital associated with these clinics in rural areas of the O.R. Tambo District Municipality. Consequently, not all clinics in the municipality were included in our study. Furthermore, significant variables, such as comorbidities, distance to health facilities, income level, and behavioral factors (including knowledge and attitudes about TB), as well as smoking and alcohol history, were not consistently recorded in the TB registers. Additionally, our study concentrated solely on TB outcomes and did not consider the outcomes of other diseases. However, the strength of this study lies in its demonstration of the challenges associated with treatment outcomes in TB management, particularly for patients co-infected with HIV and those with differing nutritional statuses, such as underweight versus overweight.
2.9. Recommendation and Further
This study emphasizes the importance of conducting similar research in various settings across the Eastern Cape, involving all age groups while ensuring adequate funding and time allocation. The current study focused on the Oliver Reginald Tambo Region, which faces significant challenges related to tuberculosis (TB), HIV, and nutritional status. Additionally, it is recommended that TB treatment strategies include nutritional interventions along with routine HIV screening and management, considering the synergistic relationship between these diseases.
2.10. Conclusion
The study revealed that most individuals maintain a normal Body Mass Index (BMI); however, middle-aged individuals between the ages of 31 and 40 show increased rates of both overweight and thinness. Both males and females typically fall within the normal BMI range, although males are more commonly represented. Treatment outcomes for Drug-Resistant Tuberculosis (DR-TB) are influenced by BMI categories, with Type 1 (Rifampicin-Resistant TB, or RR-TB) and Type 2 (Multidrug-Resistant TB, or MDR-TB) being the most prevalent forms. Gender also plays a role in treatment outcomes, as females demonstrate a slightly higher cure rate compared to males. A normal BMI is observed across all types of DR-TB, particularly among HIV-positive individuals with RR-TB. Therefore, incorporating nutritional therapies, managing HIV effectively, and developing strategies tailored to specific age groups could enhance TB treatment outcomes.
Author Contributions
Study conception and design: LMF; ND and RA; Acquisition of data, LMF; ND; Data analysis and interpretation, LMF; ND and RA; Writing-Original draft preparation, LMF; ND and RA; Writing-Review and Editing, LMF; ND and RA. All authors have read and agreed to the published version of the manuscript.
Funding
This research was funded by the South African Medical Research Council Pilot grant and The APC was funded by Walter Sisulu University.
Institutional Review Board Statement
The study was conducted by the Declaration of Helsinki and approved by the Biomedical Research Ethics Committee of the Faculty of Medicine and Health Sciences of Walter Sisulu University (ethical clearance No. 026/2019). The Department of Health approved the conduct of the research (Department of Health approval No EC_201904_011). Permission to conduct the study was sought and received from the different managers of the healthcare facilities. Every technique was used in compliance with the policies and procedures of the organization. Considering the study was based on pre-existing TB medical information and consent was waived, it was impossible to obtain verbal or written informed consent from participants. Personal identifiers like name or phone number were not taken out of their medical reports to protect the data's privacy.
Data Availability Statement
The datasets generated and analyzed during the current study are available from the corresponding author upon reasonable request.
Acknowledgments
The authors express their gratitude to the healthcare workers for providing access to the patient’s medical records. They also extend their thanks to their colleagues for their support during data collection.
Conflicts of Interest
The authors have declared no conflict of interest.
References
- World Health Organization (WHO) WHO; Geneva: 2022. Consolidated Guidelines on Tuberculosis, Module 4. Treatment – Drug-Susceptible Tuberculosis Treatment.
- World Health Organization (WHO) WHO; Geneva: 2013. Definitions and Reporting Framework for Tuberculosis–2013 Revision: Updated December 2014 and January 2020.
- Debash, H.; Nega, J.; Bisetegn, H.; Tesfaw, G.; Feleke, D.G.; Ebrahim, H.; Gedefie, A.; Tilahun, M.; Mohammed, O.; Alemayehu, E. , et al. Tuberculosis Treatment Outcomes and Its Predictors among Tuberculosis Patients Registered at Tefera Hailu Memorial General Hospital, Sekota Town, Northeast Ethiopia: A Seven-Year Retrospective Study. Can. J. Infect. Dis. Med. Microbiol. 2023, 4212312. [CrossRef]
- Kebede, M. A.; Haidar, J. Factors influencing adherence to the food by prescription program among adult HIV positive patients in Addis Ababa, Ethiopia: a facility-based, cross-sectional study. Infectious Diseases of Poverty, 2014, 3(1): 20. [CrossRef]
- Gevers, W. ASSAf Presidential Lecture 2003: 'Science' or 'Sciences': the difference one letter makes. S. Afr. J. Sci. 100, 235–236, 2005.
- Kant, S.; Gupta, H.; Ahluwalia, S. ‘Significance of nutrition in pulmonary tuberculosis’, Critical Reviews in Food Science and Nutrition. 2015, 55(7), 955–963. [CrossRef]
- Peter Cegielski, J.; Lenore Arab, Joan Cornoni-Huntley. Nutritional Risk Factors for Tuberculosis Among Adults in the United States, 1971–1992, American Journal of Epidemiology 2012, 176, 409–422. [CrossRef] [PubMed]
- Moore, S.E.; Collinson, A.C.; N'Gom, P.T.; et al. Early immunological development and mortality from infectious disease in later life. Proc. Nut. Soc. 2006, 65, 311–318. [Google Scholar] [CrossRef] [PubMed]
- Martin, S.J.; Sabina, E.P. ‘Malnutrition and associated disorders in tuberculosis and its therapy’, Journal of Dietary Supplements, 2019, 16(5), 602–610. [CrossRef]
- Bailin, S.S.; Gabriel, C.L.; Wanjalla, C.N.; Koethe, J.R. Obesity and Weight Gain in Persons with HIV. Curr HIV/AIDS Rep. 2020 Apr;17(2):138-150. [CrossRef]
- Dheda, K.; Perumal, T.; Moultrie, H.; Perumal, R.; Esmail, A.; Scott, A. J.; et al. The intersecting pandemics of tuberculosis and COVID-19: Population-level and patient-level impact, clinical presentation, and corrective interventions. Lancet Respir. Med, 2022, 10, 603–622. [CrossRef]
- Muller, M. An overview of the new rifampicin-resistant tuberculosis regimens available at decentralised drug-resistant tuberculosis sites for persons older than six years. S Afr Fam Pract. 2020;62(1), a5092. [CrossRef]
- Liebenberg, D.; Gordhan, B.G.; Kana, B.D. Drug-resistant tuberculosis: Implications for transmission, diagnosis, and disease management. Front Cell Infect Microbiol. 2022 Sep 23;12:943545. [CrossRef]
- Olivier, C.; Luies, L. WHO Goals and Beyond: Managing HIV/TB Co-infection in South Africa. SN Compr. Clin. Med. 5, 251, 2023. [CrossRef]
- Herbert, C.; Luies, L.; Loots, D.T.; Williams, A.A. The metabolic consequences of HIV/TB co-infection. BMC Infect Dis. 2023;23(1):536. [CrossRef]
- Wessels, J.; Nel, M.; Walsh, C.M. ‘A nutritional profile of patients with tuberculosis at Standerton Tuberculosis Specialised Hospital, Mpumalanga, South Africa’, Health SA Gesondheid,2021, 26(0), a1594. [CrossRef]
- Herrin, M.; Tate, J.P.; Akgun, K.M.; Butt, A.A. ; Crothers, Freiberg, M.S. et al. Weight Gain and Incident Diabetes Among HIV-Infected Veterans Initiating Antiretroviral Therapy Compared With Uninfected Individuals. J Acquir Immune Defic Syndr 2016, 73, 228–236. [Google Scholar] [CrossRef]
- Cáceres, G.; Calderon, R.; Ugarte-Gil, C. Tuberculosis, and comorbidities: treatment challenges in patients with comorbid diabetes mellitus and depression. Therapeutic Advances in Infectious Disease. 2022;9. [CrossRef]
- Kim, D. J.; et al. Multimorbidity patterns in HIV-infected patients: the role of obesity in chronic disease clustering. Journal of Acquired Immune Deficiency Syndromes 2012, 61, 600–605. [Google Scholar] [CrossRef] [PubMed]
- Jiang, J.; Qin, X.; Liu, H.; et al. An optimal BMI range associated with a lower risk of mortality among HIV-infected adults initiating antiretroviral therapy in Guangxi, China. Sci Rep 2019, 9, 7816. [Google Scholar] [CrossRef] [PubMed]
- Faye, L.M.; Hosu, M.C.; Iruedo, J.; Vasaikar, S.; Nokoyo, K.A.; Tsuro, U.; Apalata, T. Treatment Outcomes and Associated Factors among Tuberculosis Patients from Selected Rural Eastern Cape Hospitals: An Ambidirectional Study. Trop Med Infect Dis. 2023 Jun 9;8(6):315. [CrossRef]
- Lin, H.H.; Wu, C.Y.; Wang, C.H.; Fu, H. ; Lönnroth, K; Chang, Y.C.; Huang, Y.T. Association of Obesity, Diabetes, and Risk of Tuberculosis: Two Population-Based Cohorts. Clin Infect Dis. 2018 Feb 10;66(5):699-705. [CrossRef]
- Field, A. Discovering Statistics with IBM SPSS Newbury Park,2013, CA: Sage.
- Merriam-Webster. Merriam-Webster Medical Dictionary, 2016. Springfield, MO: Merriam Webster.
- Linh, N.N.; Viney, K.; Gegia, M.; et al. World Health Organization treatment outcome definitions for tuberculosis: 2021 update. Eur. Respir. J. 2021;58(2):1–7. [CrossRef]
- Carwile, M.E.; Hochberg, N.S.; Sinha, P. Undernutrition is feeding the tuberculosis pandemic: A perspective. J Clin Tuberc Other Mycobact Dis. 2022 Mar 17;27:100311. [CrossRef]
- Ko, Y.; Kim, C.; Park, Y.B.; Mo, E.K.; Moon, J.W. Changes in Nutritional Status in Pulmonary Tuberculosis: Longitudinal Changes in BMI According to Acid-Fast Bacilli Smear Positivity. J Clin Med. 2020 Dec 17;9(12):4082. PMCID: PMC7767003. [CrossRef] [PubMed]
- Limenh, L.W.; Kasahun, A.E.; Sendekie, A.K.; Seid, A.M.; Mitku, M.L.; Fenta, E.T.; Melese, M.; Workye, M.; Simegn, W.; Ayenew, W. Tuberculosis treatment outcomes and associated factors among tuberculosis patients treated at healthcare facilities of Motta Town, Northwest Ethiopia: a five-year retrospective study. Sci Rep. 2024 Apr 2;14(1):7695. [CrossRef]
- Khan, F.U.; Rehman, A.u.; Khan, F.U.; Hayat, K.; Khan, A.; Ahmad, N.; Chang, J.; Malik, U.R.; Fang, Y. Assessment of Factors Associated with Unfavorable Outcomes among Drug-Resistant TB Patients: A 6-Year Retrospective Study from Pakistan. Int. J. Environ. Res. Public Health 2022, 19, 1574. [Google Scholar] [CrossRef] [PubMed]
- Agyare, S.A.; Osei, F.A. , Odoom S.F. et al. Treatment outcomes and associated factors in tuberculosis patients at Atwima Nwabiagya district, Ashanti region, Ghana: A ten-year retrospective study. Tuberc. Res. Treat. 2021:1–9. [CrossRef]
- Kornfeld, H.; Sahukar, S.B.; Procter-Gray, E.; Kumar, N.P.; West, K.; Kane, K.; Natarajan, M.; Li, W.; Babu, S.; Viswanathan, V. Impact of Diabetes and Low Body Mass Index on Tuberculosis Treatment Outcomes. Clin Infect Dis. 2020 Dec 3;71(9):e392-e398. [CrossRef]
- Baluku, J.B.; Nakazibwe, B.; Naloka, J.; Nabwana, M.; Mwanja, S.; Mulwana, R.; Sempiira, M.; Nassozi, S.; Babirye, F.; Namugenyi, C.; Ntambi, S.; Namiiro, S.; Bongomin, F.; Katuramu, R.; Andia-Biraro, I.; Worodria, W. Treatment outcomes of drug-resistant tuberculosis patients with multiple poor prognostic indicators in Uganda: A countrywide 5-year retrospective study. J Clin Tuberc Other Mycobact Dis. 2021 Jan 27;23:100221. [CrossRef]
- Xiao, J.; Ge, J.; Zhang, D.; Lin, X.; Wang, X.; Peng, L.; Chen, L. Clinical Characteristics and Outcomes in Chronic Kidney Disease Patients with Tuberculosis in China: A Retrospective Cohort Study. Int J Gen Med. 2022 Aug 19;15:6661-6669. [CrossRef]
- Oliveira, O.; Gaio, R.; Correia-Neves, M.; Rito, T.; Duarte, R. Evaluation of drug-resistant tuberculosis treatment outcome in Portugal, 2000–2016. PLoS One. 2021 16(4): e0250028. [CrossRef]
- Sahile, Z.; Tezera, R.; Haile Mariam, D.; et al. Nutritional status and TB treatment outcomes in Addis Ababa, Ethiopia: An ambi-directional cohort study. PloS One. 2021;16(3):1–14. [CrossRef]
- Musuenge, B.B.; Poda, G.G.; Chen, P.C. Nutritional status of patients with tuberculosis and associated factors in the Burkina Faso health center region. Nutrients. 2020;12(9):1–13. [CrossRef]
- Sinha, P.; Ponnuraja, C.; Gupte, N.; Prakash Babu, S.; Cox, S.R.; Sarkar, S.; Mave, V.; Paradkar, M.; Cintron, C.; Govindarajan, S.; Kinikar, A.; Priya, N.; Gaikwad, S.; Thangakunam, B.; Devarajan, A.; Dhanasekaran, M.; Tornheim, J.A.; Gupta, A.; Salgame, P.; Christopher, D.J.; Kornfeld, H.; Viswanathan, V.; Ellner, J.J.; Horsburgh, C.R.; Gupte, A.N.; Padmapriyadarsini, C.; Hochberg, N.S. Impact of Undernutrition on Tuberculosis Treatment Outcomes in India: A Multicenter, Prospective, Cohort Analysis. Clin Infect Dis. 2023 Apr 17;76(8):1483-1491. [CrossRef]
- Aboubacar Sidiki Magassouba, et al. Malnutrition prevalence and associated biochemical factors among drug-resistance tuberculosis (DR-TB) patients at key treatment sites in Conakry City, Republic of Guinea. Pan African Medical Journal. 2021; 38(279). [CrossRef]
- Cho, S.H.; Lee, H.; Kwon, H.; et al. Association of underweight status with the risk of tuberculosis: a nationwide population-based cohort study. Sci Rep 12, 16207, 2022. [CrossRef]
- Anil, S. Korabu, Jang Bahadur Prasad. Factors determining successful treatment outcome among notified tuberculosis patients in Belagavi district of North Karnataka, India, Clinical Epidemiology and Global Health, Volume 25, 2024,101505, ISSN 2213-3984. [CrossRef]
- Min, J.; Kim, J.S.; Kim, H.W.; Ko, Y.; Oh, J.Y.; Jeong, Y.J.; Lee, E.H.; Yang, B.; Lee, K.M.; Ahn, J.H.; Kim, J.W.; Hwang, Y.I.; Lee, S.S.; Park, J.S.; Koo, H.K. Effects of underweight and overweight on mortality in patients with pulmonary tuberculosis. Front Public Health. 2023 Sep 19;11:1236099. [CrossRef]
- Kassim, S.A.; Cote, A.; Kassim, S.M.; et al. Factors influencing treatment outcomes of tuberculosis patients attending health facilities in Galkayo Puntland, Somalia. J. Public Health. 2021;43(4):887–895. [CrossRef]
- Sahile, Z.; Tezera, R.; Haile Mariam, D.; Collins, J.; Ali, J.H. Nutritional status and TB treatment outcomes in Addis Ababa, Ethiopia: An ambi-directional cohort study. PLoS One. 2021 Mar 2;16(3):e0247945. [CrossRef]
- Franke, M.A.; Emmrich, J.V.; Ranjaharinony, F.; Ravololohanitra, O.G.; Andriamasy, H.E.; Knauss, S.; Muller, N. A cross-sectional analysis of the effectiveness of a nutritional support programme for people with tuberculosis in Southern Madagascar using secondary data from a non-governmental organisation. Infect Dis Poverty. 2024 Feb 2;13(1):13. [CrossRef]
- Song, W.M.; Guo, J.; Xu, T.T.; Li, S.J.; Liu, J.Y.; Tao, N.N.; Liu, Y.; Zhang, Q.Y.; Liu, S.Q.; An, Q.Q.; Li, Y.F.; Yu, C.B.; Dong, J.H.; Li, H.C. Association between body mass index and newly diagnosed drug-resistant pulmonary tuberculosis in Shandong, China from 2004 to 2019. BMC Pulm Med. 2021 Dec 6;21(1):399. [CrossRef]
- Naidoo, K.; Yende-Zuma, N.; Augustine, S. A retrospective cohort study of body mass index and survival in HIV infected patients with and without TB co-infection. Infect Dis Poverty 7, 35, 2018. [CrossRef]
- Hamada, Y.; Getahun, H.; Tadesse, B.T.; Ford, N. HIV-associated tuberculosis. Int J STD AIDS. 2021 Aug;32(9):780-790. [CrossRef]
Disclaimer/Publisher’s Note: The statements, opinions and data contained in all publications are solely those of the individual author(s) and contributor(s) and not of MDPI and/or the editor(s). MDPI and/or the editor(s) disclaim responsibility for any injury to people or property resulting from any ideas, methods, instructions or products referred to in the content. |
© 2024 by the authors. Licensee MDPI, Basel, Switzerland. This article is an open access article distributed under the terms and conditions of the Creative Commons Attribution (CC BY) license (http://creativecommons.org/licenses/by/4.0/).
Copyright: This open access article is published under a Creative Commons CC BY 4.0 license, which permit the free download, distribution, and reuse, provided that the author and preprint are cited in any reuse.


