0. Introduction
Since the 18th Party Congress, emphasis has been placed on improving the quality and efficiency of economic development, and it has been clearly stated that China's economy has shifted from a stage of rapid growth to a stage of high-quality development. The report of the 20th CPC National Congress emphasized that the layout, structure, functions and system integration of infrastructure should be optimized, and a modern infrastructure system should be constructed. Highway is an important embodiment of the infrastructure system, as a basic, pioneering and strategic industry of the national economy and an important service facility, ensuring the smooth and safe operation of highways is of great significance in promoting the healthy development of the national transportation industry.
2024 Highway completed 192 kilometers, reached 8613 kilometers, ten years, highway construction adhere to the national strategy, the implementation of a number of landmark major projects. Located in Hunan Province, the highway connecting Yuelu District of Changsha City and Yongding District of Zhangjiajie City, referred to as "Changzhang Expressway", is one of the liaison routes of China's national expressway network Erlianhot-Guangzhou Expressway (National Expressway G55), with a total route length of 309.762 km (including municipalized sections). section).Between 4:26 p.m. and 4:39 p.m. on February 8, 2013, four consecutive road traffic accidents of chain collision occurred successively in the section of Shanzhuanwan Bridge in Dingcheng District, Changde City of Changde City on the Changzhang Expressway, resulting in a total of 16 deaths, 46 injuries, and a direct economic loss of about more than 9 million yuan.On March 22, 2019, a spontaneous combustion accident occurred in a bus at the service area of the Prince Temple in the Hanshou section of the Changde section of the Changzhang Expressway , the accident caused 26 deaths and 28 injuries (including 5 serious injuries).2024 In the early morning of December 25, an ambulance collided with a van and overturned at the Yiyang section of the Changzhang Expressway in Hunan Province, resulting in the inadvertent death of a person. Behind a series of shocking accidents, it has caused the society to pay attention to the safety of highway system, and under the current research, it is still necessary to further study its toughness influencing factors and analyze its enhancement path with innovative methods in the stage of highway system operation and maintenance safety.
Toughness was first used by ecologist Holling to describe the ecosystem suffered a perturbation after the rapid recovery of the original state and to maintain its structure and function of the characteristics, and then with the use of toughness theory in the transportation system, engineering systems, and so on, which produces resilience science (Resilience Science). In order to enhance the highway operation and maintenance operation and maintenance toughness site of the anti-interference ability, increase the operation and maintenance site redundancy, and then improve the urban transportation project operation and maintenance toughness, highway system operation and maintenance safety toughness for the object of study, the safety toughness theory introduced into the highway system of safety management and combined with the characteristics of the highway system, the study of highway system operation and maintenance stage toughness impact factors and the importance of the degree of assessment, so as to put forward the The improvement path of highway system operation and maintenance stage safety.
Combing through the domestic and international literature, scholars at home and abroad have already launched research on the toughness of highway systems. Jie Li0 et al. proposed a road network resilience evaluation method based on the combined empowerment-cloud model in order to formulate a strategy to enhance the traffic resilience of highway networks, and comprehensively evaluated the road network topology indicators and traffic operation state indicators; Pengcheng Xu[
2] et al. focused on the congestion characteristics of highway networks, established a congestion resilience evaluation method based on the seepage theory of the highway network, and verified the analysis by taking the example of highway network in a province Lin Peiqun[
3] et al. in order to quantify the impact of traffic closure on the connectivity of highway network, based on the P-space mapping method, incorporating the passenger and freight traffic flow to establish a weighted network of highways, and combined with the multivariate characteristic gravitational model to design the centrality index of the weighted network; Wu Xiumei[
4] et al. in response to the problem of safety hazards of the highway bridge project construction caused by the insufficient safety management in the process of traffic construction, based on the traditional entropy weight-approximation ideal solution sorting method, using statistical detection method to screen and secondary collection of outliers, while choosing entropy weight method to optimize weight assignment, constructing bridge engineering safety toughness evaluation model based on entropy weight-improved TOPSIS method to realize quantitative evaluation of bridge engineering safety toughness.
In the field of infrastructure research, past academic discussions have mainly centered on the resilience evaluation system in the construction phase of highway projects. Researchers at usually construct evaluation models with the help of entropy weight method, cloud model and other technical means , Yuan Dongliang[
5] et al. put forward a maturity evaluation model of intelligent construction application based on combined empowerment-cloud model for the requirements of the new era and the new infrastructure on intelligent construction and combined with the theory of capability maturity; Gao Yuqin[
6] et al. constructed an evaluation index system of urban flood resilience containing 4 first-level indexes and 20 second-level indexes in 4 aspects, based on the response process of the urban system in response to the flooding events, and on this basis, the evaluation index system of urban flood resilience is constructed through a topological hierarchical system. Gao Yuqin et al. based on the response process of urban system to flood events, constructed an evaluation index system of urban flood resilience containing 4 first-level indicators and 20 second-level indicators from 4 aspects, based on which, subjective and objective assignments were made to the indicators through topological hierarchical analysis and entropy weighting, and put forward the urban flood resilience evaluation method based on the combination of assignment and cloud model. Chen Li[
7] et al. proposed the evaluation of entropy weighting in combination with the cloud model based on the relevant research on the green smart city at home and abroad. Liu Dan[
8] et al. adopted the entropy weighting method for the prevention of accident risk in fine chemical parks. Ltd.[
9] et al. for the prevention of accident risk in fine chemical parks adopt entropy weight method to determine the weight of evaluation indexes and use cloud model to evaluate the vulnerability level of fine chemical parks, and finally take three typical fine chemical parks as an example to carry out case analysis to verify the reasonableness and validity of the method. Chen Hongbing et al. proposed an evaluation model of the effect of urban rail transit cross-line operation based on AHP-entropy right-can be topological cloud model in order to evaluate the effect of urban rail transit cross-line operation in an objective and comprehensive way. These results provide a good basis for decision-making in related fields. These results provide valuable references for decision-making in related fields and have certain practical guidance significance. However, when facing a large-scale complex network such as rail transit, it is extremely difficult to realize a completely accurate inference with the increasing scale of extremely large groups in the network structure.
In dealing with uncertainty and subjectivity, WFA (Word Frequency Analysis) can quickly extract information in a flexible way[
10] . However, the determination of weights needs to rely on specific experience or complex data preprocessing.CRITIC (Conflict Indicator-based Objective Weighting Method) has a strong objectivity in determining the weights by analyzing the variability of the data and the conflict between indicators[
11] . However, the calculation process of this method becomes cumbersome when facing data with high dimensions and complex correlations. IAHP (Interval Hierarchical Analysis) can effectively take into account the uncertainty in decision-making when constructing complex decision-making systems, providing a more systematic framework for multi-objective decision-making, which is both flexible and practical, but its calculation process is more cumbersome and relies heavily on the subjective judgment of experts[
12] . DBO (Improved Dung Beetle Algorithm) shows strong ability in large-scale data feature extraction, which can effectively explore the potential features in the data and improve the accuracy of the analysis, but the training process requires high computational resources[
13] , and when dealing with some data with extremely complex nonlinear relationships, it may be necessary to optimize the structure of the network. ELM (Extreme Learning Machine) has the features of fast learning speed and strong generalization ability, and is useful in fast processing and prediction. characteristics, it has obvious advantages in fast processing and prediction[
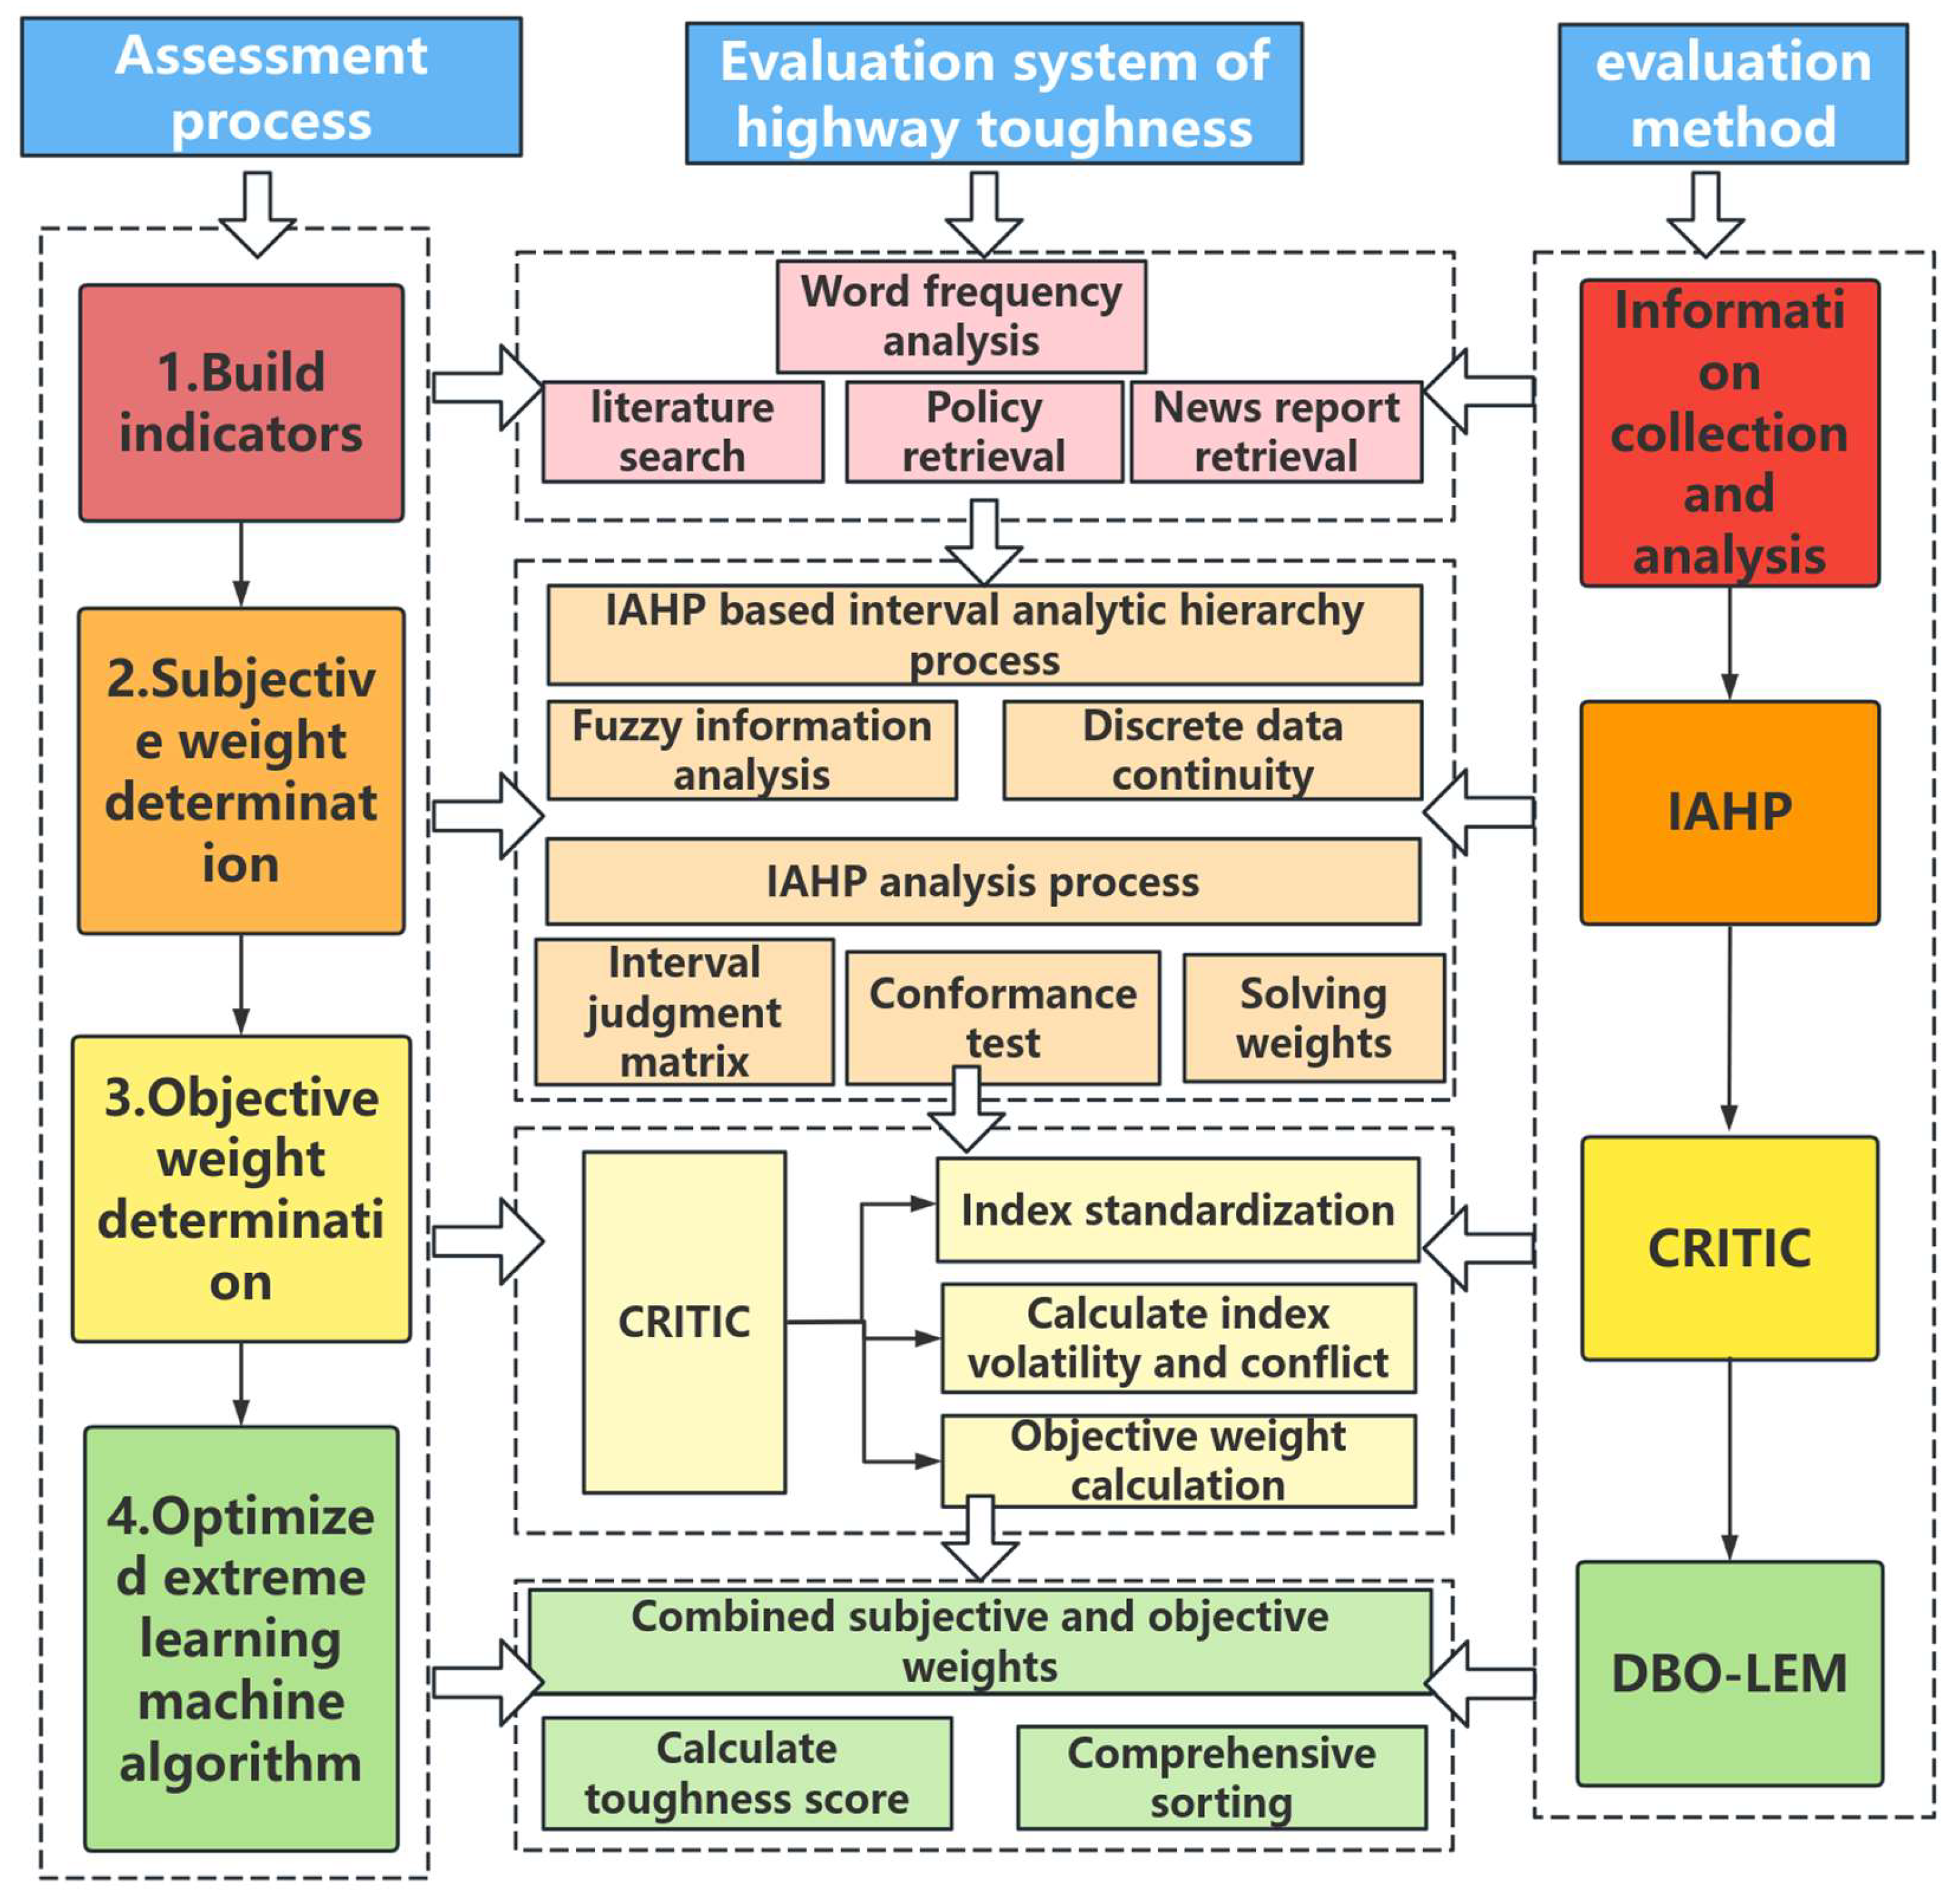
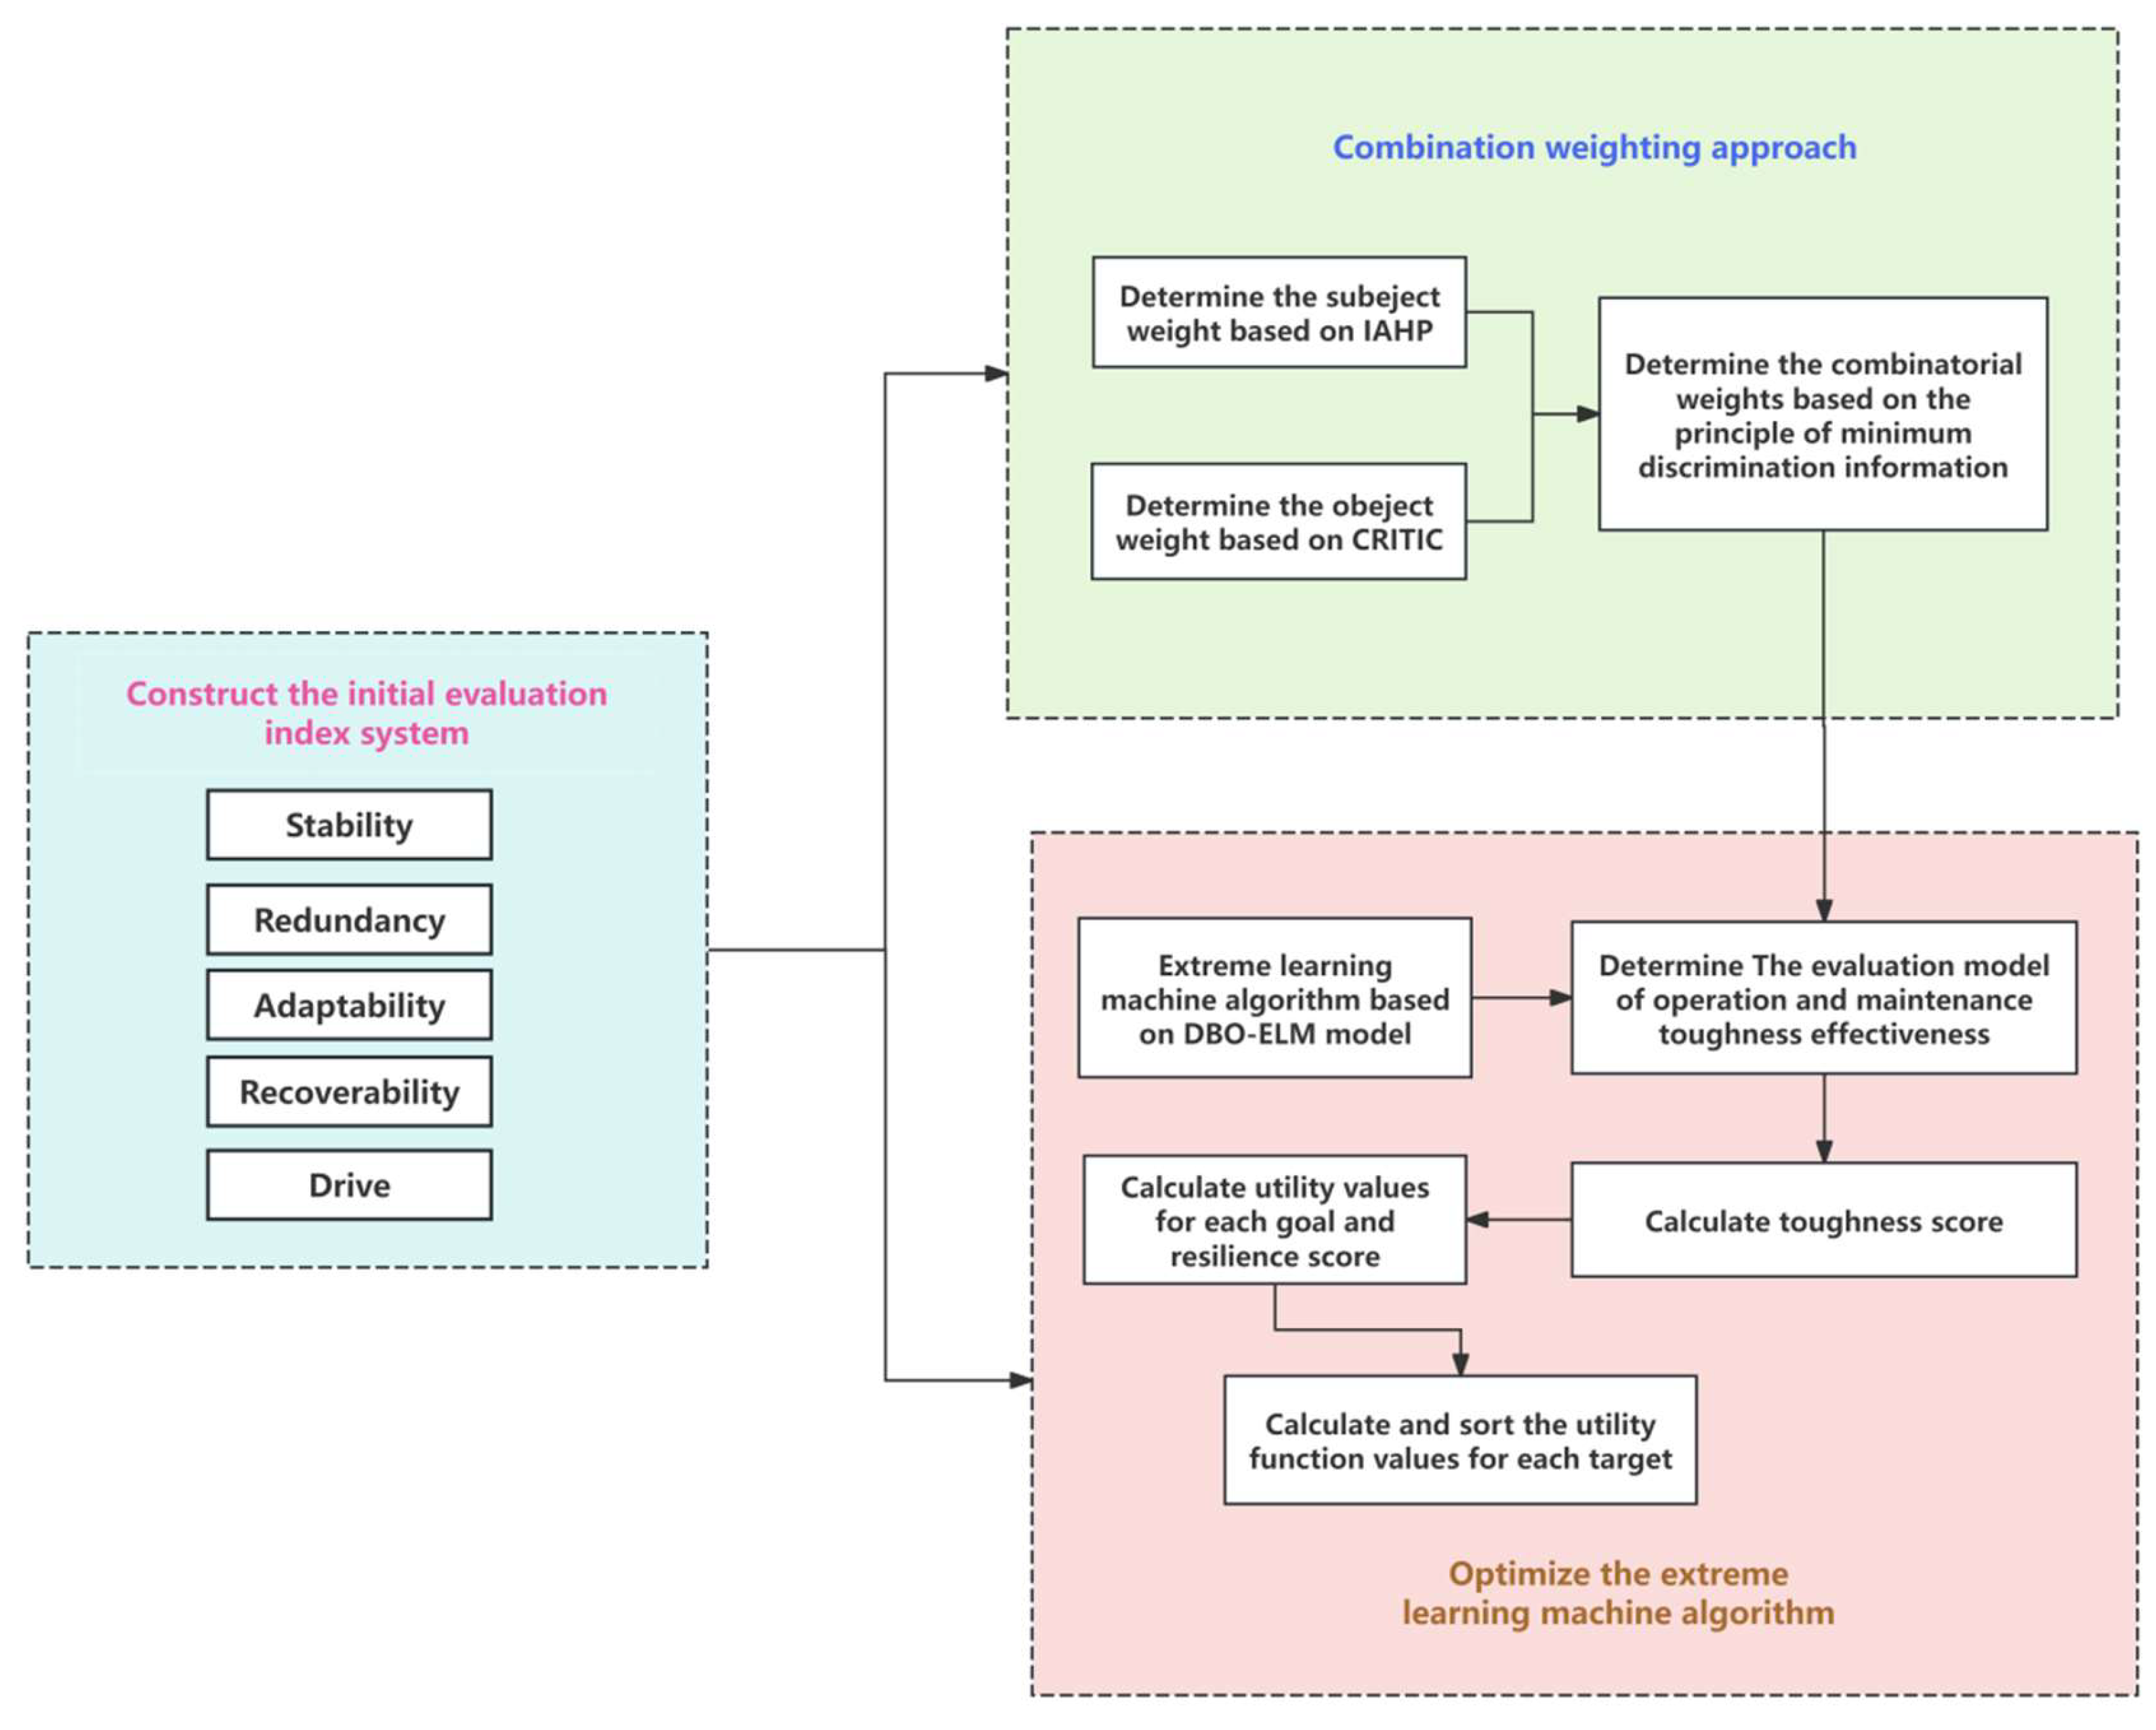
14] . In view of the advantages and disadvantages of the above methods, this paper tries to combine five methods, namely, WFA, CRITIC, IAHP, DBO and ELM, to construct a WFA - CRITIC - IAHP - DBO - ELM model, which is used for the assessment of operation and maintenance and safety resilience of highway systems. In this model, WFA, CRITIC, IAHP, DBO and ELM each play their own advantages, among which, WFA can flexibly extract the fuzzy information in highway operation and maintenance data, which lays the foundation for the subsequent analysis, CRITIC objectively determines the weights of each index to reduce the interference of subjective factors, and IAHP provides a systematic decision-making framework, which is helpful for the comprehensive consideration of various factors. DBO plays a key role in feature selection and extraction of massive highway operation and maintenance data, especially when dealing with a large amount of data such as traffic flow, facility status, etc. ELM can efficiently predict and evaluate the safety and resilience of highway systems by virtue of its fast learning and good generalization ability. ELM is able to meet the needs of highway system operation and maintenance sites for high accuracy and efficiency in complex decision-making environments, and outputs more comprehensive and accurate analysis results by comprehensively considering multiple evaluation indicators and factors, such as road conditions, traffic flow, aging degree of facilities, and safety management measures. Similar to the urban rail transit system, the operation and maintenance of highway systems and safety resilience to ensure smooth traffic and promote economic development is also of great importance. However, the current research on highway system operation and maintenance and safety toughness measurement and assessment is relatively lagging behind and needs to be improved. Based on this research background, this paper analyzes the potential risk factors in the operation and maintenance stage of highway systems, and proposes to adopt this new WFA - CRITIC - IAHP - DBO - ELM model to measure and assess the operation and maintenance and safety resilience of highway systems, aiming to provide more scientific and effective decision support for highway operation and maintenance management.
By combining these methods, a comprehensive assessment of the highway system can be conducted from multiple dimensions. This innovative approach can not only effectively overcome the lack of adaptability of traditional methods, such as the entropy weight method, when dealing with large amounts of data, as well as the shortcomings of the cloud model in terms of complexity of the reasoning procedure and model maturity, but also build a more comprehensive, concise and adaptable analytical framework. Through this framework, it is expected to significantly improve the comprehensiveness and accuracy of the evaluation of highway system operation and maintenance and safety resilience, further promote the highway system operation and maintenance work to scientific progress, and ensure the efficient and stable operation of the entire highway operation and maintenance engineering system.
Figure 1.
Research Technology Route.
Figure 1.
Research Technology Route.
3. A DMO-ELM-Based Highway Operations and Maintenance Resilience Assessment Model
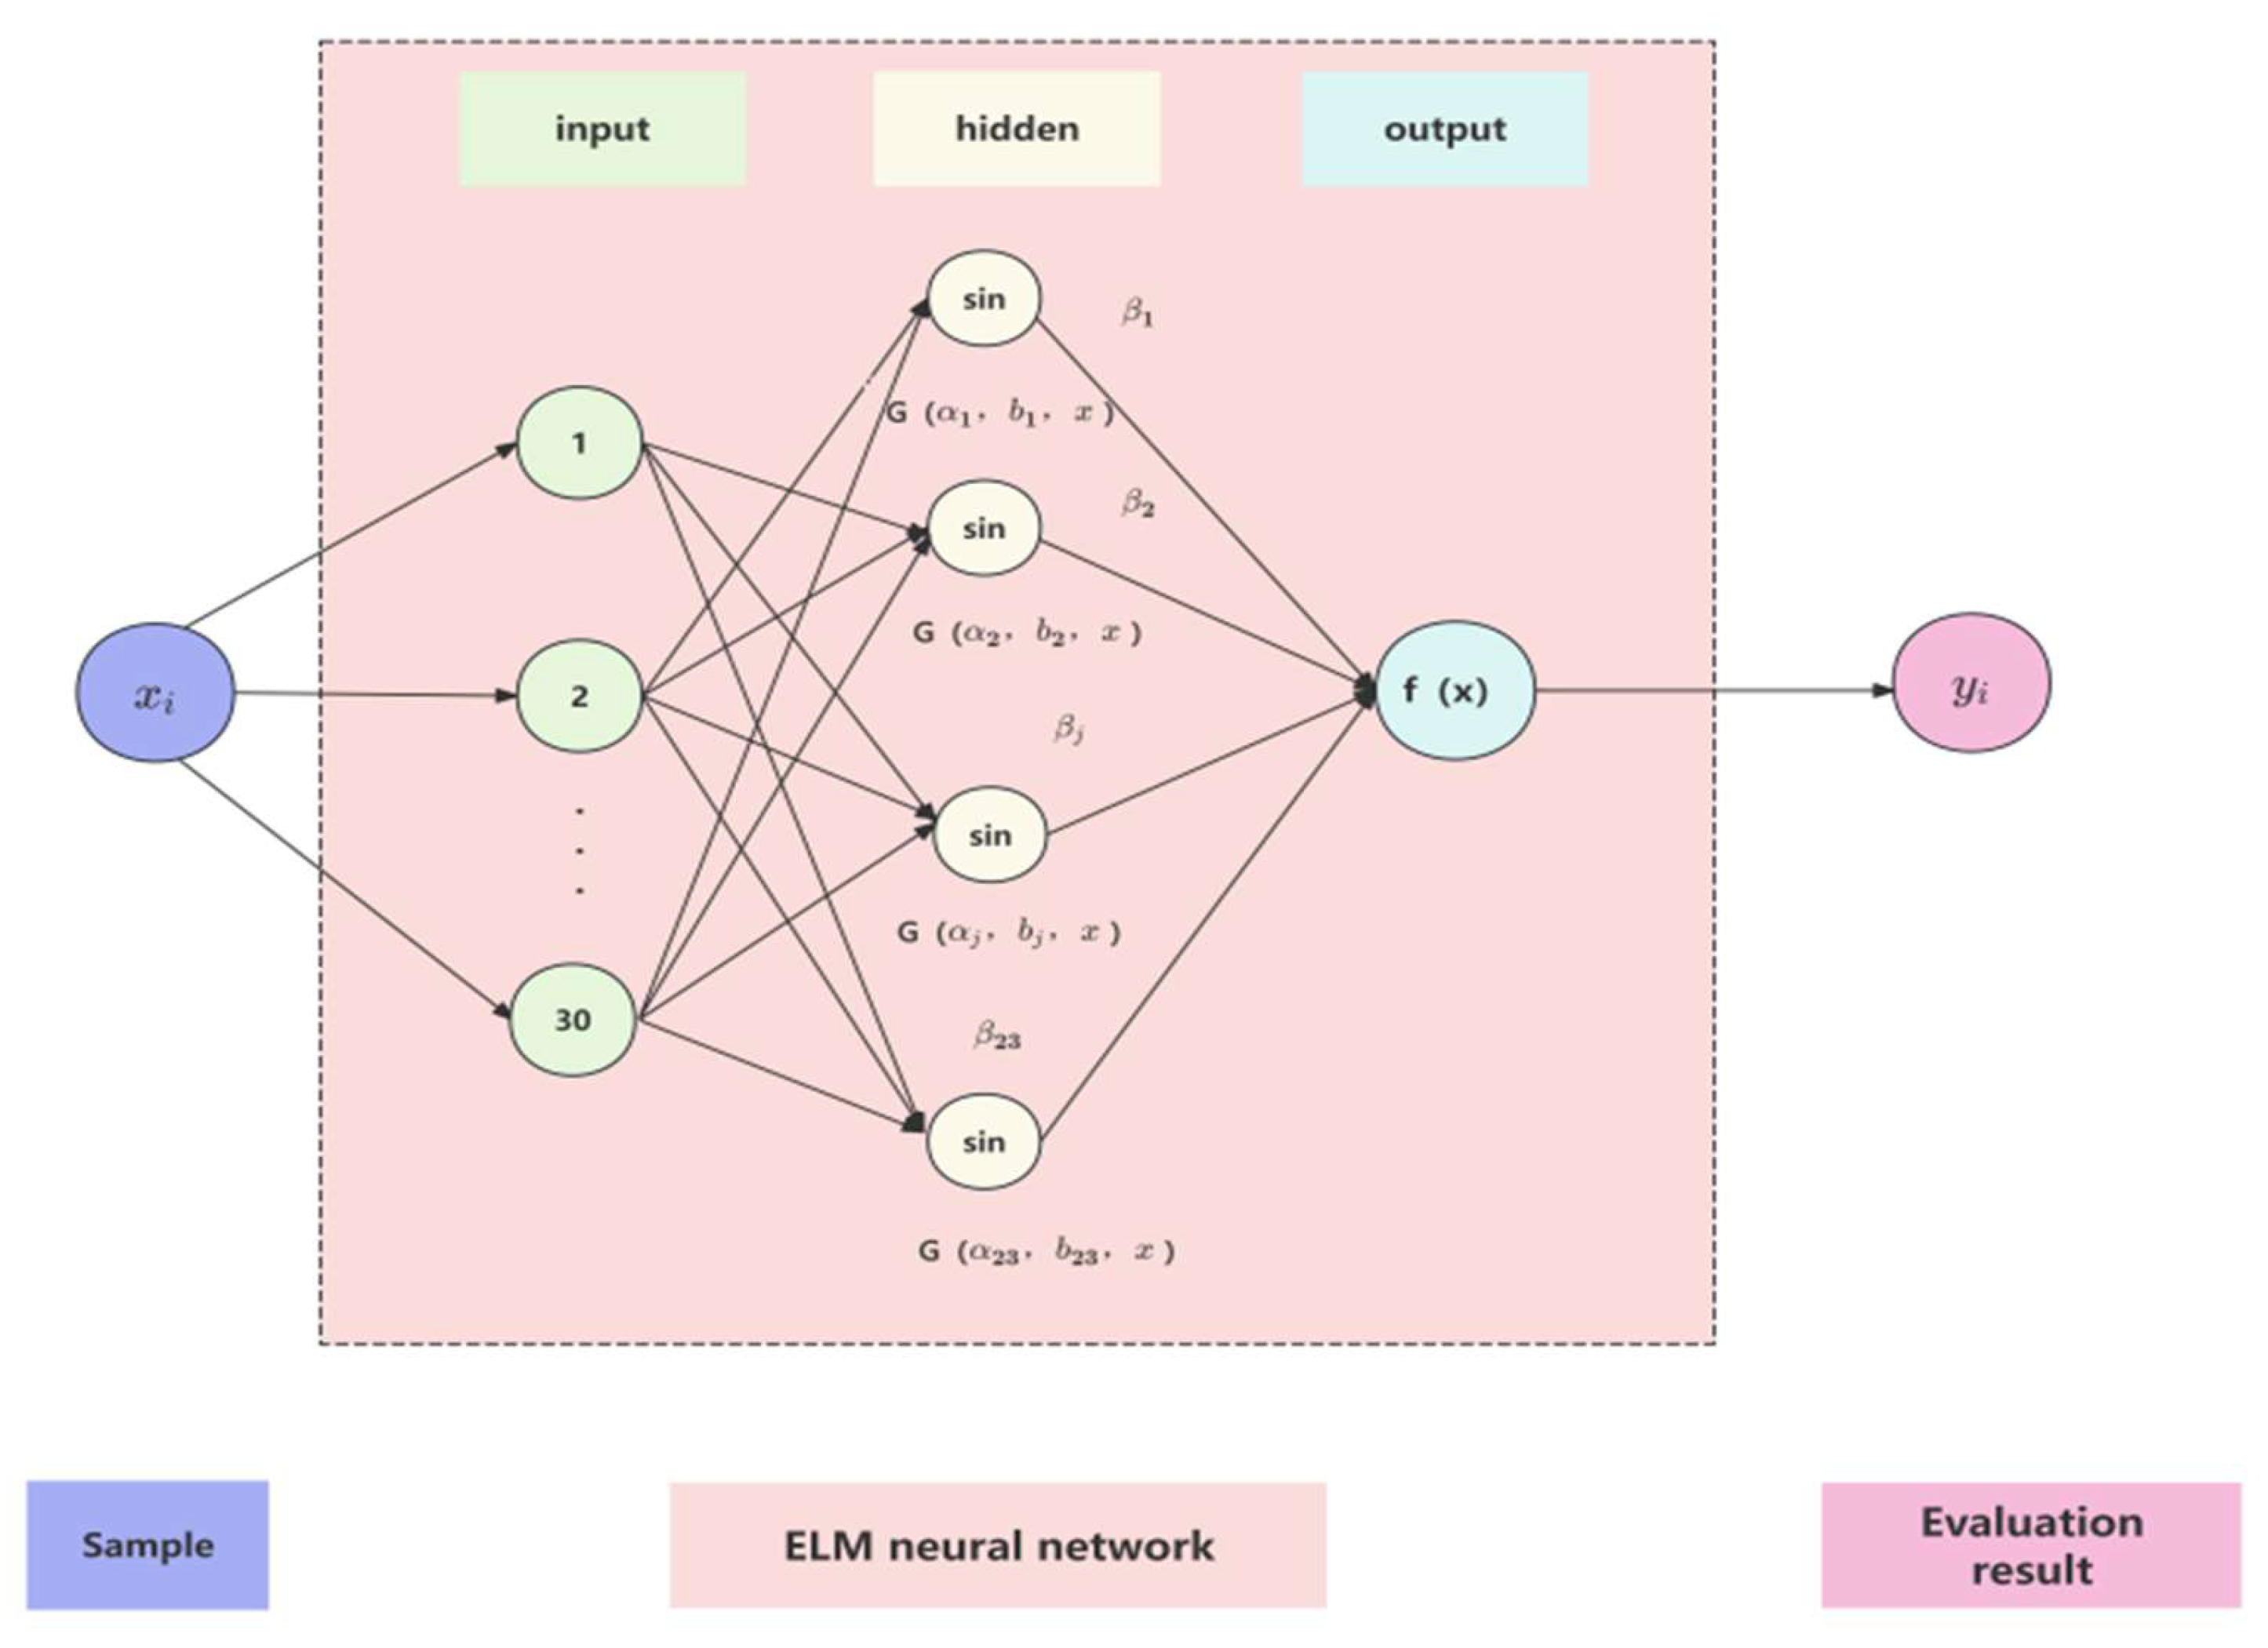
Assessment Model Based on DBO Optimized Extreme Learning Machine A highway operation and maintenance toughness assessment model based on extreme learning machine (ELM) is proposed in response to the problems of low computational efficiency and poor applicability of traditional assessment methods, as well as the multiple indicators, multiple factors, and the subjective and nonlinear characteristics of the assessment results of high-speed toughness assessment. ELM eliminates the need for iterative computation, significantly reduces computational complexity and improves the speed of computation [
24] . The assessment model is shown in equation (15).
Where
is the model function;
is the response of the hidden layer with respect to x;
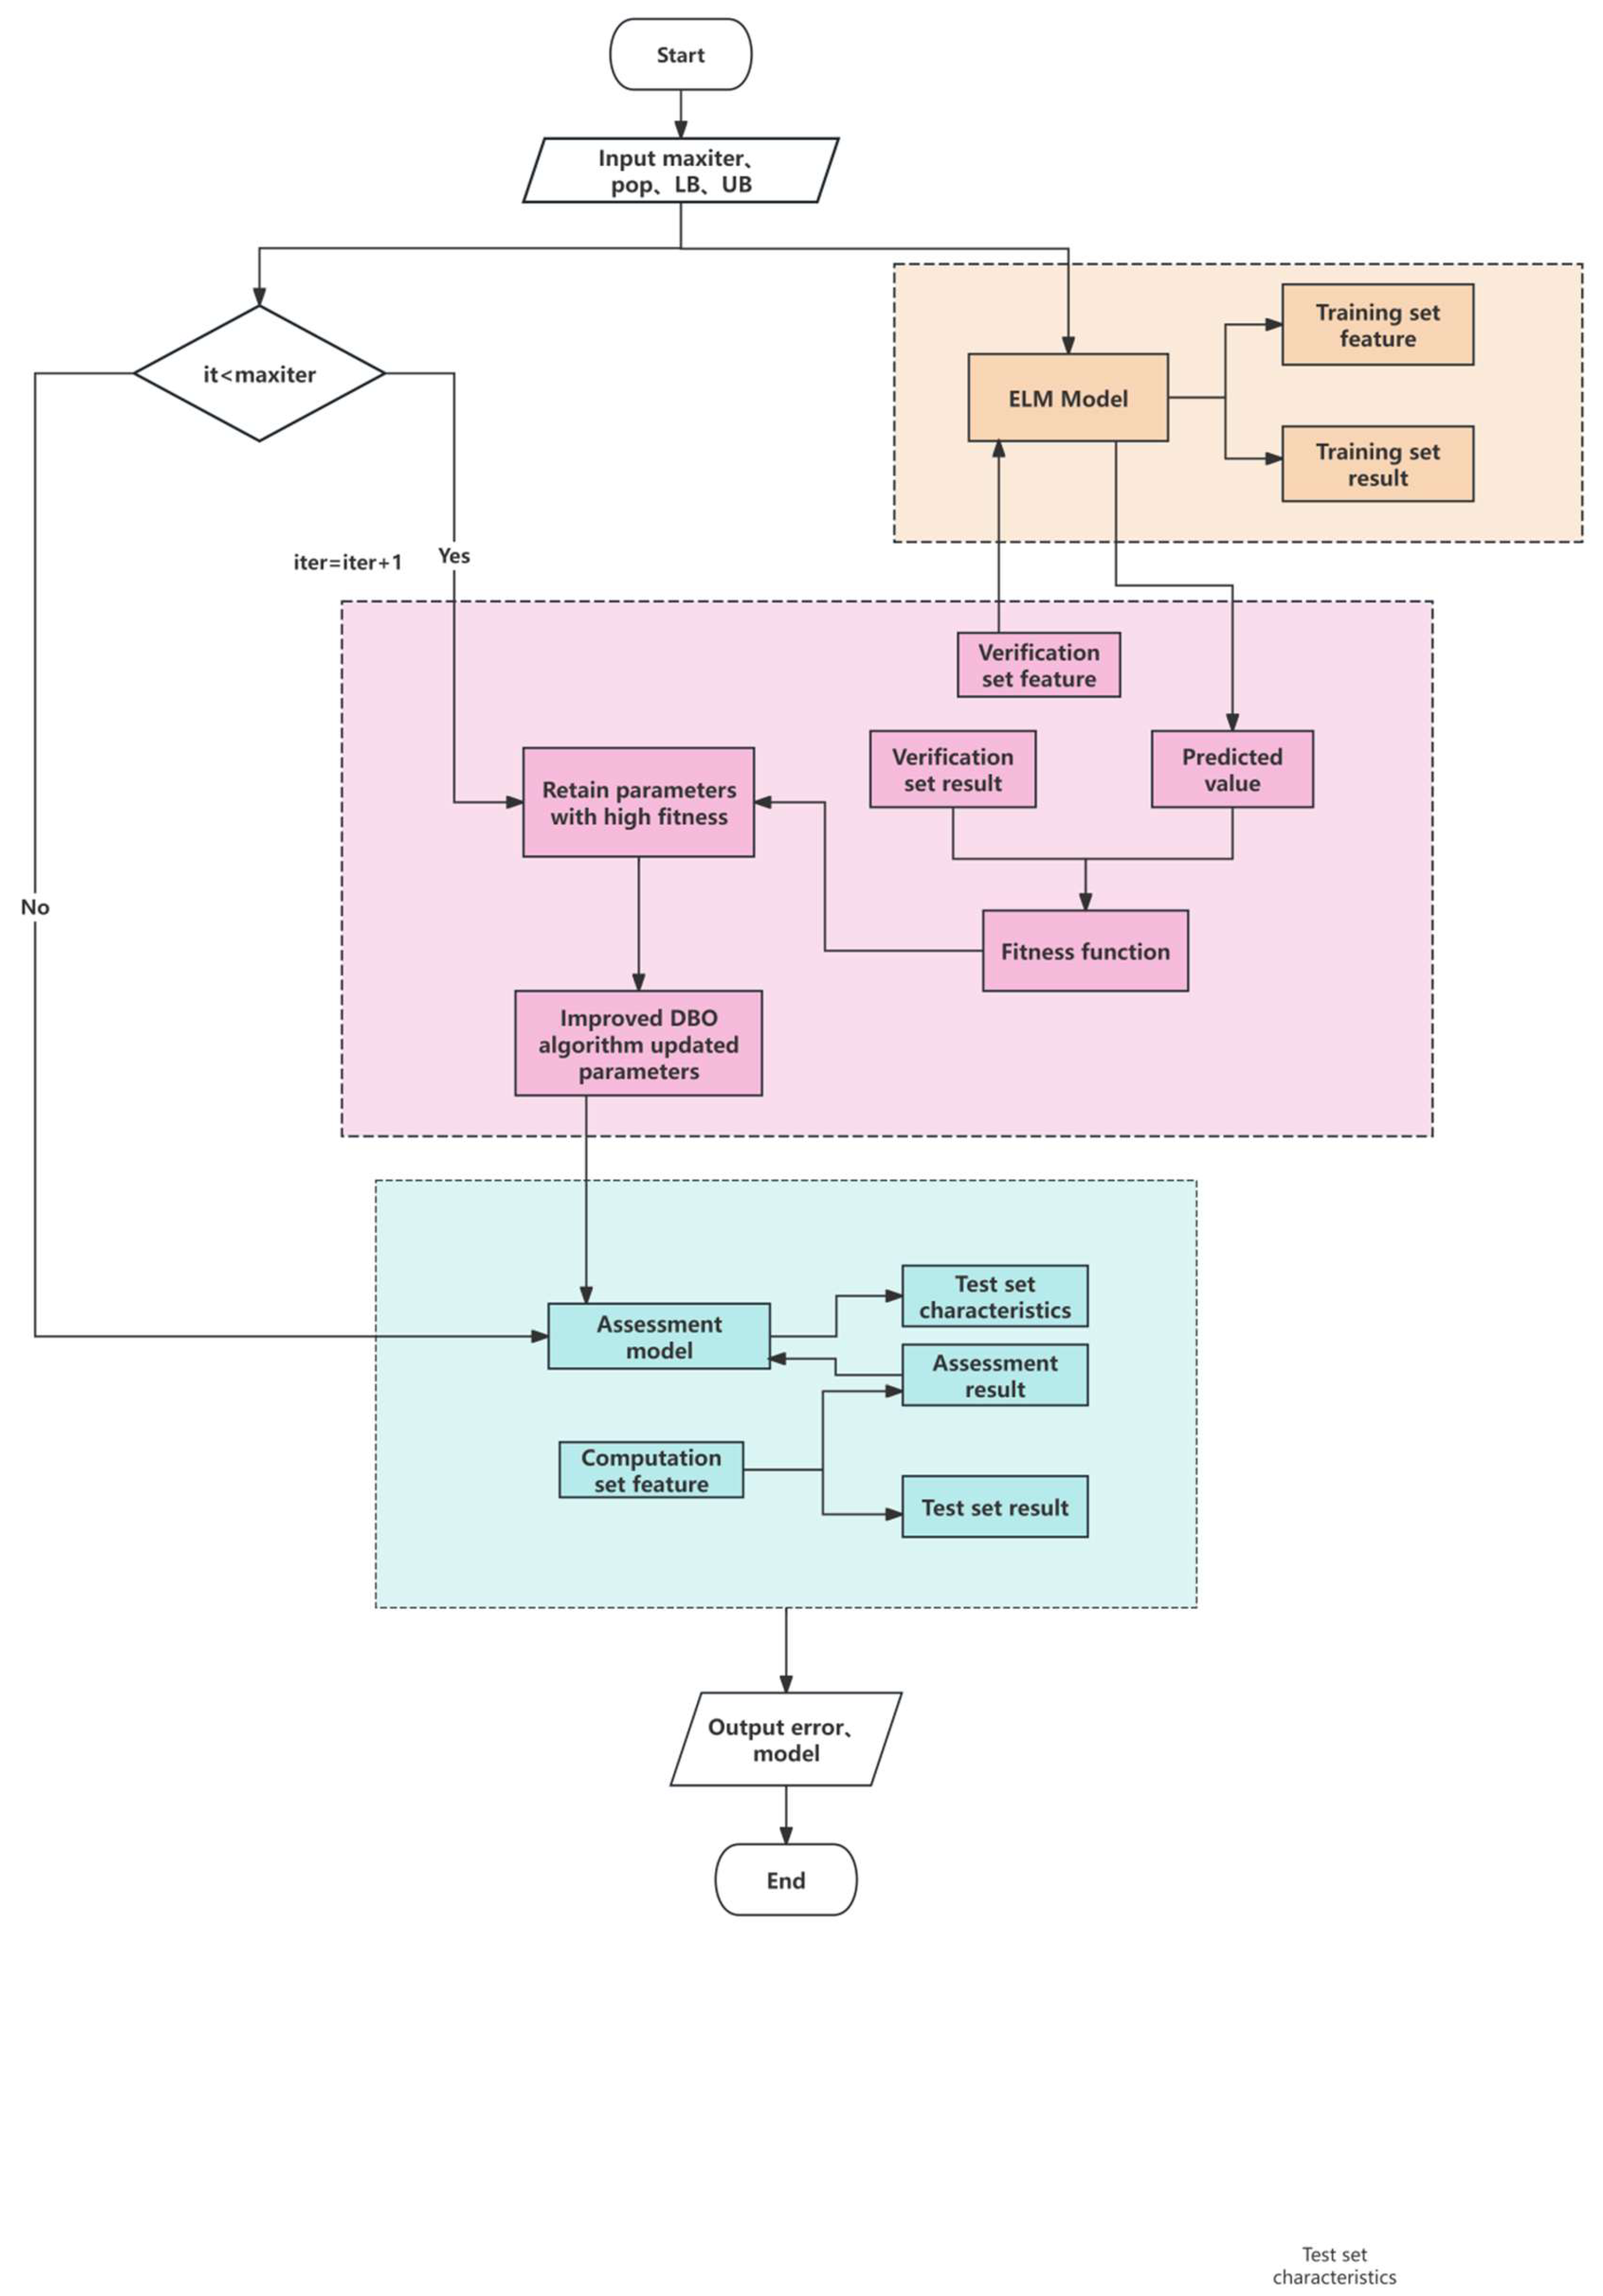
is the hidden layer function; and β^ is the minimal-paradigm least-squares solution of the loss function. The selection of the parameters of the ELM model has a great influence on the accuracy of the performance evaluation, and based on the Dung Beetle Optimization Algorithm (DBO), we optimize the hidden-layer activation function, the number of neurons in the hidden layer, and regularization coefficients of the ELM by simulating the behaviors of dung beetles (e.g., dung-ball rolling, reproducing, foraging, and stealing). The optimization of the hidden layer activation function, number of hidden layer neurons and regularization coefficients of ELM. In order to improve the convergence accuracy of the algorithm and avoid the local optimum problem, piecewise chaos mapping is used for population initialization to control the distribution of individuals; meanwhile, a variable spiral search strategy is introduced to improve the breeding and foraging process to enhance the global search ability; and the theft behavior is optimized by levy flight random wandering to increase the perturbation of the solution and enrich the diversity of the population. Using the improved DBO algorithm to optimize the extreme learning machine highway operation and maintenance toughness effectiveness assessment model, to construct the highway operation and maintenance toughness safety, applicability, durability, protection, green economy, and the effectiveness of the rapid assessment model, ELM model algorithm flow is shown in
Figure 3.
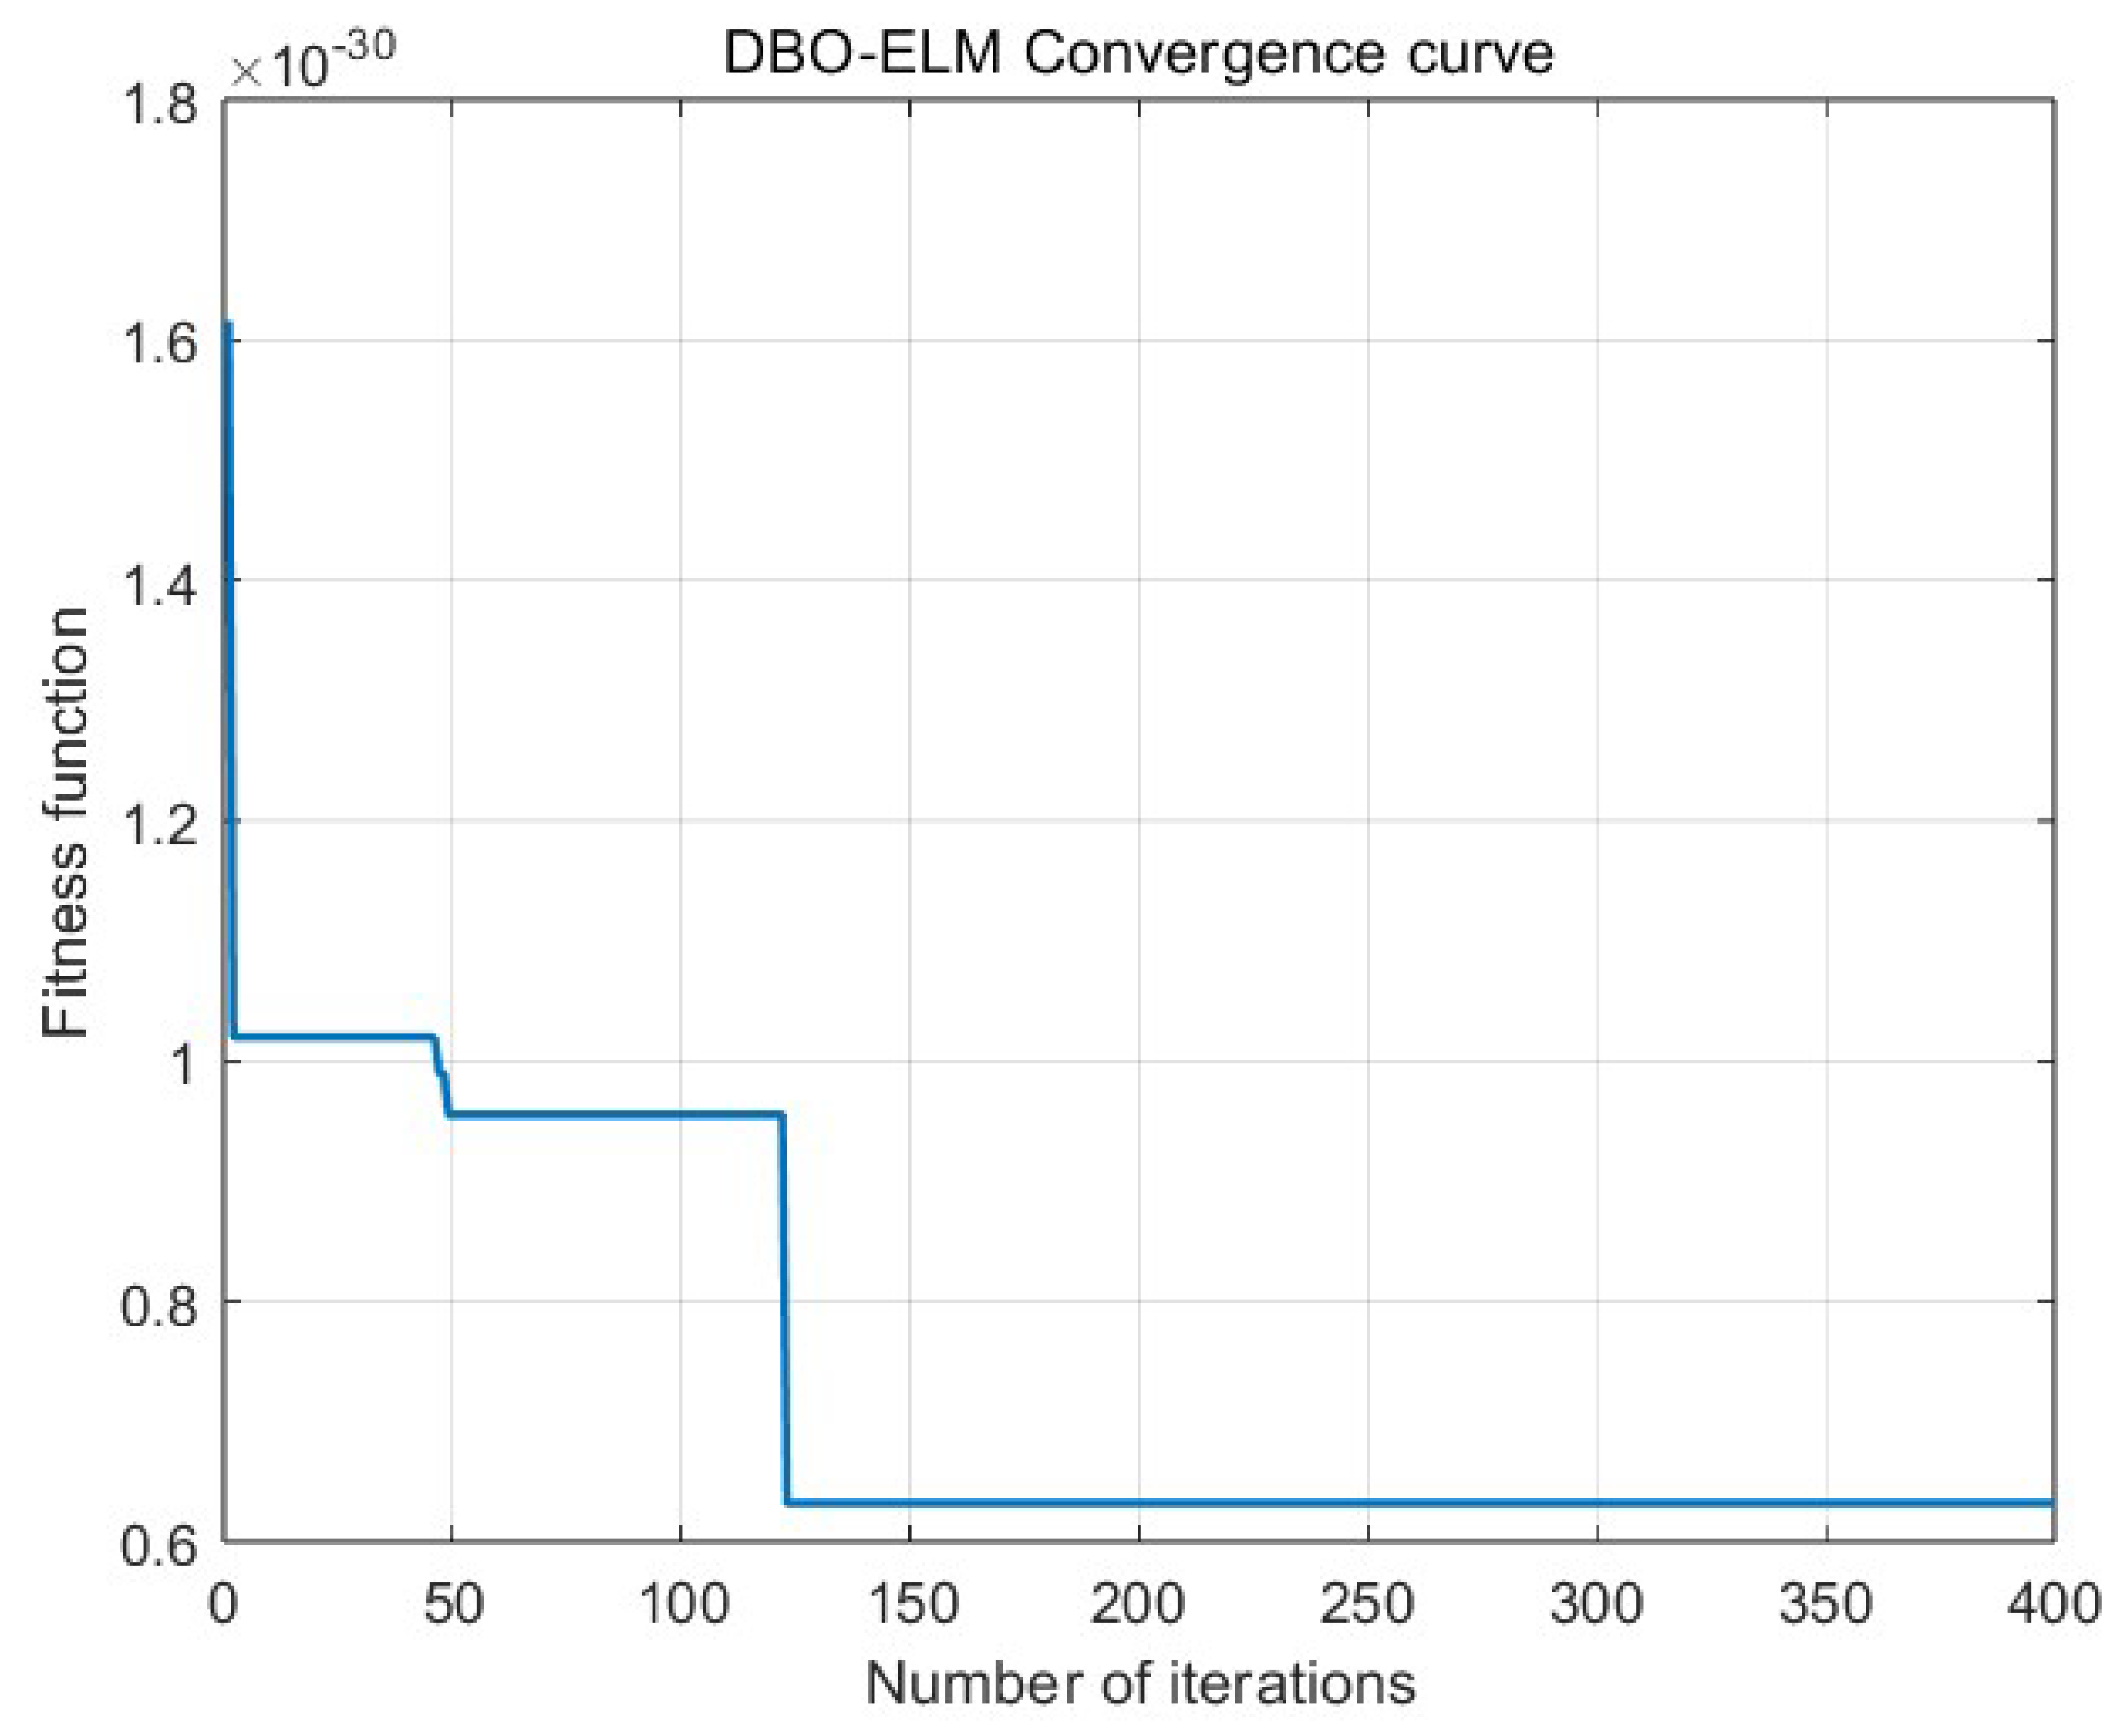
Based on the highway operation and maintenance resilience effectiveness assessment model algorithm established in the paper, input the model training parameters and sample library in
Table 3, use the unique thermal coding to eliminate the order relationship of the eigenvalues of the discrete indicators, and normalize the sample library to eliminate the quantitative outlines of different indicators. Iterative training 400 times, highway operation and maintenance resilience effectiveness assessment model of the fitness and the number of iterations as shown in
Figure 4, in the first generation of stabilization, the minimum fitness is, the assessment model as shown in
Figure 3, highway operation and maintenance resilience effectiveness assessment model parameters are shown in
Table 3.
Figure 4.
ELM model structure.
Figure 4.
ELM model structure.
Figure 5.
DBO-ELM convergence curves.
Figure 5.
DBO-ELM convergence curves.
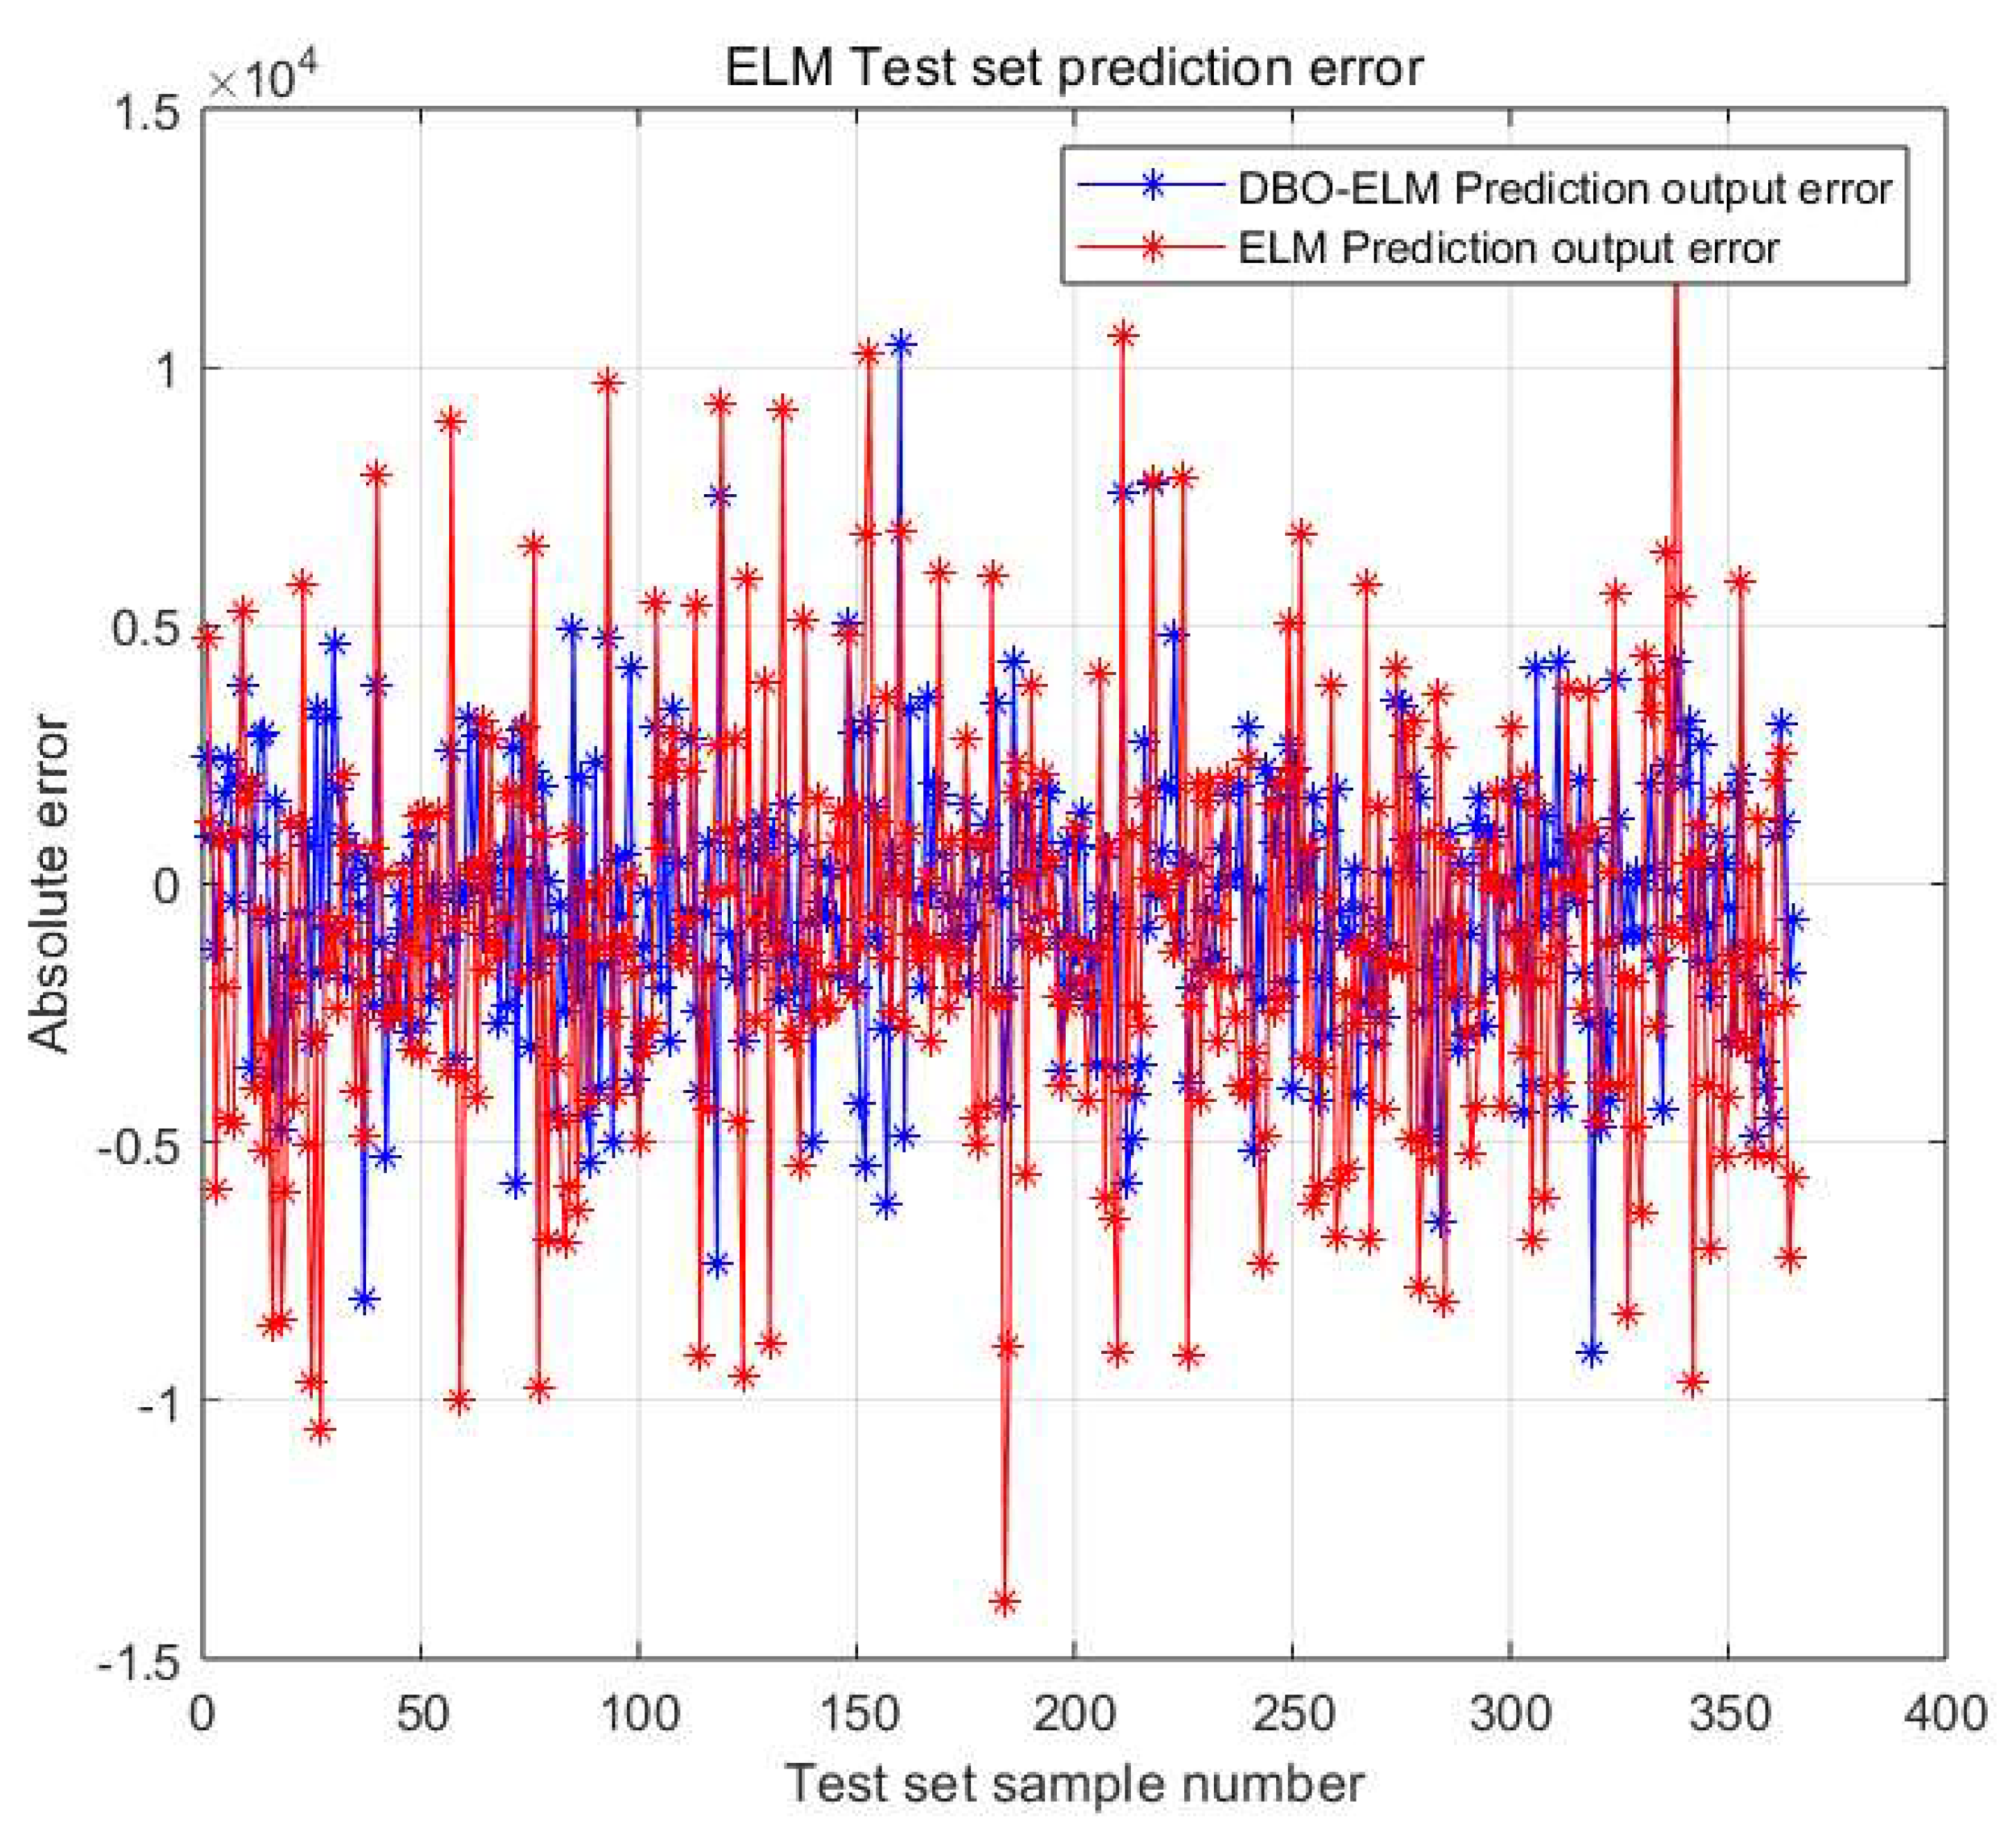
Figure 6.
Comparison of model output errors.
Figure 6.
Comparison of model output errors.
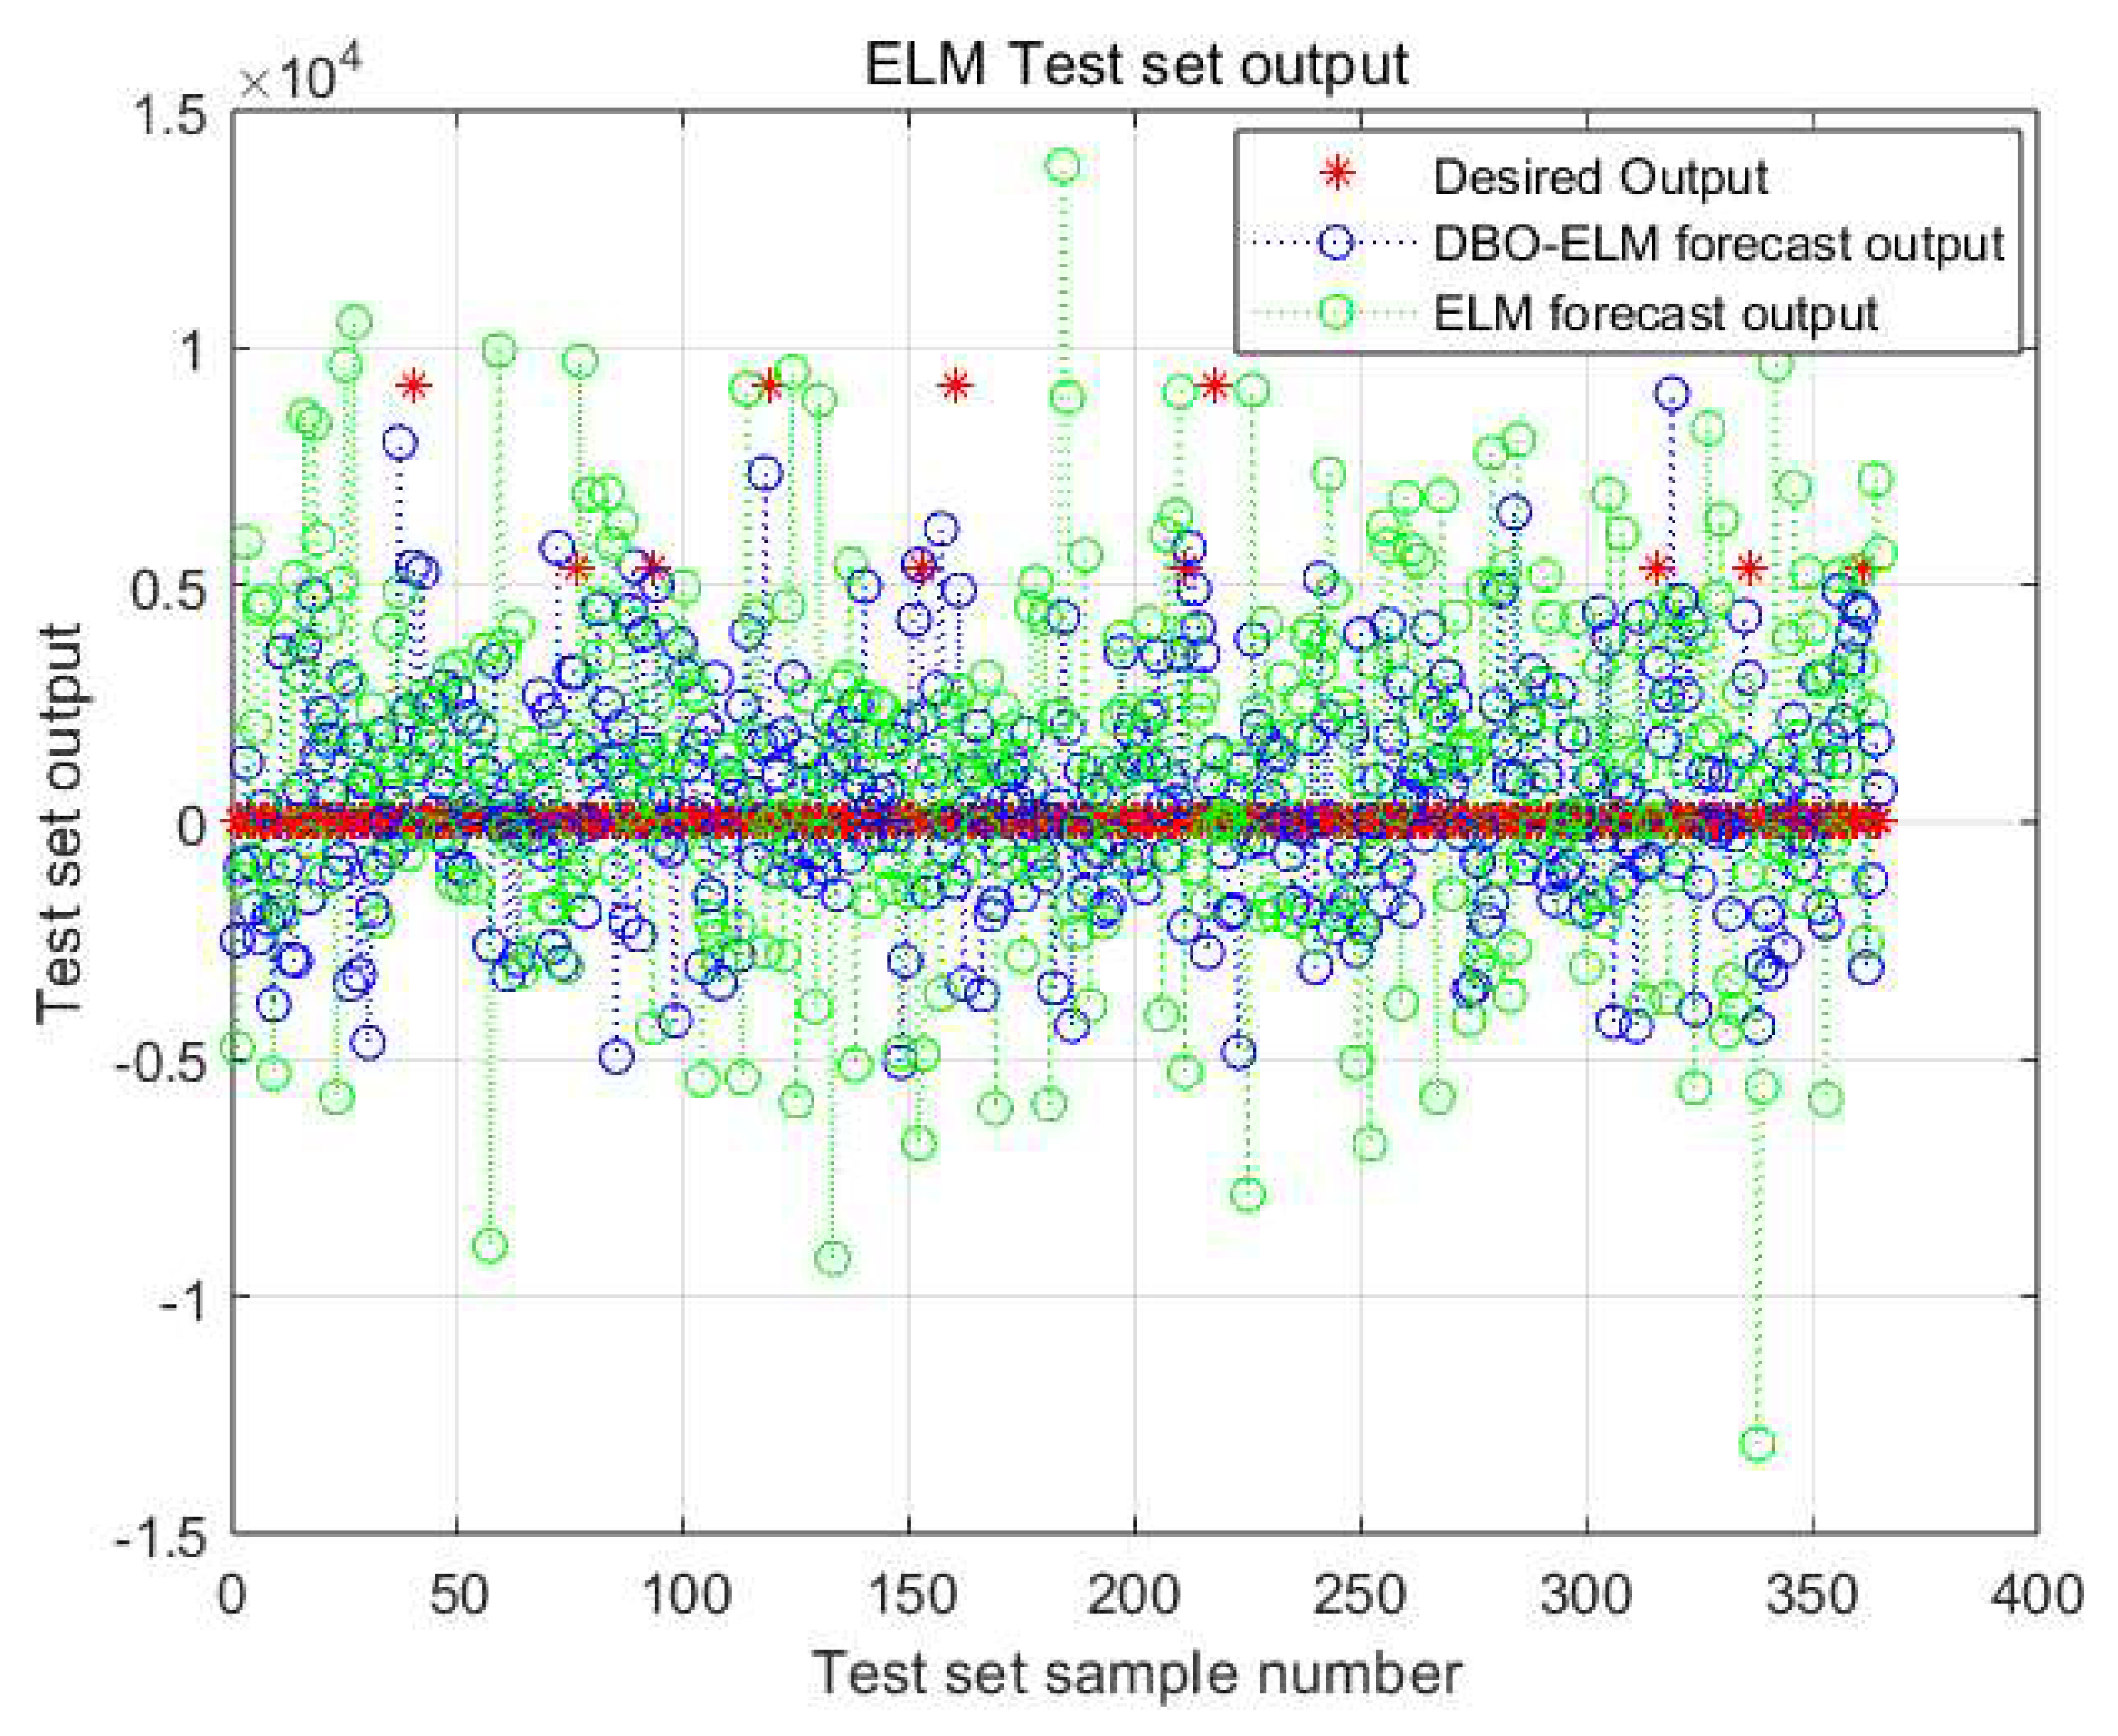
Figure 7.
Model Test Set Output.
Figure 7.
Model Test Set Output.
4. High-Speed Toughness Assessment Case Study
4.2. Data Collection
Based on the subjective weights of G1 method High-speed operation and maintenance resilience assessment affects many factors, and the traditional hierarchical analysis method is more difficult to pass the consistency test[
26,
27] , based on the high-speed operation and maintenance assessment index system, based on the improvement of the hierarchical analysis method - G1 method to design the questionnaire, and through the directional distribution, a total of 106 returned Effective responses, expert composition and weights are shown in
Table 5.
4.3. Highway System Operation and Maintenance and Safety Resilience Measurement Assessment Weighting Calculation
Invite five experts and scholars who are familiar with highway traffic operation and maintenance projects and have in-depth research on toughness theory to compare the identified operation and maintenance safety toughness system sampling 1-9 scale method in the form of interval number two by two to give the judgment matrix, and give the first expert comparison results in terms of stability as an example:
=
The expert weights2 ,the interval judgmentalness matrix is calculated based on the experts and the consistency matrix is:
=
Table 7.
Consistency Matrix.
Table 7.
Consistency Matrix.
| Consistency matrix B |
matrix |
bus route |
installations |
hydrological |
(of a computer) run |
safeguard |
commuters |
catastrophes |
| matrix |
1.139 |
1.254 |
1.279 |
1.236 |
1.318 |
1.304 |
1.297 |
1.337 |
| bus route |
1.096 |
1.139 |
1.183 |
1.192 |
1.271 |
1.258 |
1.243 |
1.265 |
| installations |
1.132 |
1.183 |
1.139 |
1.180 |
1.222 |
1.284 |
1.259 |
1.220 |
| hydrological |
1.095 |
1.203 |
1.229 |
1.139 |
1.240 |
1.206 |
1.216 |
1.256 |
| (of a computer) run |
1.098 |
1.228 |
1.239 |
1.135 |
1.139 |
1.198 |
1.229 |
1.293 |
| safeguard |
1.129 |
1.183 |
1.226 |
1.177 |
1.259 |
1.139 |
1.175 |
1.283 |
| commuters |
1.123 |
1.154 |
1.177 |
1.173 |
1.253 |
1.137 |
1.139 |
1.252 |
| catastrophes |
1.059 |
1.129 |
1.152 |
1.129 |
1.185 |
1.194 |
1.193 |
1.139 |
Calculate the consistency matrix weights, combine the interval judgment matrix with the consistency matrix to obtain the two-end extreme deviation matrix, the consistency matrix and the two-end extreme deviation matrix are as follows and use the SPA method to refine the interval weights [
17] , to obtain the IAHP weights as:
Table 8.
IAHP Weights.
| wj
|
matrix |
bus route |
installations |
hydrological |
(of a computer) run |
safeguard |
commuters |
catastrophes |
| weights |
0.227 |
0.109 |
0.102 |
0.142 |
0.098 |
0.129 |
0.102 |
0.091 |
The weights calculated by the CRITIC weighting method are:
Table 9.
CRITIC weights.
| Wi
|
matrix |
bus route |
installations |
hydrological |
(of a computer) run |
safeguard |
commuters |
catastrophes |
| weights |
0.121 |
0.287 |
0.102 |
0.095 |
0.095 |
0.126 |
0.096 |
0.078 |
Based on the principle of minimum discriminatory information, the combined weight of the portfolio combination assignment is determined as:
= (0.171,0.183,0.105,0.120,0.100,0.132,0.102,0.087), repeat the above steps, in summary, highway operation and maintenance safety resilience evaluation index weights are shown in
Table 10.
4.4. Analysis of Case Results
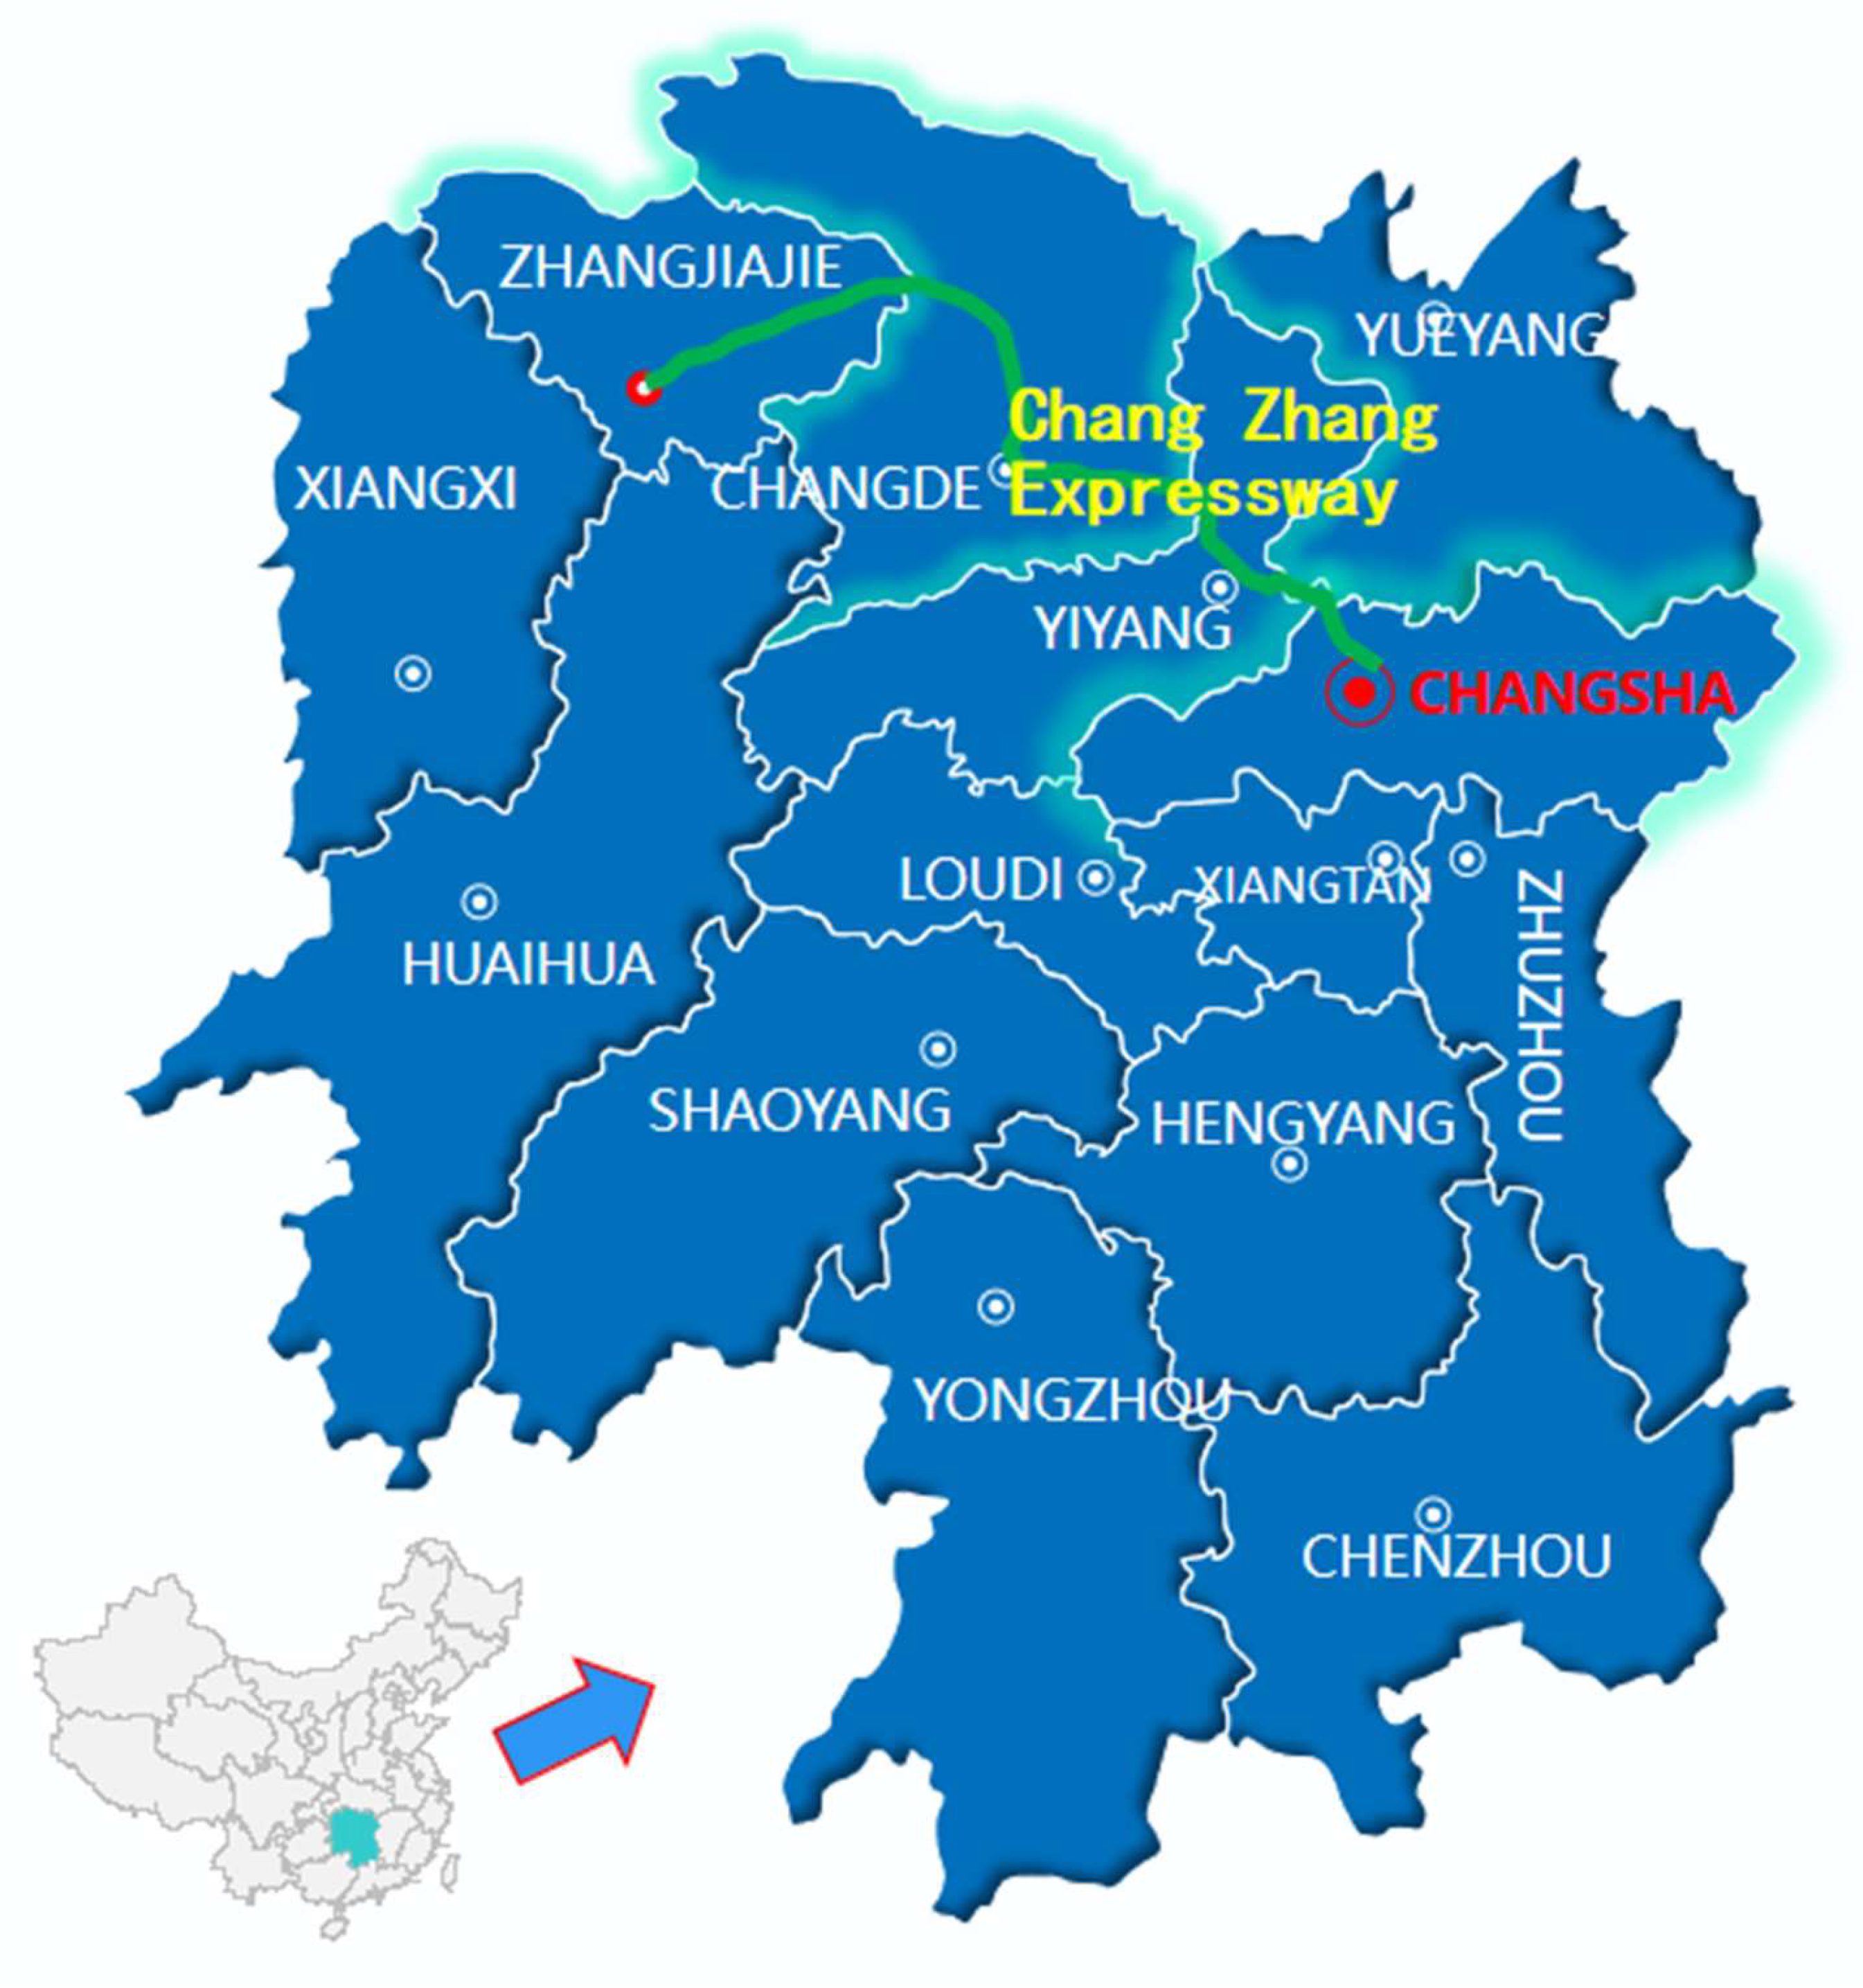
This case selects an accident-prone place in the highway section from Changsha to Zhangjiajie (Changzhang Expressway) for operation and maintenance resilience assessment. As an important transportation artery in Hunan Province, this road section carries a large number of passenger and cargo transportation tasks, and its operation and maintenance safety resilience is of great significance in ensuring smooth traffic flow and reducing the accident rate. The accident-prone area is located in the mountainous area of a section of the Changzhang Expressway, where complex terrain, changing weather conditions, and high traffic flow have led to frequent traffic accidents, posing a serious challenge to the operation and maintenance management of the expressway. In order to comprehensively assess the operation and maintenance resilience in this accident-prone area, we used a variety of data collection methods, including on-site surveys, historical accident data analysis, and expert interviews. Through on-site investigation, we learned about the topography, climate conditions, and traffic facilities of the roadway; through historical accident data analysis, we learned about the types, frequency, and causes of accidents on the roadway; and through expert interviews, we gained professional insights and suggestions on highway operation and maintenance management.
Table 12.
Summary of results for assessment indicators.
Table 12.
Summary of results for assessment indicators.
| Assessment of indicators |
stability |
redundancy |
flexibility |
restorative |
driving force |
Operation and maintenance resilience |
| Assessment results |
92.23 |
86.24 |
88.26 |
86.21 |
89.32 |
90.36 |
| assessment level |
talented |
favorable |
favorable |
favorable |
favorable |
talented |
Table 13.
Model Performance Comparison Parameters.
Table 13.
Model Performance Comparison Parameters.
| mould |
MAE |
MSE |
MAPE |
| ELM |
0.0697 |
0.0179 |
0.0390 |
| DBO-ELM |
0.00134 |
0.00178 |
0.0290 |
5. Conclusions and Recommendations
In response to the findings of the assessment, the following recommendations and measures are proposed:
(1) Constructing a highway system operation and maintenance and safety resilience measurement system. This study combines the five characteristics of resilience theory and uses the WFA method to identify the drivers of highway system operation and maintenance safety resilience. At the same time, considering the nonlinear mapping relationship between system classification and toughness feature elements, a highway transportation project operation and maintenance toughness evaluation system is constructed, aiming to measure the safety toughness of the highway system operation and maintenance phase, and then improve the highway transportation project operation and maintenance site safety.
(2) Establish the evaluation model of highway system operation and maintenance and safety resilience measurement. This study utilizes the IAHP-CRITIC method to solve the ambiguity problem existing in the traditional interval hierarchical analysis method for calculating the weights, making the evaluation results more accurate and reliable. The DBO-ELM comprehensive evaluation method with improved extreme learning machine further enhances the comprehensiveness and systematicity of the evaluation, and concludes that the weights of the toughness level 1 evaluation indexes are in the overall order of stability>drivenness>adaptability>redundancy>recovery, which provides strong support for the quantitative evaluation of the highway system operation and maintenance and safety toughness measurement. strong support.
(3) Evaluation index system and evaluation model validation of highway system operation and maintenance and safety toughness measurement. By evaluating the practical application case of one of the accident-prone places in the highway section from Changsha to Zhangjiajie (Changzhang Expressway), the results of the study show that the evaluation results of the operation and maintenance and safety toughness of the Changzhang Expressway in terms of the congestion of the corridor and the peak flow of people are high toughness, while the other aspects are medium toughness. The feasibility and effectiveness of the evaluation model proposed in this paper are verified. The model can not only effectively shorten the accident recovery time and avoid the occurrence of secondary disasters, but also reduce the occurrence of safety accidents at the operation and maintenance site, which is of great significance for improving the overall safety level of the highway system.
In order to ensure the stability of the highway system, as well as to guarantee the absolute safety of passengers, the standard of operation and maintenance and safety resilience measurement needs to be upgraded urgently to meet the safety and reliability needs. Therefore, the evaluation model proposed in this study will need to be further improved and optimized to meet the new needs and challenges. At the same time, the model can also provide a reference and reference for the safety toughness evaluation of other similar projects and provide strong support for the safety development of the highway transportation industry. Optimize traffic facilities: increase the number of toll booths to improve the handling capacity of peak traffic flow; strengthen the monitoring of vehicle loading on road sections and take timely measures to alleviate congestion; expand the per capita road area to improve road capacity. Enhance the level of operation and maintenance management: strengthen the dispatching command and operation operation level training, improve the skill quality of dispatchers and drivers; strengthen the implementation of the safety management system to ensure that all systems are effectively implemented. Strengthen emergency response capability: improve the water supply and drainage system and emergency response mechanism to improve the ability to respond to emergencies; strengthen collaboration and linkage with other departments to form a joint effort to respond to emergencies. Introducing intelligent technology: optimize the operation and maintenance management process by using big data, cloud computing and other intelligent technologies to improve the efficiency and accuracy of operation and maintenance; strengthen the intelligent monitoring and early warning capability of equipment and facilities, and discover and deal with potential risks in a timely manner.
In summary, through the assessment of operation and maintenance resilience of the accident-prone Changsha-Zhangjiajie (Changzhang Expressway) highway section, we have found the deficiencies in operation and maintenance management of this section and put forward corresponding suggestions and measures. The implementation of these recommendations and measures will help to improve the operation and maintenance safety resilience level of this road section, reduce the occurrence of traffic accidents, and protect the travel safety of the people.