
Submitted:
20 January 2025
Posted:
20 January 2025
You are already at the latest version
Abstract
As a major producer of corn and wheat, the disruption of the supply chain in Ukraine in these food sectors due to the Russian-Ukrainian conflict may have a profound global impact. Very little is known about how the war has impacted these important food sectors globally. This paper examines the global impact of the war on the maize and wheat sectors in the first year of the war. Analysis of FAO data shows that Ukraine suffered a 12.87% and 17.45% decline in the maize and wheat sectors, respectively, compared to the 2012-2021 base year. Using the Acclimate economic network model, these shocks are applied to Ukraine’s maize and wheat network nodes to analyze their global impact. The production value and total losses are calculated and compared to the base year, both regionally and in some major global economic blocs. The results show that the maize sectors in Germany, Ukraine, Poland, and Belgium were most affected by production value losses, while Ukraine, China, Venezuela, and Korea suffered the largest overall losses. In the wheat sector, Russia, Germany, Ukraine, and Canada suffered the largest production value losses, while Ukraine, Kazakhstan, Uzbekistan, and China suffered the largest overall losses. Overall, the maize sector was the hardest hit globally compared to the wheat sector, with the EU, the US, China, South America, and Africa being the hardest hit in the maize sector, while the BRICKS and Oceania were the hardest hit in the wheat sector. These findings can contribute to better investment decisions, regional and sectoral emergency management planning, and the development of regulatory frameworks.
Keywords:
Russia-Ukraine war
; Global impact assessment
; Corn and Wheat sectors
; Acclimate
; Production value losses
; Total losses
1. Introduction
The long geopolitical tensions between Russia and Ukraine that turned into a full-scale war in February 2022 [1,2,3,4,5,6] led to devastating regional and global food markets and economic crises due to a significant reduction in Ukraine and Russia’s exports and trade restrictions [7]. This event also affected other commodities and economic sectors such as energy, housing, inflation, and the general cost of living [3,8,9]. Some drastic measures were taken by non-Russian allies to try and force Russia to seize hostilities and stabilize global market prices such as sanctions and the signing of the Black Sea Grain Agreement between Russia, Ukraine, Turkey, and the United Nations [5,6,10,11,12,13,14]. This initiative was to facilitate the export of grains and fertilizers to the global market as a means of addressing global grain shortages and rising food prices due to war. Researchers found that the Black Sea Grain Initiative reduced wheat prices by 7.9%, compensating approximately $21.48 billion of these costs [14], while others found that international cooperation manifested in the Black Sea Grain and Solidarity Lanes initiatives and the removal of export restrictions may have mitigated the price hike of 2022 by 13 percentage points [15].
From when the war broke out until the present day, researchers have investigated the socioeconomic impacts of the war especially on supply chain disruptions and the subsequent food market shortages, food access, price hikes, and food insecurity. Jagtap et al. [16] investigated the Russia-Ukraine war and its implications for global food supply chains. They used a PRISMA approach (Preferred Reporting Items for Systematic Reviews and Meta-Analyses), including gray literature, to investigate six key areas of food supply chains that would be most affected due to the ongoing war. Their findings showed that although this conflict will affect the majority of the economies, however, the most affected economies are in Europe and Africa. Countries’ vulnerability to food supply disruptions caused by the Russia–Ukraine war has also been investigated from a trade dependency perspective [17]. By applying a set of trade and socioeconomic indicators, they found that the external food supplies of 279 countries and territories were affected to varying degrees, with countries such as Georgia, Armenia, Kazakhstan, Azerbaijan, and Mongolia being extremely vulnerable because they depend almost entirely on a variety of food imports from Russia and Ukraine. Lin et al [18] used Satellite observations to show signs of wheat production reduction in Ukraine in the season 2021–2022. Using a general equilibrium trade model, their findings show that this reduction led to a trade drop of 60%, soaring wheat prices of 50%, and severe food insecurity with decreased purchasing power for wheat (above 30%) in the most severe scenario, especially for countries that heavily rely on wheat imports from Ukraine, such as Egypt, Turkey, Mongolia, Georgia, and Azerbaijan. Zhang et al [19] investigated the global environmental impacts of the food system from regional shock while considering the Russia-Ukraine war as a case study. They developed a novel framework to examine global food shortages from the Russia-Ukraine conflict and quantified the embodied environmental impacts of disturbed and alternative food supply chains. Their main finding is that the conflict could soon bring a 50–120 Mt shortage of nine dominant food products and cause temporal global cropland abandonment and a decline in greenhouse gas emissions. Many other studies show that the war led to significant price hikes in basic food commodities such as wheat, corn, and soybeans with Russia and Ukraine import-dependent countries being the most affected [18,19,20,21,22,23,24,25,26,27,28,29,30,31,32]. A few studies looked at the effectiveness of some international policies that is geared towards mitigating the impacts of the war with [14,15,33] highlighting the importance of maintaining the Black Sea Grain Agreement for long-term price stability.
To better understand how the war has affected some popular food markets, this paper uses real-time agricultural production data from the Food and Agriculture Organisation of the United Nations (FAO) to examine the regional and global impact of the Russian-Ukrainian war on two of Ukraine’s most produced and exported commodities (wheat and maize) in the first year of the war. The study equally examines the countries most vulnerable in these food markets and compares the impact of the war on the major global economic blocs. In addition, this work also aims to answer the question of whether there is a correlation between Ukraine’s export partners (Figure 1) and vulnerability to war-related shocks. This information can be useful for better investment decisions, regional and sectoral contingency planning, and the development of regulatory frameworks. The rest of the paper is organized as follows: In Section 2, we present the data we used to quantify and distribute the shocks. Similarly, we present the economic network model and the EORA input-output data used to analyze the shock effects. In Section 3 and Section 4 we present the results and discussions of our numerical experiment and conclude in Section 5.
2. Data and Method
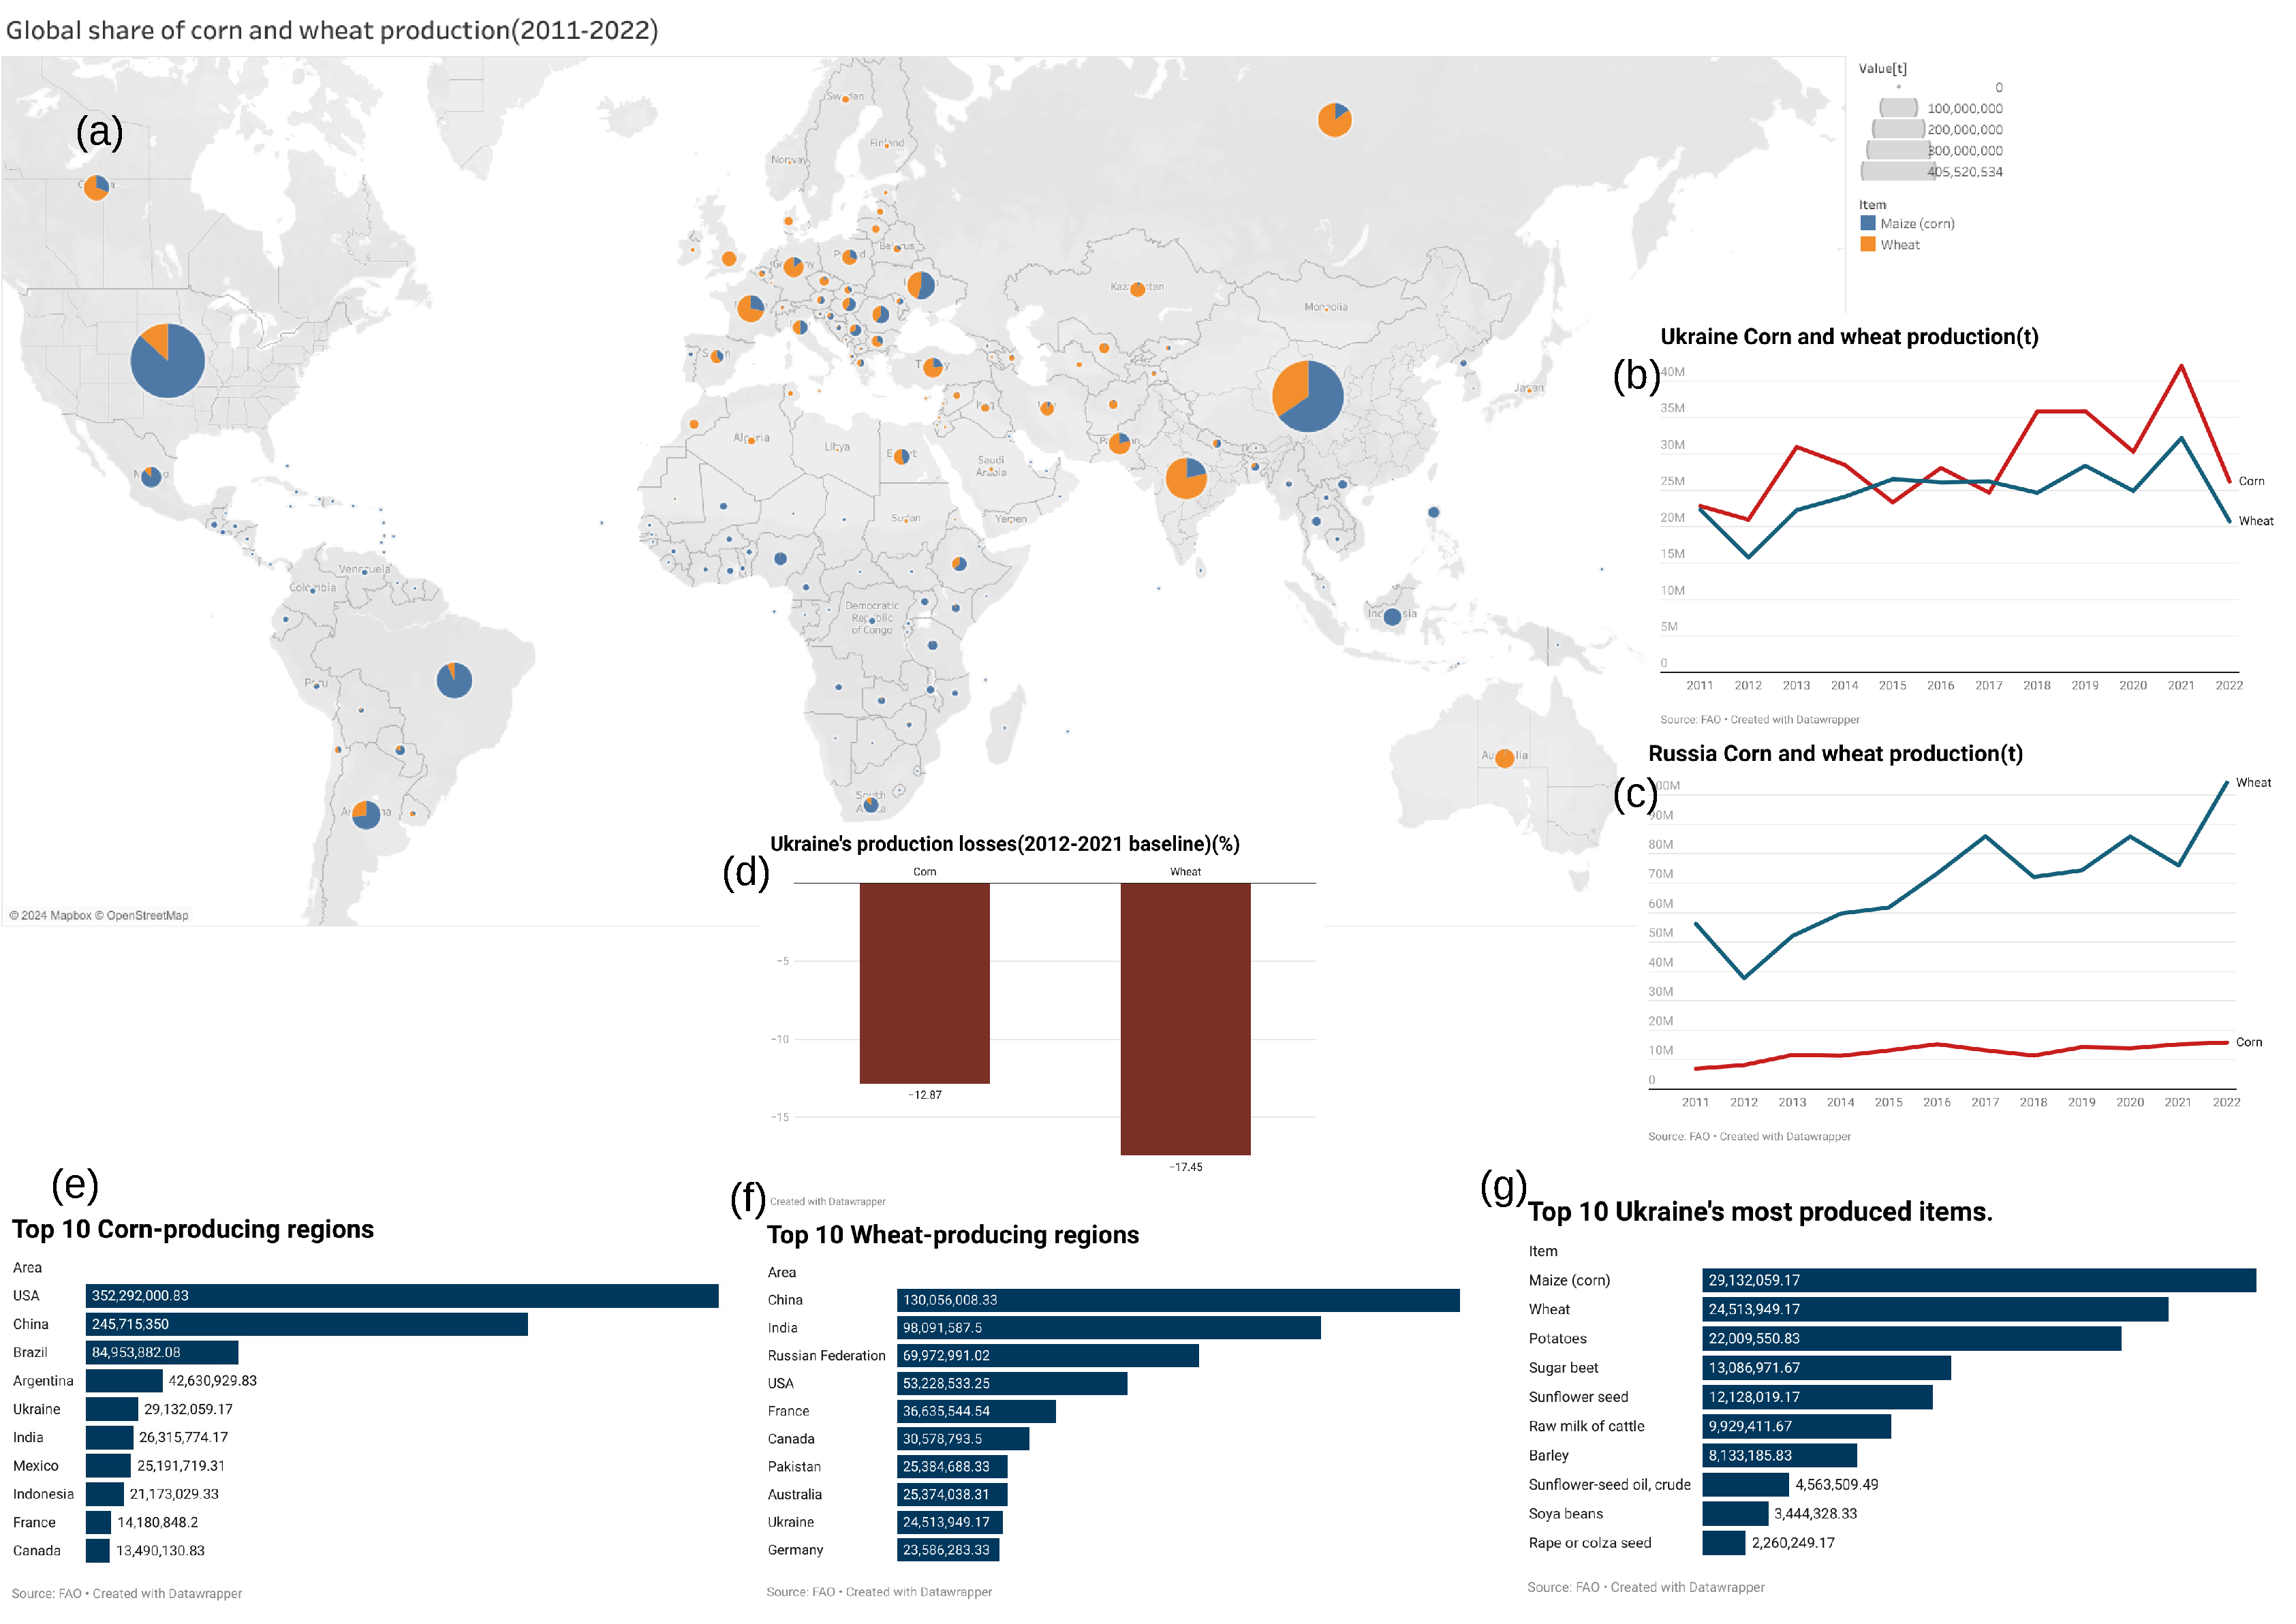
The agricultural dataset used in this study is from the Food and Agriculture Organization of the United Nations (FAO), freely available online at https://www.fao.org/faostat/en/#data/QCL. This dataset covers all crops and livestock primary production quantities in tonnes for the year 2015. Global corn and wheat production data from 2011 to 2022 was downloaded, their means were calculated and the global share displaced in Figure 2a. This analysis shows that Ukraine is a major global producer of these commodities. This figure also show that Ukraine produces more Maize (corn) than wheat while Russia produces more wheat than maize. Figure 2e,f show the top 10 corn and wheat-producing regions with Ukraine coming in at numbers 5 and 9 respectively. Figure 2g shows the top 10 Ukraine’s most produced items, with corn and wheat coming in at 1st and 2nd positions respectively. Figure 2b,c look at the time series for Ukraine and Russia in the corn and wheat sectors from 2011 to 2022. This figure shows a significant drop in these grains for Ukraine in 2022 compared to 2021 while Russia experienced a production increase for both crops. To capture the war’s impact and eliminate any biases due to market fluctuations, the mean of 2012 to 2021 is calculated for Ukraine for both crops and subtracted from 2022 to give a production decrease of -12.87% for corn and -17.45% for wheat. These values serve as shocks (Figure 2d) that are applied to the nodes of the corn and wheat in Ukraine in the demand-driven economic network model Acclimate. Their regional and global impacts are investigated by calculating the production and total losses compared to the baseline scenario (no war). The total losses are the sum of the direct and indirect losses. Ukraine and Russia, the two conflicting parties suffer direct losses while other countries suffer indirect losses solely from trade relations with the conflicting parties. Data from the World Integrated Trade Solutions (WITS) has also been used to quantify Ukraine’s trading partners which is shown in Figure 1 and can be found at https://wits.worldbank.org/.
Acclimate is an agent-based economic model that simulates the propagation of output losses caused by local demand, supply, or price shocks in the global supply network. This economic network model was developed by a team of scientists at the Potsdam Institute for Climate Impact Research (PIK), in Potsdam, Germany. The model has been experimented with and found to be very robust in simulating economic shock propagation in the global supply chain network caused by climate-related disasters and some international relation fallouts such as Brexit [34,35,36,37,38,39]. For a full description of the model, see [34]. This model consists of highly interconnected regional sectors, where the regions represent each country in the world and the sectors are the various industries that make up a country’s economy, such as the agricultural sector, food, hotels and restaurants, wholesale trade, oil and gas, timber, transportation, finance, mining and quarrying, etc. The economic network used in this study is the EORA26 2015 economic network, which breaks down the agricultural sector into corn and wheat sectors using the FAO primary crop and livestock production dataset in tonnes for 2015. This network also consists of over 15,909 economic sectors in more than 190 countries. The 12.87% reduction in corn and 17.45% in wheat production of Ukraine in 2022 compared to the base year (2012-2021) are applied as shocks on the nodes of the corn and wheat sectors of Ukraine in the acclimate network model. Their global impacts are assessed by calculating the changes in production value and total losses are also calculated as the sum of the direct and indirect losses. A comparative study is carried out to uncover the most and least vulnerable regional markets.
3. Results
Applying the -12.87% shocks for corn and -17.45% shocks for wheat in Ukraine’s Corn and Wheat sectors, changes in the global corn and wheat production value and total losses are investigated against a baseline scenario(to war). Figure 3 shows the changes in the value of corn production and total losses and the top 20 regions most and least affected. Negative production values (red) are regions most impacted while positive production values (blue) are regions least impacted. For total losses, negative losses (red) are regions least impacted while positive losses (blue) are regions most impacted. Germany, Ukraine, Poland, and Belgium suffer the most production value losses while China, the USA, the Netherlands, and Argentina are the least affected. For total losses, Ukraine, China, Venezuela, and Korea suffer the most while Germany, Poland, the USA, and Belgium suffer the least. These figures show Europe as the region most affected in terms of production value losses while China and many countries in Sub-Saharan Africa suffer the most total losses. In Figure 4, the global change in wheat production value and total losses compared to the 2012-2022 baseline is investigated. The figure also presents the top 20 most and least impacted regions. Negative production values (red) are regions most affected while positive production values (blue) are regions least affected. For total losses, negative losses (red) are regions least affected while positive losses (blue) are regions most affected. Russia, Germany, Ukraine, and Canada suffer the most production value losses while China, Kazakhstan, France, and Uzbekistan, are the least affected. For total losses, Ukraine, Kazakhstan, Uzbekistan, and China, suffer the most total losses while Russia, Germany, the Netherlands, and France, suffer the least total losses. Most of the negatively impacted countries are found to have some strong trade ties with Ukraine as seen in Figure 1 which shows that a disaster impacting a certain region can also have profound impacts on its trading partners.
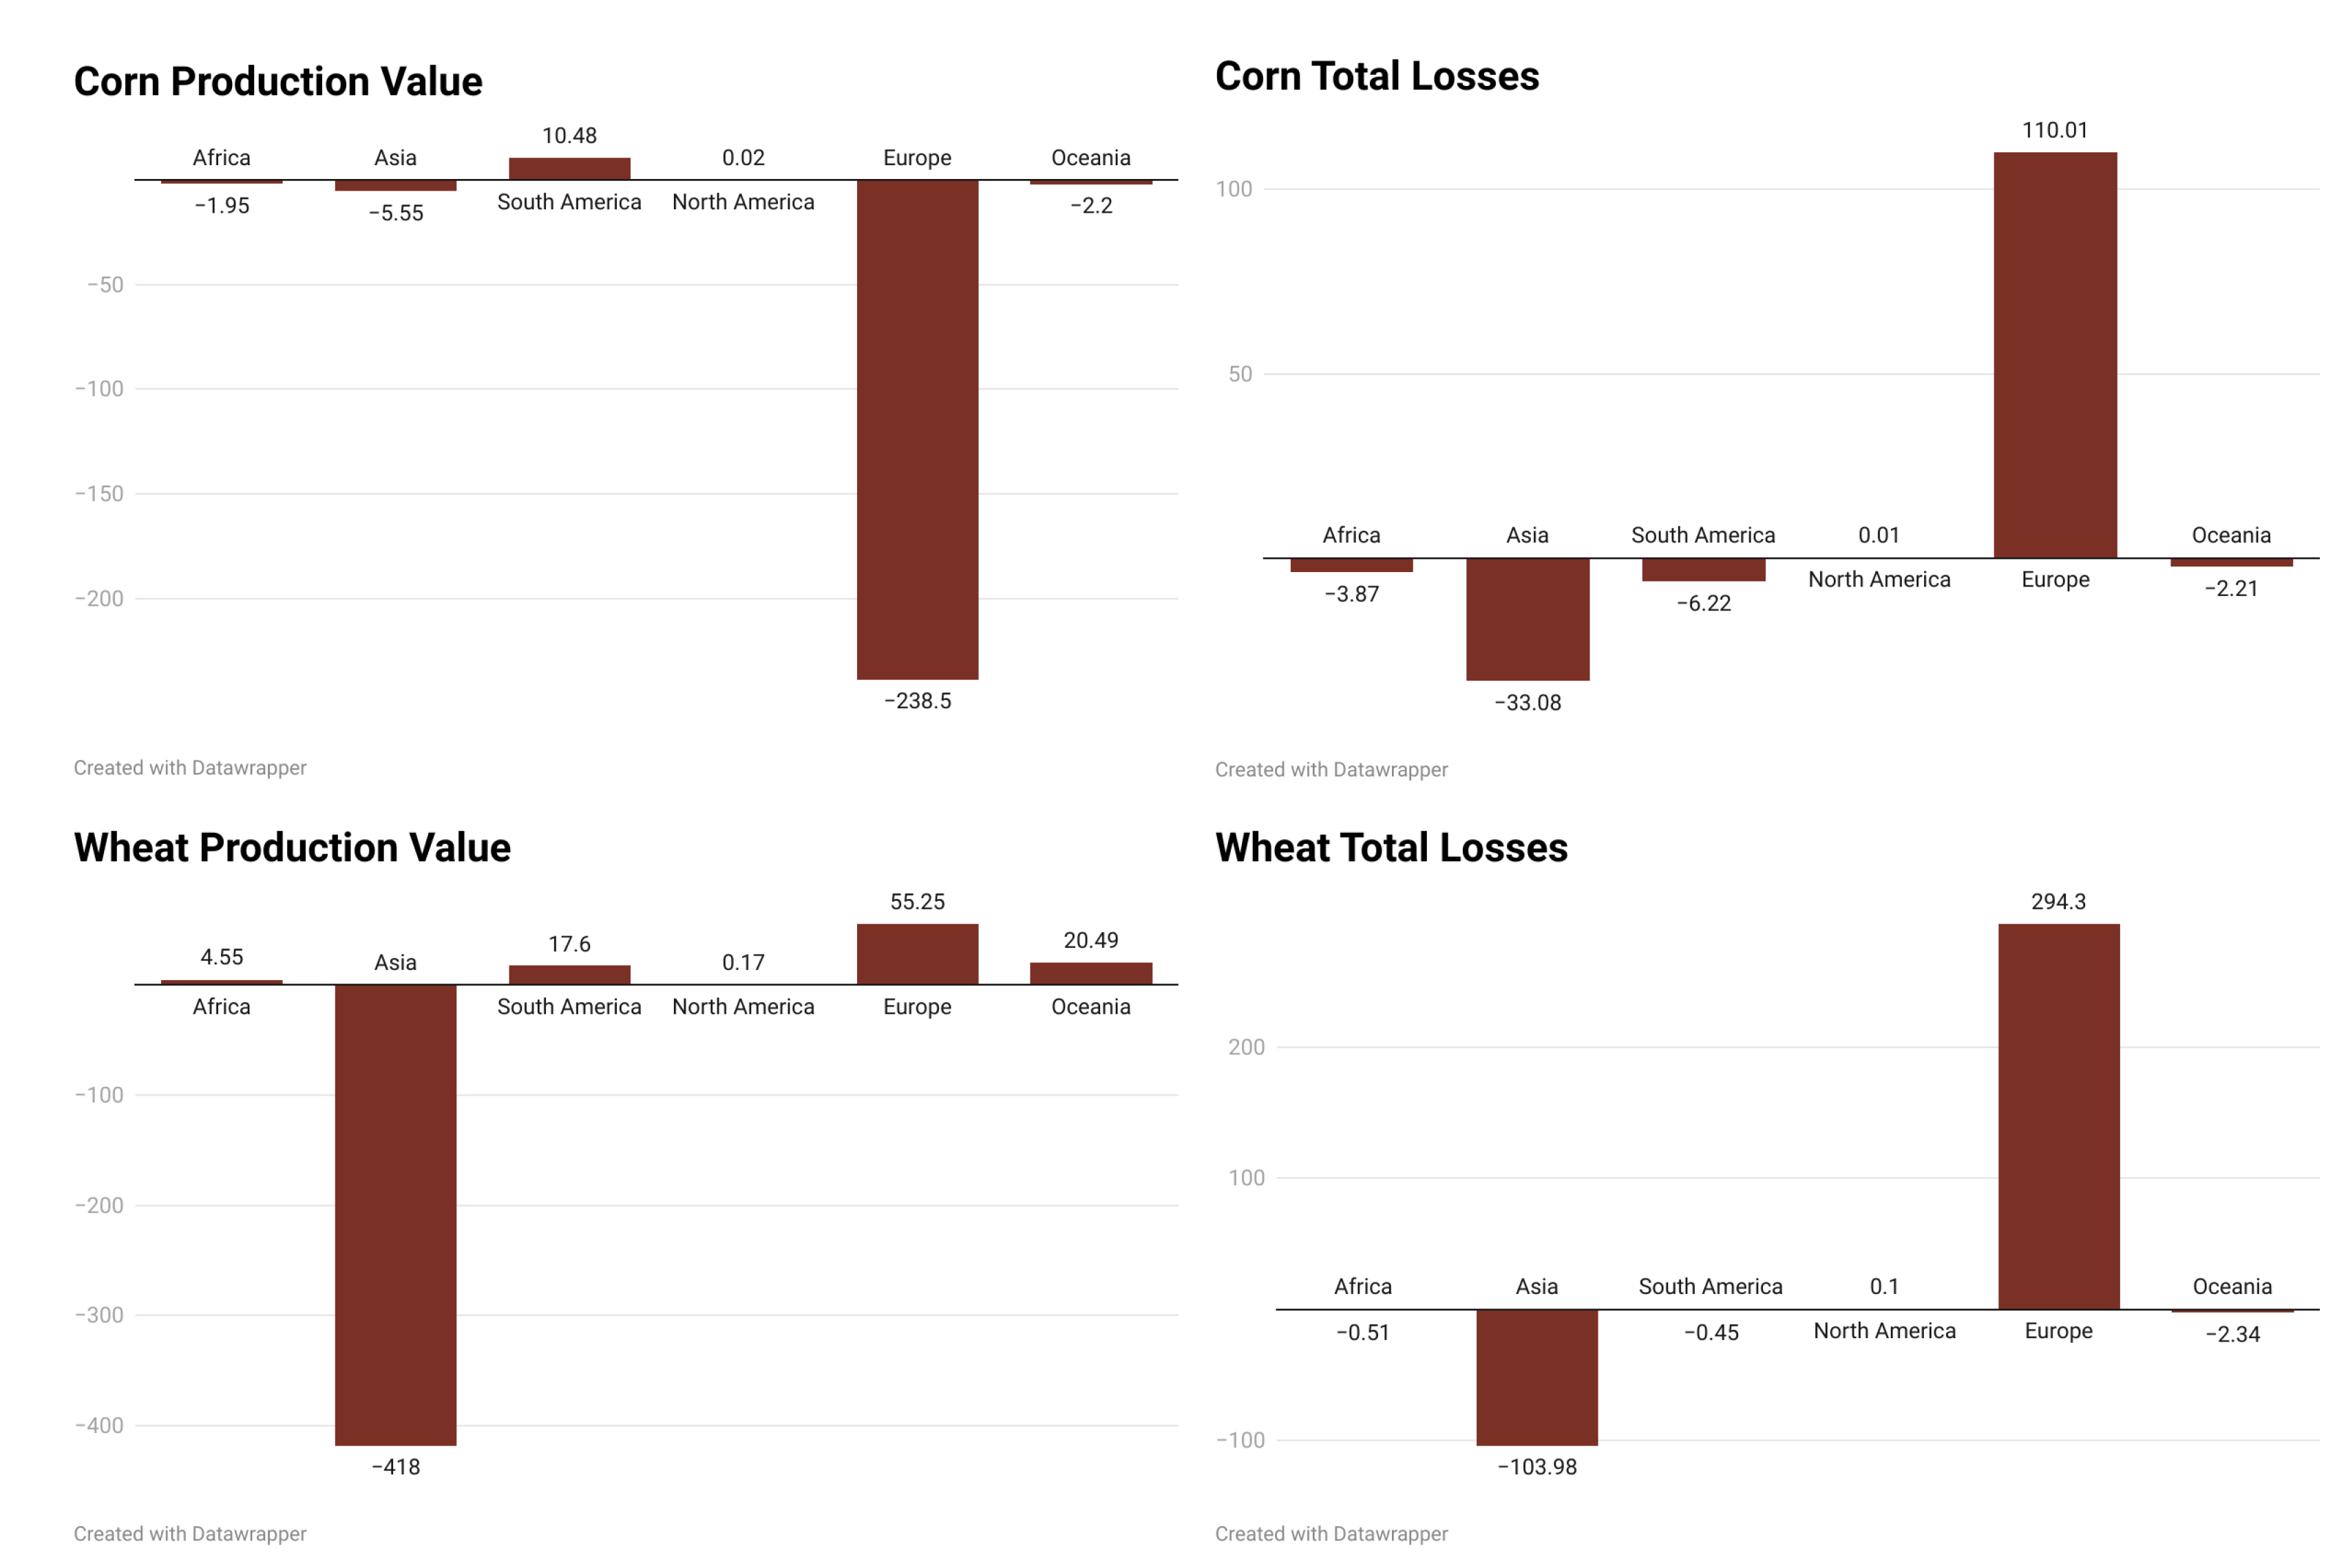
Figure 5 analyses the shocks for the various major economic blocs, both for the maize and wheat sectors. This figure shows a very high negative shock for the EU maize and wheat sectors in the initial phase of the conflict. The impact on the maize sector is greater than on the wheat sector. Over the course of the days, the maize and wheat sectors in the EU are gradually recovering, but are still only slightly affected. In the US, the maize sector was hit harder than the wheat sector in the first few days of the war. While the US production value is gradually recovering over time, these sectors continue to suffer total losses. The impact of the war is far less in China than in the US and the EU. A look at the BRICS bloc shows a similar pattern as in the EU, but the wheat sector is much more affected than the corn sector. This could be due to the fact that production and trade in the wheat sector in these countries is far greater than in the maize sector. In Oceania, the maize sector was more affected than the wheat sector, although the wheat sector was more affected at the beginning of the war. In South America and Africa, a similar pattern can be observed, with the maize sector being the most affected compared to the wheat sector. Figure 6 compares the impact of the war on the maize and wheat sectors in some global economic blocs. This figure shows that Europe suffers the largest overall losses in the corn and wheat sectors and experiences the largest decline in the production value of corn, while Asia experiences a significant decline in the production value of wheat. North America is the least affected of all continents. Overall, these analyses (Figure 5 and Figure 6) show that the disruption of the supply chain for a major export commodity generally has a major global impact. To protect against future economic crises, excessive dependence on a particular region or country for the supply of a commodity should therefore be avoided by creating new production centres around the world.
4. Discussion
Successive disasters and geopolitical conflicts such as the Covid-19 pandemic, the war between Russia and Ukraine, the war between Israel and Hamas, and the extreme effects of climate change have dealt a severe blow to the global economy by disrupting global supply chains and leading to worldwide shortages, price hikes, inflation, economic stagnation, recession, loss of wealth, food insecurity, and deaths. Increasing geopolitical tensions between major economies and agricultural producers, as well as crises related to climate change, mean that there are likely to be more such geopolitical conflicts and climate/health-related disasters in the future. To protect against future global humanitarian crises caused by disasters in one part of the world, there is a growing need to build more resilient supply chains and raise awareness. Following the global economic hardship caused by the Russia-Ukraine war, some remedial strategies have been implemented to reduce the cost of living and improve access to basic necessities such as food and energy. To some extent, international sanctions have helped to reduce Russia’s hostilities compared to the early days of the invasion, while the Black Sea Grain Agreement signed between Russia, Ukraine, Turkey, and the United Nations [33] helped to stabilize global food prices and prevent famine in vulnerable countries. The continued renewal of this agreement is crucial to maintaining global food security.
In order to facilitate the implementation of better investment decisions, regional and sectoral contingency planning, and regulatory framework development, this paper assessed the regional and global impact of the war on some major agricultural commodities produced and exported by Ukraine. Compared to the base year 2012-2021, the study shows that the Ukrainian corn and wheat sectors are affected by up to 12.87% reduction in corn production and 17.45% reduction in wheat production. The study analyses the global impact of this decline on the production value and total losses of maize and wheat. The results show that Europe, followed by African countries, was hit hardest by the war. The results are in line with those of Jagtap et al. [16] in their study on the Russia-Ukraine war and its impact on global food supply chains. Their findings show that while this conflict will affect the majority of economies, the most affected economies are in Europe and Africa. The analysis in this study also found a strong relationship between countries that heavily depend on Russia and Ukraine for imports of some food commodities with high vulnerability to losses. These findings are consistent with many studies carried out on regional vulnerability to the Russia-Ukraine war [18,19,20,21,22,23,24,25,26,27,28,29,30,31,32].
Limitations
Some drawbacks of this work are:
- The FAO data used might induce some inaccuracies during data collection, small farms might be underrepresented or ignored, and the survey sample may not represent the entire agricultural industry. Moreover, the WITS trade network data might not capture all trade routes.
- The war between Russia and Ukraine is still ongoing but not as intense as it was in 2022, so it is difficult to take stock of the economic damage caused by the war. That is why we considered a scenario-based modeling approach. Reliance on scenario-based modeling may not fully reflect the evolving situation and capture its complexity.
Future Work
In the future, we look to develop detailed shock models using factors affecting regional agricultural losses and real-time food market prices. We also look forward to investigating the ripple effects of the war on other economic sectors such as Oil and Gas, Transport, and Manufacturing. We will also try to model other highly probable geopolitical events such as the conflict between Russia and NATO, China and Taiwan, the USA and China, and Russia and the USA to project possible future crises in the agricultural sector for early warning and disaster preparedness.
5. Conclusions
The increasing uncertainty in international relations between major world powers, due to the fact that each country’s interests come first when it comes to acquiring resources for regional development and better welfare, can increase geopolitical tensions that can lead to escalating conflicts. These conflicts can seriously disrupt key food production and supply routes, leading to increased food insecurity, especially in regions that are heavily dependent on imports from the conflicting parties. In order to better prepare for future conflicts between major breadbaskets, this study simulated the regional and global impact of a disruption of the Ukrainian maize and wheat supply chain in the first year of the Russia-Ukraine crisis. The study analyzes FAO data on Ukraine’s annual maize and wheat production for 2022 compared to the years 2012 to 2021 and concludes that maize and wheat production in Ukraine decreased by 12.87% and 17.45% respectively. When the Ukrainian maize and wheat sectors were shocked with this data in the Acclimate economic network model and the global impact assessed, the results showed that the maize sectors in Germany, Ukraine, Poland, and Belgium were the most affected by production value losses, while Ukraine, China, Venezuela, and Korea suffered the largest overall losses. In the wheat sector, Russia, Germany, Ukraine, and Canada suffered the largest production value losses, while Ukraine, Kazakhstan, Uzbekistan, and China suffered the largest overall losses. Overall, the maize sector was the hardest hit globally compared to the wheat sector, with the EU, the US, China, South America, and Africa being the hardest hit in the maize sector, while the BRICKS and Oceania were the hardest hit in the wheat sector. The EU and Africa proved to be the two most affected continents in these commodities. International cooperation through the reduction of tariffs on imported goods, the continued renewal and maintenance of the Black Sea Grain Agreement, the diversification of trading partners in the food sector, and measures to increase local production of some staple crops through large-scale agriculture (plantation farming), particularly in sub-Saharan Africa, can help mitigate future global crises affecting key breadbaskets.
Author Contributions
Conceptualization, N.A.A; methodology, N.A.A; software, N.A.A; validation, N.A.A; formal analysis, N.A.A; investigation, N.A.A; resources, N.A.A; data curation, N.A.A; writing—original draft preparation, N.A.A; writing—review and editing, N.A.A; visualization, N.A.A; supervision, N.A.A; project administration, N.A.A; funding acquisition, N.A.A.
Funding
This project is jointly funded by the European Union (Grant Agreement no. 945361) through the Marie Skłodowska-Curie Actions COFUND scheme and Next Generation EU.
Data Availability Statement
The agricultural dataset used in this study is from the Food and Agriculture Organization of the United Nations (FAO), freely available online at https://www.fao.org/faostat/en/#data/QCL. The bilateral and multilateral trade network data from the World Integrated Trade Solutions (WITS) can be found at https://wits.worldbank.org/
Acknowledgments
The author would like to thank the European Union, Ca’ Foscari University of Venice, and the Next Generation EU for funding the project under grant agreement No. 945361. The authors equally extend their gratitude to members of the Complexity Science Division of the Potsdam Institute for Climate Impact Research (PIK), in Potsdam, Germany for their development of the Acclimate model and for making it publicly available via GitHub.
Conflicts of Interest
The author declares no conflicts of interest.
References
- Briefing, E.P. EU sanctions on Russia: Update, economic impact and outlook, 2023. https://www.europarl.europa.eu/thinktank/en/document/EPRS_BRI(2023)753943 [Accessed: (23-11-2023)].
- PISONERO-HERNANDEZ, A.; MULETIER, Z. Key findings of the 2023 Report on Ukraine, 2023. https://ec.europa.eu/commission/presscorner/detail/en/qanda_23_5631 [Accessed: (23-11-2023)].
- Arce, O.; Koester, G.; Nickel, C. One year since Russia’s invasion of Ukraine – the effects on euro area inflation, 2023. https://www.ecb.europa.eu/press/blog/date/2023/html/ecb.blog20230224~3b75362af3.en.html [Accessed: (27-11-2023)].
- Toh, M.; Ogura, J.; Humayun, H.; Yee, I.; Cheung, E.; Fossum, S.; Maruf, R. The list of global sanctions on Russia for the war in Ukraine, 2022. https://edition.cnn.com/2022/02/25/business/list-global-sanctions-russia-ukraine-war-intl-hnk/index.html [Accessed: (27-11-2023)].
- Funakoshi, M.; Lawson, H.; Deka, K. Tracking sanctions against Russia, 2022. https://www.reuters.com/graphics/UKRAINE-CRISIS/SANCTIONS/byvrjenzmve/ [Accessed: (23-11-2023)].
- Wikipedia. International sanctions during the Russian invasion of Ukraine, 2023. https://en.wikipedia.org/wiki/International_sanctions_during_the_Russian_invasion_of_Ukraine [Accessed: (23-11-2023)].
- Mariusz, H.; Pawlak, K.; Stefańczyk, J.; Gołębiewski, J. Agri-Food Supply and Retail Food Prices during the Russia–Ukraine Conflict’s Early Stage: Implications for Food Security. Agriculture 2023, 13. [CrossRef]
- Lane, P.R. Inflation Diagnostics, 2022. https://www.ecb.europa.eu/press/blog/date/2022/html/ecb.blog221125~d34babdf3e.en.html [Accessed: (23-11-2023)].
- Evangelos, C.; Bruno, F.; Lukas, H.; Chiara, O. The impact of the recent rise in inflation on low-income households. Economic Bulletin, Box 4, Issue 7 2022.
- News, B. West to cut some Russian banks off from Swift, 2022. https://www.bbc.com/news/world-60542433 [Accessed: (23-11-2023)].
- News, B. China State Banks Restrict Financing for Russian Commodities, 2022. https://www.bloomberg.com/news/articles/2022-02-25/chinese-state-banks-restrict-financing-for-russian-commodities#xj4y7vzkg [Accessed: (23-11-2023)].
- Melander, I.; Baczynska, G. EU targets Russian economy after ’deluded autocrat’ Putin invades Ukraine, 2022. https://www.reuters.com/world/europe/eu-launch-new-sanctions-against-russia-over-barbaric-attack-ukraine-2022-02-24/ [Accessed: (23-11-2023)].
- Liberty, R.F.E. Western Countries Agree To Add Putin, Lavrov To Sanctions List, 2022. https://www.rferl.org/a/eu-sanctions-putin-lavrov/31723682.html [Accessed: (23-11-2023)].
- Poursina, D.; Aleks Schaefer, K.; Hilburn, S.; Johnson, T. Economic impacts of the Black Sea Grain Initiative. Journal of Agricultural Economics 2024, 75, 457–464. [CrossRef]
- Kuhla, K.; Puma, M.; Otto, C. International cooperation was key to stabilize wheat prices after the Russian Invasion of Ukraine. Commun Earth Environ 2024, 5. [CrossRef]
- Jagtap, S.; Trollman, H.; Trollman, F.; Garcia-Garcia, G.; et al. The Russia-Ukraine Conflict: Its Implications for the Global Food Supply Chains. Foods 2022, 11(14), 2098. [CrossRef]
- Zhang, Z.; Abdullah, M. J.and Xu, G.; et al. Countries’ vulnerability to food supply disruptions caused by the Russia–Ukraine war from a trade dependency perspective. Scientific Reports 2023, 13, 16591. [CrossRef]
- Faqin, L.; Xuecao, L.; Ningyuan, J.; Fan, F.; Hai, H.; et al. The impact of Russia-Ukraine conflict on global food security. Global Food Security 2023, 36, 2211–9124. [CrossRef]
- Zhang, H.and Jiao, L.; Li, C.; et al. Global environmental impacts of food system from regional shock: Russia-Ukraine war as an example. Humanit Soc Sci Commun 2024, 11, Humanit Soc Sci Commun. [CrossRef]
- Tarek, B.H.; Bilali, H.E. Impacts of the Russia-Ukraine War on Global Food Security: Towards More Sustainable and Resilient Food Systems? Foods 2022, 11, no. 15: 2301. [CrossRef]
- Behnassi, M.; El Haiba, M. Implications of the Russia–Ukraine war for global food security. Nat Hum Behav 2022, 6, 754–755. [CrossRef]
- Höhler, J.; Harmens, I.; Lansink, A.O. The impact of the Russia–Ukraine war on stock prices, profits and perceptions in the food supply chain. Agribusiness 2024, p. 1–19. [CrossRef]
- El Bilali, H.; Ben Hassen, T. Disrupted harvests: how Ukraine – Russia war influences global food systems – a systematic review. Policy Studies 2024, Policy Studies, 310–335. [CrossRef]
- Amat, N.M.; Nugroho, A.D.; Lakner, Z. Impact of the Russian–Ukrainian Conflict on Global Food Crops. Foods 2022. [CrossRef]
- Laber, M.; Klimek, P.; Bruckner, M.; et al. Shock propagation from the Russia–Ukraine conflict on international multilayer food production network determines global food availability. Nature Food 2023, 4, 508–517. [CrossRef]
- Zhou, X.; Lu, G.; Zhicheng, X.; Xiaoqing, Y.; et al. Influence of Russia-Ukraine War on the Global Energy and Food Security. Resources, Conservation and Recycling 2023, 188. [CrossRef]
- Mostafa, N.A.; Abdelwahab, A.H.; Mohab, E.; Giovanni, R. Impacts of COVID-19 and the Russian–Ukrainian Conflict on Food Supply Chain: A Case Study from Bread Supply Chain in Egypt. Sustainability 2024, 16. [CrossRef]
- Kibrom, A.A.; Breisinger, C.; Glauber, J.; Kurdi, S.; Laborde, D.; Siddig, K. The Russia-Ukraine war: Implications for global and regional food security and potential policy responses. Global Food Security 2023, 36, 100675. [CrossRef]
- Walter, F.L.; Fedoruk, M.; Eustachio, J.H.; et al. How the War in Ukraine Affects Food Security. Foods 2023, 12. [CrossRef]
- Hellegers, P. Food security vulnerability due to trade dependencies on Russia and Ukraine. Food Security 2022, 14, 1503–1510. [CrossRef]
- Feng, F.; Jia, N.; Lin, F. Quantifying the impact of Russia–Ukraine crisis on food security and trade pattern: evidence from a structural general equilibrium trade model. China Agricultural Economic Review 2023, 15, 241–258. [CrossRef]
- Kozielec, A.; Piecuch, J.; Daniek, K.; Luty, L. Challenges to Food Security in the Middle East and North Africa in the Context of the Russia–Ukraine Conflict. Agriculture 2024, 14. [CrossRef]
- Martins, A.M. Short-term market impact of Black Sea Grain Initiative on four grain markets. The Journal of Futures Markets 2024, 44, 619–630. [CrossRef]
- Otto, C.; Willner, S.N.; Wehz, L.; Frieler, K.; Levermann, A. Modeling loss-propagation in the global supply network: The dynamic agent-based model acclimate. Journal of Economic Dynamics and Control 2017, 83, 232–269.
- Willner, S.N.; Otto, C.; Levermann, A. Global economic response to river floods. Nat. Clim. Chang 2018. [CrossRef]
- Wenz, L.; Levermann, A. Enhanced economic connectivity to foster heat stress–related losses. Sci. Adv. 2016 2016, 2, e1501026. [CrossRef]
- Kuhla, K.; et al. Future heat stress to reduce people’s purchasing power. PLoS ONE 16(6), e0251210 2021. [CrossRef]
- Arreyndip, N.A. Identifying agricultural disaster risk zones for future climate actions. PLoS ONE 2021, 16, 12. [CrossRef]
- Kuhla, K.; Willner, S.N.; Otto, C.; Geiger, T.; Levermann, A. Ripple resonance amplifies economic welfare loss from weather extremes. Environmental Research Letters 2021, 16(11), 114010. [CrossRef]
Figure 1.
The figure shows Ukraine’s cereal trading partners with countries such as China, Egypt, Indonesia, Spain, the Netherlands, Turkey, and Tunisia being the main trading partners. The data was taken from the World Integrated Trade Solutions (WITS) found at https://wits.worldbank.org/
Figure 1.
The figure shows Ukraine’s cereal trading partners with countries such as China, Egypt, Indonesia, Spain, the Netherlands, Turkey, and Tunisia being the main trading partners. The data was taken from the World Integrated Trade Solutions (WITS) found at https://wits.worldbank.org/
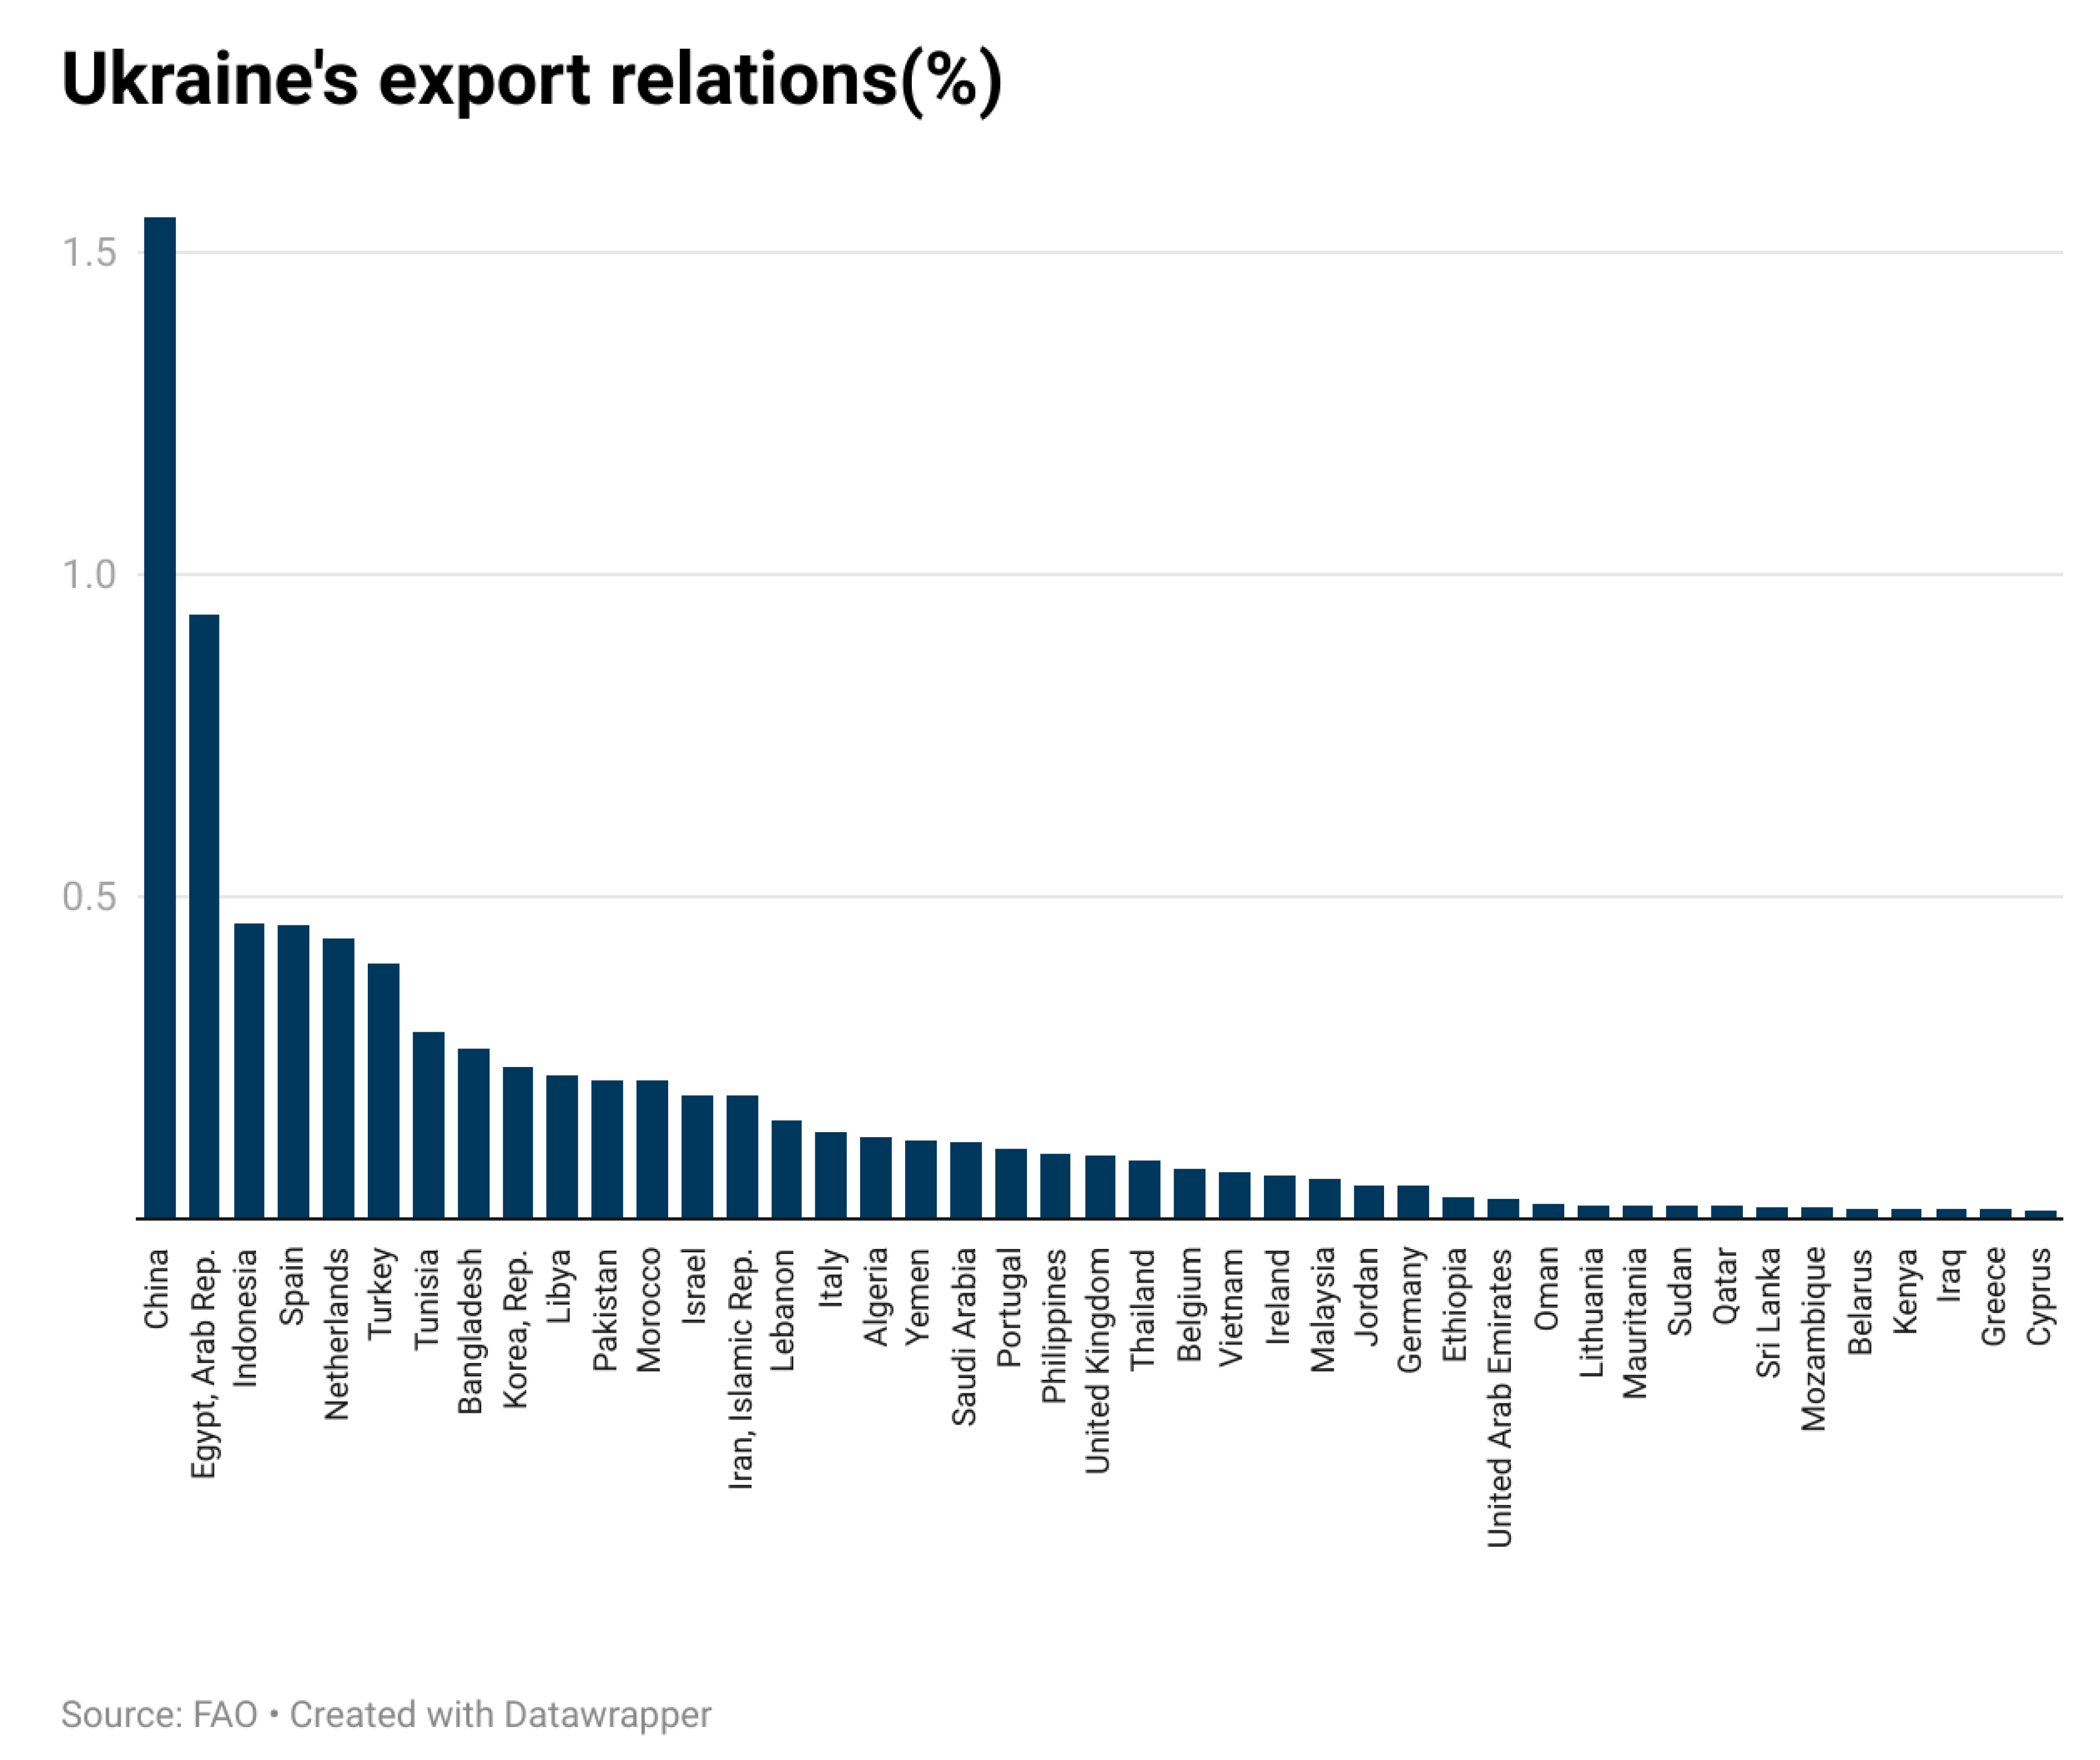
Figure 2.
A global share of Corn and Wheat Production averaged from 2011 to 2022 is shown in (a). (b) and (c) is Ukraine’s and Russia’s Corn and Wheat Production time series respectively over the study period. (d) shows the changes in Ukraine’s Corn and Wheat production with reference to the 2012-2021 baseline. (e) and (f) presents the top 10 Corn and Wheat producing regions respectively. While (g) shows the top 10 most produced items in Ukraine. This figure shows Ukraine as a global producer of corn and wheat, corn and wheat being among the top three (3) of Ukraine’s most produced items, and Ukraine being the only region that was impacted by their war with Russia as per the time series. The data was taken from the Food and Agricultural Organization of the United Nations (FAO) found at https://www.fao.org/faostat/en/#data/QCL.
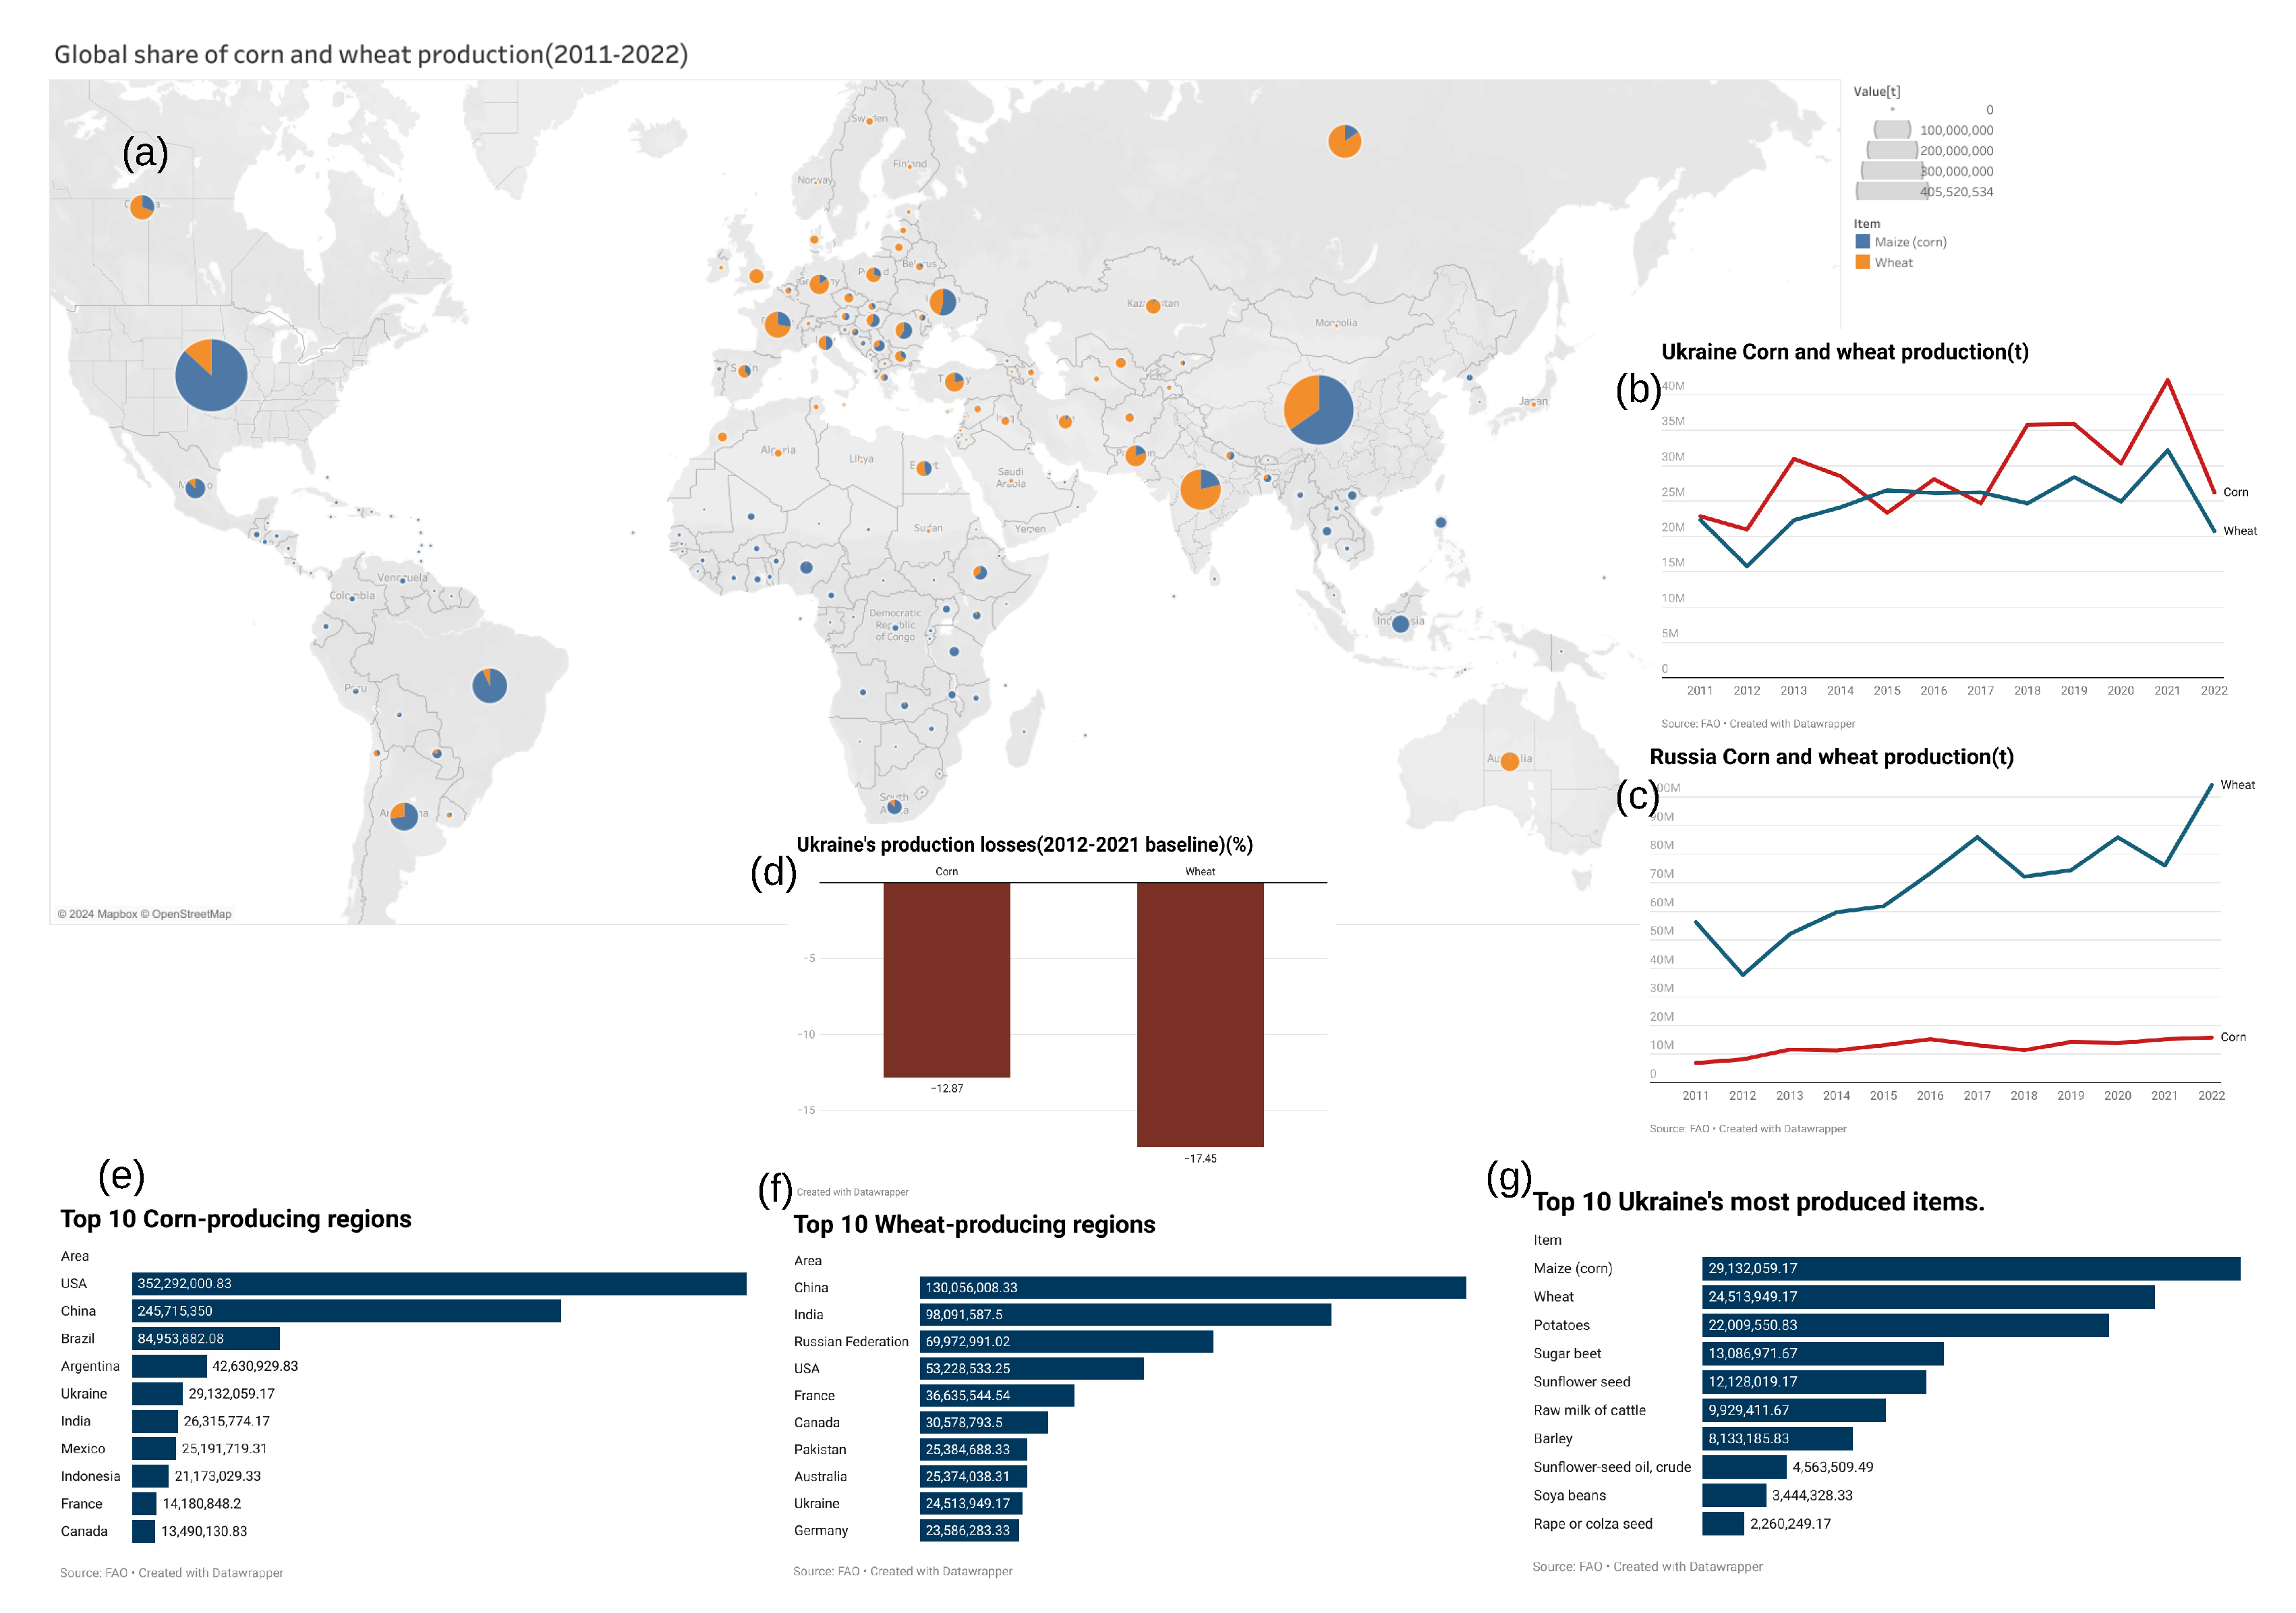
Figure 3.
Global change in Corn production value (a) and total losses (b) compared to the 2012-2022 baseline. (c) presents the top 20 most and least impacted regions. Negative production values (red) are regions most impacted while positive production values (blue) are regions least impacted. For total losses, negative losses (red) are regions least impacted while positive losses (blue) are regions most impacted. Germany, Ukraine, Poland, and Belgium suffer the most production value losses while China, the USA, the Netherlands, and Argentina are the least affected. For total losses, Ukraine, China, Venezuela, and Korea suffer the most total losses while Germany, Poland, the USA, and Belgium suffer the least total losses. The maps were generated using the Datawrapper online tool found at https://www.datawrapper.de/.
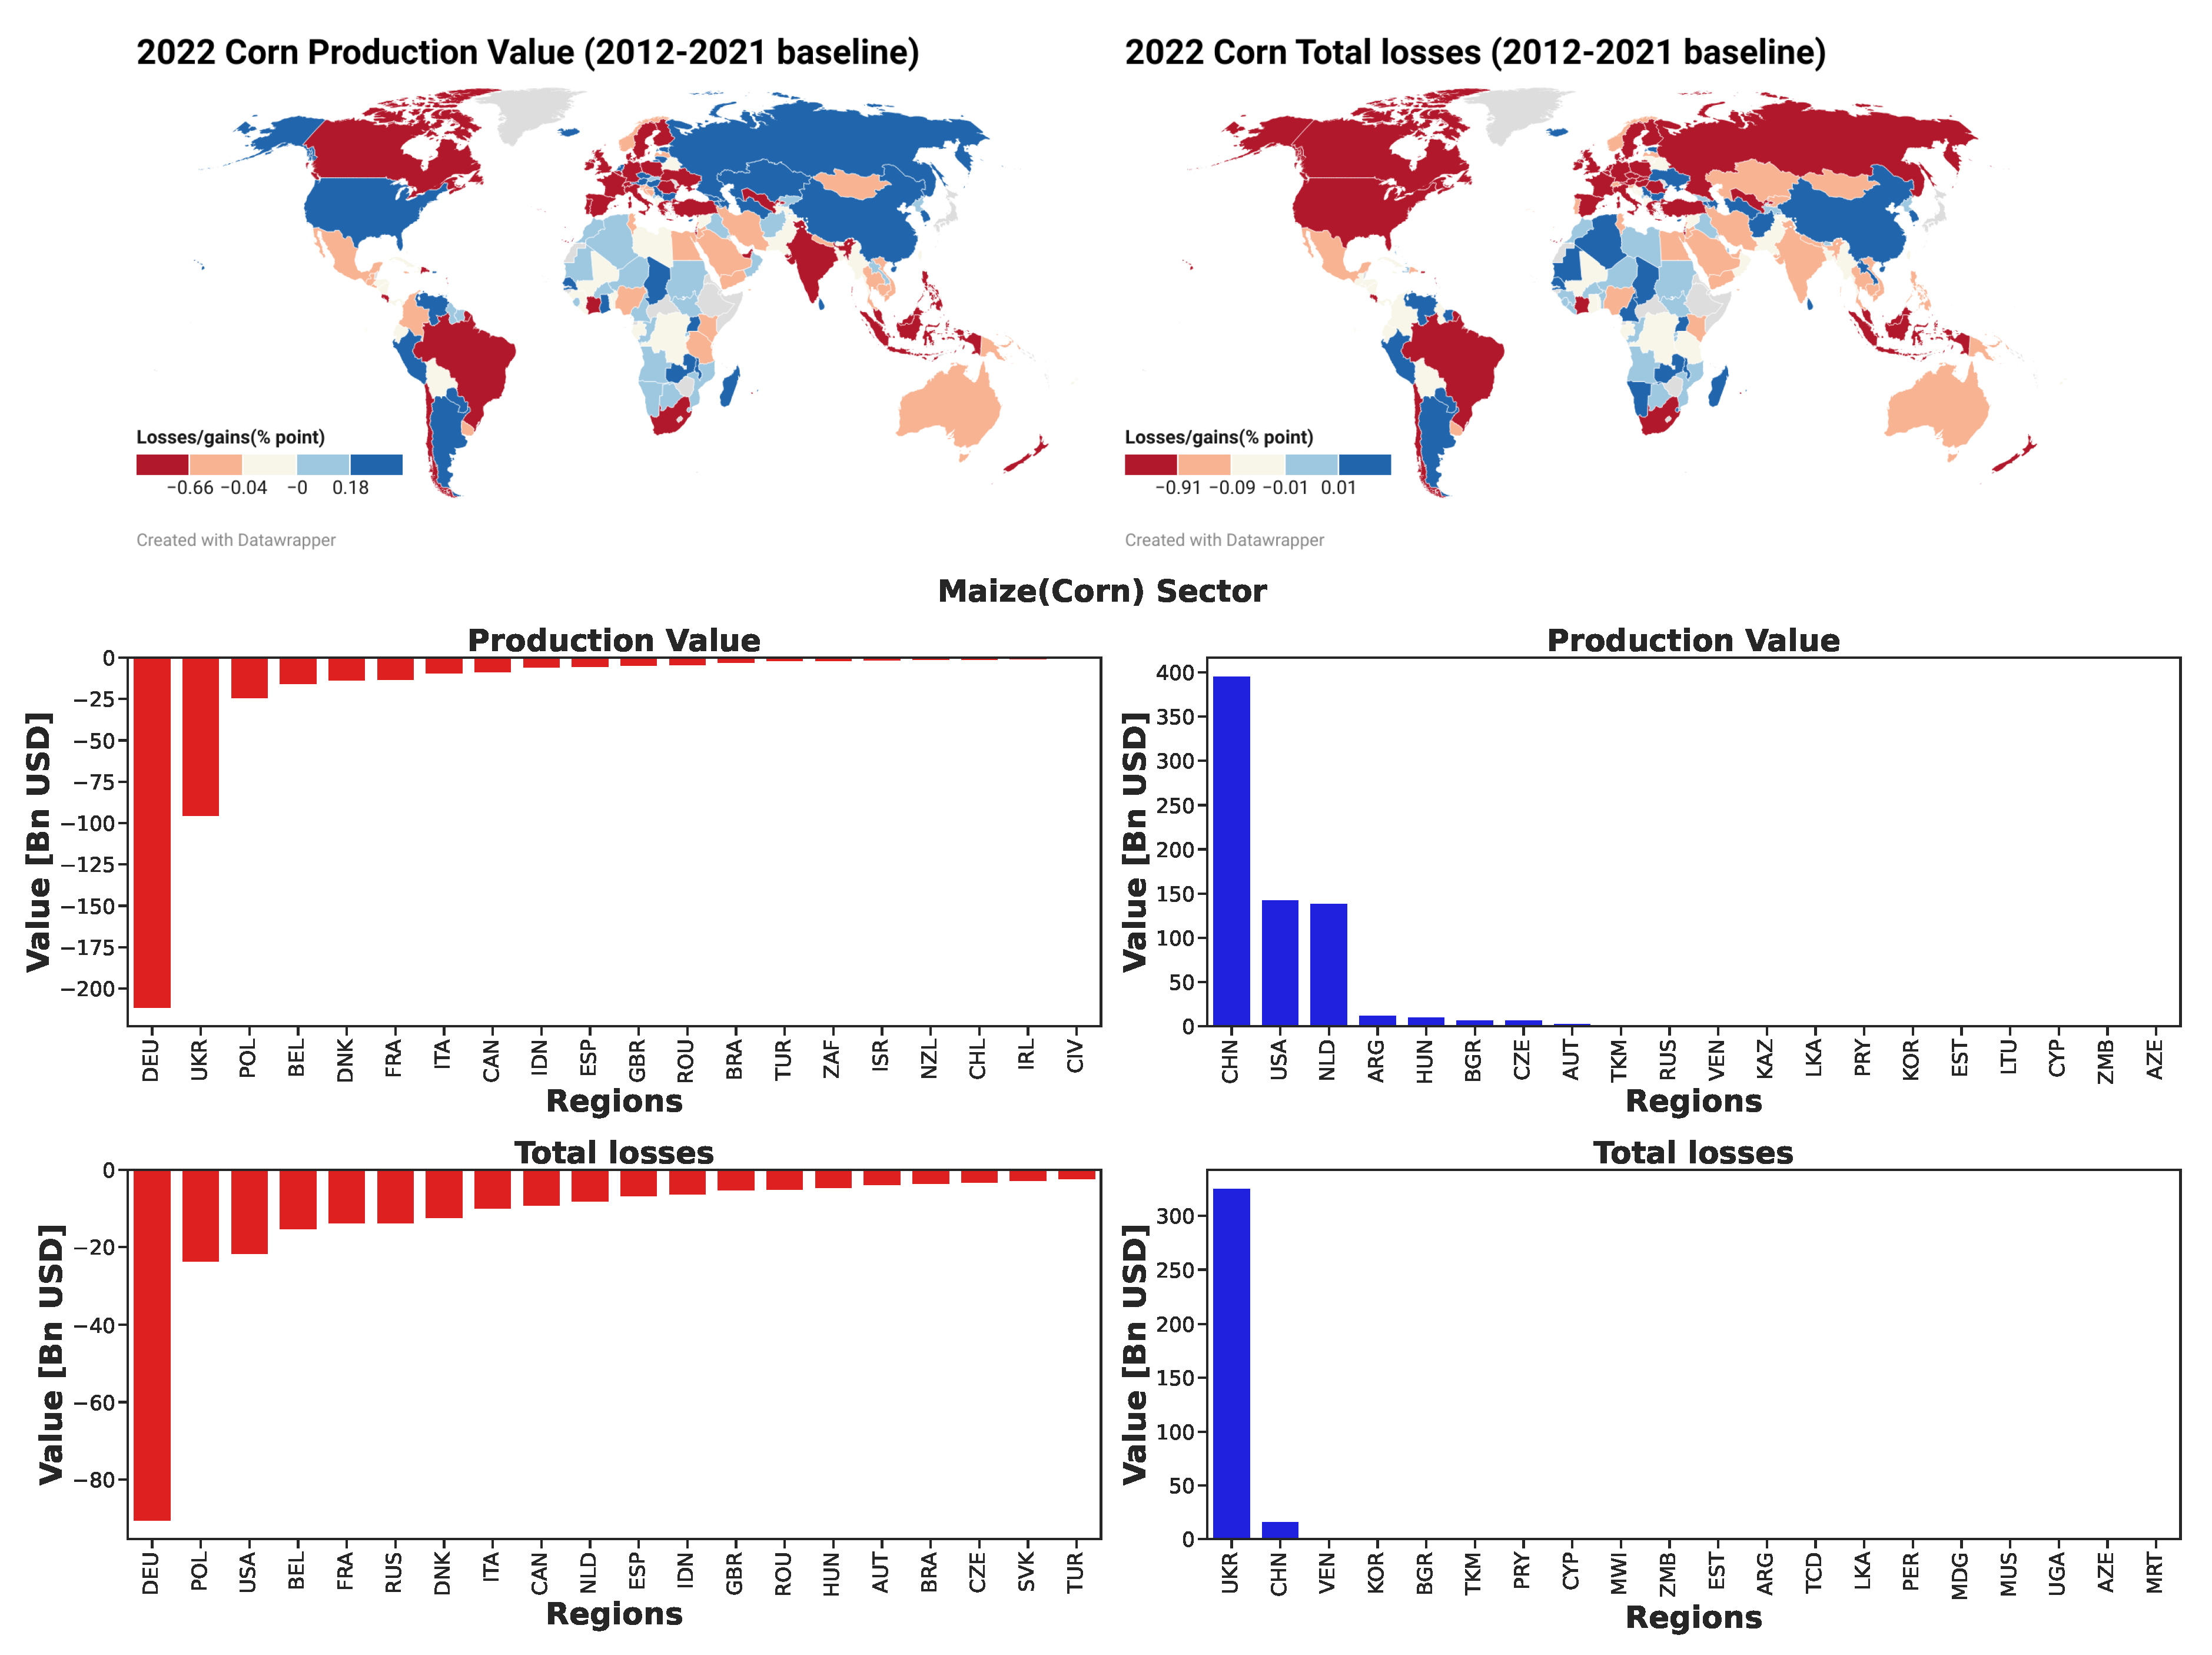
Figure 4.
Global change in Wheat production value (a) and total losses (b) compared to the 2012-2022 baseline. (c) presents the top 20 most and least impacted regions. Negative production values (red) are regions most impacted while positive production values (blue) are regions least impacted. For total losses, negative losses (red) are regions least impacted while positive losses (blue) are regions most impacted. Russia, Germany, Ukraine, and Canada suffer the most production value losses while China, Kazakhstan, France, and Uzbekistan, are the least affected. For total losses, Ukraine, Kazakhstan, Uzbekistan, and China, suffer the most total losses while Russia, Germany, the Netherlands, and France, suffer the least total losses. The maps were generated using the Datawrapper online tool found at https://www.datawrapper.de/.
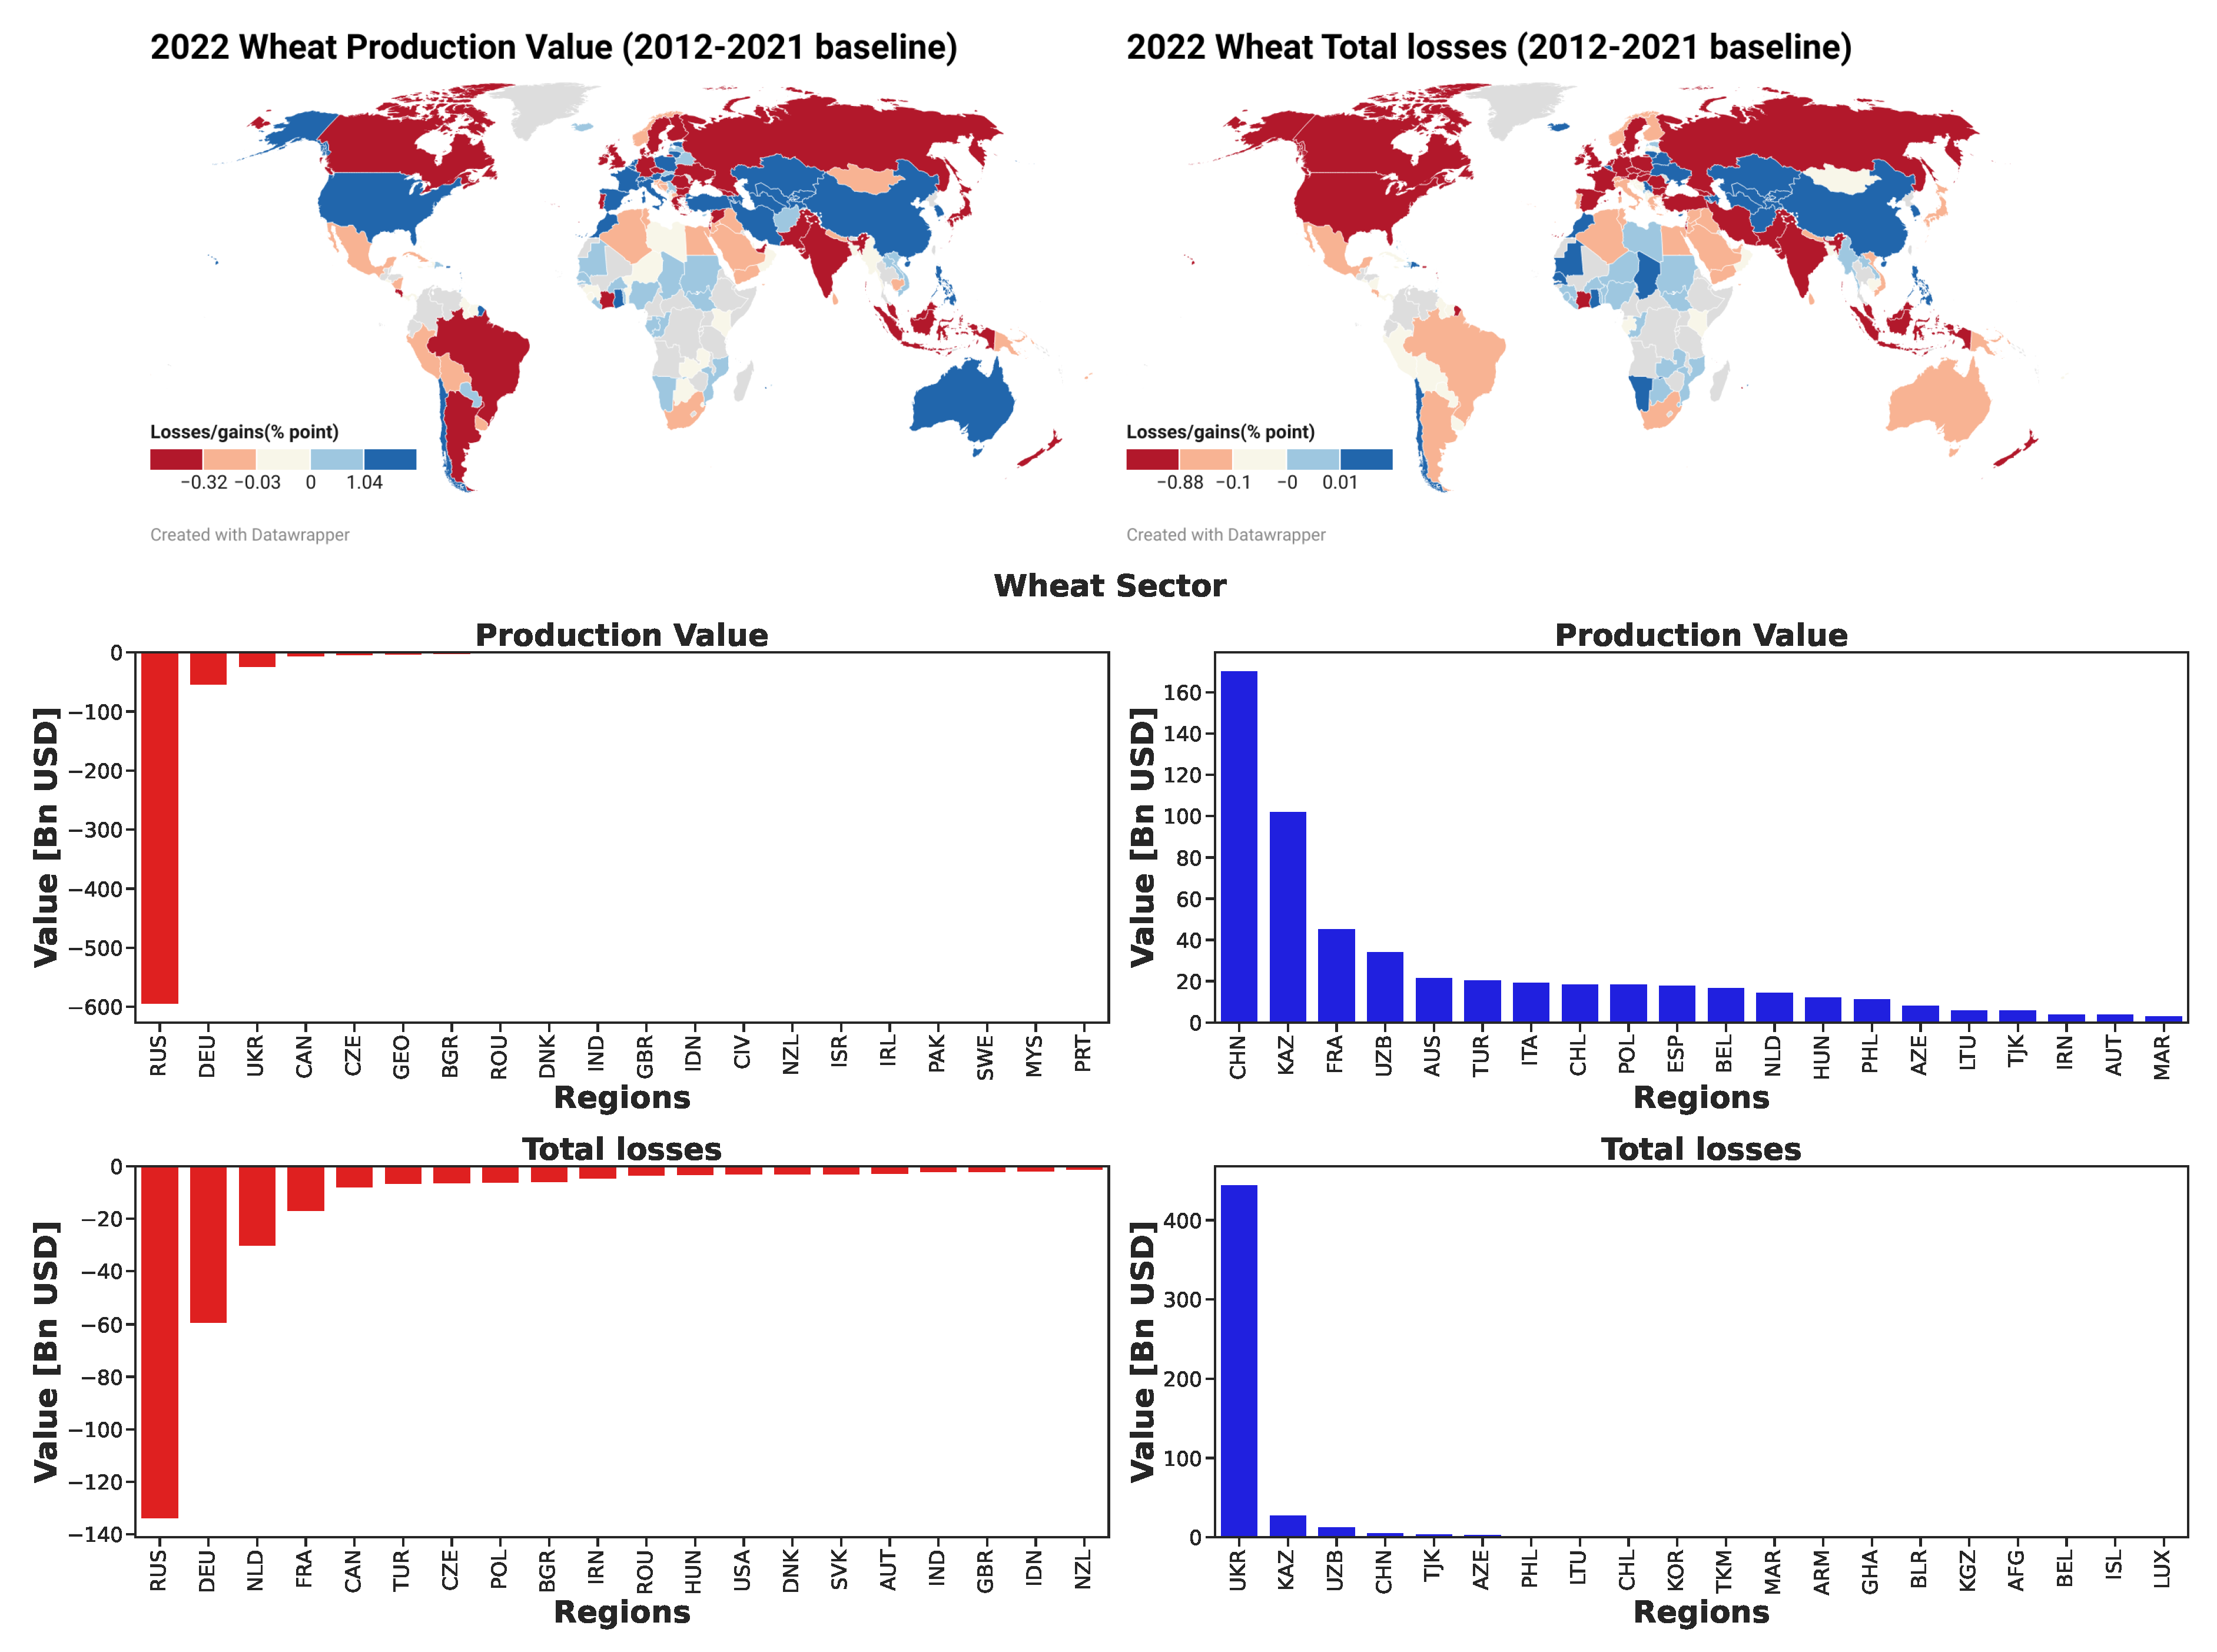
Figure 5.
Shocks on regional economic blocs during the first year of hostilities. The maize sector is shown to be the hardest hit globally compared to the wheat sector, with the EU, US, China, South America, and Africa being the hardest hit in the maize sector, while the BRICKS and Oceania are the hardest hit in the wheat sector. Looking at the total losses, China shows economic recovery in the corn and wheat sectors, followed by a moderate recovery in South America, the EU, Africa, and BRICKS states.
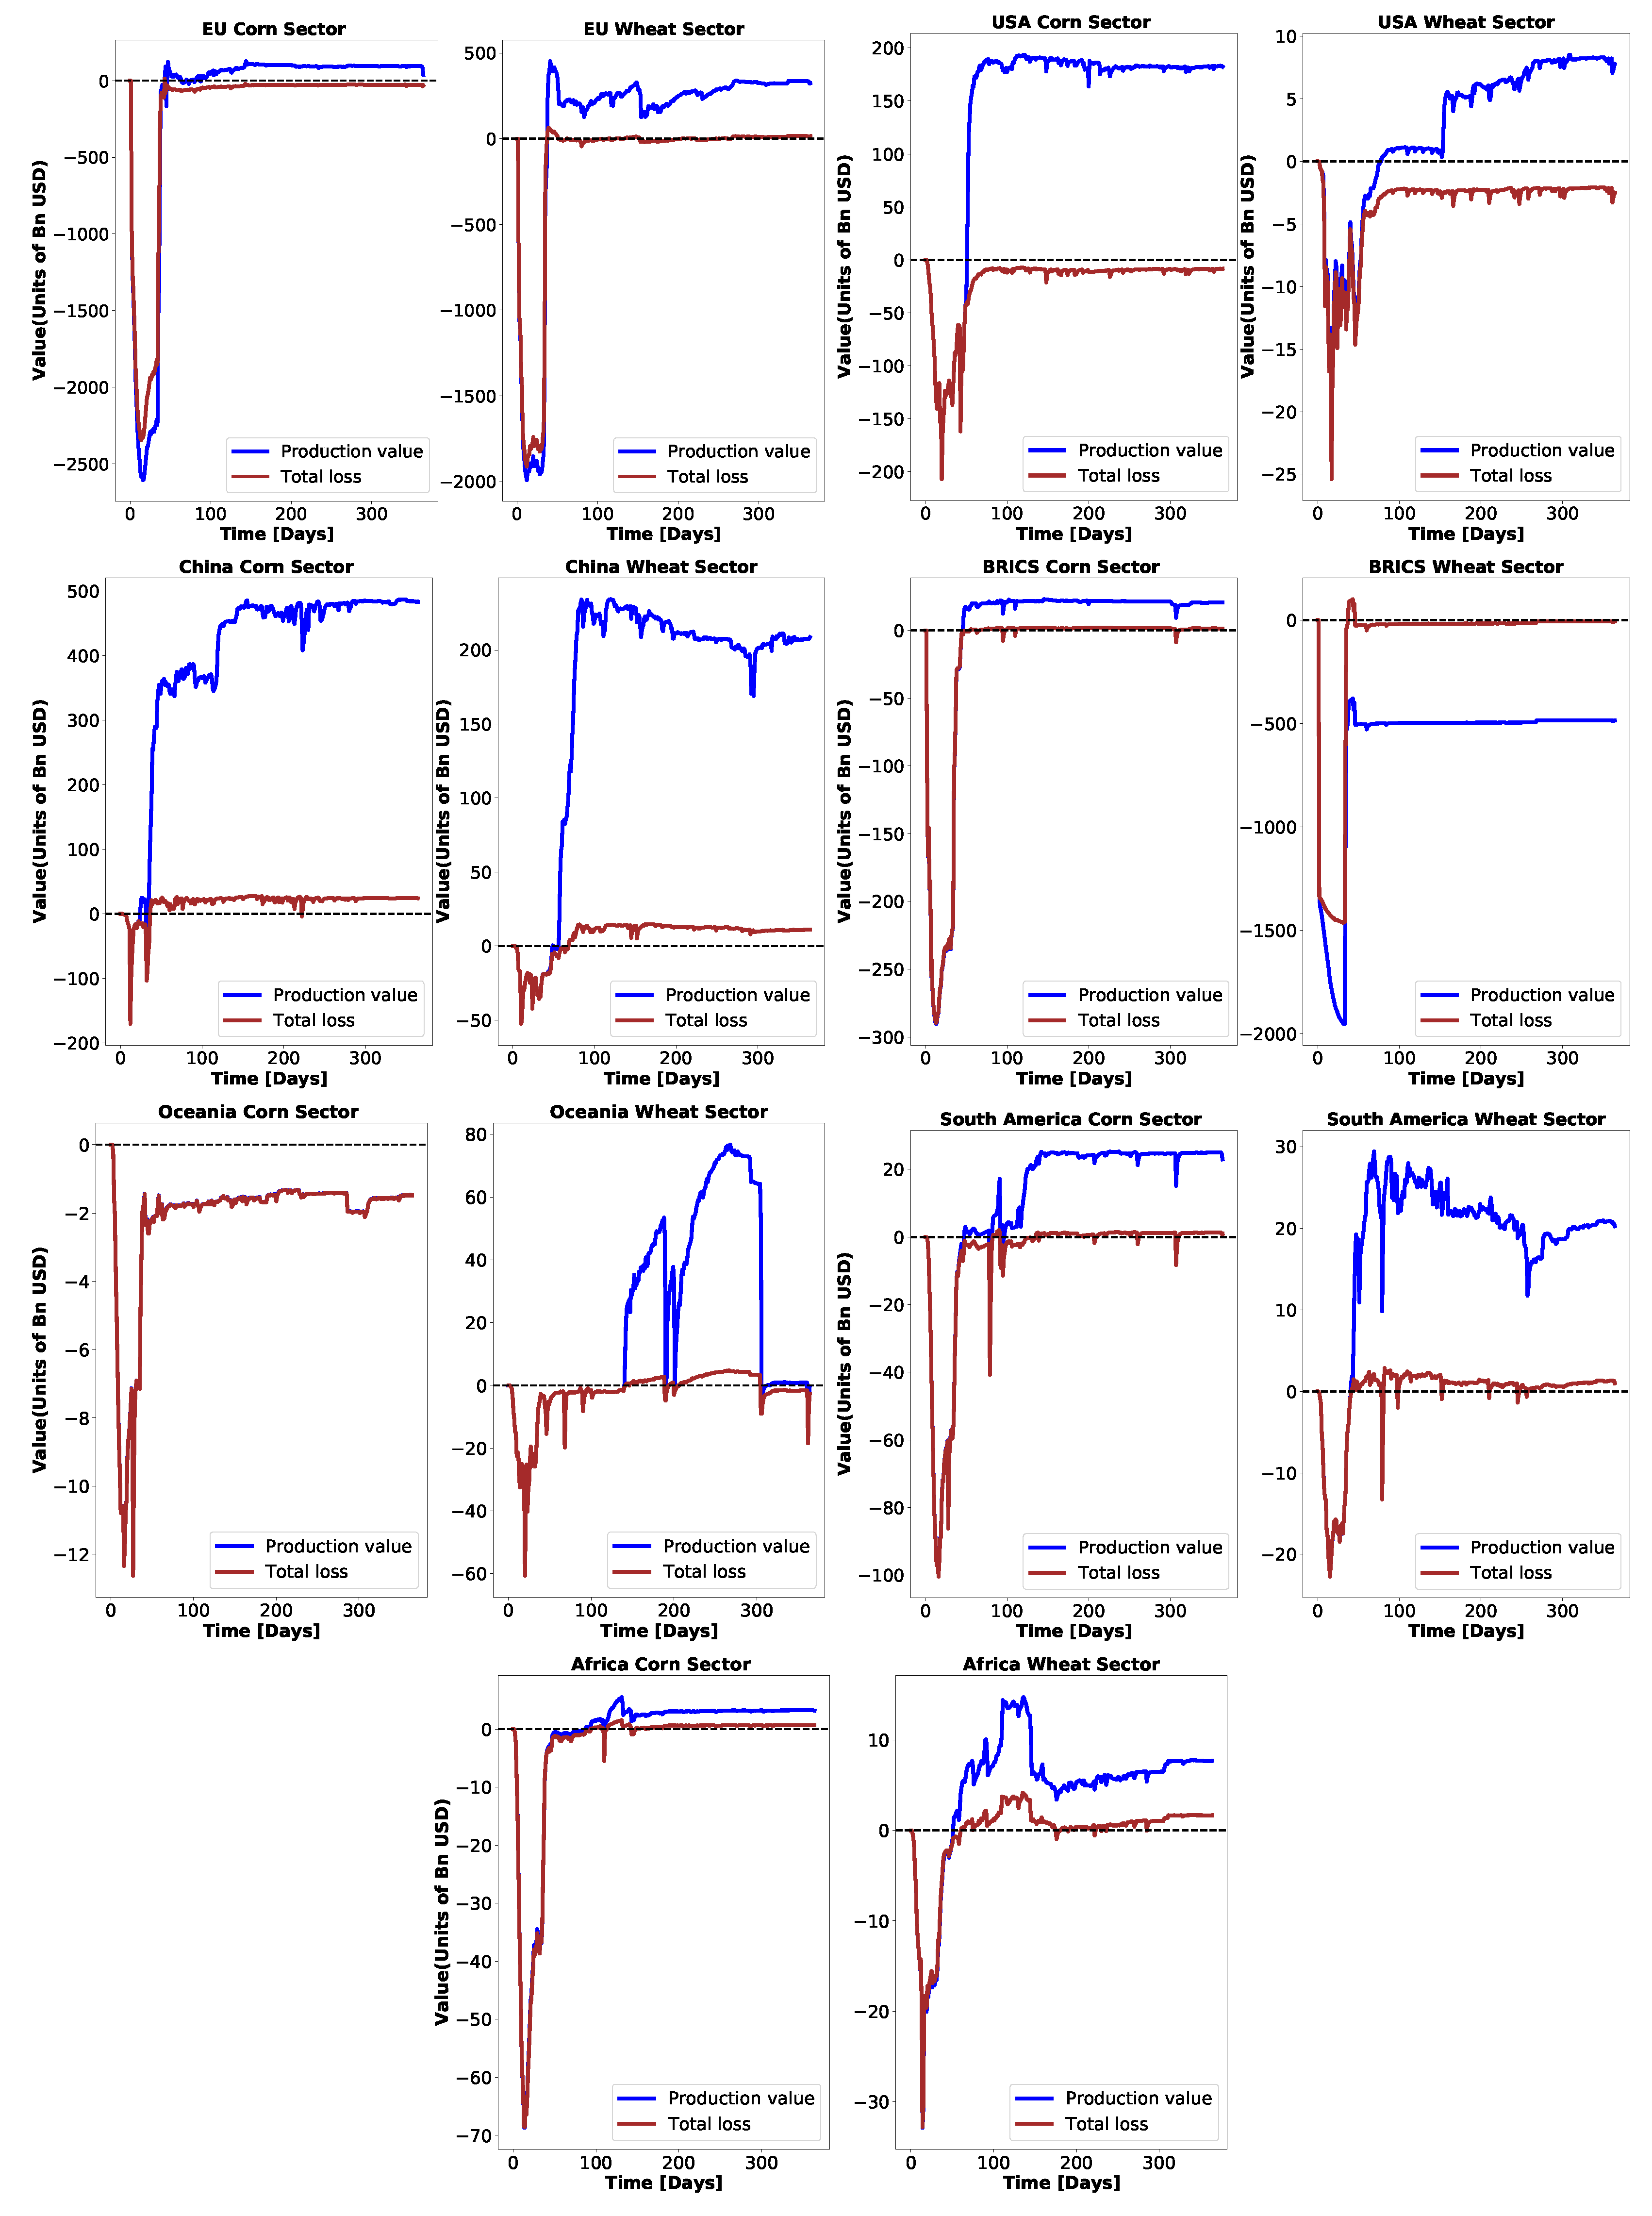
Figure 6.
Continental impacts during the first year of hostilities. Plots show Europe suffers the most total losses in the Corn and Wheat sectors and the most drop in Corn production value while Asia experiences a significant drop in Wheat production value. North America is shown to be the least impacted compared to all continents.
Disclaimer/Publisher’s Note: The statements, opinions and data contained in all publications are solely those of the individual author(s) and contributor(s) and not of MDPI and/or the editor(s). MDPI and/or the editor(s) disclaim responsibility for any injury to people or property resulting from any ideas, methods, instructions or products referred to in the content. |
© 2025 by the authors. Licensee MDPI, Basel, Switzerland. This article is an open access article distributed under the terms and conditions of the Creative Commons Attribution (CC BY) license (http://creativecommons.org/licenses/by/4.0/).
Copyright: This open access article is published under a Creative Commons CC BY 4.0 license, which permit the free download, distribution, and reuse, provided that the author and preprint are cited in any reuse.


