
Submitted:
19 January 2025
Posted:
20 January 2025
You are already at the latest version
Abstract
Reviews and bibliometrics can assist researchers in acquiring structural knowledge. However, reviews may not always be available for every specific topic, and bibliometrics fails to consider the actual content of papers. AI tools can facilitate the acquisition of detailed information more easily, but their reliability can be questionable, and researchers must first identify the relevant papers. This study introduces a framework, literature map, that integrates the actual content of papers into vectors and clusters them. These clusters are then translated into a map view, with customized summarizations generated by a large language model to reveal structural knowledge. Graph knowledge and text chunks are extracted from the internal text of the literature and integrated into a graph database, enabling both global and local searches for detailed knowledge. The literature map framework is both universal and customizable, and can serve as a complement to reviews and bibliometrics. A video example has been uploaded to YouTube at www.youtube.com/watch?v=phkr9Efv9fI.
Keywords:
Literature map
; Bibliometrics
; Graph knowledge
; HybirdRAG
Introduction
All researchers engage with literature; however, a significant portion of their time is often spent searching for the necessary literature. Sometimes, researchers read literature to gain structural knowledge, such as understanding the main concepts, methodologies, and viewpoints within a specific field. Occasionally, they may find a review that perfectly satisfies their curiosity. Yet, the challenge with reviews is that they are not always available and may not meet personalized needs. Bibliometrics is another popular choice. Bibliometrics analysis relies heavily on citation or co-citation relationships. For instance, a simplified co-citation network of three papers on global warming, as depicted in Figure 1A, is based on common bibliometric methods. However, upon closely examining the content of these three papers, the network should more accurately resemble Figure 1B. The issue with bibliometrics is that it does not take into account the actual content of the literature.
Researchers also read literature to acquire detailed knowledge. Numerous AI tools can facilitate this process, such as ChatPDF (chatpdf.com) and ChatGPT (chatgpt.com). However, directly asking questions to these AI tools may not always yield accurate results due to their hallucinations [1]. A more effective approach is for researchers to upload the relevant documents to these tools and inquire about specific details. This, however, presupposes that they have already identified the appropriate literature, which often is the most time-consuming part. Some tools, like SCISPACE (typeset.io), enable researchers to pose targeted questions, but they may not always delve into details.
The present study introduces a framework known as the literature map, designed to reveal both structural and detailed knowledge within the literature. This framework embeds literature into vectors, clusters the documents, and visually represents the inner structure in map form. Each cluster is accompanied by a summary generated by a large language model (LLM). Both GraphRAG [2,3] and VectorRAG [4] are utilized to enhance the retrievability of literature, facilitating both global and local searches. This literature map framework is versatile and can be applied across various fields, potentially aiding researchers in more efficiently acquiring both structural and detailed knowledge.
Results
Data Cleaning and Traditional Bibliometric Analysis
A total of 8,179 papers were collected, and after the cleaning process, 7,220 papers remained. Subsequently, 65 clusters were identified using CiteSpace [5].
Literature Embedding and Clustering
Various embedding-clustering combinations were tested to determine their effectiveness. The highest same-cluster ratio, at 0.64, was achieved using spectral clustering with the BAAI/bge-small-en-v1.5 [6] embedding and Euclidean distance as the distance metric (Table 1). A total of 72 clusters were identified, and this embedding-clustering pair was selected for further analysis. Some embedding-clustering pairs were not evaluated because the number of clusters they produced deviated significantly from the results obtained through traditional bibliometric analyses.
Hybrid RAG of Literature
A total of 451 open access papers were collected and processed. These papers were digested and imported into Neo4j [9], incorporating both graph knowledge and text chunks. As depicted in Figure 3A, both entities and relationships were stored in the Neo4j database, each associated with the corresponding Digital Object Identifier (DOI) of the paper from which they were derived. Figure 3B illustrates that text chunks were also stored in the database, along with their source. This approach enables both GraphRAG and VectorRAG, facilitating the global and local retrieval of literature.
Literature Map
A literature map was constructed, metaphorically representing papers as cities and clusters as states (Figure 4). Figure 4A illustrates the capitals for clusters, with pop-up tips displaying customized information. Additionally, a plugin was deployed on the right to display customized keywords extracted by a LLM, offering a rapid overview of the clusters. Figure 4B demonstrates that upon hovering over each node, a pop-up tip is triggered, revealing the title, DOI, and abstract of the corresponding paper. An additional plugin was provided on the right for users to pose questions. When a user inputs a question, the backend application programming interface (API) not only retrieves an answer from the literature but also supplies DOIs for the papers containing the relevant context. This feature allows users to verify the data source. A video example has been uploaded to YouTube at www.youtube.com/watch?v=phkr9Efv9fI, and readers are encouraged to view it for a more immediate impression.
Discussion
The present study introduces an innovative framework named as the literature map, designed to offer a universal solution to meet researchers’ daily needs for both structural and detailed knowledge. Traditionally, literature reviews have been instrumental in helping researchers acquire structural knowledge. However, it is not always possible to find reviews that precisely cover their specific demands. Bibliometrics is also a valuable tool, but it falls short in considering the actual content of the literature. Additionally, while AI tools can be helpful, they are not always reliable and may lack the depth required for detailed analysis.
Although these tools may not consistently satisfy researchers’ needs, this does not imply that the framework presented in this study is a competitive replacement for them. On the contrary, the current framework is designed to serve as a universal complementary tool, addressing researchers’ personalized demands. Readers are strongly encouraged to view the video example at www.youtube.com/watch?v=phkr9Efv9fI, to gain a better understanding of its application
Significant programming and engineering efforts have been dedicated to the present study. In addition to the embedding-clustering pairs presented in the results, various embedding models were evaluated, including sentence-transformers/paraphrase-xlm-r-multilingual-v1 [10], universal-sentence-encoder [11] and Doc2Vec [12]. A range of clustering algorithms were also tested, such as Density-Based Spatial Clustering of Applications with Noise [13], Hierarchical clustering [14], and Weighted Correlation Network Analysis [15]. However, these alternative embedding and clustering methods did not yield satisfactory results, and thus, they were not included in the final analysis.
In the current framework, lines connecting nodes are intentionally omitted. While it would be a straightforward task to introduce lines between nodes, as is common in traditional bibliometric methods where lines represent citation or co-citation relationships, doing so could also make the literature map appear more like a traditional map. However, such an addition would not enhance users’ ability to gain structural or detailed knowledge and would come at the cost of increased complexity. This rationale also informs why only the minimum spanning tree algorithm and spring layout algorithm were tested for visualizing the connections between nodes. And no more algorithms were tested.
The current framework is designed to be both universal and customizable, offering broad applicability to various topics and extending its utility beyond literature analysis. Readers have the option to employ LLMs to tailor the summarizations of each cluster, thereby unveiling more personalized structural knowledge within each subject area. Additionally, a customized legend can be created to serve specific purposes, enhancing the interpretability of the literature map. The visualization style can be further customized, for instance, by encoding node size with user-defined information or by rendering the map in three dimensions to provide a more immersive visual experience.
A lot of work could be done in the future upon the current literature map framework, including the refinement of map layout algorithms and the alignment of multilingual data. It would be worthwhile to explore canonical methods, such as burst detection techniques commonly used in bibliometrics, particularly if temporal dimensions are incorporated into the framework. As depicted in Figure 2, the low consistency among various embedding-clustering pairs suggests that the choice of embedding and clustering methods significantly influences the final outcome. Given that only a limited number of embedding-clustering pairs have been tested thus far, further exploration of additional methods is needed. As indicated in Table 1, PubMedBERT [16] did not achieve high performance; however, this does not necessarily imply that domain-specific embedding models are ineffective. On the contrary, domain- or project-specific embedding models may significantly enhance performance with appropriate fine-tuning. Nonetheless, additional experiments are required to validate this hypothesis. Further programming efforts could integrate the literature map within web browsers, making it accessible to the public.
One major limitation of the present study is that each paper is classified into only one cluster, which is a common strategy adopted by bibliometrics too. A paper could involve several topics at the same time and has the potential to be classified into several clusters. Some algorithm like hierarchical navigable small world [17] may fit this situation. But its visualization [18] is not easy for human to understand and researcher could not gain structural knowledge from it. Meanwhile, if enough literature is collected, all clusters could be identified and comprehensive structural knowledge could also be revealed. This could justify both canonical bibliometrics and the current framework adopting the same clustering strategy. The current study included 7,220 papers and generate 72 clusters, which is quite close to the 65 clusters identified with CiteSpace. Therefore, comprehensive structure should be successfully revealed in the present study. In the future, well fine-tuned long context window LLMs could be a solution for this problem, by digesting all literature at once.
A major limitation of the present study is that each paper is assigned to only one cluster, a strategy commonly employed in bibliometrics too. However, a paper may encompass multiple topics and could potentially be classified into several clusters. Algorithms such as the Hierarchical Navigable Small World [17] may be more suitable for handling such complex categorizations. Yet, the visualization [18] of such algorithms can be challenging for human comprehension, and researchers may struggle to extract structural knowledge from them. Concurrently, if a sufficient corpus of literature is collected, all clusters could be identified and comprehensive structural knowledge could also be revealed. This could validate the use of similar clustering strategies in both traditional bibliometrics and the current framework. The current study included 7,220 papers and generated 72 clusters, which is notably close to the 65 clusters identified using CiteSpace. Thus, the study likely succeeded in revealing a comprehensive structure. In the future, LLM with long context windows could offer a solution to this challenge by processing all literature simultaneously.
Methods
Literature Collection, Cleaning and Traditional Bibliometric Analysis
An arbitrary topic was selected from the Web of Science Core Collection as an illustrative example. The search query combined the terms ’covid’ (All Fields) and ’mrna vaccine’ (All Fields). The bibliometric data retrieved included abstracts and references. Duplicate records were removed to ensure that only unique entries were retained. Records lacking an abstract were also excluded. A traditional bibliometric analysis was conducted using CiteSpace, with the aim of identifying the number of clusters within the topic. The analysis was configured to consider the top 30% of papers and a maximum of 500 papers per slice; all other parameters were set to their default values.
Literature Embedding and Clustering
To ensure the accurate representation of the literature’s meaning, the initial step involves embedding the literature into vectors, which means transforming text into numerical representations within a high-dimensional space [19,20]. For simplicity, only the abstracts of the literature were embedded. Several embedding models were tested, including BAAI/bge-small-en-v1.5, sentence-transformers/LaBSE [21], sentence-transformers/stsb-roberta-base [10], microsoft/BiomedNLP-BiomedBERT-base-uncased-abstract (formerly PubMedBERT). Both cosine similarity and Euclidean distance were employed to calculate the distances between abstracts. Subsequently, clustering was conducted using Affinity Propagation [22] and Spectral Clustering algorithms.
Due to the absence of ground-truth labels for the data, and the variation in cluster labels among different embedding-clustering pairs for each record, traditional evaluation methods could not be applied to the clustering results. Record pairs that appeared in at least two different embedding-clustering pairs were manually filtered to retain only those that were highly similar. The successful co-occurrence ratios, or same-cluster ratios, of these record pairs were then calculated for each embedding-clustering pairs. The consistency among different embedding-clustering configurations was evaluated using the Adjusted Rand Index and Normalized Mutual Information.
Hybrid Retrieval Augmented Generation (RAG) of Literature
For the purpose of enabling both global and local retrieval of literature, GraphRAG and VectorRAG were utilized. To simplify the process, only the top-most cited open-access papers in each cluster were selected. These papers were collected and parsed using Grobid [23] to extract relevant information and exclude references. Graph knowledge, including entities and relationships, was then extracted from these papers with llama3.1 [24], powered by Ollama (ollama.com). This graph knowledge was subsequently inputted into Neo4j, a graph database. Concurrently, the text of these papers was chunked and embedded into Neo4j, facilitating hybrid retrieval. DOIs of these papers were also tagged with corresponding data to ensure source tracing. An API was developed, enabling users to input questions about the literature. The API performs both graph and vector retrieval for user’s questions. Llama3.1 extracts answers from the retrieved data and sends them back to the user, along with the DOIs of the corresponding papers.
Literature Map
Papers served as nodes within the literature map. Initially, the distribution of papers within each cluster was calculated and finally merged to form a comprehensive literature map. The minimum spanning tree algorithm from SciPy [25] and the spring layout algorithm from NetworkX [26] were utilized to determine the distribution of papers within each cluster. Subsequently, hierarchical clustering [14] was conducted on all identified clusters. These clusters were assembled sequentially, following the sequence established by the hierarchical clustering. The layout of all papers was then converted into GeoJSON format to facilitate input into QGIS [27], incorporating geographical information.
Once inputted into QGIS, the borders of each cluster were drawn to distinguish them from each other, resulting in distinct visual representations akin to different states. Nodes, representing papers in the literature or cities on a map, were given different colors to distinguish between different clusters (or states). The size of nodes was set proportionally to their measured similarity with other nodes within the same cluster. Capitals were calculated as centroid for each cluster and labeled in the literature map. Pop-up tips were enabled for each capital, with customized information generated by Kimi [28], an AI assistant capable of processing extensive context. To exemplify, Kimi provided summaries of the main subjects, methods, and conclusions for each cluster. Pop-up tips were also enabled for each node, displaying the title, DOI, and abstract. Continuous zooming and level-of-detail display features were enabled, enhancing the interface to more closely resemble a map. In traditional maps, lines between nodes usually indicate transportation routes. In the current literature map framework, lines connecting nodes were omitted to enhance clarity.
To enhance the clarity of the literature’s structure, a QGIS plug-in was developed to function as a map legend. To exemplify, Kimi extracted the top keywords to reveal the main topics within each cluster. Additionally, another QGIS search plug-in was developed, enabling users to query topics of interest. The backend API will extract relevant answers from the corresponding graph data and text chunks, and will also provide the corresponding DOIs.
Author Contributions
WL contributed to the conception and design of the current work, collected and analyzed the data, wrote the program codes, and drafted the manuscript. QL contributed to the conception of the work, helped analyze the data, and revised the manuscript. GL contributed to the design of the current work and revised the manuscript.
Data Availability Statement
The data used in the current work is for exemplify only. Readers can easily retrieve the data with the same query from the Web of Science Core Collection.
Code Availability:
The codes are available upon request to WL. Readers are encouraged to test different embedding and clustering models, distinct from those used in the current work, using their own codes.
References
- Azamfirei, R., Kudchadkar, S. R. & Fackler, J. Large language models and the perils of their hallucinations. Crit Care 27, 120 (2023).
- Edge, D. et al. From Local to Global: A Graph RAG Approach to Query-Focused Summarization. arXiv.org https://arxiv.org/abs/2404.16130v1 (2024).
- Peng, B. et al. Graph Retrieval-Augmented Generation: A Survey. Preprint at http://arxiv.org/abs/2408.08921 (2024).
- Sarmah, B. et al. HybridRAG: Integrating Knowledge Graphs and Vector Retrieval Augmented Generation for Efficient Information Extraction. Preprint at http://arxiv.org/abs/2408.04948 (2024).
- Chen, C. Searching for intellectual turning points: Progressive knowledge domain visualization. Proceedings of the National Academy of Sciences 101, 5303–5310 (2004).
- Xiao, S., Liu, Z., Zhang, P. & Muennighoff, N. C-Pack: Packaged Resources To Advance General Chinese Embedding. (2023).
- Steinley, D. Properties of the Hubert-Arabie adjusted Rand index. Psychol Methods 9, 386–396 (2004).
- Romano, S., Bailey, J., Nguyen, X. & Verspoor, K. M. Standardized Mutual Information for Clustering Comparisons: One Step Further in Adjustment for Chance. in (2014).
- Guia, J., Gonçalves Soares, V. & Bernardino, J. Graph Databases: Neo4j Analysis: in Proceedings of the 19th International Conference on Enterprise Information Systems 351–356 (SCITEPRESS—Science and Technology Publications, Porto, Portugal, 2017). [CrossRef]
- Reimers, N. & Gurevych, I. Sentence-BERT: Sentence Embeddings using Siamese BERT-Networks. in Proceedings of the 2019 Conference on Empirical Methods in Natural Language Processing (Association for Computational Linguistics, 2019).
- Cer, D. et al. Universal Sentence Encoder. arXiv.org https://arxiv.org/abs/1803.11175v2 (2018).
- Řehůřek, R. & Sojka, P. Software Framework for Topic Modelling with Large Corpora. in Proceedings of the LREC 2010 Workshop on New Challenges for NLP Frameworks 45–50 (ELRA, Valletta, Malta, 2010).
- Ester, M., Kriegel, H.-P. & Xu, X. A Density-Based Algorithm for Discovering Clusters in Large Spatial Databases with Noise.
- Murtagh, F. & Contreras, P. Algorithms for hierarchical clustering: an overview. WIREs Data Mining and Knowledge Discovery 2, 86–97 (2012).
- Langfelder, P. & Horvath, S. WGCNA: an R package for weighted correlation network analysis. BMC Bioinformatics 9, 559 (2008).
- Gu, Y. et al. Domain-Specific Language Model Pretraining for Biomedical Natural Language Processing. (2020).
- Efficient and Robust Approximate Nearest Neighbor Search Using Hierarchical Navigable Small World Graphs | IEEE Journals & Magazine | IEEE Xplore. https://ieeexplore.ieee.org/document/8594636.
- Tech, Z. Feder: A Federated Learning Library. (2023).
- da Costa, L. S., Oliveira, I. L. & Fileto, R. Text classification using embeddings: a survey. Knowl Inf Syst 65, 2761–2803 (2023).
- Petukhova, A., Matos-Carvalho, J. P. & Fachada, N. Text Clustering with LLM Embeddings. Preprint at https://doi.org/10.48550/arXiv.2403.15112 (2024).
- Feng, F., Yang, Y., Cer, D., Arivazhagan, N. & Wang, W. Language-agnostic BERT Sentence Embedding. Preprint at https://doi.org/10.48550/arXiv.2007.01852 (2022).
- Frey, B. J. & Dueck, D. Clustering by Passing Messages Between Data Points. Science 315, 972–976 (2007).
- GROBID. (2008).
- Dubey, A. et al. The Llama 3 Herd of Models. arXiv.org https://arxiv.org/abs/2407.21783v2 (2024).
- Virtanen, P. et al. SciPy 1.0: fundamental algorithms for scientific computing in Python. Nat Methods 17, 261–272 (2020).
- Hagberg, A., Swart, P. & Chult, D. Exploring Network Structure, Dynamics, and Function Using NetworkX. in (2008). [CrossRef]
- QGIS Development Team. QGIS Geographic Information System. (QGIS Association).
- Kimi, an AI Assistant by Moonshot AI.
Figure 1.
Co-citation network consisting of three hypothetical papers on global warming.
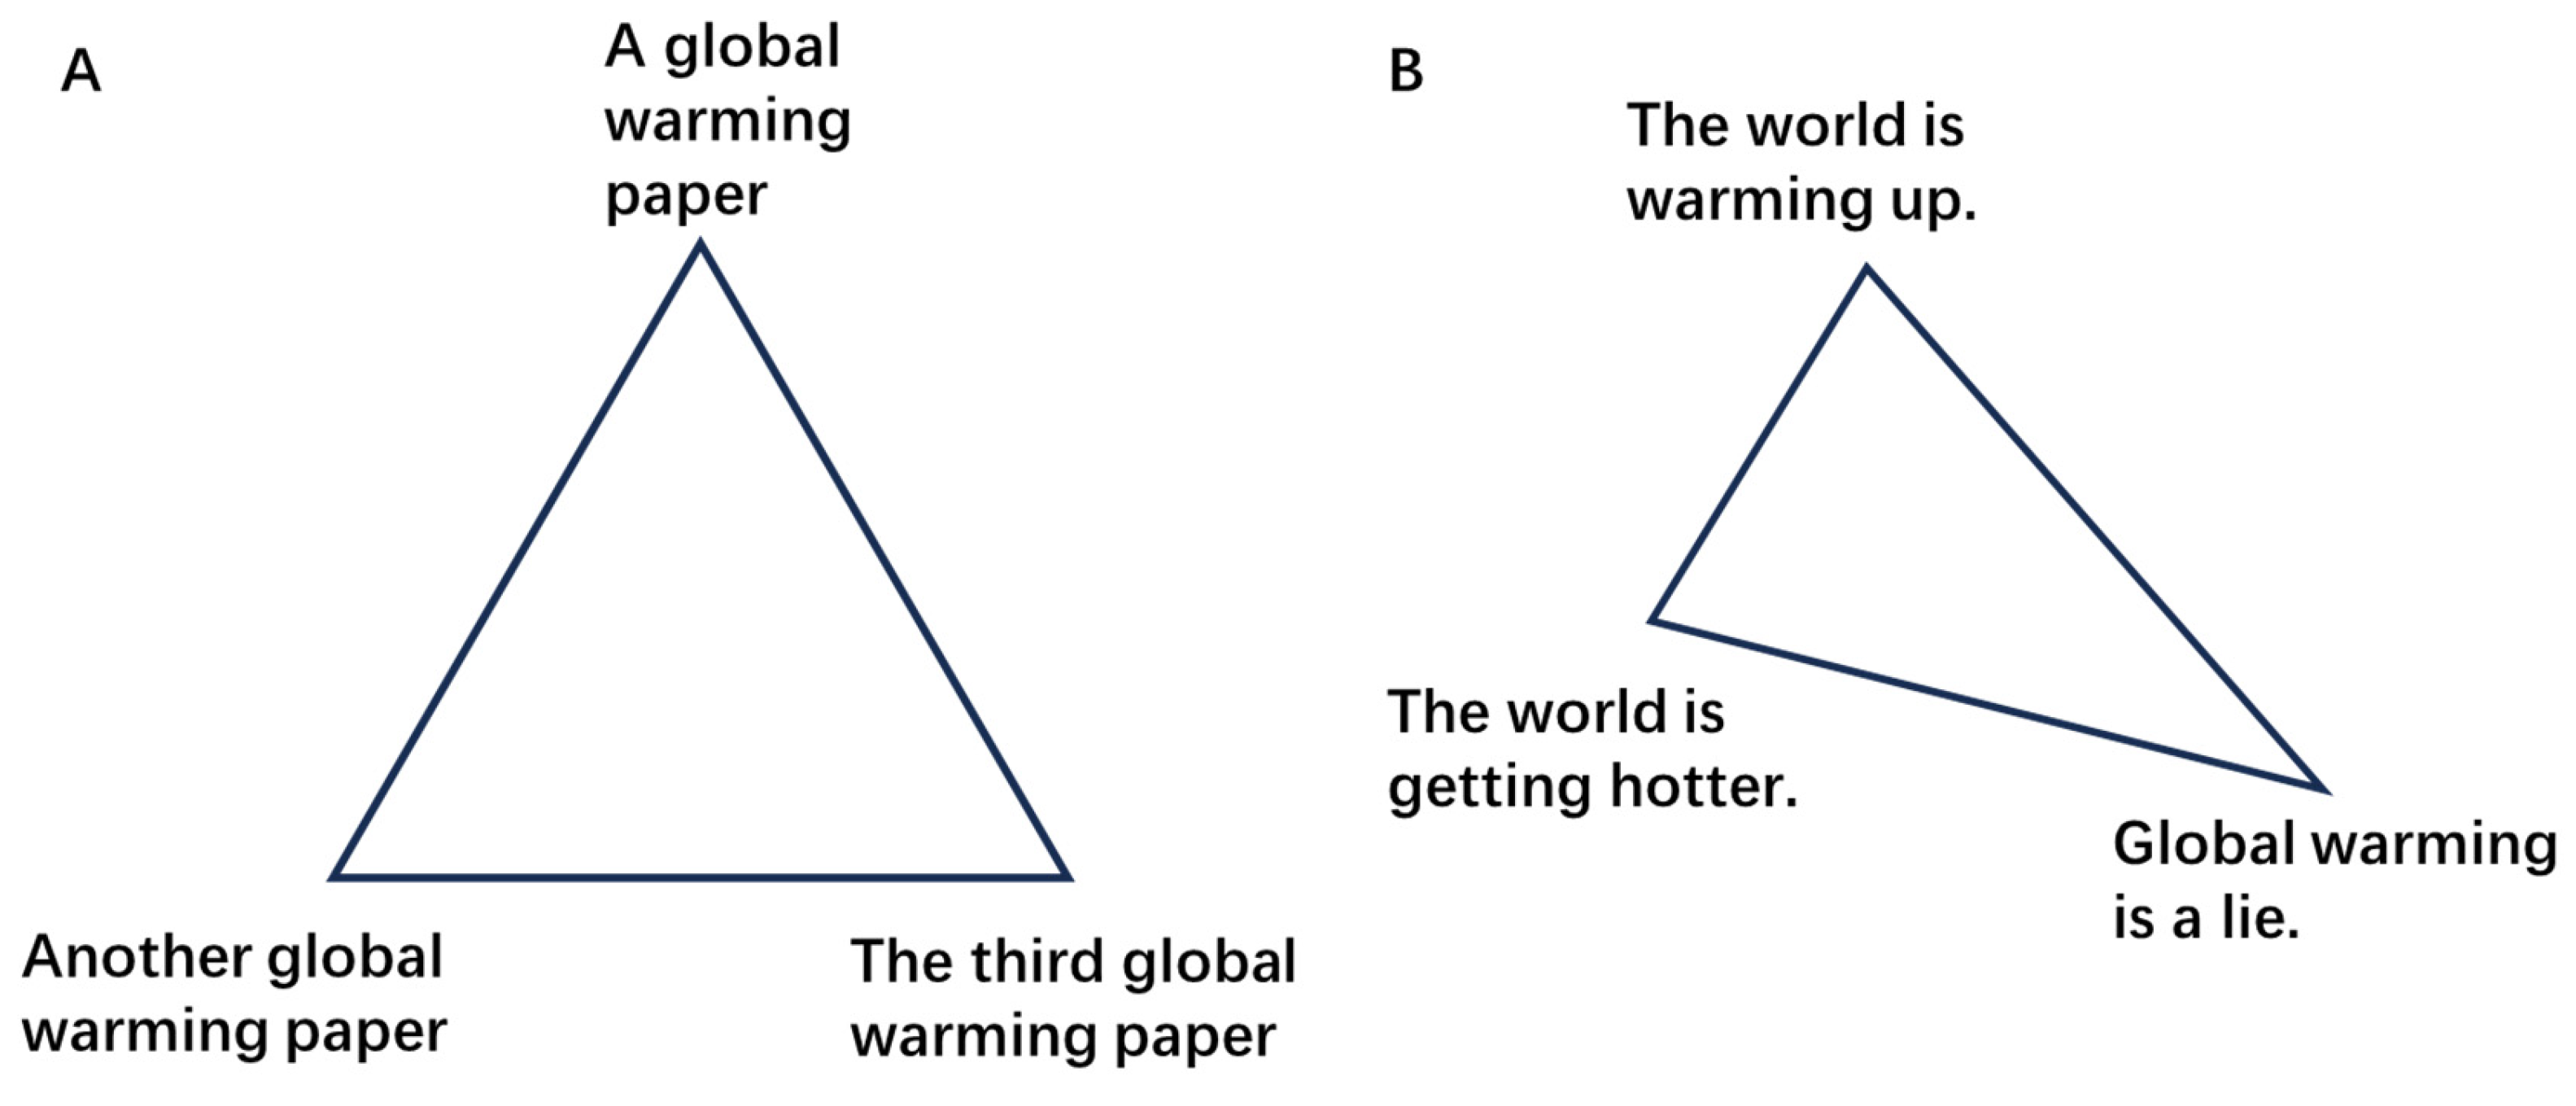
Figure 2.
Consistency among different embedding-clustering pairs. Each pair is designated by the clustering method, distance metric, and embedding method. AP denotes Affinity Propagation. Cosine and Euclid represent cosine similarity and Euclidean distance, respectively. The last component of each name specifies the embedding model used.
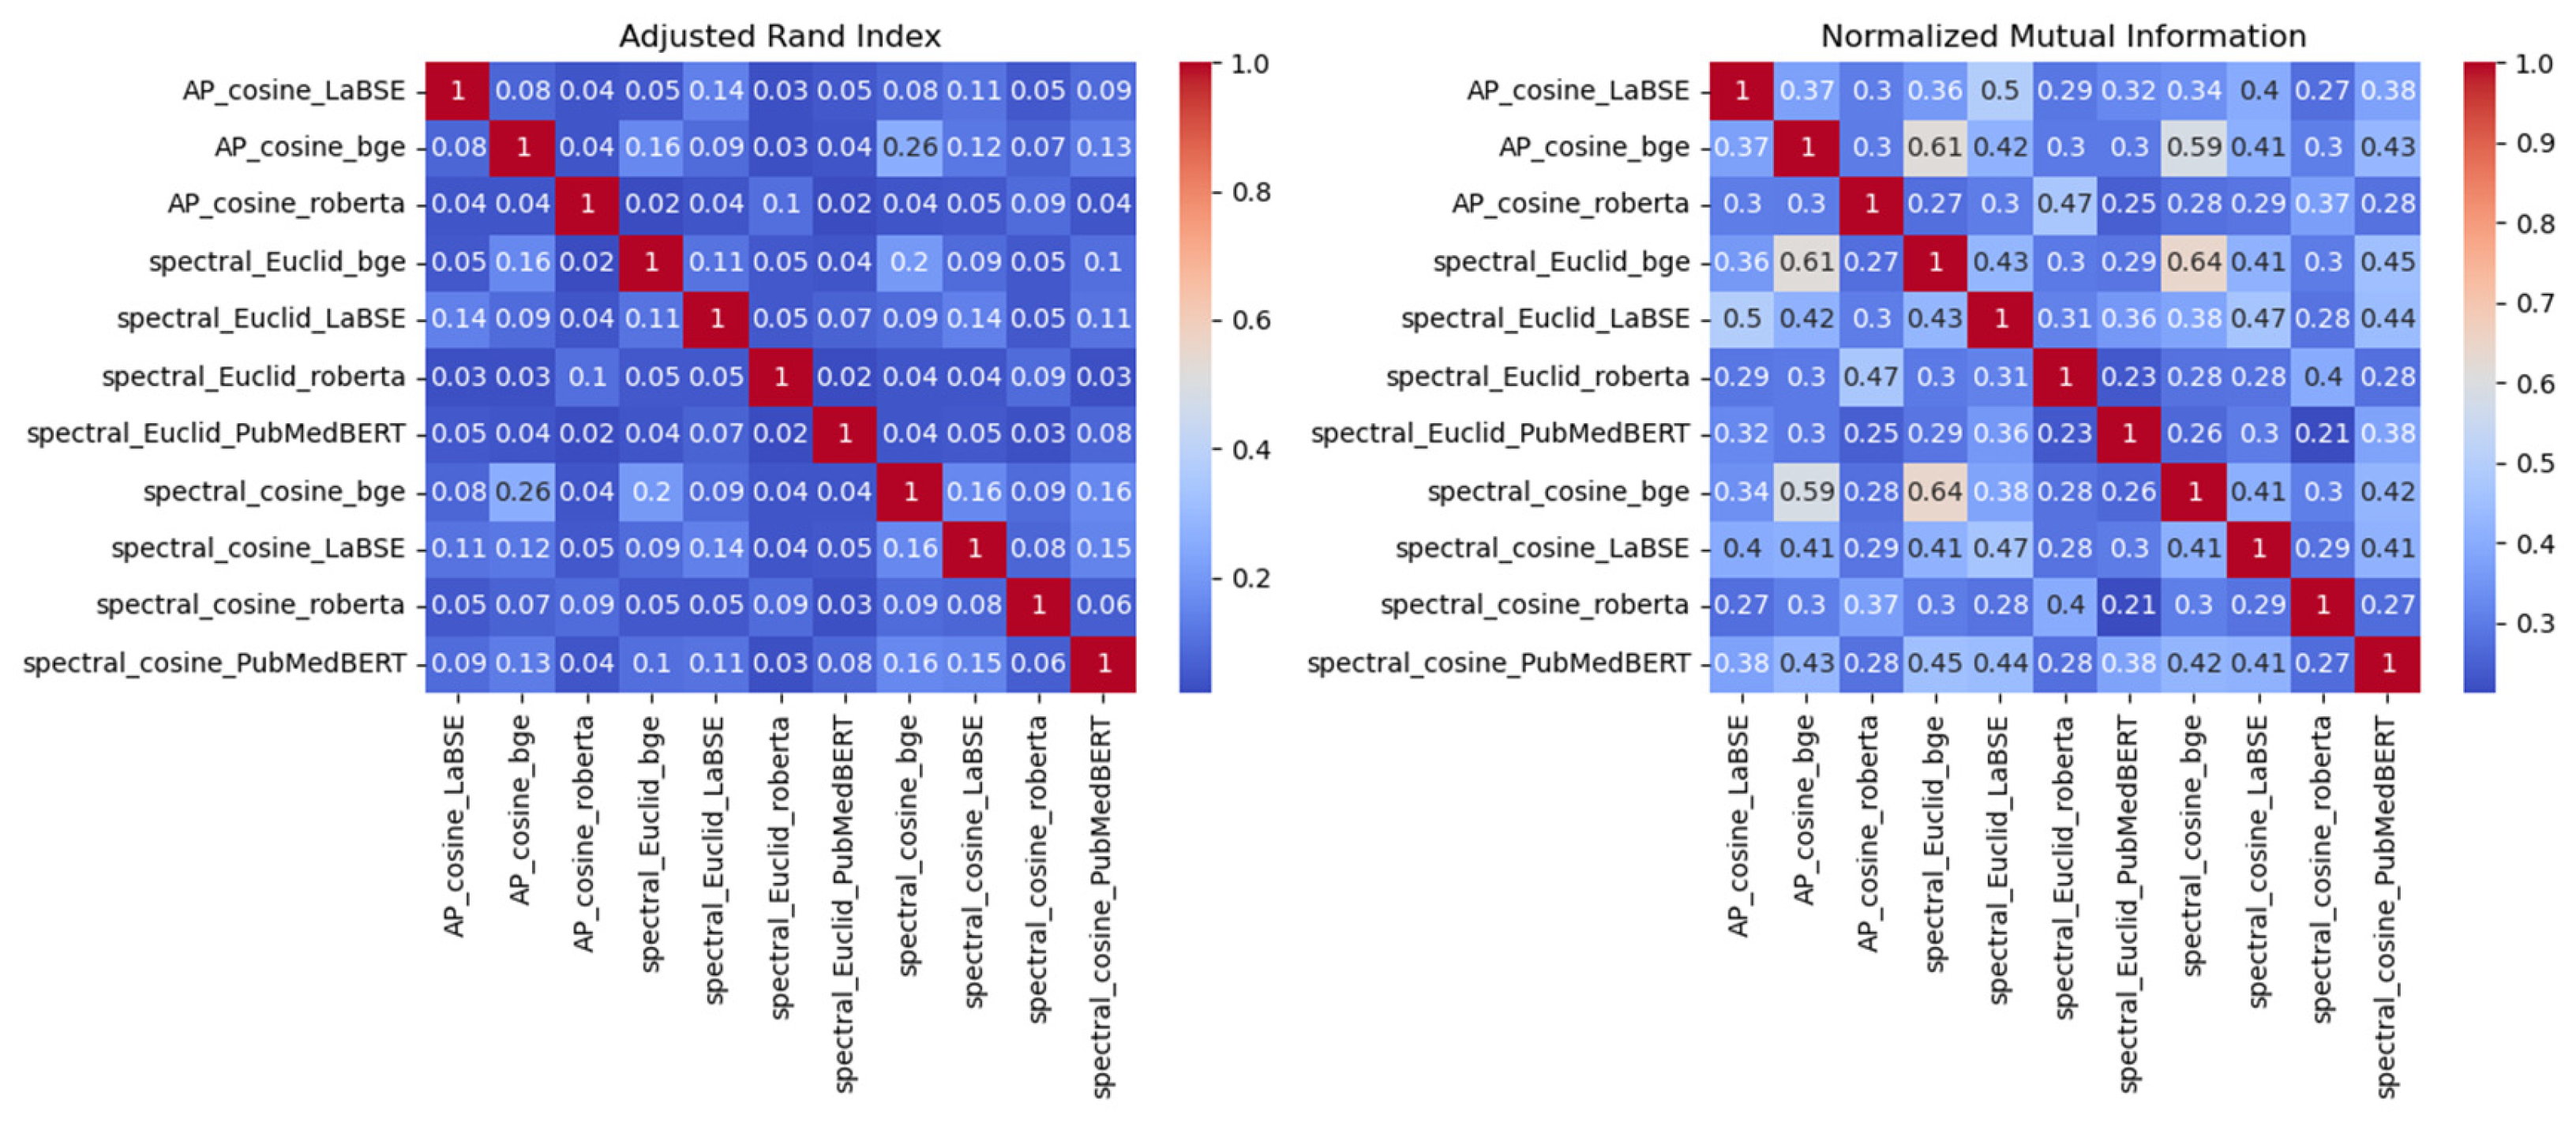
Figure 3.
Graph knowledge (A) and text chunks (B) are stored in Neo4j database.
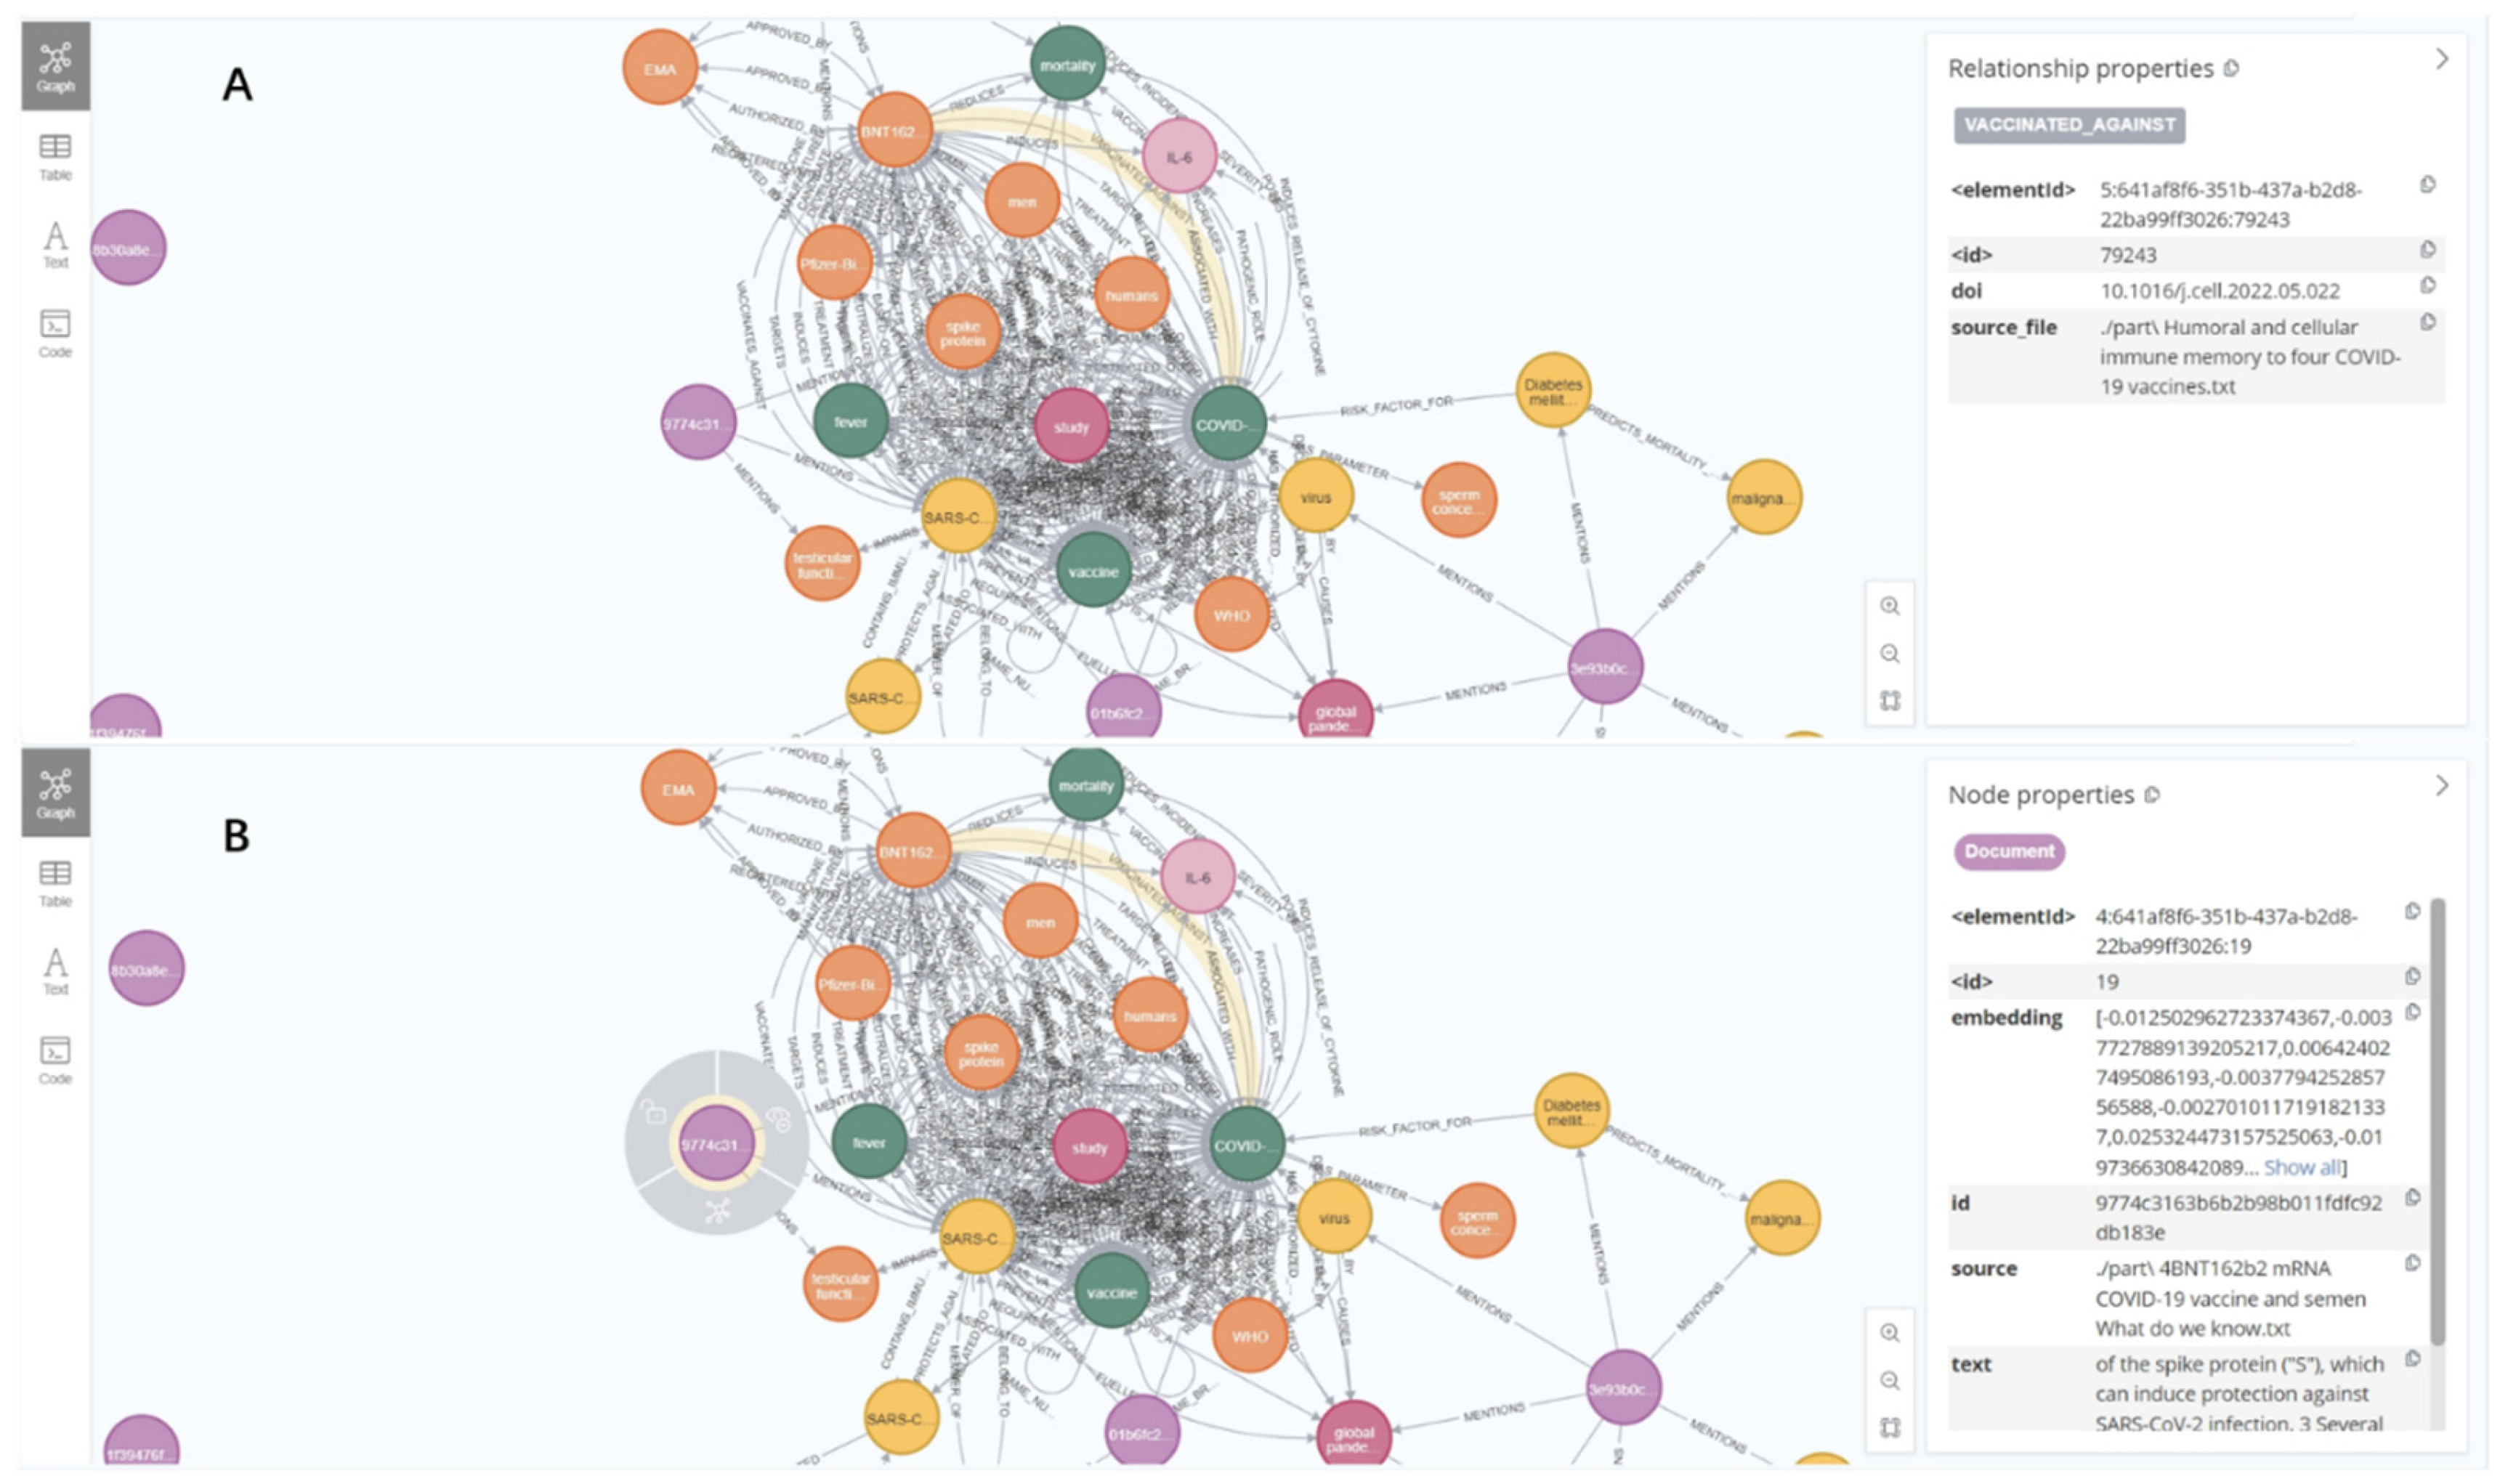
Figure 4.
Literature map visualization. A. The large-scale view displays cluster capitals and their summarizations, with a plugin on the right serving as a legend that showcases keyword summarizations extracted by a LLM. B. The small-scale view presents detailed information for individual papers, alongside a plugin on the right designed to answer questions and provide the data sources.
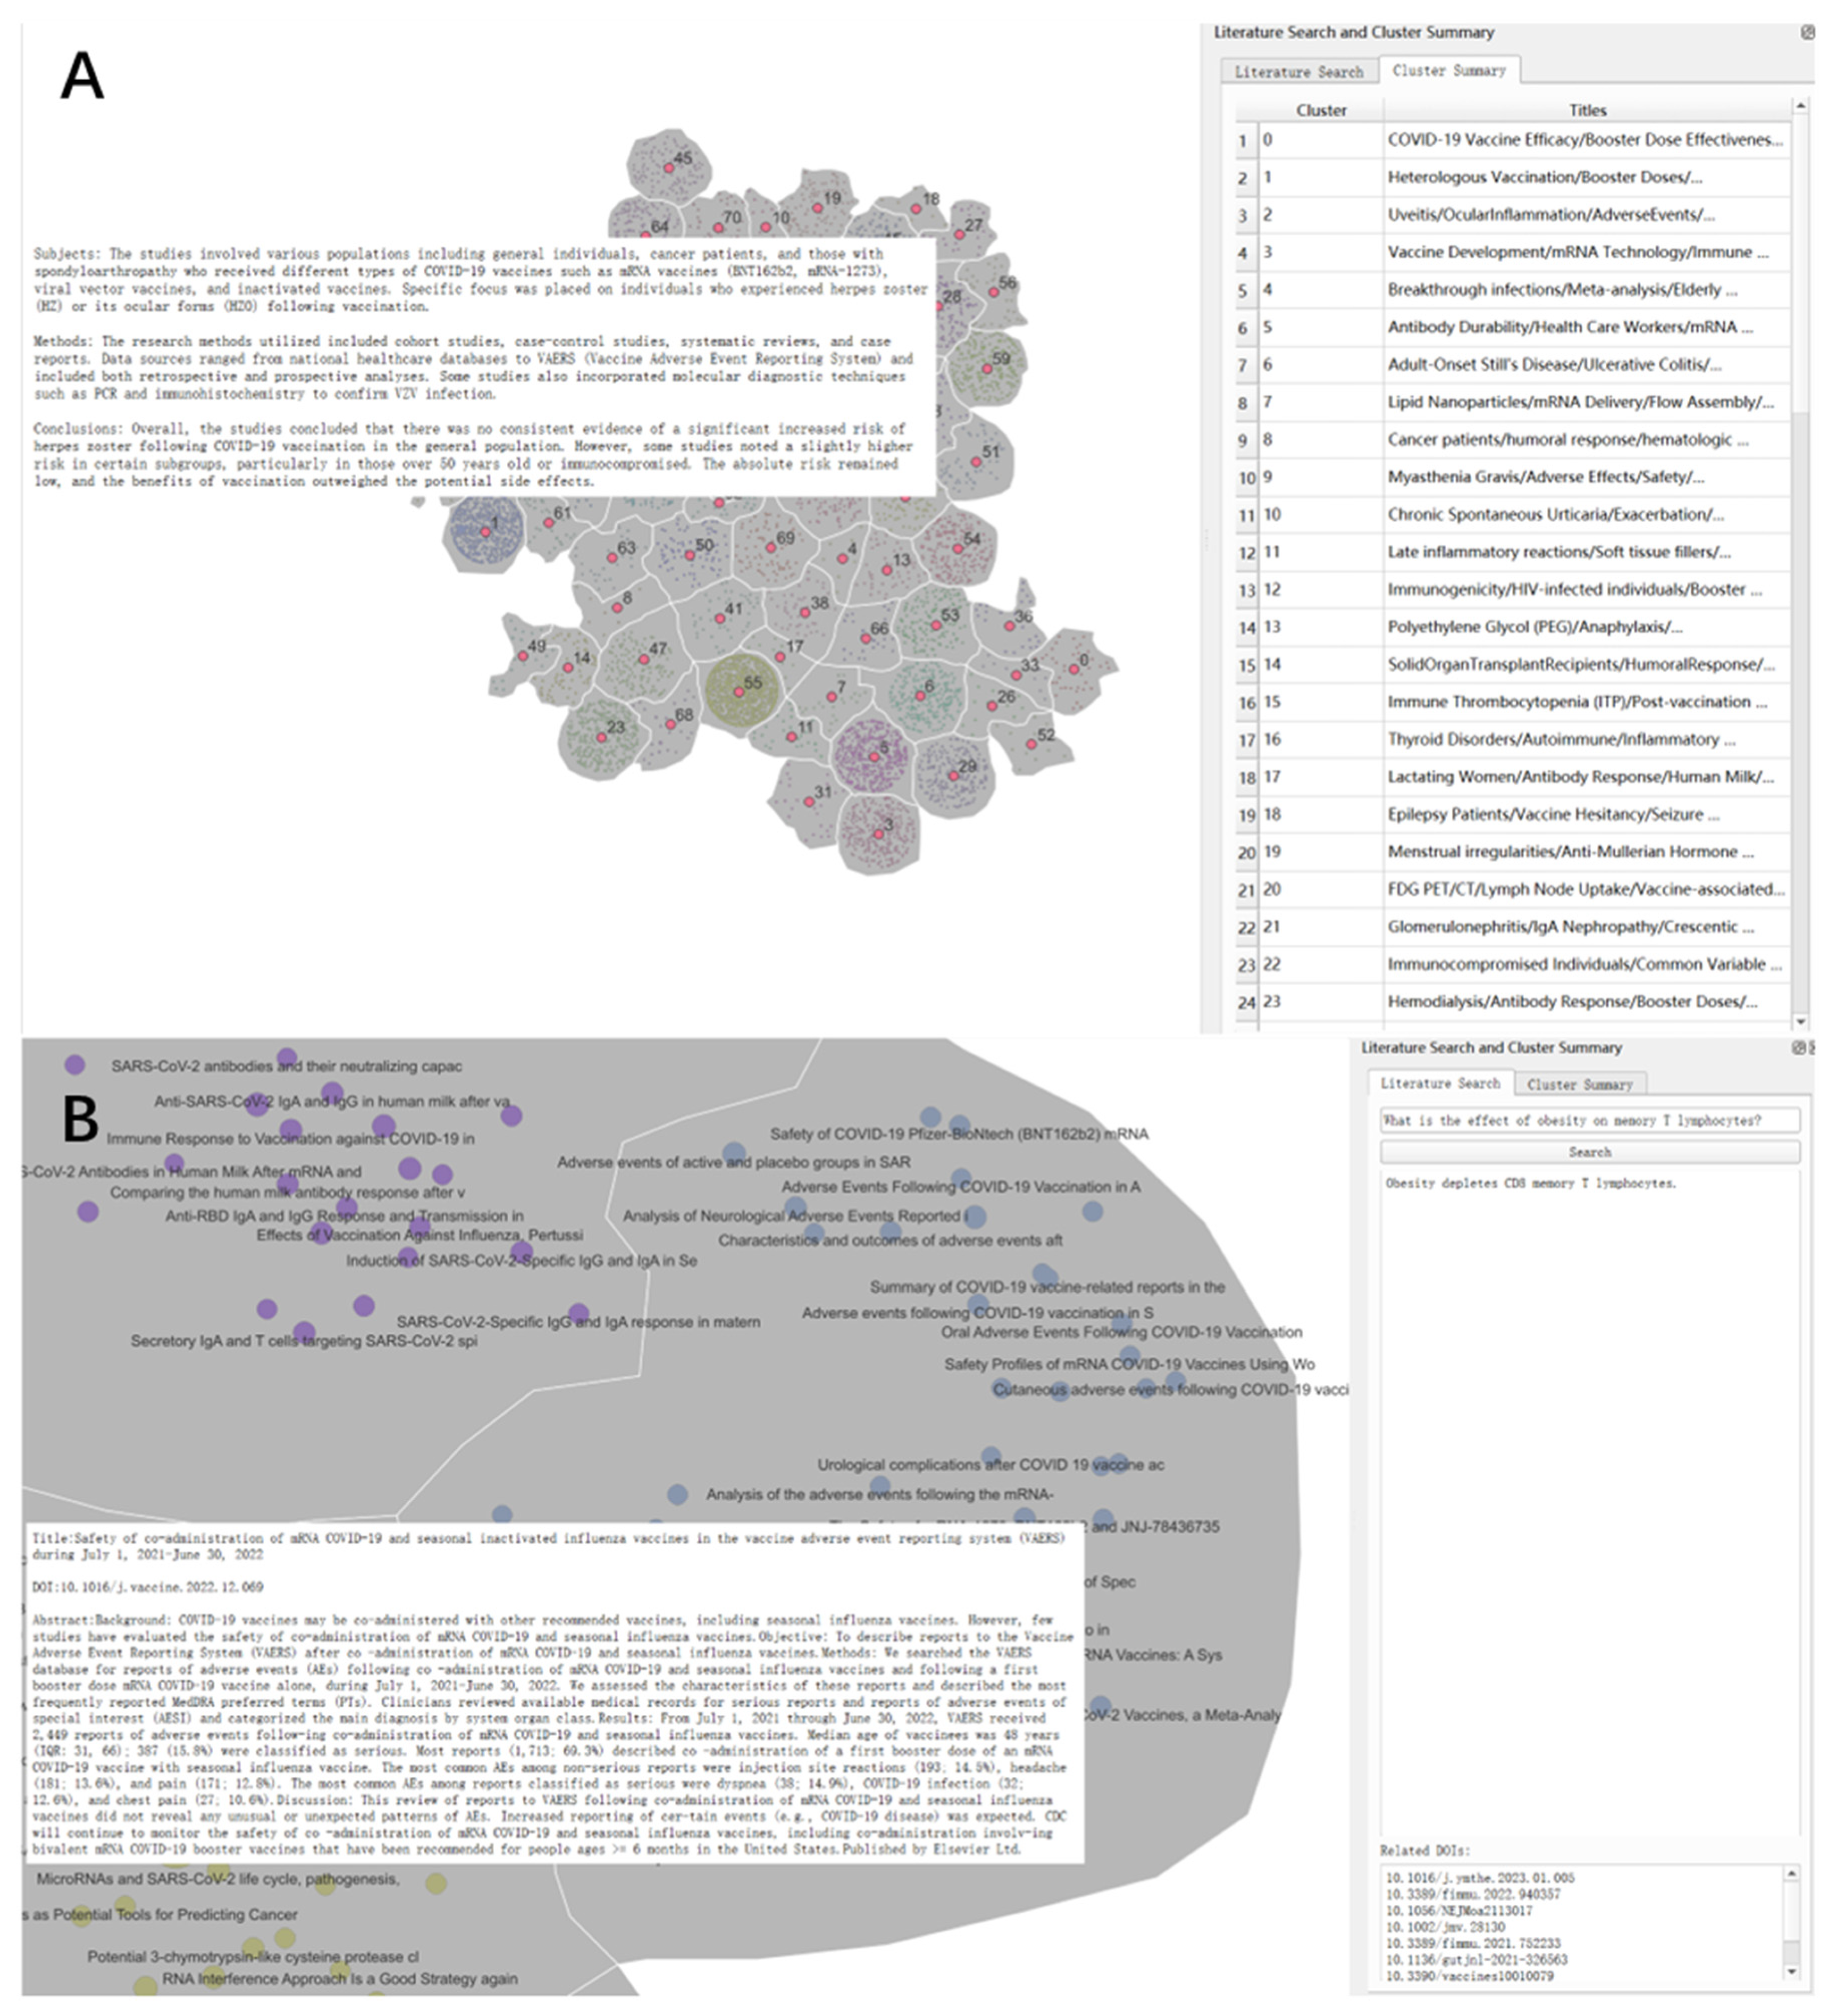

Table 1.
Clustering metrics for embedding-clustering pairs. Each pair is designated by the clustering method, distance metric, and embedding method. AP denotes Affinity Propagation. Cosine and Euclid represent cosine similarity and Euclidean distance, respectively. The last component of each name specifies the embedding model used.
| Embedding-clustering pair | # of same Cluster | # of different Cluster | Same Cluster Ratio |
| AP_cosine_LaBSE | 97 | 229 | 0.30 |
| AP_cosine_bge | 189 | 137 | 0.58 |
| AP_cosine_roberta | 55 | 271 | 0.17 |
| spectral_Euclid_bge | 209 | 117 | 0.64 |
| spectral_Euclid_LaBSE | 99 | 227 | 0.30 |
| spectral_Euclid_roberta | 71 | 255 | 0.22 |
| spectral_Euclid_PubMedBERT | 35 | 291 | 0.11 |
| spectral_cosine_bge | 172 | 154 | 0.53 |
| spectral_cosine_LaBSE | 101 | 225 | 0.31 |
| spectral_cosine_roberta | 84 | 242 | 0.26 |
| spectral_cosine_PubMedBERT | 138 | 188 | 0.42 |
Disclaimer/Publisher’s Note: The statements, opinions and data contained in all publications are solely those of the individual author(s) and contributor(s) and not of MDPI and/or the editor(s). MDPI and/or the editor(s) disclaim responsibility for any injury to people or property resulting from any ideas, methods, instructions or products referred to in the content. |
© 2025 by the authors. Licensee MDPI, Basel, Switzerland. This article is an open access article distributed under the terms and conditions of the Creative Commons Attribution (CC BY) license (http://creativecommons.org/licenses/by/4.0/).
Copyright: This open access article is published under a Creative Commons CC BY 4.0 license, which permit the free download, distribution, and reuse, provided that the author and preprint are cited in any reuse.


