
Submitted:
06 July 2025
Posted:
08 July 2025
You are already at the latest version
Abstract
The visualization of scientific data is a fundamental step in uncovering hidden patterns and relationships within complex systems. While conventional force-directed graph layout algorithms (e.g., spring layout) are effective at displaying the general topology and clustering tendencies of systems, they possess a critical shortcoming: they are inherently non-deterministic and obscure the natural, sequential, or index-based identities of nodes. This poses a significant limitation when analysing systems that contain an intrinsic sequential logic, such as quantum circuits, metabolic pathways, crystal structures, or chronological data structures. This paper introduces the "Keçeci Layout," a deterministic and order-preserving algorithm designed to fill this analytical gap. The algorithm operates by arranging nodes sequentially along a primary axis according to their IDs, employing a predictable zigzag pattern on a secondary axis to prevent node overlaps. This approach establishes a direct and intuitive bridge between a system's abstract data structure (e.g., qubit indices, reaction steps) and its visual representation. To demonstrate the versatility and efficacy of the Keçeci Layout, four case studies from distinct scientific disciplines are presented: Chemistry, Physics, Biology, Quantum Computing, Materials Science, Molecular Biology, Computer Science, etc. In conclusion, the Keçeci Layout is proven to be a powerful scientific tool that offers analytical depth by remaining faithful to the underlying data structure, moving beyond purely aesthetic presentation. The algorithm provides a significant advantage over conventional methods, particularly for the visual analysis of ordered, hierarchical, or index-dependent systems.
Keywords:
Deterministic Algorithm
; Deterministic Layout
; Graph Layout
; Graph Visualization
; Interdisciplinary Data Visualization
; Keçeci Layout
; KececiLayout
; Keçeci Zigzag Layout Algorithm
; Keçeci Deterministic Zigzag Layout
; Node Positioning
; Order-Preserving Algorithms
; Sequential Layout
; Scientific Computing
; Structural Analysis
; Zigzag Layout
I. A Historical Overview of Graph Layout Methods with A Focus on Deterministic Approaches
The history of graph layout algorithms is shaped by the need to transform abstract relationships into understandable visual representations. Its roots trace back to Leonhard Euler’s work in 1736 on the Seven Bridges of Königsberg problem, which laid the foundations of modern graph theory (Euler 1741) [3]. However, in these early stages, graph drawings were typically done manually, primarily to illustrate topological connections rather than adhering to specific aesthetic criteria.
With the rise of computers, particularly in the 1960s and 1970s, the need to visualize complex data structures and relational databases grew. During this period, the first automatic graph layout algorithms began to emerge. Initial efforts often focused on specific types of graphs, such as algorithms developed for tree structures (like methods discussed in Knuth 1968’s The Art of Computer Programming) [8] or studies on the layout of planar graphs (graphs that can be drawn without edge crossings) (Tutte 1963) [10]. Tutte’s “barycentric embedding” method [10] was a significant early step, producing planar drawings by fixing the vertices of the outer face onto a convex polygon and positioning interior vertices at the barycenter of their neighbors.
A revolution in graph layout occurred with the development of force-directed algorithms in the 1980s and early 1990s. This approach models the graph as a physical system: nodes are considered particles that repel each other (like electrical charges), and edges are forces (like springs) pulling connected nodes together. The system iteratively updates until it reaches an equilibrium state, typically based on energy minimization principles. Peter Eades (1984) [2] was among the first to popularize the “spring embedder” model. Subsequently, Thomas Kamada and Satoru Kawai (1989) [7 introduced an influential model where the ideal distance between nodes is based on their graph-theoretic distance (shortest path), simulated using physical springs. Thomas Fruchterman and Edward Reingold (1991) [4] developed an algorithm, still widely used today, that efficiently calculates both attractive and repulsive forces, producing aesthetically pleasing results. This physical analogy approach became a standard for visualizing general-purpose graphs.
Concurrently, hierarchical or layered approaches gained prominence, especially for visualizing directed graphs (e.g., workflows, dependencies). The method proposed by Sugiyama, Tagawa, and Toda (1981), often known as the “Sugiyama Method,” [9] established the fundamental framework in this area. This method typically consists of three main steps: (1) Assigning nodes to hierarchical layers, (2) Optimizing the ordering of nodes within layers to minimize edge crossings, and (3) Assigning final coordinates to the nodes. This approach is highly effective for emphasizing flow and dependency relationships and forms the basis of the “dot” algorithm in tools like Graphviz (Gansner et al. 1993) [5].
Besides these, other algorithms targeting different aesthetic criteria or application domains were developed, such as circular layouts (placing nodes on a circle) and orthogonal layouts (drawing edges using only horizontal and vertical segments, particularly used in VLSI design) (Di Battista et al. 1998) [1].
Contemporary graph layout research focuses on challenges like visualizing large-scale graphs (millions of nodes and edges) using techniques such as multi-level methods, handling dynamic graphs (changing over time), enabling interactive visualization, and satisfying specific aesthetic constraints (e.g., symmetry, clustering) (Herman, Melancon, and Marshall 2000) [6]. Specific, deterministic, and sequential layout algorithms like the “Keçeci Layout” [15,16,17,18,19,20,37,53,54,55,56,57,58,59] represent modern approaches built upon this rich historical foundation, particularly useful in scenarios where predictable and repeatable arrangements are desired.
II. Application Areas of Graph Layout Algorithms
Graph layout algorithms are fundamental tools with the power to make complex data understandable by visualizing relationships between nodes (points) and edges (lines). Consequently, they find applications in numerous fields where understanding connections, structures, or flows within data is critical. Different domains often involve distinct types of graph structures and thus require different aesthetic criteria or informational emphases, leading to the development of diverse layout algorithms.
Social Sciences and Network Analysis: One of the most well-known applications of graph layout is the visualization of social networks. Social structures such as friendship ties, collaboration networks (e.g., co-authorship of scientific papers), communication networks, or organizational structures can be modelled as graphs. Force-directed algorithms (e.g., Fruchterman-Reingold) are often used to visually reveal communities (densely connected groups) and central or influential actors (Freeman 2000) [11]. Jacob Moreno’s sociograms from the 1930s are early pioneering efforts in this area (Moreno 1953) [12].
Biology and Bioinformatics: Biological systems are inherently complex and often represented as network structures. Visualizing protein-protein interaction networks, metabolic pathways (relationships between chemical reactions), gene regulatory networks (how genes influence each other), and phylogenetic trees showing genetic relationships between species helps biologists understand system-level behaviours. Hierarchical or path-based layouts, which facilitate pathway tracing, are used alongside force-directed or clustering-based layouts that reveal functional modules (Pavlopoulos et al. 2008) [13].
Computer Science and Software Engineering: Graph layout is indispensable for understanding the structure and behaviour of software systems. Program call graphs (how functions call each other), class dependency diagrams (in object-oriented programming), database schemas (relationships between tables), and computer network topologies (how devices are interconnected) are frequently visualized. Hierarchical layouts may be preferred for showing control flow or dependencies, while force-directed layouts can help understand overall structure or clustering (Storey 1999) [14].
Information Visualization and Data Mining: Graph visualization is a critical tool for exploring patterns and relationships in large, complex datasets. The link structures between web pages, citation networks among scientific publications, similarity relationships between documents or topics (after clustering analysis), and other abstract data spaces are drawn as graphs to help users navigate and make sense of the information. Scalability and interactive exploration are often important considerations in this field (Herman, Melancon, and Marshall 2000) [6].
Project Management and Operations Research: Processes and systems like workflows, task dependencies, and logistics networks are naturally graph structures. Project management tools such as PERT (Program Evaluation and Review Technique) and CPM (Critical Path Method) charts often use hierarchical or directed graph layouts to illustrate the sequencing and dependencies between tasks. Structures like supply chain networks or transportation networks are also visualized for optimization and analysis.
Other Fields: Beyond these areas, graph layout algorithms are utilized in many other domains, including chemistry for visualizing molecular structures, physics for state diagrams, linguistics for semantic networks (meaning relationships between words), and even analysing relationships in financial markets.
In conclusion, graph layout algorithms fundamentally support the process of exploring, understanding, and communicating data by transforming abstract relationships into concrete visual forms. Selecting the appropriate algorithm based on the specific needs of the application domain is key to generating an effective visualization.
III. Potential Contributions and Application Areas of Keçeci Layout
Keçeci Layout [15,16,17,18,19,20,37,53,54,55,56,57,58,59], differing from the aesthetic optimization goals of traditional force-directed or hierarchical algorithms (e.g., minimizing edge crossings or emphasizing cluster structures), offers an approach founded on determinism (predictability), order, and simple geometric arrangement. These characteristics can provide unique advantages in specific application scenarios:
- 1.
-
Comparison and Change Tracking: The deterministic nature of the algorithm means it will always produce the exact same layout for the same graph. This is highly valuable for comparing graphs that change over time (dynamic networks):
- a)
- Software Engineering: When visualizing call graphs or dependency structures of different software versions using Keçeci Layout, added, deleted, or modified nodes/edges become visually apparent immediately because the rest of the structure remains fixed. Such comparisons are difficult with force-directed layouts that involve randomness.
- b)
- Bioinformatics: It can be used to track changes in biological interaction networks derived from time-series data. Changing interactions can be easily distinguished as the overall structure remains constant.
- c)
- Social Network Analysis: It might allow visualizing a social network with nodes ordered by a specific attribute (e.g., join date, activity level) and consistently tracking its progression over time.
- 2.
-
Highlighting Sequential Processes and Structures: As the algorithm places nodes according to a specific order (usually ID or index), it naturally emphasizes the structure when this ordering is meaningful:
- a)
- Project Management: In PERT/CPM-like diagrams where tasks are ordered by a specific ID or start time, it can visualize the task flow in a regular zigzag pattern.
- b)
- Data Structures and Algorithms: It can be used for educational purposes to visualize simple data structures (e.g., variations of linked lists) or specific algorithm steps. Its sequential nature makes following the steps easier.
- c)
- Computer Science: It might be suitable for displaying the chronological or sequential flow of events in simple graphs generated from log data or event sequences.
- 3.
-
Simplicity, Reproducibility, and Debugging:
- a)
- Information Visualization: It can be used in situations where a simple, understandable, and reproducible layout is preferred over complex aesthetic optimizations (e.g., technical documentation, reporting).
- b)
- Education: When teaching the fundamentals of graph layout algorithms, it can serve as a simple example whose mechanics are easily understood.
- c)
- Debugging: While debugging graph processing code, having nodes consistently appear in the same location can simplify identifying issues.
- 4.
- Controlled and Predictable Arrangement: The spacing parameters allow control over how close nodes are positioned. Given sufficient spacing, node overlaps can be prevented. This is particularly useful when label readability is important.
Limitations: Keçeci Layout does not inherently reveal complex cluster structures or communities like force-directed algorithms do. It doesn’t optimize layered structures or flow direction like hierarchical algorithms. It lacks global aesthetic goals such as minimizing edge crossings. Therefore, it may not be ideal for visualizations where the primary goal is to discover or emphasize such structures.
Conclusion: Keçeci Layout can find its place in the graph visualization toolkit as a valuable complementary tool, especially for niche applications requiring determinism, emphasis on order, comparability, and simplicity. Instead of replacing existing popular algorithms, it offers a strong alternative in specific situations where those algorithms fall short, or a different approach is beneficial.
IV. Keçeci Layout Vs. Other Layout Algorithms: Advantages And Disadvantages
Graph visualization is crucial for understanding relationships between nodes. Different layout algorithms serve distinct aesthetic goals and use cases. Keçeci Layout stands out with its deterministic and sequential nature, giving it specific advantages and disadvantages when compared to other popular algorithms (e.g., force-directed, hierarchical, circular).

Table 1.
Keçeci Layout vs. Other Layout Algorithms: Advantages and Disadvantages.
| Feature/Algorithm | Keçeci Layout | Force-Directed (e.g., Fruchterman-Reingold) | Hierarchical (e.g., Sugiyama) | Circular |
| Primary Goal | Sequential, deterministic, simple geometric order | Aesthetic optimization, clustering, edge length | Show flow/hierarchy, layering | Placement on a circle, cyclic structure |
| Determinism | Yes (Same input always yields same output) | Often No (Random start/local minima) | Mostly Yes (Depends on heuristics) | Yes (If order is fixed) |
| Node Order Sensitivity | High (Directly determines layout) | Low (Topology dominates) | Medium (Intra-layer ordering matters) | High (Determines adjacency on circle) |
| Structure Emphasis | Sequence, simple connections | Clusters, communities, central nodes | Direction, layers, dependencies | Cyclicality, peripheral position |
| Aesthetics (General) | Simple, predictable; can be cluttered if dense | Often pleasing, organic; can tangle if large/dense | Structured, orderly; can be wide/tall | Simple; can have center clutter (“hairball”) |
| Edge Crossings | Not optimized (Can be many) | Reduced implicitly | Reduced between layers explicitly | Not optimized (Can be many) |
| Computational Complexity | Low (Often O(N)) | Medium/High (O(N^2) or O(N log N)) | Medium/High (Involves NP-hard problems) | Low (O(N)) |
Advantages of Keçeci Layout:
Determinism and Reproducibility: Always produces the same output for the same graph. This is invaluable for comparing changes over time or for debugging. Many other algorithms (especially force-directed) involve randomness.
Emphasis on Order: Naturally visualizes the sequence when nodes need to be laid out according to a specific order (ID, time, etc.).
Simplicity and Understandability: The algorithm’s logic is straightforward, and its output is geometrically predictable. It avoids complex optimizations.
Speed: It’s typically very fast, often running in linear time with respect to the number of nodes (O(N)), especially compared to force-directed algorithms.
Parametric Control: Distances between nodes can be directly controlled via spacing parameters.
Disadvantages of Keçeci Layout:
Ignores Topological Structure: The layout is based on node order; it may not aesthetically reflect the graph’s topological structure (clusters, bridges, etc.) or edge density. Force-directed algorithms are generally better at this.
Edge Crossings: Makes no specific effort to minimize edge crossings, which can hinder readability, particularly in dense graphs. Hierarchical and force-directed algorithms handle this better.
Doesn’t Show Hierarchy or Flow: Not designed to emphasize flow or hierarchy in directed graphs. Hierarchical algorithms like Sugiyama are more suitable for such needs.
Over-reliance on Order: If given a meaningless or random node order, the resulting visualization might also appear meaningless or confusing.
Aesthetic Limitations: Does not produce “organic” or “natural” looking layouts; its structure is quite grid-like and mechanical. May not be ideal where aesthetics is a primary concern.
Conclusion: Keçeci Layout is a powerful tool, particularly when determinism, speed, emphasis on order, and comparability are required. However, for goals like revealing complex topological structures, performing aesthetic optimization, or showing hierarchy, other algorithms will generally be more appropriate.
V. An Approach to Graph Visualization in Quantum Computing with Keçeci Layout
The Keçeci Layout is a novel graph layout algorithm that offers deterministic and scalable node positioning for various graph libraries such as NetworkX, Rustworkx, igraph, Networkit, and Graphillion. It provides an efficient way to visualize complex network structures, especially in domains where predictable and repeatable layouts are essential. This layout method builds upon the mathematical foundations laid out in previous works, including the Keçeci Numbers [21,22,23,24,25] and the Keçeci Arithmetical Square [26,27,28,29], which explore number-theoretic patterns and symmetrical properties—features that resonate well with structured graph visualizations.
At its core, the Keçeci Layout employs a zigzag placement strategy, distributing nodes along a primary axis while alternating offsets on the secondary axis. This approach ensures minimal overlap between nodes and maintains spatial consistency across different graph sizes and densities. The algorithm’s deterministic nature makes it particularly useful in scenarios requiring reproducibility, such as version-controlled graph comparisons or interactive visualization environments.
This deterministic structure aligns well with recent advancements in quantum computing, especially in the context of quantum error correction codes [30], where precise topological representations are critical. In high-qubit systems, surface codes and other topological codes play a vital role in maintaining fault tolerance. The Keçeci Layout can be employed to visualize these complex code structures effectively, allowing researchers to analyze error syndromes and decode operations more intuitively.
Moreover, the Keçeci Layout complements hybrid algorithmic approaches proposed in the field of quantum computation, such as those integrating classical matrix multiplication algorithms like Coppersmith-Winograd into decoding pipelines [31]. By providing structured layouts, the algorithm supports faster decoding processes and enhances interpretability during simulation and debugging stages.
One of the key strengths of the Keçeci Layout lies in its adaptability across multiple platforms. Its compatibility with libraries such as NetworkX, Rustworkx, and igraph enables seamless integration into existing workflows, both in classical and quantum contexts. For instance, when working with large-scale simulations involving millions of theoretical qubits [32], the algorithm’s predictable output helps reduce computational overhead associated with dynamic layout recalculations.
In addition to its technical utility, the Keçeci Layout reflects a broader interdisciplinary philosophy. As emphasized in works exploring Weyl semimetals, Majorana fermions, and nodal-line semimetals [33], geometric and topological insights are increasingly shaping modern quantum technologies. The Keçeci Layout serves as a bridge between abstract mathematical constructs and tangible physical implementations, enabling clearer communication of complex relationships in layered structures containing exotic fermionic states [34].
Furthermore, the algorithm integrates naturally into optimization frameworks targeting multi-processor architectures, including Cython, Numba, and JAX-based parallelization strategies [35]. These tools are essential for accelerating quantum simulations, especially in Noisy Intermediate-Scale Quantum (NISQ) devices where noise mitigation techniques such as zero-noise extrapolation (ZNE) and probabilistic error cancellation (PEC) are crucial [36].
The Keçeci Layout also contributes to the development of autonomous and convolutional quantum algorithms powered by artificial intelligence, as explored in relation to the Künneth theorem [36]. By offering structured and interpretable visual outputs, the layout aids in training machine learning models that predict optimal decoding paths or adaptive error correction schemes.
In summary, the Keçeci Layout represents more than just a visualization tool—it embodies a convergence of number theory, geometry, and quantum information science. Its deterministic, scalable, and library-agnostic design makes it a valuable asset in both classical and quantum computing research. As quantum systems grow in complexity and scale, tools like the Keçeci Layout will become indispensable for ensuring clarity, efficiency, and insight in the visualization of intricate data structures.
VI. Background: Graph Layout Techniques in Quantum Computing
Graph visualization plays a critical role in understanding complex relationships within quantum computing systems, particularly in the context of quantum error correction, topological qubit architectures, and hybrid algorithmic frameworks. The Keçeci Layout offers a deterministic and scalable approach to node placement, enabling consistent and interpretable visualizations across various graph libraries such as NetworkX, Rustworkx, igraph, Networkit, and Graphillion. This paper explores the application of the Keçeci Layout in the domain of quantum computing, focusing on its utility in visualizing surface code structures, topological materials, and hybrid quantum-classical algorithms. We also discuss how this layout method aligns with recent advancements in quantum simulation, error mitigation strategies, and artificial intelligence-assisted decoding techniques.
Quantum computing is poised to revolutionize scientific computation by solving problems that are intractable for classical computers. However, the complexity of quantum systems—particularly those involving large-scale qubit arrays and topological architectures—requires robust tools for data interpretation and system design. One such tool is graph visualization, which enables researchers to map abstract relationships into spatial representations, aiding in the comprehension of quantum circuits, error syndromes, and logical qubit interactions.
The Keçeci Layout, zigzag-based positioning mechanism that ensures minimal node overlap and high spatial consistency. Unlike force-directed or hierarchical methods, the Keçeci Layout is deterministic, making it especially suitable for applications requiring reproducibility and version-controlled visualization.
This paper investigates the integration of the Keçeci Layout into quantum computing workflows, emphasizing its relevance in visualizing error-corrected qubit lattices, topological material structures, and hybrid quantum-classical optimization pipelines.
Challenges in Visualizing Quantum Systems
Visualizing quantum systems presents unique challenges due to their high-dimensional nature and sensitivity to noise. In particular:
Surface Code Architectures: These rely on two-dimensional lattice structures where each qubit corresponds to an edge or vertex. Effective visualization must preserve spatial adjacency while highlighting error syndromes.
Topological Materials: Structures such as Weyl semimetals and Majorana zero modes involve layered geometries that require precise spatial mapping.
Hybrid Algorithms: Many NISQ (Noisy Intermediate-Scale Quantum) algorithms combine classical and quantum components, necessitating clear separation and interaction patterns.
Existing Layout Methods
Traditional layout algorithms such as force-directed layouts (e.g., Fruchterman-Reingold), hierarchical layouts (e.g., Sugiyama method), and spectral layouts have been widely used in general-purpose graph visualization. However, they often suffer from non-determinism, computational overhead, or limited scalability—issues that are exacerbated in quantum contexts.
The Keçeci Layout Algorithm
The Keçeci Layout employs a sequential-zigzag strategy for placing nodes along a primary axis while alternating offsets on the secondary axis. This approach results in a compact, readable layout that minimizes node overlap and supports both vertical and horizontal orientations.
Key features include:
- Deterministic output: Ensures reproducibility across runs.
- Library agnosticism: Compatible with major Python graph libraries.
- Customizable orientation: Supports four directional placements.
- Scalability: Efficient even for large graphs with thousands of nodes.
The algorithm’s implementation spans multiple platforms including NetworkX, Rustworkx, igraph, Networkit, and Graphillion, enabling seamless integration into existing quantum software stacks.
Application in Quantum Computing
Visualizing Surface Code Lattices
In fault-tolerant quantum computing, surface codes are among the most promising error correction schemes. They encode logical qubits using a two-dimensional grid of physical qubits. The Keçeci Layout can be employed to visualize these grids consistently, ensuring that error syndromes and decoding operations are represented clearly and uniformly. For example, in simulations involving millions of theoretical qubits [32], the Keçeci Layout facilitates efficient rendering of large-scale surface code lattices without compromising clarity or spatial accuracy.
Representation of Topological Materials
Topological materials such as Weyl semimetals [33] and Majorana fermion-containing structures [34] exhibit complex layered arrangements. The Keçeci Layout’s ability to maintain consistent node spacing and directionality makes it ideal for illustrating these multi-layered systems.
By preserving structural symmetries and minimizing visual clutter, the layout aids in identifying key physical properties such as chirality, spin texture, and Fermi arc connectivity.
Hybrid Quantum-Classical Algorithms
Hybrid algorithms, such as Variational Quantum Eigensolvers (VQE) and Quantum Approximate Optimization Algorithms (QAOA), integrate classical optimization loops with quantum subroutines. The Keçeci Layout supports the visualization of these dual-domain processes by structuring quantum circuits alongside classical control flows.
Additionally, when combined with machine learning models trained on past low-error executions [36], the layout can highlight optimal ansatz configurations and adaptive parameter updates.
Integration with Error Mitigation Techniques
Error mitigation remains a cornerstone of NISQ-era quantum computing. Techniques such as Zero-Noise Extrapolation (ZNE) and Probabilistic Error Cancellation (PEC) benefit from visual diagnostics that track error propagation and fidelity improvements.
The Keçeci Layout enhances the interpretability of these diagnostics by providing stable visual baselines across different noise levels and mitigation steps. This is particularly useful in debugging noisy circuits and evaluating the performance of error suppression algorithms.
Conclusion and Future Directions
The Keçeci Layout represents a novel and effective solution for deterministic, scalable graph visualization in quantum computing. Its compatibility with diverse graph libraries and alignment with topological and hybrid algorithmic paradigms make it a valuable tool for both research and educational purposes.
Future work includes:
- Extending the layout to support dynamic graphs (e.g., dynamic quantum states).
- Incorporating interactive features via JupyterLab and web-based interfaces.
- Integrating with quantum simulators such as Qiskit, Cirq, and Braket.
- Applying the layout to real-time decoding pipelines for topological error correction.
As quantum hardware continues to scale and diversify, tools like the Keçeci Layout will play a crucial role in bridging the gap between abstract theory and practical implementation.
VII. Enhancing Clarity and Reproducibility in Chemical Graph Visualization with the Keçeci Layout
The Keçeci Layout is a deterministic graph visualization algorithm that arranges nodes in a sequential, expanding zigzag pattern. Unlike force-directed algorithms (e.g., Fruchterman-Reingold), which optimize for topological structure and produce non-identical results on each run, the Keçeci Layout is designed for contexts where the order of the nodes is meaningful. Its deterministic nature ensures that the same graph will always produce the exact same visualization, a crucial feature for scientific reproducibility.
Its primary applications in chemistry include:
- 1.
-
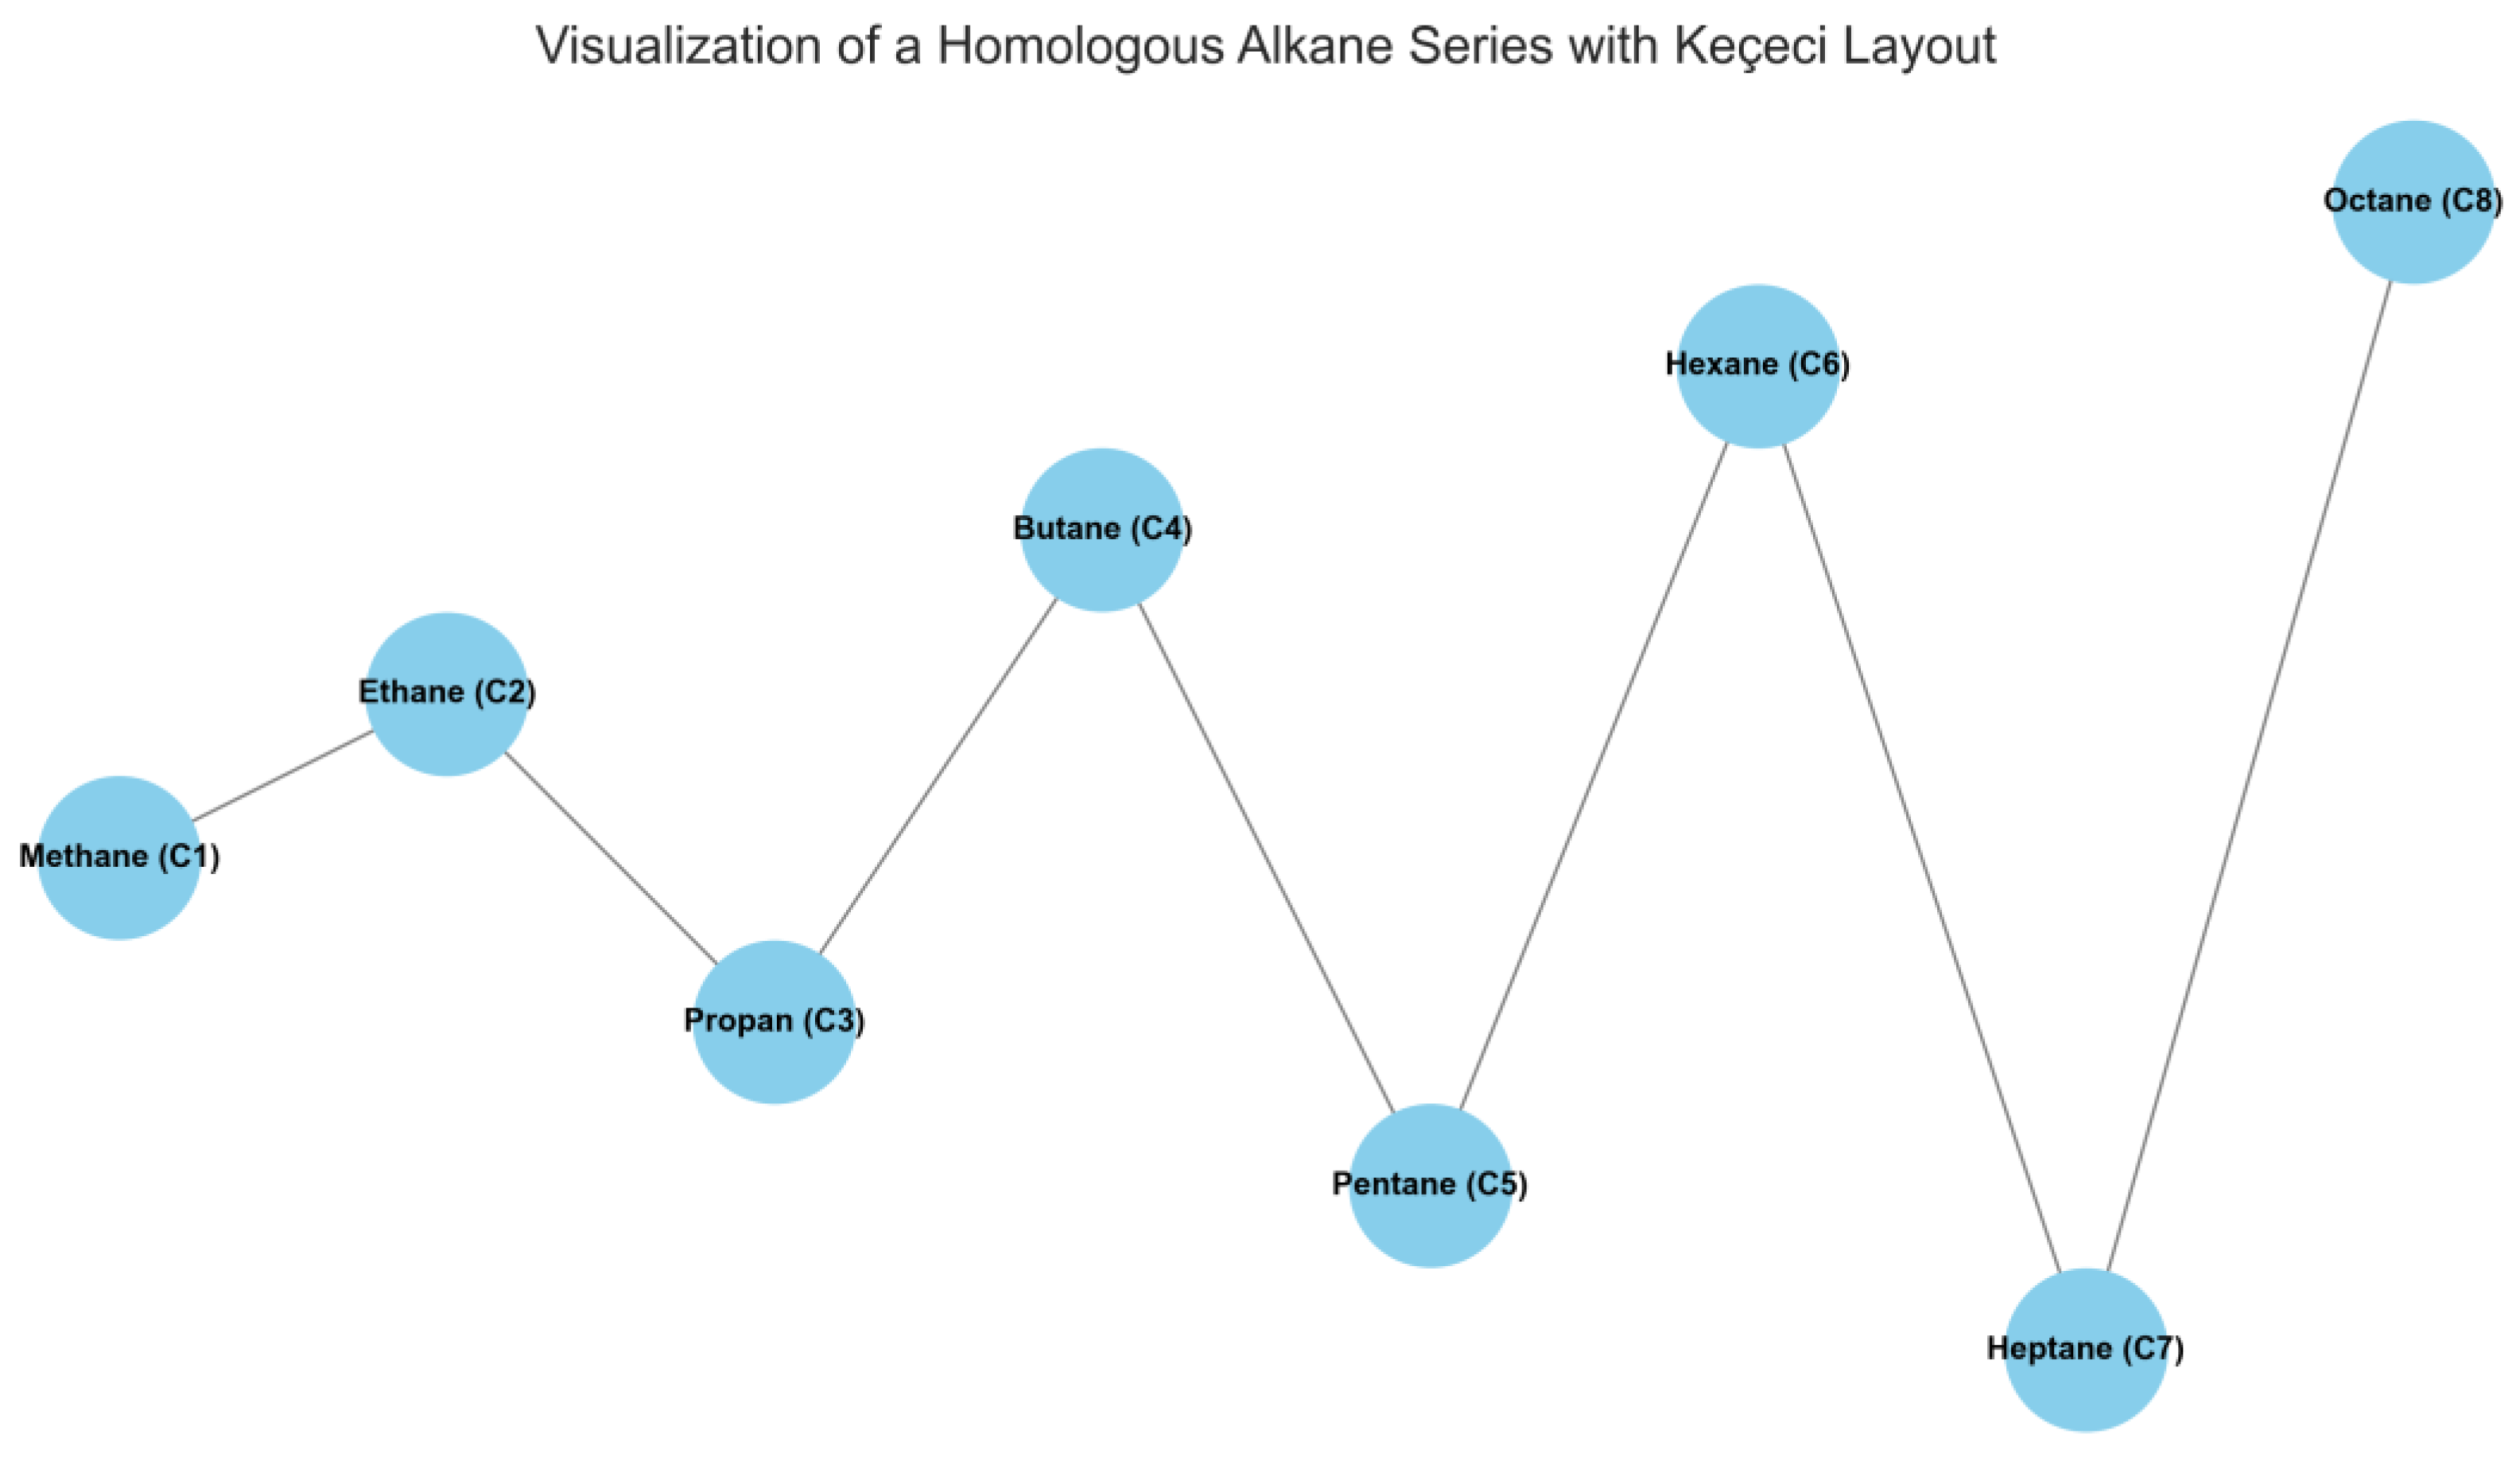
Visualizing Homologous Series and Molecular Libraries
- Application: Systematically representing series of molecules where a core structure is incrementally modified, such as alkanes (CH₄, C₂H₆, C₃H₈, ...), or a combinatorial library where different functional groups are added to a scaffold.
- Problem: Traditional layouts scatter these molecules based on similarity metrics or connectivity, obscuring the logical, step-by-step progression of the series.
- Solution with Keçeci Layout: By ordering the molecules according to a meaningful property (e.g., carbon count, molecular weight, calculated property), the layout visually represents this progression along a primary axis. The zigzag pattern ensures that labels and structures do not overlap, even for long series.
-
Benefits:
- ○
- Intuitive Progression: The visual flow directly mirrors the systematic change in the molecular series.
- ○
- Clarity: Prevents visual clutter and makes it easy to compare adjacent members of the series.
- ○
- Structure-Property Relationships: Helps in visually identifying trends in properties as the structure changes sequentially.
Nodes: [0, 1, 2, 3, 4, 5, 6, 7]
Figure 1.
Visualization of a Homologous Alkane Series with Keçeci Layout (Version 4).
- 2.
-
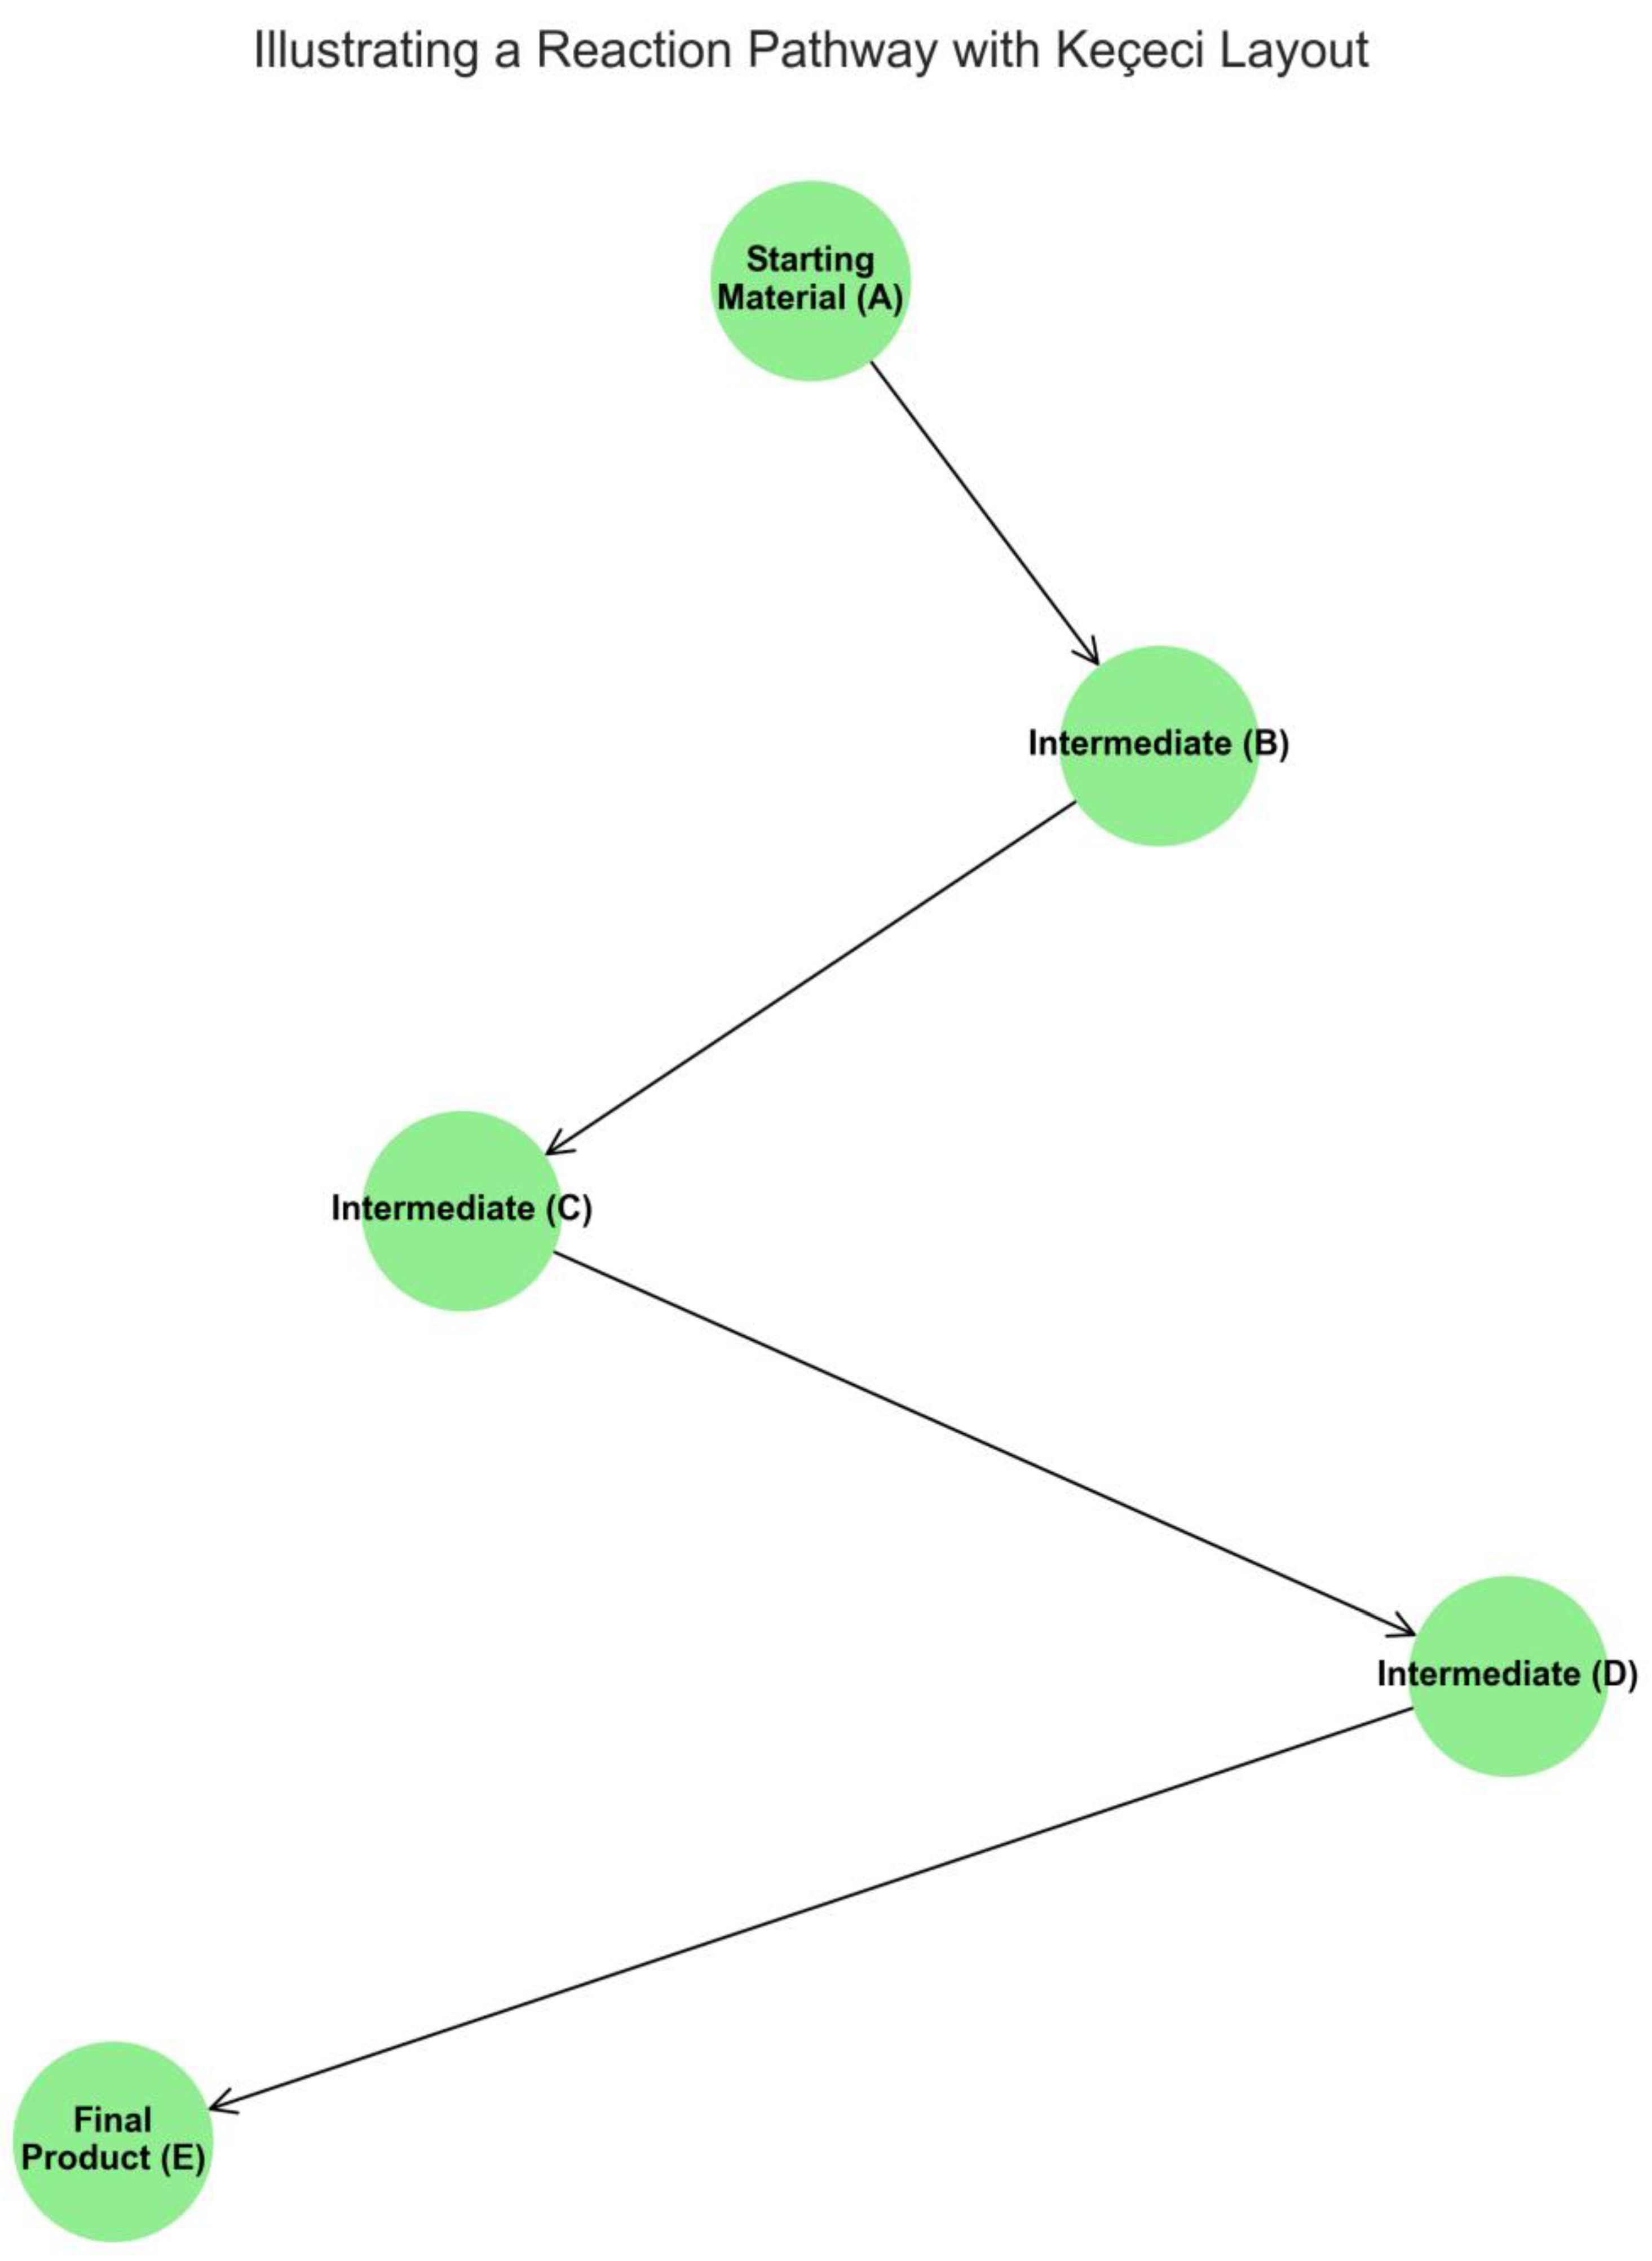
Illustrating Reaction Pathways and Synthetic Mechanisms
- Application: Mapping the steps of a chemical reaction, from starting materials through intermediates to the final products.
- Problem: Complex reaction networks can appear as a tangled “hairball” with force-directed layouts, making it difficult to follow the primary reaction sequence.
- Solution with Keçeci Layout: Nodes representing reactants, intermediates, and products are ordered chronologically. The layout arranges them in a clear, directional flow (e.g., top-to-bottom or left-to-right), making the entire process easy to follow.
-
Benefits:
- ○
- Sequential Clarity: The temporal or logical sequence of the reaction is preserved visually.
- ○
- Educational Tool: Excellent for teaching and explaining complex mechanisms without visual ambiguity.
- ○
- Reproducibility: The visualization of a published mechanism will remain consistent across all documents and presentations.
Nodes: [0, 1, 2, 3, 4]
Figure 2.
Visualization of a Homologous Alkane Series with Keçeci Layout (Version 4).
- 3.
-
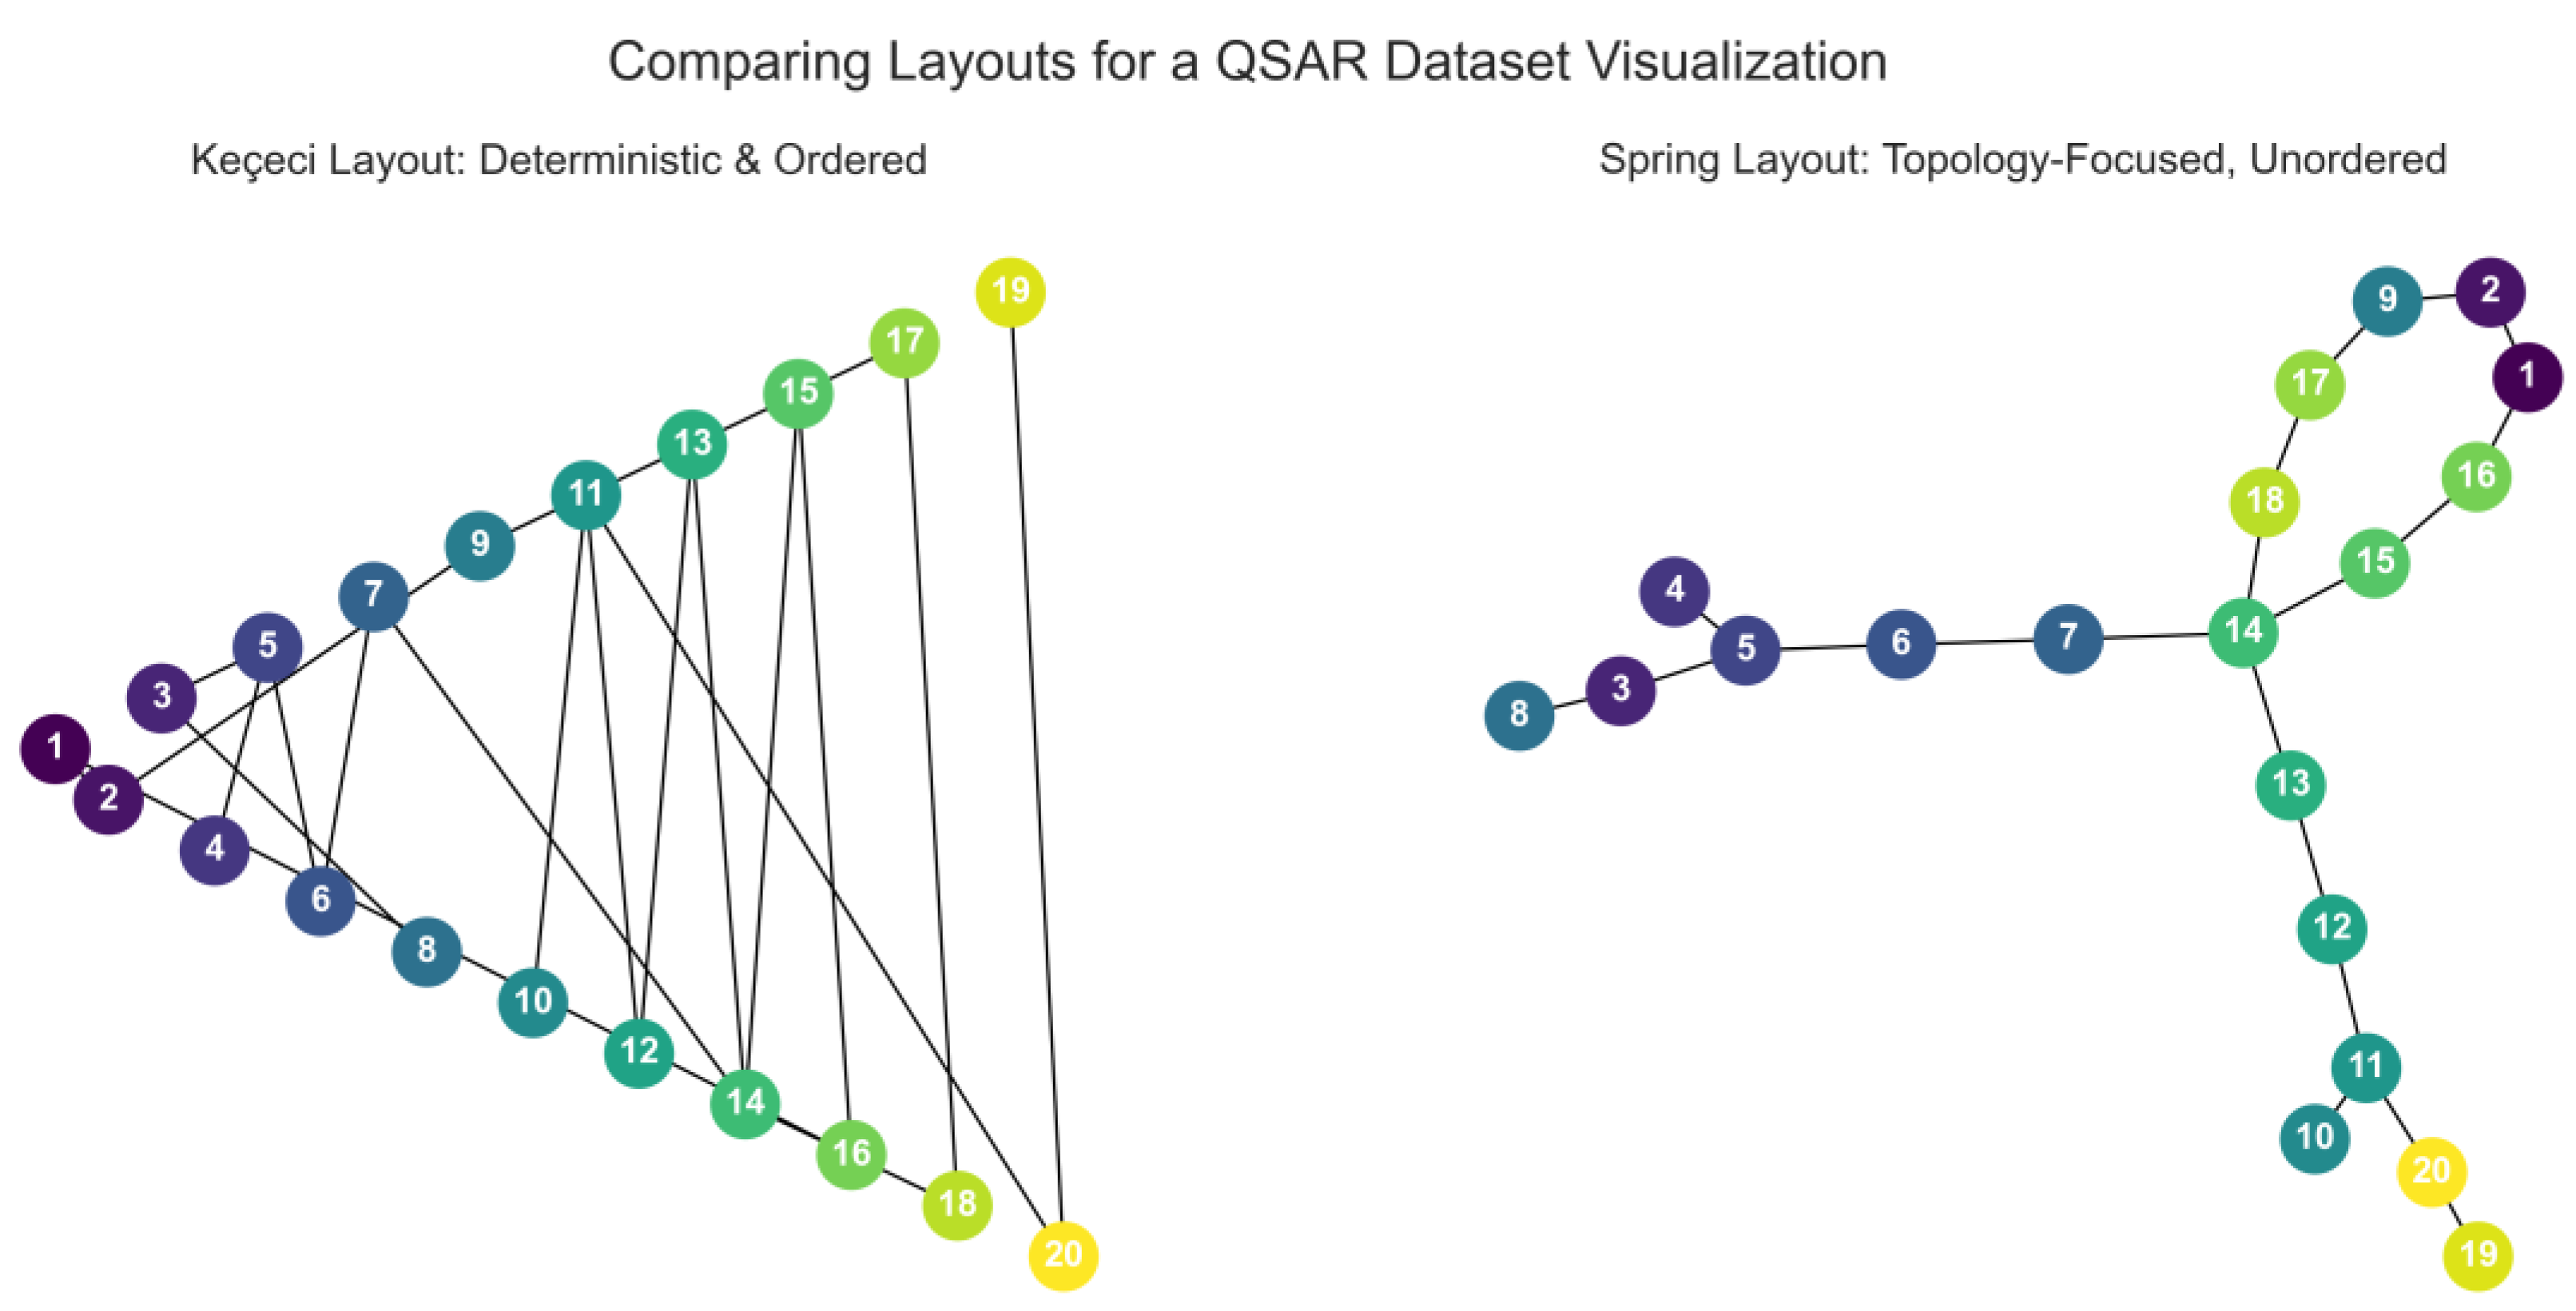
Ensuring Reproducibility in QSAR and Data-Driven Chemistry
- Application: Visualizing datasets for Quantitative Structure-Activity Relationship (QSAR) studies, where compounds are often sorted by activity, toxicity, or some other calculated descriptor.
- Problem: Non-deterministic layouts can produce different visualizations of the same dataset, potentially leading to misinterpretation or making it difficult to compare figures between a publication and a later analysis.
- Solution with Keçeci Layout: By sorting compounds based on their activity score or index, the Keçeci Layout provides a stable and predictable canvas. The most active compounds will always appear in a known region of the plot, and the overall structure of the data visualization is preserved.
-
Benefits:
- ○
- Absolute Reproducibility: Guarantees that figures in papers, reports, and presentations are identical and verifiable.
- ○
- Ordered Data Display: Makes it easy to visually locate high-scoring or low-scoring compounds in a sorted dataset.
- ○
- Standardization: Provides a standard way to visualize chemical datasets, improving communication and reducing ambiguity.
Figure 3.
Visualization of a Homologous Alkane Series with Keçeci Layout (Version 4).
VIII. Visualization of Physical Systems with the Keçeci Layout
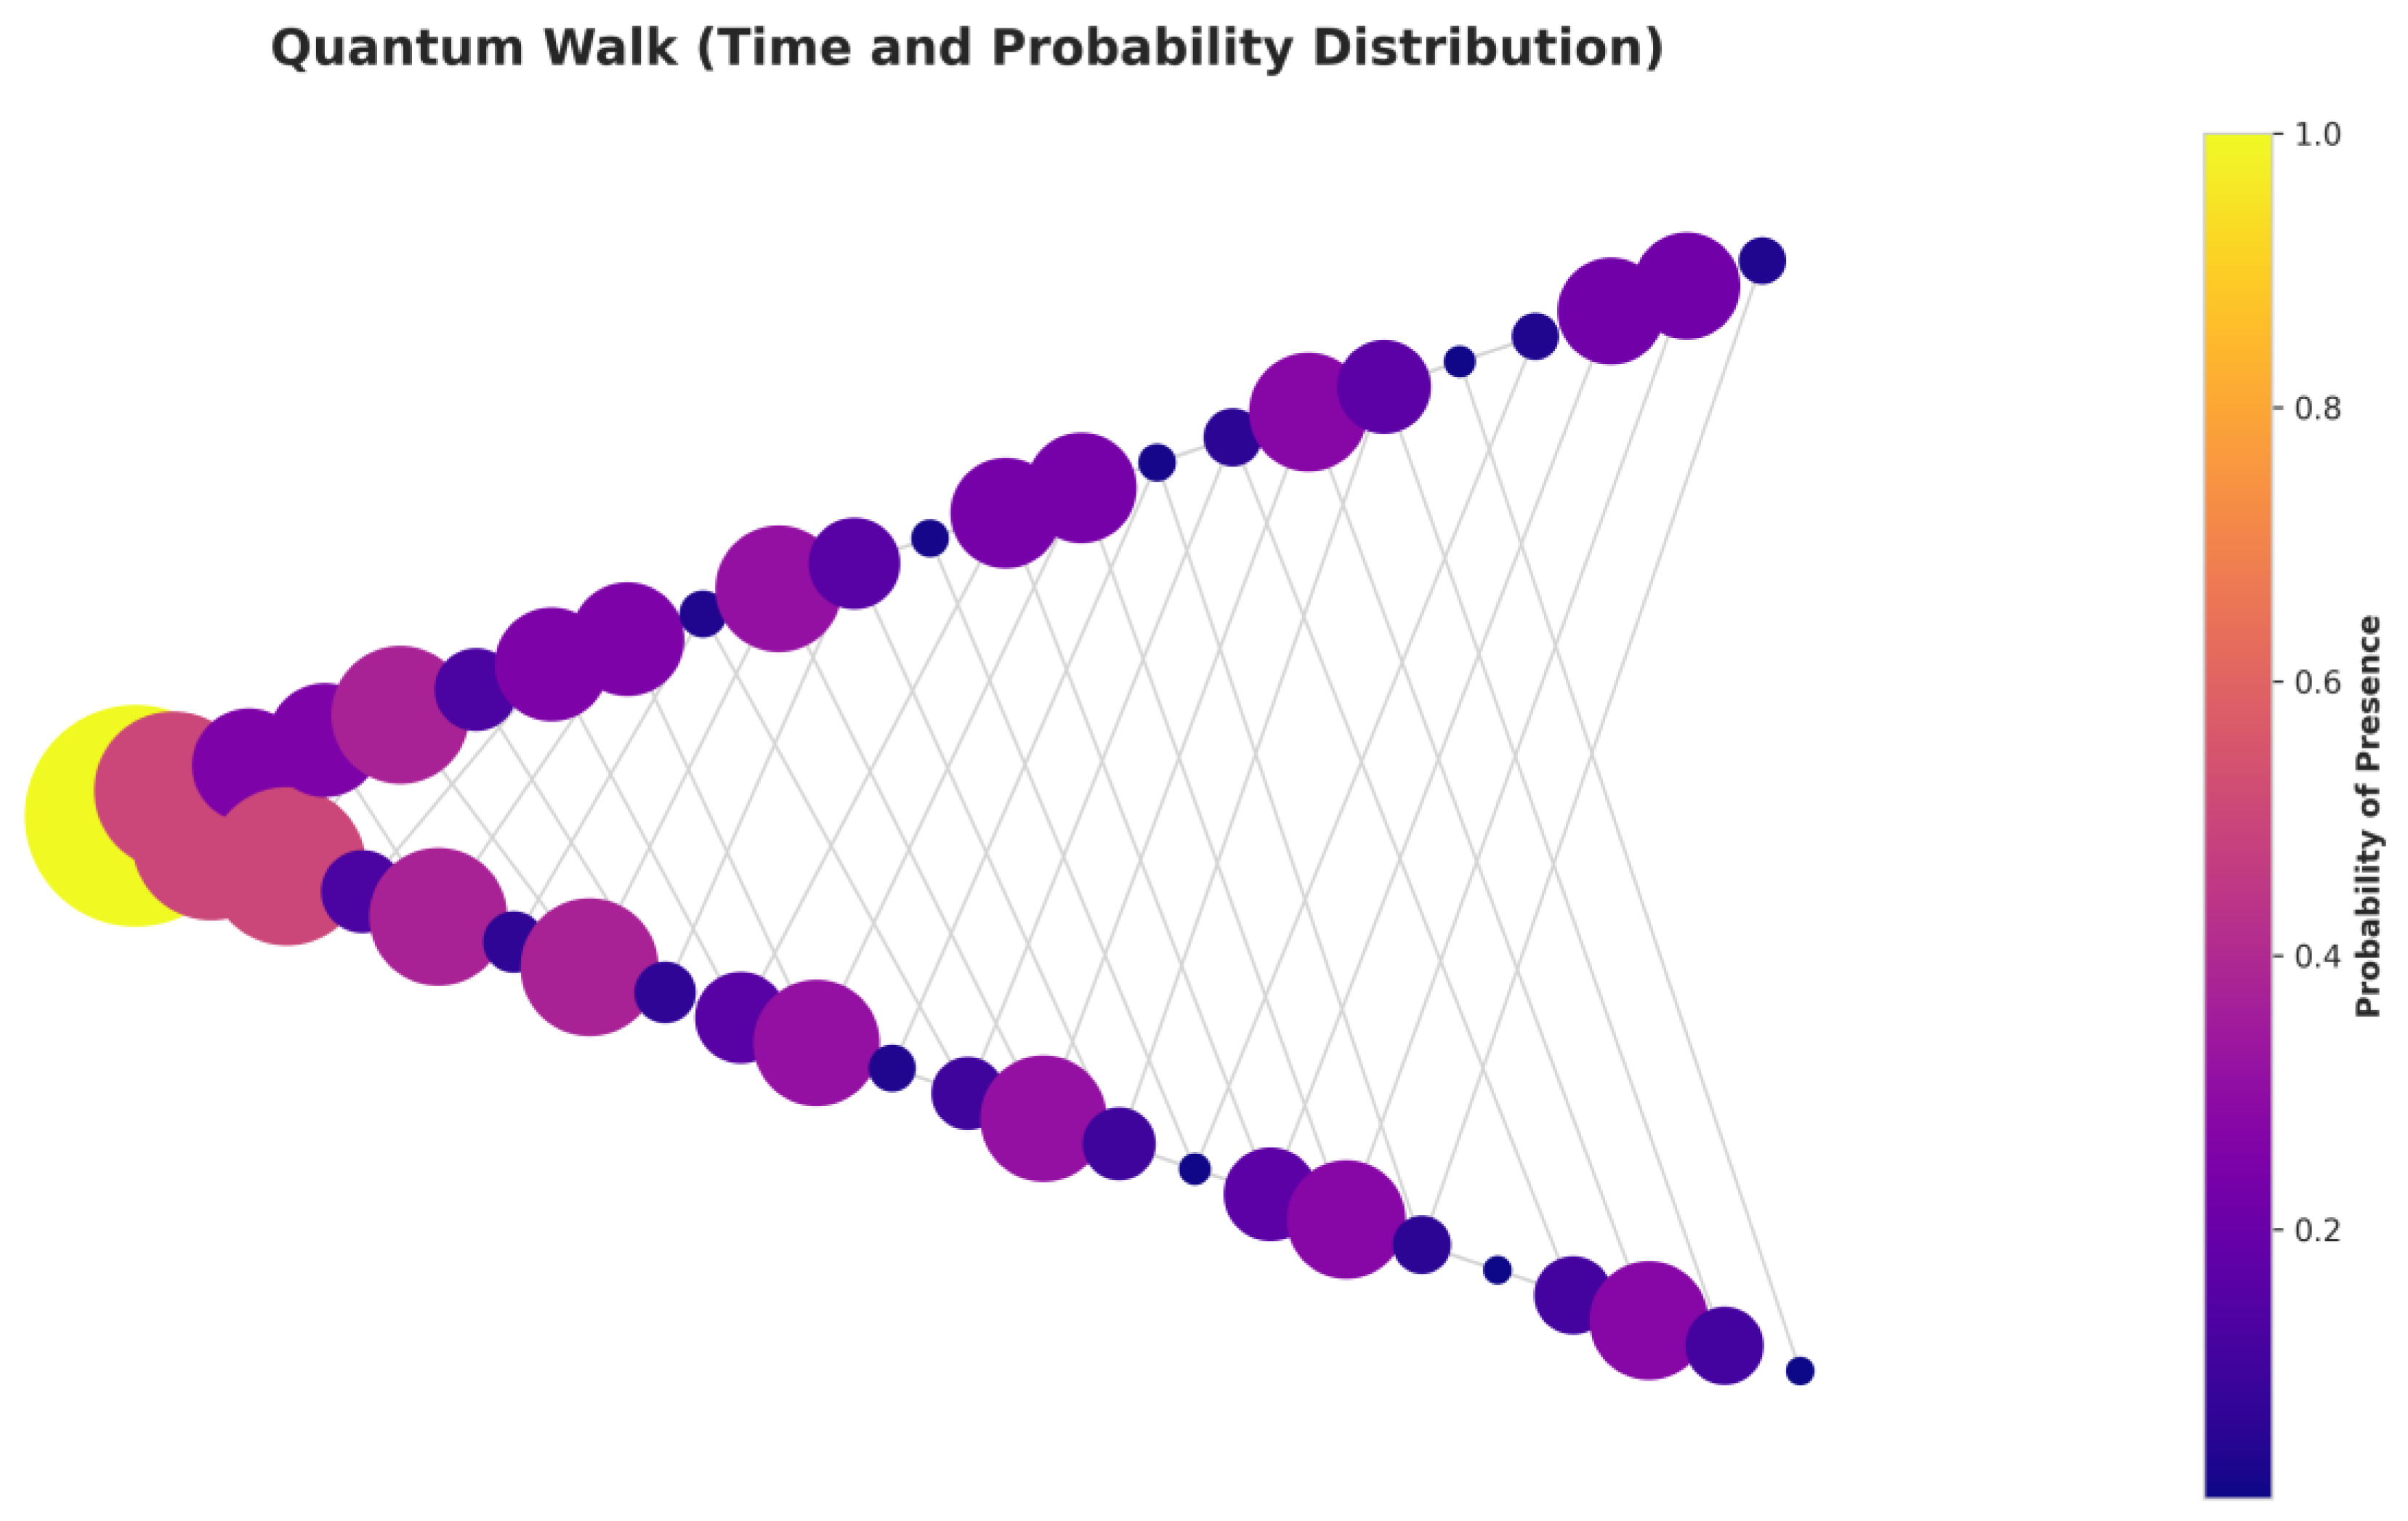
Quantum Walk (Time and Probability Distribution):
The quantum walk is the quantum-mechanical analogue of the classical random walk and serves as a fundamental building block for quantum computing algorithms. Unlike a classical walker, a quantum particle (e.g., an electron) can exist in a superposition of states, allowing it to move in multiple directions simultaneously at each step. This leads to the phenomenon of quantum interference, where different paths to the same location can interfere constructively or destructively.
This visualization depicts the time changing of a quantum walk on a one-dimensional line:
- Primary Axis (Horizontal): Represents the discrete time steps (t). The left-to-right direction of the Keçeci layout intuitively reflects the chronological flow of time.
- Secondary Axis (Vertical): Shows the position (x) of the particle on the 1D line. The zigzag pattern ensures that the distinct positions at each time step are clearly separated without visual overlap.
- Node Color and Size: Represents the probability (P(x,t)) of finding the particle at a specific time t and position x. Bright, large nodes indicate high probability, while dim, small nodes indicate low probability.
The graph clearly reveals the characteristic features of a quantum walk, which contrast sharply with the Gaussian distribution expected from a classical random walk. These features include the significantly faster propagation of the probability wave packet and the distinct bimodal distribution that forms at the edges. This is a direct result of constructive and destructive interference, and the Keçeci layout transforms this complex dynamic into an intelligible visual representation.
Figure 4.
Visualization of a Quantum Walk (Time and Probability Distribution) with Keçeci Layout (Version 4).
Figure 4.
Visualization of a Quantum Walk (Time and Probability Distribution) with Keçeci Layout (Version 4).
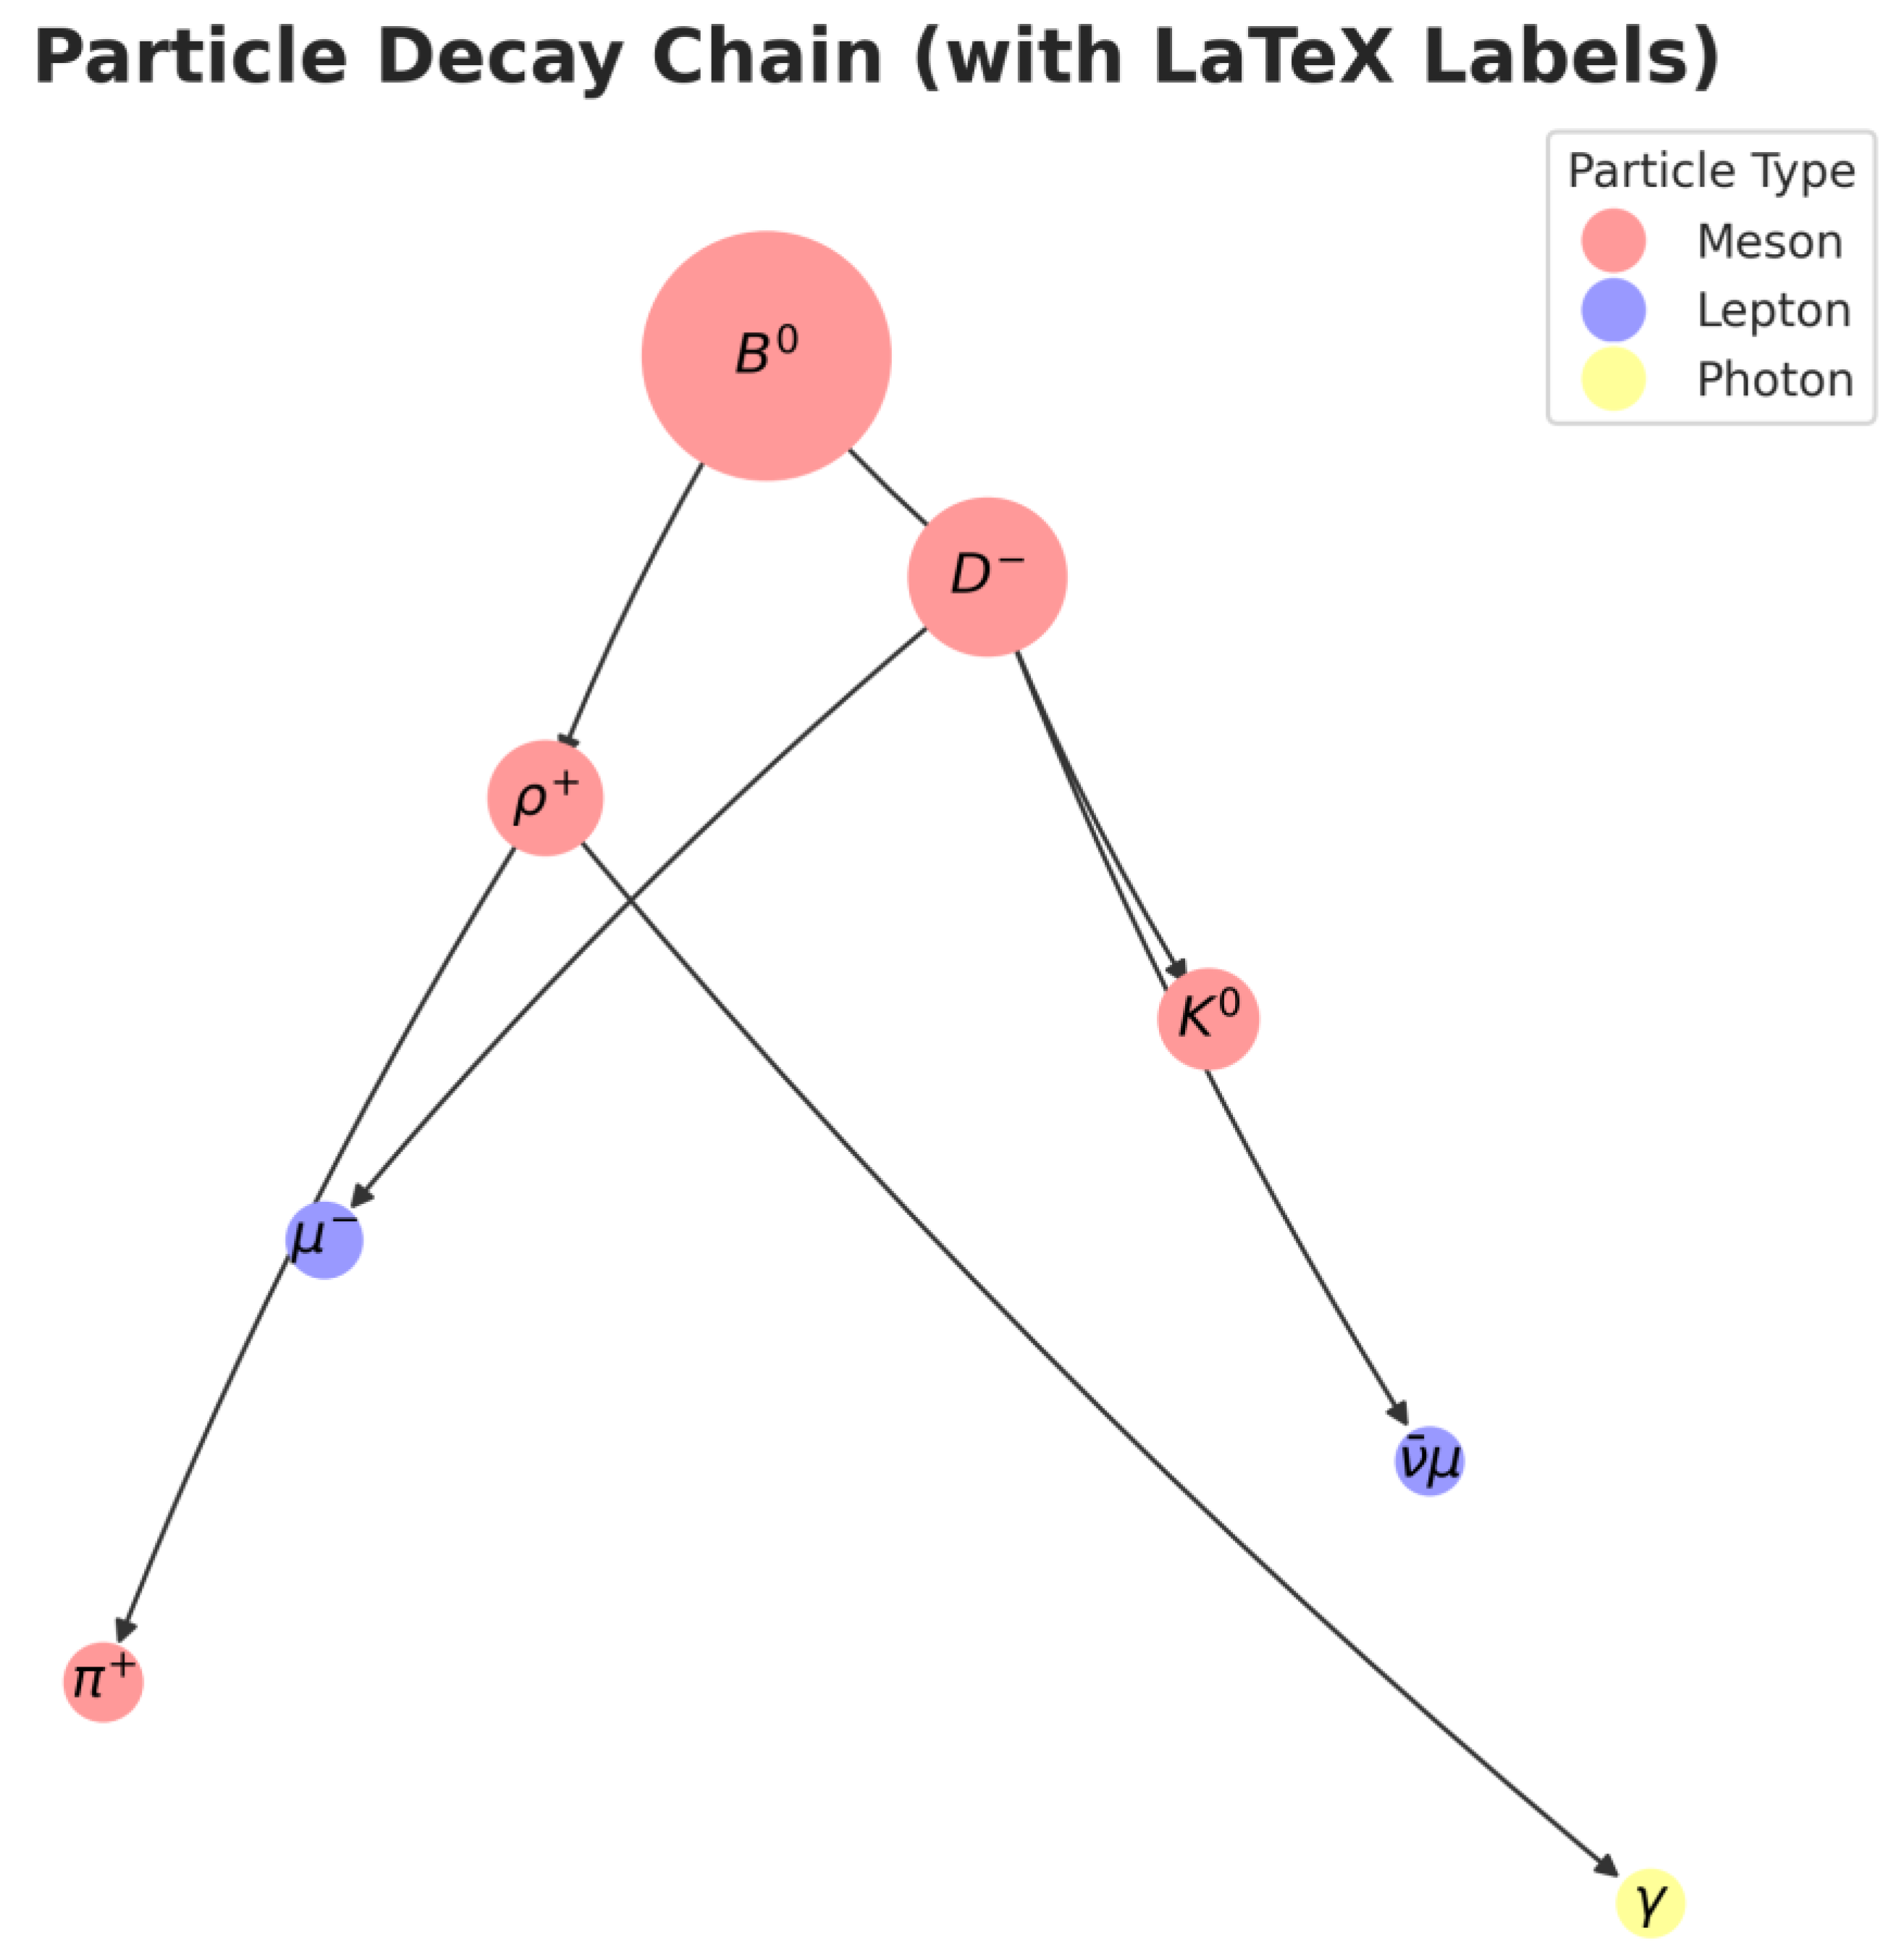
Particle Decay Chain:
In high-energy physics, unstable fundamental particles decay into lighter “daughter particles” in accordance with the principle of mass-energy equivalence and fundamental conservation laws (e.g., charge, lepton number). This decay process generates a hierarchical and causal tree-like structure, originating from a single parent particle. This visualization models the decay chain of a B⁰ meson. The effectiveness of the Keçeci layout here stems not only from the algorithm itself but from a deliberate academic choice made during data preparation:
- Ordering Strategy: The nodes were added to the graph not in an arbitrary or alphabetical order, but according to a causal hierarchy defined by the layout_order list. The parent particle (B⁰) is first, followed by its direct decay products (D⁻, ρ⁺), and this sequence continues down the hierarchy.
- Role of the Keçeci Layout: The algorithm takes this pre-defined order and arranges it into a clean, top-down zigzag pattern. This makes the “generations” of the decay process and the branching structure immediately apparent.
- Node Color: Adds a layer of categorical data, representing the particle family (Meson, Lepton, Photon).
- Node Size: Is proportional to the particle’s rest mass (in MeV/c²). This visually reinforces how mass is converted into lighter particles and energy during the decay.
This approach demonstrates how a topological structure, when combined with a meaningful ordering, can be transformed into a powerful narrative tool via the Keçeci layout.
Figure 5.
Visualization of a Particle Decay Chain with Keçeci Layout (Version 4).
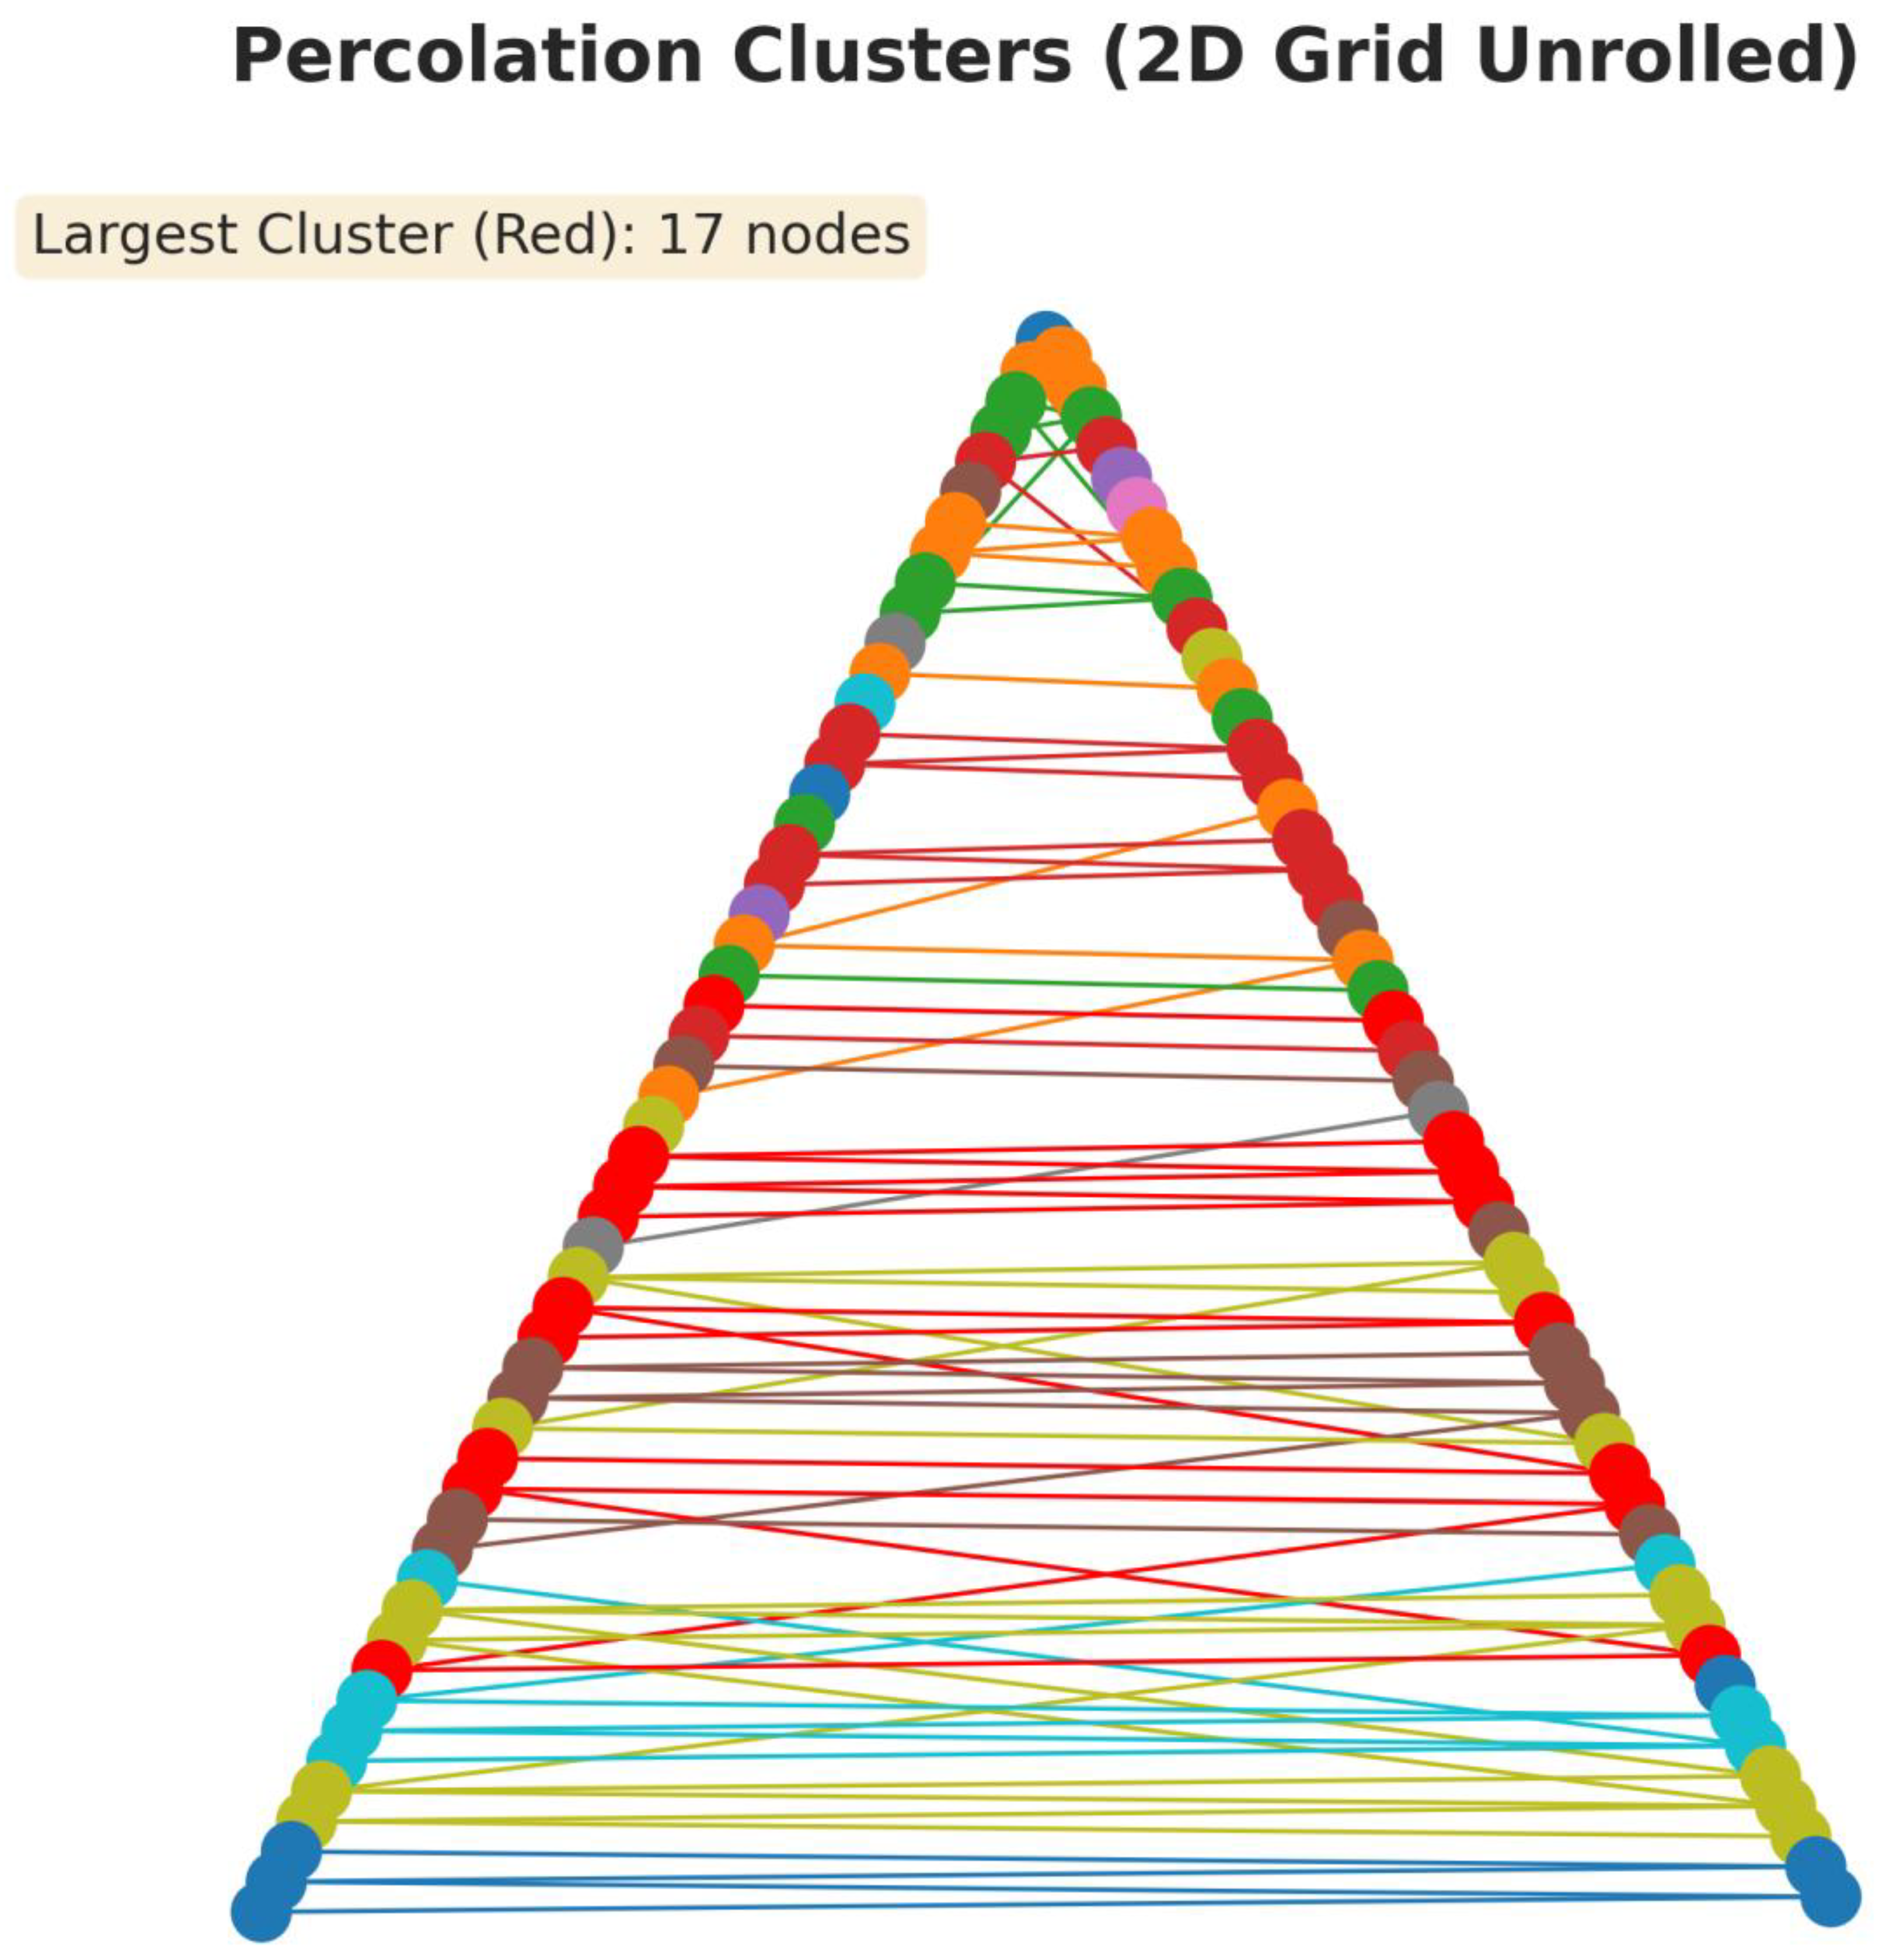
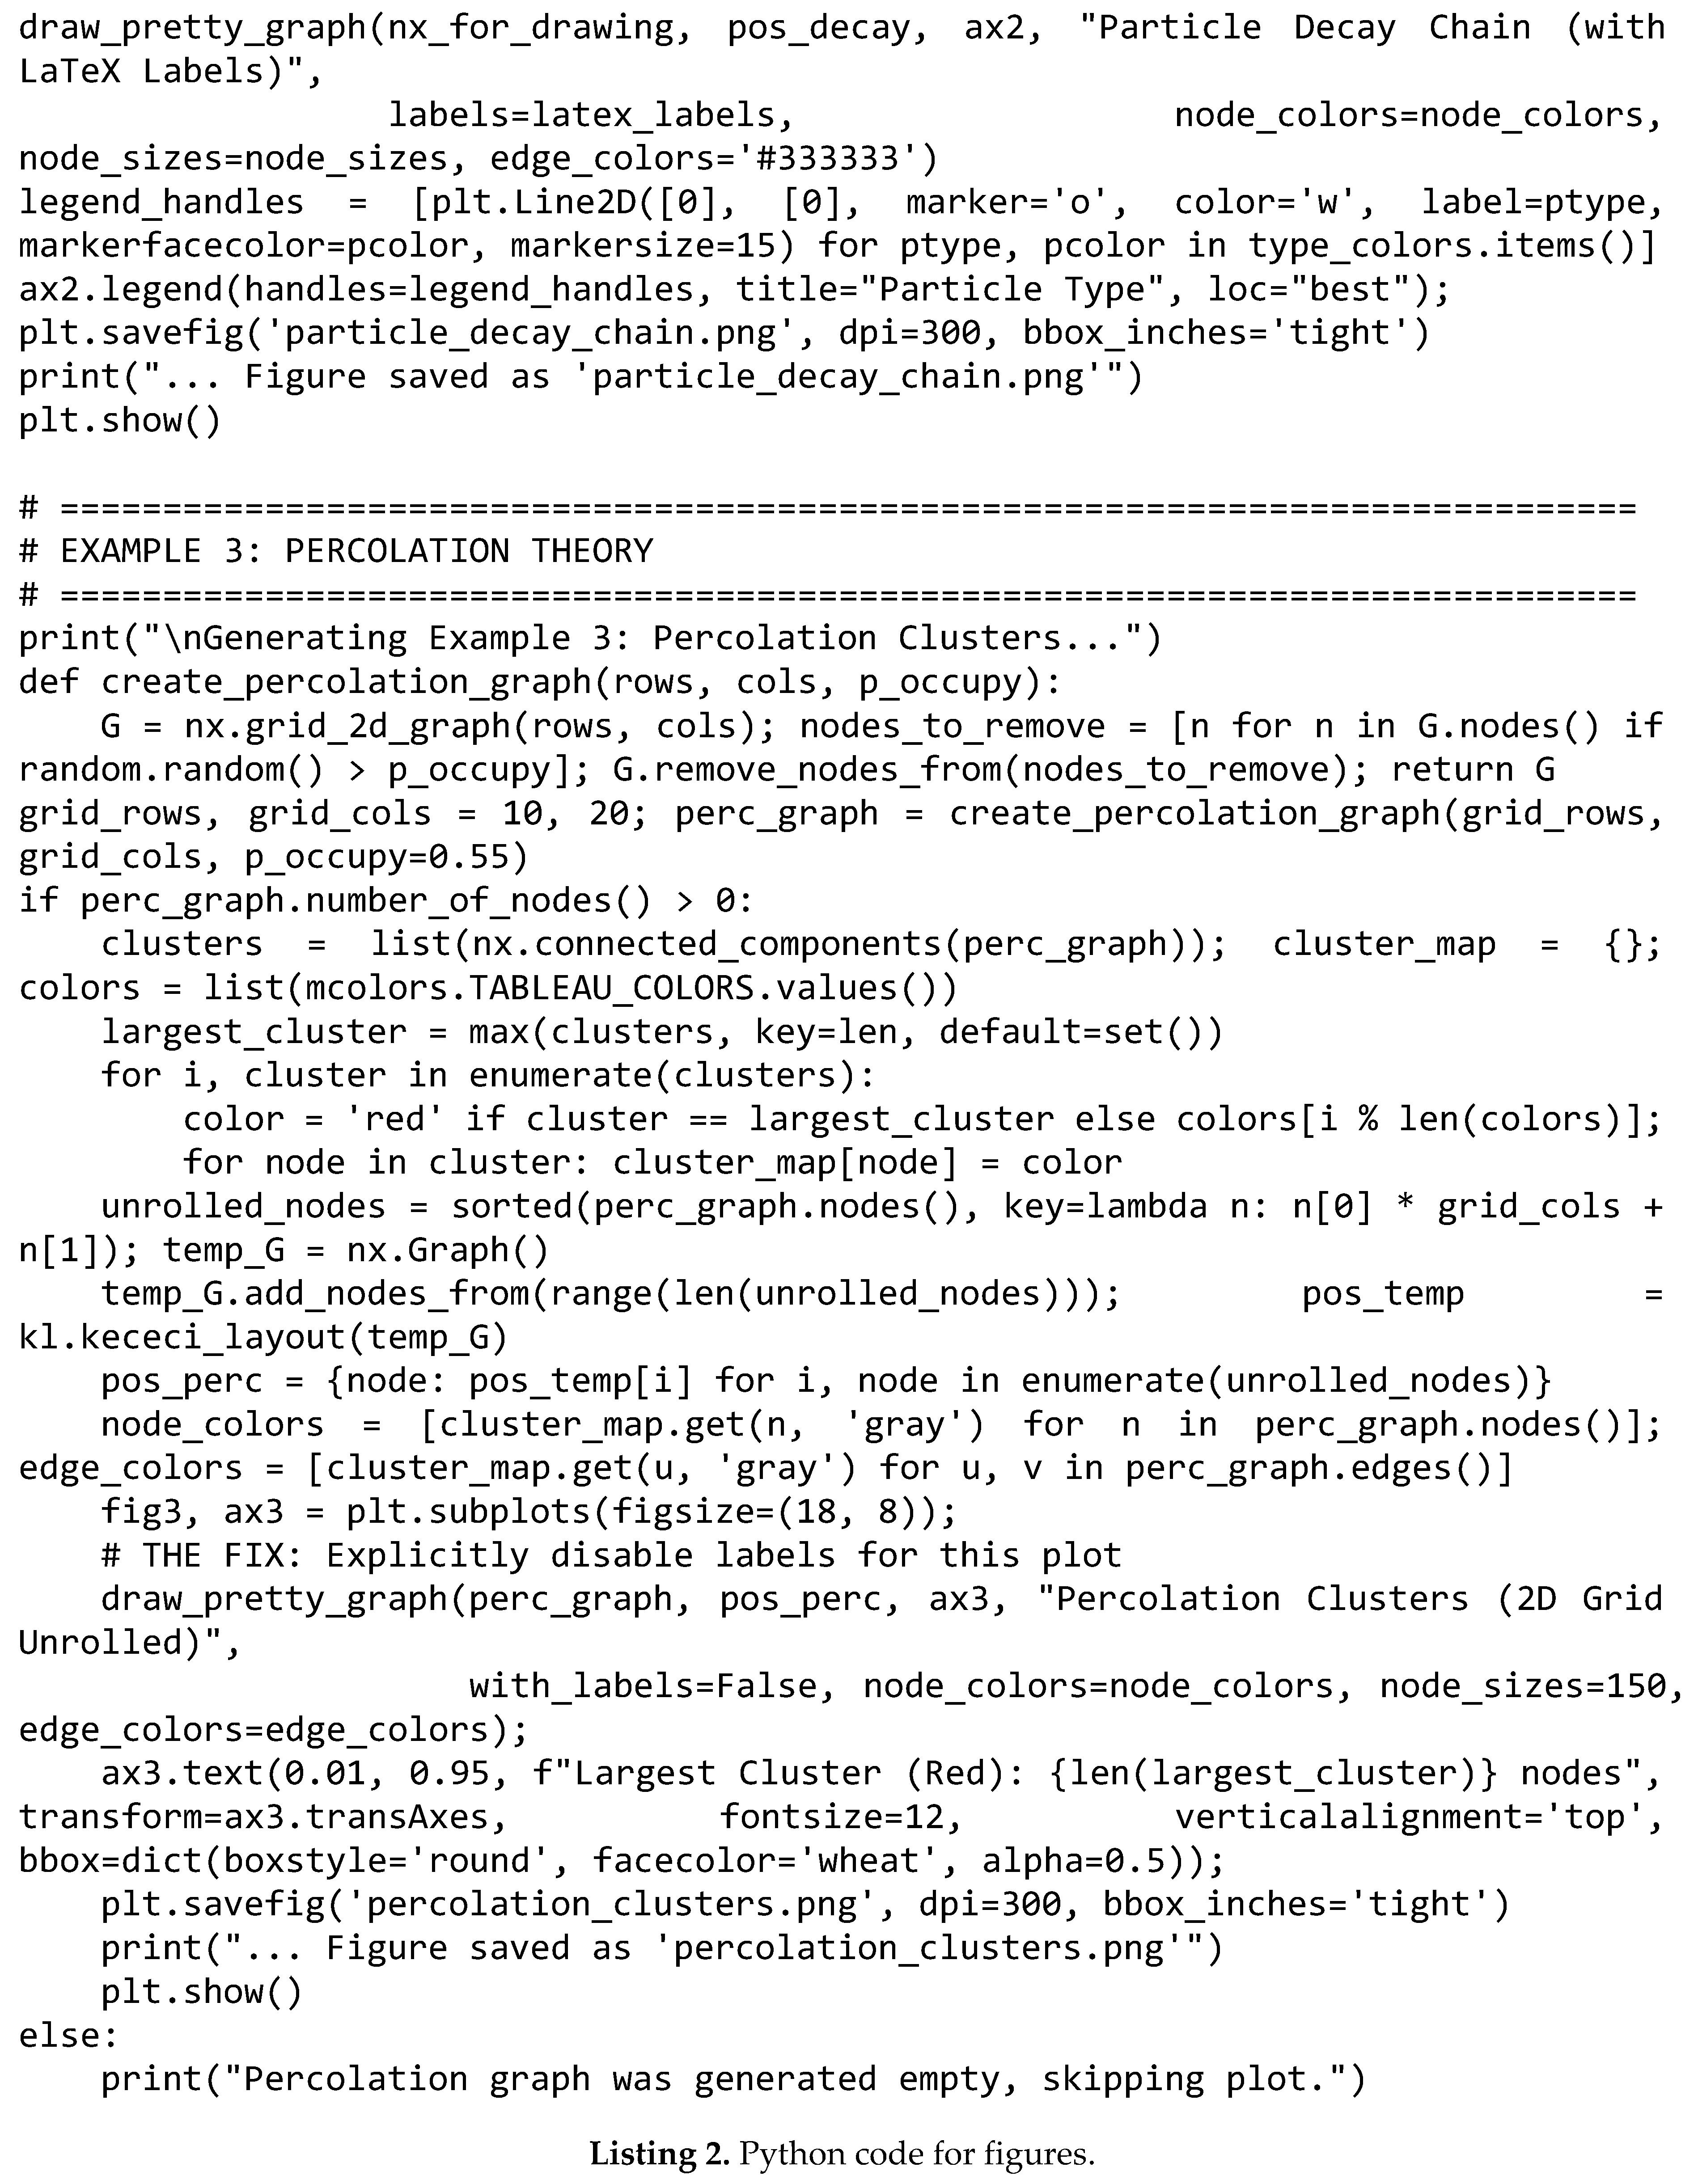
Percolation Clusters (2D Grid Unrolled):
Percolation theory is a model in statistical physics used to describe connectivity and phase transitions in random systems. It explains phenomena such as the flow of a liquid through a porous medium (e.g., a coffee filter) or the electrical conductivity of a composite material made of randomly placed conductive elements. When the occupation probability (p) of sites in the system exceeds a certain critical threshold (p_c), a massive connected component, known as a “spanning cluster” (or giant component), suddenly emerges, connecting one end of the system to the other.
This visualization analyses a percolation model on a 2D grid by innovatively applying the Keçeci layout:
- Dimensionality Reduction Technique: The Keçeci layout is inherently a 1D algorithm. The novelty of this visualization lies in “unrolling” the 2D grid into a 1D strip by mapping the (r, c) coordinates to a single index via the formula r * num_cols + c. This ordering preserves the row-by-row structure of the original grid.
- Role of the Keçeci Layout: The algorithm takes this long 1D strip and arranges it into a compact zigzag pattern. This allows a large 2D system to be displayed in a format suitable for inspecting the distribution and sizes of its clusters.
- Node Color: Indicates cluster membership. Each distinct group of connected nodes (a cluster) is encoded with a different color.
- Highlighted Color (Red): The largest cluster is specifically highlighted. This provides an at-a-glance assessment of whether a giant component has formed and whether the system has “percolated.”
This method offers an effective alternative to standard 2D representations for analysing the size distribution of clusters and the relative dominance of the largest component.
Figure 6.
Visualization of a Percolation Clusters (2D Grid Unrolled) with Keçeci Layout (Version 4).
Figure 6.
Visualization of a Percolation Clusters (2D Grid Unrolled) with Keçeci Layout (Version 4).
IX. Visual Analysis of Biological Processes and Networks with the Keçeci Layout
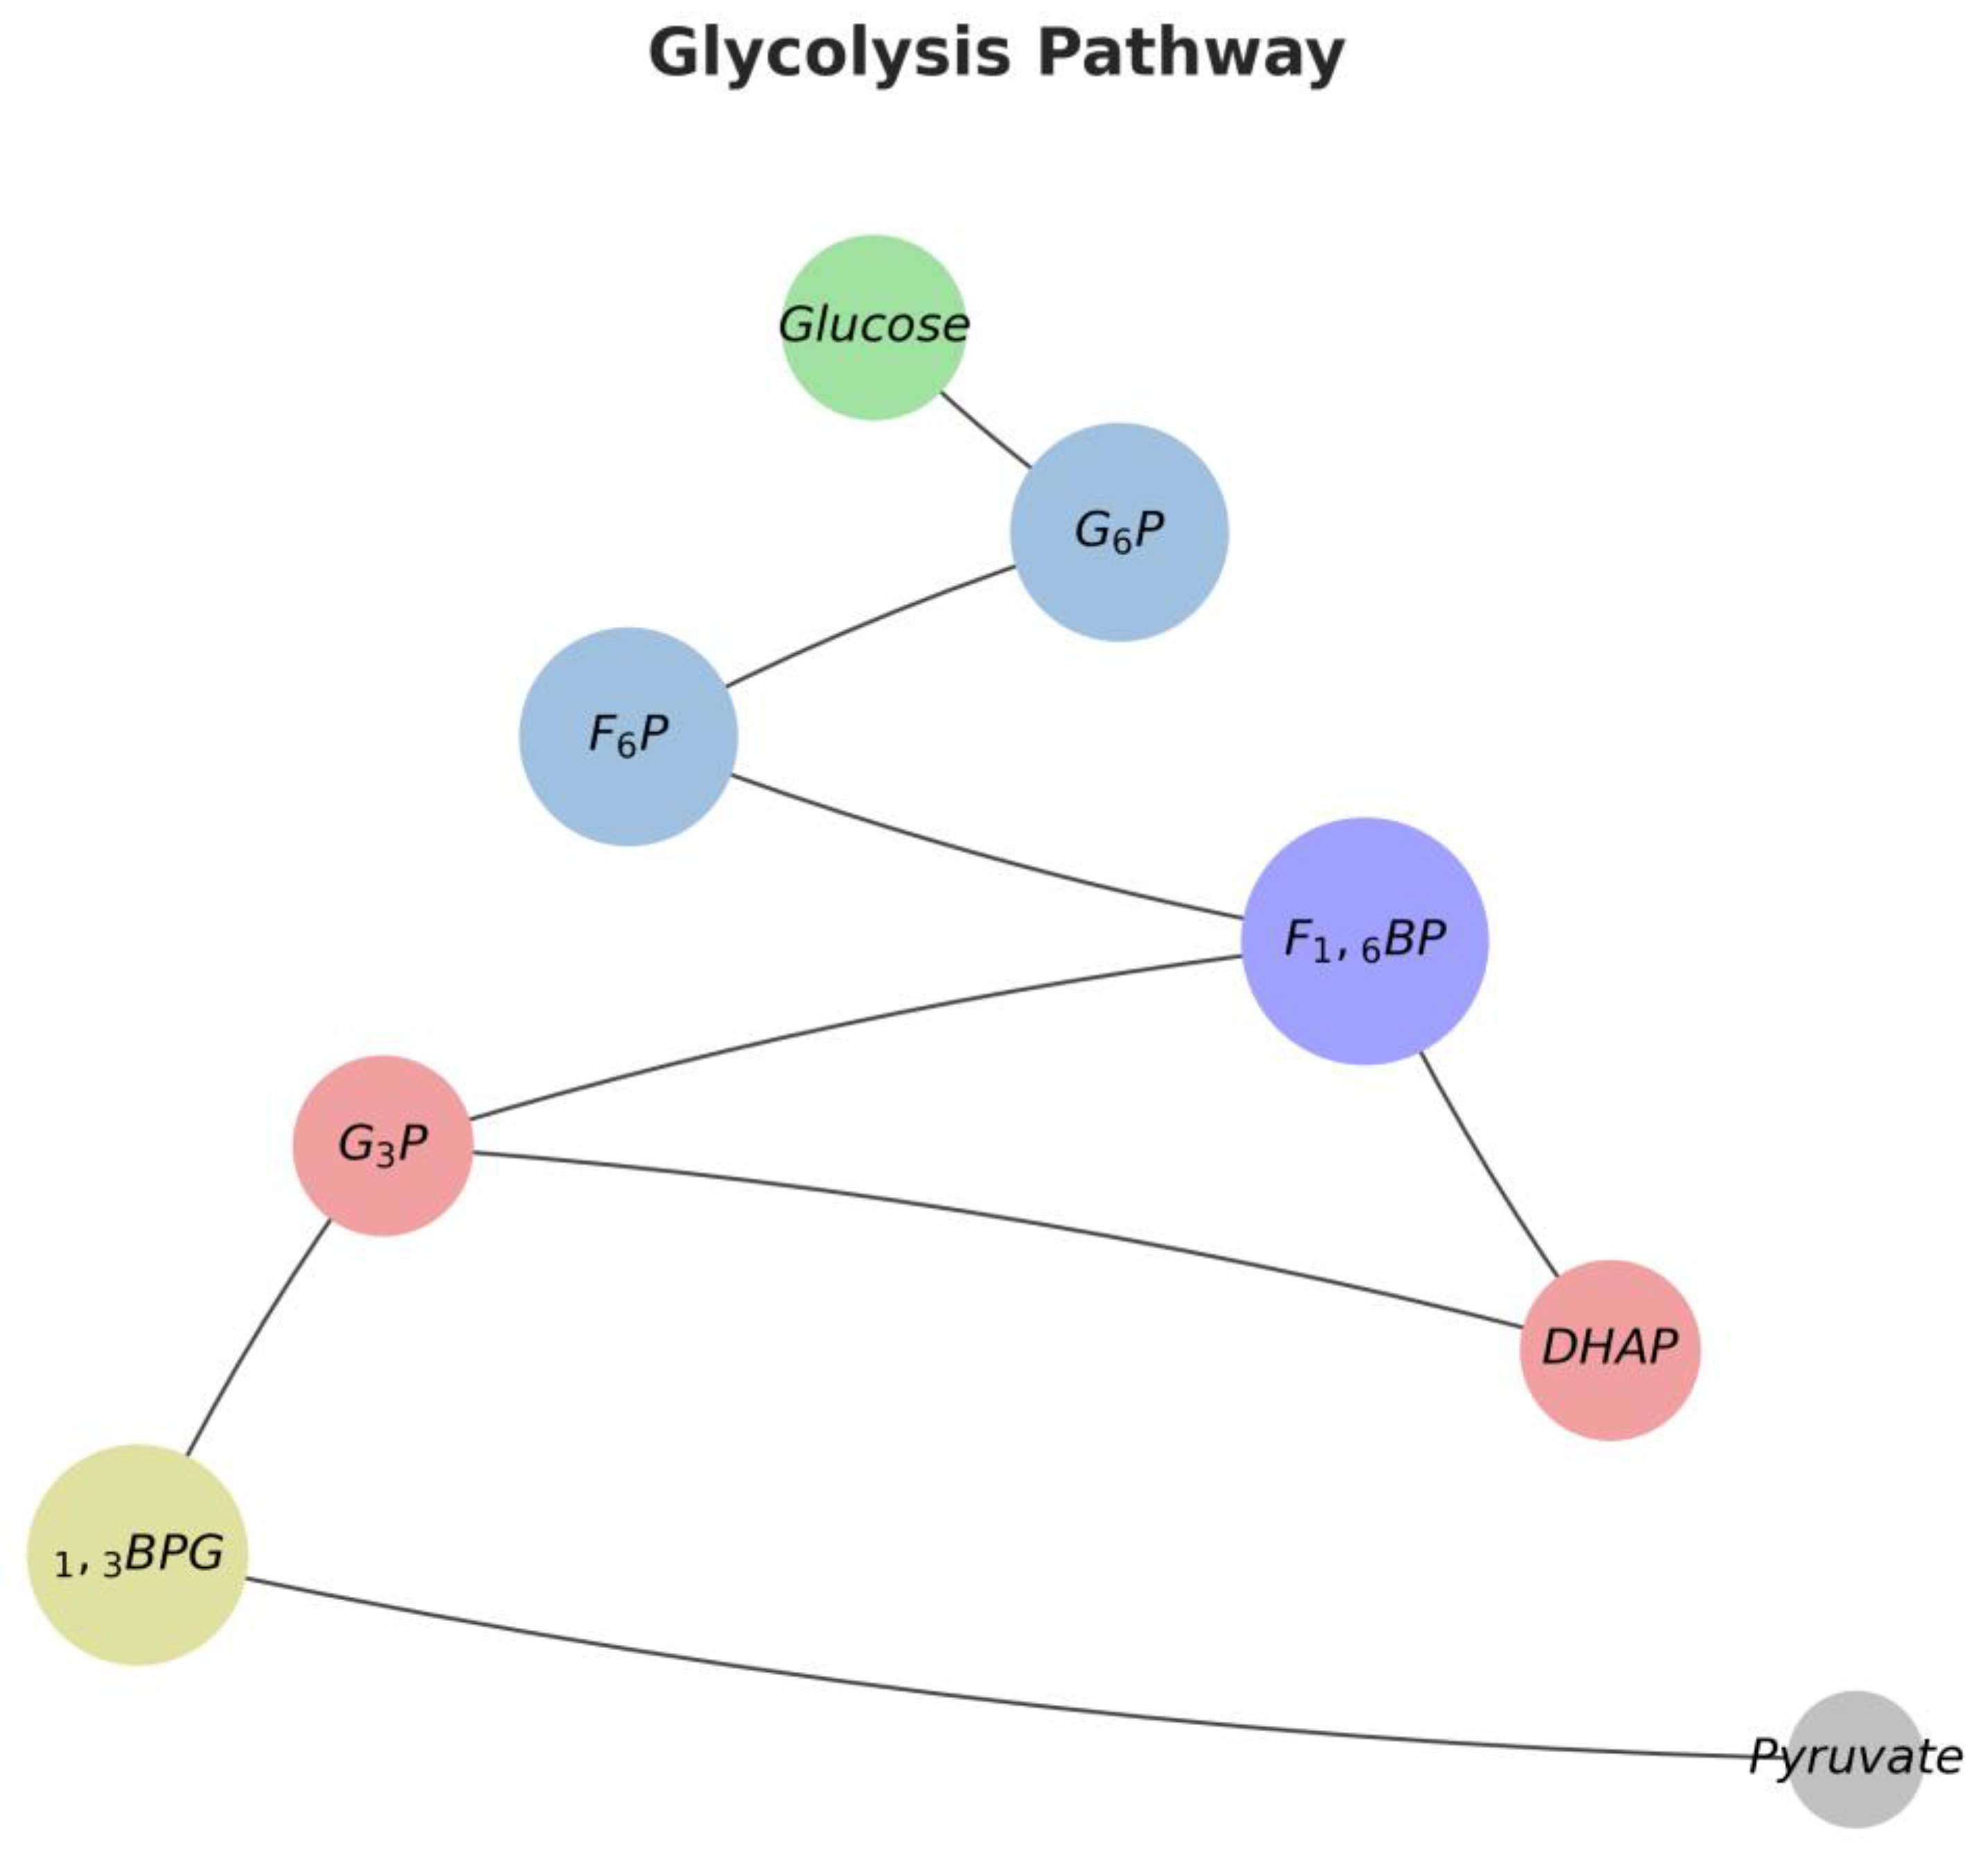
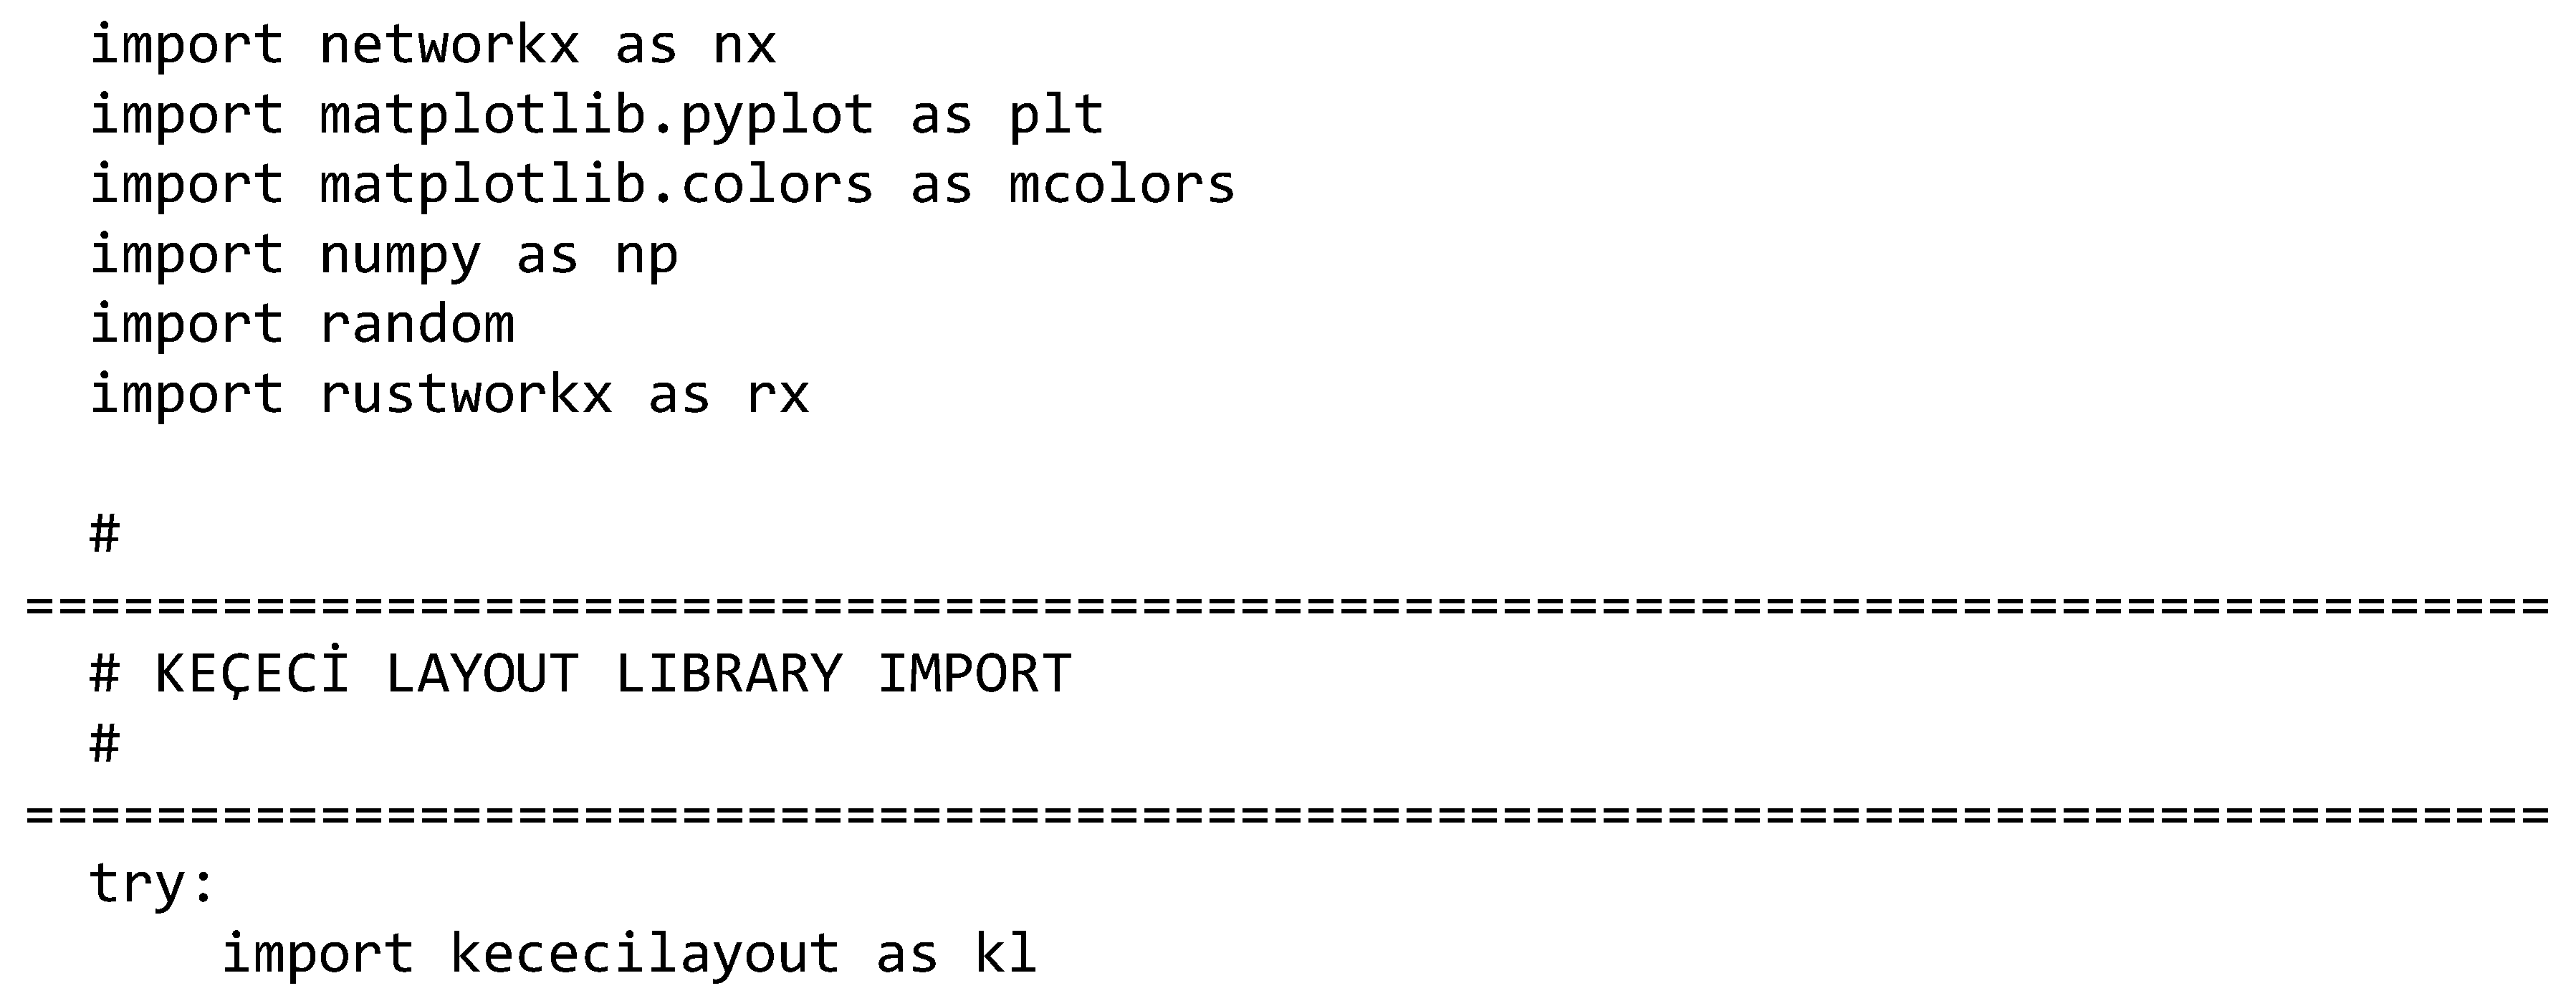
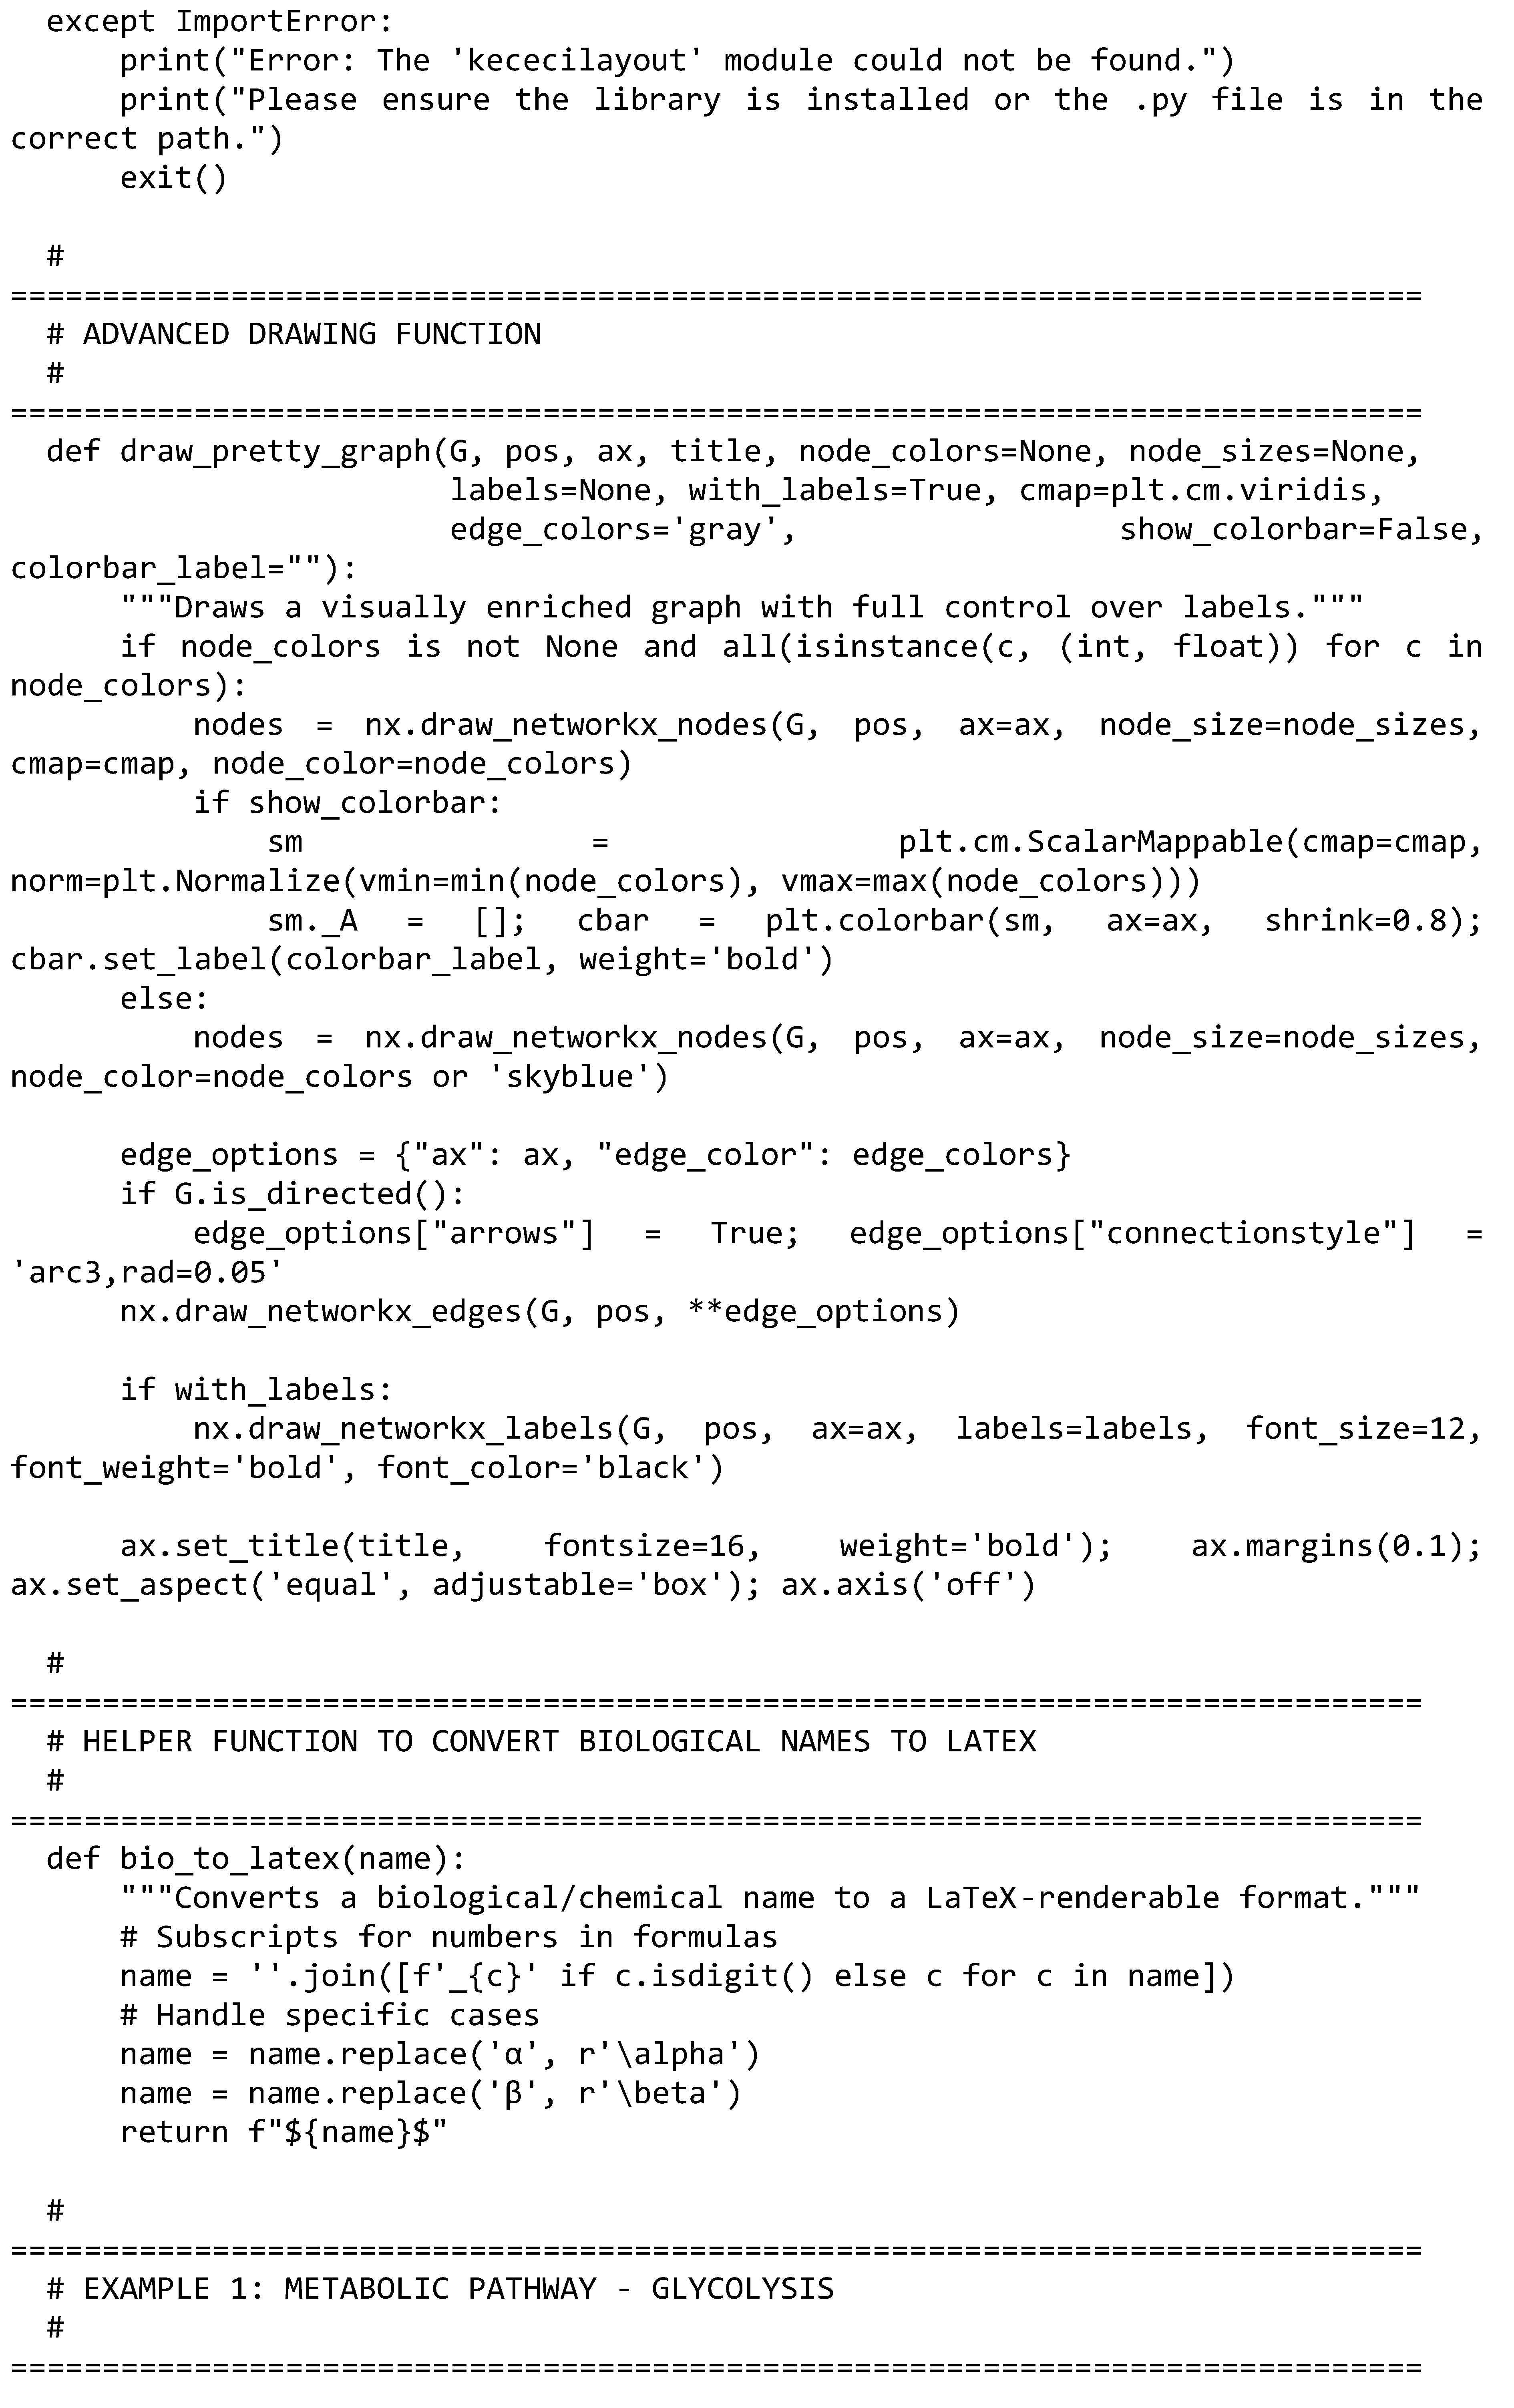
Glycolysis Metabolic Pathway:
Metabolic pathways are series of interconnected biochemical reactions that convert a starting substrate into a final product through the action of multiple enzymes. Glycolysis is a central metabolic pathway, found in nearly all living organisms, where glucose is broken down into pyruvate to generate energy (ATP).
This visualization models the initial, fundamental steps of the glycolysis pathway:
- Role of the Keçeci Layout: The top-down progression perfectly mirrors the sequential nature of the pathway. Each successive node represents the next reaction step. The critical branch point, where F1,6BP splits into G3P and DHAP, is clearly depicted thanks to the zigzag pattern.
- Nodes: Represent the key metabolites (intermediates) of the pathway. Labels are rendered using LaTeX for chemically accurate nomenclature.
- Node Color: Provides categorical information, indicating the chemical class of the metabolite (e.g., Hexose Phosphate, Triose Phosphate).
- Node Size: Is proportional to the molecular weight (MW). This visually confirms the breakdown of a 6-carbon sugar (Glucose) into two 3-carbon molecules, and the eventual arrival at a smaller end product (Pyruvate).
This layout presents the reaction flow, key branch points, and the transformation of molecules in a much more intuitive and comprehensible format than a complex biochemical diagram.
Figure 7.
Visualization of a Glycolysis Metabolic Pathway with Keçeci Layout (Version 4).
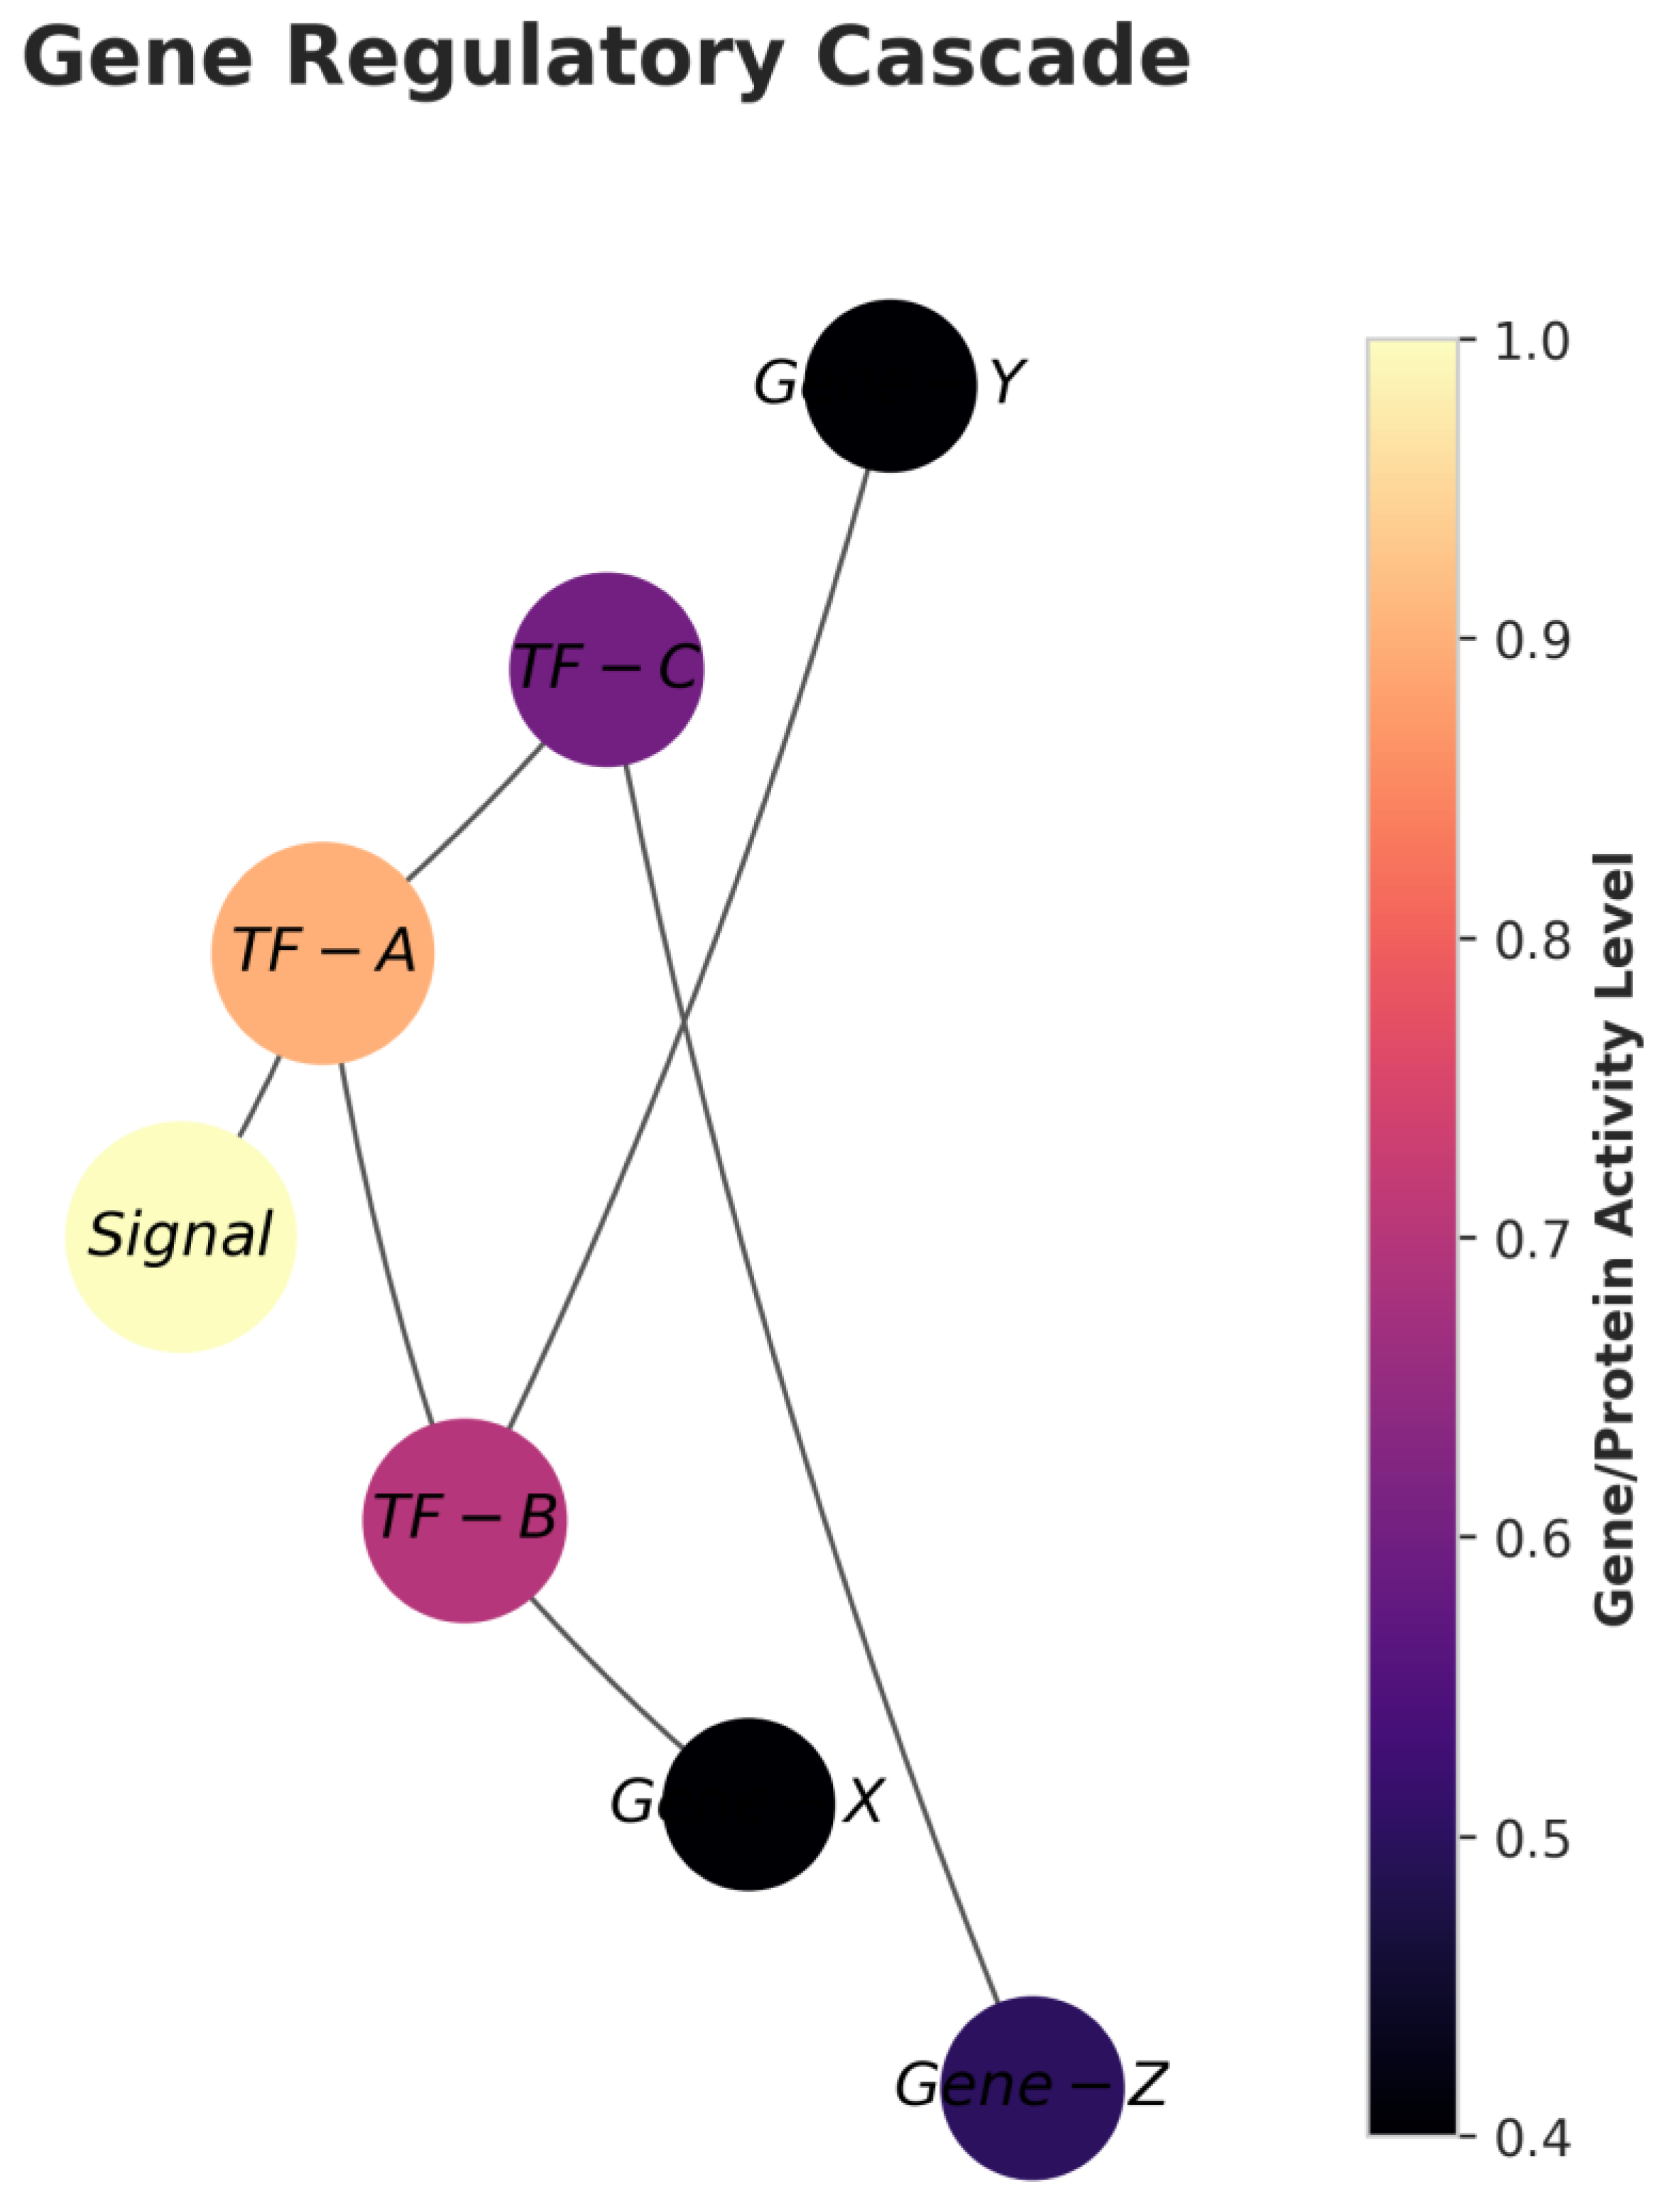
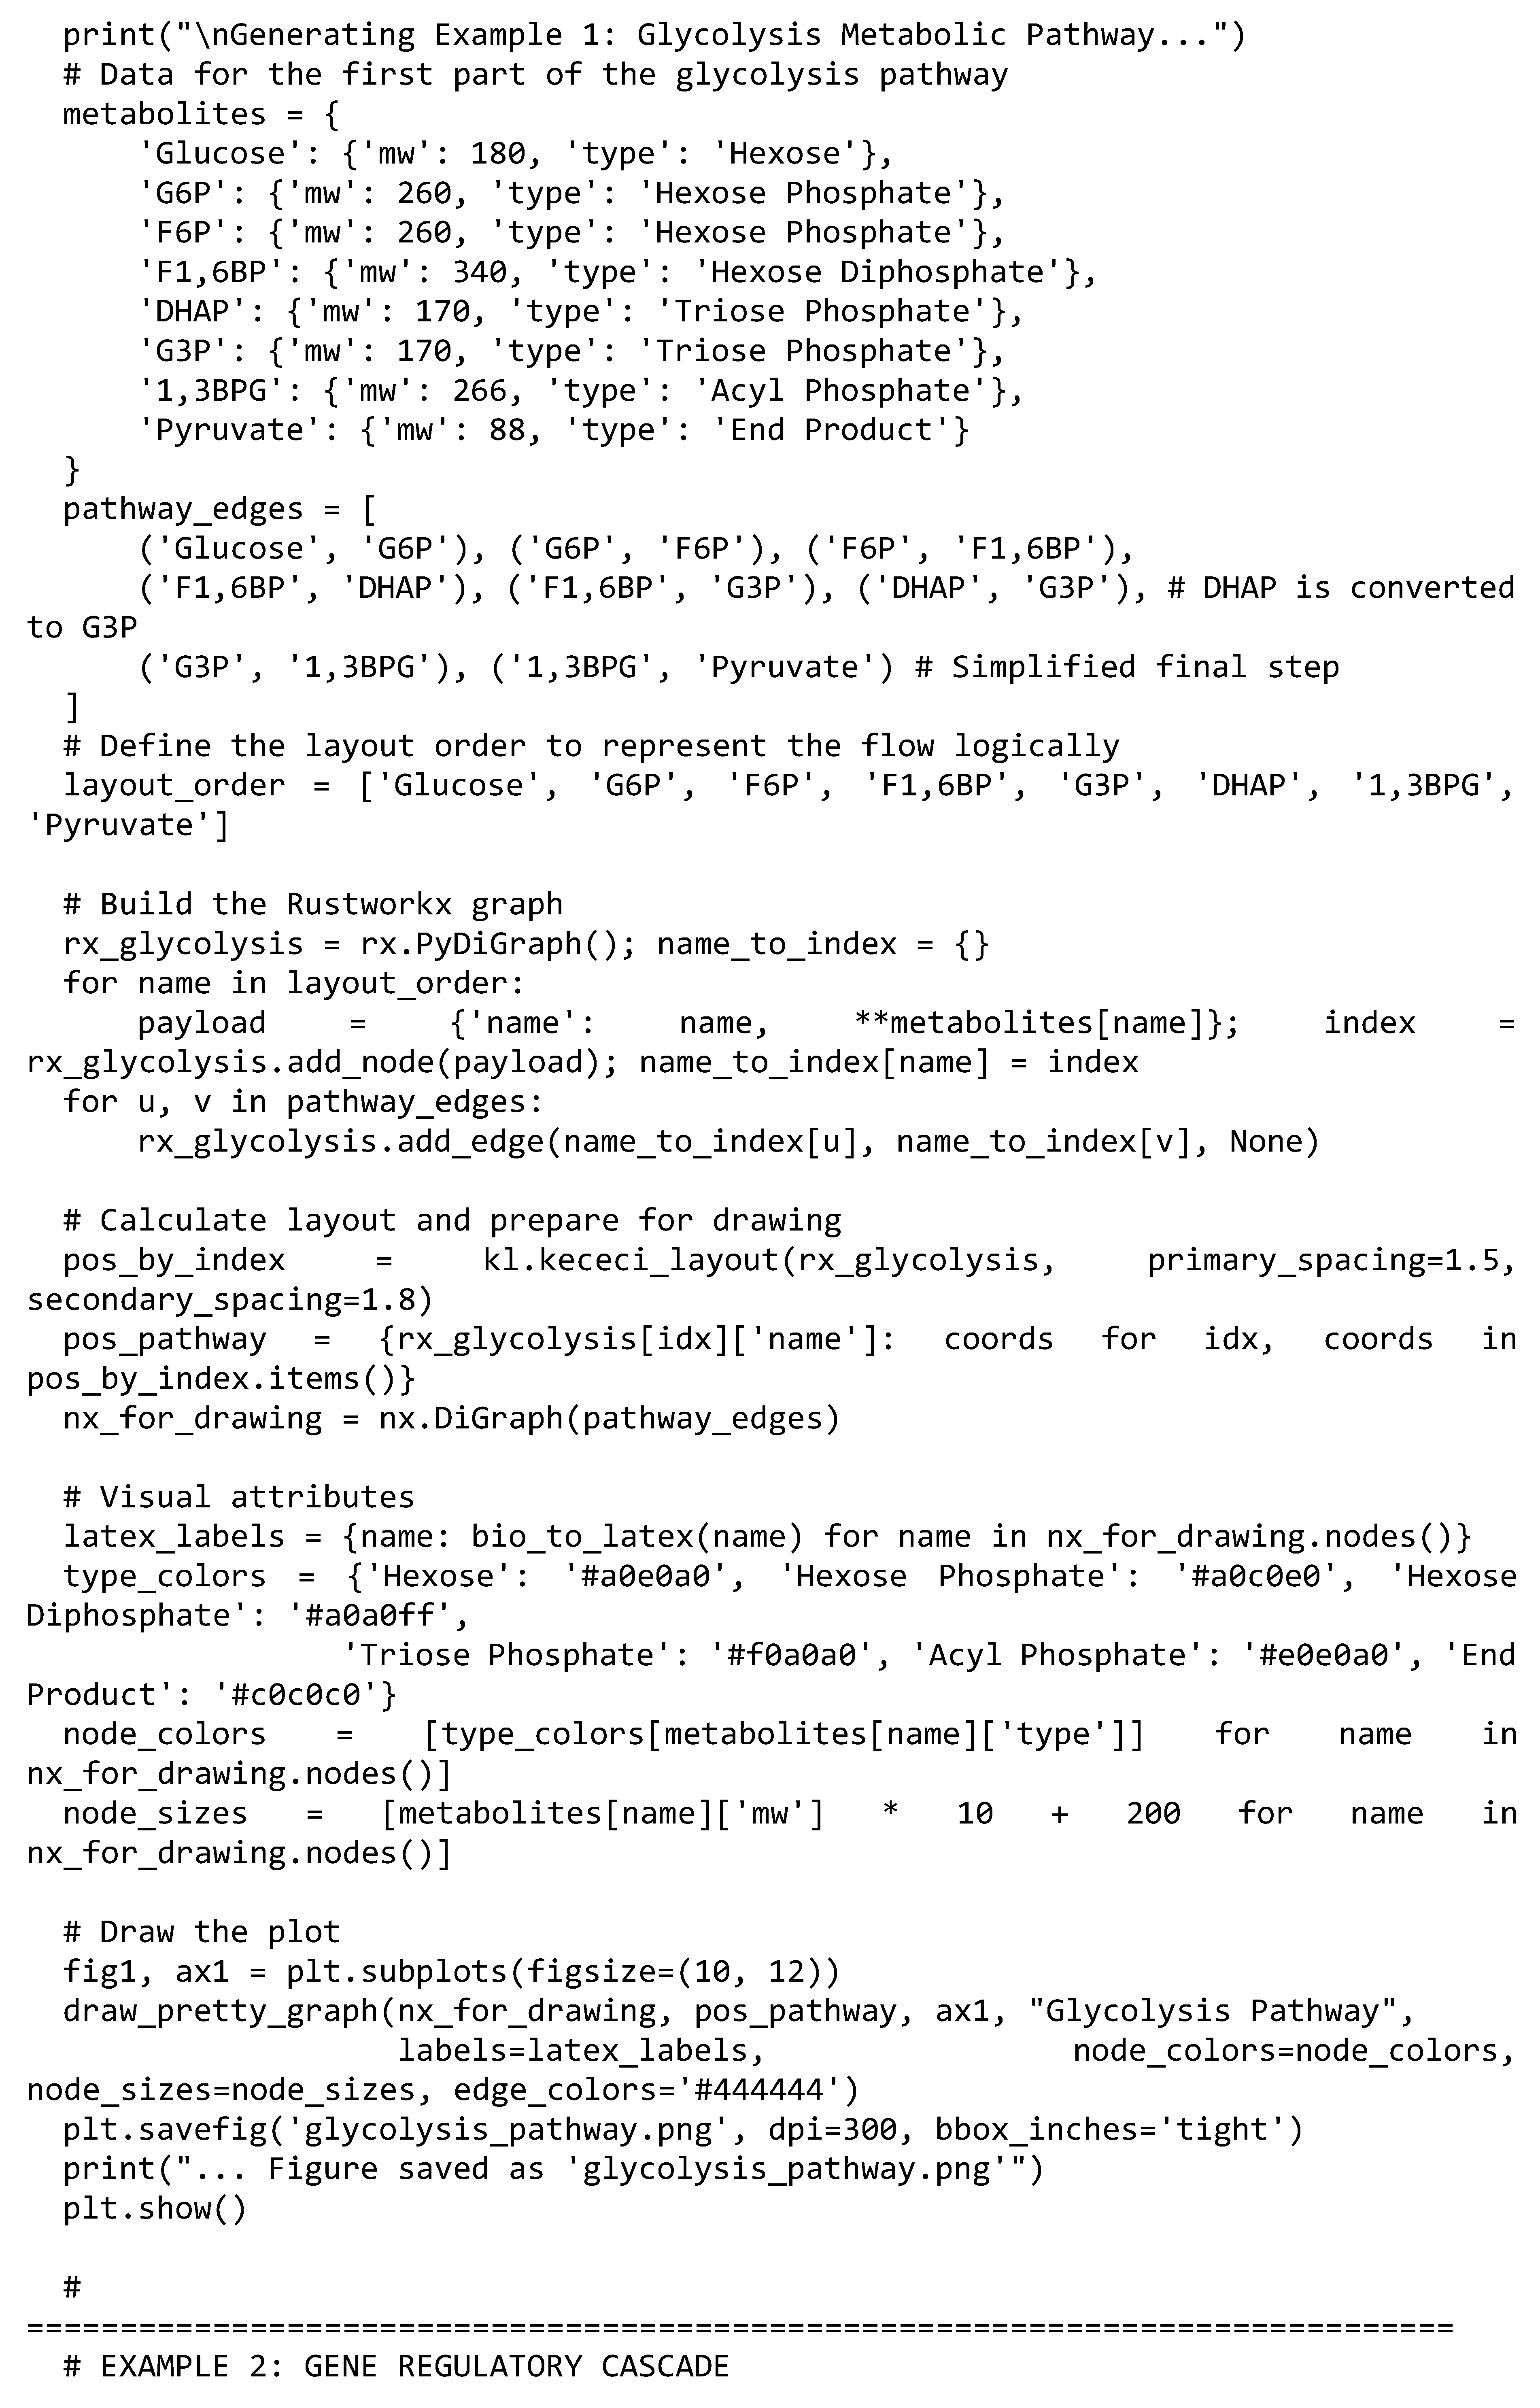
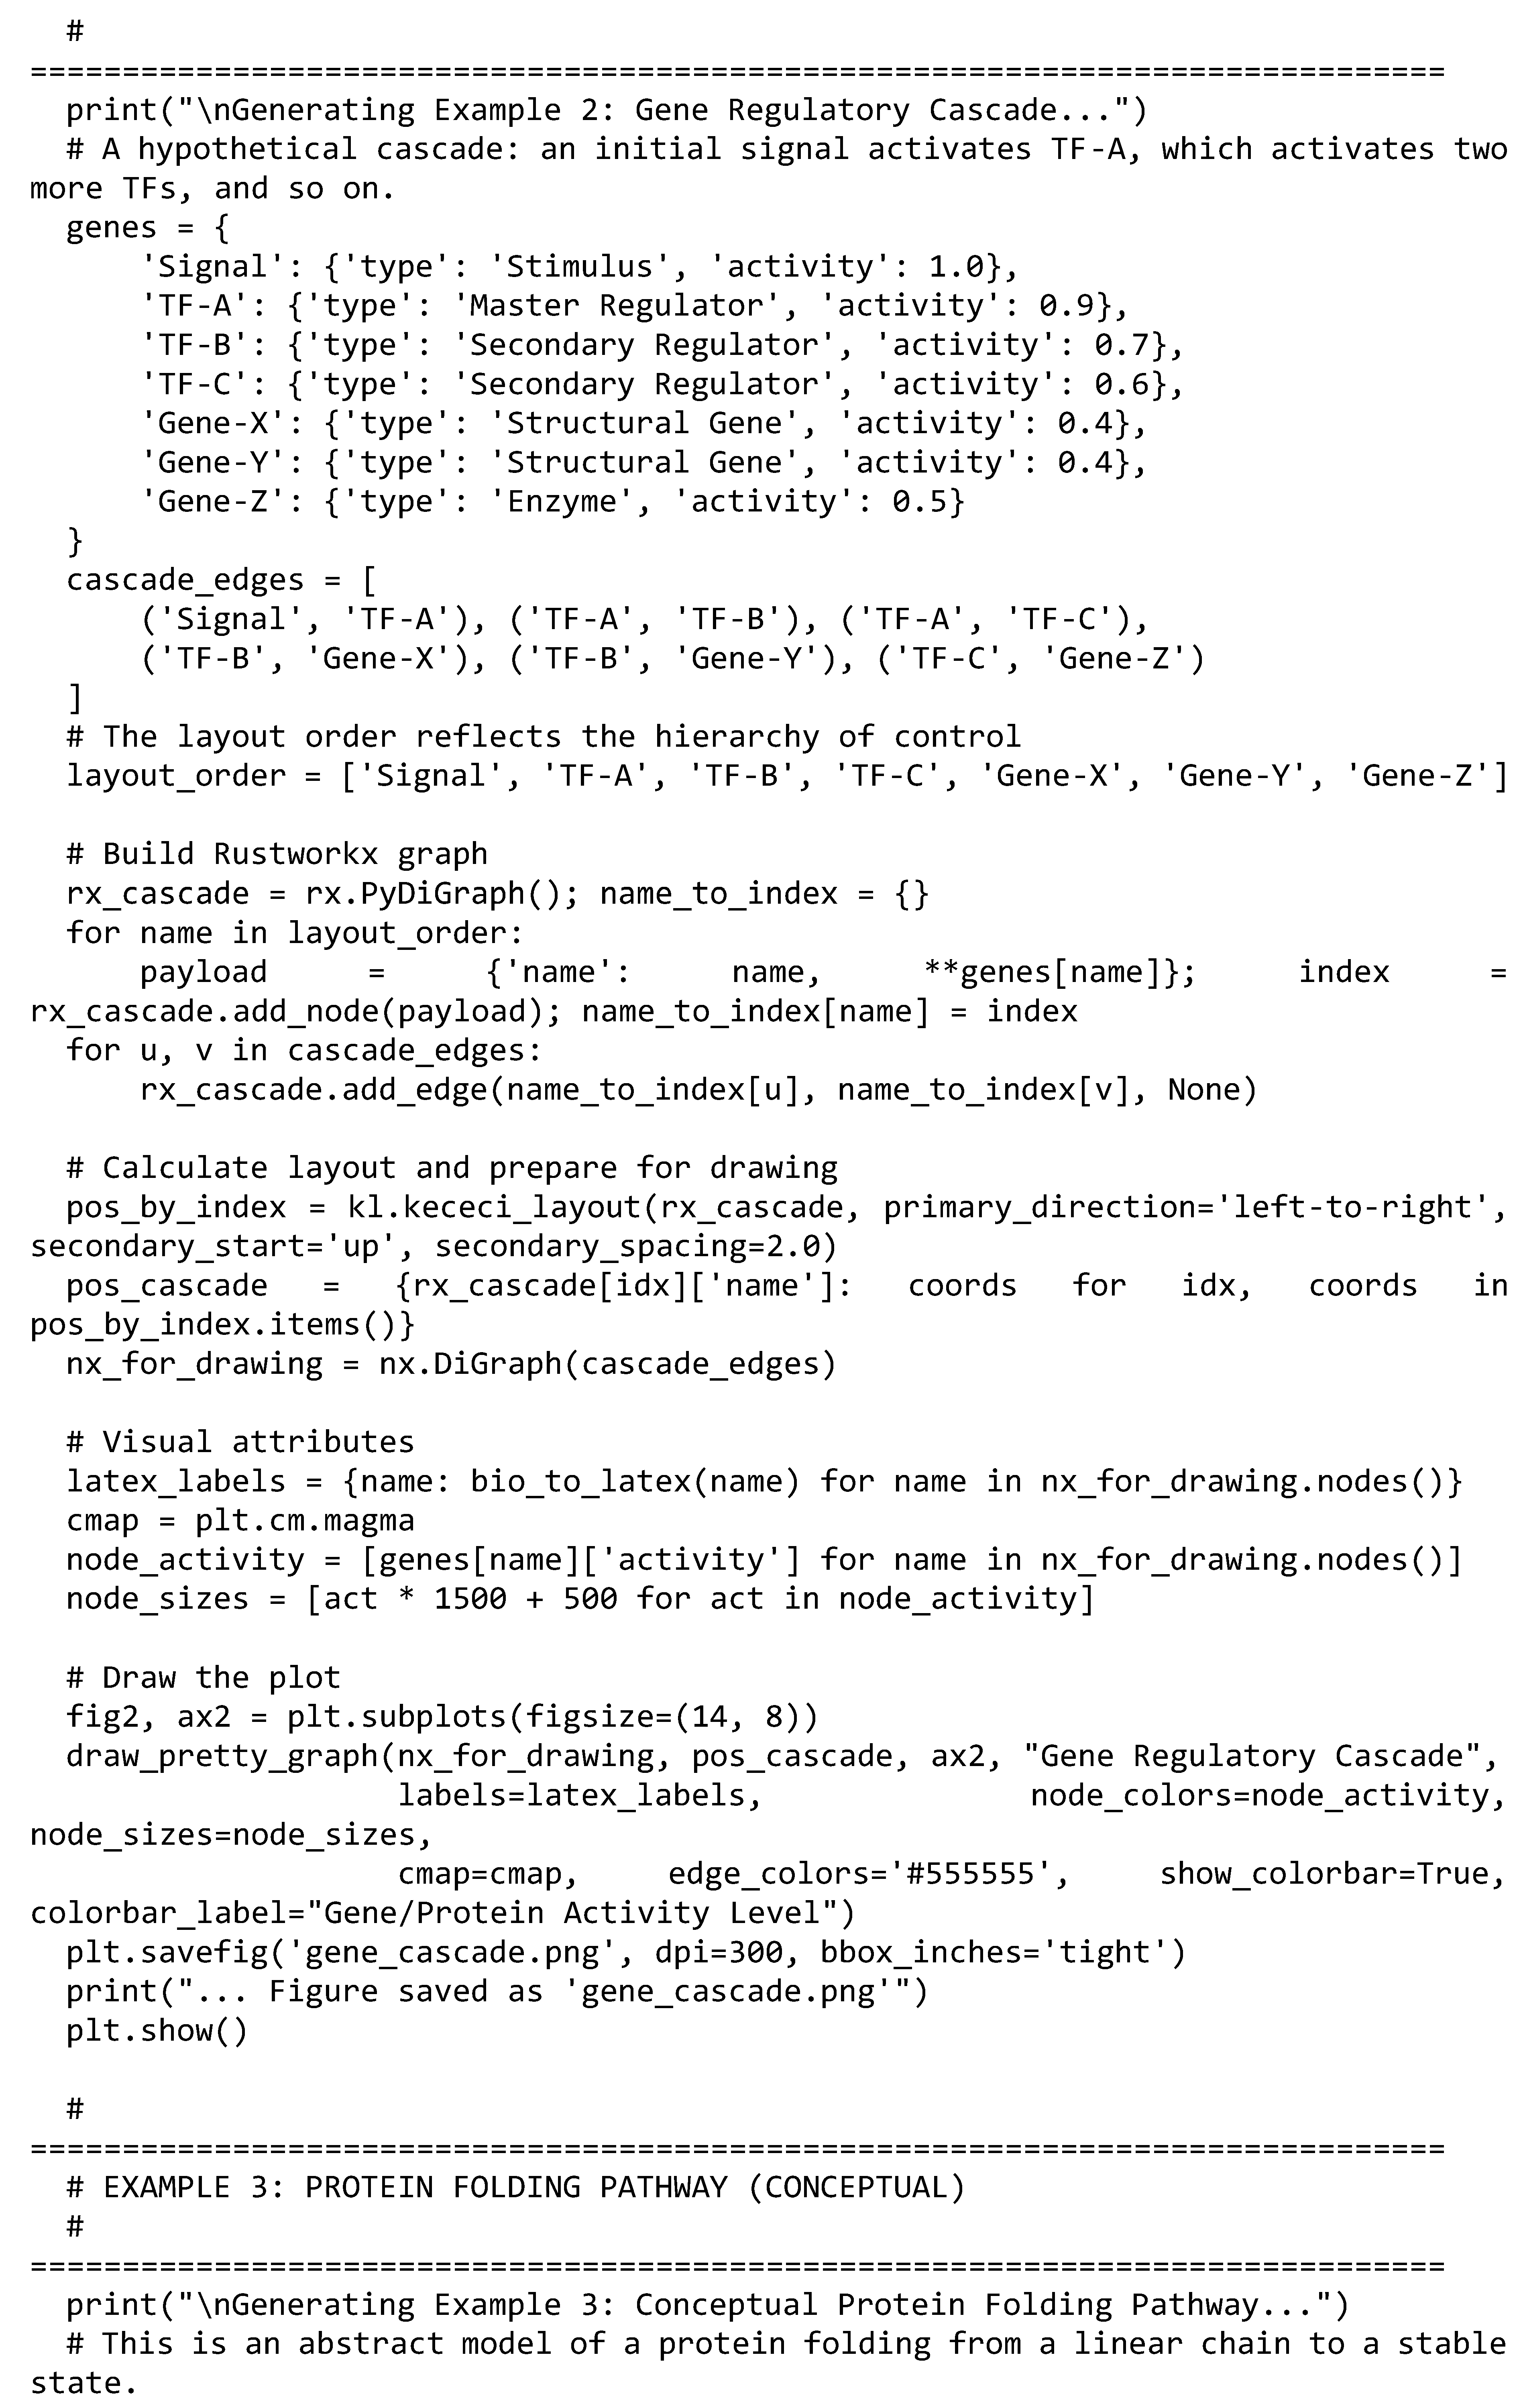
Gene Regulatory Cascade:
Gene regulation is the fundamental process by which a cell controls which of its genes are expressed (turned on). Regulation often proceeds in a cascade: an external signal activates a “master regulator” transcription factor (TF), which in turn activates one or more secondary TFs, and so on, until the process leads to the production of structural genes or enzymes.
This visualization depicts a hypothetical gene regulatory cascade:
- Role of the Keçeci Layout: The left-to-right progression represents the causal flow of signal transduction and regulation. Each “column” effectively shows a level in the cascade (initial signal, master regulator, secondary regulators, target genes). This makes the control hierarchy immediately apparent.
- Nodes: Represent signalling molecules, transcription factors, and target genes.
- Node Color and Size: Represents a conceptual “activity level.” Key regulators at the start of the cascade are rendered brighter and larger, emphasizing their importance in initiating the entire process. The color bar provides a quantitative measure of this activity level.
This visualization effectively demonstrates how a cell can produce a complex, branching response to a single signal, leveraging the power of the Keçeci layout to reveal hierarchical structures.
Figure 8.
Visualization of a Gene Regulatory Cascade with Keçeci Layout (Version 4).
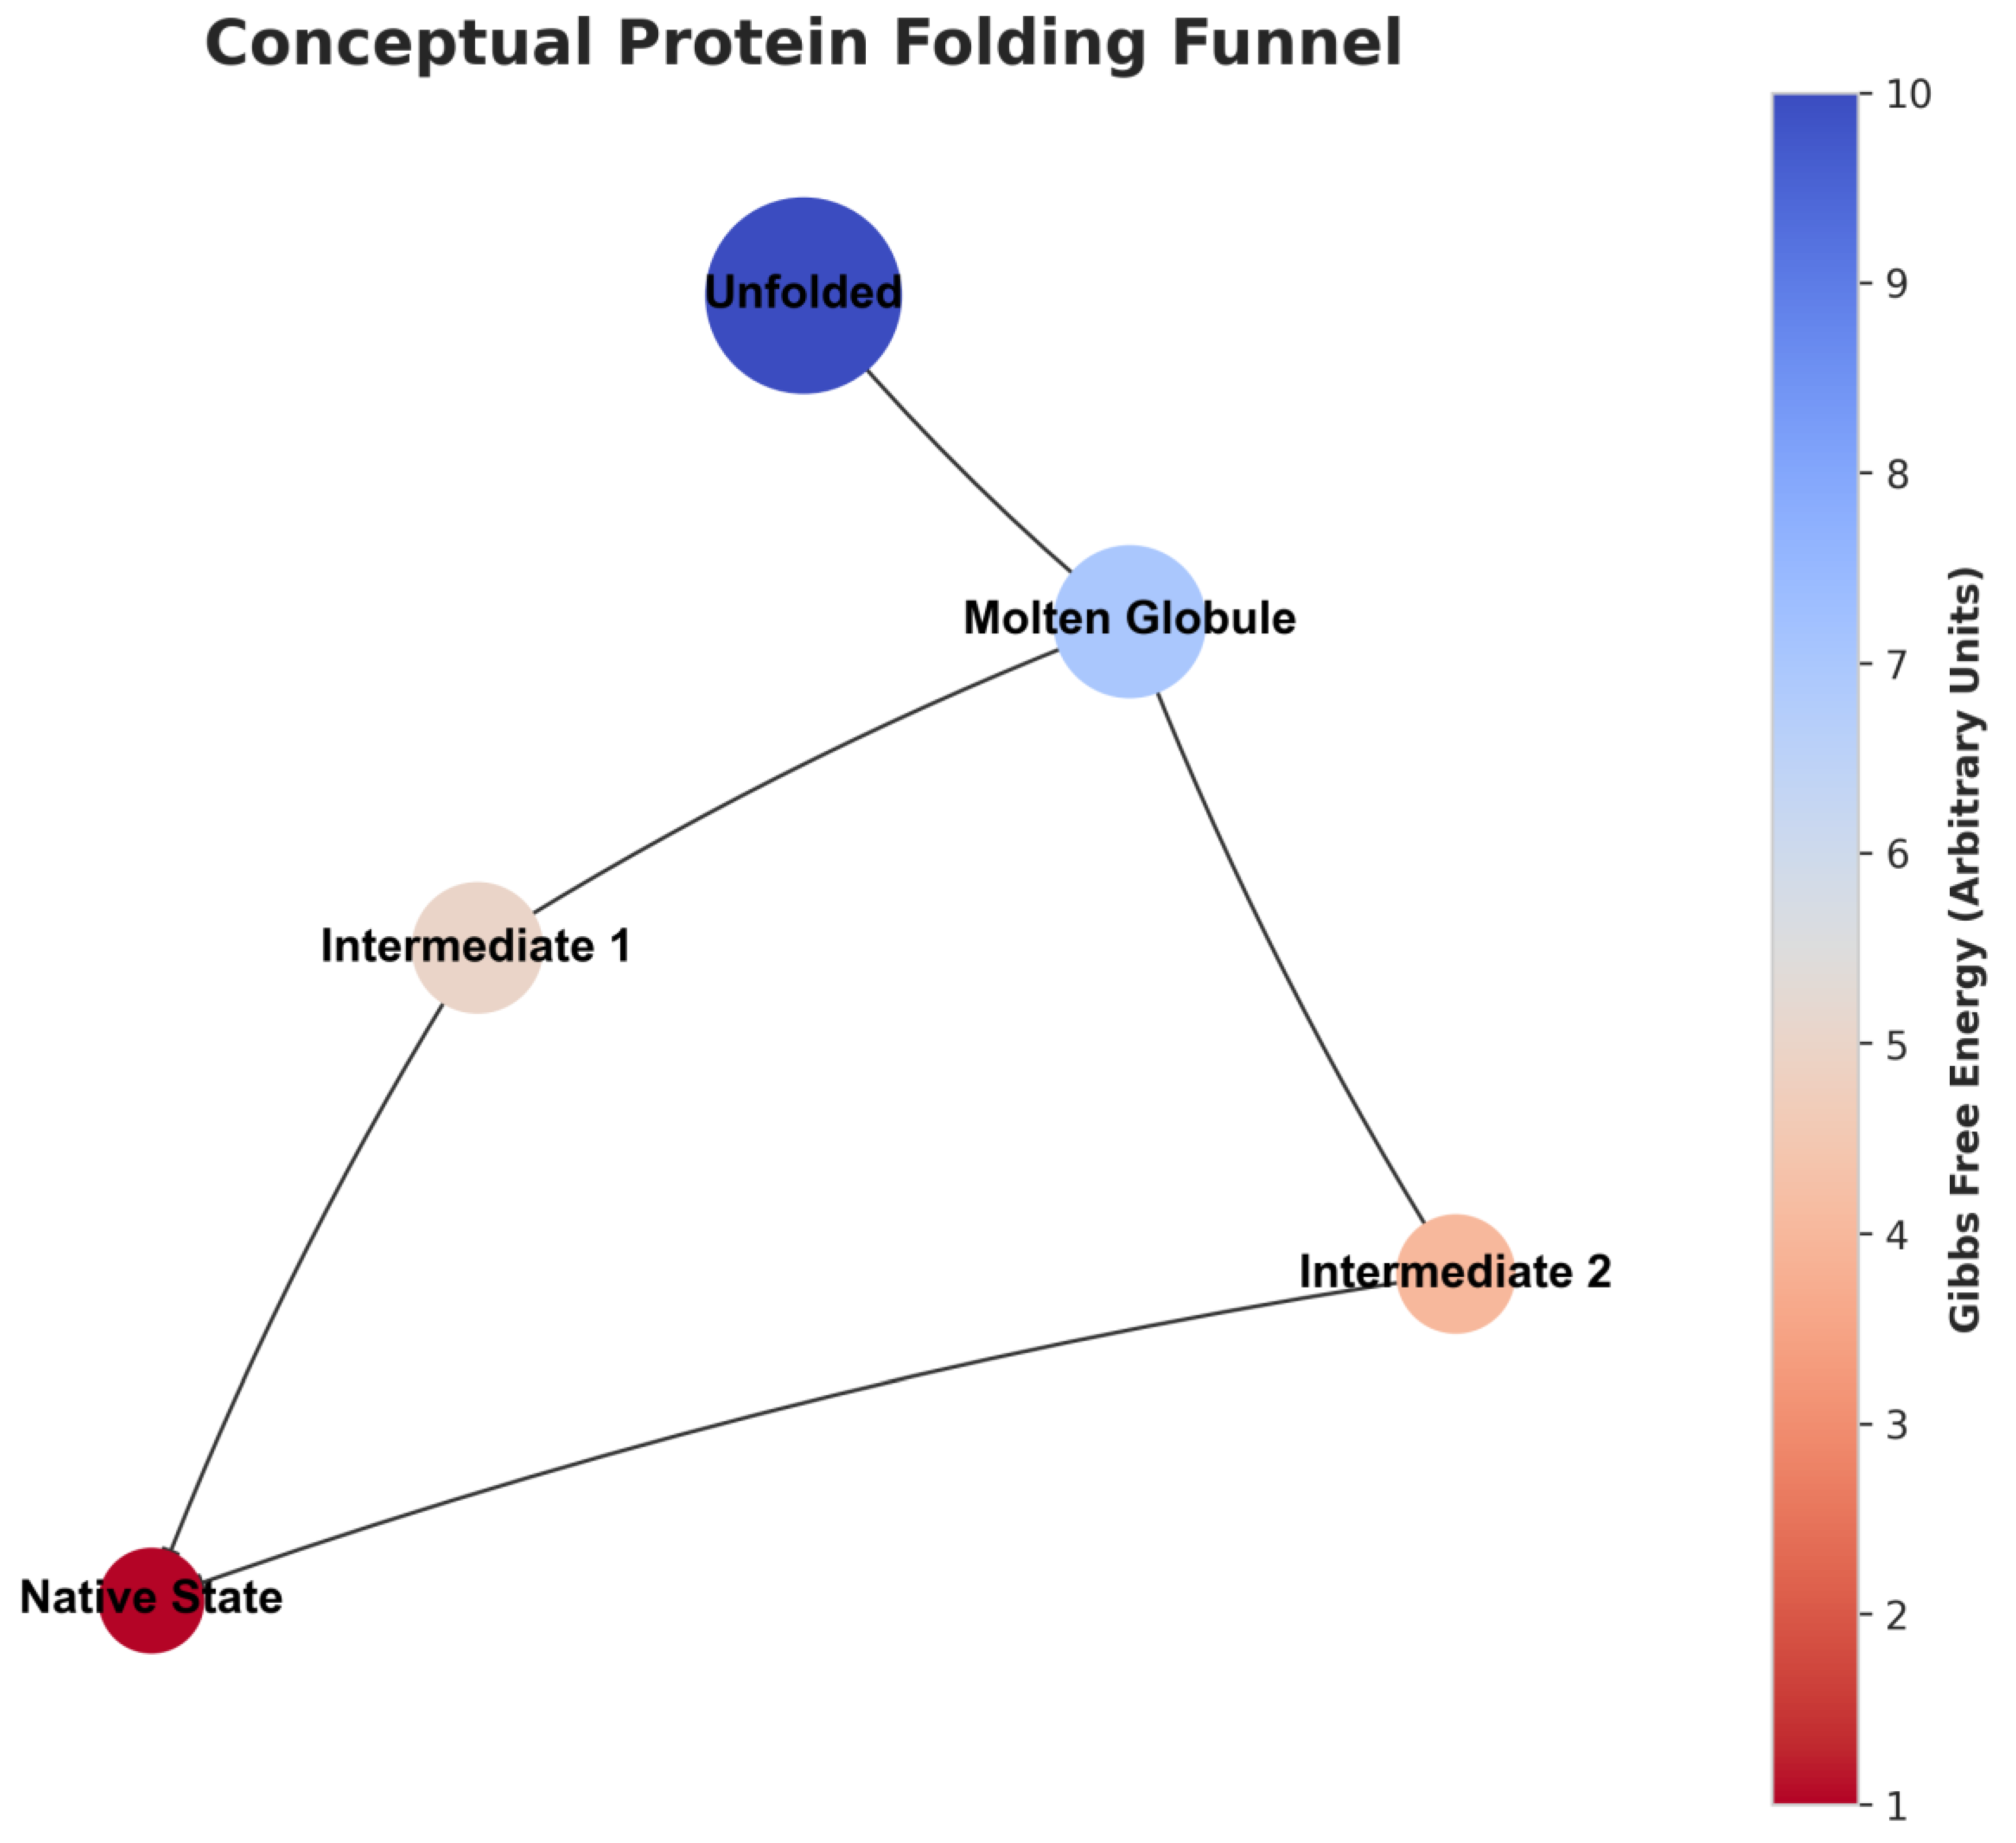
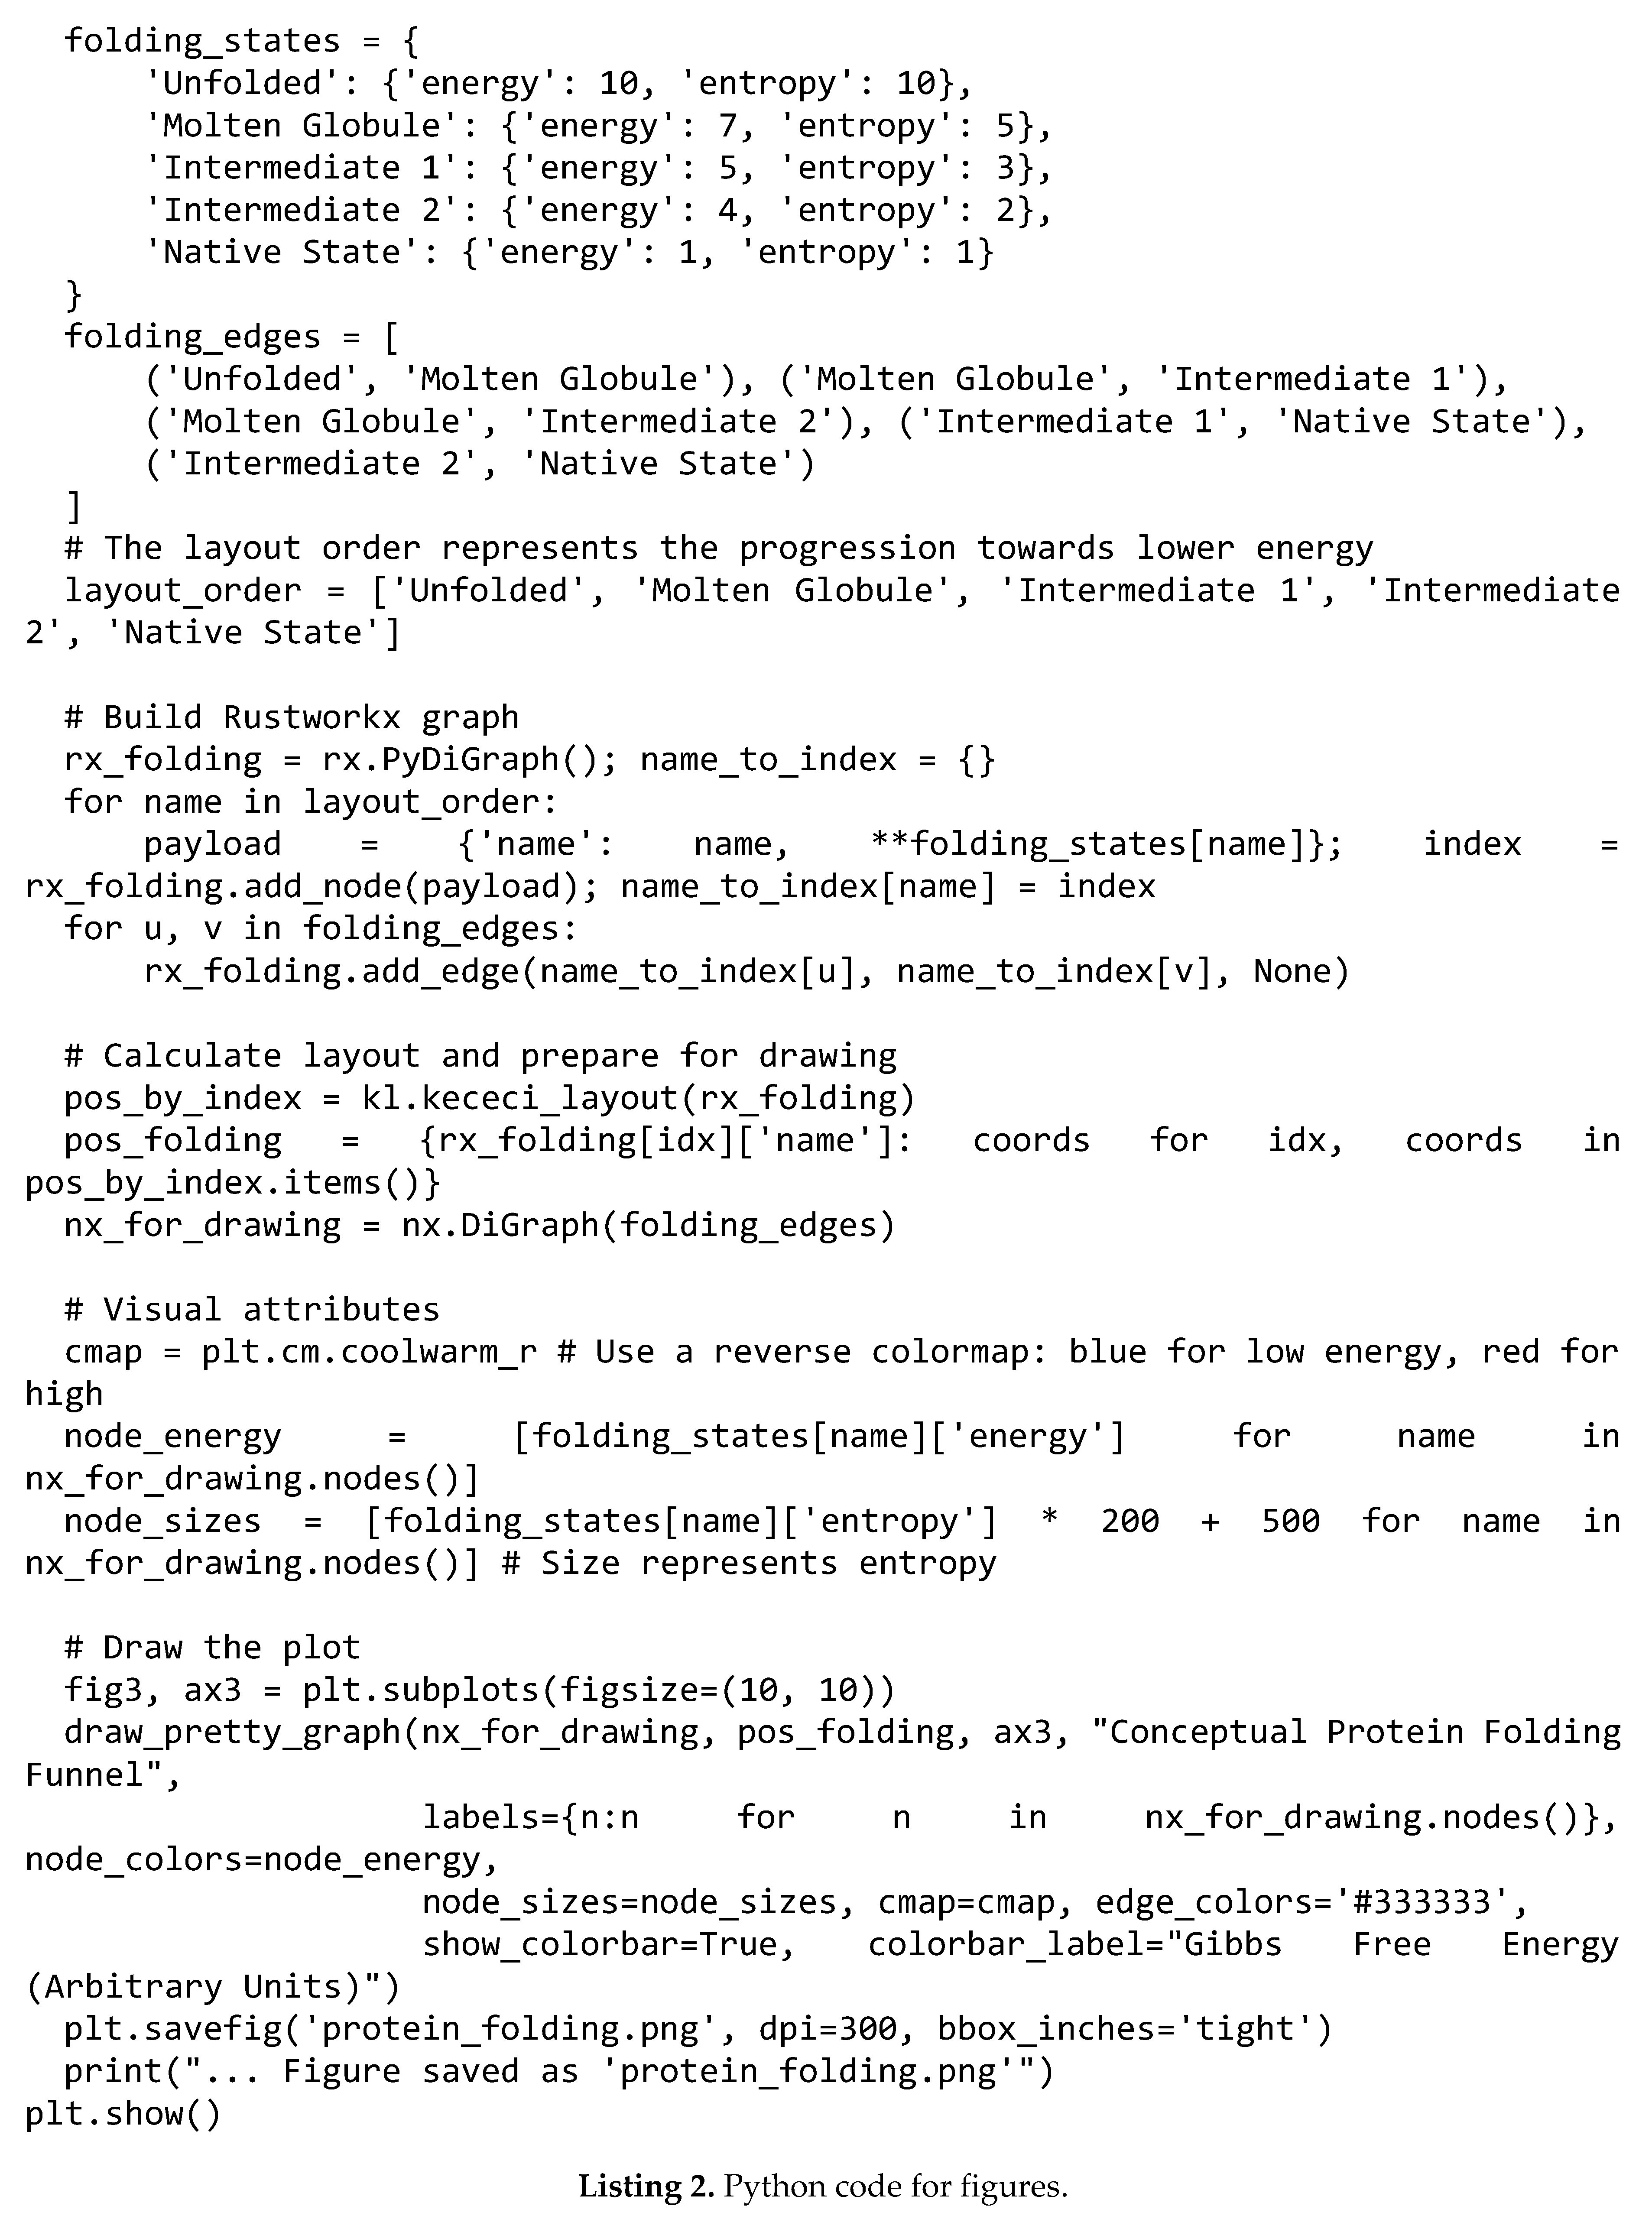
Conceptual Protein Folding Funnel:
Protein folding is the process by which a polypeptide chain (a linear sequence of amino acids) acquires its unique, functional, three-dimensional structure. This process is not random; it generally proceeds along an energy landscape known as a “folding funnel.” The protein moves from a high-energy, high-entropy (disordered) unfolded state to a low-energy, low-entropy (ordered) stable native state, often passing through a series of intermediate states.
This visualization models this conceptual process:
- Role of the Keçeci Layout: The top-down progression represents the protein’s journey down the energy landscape. The starting point is the highest-energy “Unfolded” state, and the end point is the lowest-energy “Native State.”
- Nodes: Represent key conformational states in the folding process (unfolded, molten globule, intermediates, native state).
- Node Color (Energy): The color of a node represents the relative Gibbs free energy of that state. As shown on the color bar, high-energy states (red) are at the beginning of the pathway, while the low-energy, stable state (blue) is at the end.
- Node Size (Entropy): The size of a node is proportional to the conformational entropy (disorder) of the state. The largest node, “Unfolded,” has the most possible conformations, while the smallest, “Native State,” has the least disorder.
This visual demonstrates how effectively the Keçeci layout can map not only physical connections but also abstract processes, such as the ordered journey of a system through an energy or state space.
Figure 9.
Visualization of a Conceptual Protein Folding Funnel with Keçeci Layout (Version 4).
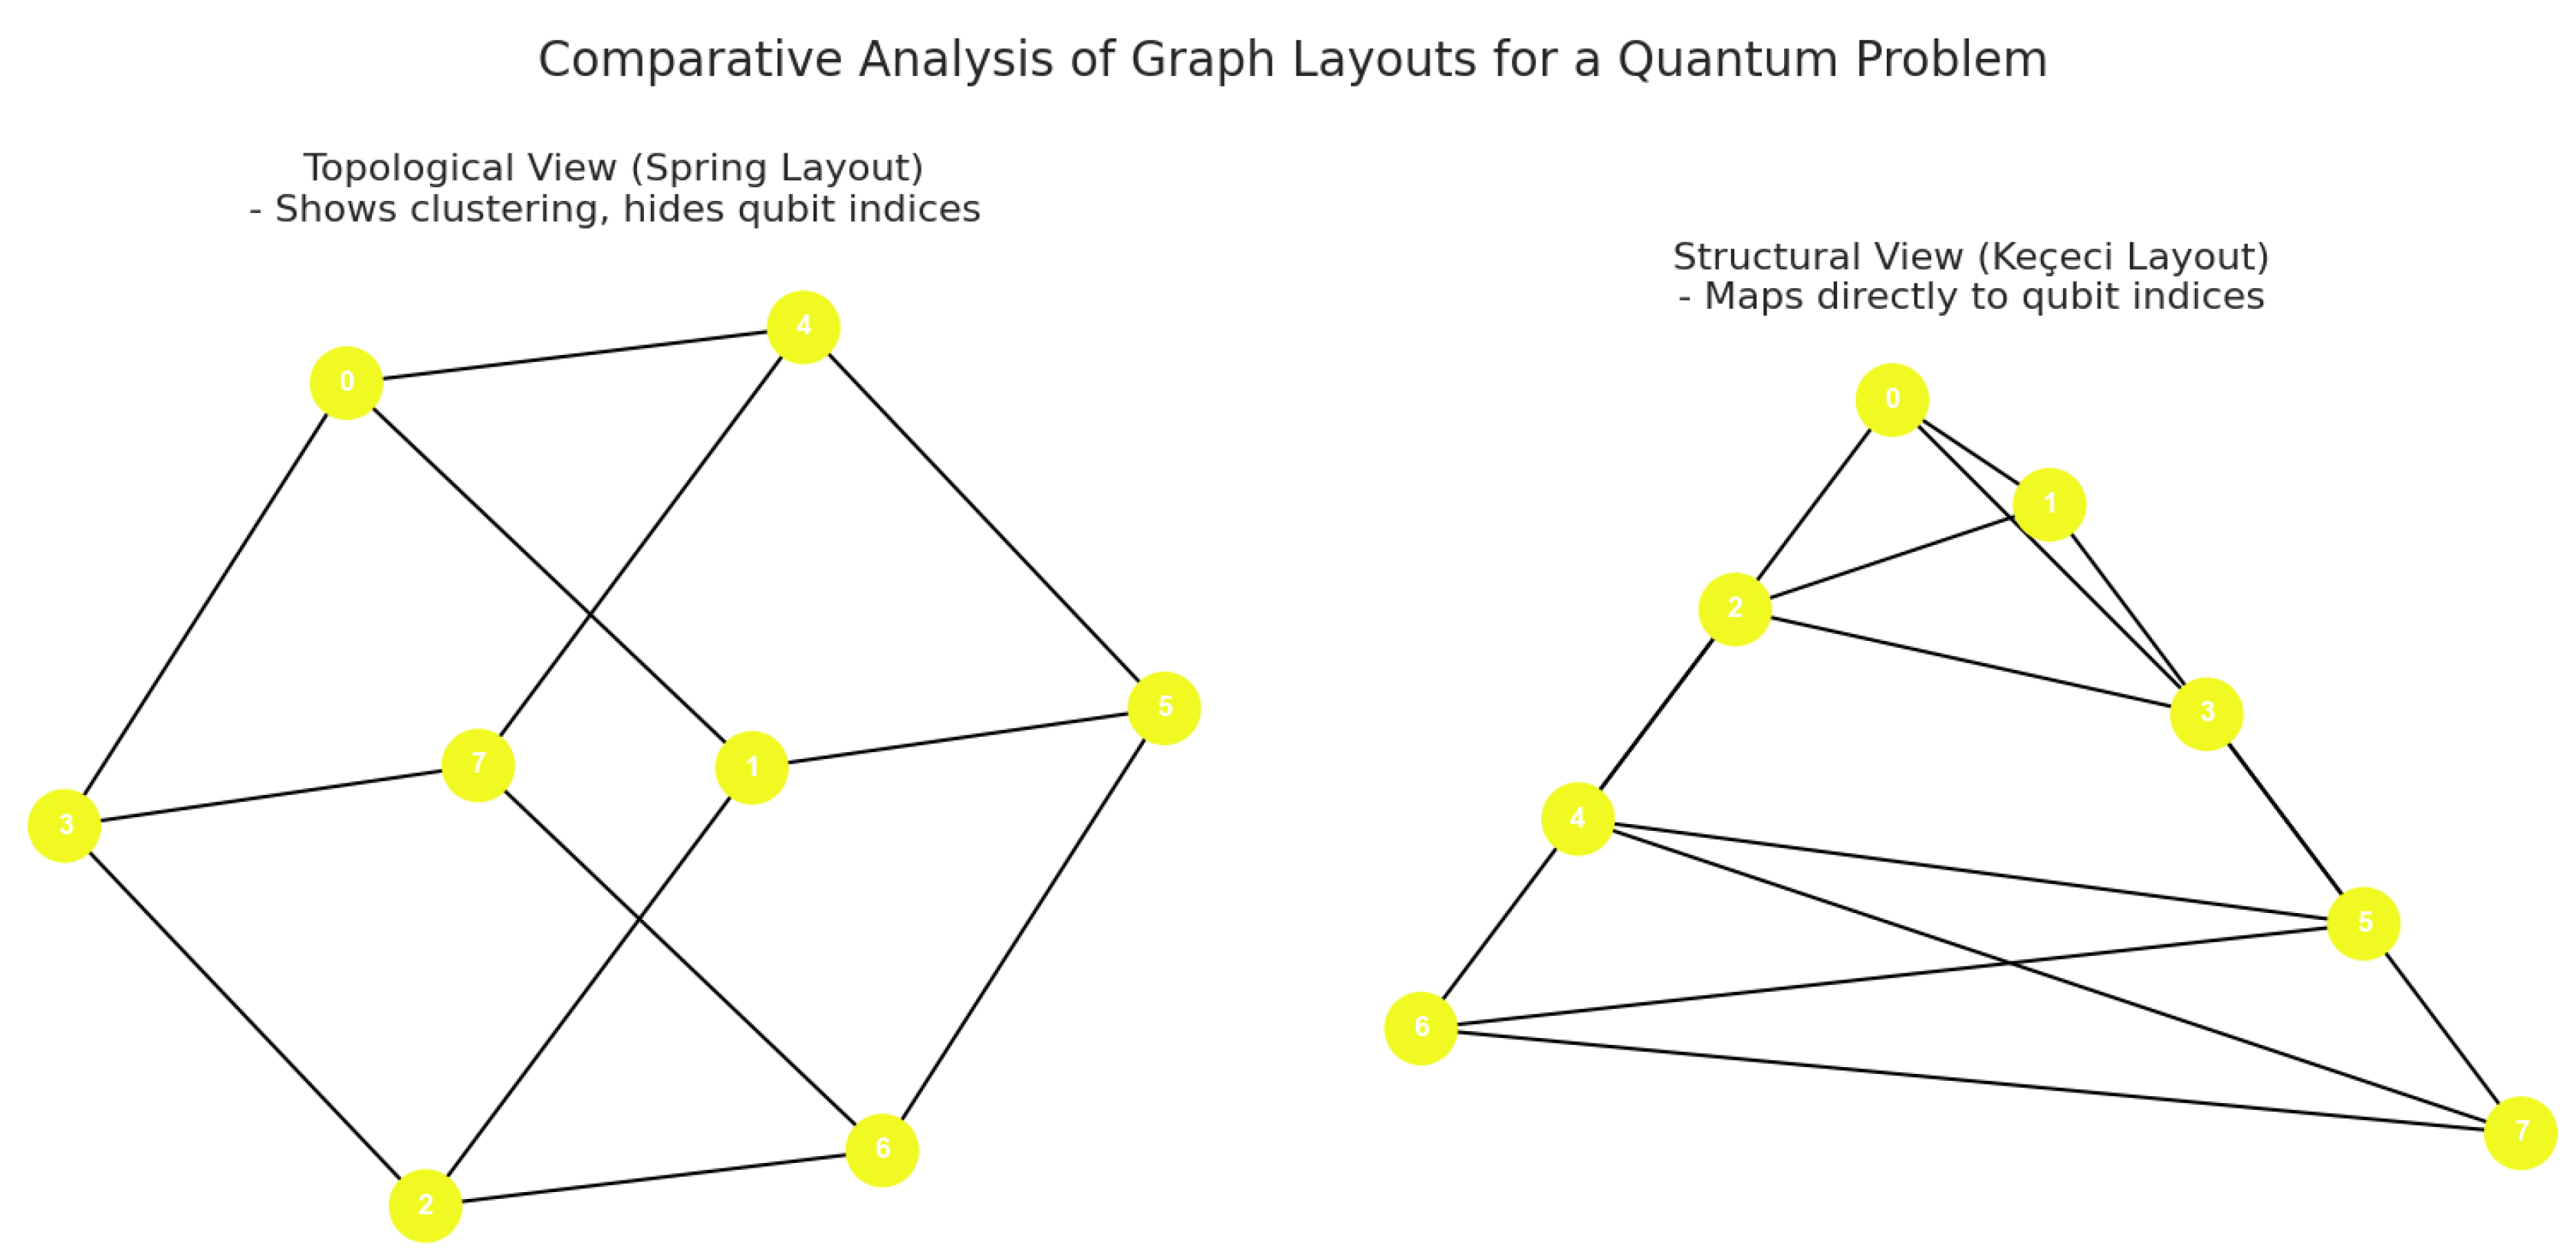
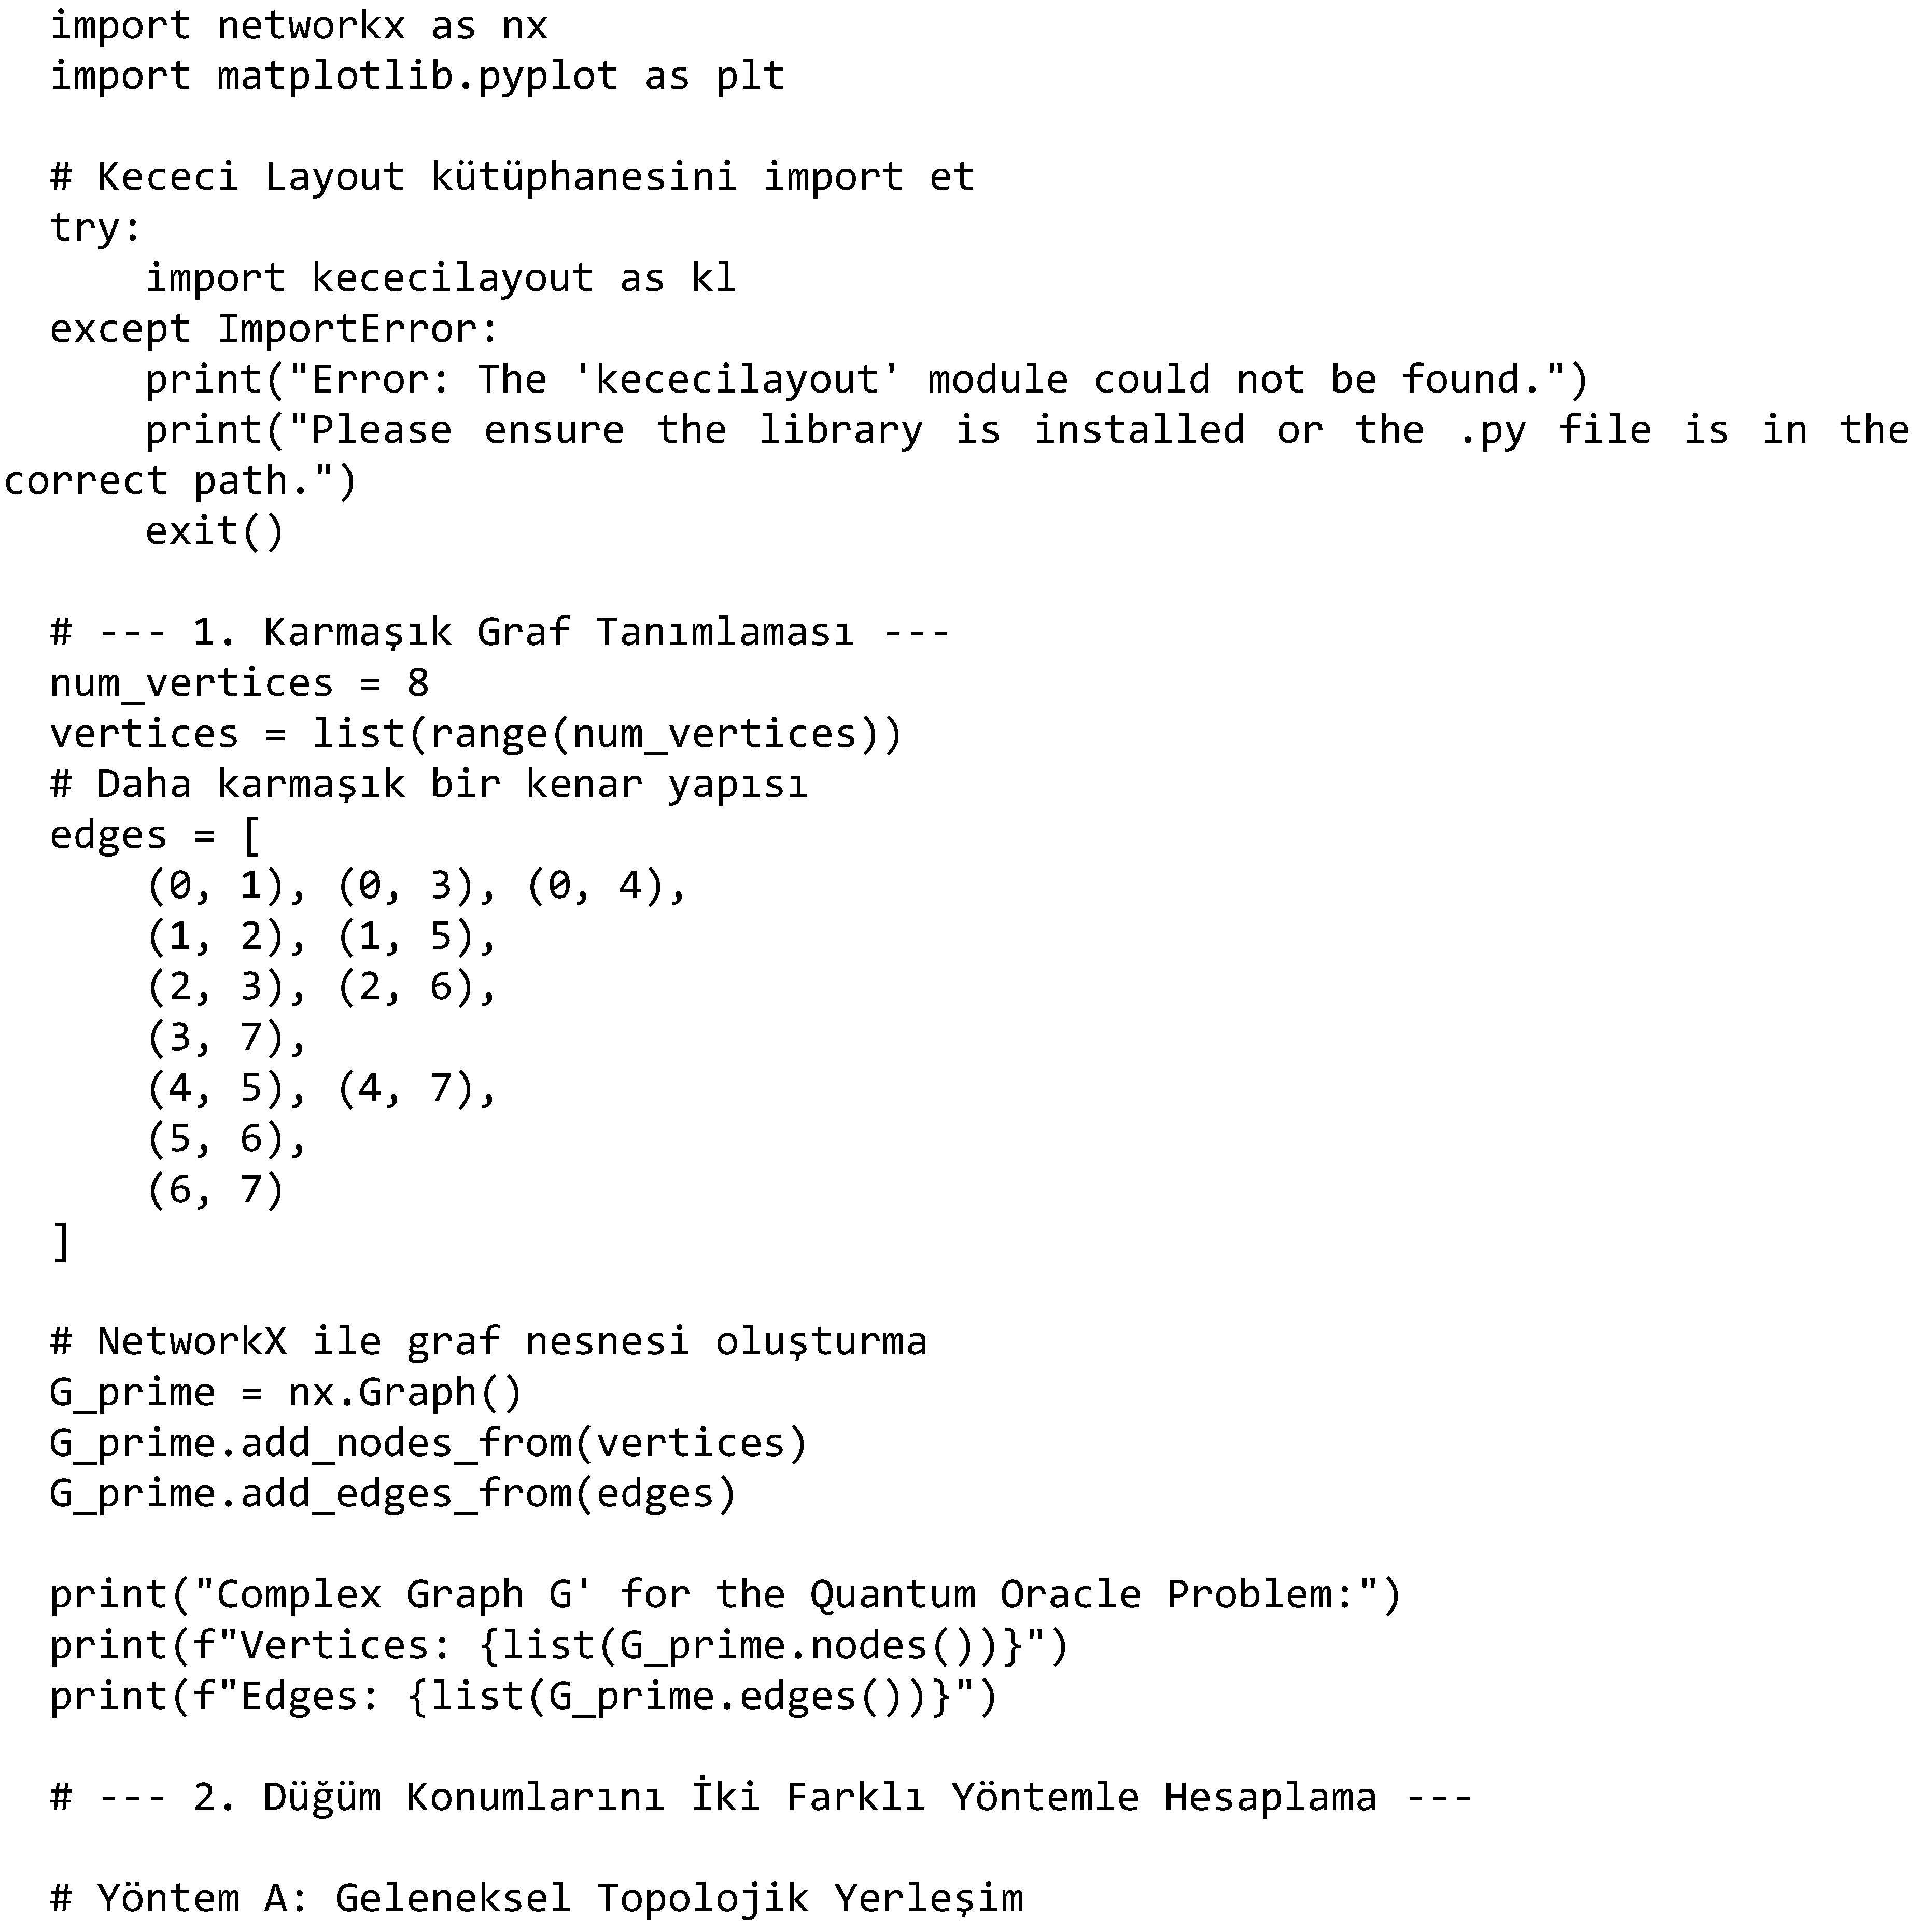
X. Structural Representation of Graph G for a Quantum Oracle Problem using the Keçeci Layout
Comparative Analysis of Graph Layouts for a Quantum Problem:
Problem: We are given a graph with 8 vertices, where each vertex will be coloured with one of two colours (represented by 0 or 1), thus defining a “cut”. The size of this cut is defined as the number of edges that connect vertices of different colours. The task is to design a quantum oracle for Grover’s algorithm that can check whether there exists a colouring (a cut) of the graph where the cut size is at least 7. This problem is a specific instance of the well-known “Maximum Cut” (Max-Cut) problem, which serves as a significant benchmark for testing quantum algorithms.
Graph G’: 8 Vertices, 12 Edges. The vertices (which will correspond to qubits) are labelled 0 through 7. The edges define a specific connectivity structure for the problem.
Quantum algorithms, particularly Grover’s search algorithm, rely on an oracle that represents the problem’s state space. For graph-based problems like Max-Cut, this oracle typically maps the graph’s structure (vertices and edges) directly onto qubits. Therefore, it is critically important that the visualization method used to analyze the algorithm’s logic and results remains faithful to this underlying mapping.
This work compares two distinct visualization approaches for a graph (G’) with 8 vertices and 12 edges:
- 1.
-
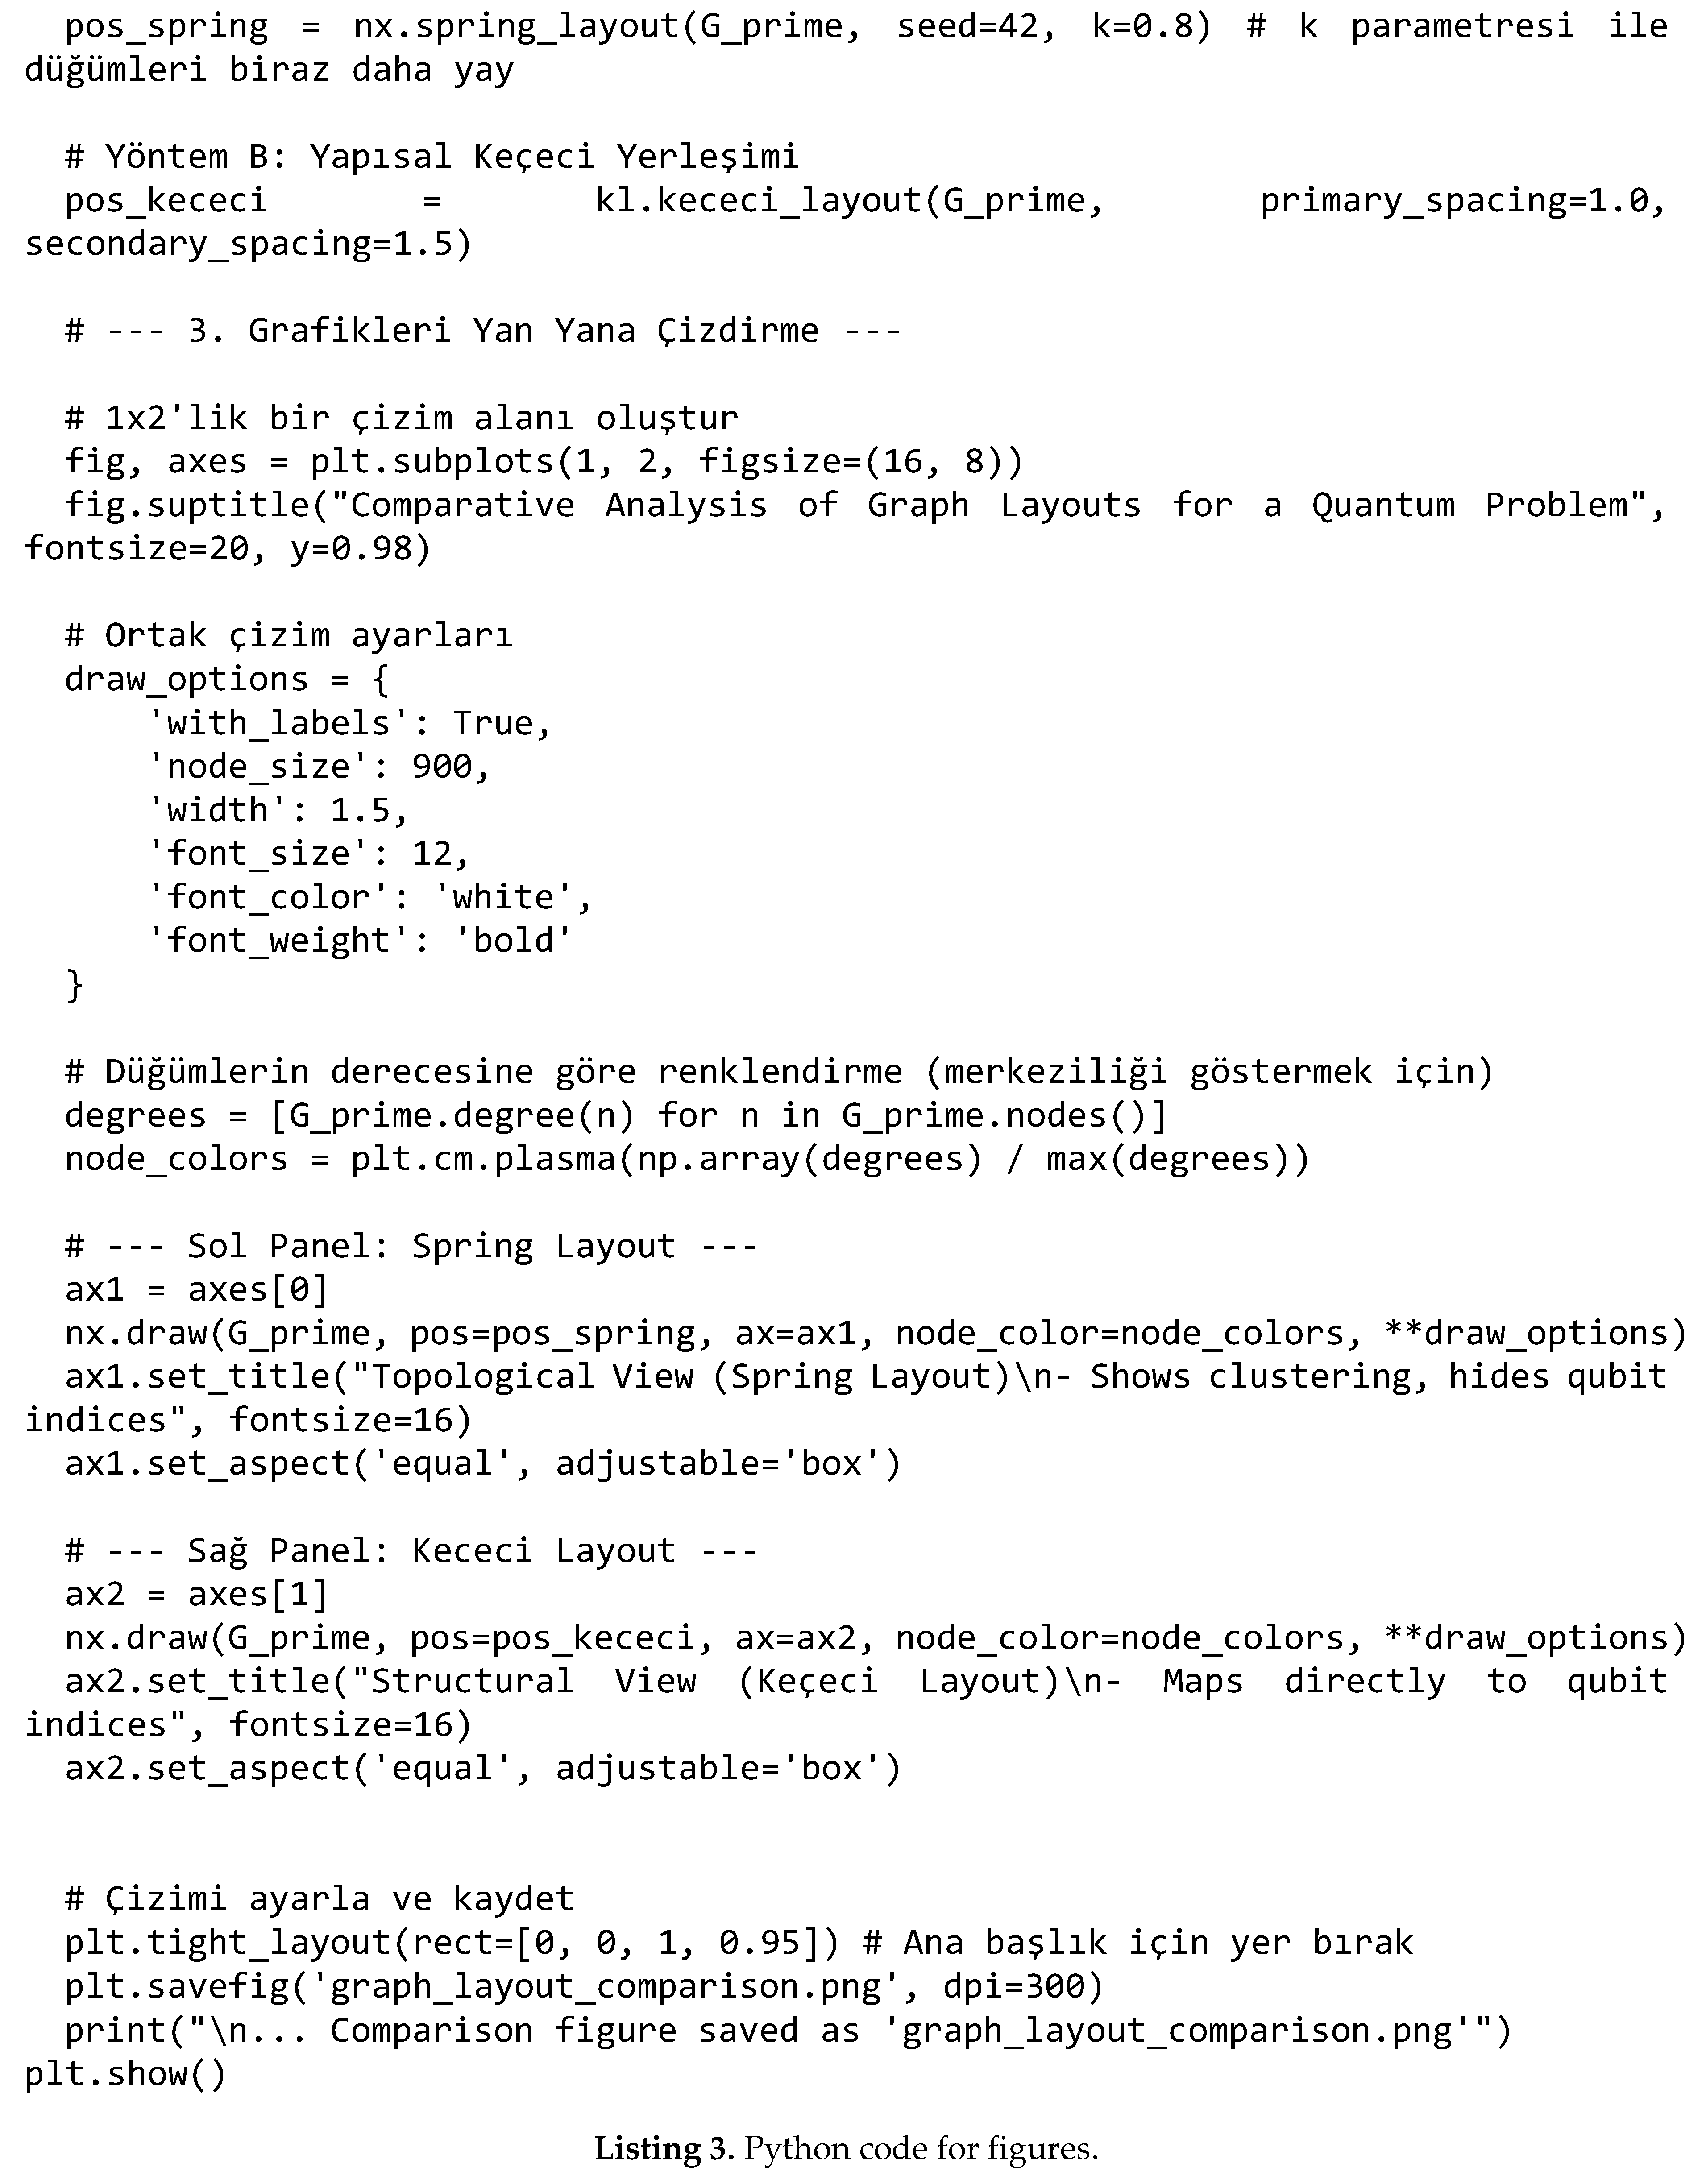
Topological Layout (spring_layout):
- Approach: This method is a force-directed algorithm that models nodes as repelling particles and edges as connecting springs. The final positions of the nodes are determined by minimizing the energy of the system.
- Advantages: It excels at revealing the graph’s overall topology, dense regions (clusters), and properties like centrality. It presents a visually aesthetic and “organic” structure.
- Disadvantages: It is non-deterministic; it can produce a different layout on each run (though small variations can occur even with a seed). More importantly, there is no predictable relationship between a node’s spatial position and its logical qubit index (0, 1, ..., 7). This makes it impossible to directly correlate the visual representation with the structure of the quantum circuit.
- 2.
-
Structural Layout (kececilayout):
- Approach: This method arranges nodes sequentially based on their IDs along a predefined primary axis. The position of each node is determined solely by its ID.
- Advantages: It is fully deterministic and ordered. Node 0 is always at the top, and node 7 is at the bottom. This ordering perfectly mirrors the mapping from qubit 0 to qubit 7. Consequently, a statement like “the interaction between qubit 3 and 5” can be analysed by directly observing the corresponding nodes on the visual. Structural properties, such as edge density and node degree, can be clearly examined on this regular “canvas.”
- Disadvantages: It may not emphasize traditional topological clustering or symmetry. Its focus is less on aesthetics and more on fidelity to the problem’s mathematical structure.
Conclusion: While spring_layout offers an intuition about the “natural” shape of the graph, kececilayout provides a structural and index-based map that is indispensable for the design and analysis of a quantum oracle. For academic and analytical work, structural methods like the Keçeci Layout offer a distinct advantage over topological ones by enabling the direct visual tracking of an algorithm’s steps.
Figure 10.
Visualization of a Comparative Analysis of Graph Layouts for a Quantum Problem with Keçeci Layout (Version 4).
Figure 10.
Visualization of a Comparative Analysis of Graph Layouts for a Quantum Problem with Keçeci Layout (Version 4).
XI. Representation of Other Branches of Science Using the Keçeci Layout
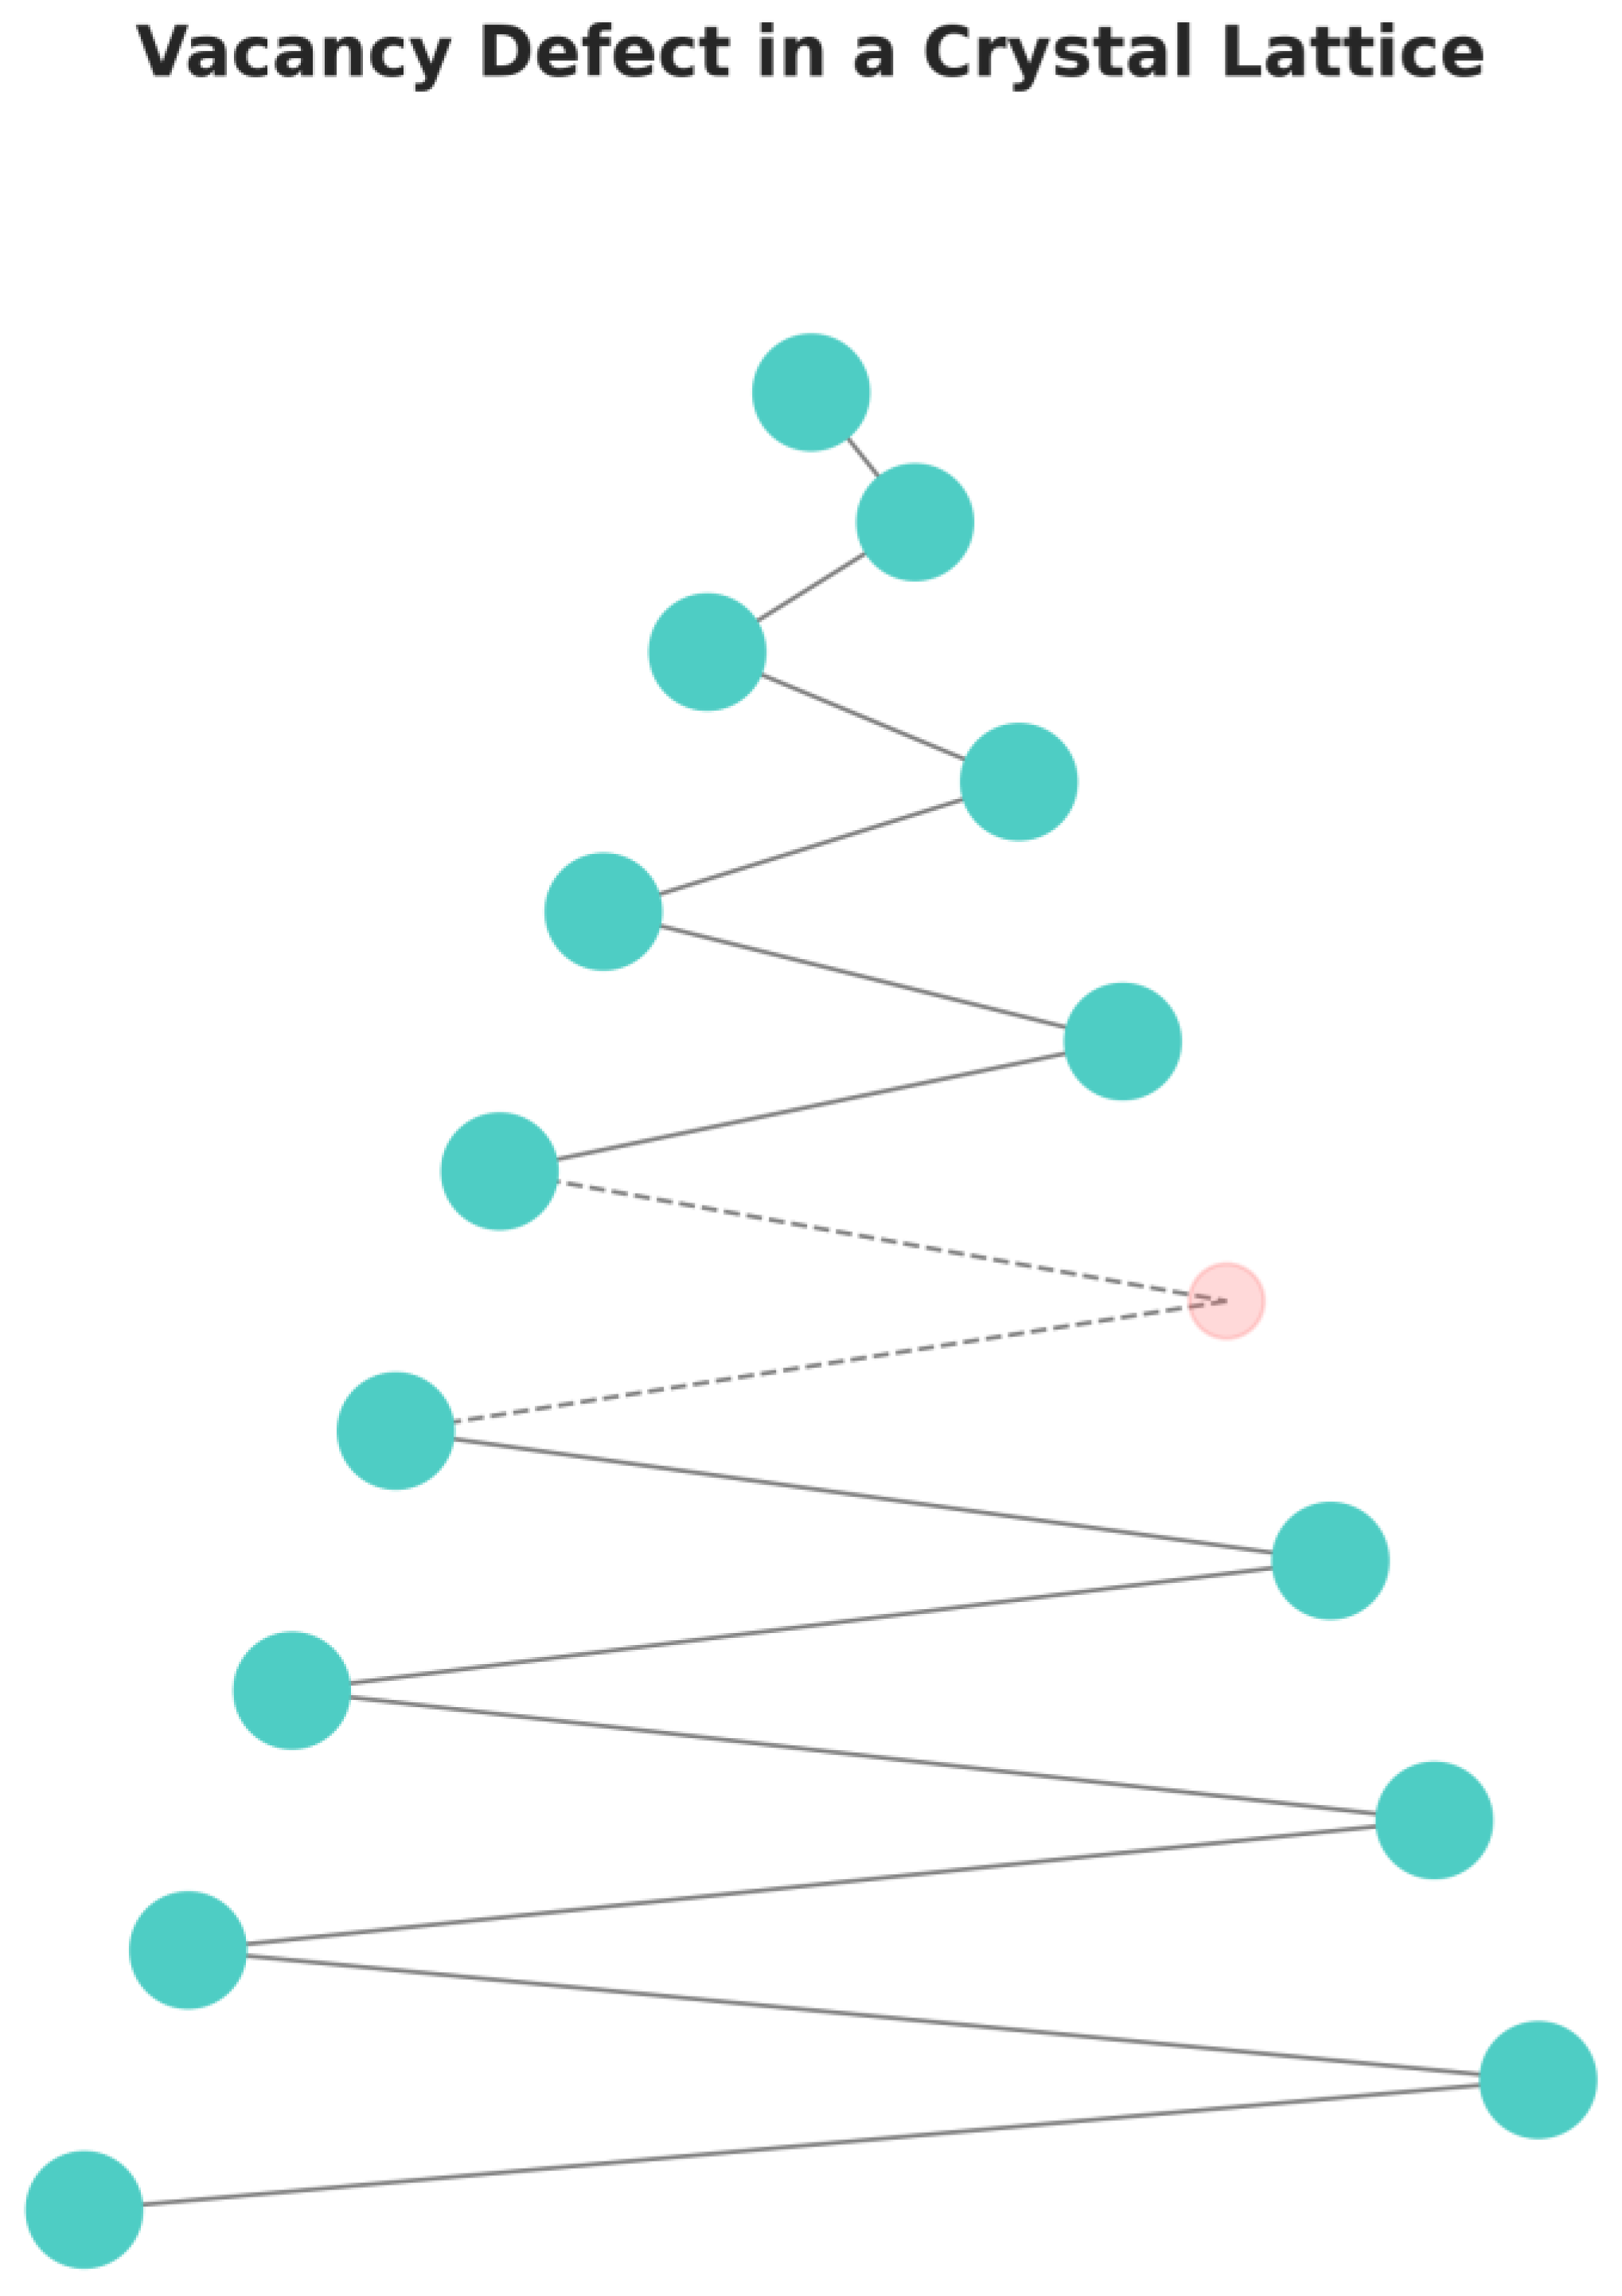
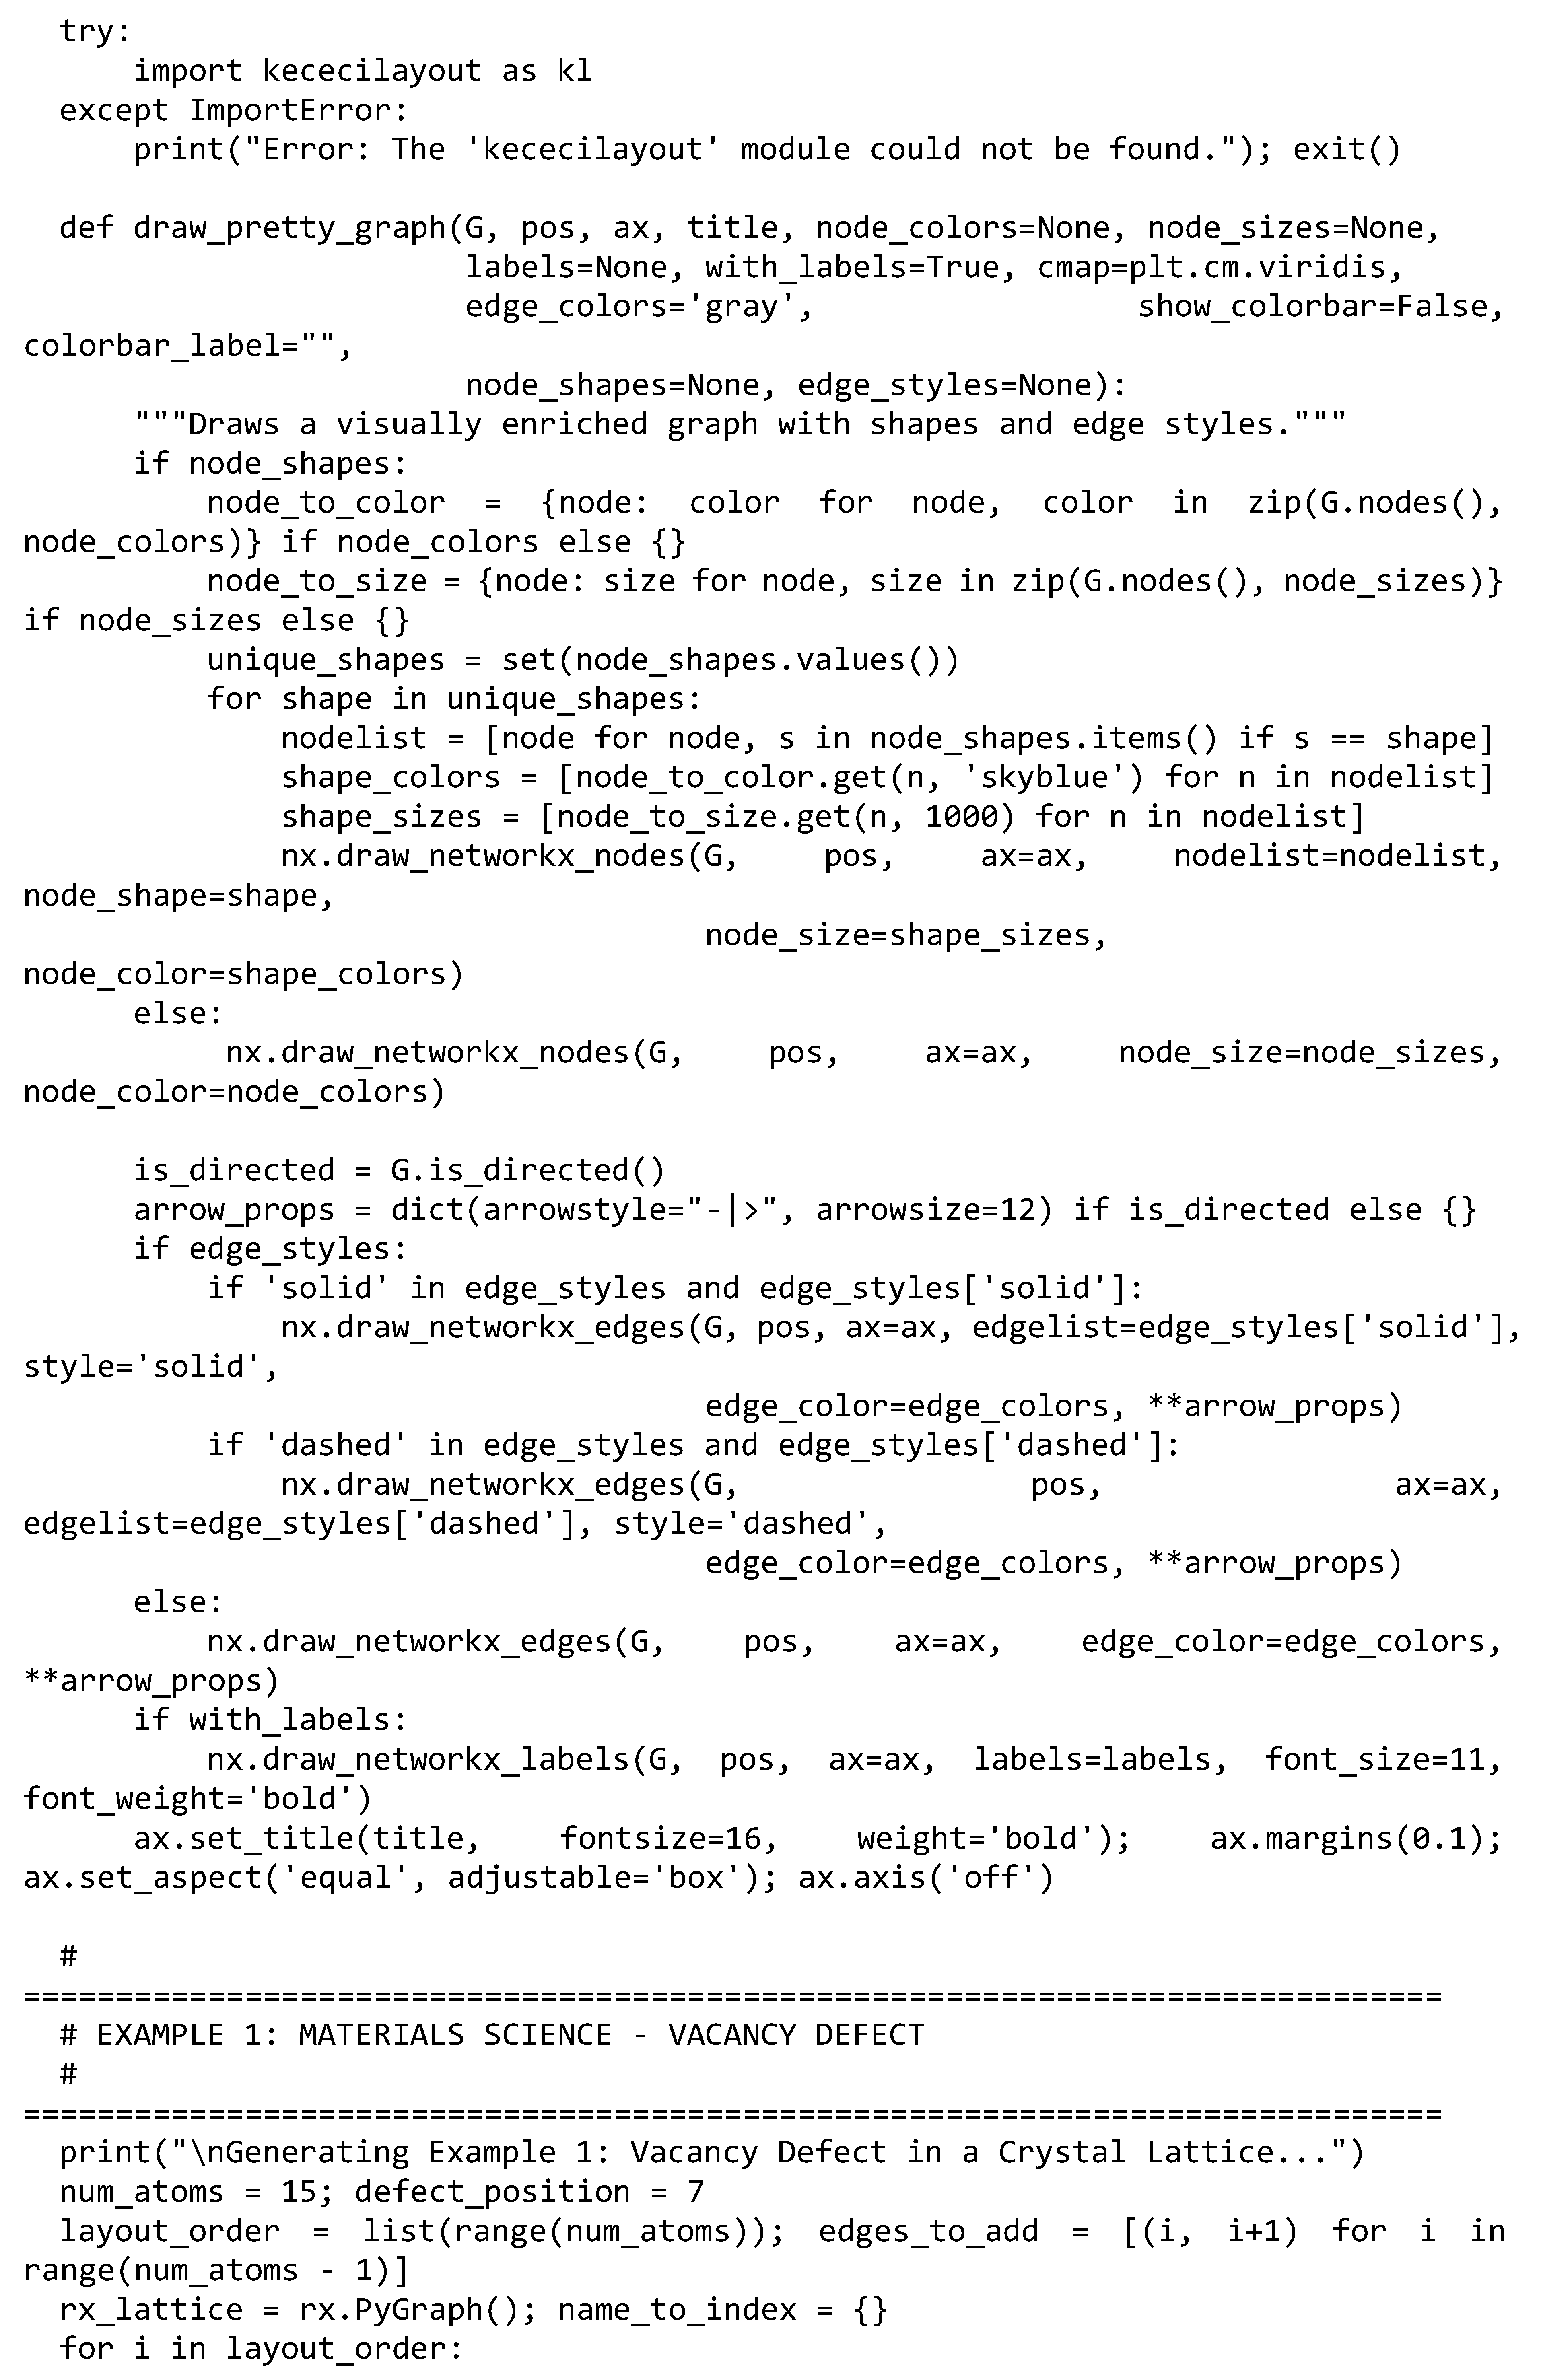
Vacancy Defect in a Crystal Lattice:
The mechanical, electrical, and thermal properties of crystalline materials are significantly influenced by defects within their ideal periodic structure. One of the simplest and most common point defects is the vacancy defect, where a lattice site that should be occupied by an atom is empty. These defects govern properties such as diffusion, creep, and conductivity in a material.
This visualization models a single vacancy defect in a one-dimensional atomic chain:
- Role of the Keçeci Layout: The algorithm maps the atomic positions of the ideal crystal lattice into an ordered and periodic arrangement. This generates a perfect reference structure against which the defect can be analysed. The regular structure of the chain can be clearly followed from top to bottom.
- Representation of the Defect: Rather than deleting a node from the graph, the node at the defect’s location is represented as a “ghost” node by altering its color and size. This approach preserves the integrity of the lattice structure for context, while highlighting the defect’s position and its impact on its surroundings (e.g., weakened neighbouring bonds, indicated by dashed lines).
- Node Color and Size: Regular atoms are shown in a standard color and size, whereas the vacancy is depicted with a transparent and smaller circle, reinforcing the sense of an “empty” site.
This method demonstrates how the Keçeci Layout can be used as a powerful analytical tool to study the position and impact of a local perturbation within the context of a global, ordered structure.
Figure 11.
Visualization of a Vacancy Defect in a Crystal Lattice with Keçeci Layout (Version 4).
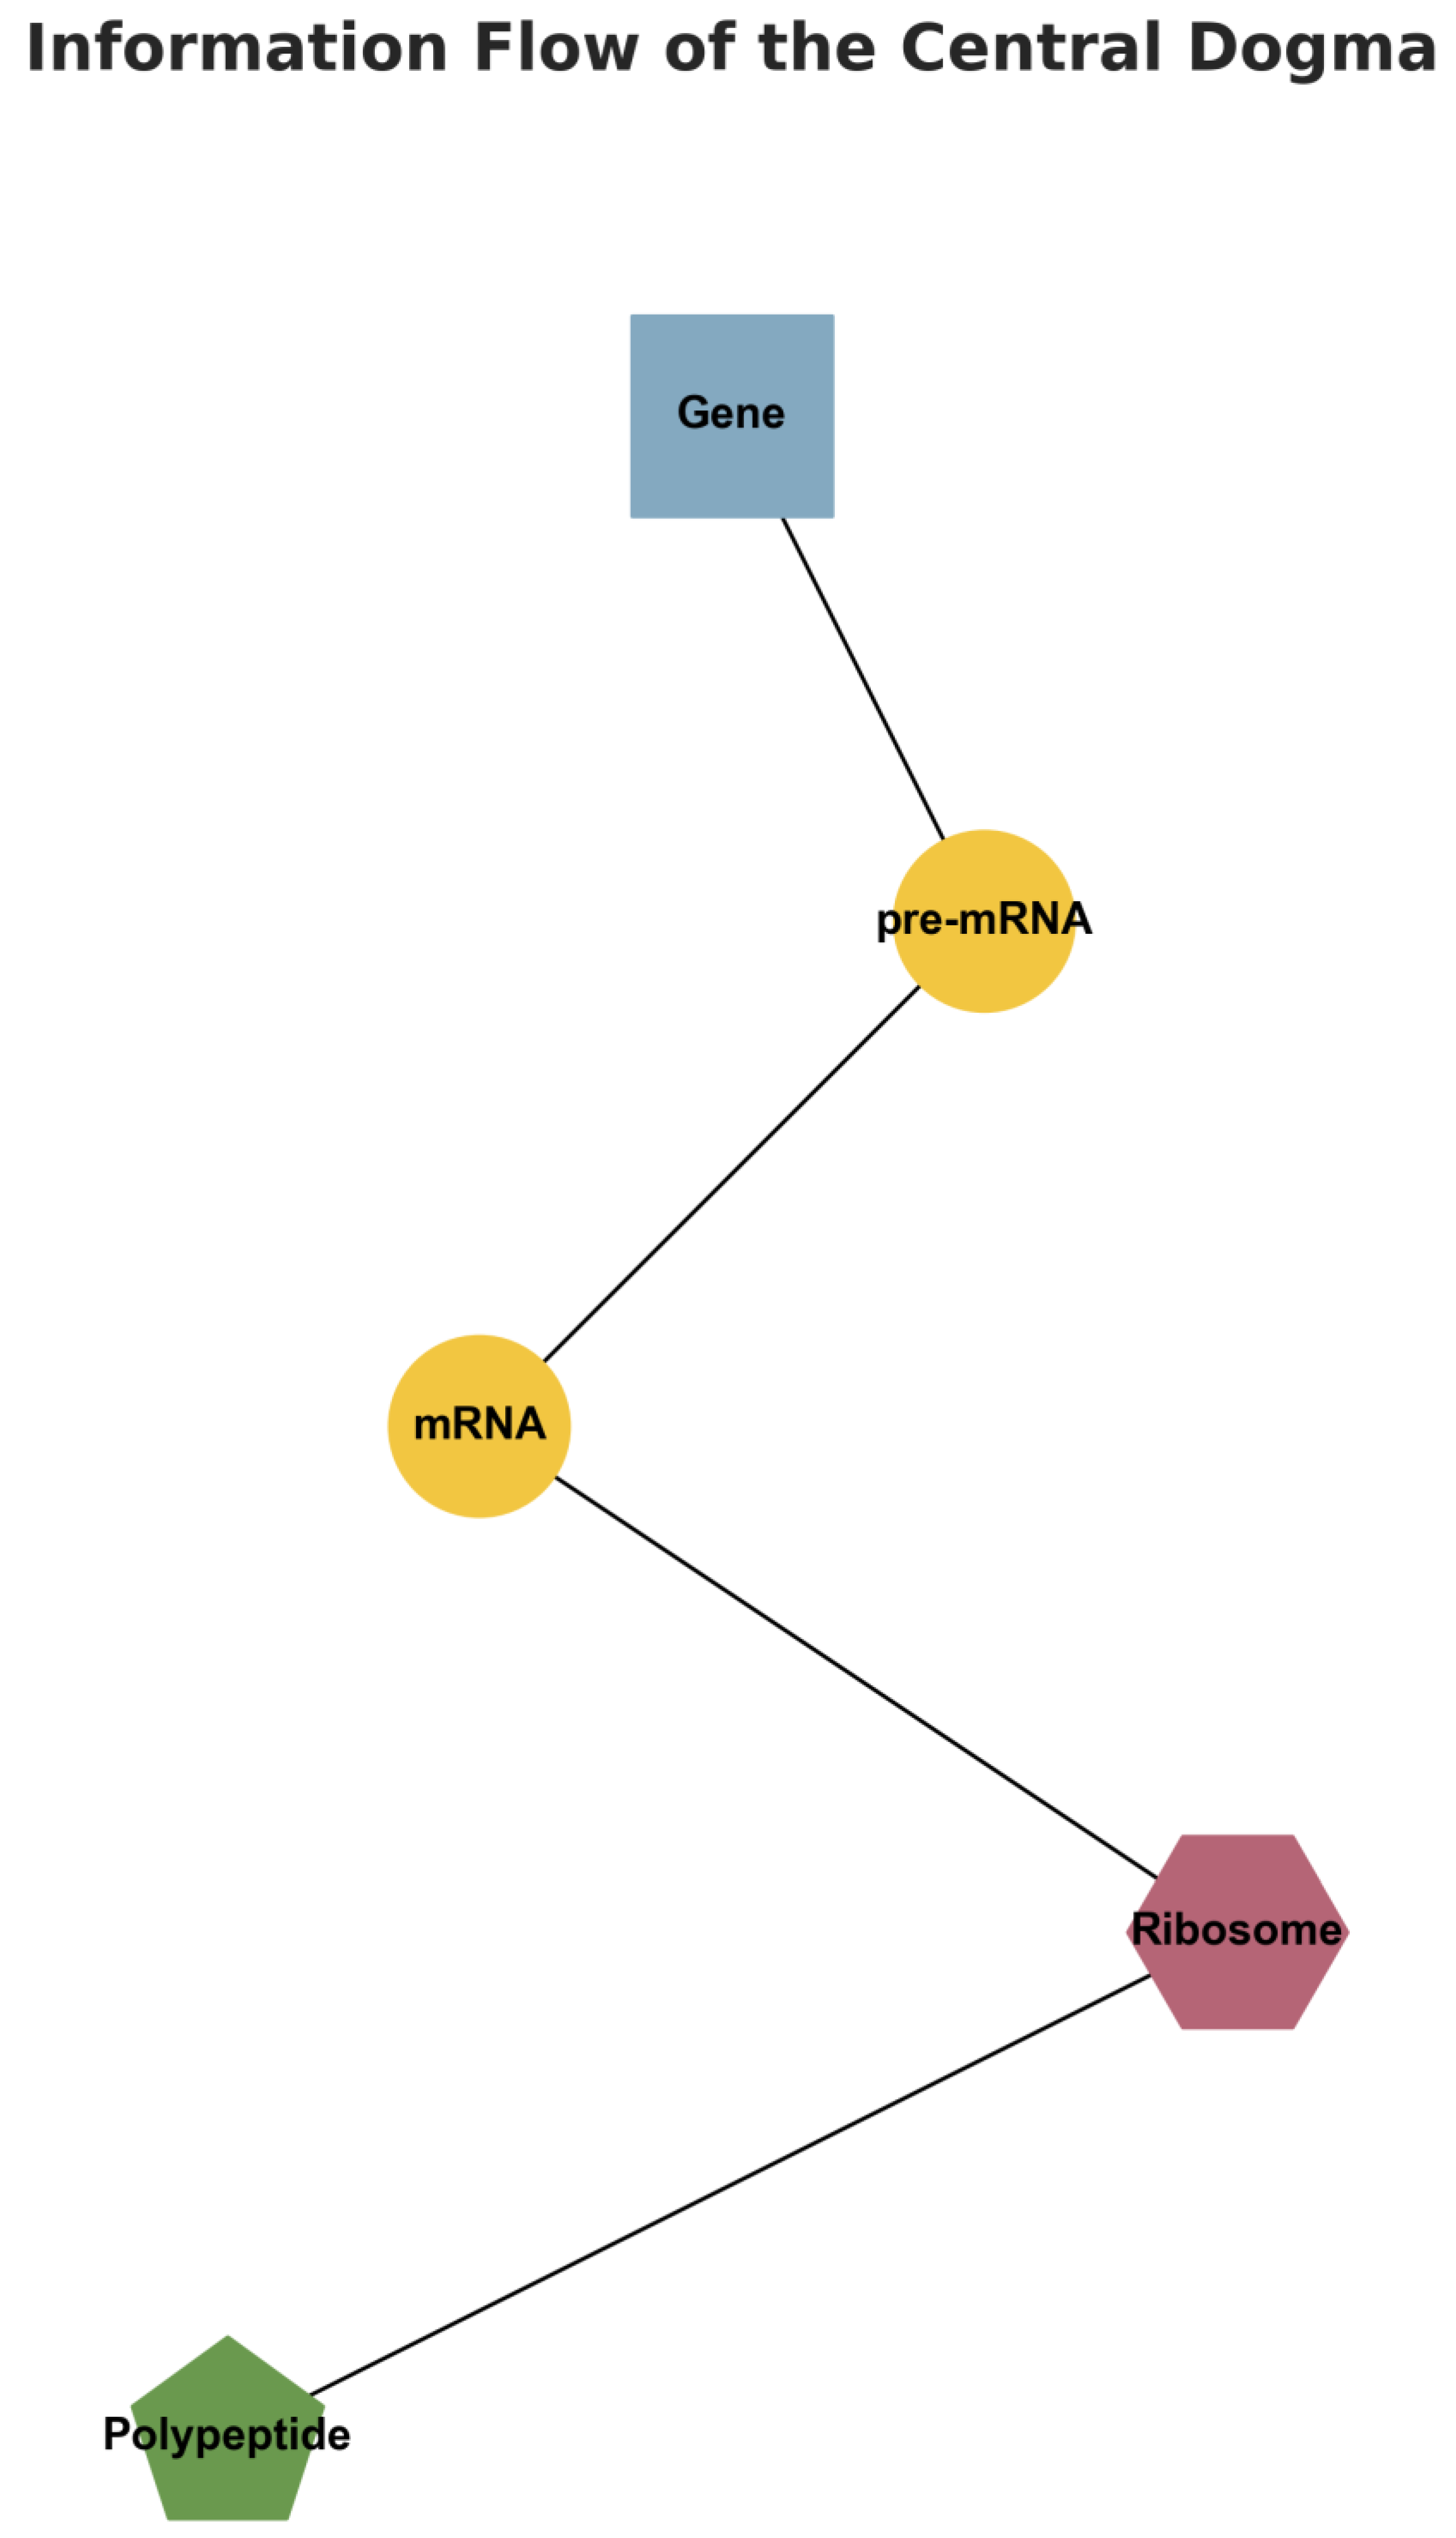
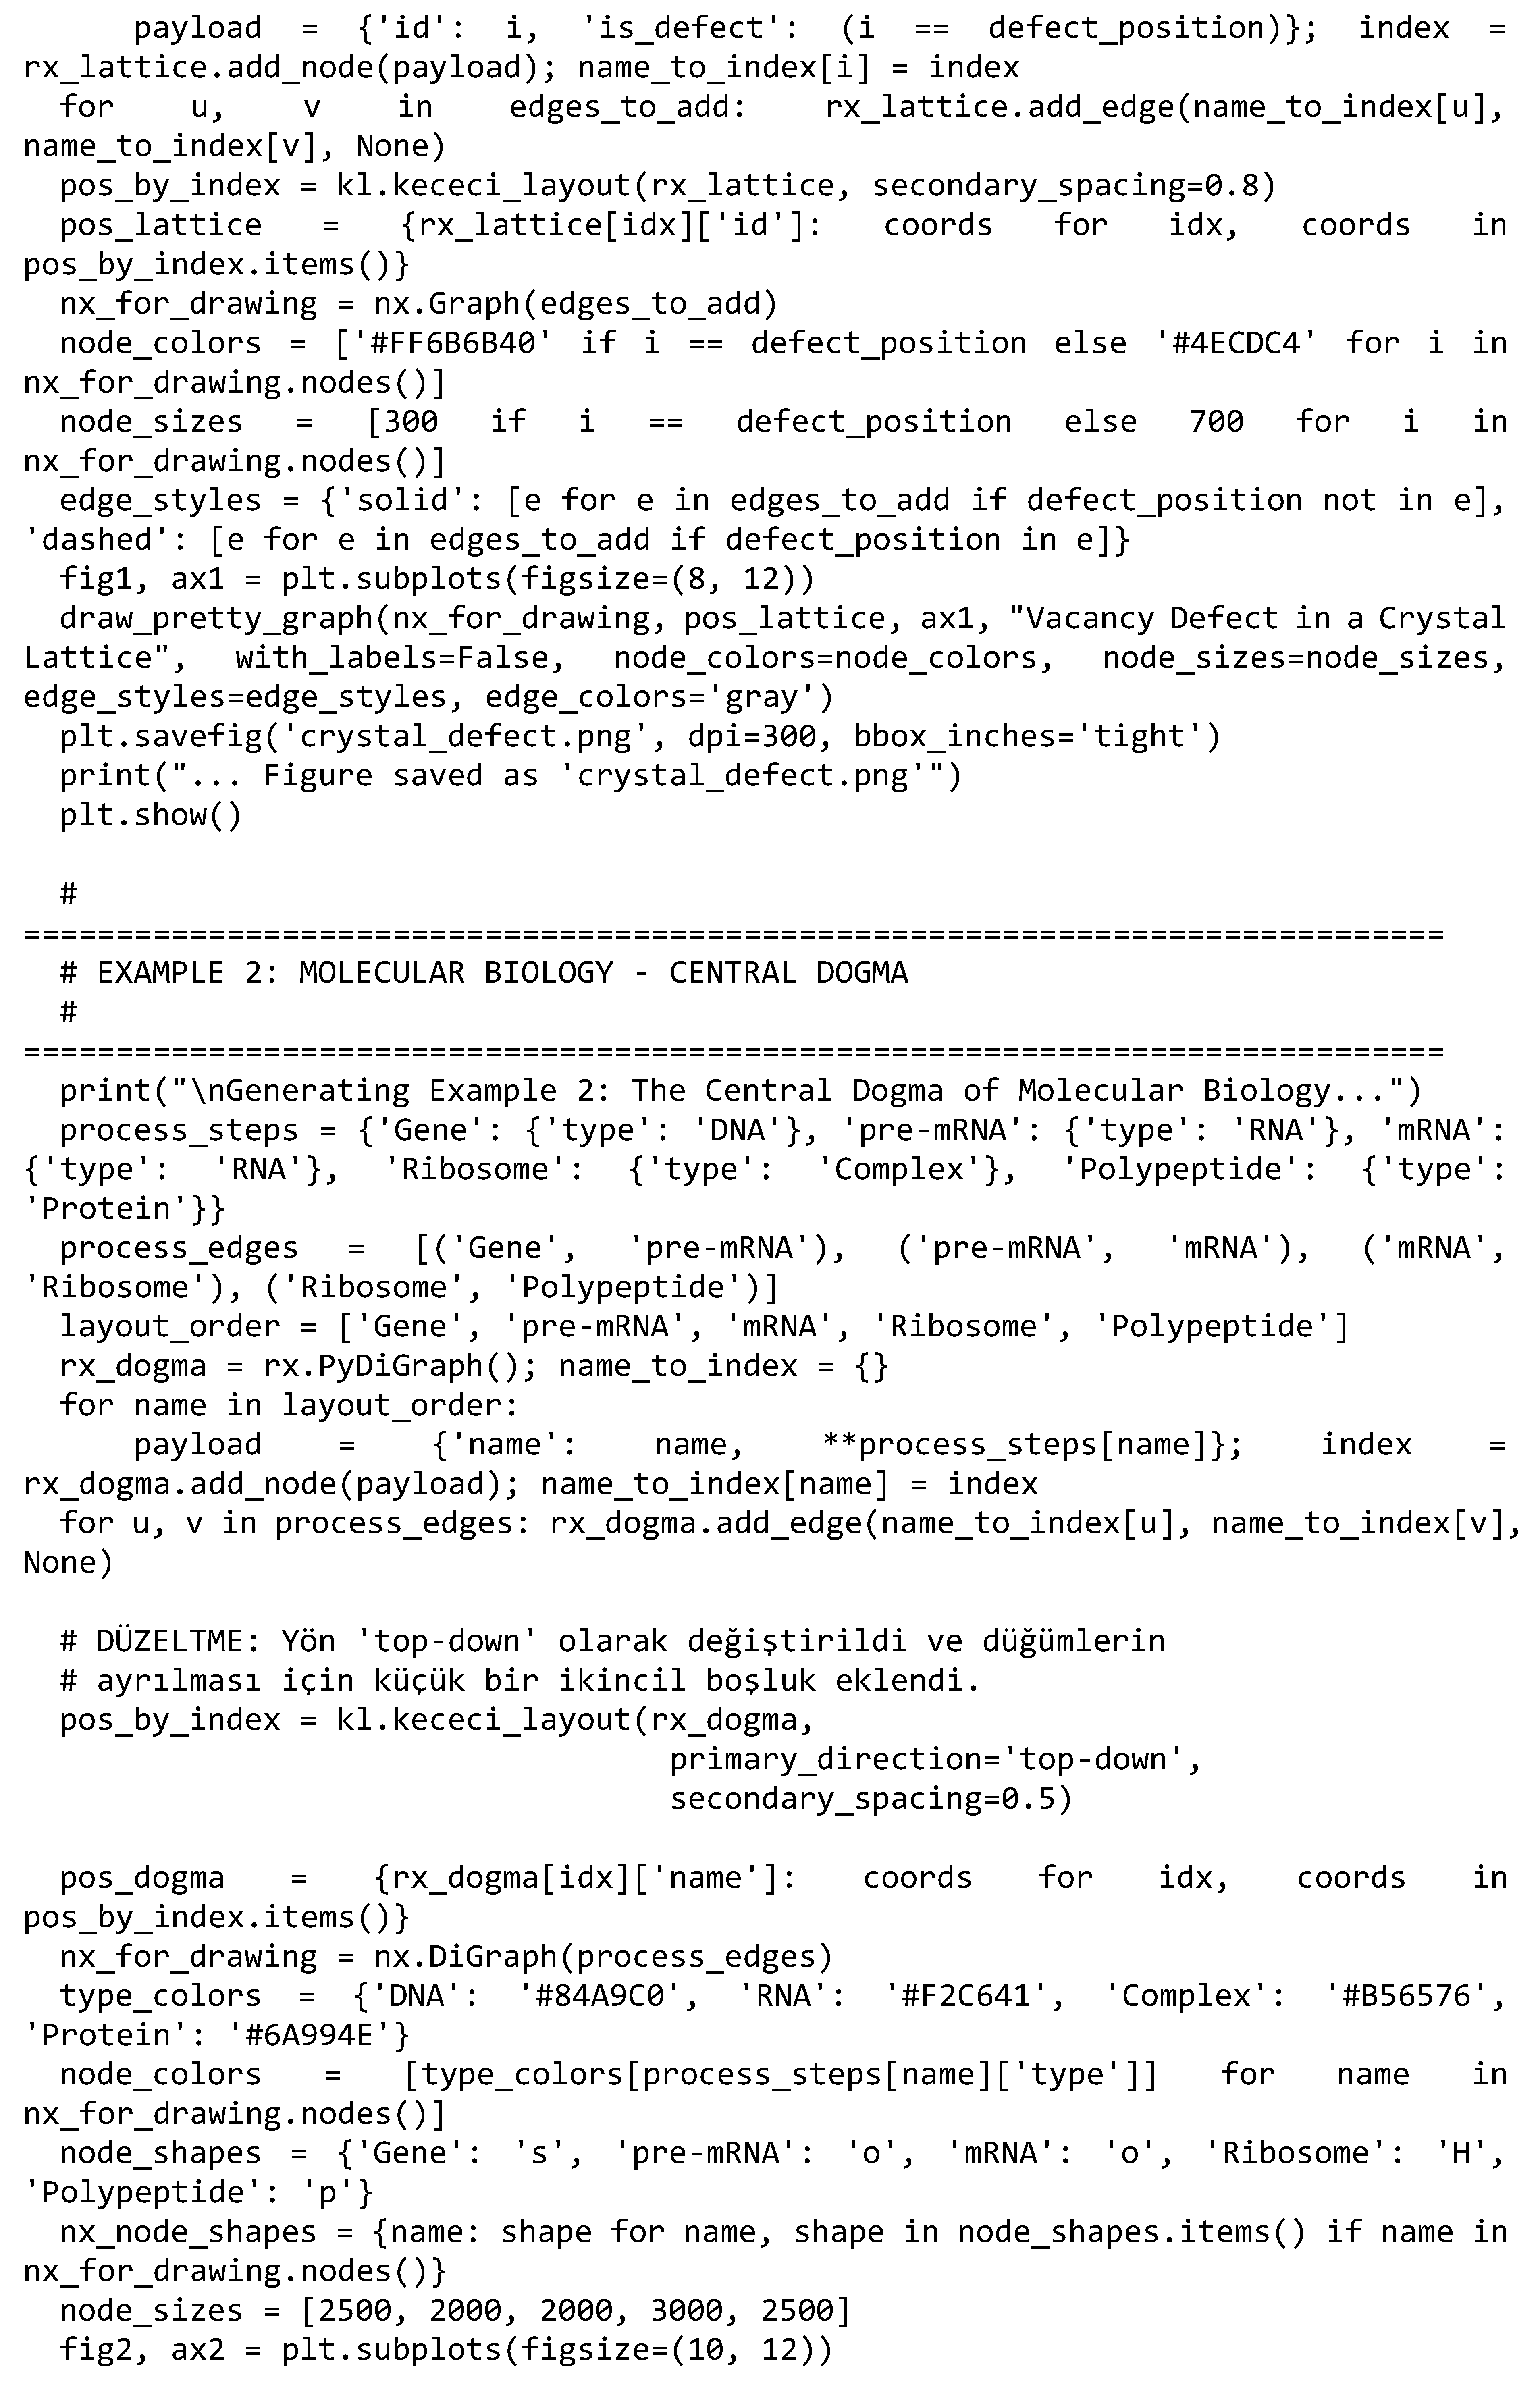
Information Flow of the Central Dogma:
The Central Dogma of molecular biology is the fundamental principle describing how genetic information flows within a cell: from DNA to RNA (transcription), and from RNA to protein (translation). This is a strictly sequential and directional flow of information that underpins all living systems.
This visualization conceptually models this multi-step process:
- Role of the Keçeci Layout: The left-to-right progression perfectly mirrors the direction of information flow and the chronology of the process. Each “column” represents a distinct stage: the gene region on the DNA, its transcription into pre-mRNA, the formation of mature mRNA through splicing, translation at the ribosome, and finally, the synthesis of the amino acid chain (polypeptide).
- Nodes: Represent each key molecule and stage of the process. Labels are rendered with LaTeX to match standard biological terminology.
- Node Color and Shape: Are used to distinguish between different types of molecules (DNA, RNA, Ribosome, Amino Acids). This allows the viewer to instantly recognize the different biomolecular entities involved.
- Edges: Are drawn as directed arrows, indicating the transfer of information from one stage to the next.
This layout presents the linear and sequential nature of the Central Dogma in a more dynamic and structured way than static textbook diagrams. The Keçeci Layout enhances comprehension by breaking down a complex biological narrative into easy-to-follow steps.
Figure 12.
Visualization of a Information Flow of the Central Dogma with Keçeci Layout (Version 4).
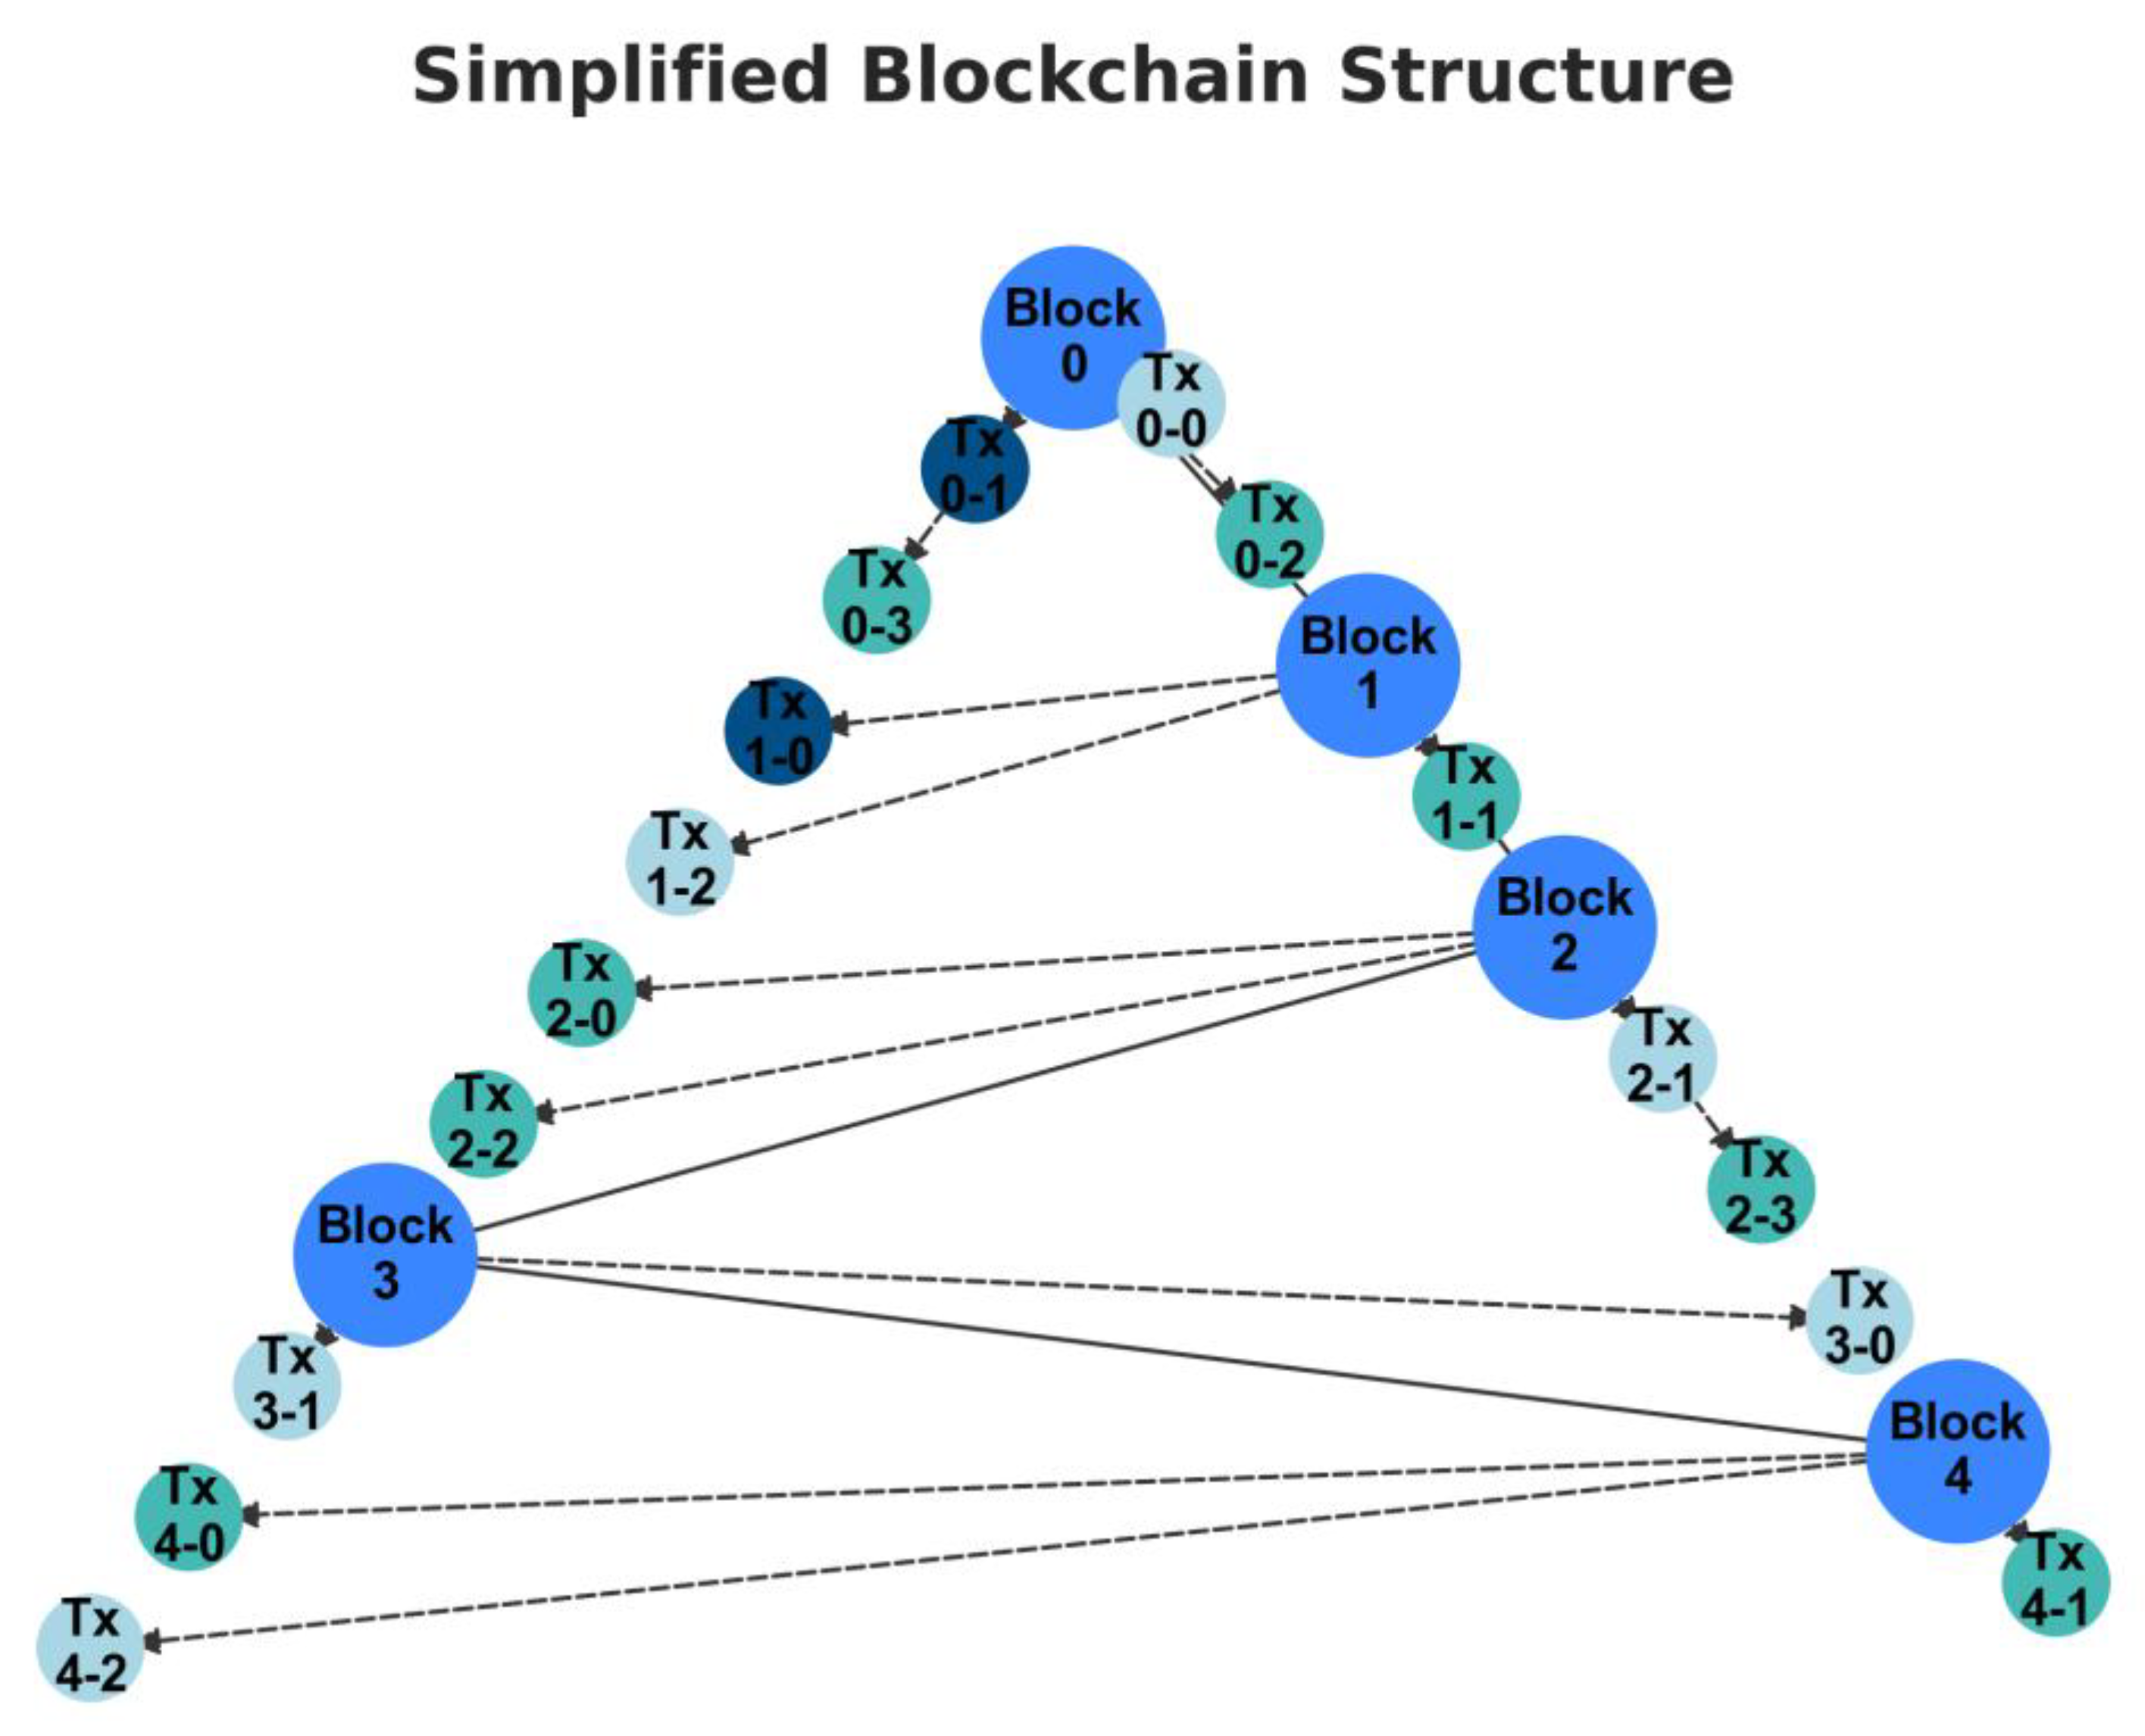
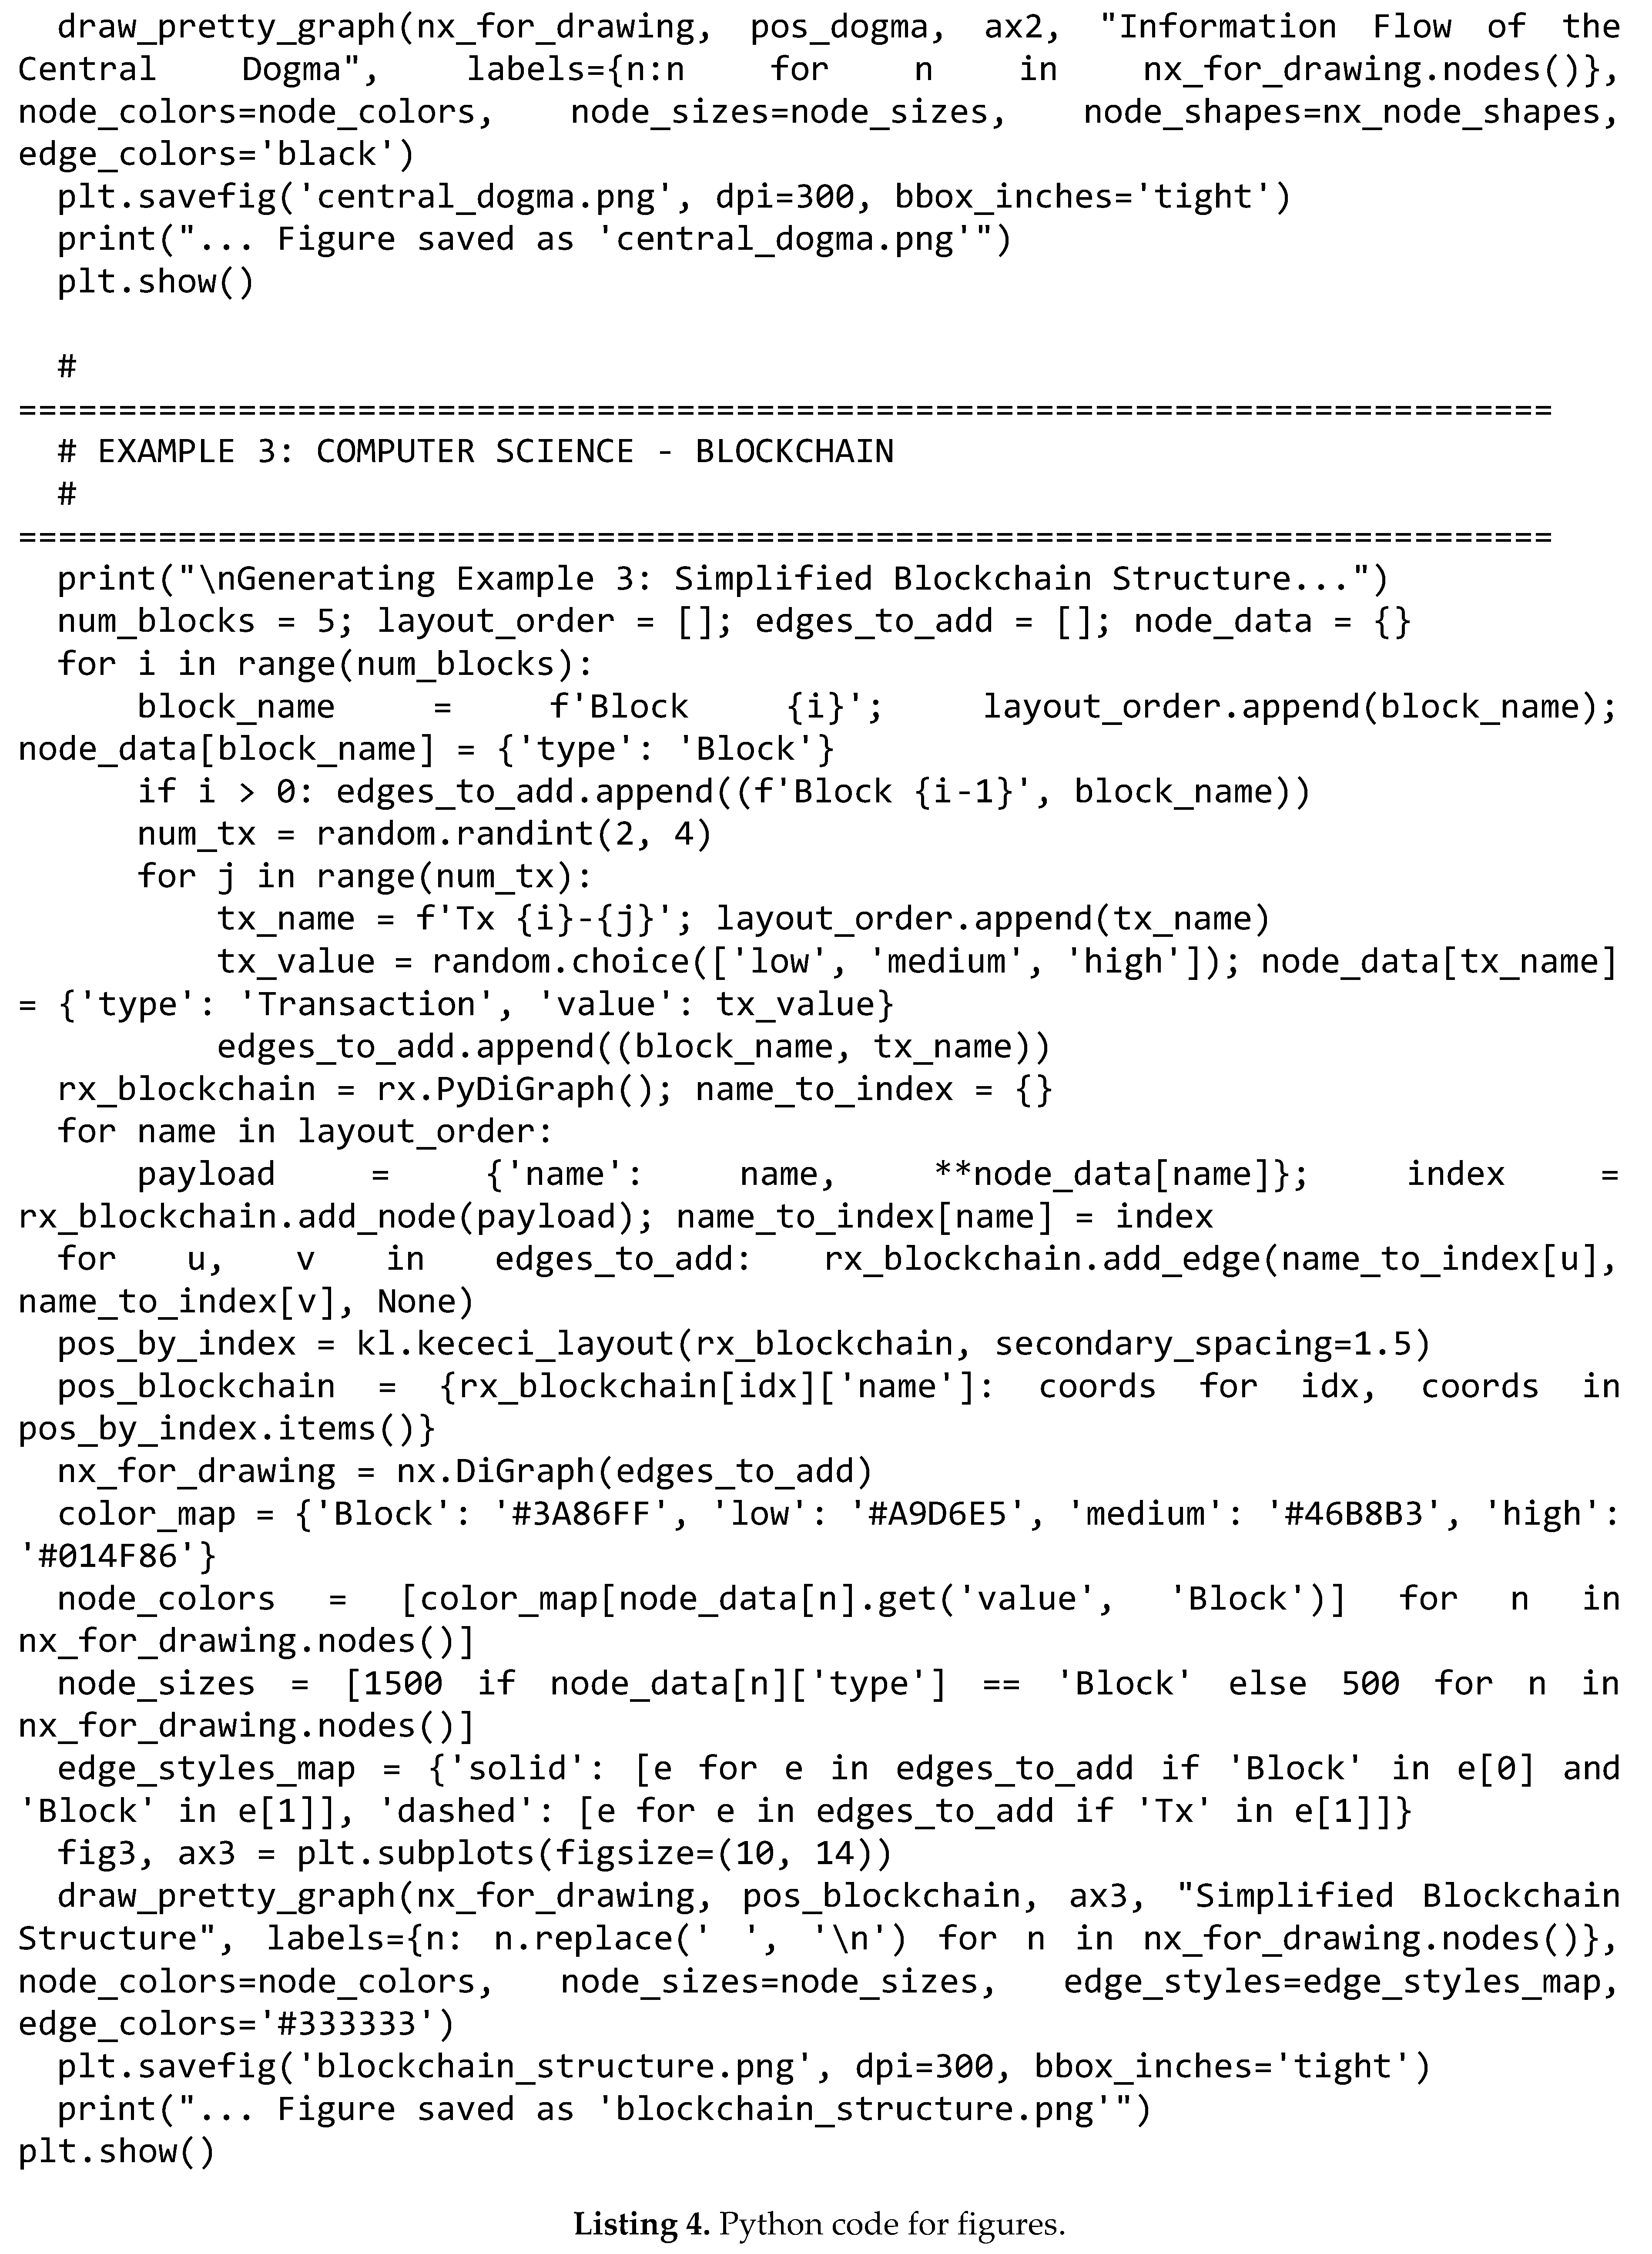
Simplified Blockchain Structure:
A blockchain is a distributed database or ledger that is shared among the nodes of a computer network, consisting of a continuously growing list of records, called blocks, that are linked using cryptography. Each block typically contains a cryptographic hash of the previous block, a timestamp, and transaction data. This structure generates an immutable and sequential record.
This visualization models this fundamental structure in a simplified manner:
- Role of the Keçeci Layout: The primary top-down axis represents the chronological and sequential structure of the blockchain. Block 0 (the Genesis block) is at the top, and each new block is appended to the chain. This emphasizes the immutable and sequential nature of the ledger.
- Nodes and Branching: The large nodes on the main chain represent the “Blocks.” The smaller nodes branching off from each block represent the “Transactions” contained within that block. The zigzag pattern of the Keçeci layout clearly displays these transaction branches without cluttering the main chain structure.
- Node Color: Visually separates the blocks from the transactions. Furthermore, the color of the transaction nodes can vary based on transaction value (low, medium, high), providing an additional layer of data.
- Edges: The main link between blocks (the cryptographic hash link) is shown with a thick line, while the relationship between blocks and their transactions is shown with thinner lines.
This visualization demonstrates how an abstract data structure like a blockchain can be transformed into a concrete, ordered, and hierarchical diagram using the Keçeci layout, allowing its fundamental components (blocks, transactions, chain structure) to be effectively analysed.
Figure 13.
Visualization of a Simplified Blockchain Structure with Keçeci Layout (Version 4).
XII. The Keçeci Layout as an Interdisciplinary Analytical Tool
The case studies presented throughout this work have proven that the “Keçeci Layout” algorithm [15,16,17,18,19,20,37,38,53,54,55,56,57,58,59] is a powerful and flexible tool for visualizing ordered and hierarchical systems across various scientific disciplines. Unlike traditional force-directed methods, this deterministic approach preserves the underlying logical and index-based structure of a system, generating a direct bridge between the visual representation and the abstract data structure. From quantum oracle problems in physics [30,31,44,51] to crystal defects in materials science, metabolic pathways in biology, and cryptographic structures like blockchain in computer science, the structural clarity provided by the Keçeci Layout has significantly enhanced analytical depth.
The mathematical foundation underlying this layout algorithm is supported by novel numerical and geometric constructs such as Keçeci Numbers [21,22,23,24,25], Keçeci Squares [26,27,28,29], and Keçeci Fractals [39,40,41,42,43]. These structures demonstrate that the algorithm is more than just a visualization tool; it possesses a theoretical underpinning. The deterministic zigzag pattern of the algorithm is inspired by these fundamental mathematical discoveries [25,37,38].
Future work aims to further expand the application areas of the Keçeci Layout. In particular, it could be a valuable tool in the analysis of noise and scalability challenges in quantum computation [30,32,52] and quantum error correction codes [30,44,51], by visualizing the dynamics of qubit states and interaction networks. Similarly, in studies exploring the technological and methodological bridges between gravitational wave observations and quantum computing [45,46,47,48], it could be used to map complex signal processing and data flow diagrams. Furthermore, it offers new possibilities for the structural representation of layered material models in research on topological phases and exotic electronic states [33,34,49,50].
In conclusion, the Keçeci Layout is a mature and extensible platform that offers researchers in different scientific fields the opportunity to explore the sequential and structural properties of their systems in an intuitive and analytically powerful manner.
XIII. Conclusions
Keçeci Layout is a distinct layout algorithm offering a deterministic, sequential, and geometrically simple approach to positioning graph nodes. Its core mechanism relies on placing nodes sequentially along a user-defined primary axis while applying a controlled zigzag offset on a secondary axis. The algorithm’s most significant advantage lies in its absolute determinism and reproducibility. Given the same input graph and parameters, it consistently produces the exact same visual output every time. This characteristic makes it uniquely suited for tasks requiring consistent visual comparison of graphs changing over time (dynamic networks), visual regression testing, or debugging. Furthermore, its computational efficiency (often linear time, O(N)) and relatively straightforward implementation offer practical benefits. When the node order is meaningful (e.g., timestamps, identifiers, process steps), it naturally emphasizes that sequence.
Conversely, Keçeci Layout does not inherently optimize for common aesthetic criteria such as minimizing edge crossings or revealing topological structures like clusters. Its visual output is heavily dependent on the input node order; if this order is arbitrary, the resulting layout can be confusing. It lacks the “organic” appearance of popular force-directed algorithms or the flow-oriented structure of hierarchical layouts.
Consequently, Keçeci Layout should not be viewed as a universal replacement for established algorithms like force-directed or hierarchical methods when their respective strengths are paramount. Instead, it serves as a valuable complementary tool within the graph visualization toolkit. It excels in specific scenarios where predictability, emphasis on order, speed, and direct comparability are the primary requirements. These properties make it particularly useful in specific scientific domains:
Chemistry: In computational chemistry and reaction kinetics, it can visualize reaction pathways where each node represents a molecular intermediate. The primary axis acts as the reaction coordinate, clearly showing the sequence of transformations. It is also ideal for comparing the step-by-step growth of different polymers or for tracking atomic position changes across snapshots of a molecular dynamics simulation, where maintaining a consistent visual frame of reference is crucial.
Physics: For particle physics, it can map out particle decay chains, where the sequence of decay products is fundamental. In quantum computing, the algorithm can represent the sequence of quantum gates in a circuit, as the order of operations is strictly defined and critical. Similarly, it can be used to visualize the system’s dynamics through discrete states or time steps in a simulation, with its determinism ensuring that comparisons between different simulation runs highlight only the true variations.
Biology & Bioinformatics: The layout is exceptionally well-suited for comparative genomics, specifically for visualizing gene order (synteny) along chromosomes of different species. Its deterministic nature makes genetic insertions, deletions, or inversions immediately obvious when comparing two layouts side-by-side. It can also clearly depict sequential processes like metabolic pathways or cell signalling cascades, where one event triggers the next in a specific order.
In summary, Keçeci Layout is ideal for tracking dynamic graph transformation, visualizing ordered processes, or ensuring consistent layouts for debugging and documentation. It offers a distinct alternative focused on structure through sequence, rather than structure through physical simulation or hierarchical layering.
References
- Di Battista, G., Eades, P., Tamassia, R., & Tollis, I. G. (1998). Graph drawing: Algorithms for the visualization of graphs. Prentice Hall.
- Eades, P. (1984). A heuristic for graph drawing. Congressus Numerantium, 42, 149–160.
- Euler, L. (1741). Solutio problematis ad geometriam situs pertinentis. Commentarii academiae scientiarum Petropolitanae, 8, 128–140. (Original work presented in 1736).
- Fruchterman, T. M. J., & Reingold, E. M. (1991). Graph drawing by force-directed placement. Software: Practice and Experience, 21(11), 1129–1164. [CrossRef]
- Gansner, E. R., Koutsofios, E., North, S. C., & Vo, K.-P. (1993). A technique for drawing directed graphs. IEEE Transactions on Software Engineering, 19(3), 214–230. [CrossRef]
- Herman, I., Melançon, G., & Marshall, M. S. (2000). Graph visualization and navigation in information visualization: A survey. IEEE Transactions on Visualization and Computer Graphics, 6(1), 24–43. [CrossRef]
- Kamada, T., & Kawai, S. (1989). An algorithm for drawing general undirected graphs. Information Processing Letters, 31(1), 7–15. [CrossRef]
- Knuth, D. E. (1968). The art of computer programming, volume 1: Fundamental algorithms. Addison-Wesley.
- Sugiyama, K., Tagawa, S., & Toda, M. (1981). Methods for visual understanding of hierarchical system structures. IEEE Transactions on Systems, Man, and Cybernetics, SMC-11(2), 109–125. [CrossRef]
- Tutte, W. T. (1963). How to draw a graph. Proceedings of the London Mathematical Society, 3(1), 743–768. [CrossRef]
- Freeman, L. C. (2000). Visualizing social networks. Journal of Social Structure, 1(1). http://www.cmu.edu/joss/content/articles/volume1/Freeman.html.
- Moreno, J. L. (1953). Who shall survive? Foundations of sociometry, group psychotherapy and sociodrama (2nd ed.). Beacon House. (Original work published 1934).
- Pavlopoulos, G. A., Secrier, M. D., Moschopoulos, C. N., Soldatos, T. G., Kossida, S., Bagos, P. G., & Vizirianakis, I. S. (2008). Using graph theory to analyze biological networks. BioData Mining, 1(1), 1–27. [CrossRef]
- Storey, M.-A. D. (1999). A cognitive framework for assessing and designing software exploration tools (Unpublished doctoral dissertation). Simon Fraser University.
- Keçeci, M. (2025, May 1). Kececilayout. Zenodo. [CrossRef]
- https://pypi.org/project/KececiLayout/.
- https://anaconda.org/bilgi/kececilayout.
- https://github.com/WhiteSymmetry/kececilayout.
- Keçeci, M. (2025). kececilayout [Data set]. WorkflowHub. [CrossRef]
- Keçeci, M. (2025, May 1). Keçeci Layout. Zenodo. [CrossRef]
- Keçeci, M. (2025). Keçeci Numbers and the Keçeci Prime Number. Authorea. June, 2025. [CrossRef]
- Keçeci, M. (2025, May 11). Keçeci numbers and the Keçeci prime number: A potential number theoretic exploratory tool. Zenodo. [CrossRef]
- Keçeci, M. (2025). kececinumbers [Data set]. WorkflowHub. [CrossRef]
- Keçeci, M. (2025, May 10). Kececinumbers. Zenodo. [CrossRef]
- Keçeci, M. (2025). Diversity of Keçeci Numbers and Their Application to Prešić-Type Fixed-Point Iterations: A Numerical Exploration. [CrossRef]
- Keçeci, M. (2025). Keçeci’s Arithmetical Square. Authorea. June, 2025. [CrossRef]
- Keçeci, M. (2025, May 15). The Keçeci binomial square: A reinterpretation of the standard binomial expansion and its potential applications. Zenodo. [CrossRef]
- Keçeci, M. (2025). kececisquares [Data set]. WorkflowHub. [CrossRef]
- Keçeci, M. (2025, May 14). Kececisquares. Zenodo. [CrossRef]
- Keçeci, M. (2025). Quantum Error Correction Codes and Their Impact on Scalable Quantum Computation: Current Approaches and Future Perspectives. [CrossRef]
- Keçeci, M. (2025). Yüksek Kübit Sayılı Kuantum Hesaplamada Ölçeklenebilirlik ve Hata Yönetimi: Yüzey Kodları, Topolojik Malzemeler ve Hibrit Algoritmik Yaklaşımlar. [CrossRef]
- Keçeci, M. (2025). Accuracy, Noise, and Scalability in Quantum Computation: Strategies for the NISQ Era and Beyond. [CrossRef]
- Keçeci, M. (2025). Weyl semimetals: Discovery of exotic electronic states and topological phases. Zenodo. [CrossRef]
- Keçeci, M. (2025). Investigating Layered Structures Containing Weyl and Majorana Fermions via the Stratum Model. [CrossRef]
- Keçeci, M. (2025). Çoklu İşlemci Mimarilerinde Kuantum Algoritma Simülasyonlarının Hızlandırılması: Cython, Numba ve Jax ile Optimizasyon Teknikleri. [CrossRef]
- Keçeci, M. (2025). Künneth Teoremi Bağlamında Özdevinimli ve Evrişimli Kuantum Algoritmalarında Yapay Zekâ Entegrasyonu ile Hata Minimizasyonu. [CrossRef]
- Keçeci, M. (2025). Keçeci Zigzag Layout Algorithm. Authorea. June, 2025. [CrossRef]
- Keçeci, M. (2025). Keçeci Deterministic Zigzag Layout. WorkflowHub. [CrossRef]
- Keçeci, M. (2025). Scalable Complexity in Fractal Geometry: The Keçeci Fractal Approach. Authorea. June, 2025. [CrossRef]
- Keçeci, M. (2025). Keçeci Fractals. WorkflowHub. [CrossRef]
- Keçeci, M. (2025, May 13). Scalable complexity: Mathematical analysis and potential for physical applications of the Keçeci circle fractal. Zenodo. [CrossRef]
- Keçeci, M. (2025). kececifractals [Data set]. WorkflowHub. [CrossRef]
- Keçeci, M. (2025, May 13). Kececifractals. Zenodo. [CrossRef]
- Keçeci, M. (2025). Kuantum Hata Düzeltmede Metrik Seçimi ve Algoritmik Optimizasyonun Büyük Ölçekli Yüzey Kodları Üzerindeki Etkileri. [CrossRef]
- Keçeci, M. (2025). The Relationship Between Gravitational Wave Observations and Quantum Computing Technologies. [CrossRef]
- Keçeci, M. (2025). Kütleçekimsel Dalga Gözlemleri ile Kuantum Bilgisayar Teknolojileri Arasındaki Teknolojik ve Metodolojik Bağlantılar. [CrossRef]
- Keçeci, M. (2025). Technical and Theoretical Bridges Between Gravitational Wave Observations and Quantum Information Processing Systems. Authorea. July, 2025. [CrossRef]
- Keçeci, M. (2025). New Technological and Methodological Approaches in Gravitational Wave Detection and Quantum Computing Development. WorkflowHub. [CrossRef]
- Keçeci, M. (2025). Kuantum geometri, topolojik fazlar ve yeni matematiksel yapılar: Disiplinlerarası bir perspektif. Zenodo. [CrossRef]
- Keçeci, M. (2025). Nodal-line semimetals: A geometric advantage in quantum information. Zenodo. [CrossRef]
- Keçeci, M. (2025). Kuantum Hata Düzeltme Algoritmalarında Özyineleme Optimizasyonu ve Aşırı Gürültü Toleransı: Kuantum Sıçraması Potansiyelinin Değerlendirilmesi. [CrossRef]
- Keçeci, M. (2025). Nanoscale Quantum Computers Fundamentals, Technologies, and Future Perspectives. [CrossRef]
- Keçeci, M. (2025). The Keçeci Layout: A Structural Approach for Interdisciplinary Scientific Analysis. [CrossRef]
- Keçeci, M. (2025). Beyond Topology: Deterministic and Order-Preserving Graph Visualization with the Keçeci Layout. WorkflowHub. [CrossRef]
- Keçeci, M. (2025). Beyond Traditional Diagrams: The Keçeci Layout for Structural Thinking. Knowledge Commons. [CrossRef]
- Keçeci, M. (2025). The Keçeci Layout: A Structural Approach for Interdisciplinary Scientific Analysis. figshare. Journal contribution. [CrossRef]
- Keçeci, M. (2025, July 3). The Keçeci Layout: A Structural Approach for Interdisciplinary Scientific Analysis. OSF. [CrossRef]
- Keçeci, M. (2025). The Keçeci Layout: A Cross-Disciplinary Graphical Framework for Structural Analysis of Ordered Systems. Authorea. [CrossRef]
- Keçeci, M. (2025). When Nodes Have an Order: The Keçeci Layout for Structured System Visualization. HAL open science. https://hal.science/hal-05143155; [CrossRef]
Disclaimer/Publisher’s Note: The statements, opinions and data contained in all publications are solely those of the individual author(s) and contributor(s) and not of MDPI and/or the editor(s). MDPI and/or the editor(s) disclaim responsibility for any injury to people or property resulting from any ideas, methods, instructions or products referred to in the content. |
© 2025 by the authors. Licensee MDPI, Basel, Switzerland. This article is an open access article distributed under the terms and conditions of the Creative Commons Attribution (CC BY) license (http://creativecommons.org/licenses/by/4.0/).
Copyright: This open access article is published under a Creative Commons CC BY 4.0 license, which permit the free download, distribution, and reuse, provided that the author and preprint are cited in any reuse.


