
Submitted:
16 January 2025
Posted:
17 January 2025
You are already at the latest version
Preprints on COVID-19 and SARS-CoV-2
Abstract
Kidney transplant recipients (KTRs) are at high risk of severe COVID-19 outcomes due to chronic immunosuppression, which can impair vaccine efficacy. While mycophenolate sodium (MPS) and azathioprine (AZA) are commonly used immunosuppressive agents, their influence on anti-SARS-CoV-2 antibody kinetics remains unclear. This study compares the humoral response in KTRs receiving MPS or AZA after ChAdOx1 primary vaccination. Methods: This prospective, observational, single-center study included 89 KTRs who had undergone transplantation and seroconverted following ChAdOx1 vaccination. Patients were grouped based on maintenance immunosuppression: MPS (n=51) or AZA (n=38). Anti-SARS-CoV-2 IgG titers and neutralizing antibody activity were measured at screening and 1-, 3-, 6-, and 12-months post-transplant. Linear regression models and generalized estimating equations were applied to analyze group and time effects. Results: At baseline, IgG titers were 12,059.2 AU/mL (MPS) and 14,369.3 AU/mL (AZA), with both groups experiencing a decline at month 1 (9,483.9 AU/mL and 11,023.5 AU/mL, respectively). By month 12, titers stabilized at 11,626.8 AU/mL (MPS) and 13,851.4 AU/mL (AZA; p=0.286). Neutralizing antibody activity was initially higher in the AZA group (0.924 vs. 0.764 at baseline; p=0.006) but converged with the MPS group by month 3 (0.937 vs. 0.871; p=0.161). Booster doses significantly enhanced responses, with a mean gain of 0.175 in neutralizing activity over 12 months. Conclusions: AZA offers a transient early advantage in humoral responses compared to MPS, but long-term antibody kinetics were comparable. Booster doses are critical for sustaining immunity in KTRs, underscoring the need for tailored vaccination strategies in this population. These findings may guide clinical decisions during pandemic scenarios.
Keywords:
COVID-19
; SARS-CoV-2
; vaccine
; kidney transplant
; immunosuppression
1. Introduction
The COVID-19 pandemic has posed a significant global health challenge, particularly for vulnerable populations such as kidney transplant recipients (KTRs) [1]. Due to the chronic use of immunosuppressive drugs to prevent graft rejection, these patients face a heightened risk of severe complications and mortality from SARS-CoV-2 infection [1]. Moreover, their immune response to vaccination may be impaired, raising concerns about the effectiveness of COVID-19 vaccines in this population [2].
The ChAdOx1 (AstraZeneca) is a viral vector-based vaccine in which an adenovirus that infects chimpanzees is genetically engineered to insert the SARS-CoV-2 Spike protein. The primary schedule comprises two intramuscular shots administered at 4 to 12 weeks, with efficacy against infection above 70% in the general population [3,4]. In KTRs, the ChAdOx1 vaccine provides comparable antibody titers to mRNA platforms [5]. Notably, while vaccination has not significantly reduced the incidence of COVID-19 in KTRs, an increased number of vaccine doses has been associated with a decreased risk of mortality in this population [6].
In addition to the lower humoral response, the duration of kinetics of anti-SARS-CoV-2 antibodies appears to be disadvantageous in those using chronic immunosuppression. However, the association between the type of maintenance immunosuppressive therapy and the kinetics of the humoral response after transplantation is not well established. In this context, it becomes crucial to investigate whether the type of maintenance immunosuppression influences the kinetics of anti-SARS-CoV-2 antibodies in kidney transplant recipients who were primarily vaccinated with ChAdOx1 and had a primary response.
2. Materials and Methods
2.1. Study Design and Population
This is a prospective, observational, single-center study comparing the kinetics of the anti-SARS-CoV-2 antibodies in patients receiving a kidney transplant who received the ChAdOx1 vaccine as the primary vaccine schedule according to the maintenance immunosuppressive regimen prescribed on the first day after transplantation.
We included patients who received the ChAdOx1 vaccine as the primary schedule and had undergone kidney transplantation in our center from a living or deceased donor. We excluded patients with a previous diagnosis of COVID-19, negative SARS-CoV-2 IgG serology on inclusion, those living with HIV, and those currently undergoing cancer treatment. All patients were followed up for 12 months from the date of inclusion. A blood sample was collected immediately before the transplant and after 1, 3, 6, and 12 months for immunological analysis. In each study visit, the patients were argued about vaccine boosters received and COVID-19 diagnosis.
The eligible population signed an informed consent form. The study was complied with the Good Clinical Practice guidelines and the Declaration of Helsinki and was approved by the Institutional Review Board of the Federal University of São Paulo (approval number: 5.056.135).
2.2. Study Objectives
The main objective of the study was to compare the kinetics of anti-SARS-CoV-2 IgG titers and neutralizing antibodies in de novo kidney transplant recipients receiving mycophenolate or azathioprine as part of the immunosuppressive regimen over a 12-month follow-up period. Secondary assessments were conducted at 1, 3, and 6 months.
Other objectives were to assess the number, type, and time of additional vaccine doses. These outcomes were also analyzed and compared between the groups at 1, 3, 6, and 12 months.
2.3. Immunological Assessment
The humoral immune was assessed by the kinetics of the SARS-CoV-2, IgG titers, and neutralizing antibodies in blood samples collected at five study visits: screening (immediately before the transplant), and study visits after 1, 3, 6, and 12 months of inclusion.
We used the AdviseDx SARS-CoV-2 IgG II test (Abbott Laboratories, Sligo, Ireland; lower limit of positivity 50 AU/mL) to evaluate IgG antibodies targeting the receptor-binding domain (RBD) of the S1 subunit of the SARS-CoV-2 Spike protein [7]. We used the cPass™ SARS-CoV-2 test (GenScript Laboratory, Rijswijk, The Netherlands; positivity limit 30%) to evaluate the neutralizing activity of anti-SARS-CoV-2 antibodies [8].
2.4. Vaccination Strategy
In our country, the COVID-19 vaccination was managed by the National Immunization Program, and the public health system applied all vaccines. The KTRs have been prioritized for receiving vaccine doses and boosters since May 2021. During this study, all patients received at least one vaccine booster by the public health system. Our study did not intervene on vaccination policies of these patients.
The ChAdOx1 nCoV-19 is a non-human adenovirus vector vaccine given in two doses, with an interval of four to twelve weeks, developed by AstraZeneca [9]. The study used to register the vaccine included 32,451 adult volunteers to receive the ChAdOx1 nCoV-19 vaccine or placebo, in a 2:1 ratio. The efficacy in preventing infection was 74%, and 83.5% in people over 65 years of age [9].
2.5. Immunosuppressive Regimen
According to the standard institutional protocol, all kidney transplant recipients undergo intravenous induction therapy, which includes 1g of methylprednisolone administered intraoperatively and a single dose of rabbit anti-thymocyte globulin (rATG) at 3mg/kg on the first postoperative day. This study did not involve any interventions or modifications to the established immunosuppressive regimen. Maintenance therapy comprises prednisone 0,5mg/kg QD tapered to 5mg QD until the end of the first month and tacrolimus 0,05-0,1mg/kg BID for all patients. The third drug consists of mycophenolate sodium 720mg BID or azathioprine 2mg/kg QD, selected based on donor characteristics (standard or expanded criteria donor) and the recipient’s immunological risk profile.
2.6. Statistical Analysis
Categorical variables were expressed as percentages and compared using the chi-square test. Numerical variables were evaluated for normality using the Kolmogorov–Smirnov test. Quantitative variables were presented as a median and interquartile range for non-parametric variables and as a mean and standard deviation for parametric variables. Differences between groups were analyzed using the Mann–Whitney test.
We performed a linear regression using Generalized Estimated Equations (GEE) with pairwise comparison adjusted by Bonferroni to compare the time and group effect on anti-SARS-CoV IgG titers and neutralizing antibodies over time [10]. Due to the small number of negative and indeterminate results, neutralizing antibody data were dichotomized into positive and non-positive.
Statistical analyses were performed using the statistical package SPSS version 29 (IBM Corp. Released 2022. IBM SPSS Statistics for Windows, Version 29.0, Armonk, NY, USA: IBM Corp.). We considered a p < 0.05 as statistically significant.
3. Results
3.1. Demographic Characteristics
Between December 13, 2021 and April 05, 2022, 115 patients were enrolled, but 26 were excluded due to other primary vaccine regimens (n=23), SARS-CoV-2 IgG negative at screening (n=2), or receiving mTOR inhibitor as maintenance immunosuppressive therapy (n=1), resulting in 89 patients included in this study (Figure 1). They all had a blood sample collected at screening and a positive anti-SARS-CoV-2 IgG serology.
The median age was 47.1 years, most were male (52.8%) and white (54%). The most commom etiology of chronic kidney disease (CKD) was undetermined (30%), followed by chronic glomerulonephritis (27%), diabetes mellitus (21.3%), autosomal dominant polycystic kidney disease (7.0%), urological diseases (5.6%) and hypertension (4.5%).
Comorbidities such as hypertension and diabetes mellitus were present in 80.9% and 22.5% of patients, respectively. Hemodialysis was the most commom therapy of CKD (83.1%), with median duration of 29.2 months. Of 89 patients, 51 received mycophenolate sodium and 38 received azathioprine as maintenance imunosuppressive regimen. In both groups, the median HLA mismatches in loci A, B and DR was 2, and panel-reactive antibody was 27,5% and 7.9%, respectively. Of all, 2.2% patients received a retransplantation (Table 1).
The median donor age was 50 years, 48% were male and 50% were white. Kidneys from a deceased donor were transplanted in 76% of the patients; 30% expanded criteria donors, with a median KDPI of 55%, final creatinine of 1.41 mg/dl, and cold ischemia time of 22.8 h. In the MPS group, donors were older (54.0 vs. 38.0 years; p<0.001) and filled the expanded criteria in 98.0% vs. 68.4% (p<0.001). The proportion of male donors (60.8% vs. 44.7%; p=0.133) and white donors (54.9% vs. 57.9%; p=0.761) were similar between the groups.
3.2. Vaccination status at screening and boosters received during the study
As this study was conducted during the COVID-19 pandemic and transplant patients were prioritized for boosters, most patients (N=69; 77.5%) had already received at least one booster at inclusion (Table 2 and Table 3). Of these, 63 received three doses, and 6 patients received four doses, with no difference in the distribution between groups. The time elapsed from the last dose of vaccine administered to inclusion in the study was the same for both groups (90 days; p=0.990), with the BNT162b2 vaccine being preferentially administered in both groups (51% and 65.8%) (Table 2 and Table 3). About the other vaccines, 23.6% of patients received ChAdOx1 nCoV-19, 18% received CorononaVac and 1.1% Ad26.COV2.S (Table 2 and Table 3). Among the patients who received the third and fourth doses of vaccine before the inclusion, the BNT162b2 vaccine was the preferred in both groups (67.6% and 82.8%; p=0.273) and (60% and 100%; p=0.741) (Table 3).
This study followed the national immunization policy against COVID-19 during the pandemic, and patients continued to receive boosters during the study follow-up and the vaccines available then. During the 12-month follow-up period, the study patients received 114 additional vaccine doses, 61 in the MPS group and 53 in the AZA group (p=0.195). The distribution of boosters was very similar between the groups (Figure 2).
Most of the boosters were received until M3, with the AZA group receiving the most doses in this period (62.2% vs. 37.8%; p=0.028). At M6, the MPS group received more doses than the AZA group (46.7% vs. 27%; p=0.068). In addition, the vaccine of choice for both groups during the study was BNT162b2 (Table 4). The time between the last dose and the study visit was similar in both groups, except at M3, with 102 vs. 55 days in the MPS and AZA groups, respectively (p=0.007) (Table 4).
3.3. SARS-CoV-2 IgG kinetics.
Anti-SARS-CoV-2 IgG antibody titers were assessed at screening and in months 1, 3, 6, and 12 and compared according to the groups. As summarized in Table 5 and Figure 4, IgG titers in the AZA group were numerically but not statistically superior compared to patients receiving MPS at all study visits (p=0.286). In both groups, IgG titers varied similarly over time.
Figure 4 shows the means and confidence intervals of the anti-SARS-CoV-2 IgG antibody titers by group, by study visit, and the descriptive levels of the linear models with longitudinal random effects. In this model, the effects of three components are evaluated: time, group, and interaction between group and time (Figure 4).
We performed a linear regression by GEE (Generalized Estimated Equations) with pairwise comparison adjusted by Bonferroni to compare the groups over time. A total of 417 measures were evaluated across all the study visits: 234 in the mycophenolate group and 183 in the azathioprine group. Throughout the study period, the mean antibody titers were similar in the mycophenolate group (11,611.2 IU/ml; 95%CI: 8,878.6 - 14,343.7) and the azathioprine group (13,060.1 IU/ml; 95%CI: 10,237.1–15,883.1) (p=0.470; adjusted by Bonferroni) (Figure 3; Table 8).
Considering the entire study population, time affected the mean antibody titers, mainly due to the drop in the mean antibodies in both groups at visit M1. Antibody titers recovered at visit M3, and the means stabilized at visits M6 and M12 (Figure 3; Table 8).
Analyzing the effect of the interaction between time and the type of immunosuppressive regimen, there was no difference between the groups (p=0.286; Table 8).
3.4. Neutralizing antibodies
The neutralizing activity of antibodies between MPS and AZA groups at Screening (0.764 vs. 0.924; p=0.006) and M1 (0.817 vs. 0.957; p=0.004) was significantly different, but it was similar in M3, M6, and M12 (Table 9; Figure 4). In the AZA group, the mean neutralizing activity remained stable over time, but there was a significant increase in the neutralizing activity of patients in the MPS group.
We performed a linear regression by GEE (Generalized Estimated Equations) with a pairwise comparison to compare the groups over time. A total of 404 measures were evaluated over all the study visits: 224 in the mycophenolate group and 180 in the azathioprine group. Considering all the measurements, on average, the neutralizing activity of the antibodies was higher in the AZA group at 0.082 (CI95% 0.021 to 0.143; p=0.008, adjusted by Bonferroni).
Considering the entire study period, there was an increase in antibody-neutralizing activity, with an average gain of 0.175 (CI 95% 0.089 to 0.260; p=0.001, adjusted by Bonferroni) between the screening visit and M12.
There was also a group and time effect with a reduction of -0.137 (95% CI -0.241 to -0.033; p=0.017, adjusted by Bonferroni) reduction in the difference in neutralizing antibody activity at 12 months in the AZA group compared to the MPS group, primarily due to increased neutralizing activity in the AZA group (Table 10).
Neutralizing antibodies were high in both groups and at all study visits (Figure 8). At screening, positive neutralizing activity was higher in the AZA group (83.3% vs. 97.3%; p=0.038). However, during the follow-up and boosters received by both groups, this difference was attenuated: M1 (88.9% vs 97.2%; p=0.155), M3 (88.6% vs. 97.3%; p=0.138), M6 (97.7% vs. 100%; p=0.351), and M12 (97.7% vs. 100%; p=0.383) (Figure 5).
4. Discussion
This prospective observational study provides an in-depth analysis of the kinetics of anti-SARS-CoV-2 antibody titers and neutralizing activity in KTRs undergoing maintenance immunosuppression with mycophenolate sodium (MPS) or azathioprine (AZA) after receiving the primary immunization with the ChAdOx1 nCoV-19 vaccine. Our results demonstrated that both MPS and AZA groups exhibited an initial decline in IgG titers at Month 1, followed by stabilization through Month 12. Although IgG titers were numerically higher in the AZA group at all time points, the differences were not statistically significant. Conversely, neutralizing antibody activity was initially higher in the AZA group but converged between the groups by Month 3, remaining comparable thereafter.
The primary response to vaccination and humoral kinetics in KTRs are deficient compared to the general population or dialysis patients and are attributed to the chronic use of immunosuppressive drugs [11,12]. The gold standard immunosuppression regimen in kidney transplantation consists of tacrolimus, mycophenolate, and steroids, with few centers having experience in using AZA instead of MPS in patients at low immunological risk, despite similar efficacy and safety in this population [13,14]. During the pandemic, several studies indicated MPS as a predictor of mortality and as a predictor of lower vaccine response, but not AZA [15,16]. This study was based on the hypothesis that in patients vaccinated against SARS-CoV-2 and seroconverted, the kinetics of humoral immune response could be different after kidney transplantation according to the immunosuppressive regimen used (MPS vs. AZA).
The decay of antibody titers is a natural process in all individuals and has also been demonstrated for the COVID-19 vaccine. For instance, Sanders et al. compared the decay of anti-SARS-CoV-2 IgG antibody titers between healthy individuals and patients on a spectrum of chronic kidney disease – including KTRs – who received two doses of an mRNA vaccine [17]. After the vaccination schedule completion, the antibody titers significantly decayed over time in all groups, but KTRs had notably lower antibodies during the 6-month follow-up, suggesting that immunosuppression may play a role in reducing the period of protection offered by the vaccine [17]. Another study comparing patients on dialysis and KTRs demonstrated that KTRs had lower SARS-CoV-2 IgG titers and neutralizing antibodies over 12-month follow-up, even though KTRs received more boosters during the follow-up [12]. These results raise the importance of further doses as a primary source of protection for this especially vulnerable population.
In KTRs, the effectiveness and antibody titers induced by ChAdOx1 were comparable to mRNA vaccines [5]. For instance, Callaghan et al. demonstrated that two doses of the ChAdOx1 vaccine in KTRs reduced mortality by 20% compared to those unvaccinated, although the disease incidence was similar [6]. In Brazil, four vaccines were approved for use during the pandemic: ChAdOx1, BNT162b2, Ad26.COV2.S, and CoronaVac. Because KTRs were at high risk of poor outcomes after COVID-19, they were prioritized early for vaccination, and the majority had already received three or four doses at the time of inclusion. Once our observational study did not modify the healthcare authority recommendations during the pandemic, all individuals received at least one further dose during the study, with the vaccine available at that time, with some accumulating up to six doses.
Ajlan et al. reported that MMF use or triple immunosuppression was associated with a poor humoral response in KTRs vaccinated compared to other regimens containing AZA or mTOR inhibitors [5]. However, the influence of different maintenance immunosuppressive drugs on the kinetics of humoral immunity against SARS-CoV-2 in previously vaccinated and seroconverted patients undergoing kidney transplantation has not yet been elucidated. While azathioprine’s mechanism as a purine synthesis inhibitor might offer a more favorable environment for vaccine response than mycophenolate, further studies are needed to clarify the underlying immunological pathways.
The observed kinetics of antibody titers and neutralizing activity have several implications for clinical practice. First, the initial lag in immune response among KTRs highlights the critical need for timely booster doses to sustain immunity, particularly to emerging SARS-CoV-2 variants. Second, the lack of significant differences in long-term antibody kinetics between the MPS and AZA groups suggests that vaccine efficacy may be driven primarily by external factors, such as booster doses and the timing of vaccination relative to transplantation. In our study, the type of vaccine received as a booster was similar between groups, as was the time between the last dose and the study visit. This underscores the importance of robust public health strategies to prioritize vaccine access for vulnerable patients, particularly during outbreaks or epidemics. Third, our findings raise questions about immunosuppression manipulation during pandemic scenarios. Given the nonsignificant advantage in humoral observed between the drugs, clinicians may focus on patient-specific prevention strategies instead of reducing or discontinuing antimetabolites to enhance vaccine responsiveness without improving the risk of acute rejection or graft loss [18]. However, such decisions must be made cautiously and supported by further evidence. An ongoing prospective open-label trial is evaluating the impact of immunosuppression adjustment on COVID-19 Vaccination Response in KTRs (ADIVKT; NCT05060991).
Some limitations should be acknowledged. This was a single-center study, which may limit the generalizability of our findings to broader KTR populations with different demographic and clinical characteristics. Additionally, while our study focused on humoral immunity, cell-mediated immune responses critical for long-term protection against SARS-CoV-2 were not assessed. Since this study was performed during the COVID-19 pandemic, we could not direct that KTRs stop receiving additional vaccine doses. Finally, the observational design precludes definitive conclusions about causality between immunosuppressive regimens and vaccine response.
5. Conclusions
This study sheds light on the antibody kinetics and neutralizing activity in KTRs receiving different immunosuppressive regimens after ChAdOx1 primary vaccination. While azathioprine appears to confer a transient advantage in early humoral responses, the overall vaccine-induced immunity in both groups benefited substantially from booster doses. These findings underscore the importance of continued vaccine prioritization and tailored strategies to protect this high-risk population during the COVID-19 pandemic.
Author Contributions
J.S.R.: Participated in research design, in the performance of the research, in data analysis, and the writing of the paper. R.M.S.: Participated in the performance of the research, in data analysis, and reviewed the manuscript. H.T.S.J.: Participated in the research design and reviewed the manuscript. L.R.-M.: Participated in the research design, in the performance of the research, in data analysis, and reviewed the manuscript. J.M.P.: Participated in the research design, and reviewed the manuscript. R.D.F.: Participated in research design, in the performance of the research, in data analysis, and the writing of the paper.
Funding
This study was financed by the São Paulo Research Foundation (FAPESP), Brasil. Process Number #2021/13680-6.
Institutional Review Board Statement
The study was conducted in compliance with Good Clinical Practice guidelines and the Declaration of Helsinki and was approved by the Ethics Committee of the Universidade Federal de São Paulo (Protocol code 5.156.043, approved on 9 December 2021).
Informed Consent Statement
All study participants provided informed consent.
Data Availability Statement
Data available on request.
Conflicts of Interest
The authors report no conflicts of interest. The sponsors were not involved in the design, execution, interpretation, or writing of the study.
References
- Abu Jawdeh BG, Vikram HR. Coronavirus Disease 2019 in Kidney Transplantation - A 2024 Update. Adv Kidney Dis Health. 2024, 31, 458–465. [Google Scholar] [CrossRef] [PubMed]
- Dęborska-Materkowska D, Kamińska D. The Immunology of SARS-CoV-2 Infection and Vaccines in Solid Organ Transplant Recipients. Viruses. 2021, 13, 1879. [Google Scholar] [CrossRef] [PubMed]
- Falsey AR, Sobieszczyk ME, Hirsch I, Sproule S, Robb ML, Corey L, et al. Phase 3 Safety and Efficacy of AZD1222 (ChAdOx1 nCoV-19) Covid-19 Vaccine. N Engl J Med. 2021, 385, 2348–2360. [Google Scholar] [CrossRef] [PubMed]
- Voysey M, Clemens SAC, Madhi SA, Weckx LY, Folegatti PM, Aley PK, et al. Safety and efficacy of the ChAdOx1 nCoV-19 vaccine (AZD1222) against SARS-CoV-2: an interim analysis of four randomised controlled trials in Brazil, South Africa, and the UK. Lancet. 2021, 397, 99–111. [Google Scholar] [CrossRef] [PubMed]
- Ajlan AA, Ali T, Aleid H, Almeshari K, DeVol E, Alkaff MA, et al. Comparison of the safety and immunogenicity of the BNT-162b2 vaccine and the ChAdOx1 vaccine for solid organ transplant recipients: a prospective study. BMC Infect Dis. 2022, 22, 786. [Google Scholar]
- Callaghan CJ, Mumford L, Curtis RMK, Williams SV, Whitaker H, Andrews N, et al. Real-world Effectiveness of the Pfizer-BioNTech BNT162b2 and Oxford-AstraZeneca ChAdOx1-S Vaccines Against SARS-CoV-2 in Solid Organ and Islet Transplant Recipients. Transplantation. 2022, 106, 436–446. [Google Scholar] [CrossRef] [PubMed]
- Abbott. AdviseDx SARS-CoV-2 IgG II Instructions for Use. 2021. Available online: https://www.fda.gov/media/146371/download (accessed on 10 December 2021).
- Tan CW, Chia WN, Qin X, Liu P, Chen MI, Tiu C, et al. A SARS-CoV-2 surrogate virus neutralization test based on antibody-mediated blockage of ACE2-spike protein-protein interaction. Nat Biotechnol. 2020, 38, 1073–1078. [Google Scholar] [CrossRef] [PubMed]
- Cerqueira-Silva T, Andrews JR, Boaventura VS, Ranzani OT, de Araújo Oliveira V, Paixão ES, et al. Effectiveness of CoronaVac, ChAdOx1 nCoV-19, BNT162b2, and Ad26.COV2.S among individuals with previous SARS-CoV-2 infection in Brazil: a test-negative, case-control study. Lancet Infect Dis. ;22.
- Ballinger, G. A. Using Generalized Estimating Equations for Longitudinal Data Analysis. Organizational Research Methods 2004, 7, 127–150. [Google Scholar] [CrossRef]
- Zong K, Peng D, Yang H, Huang Z, Luo Y, Wang Y, et al. Risk Factors for Weak Antibody Response of SARS-CoV-2 Vaccine in Adult Solid Organ Transplant Recipients: A Systemic Review and Meta-Analysis. Front Immunol. 2022, 13, 888385. [Google Scholar] [CrossRef] [PubMed]
- Foresto RD, Souza RM, Dos Anjos GR, Nakamura MR, Goulart HS, Sampaio R, et al. The Influence of Initial Immunosuppression on the Kinetics of Humoral Response after SARS-CoV-2 Vaccination in Patients Undergoing Kidney Transplantation. Vaccines (Basel). 2024, 12, 1135. [Google Scholar] [CrossRef] [PubMed]
- Ekberg H, Tedesco-Silva H, Demirbas A, Vítko S, Nashan B, Gürkan A, Margreiter R, Hugo C, Grinyó JM, Frei U, Vanrenterghem Y, Daloze P, Halloran PF; ELITE-Symphony Study. Reduced exposure to calcineurin inhibitors in renal transplantation. N Engl J Med. 2007, 357, 2562–75. [Google Scholar] [CrossRef] [PubMed]
- Cristelli MP, Tedesco-Silva H, Medina-Pestana JO, Franco MF. Safety profile comparing azathioprine and mycophenolate in kidney transplant recipients receiving tacrolimus and corticosteroids. Transpl Infect Dis. 2013, 15, 369–78. [Google Scholar] [CrossRef] [PubMed]
- Requião-Moura LR, Modelli de Andrade LG, de Sandes-Freitas TV, Cristelli MP, Viana LA, Nakamura MR, Garcia VD, Manfro RC, Simão DR, Almeida RAMB, Ferreira GF, Costa KMAH, de Lima PR, Pacheco-Silva A, Charpiot IMMF, Deboni LM, Ferreira TCA, Mazzali M, Calazans CAC, Oriá RB, Tedesco-Silva H, Medina-Pestana J; COVID-19-KT Brazil Study Group*. The Mycophenolate-based Immunosuppressive Regimen Is Associated With Increased Mortality in Kidney Transplant Patients With COVID-19. Transplantation. 2022, 106, e441–e451. [Google Scholar] [CrossRef] [PubMed]
- Kantauskaite M, Müller L, Kolb T, Fischer S, Hillebrandt J, Ivens K, Andree M, Luedde T, Orth HM, Adams O, Schaal H, Schmidt C, Königshausen E, Rump LC, Timm J, Stegbauer J. Intensity of mycophenolate mofetil treatment is associated with an impaired immune response to SARS-CoV-2 vaccination in kidney transplant recipients. Am J Transplant. 2022, 22, 634–639. [Google Scholar] [CrossRef] [PubMed]
- Sanders JF, Messchendorp AL, de Vries RD, Baan CC, van Baarle D, van Binnendijk R, Diavatopoulos DA, Geers D, Schmitz KS, GeurtsvanKessel CH, den Hartog G, Kho MML, Koopmans MPG, van der Molen RG, Remmerswaal EBM, Rots N, Gansevoort RT, Bemelman FJ, Hilbrands LB, Reinders MEJ; VACcination Immune Response Study (RECOVAC) Collaborators. Antibody and T-Cell Responses 6 Months After Coronavirus Disease 2019 Messenger RNA-1273 Vaccination in Patients With Chronic Kidney Disease, on Dialysis, or Living With a Kidney Transplant. Clin Infect Dis. 2023, 76, e188–e199. [Google Scholar] [CrossRef] [PubMed]
- Yu B, Tamargo C, Brennan DC, Kant S. Measures to Increase Immunogenicity of SARS-CoV-2 Vaccines in Solid Organ Transplant Recipients: A Narrative Review. Vaccines (Basel). 2023, 11, 1755. [Google Scholar] [CrossRef] [PubMed]
Figure 1.
Flowchart of the study population.
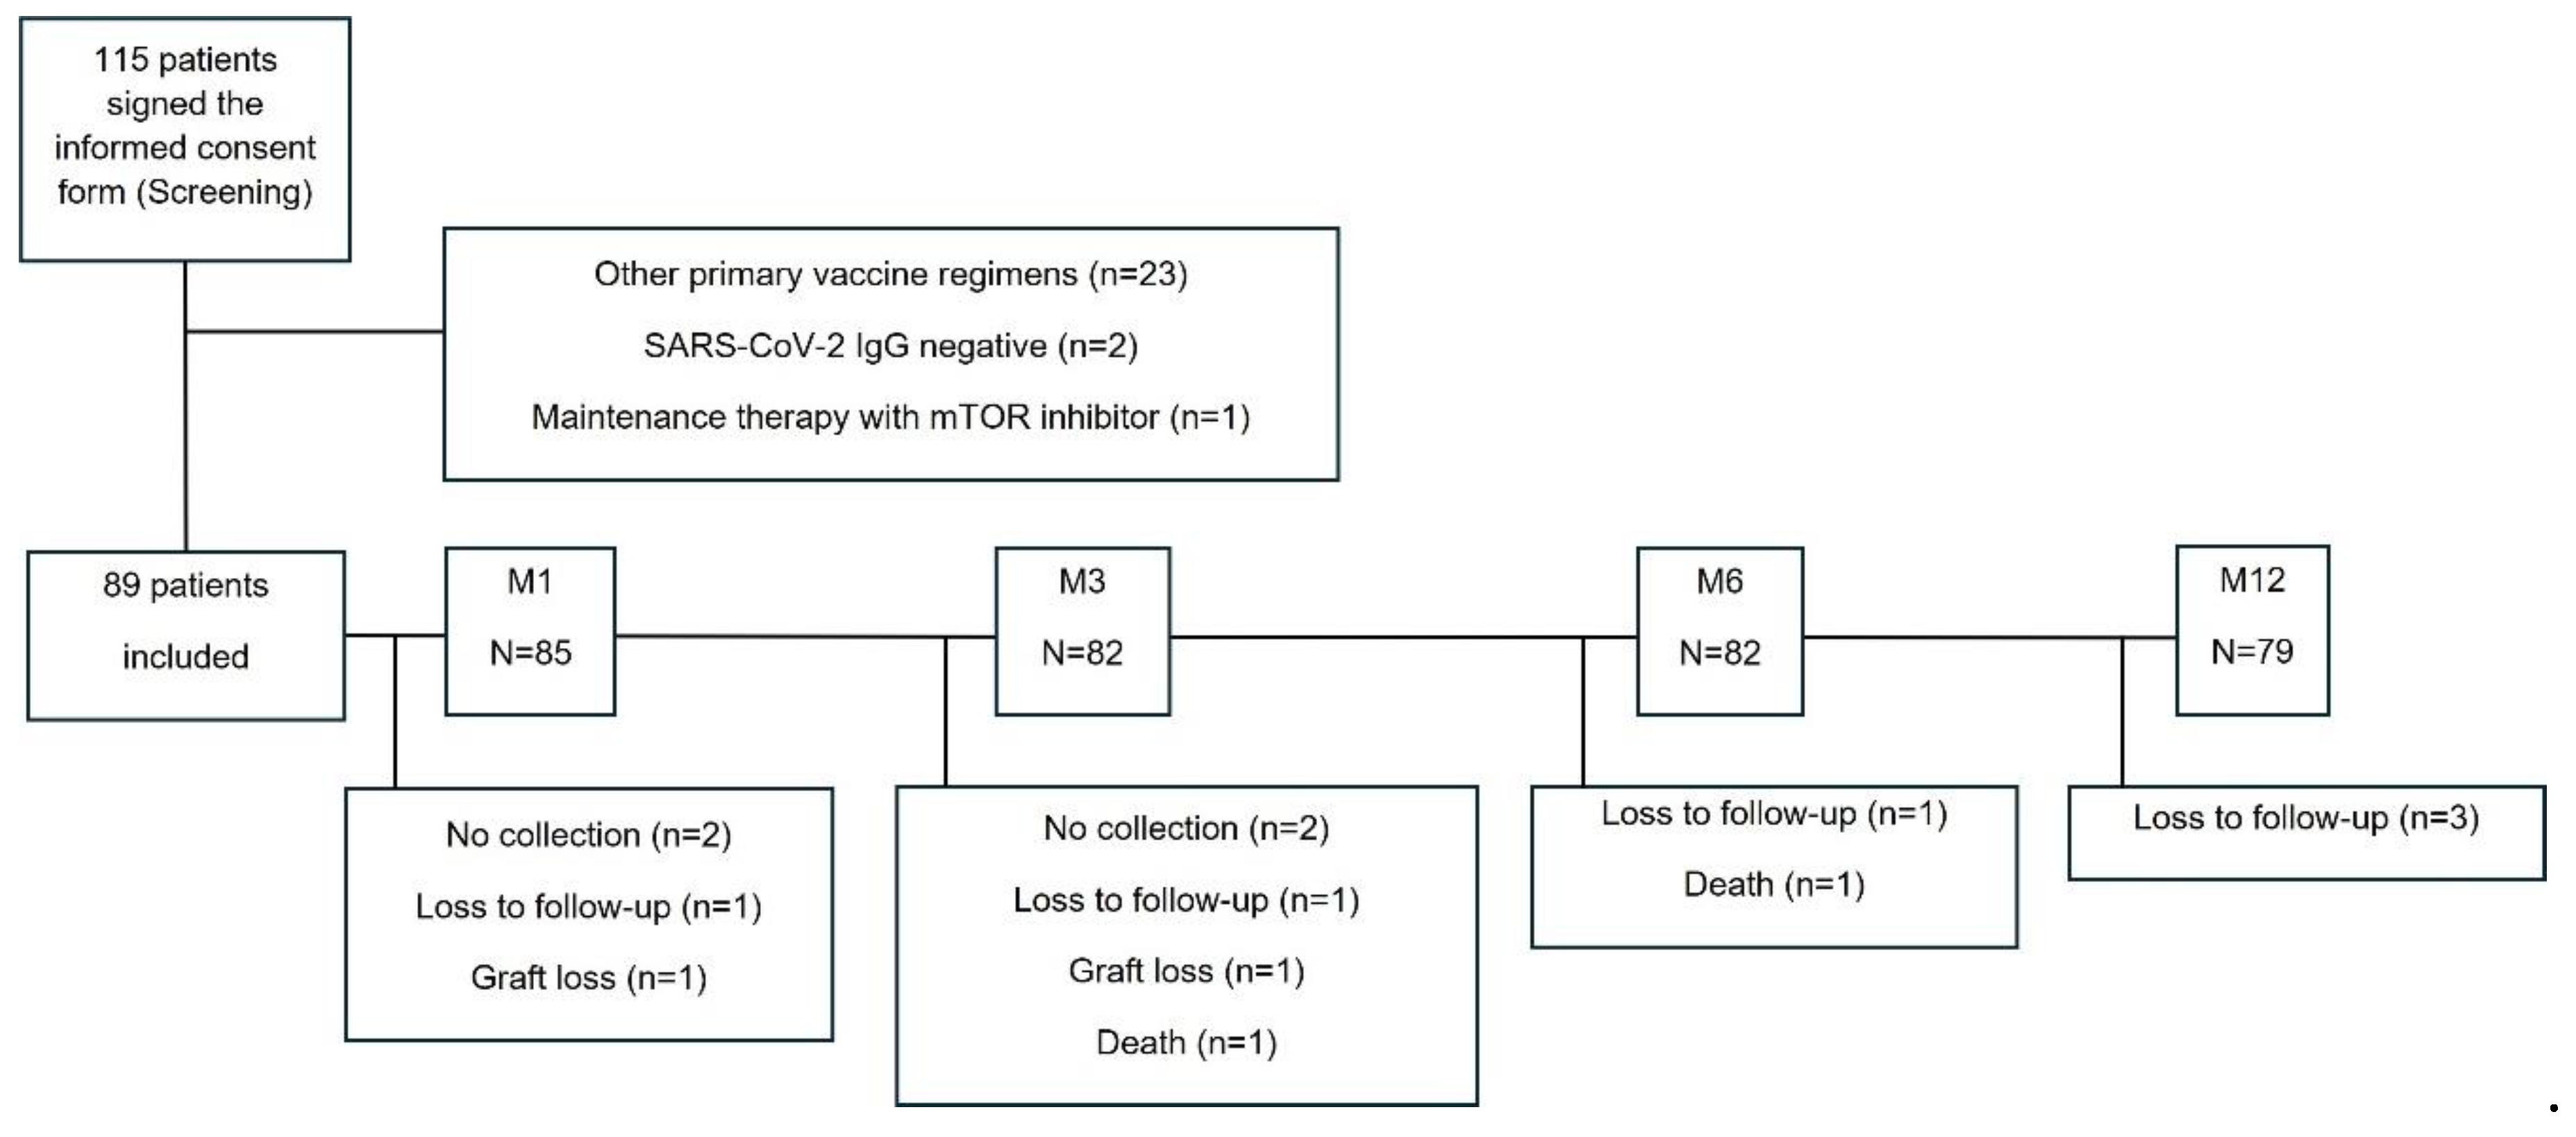
Figure 2.
Time of booster and number of accumulated doses in both groups after inclusion. Each point represents the accumulated number of additional vaccine doses in patients receiving mycophenolate (blue) or azathioprine (orange).
Figure 2.
Time of booster and number of accumulated doses in both groups after inclusion. Each point represents the accumulated number of additional vaccine doses in patients receiving mycophenolate (blue) or azathioprine (orange).
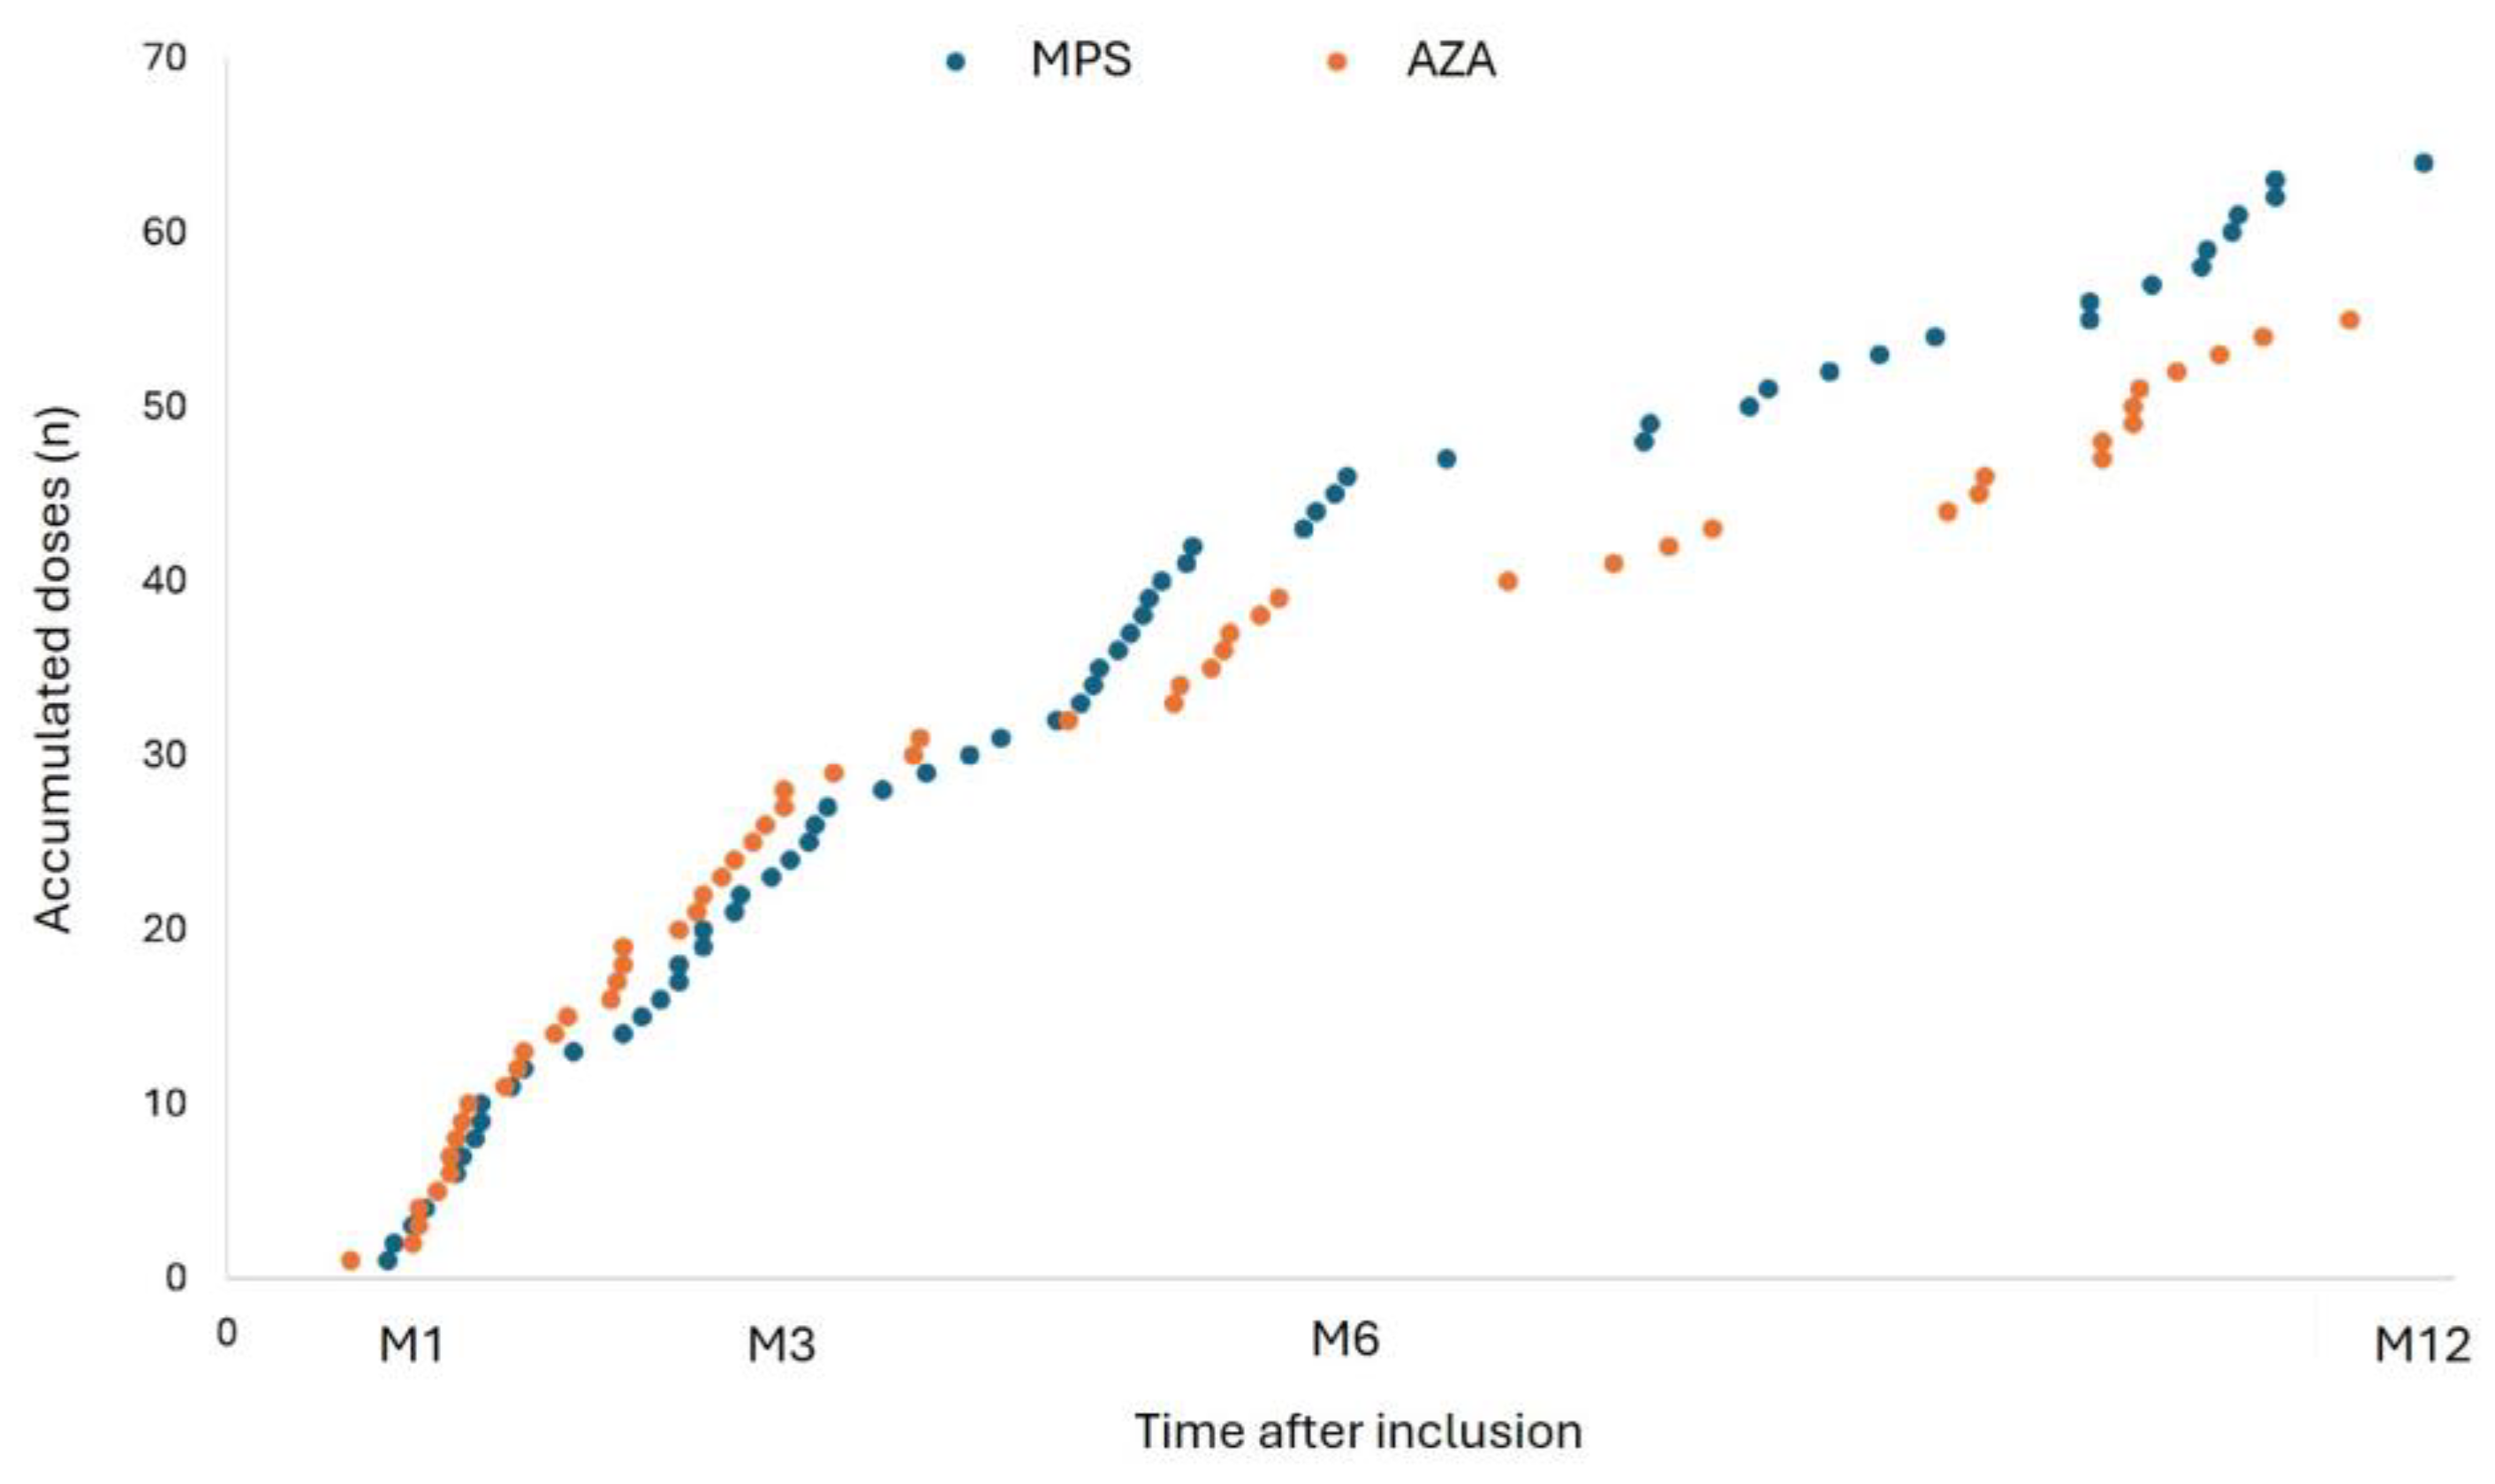
Figure 3.
Evolution of anti-SARS-CoV-2 IgG antibody titers. Means and 95% CI for anti-SARS-CoV-2 IgG antibody titers by group and study visit. Test used: AdviseDx SARS-CoV-2 IgG II test, Abbott Laboratories; lower limit of positivity 50 AU/mL.
Figure 3.
Evolution of anti-SARS-CoV-2 IgG antibody titers. Means and 95% CI for anti-SARS-CoV-2 IgG antibody titers by group and study visit. Test used: AdviseDx SARS-CoV-2 IgG II test, Abbott Laboratories; lower limit of positivity 50 AU/mL.
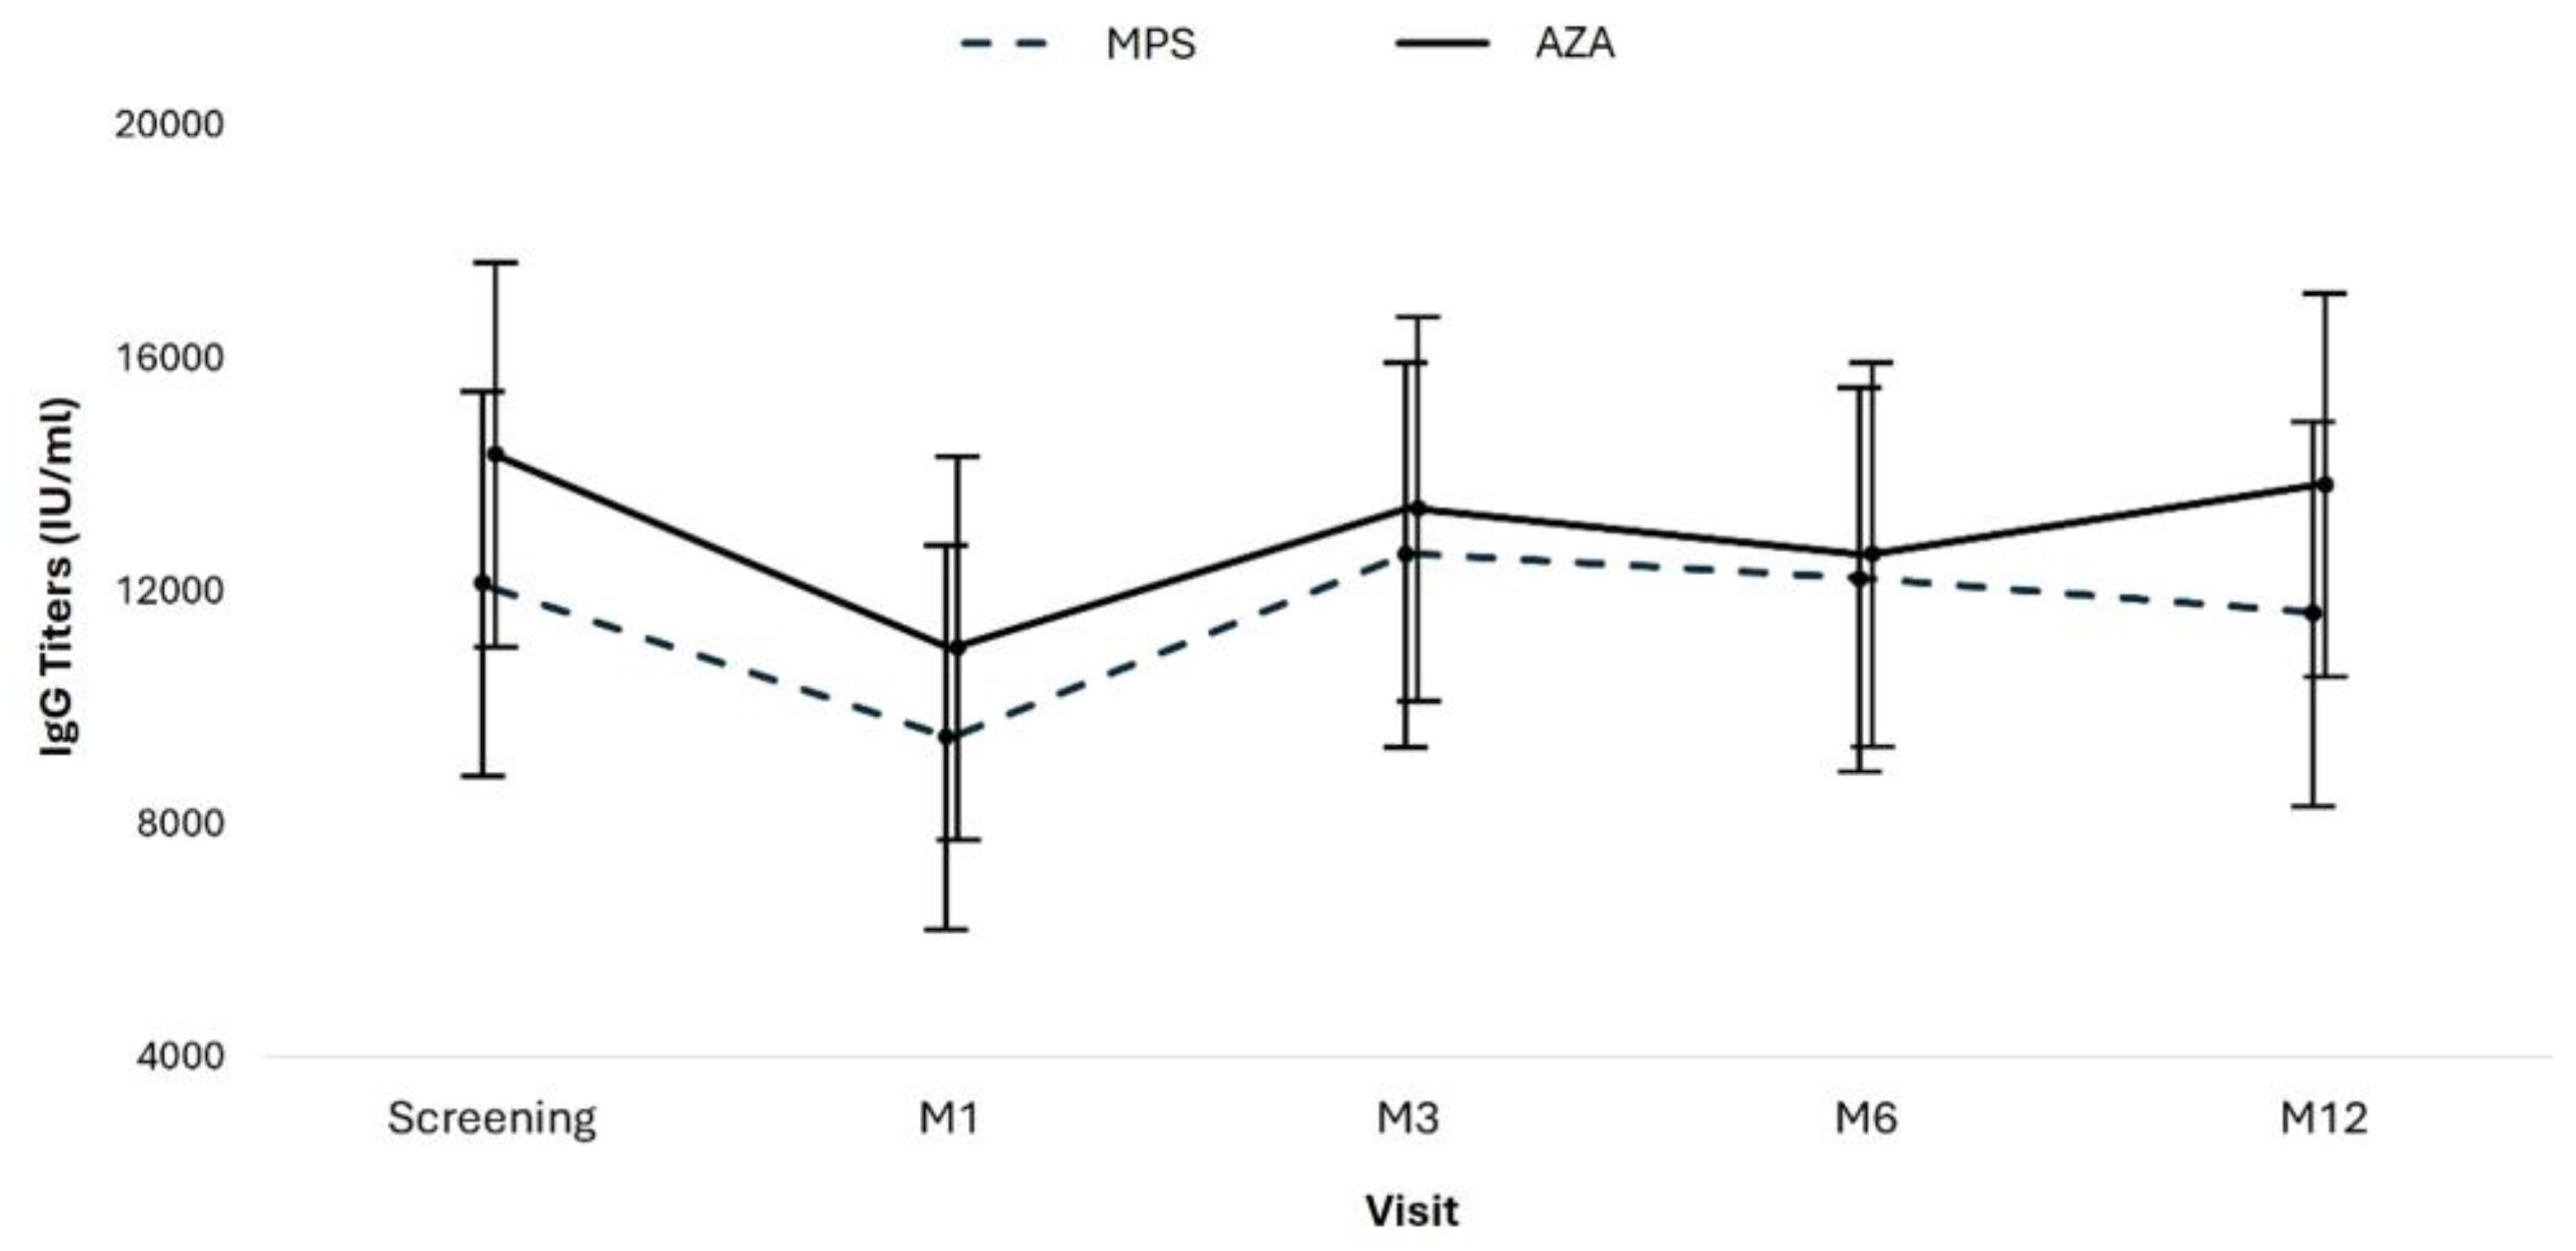
Figure 4.
Evolution of neutralizing antibodies. Means and 95% CI for anti-SARS-CoV-2 IgG neutralizing antibodies by group and study visit. Test used: AdviseDx SARS-CoV-2 IgG II test, Abbott Laboratories; lower limit of positivity 50 AU/mL.
Figure 4.
Evolution of neutralizing antibodies. Means and 95% CI for anti-SARS-CoV-2 IgG neutralizing antibodies by group and study visit. Test used: AdviseDx SARS-CoV-2 IgG II test, Abbott Laboratories; lower limit of positivity 50 AU/mL.
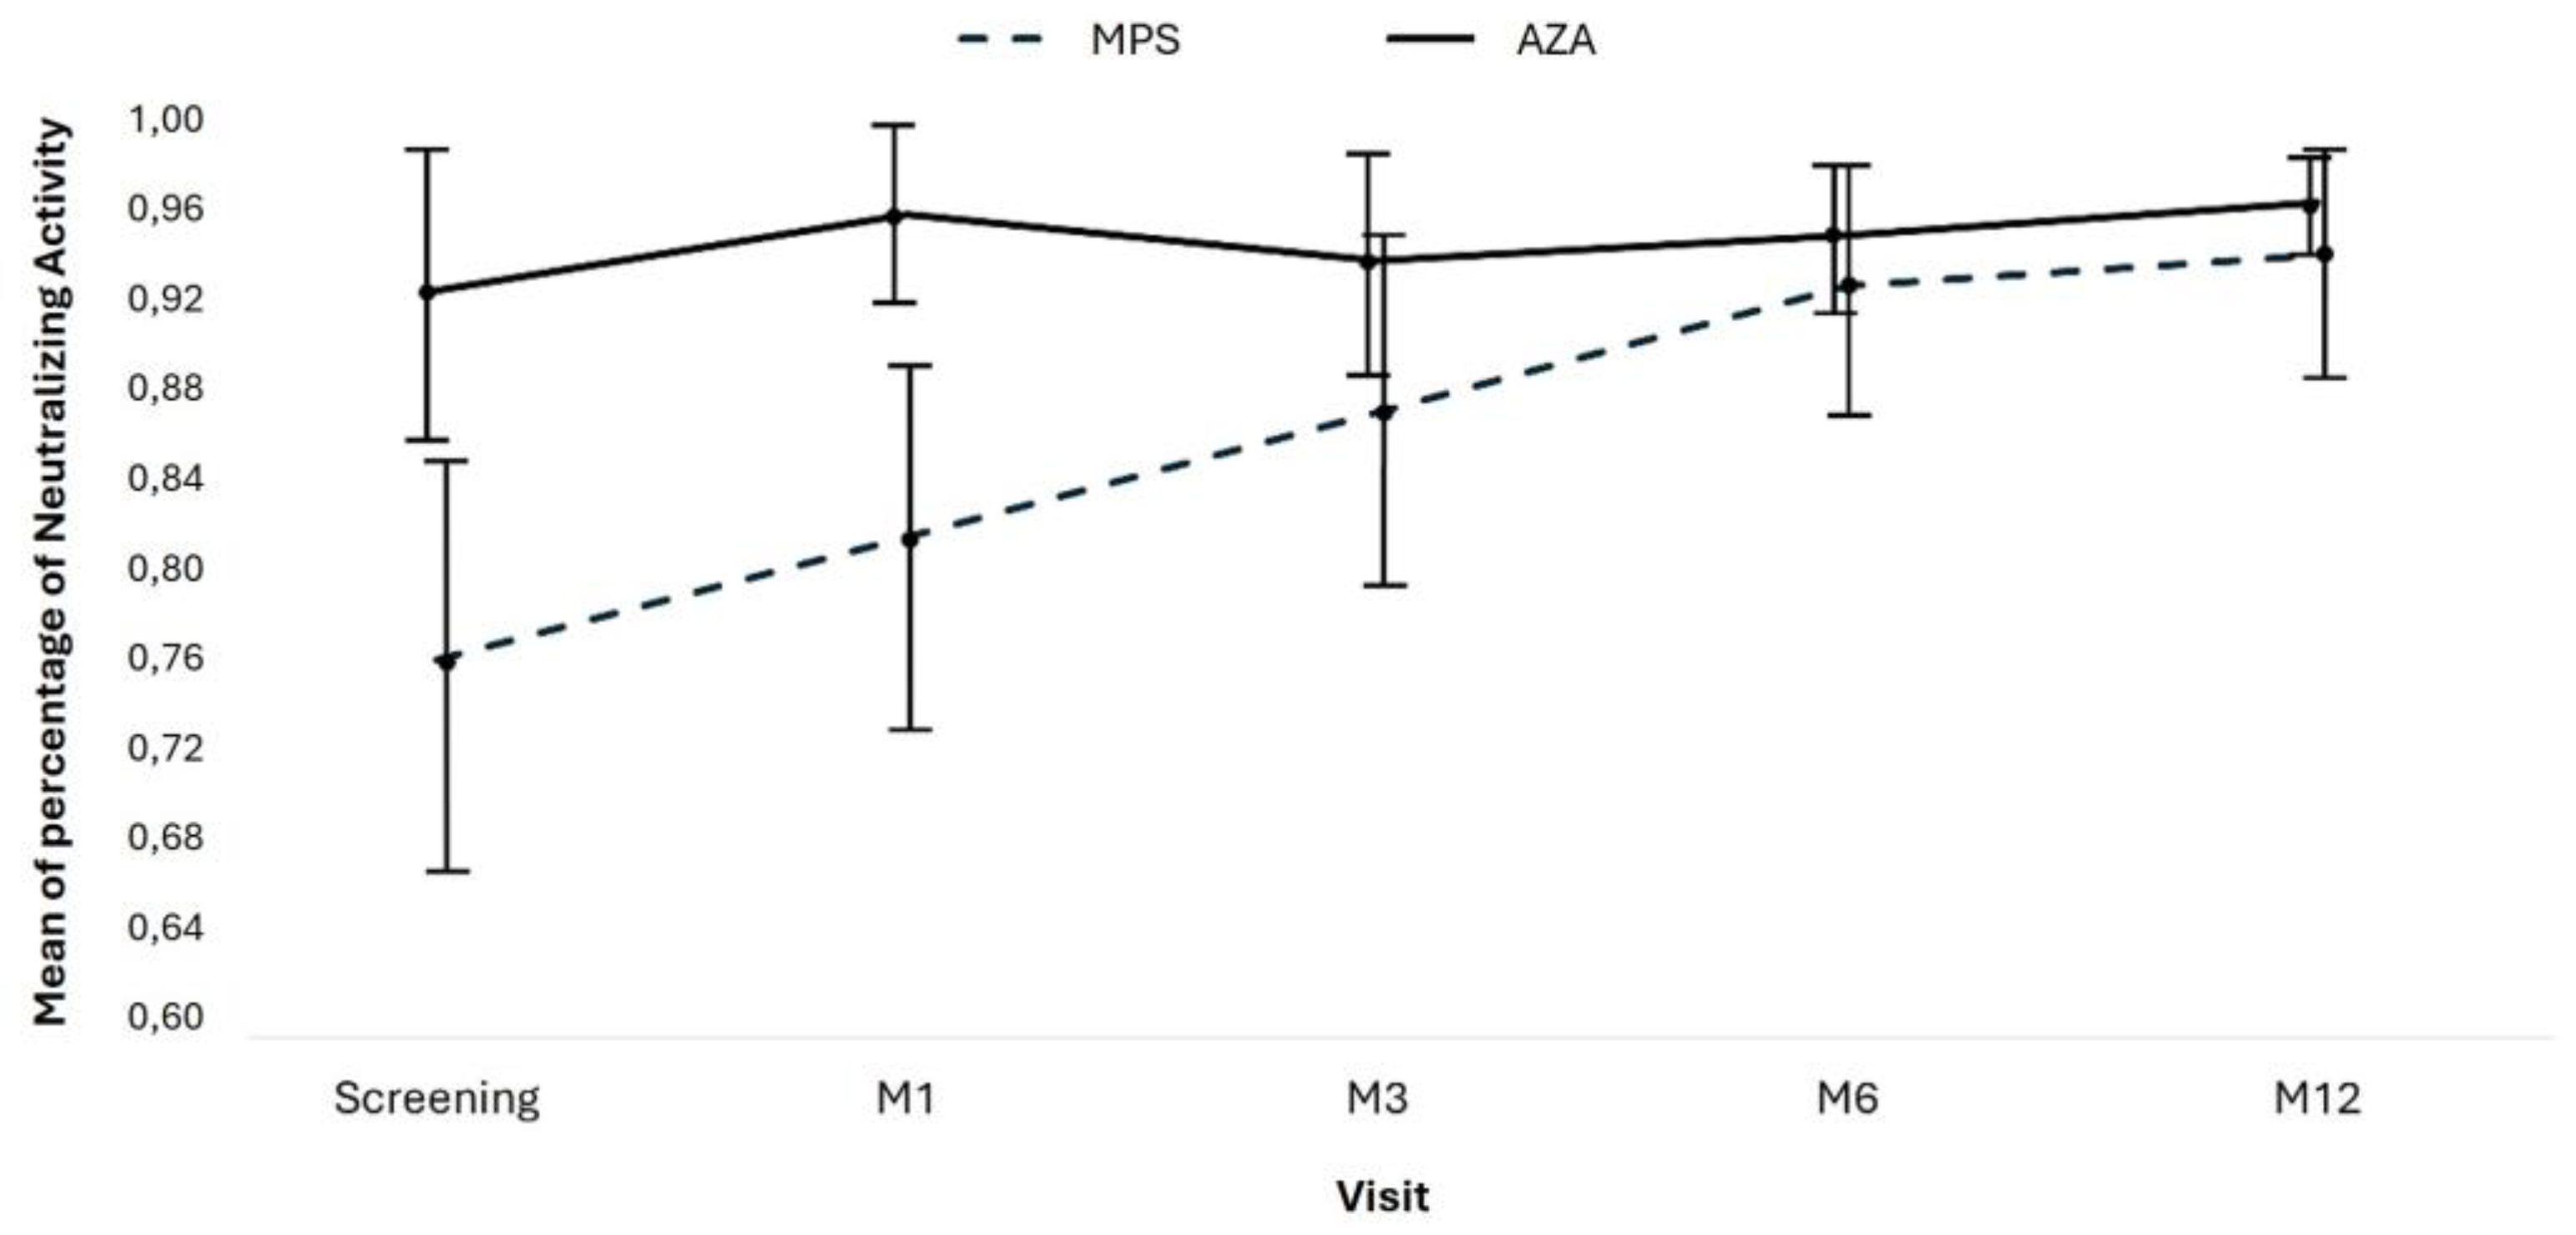
Figure 5.
Distribution of neutralizing antibody responses by group and study visit. Incidence of positive and non-positive neutralizing antibodies between groups. M: month. Test used: cPass™ SARS-CoV-2 test, GenScript Laboratory; positivity threshold 30%.
Figure 5.
Distribution of neutralizing antibody responses by group and study visit. Incidence of positive and non-positive neutralizing antibodies between groups. M: month. Test used: cPass™ SARS-CoV-2 test, GenScript Laboratory; positivity threshold 30%.
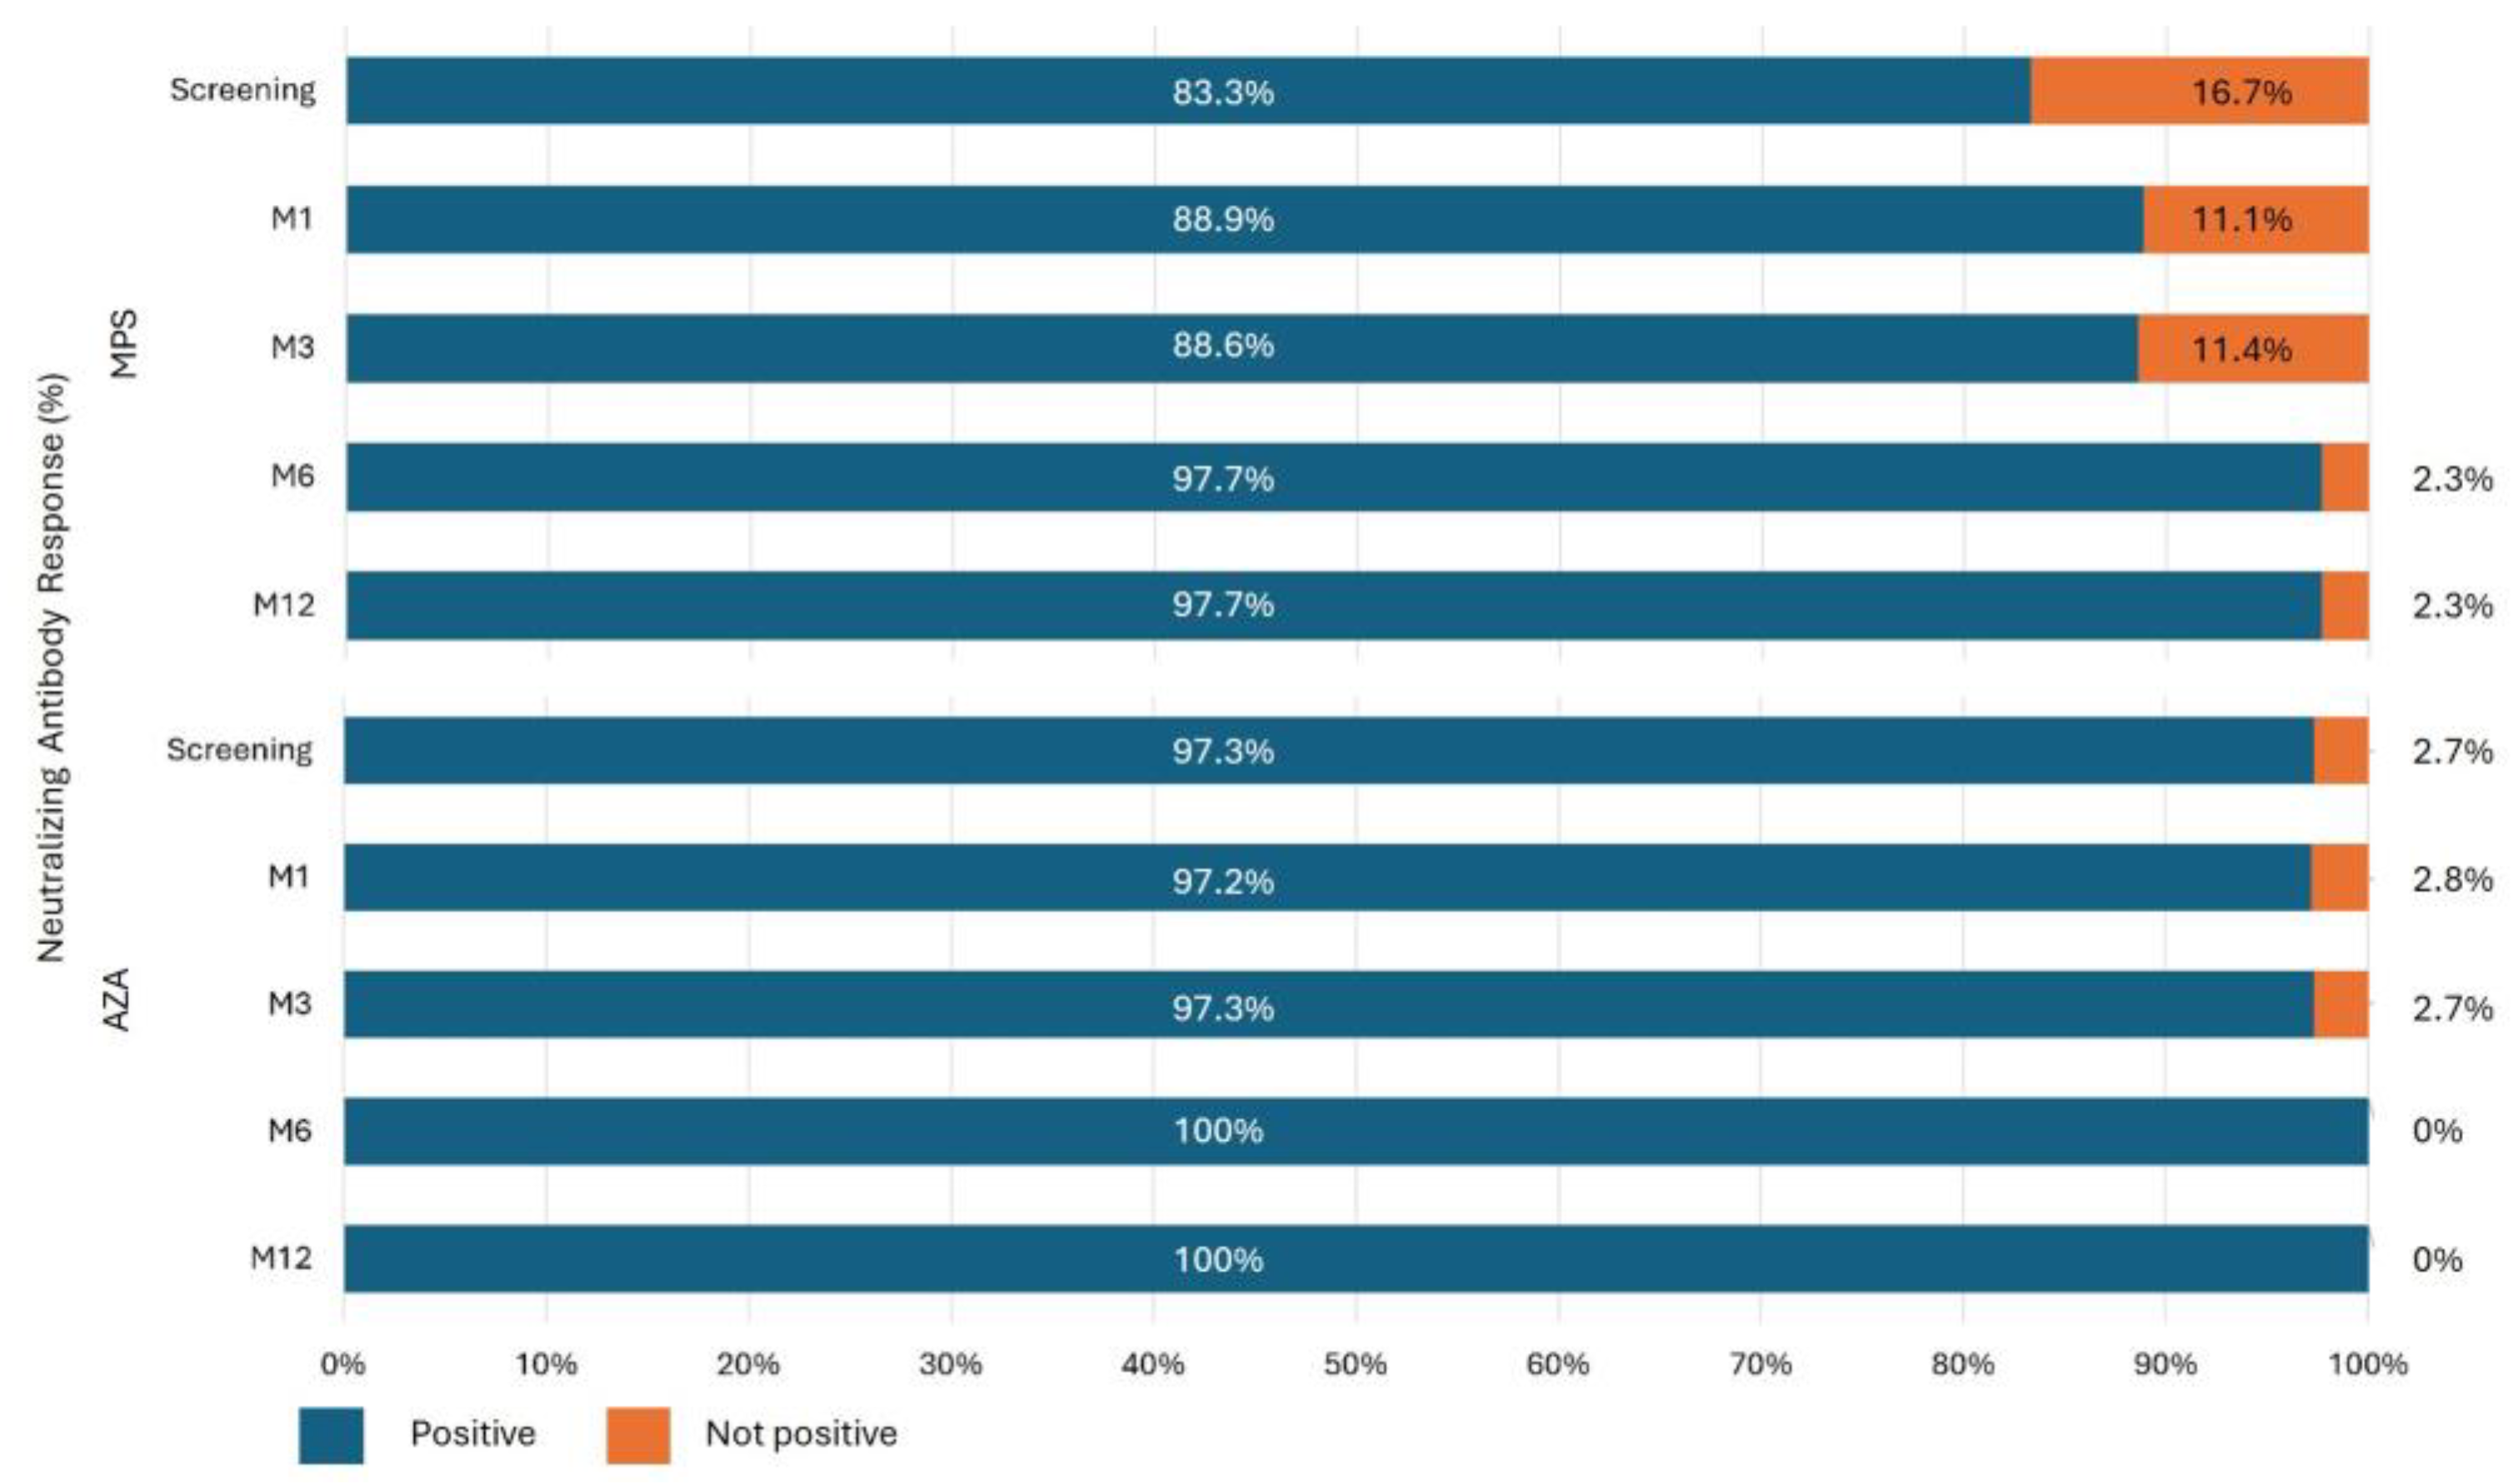

Table 1.
Demographic characteristics of the study population.
| Total N=89 |
Mycophenolate N=51 |
Azathioprine N=38 |
p | |
|---|---|---|---|---|
| KTRs | ||||
| Age, years (IQR) | 47.1 (35.8-58.8) | 50.4 (35.9-58.9) | 44.3 (35.7-57.0) | 0.545 |
| Male, N (%) | 47 (52.8) | 21 (41.2) | 26 (68.4) | 0.011 |
| Ethinicity, N (%) | 0.053 | |||
| White | 54 (60.7) | 28 (54.9) | 26 (68.4) | |
| Mixed | 28 (31.5) | 16 (31.4) | 12 (31.6) | |
| Black | 7 (7.9) | 7 (13.7) | 0 (0.0) | |
| Hypertension, N (%) | 72 (80.9) | 38 (74.5) | 34 (89.5) | 0.076 |
| Diabetes mellitus, N (%) | 20 (22.5) | 13 (25.5) | 7 (18.4) | 0.429 |
| Cause of CKD, N (%) | 0.307 | |||
| Undetermined | 30 (33.7) | 12 (23.5) | 18 (47.4) | |
| Glomerulonephrites | 24 (27.0) | 15 (29.4) | 9 (23.7) | |
| Diabetes Mellitus | 19 (21.3) | 13 (25.5) | 6 (15.8) | |
| Polycystic Kidney Disease | 7 (7.9) | 5 (9.8) | 2 (5.3) | |
| Urological | 5 (5.6) | 3 (5.9) | 2 (5.3) | |
| Hypertension | 4 (4.5) | 3 (5.9) | 1 (2.6) | |
| Time on dialysis, months (IQR) | 29.2 (16.2-54.4) | 33.3 (23.3-61.6) | 21.0 (11.8-43.8) | 0.006 |
| Type of dialysis, N (%) | 0.068 | |||
| Hemodialysis | 74 (83.1) | 46 (90.2) | 28 (73.7) | |
| Peritoneal dialysis | 9 (10.1) | 4 (7.8) | 5 (13.2) | |
| Preemptive | 6 (6.7) | 1 (2.0) | 5 (13.2) | |
| HLA ABDR Mismatch, N (IQR) | 2 (1-3) | 2 (1-3) | 2 (0-3) | 0.100 |
| PRA >0%, N (%) | 17 (19.1) | 14 (27.5) | 3 (7.9) | 0.020 |
| Retransplantation, N (%) | 2 (2.2) | 1 (2.0) | 1 (2.6) | 0.833 |
KTR: kidney transplant recipient; N: number; IQR: interquartile range; CKD: chronic kidney disease; HLA: human leukocyte antigen; PRA: panel-reactive antibody.
Table 2.
Vaccination status of the study population at screening.
| Total N=89 |
Mycophenolate N=51 |
Azathioprine N=38 |
p | |
|---|---|---|---|---|
| Doses received, N (%) | 0.367 | |||
| 2 | 20 (22.5) | 12 (23.5) | 8 (21.1) | |
| 3 | 63 (70.8) | 34 (66.7) | 29 (76.3) | |
| 4 | 6 (6.7) | 5 (9.8) | 1 (2.6) | |
| Last dose of vaccine, N (%) | 0.305 | |||
| BNT162b2 | 51 (57.3) | 26 (51.0) | 25 (65.8) | |
| ChAdOx1 nCoV-19 | 21 (23.6) | 12 (23.5) | 9 (23.7) | |
| CoronaVac | 16 (18.0) | 12 (23.5) | 4 (10.5) | |
| Ad26.COV2.S | 1 (1.1) | 1 (2.0) | 0 (0.0) | |
| Time since last dose, days (IQR) | 90 (56-133) | 90 (56-126) | 90 (54.7-133) | 0.990 |
N: number; IQR: interquartile range.
Table 3.
Type of vaccine received by patients at screening.
| 3 doses received, N (%) | Total N=63 |
Mycophenolate N=34 |
Azathioprine N=29 |
p |
|---|---|---|---|---|
| 3rd dose | 0.141 | |||
| BNT162b2 | 47 (74.6) | 23 (67.6) | 24 (82.8) | |
| CoronaVac | 15 (23.8) | 11 (32.4) | 4 (13.8) | |
| ChAdOx1 nCoV-19 | 1 (1.6) | 0 (0.0) | 1 (3.4) | |
| 4 doses received, N (%) |
Total N=6 |
Mycophenolate N=5 |
Azathioprine N=1 |
p |
| 3rd dose | 0.273 | |||
| BNT162b2 | 3 (50.0) | 3 (60.0) | 0 (0.0) | |
| CoronaVac | 3 (50.0) | 2 (40.0) | 1 (100.0) | |
| 4th dose | 0.741 | |||
| BNT162b2 | 4 (66.7) | 3 (60.0) | 1 (100.0) | |
| CoronaVac | 1 (16.7) | 1 (20.0) | 0 (0.0) | |
| ChAdOx1 nCoV-19 | 1 (16.7) | 1 (20.0) | 0 (0.0) |
N: number.
Table 4.
Boosters received, type of vaccine and time since last dose.
| M1 | M3 | |||||
|---|---|---|---|---|---|---|
| MPS N=49 | AZA N=36 | p | MPS N=45 | AZA N=37 | p | |
| Booster, N (%) | 3 (6.1) | 4 (11.1) | 0.408 | 17 (37.8) | 23 (62.2) | 0.028 |
| Vaccine, N (%) | 0.268 | 0.015 | ||||
| BNT162b2 | 3 (100) | 1 (25) | 10 (58.8) | 13 (56.5) | ||
| ChAdOx1 CoV-19 | 0 (0) | 1 (25) | 4 (23.5) | 0 (0) | ||
| Ad26.COV2.S | 0 (0) | 1 (25) | 1 (5.9) | 9 (39.1) | ||
| CoronaVac | 0 (0) | 1 (25) | 2 (11.8) | 1 (4.3) | ||
| Last dose*, days (IIQ) | 121 (82-148) | 107 (68-166) | 0.513 | 102 (49-183) | 55 (25-101) | 0.007 |
| M6 | M12 | |||||
| MPS N=45 | AZA N=37 | p | MPS N=44 | AZA N=35 | p | |
| Booster, N (%) | 21 (46.7) | 10 (27) | 0.068 | 20 (45.5) | 16 (45.7) | 0.982 |
| Vaccine, N (%) | 0.979 | 0.717 | ||||
| BNT162b2 | 11 (52.4) | 5 (50) | 14 (70) | 10 (62.5) | ||
| ChAdOx1 CoV-19 | 5 (23.8) | 2 (20) | 1 (5) | 1 (6.3) | ||
| Ad26.COV2.S | 3 (14.3) | 2 (20) | 0 (0) | 1 (6.3) | ||
| CoronaVac | 2 (9.5) | 1 (10) | 5 (25) | 4 (25) | ||
| Last dose*, days (IIQ) | 108 (62-146) | 108 (77-140) | 0.744 | 185 (89-266) | 179 (66-288) | 0.933 |
M: month; N: number; IQR: interquartile range. *Time between the last booster and the study visit.
Table 7.
Mean and confidence interval of anti-SARS-CoV-2 IgG antibody titers at each study visit.
| Total (n=89) |
MPS (n=51) |
AZA (n=38) |
p | |
|---|---|---|---|---|
| Visits, Mean (CI95%) | 0.286 | |||
| Screening | 13,214.3 (10,442.3 – 15,986.3) | 12,059.2 (8,307.4 – 15,811.0) | 14,369.3 (10,287.7 – 18,450.9) | |
| M1 | 10,253.7 (7,647.5 – 12,859.9) | 9,483.9 (5,868.8 – 13,099.1) | 11,023.5 (7,268.4 – 14,778.5) | |
| M3 | 13,046.1 (10,181.4 – 15,910.9) | 12,660.0 (8,721.7 – 16,598.2) | 13,432.3 (9,271.0 – 17,593.7) | |
| M6 | 12,424.8 (9,574.1 – 15,275.4) | 12,225.8 (8,430.7 – 16,020.9) | 12,623.8 (8,369.1 – 16,878.4) | |
| M12 | 12,739.1 (9,723.5 – 15,754.8) | 11,626.8 (7,850.9 – 15,402.8) | 13,851.4 (9,148.4 – 18,554.5) |
CI: confidence interval; MPS: mycophenolate sodium; AZA: azathioprine; M: month.
Table 8.
Multiple linear regression model to evaluate the effect of time and type of immunosuppressive regimen on anti-SARS-CoV-2 IgG titers over 12 months.
Table 8.
Multiple linear regression model to evaluate the effect of time and type of immunosuppressive regimen on anti-SARS-CoV-2 IgG titers over 12 months.
| Coefficient (CI 95%) | p | ||
|---|---|---|---|
| Azathioprine (ref. Mycophenolate) | 2,310.1 (-3,233.9 to 7,854.1) | 0.414 | |
| Visit (ref. Screening) | 0.040 | ||
| M1 | -2,575.3 (-5,812.5 to 661.9) | 0.119 | |
| M3 | 600.7 (-4,437.8 to 5,639.3) | 0.815 | |
| M6 | 166.6 (-4,820.4 to 5,153.6) | 0.948 | |
| M12 | -432.4 (-5,892.2 to 5,027.4) | 0.877 | |
| Interaction between group and time (ref. Mycophenolate-Scr) |
0.286 | ||
| Azathioprine – M1 | -770.6 (-5,991.1 to 4,449.9) | 0.772 | |
| Azathioprine – M3 | -1,537.7 (-9,245.1 to 6,169.7) | 0.696 | |
| Azathioprine – M6 | -1,912.1 (-9,462.9 to 5,638.7) | 0.620 | |
| Azathioprine – M12 | -85.5 (-7,475.6 to 7,304.6) | 0.982 |
CI: confidence interval; Ref: reference; M: month; Scr: screening.
Table 9.
Mean and confidence interval of anti-SARS-CoV-2 antibody neutralizing activity at each study visit.
Table 9.
Mean and confidence interval of anti-SARS-CoV-2 antibody neutralizing activity at each study visit.
| Total (n=89) |
MPS (n=51) |
AZA (n=38) |
p | |
|---|---|---|---|---|
| Visits, Mean (IC95%) | 0.008 | |||
| Screening | 0.844 (0.789 – 0.899) | 0.764 (0.671 – 0.857) | 0.924 (0.865 – 0.983) | 0.006 |
| M1 | 0.887 (0.841 – 0.932) | 0.817 (0.735 – 0.898) | 0.957 (0.917 – 0.997) | 0.004 |
| M3 | 0.904 (0.859 – 0.949) | 0.871 (0.793 – 0.949) | 0.937 (0.892 – 0.983) | 0.161 |
| M6 | 0.937 (0.906 – 0.968) | 0.926 (0.873 – 0.979) | 0.948 (0.916 – 0.979) | 0.502 |
| M12 | 0.950 (0.925 – 0.976) | 0.939 (0.892 – 0.985) | 0.962 (0.941 – 0.982) | 0.383 |
CI: confidence interval; MPS: mycophenolate sodium; AZA: azathioprine; M: month.
Table 10.
Multiple linear regression analysis of time and immunosuppressive regimen effects on mean anti-SARS-CoV-2 neutralizing activity over 12 months.
Table 10.
Multiple linear regression analysis of time and immunosuppressive regimen effects on mean anti-SARS-CoV-2 neutralizing activity over 12 months.
| Coefficient (CI 95%) | p | ||
|---|---|---|---|
| Azathioprine (ref. Mycophenolate) | 0.082 (0.021 to 0.143) | 0.008 | |
| Visit (ref. Screening) | 0.002 | ||
| M1 | 0.053 (-0.01 to 0.115) | 0.097 | |
| M3 | 0.107 (0.025 to 0.189) | 0.010 | |
| M6 | 0.162 (0.079 to 0.245) | 0.001 | |
| M12 | 0.175 (0.089 to 0.260) | 0.001 | |
| Interaction between group and time (ref. Mycophenolate-Scr) |
0.017 | ||
| Azathioprine – M1 | -0.020 (-0.101 to 0.061) | 0.634 | |
| Azathioprine – M3 | -0.094 (-0.203 to 0.015) | 0.092 | |
| Azathioprine – M6 | -0.138 (-0.237 to -0.040) | 0.006 | |
| Azathioprine – M12 | -0.137 (-0.241 to -0.033) | 0.010 |
CI: confidence interval; Ref: reference; M: month; Scr: screening.
Disclaimer/Publisher’s Note: The statements, opinions and data contained in all publications are solely those of the individual author(s) and contributor(s) and not of MDPI and/or the editor(s). MDPI and/or the editor(s) disclaim responsibility for any injury to people or property resulting from any ideas, methods, instructions or products referred to in the content. |
© 2025 by the authors. Licensee MDPI, Basel, Switzerland. This article is an open access article distributed under the terms and conditions of the Creative Commons Attribution (CC BY) license (http://creativecommons.org/licenses/by/4.0/).
Copyright: This open access article is published under a Creative Commons CC BY 4.0 license, which permit the free download, distribution, and reuse, provided that the author and preprint are cited in any reuse.


