
Submitted:
15 January 2025
Posted:
16 January 2025
You are already at the latest version
Abstract
The aim of this paper is to study the performance of a matched filter for baseband binary transmission when subjected to Gaussian noise. A BER performance simulation model is created which consists of a BPSK encoder, a transmission SQRC filter, a Gaussian noise generator, a receive SQRT filter and a BPSK decoder. A Monte Carlo simulation technique is used to determine the dependency of BER performance on the signal to noise ratio. A MATLAB program and a MATLAB SIMULINK program was written to generate the required data. The MATLAB results show good agreement with statistical theoretical predictions.
Keywords:
Matched Filter
; Baseband Binary Transmission
; Gaussian Noise
; BER Performance
; BPSK Encoder
; BPSK Decoder
; SQRC Filter
; Signal-to-Noise Ratio (SNR)
; Monte Carlo Simulation
; MATLAB Simulation
; MATLAB SIMULINK
; Statistical Predictions
1. Introduction
High-speed digital transmission of baseband data has become an important part of communication systems. However, when data are transmitted at high speeds over long distances, the signal is subjected to noise levels, which can affect the signal output and cause errors in the received data. To reduce errors, matched transmission filters and reception filters are commonly used in high-speed transmissions such as a matched SQRC filter [1].
The purpose of this paper is to investigate the effect of noise on a baseband transmission line that is filtered at both ends. This will involve the simulation of a binary transmission, which is represented by the block diagram shown in Figure 1 [1].
The simulation will involve passing a binary signal through a BPSK encoder which converts the signal into polar data. The signal is then upsampled and passed through a matched transmission SQRT filter. An AWGN noise signal is added to the transmitted data, using various values of SNR, and is received by a matching SQRT filter. The received filtered data is then sampled and converted to binary data a Maximum Likely rule. To determine the BER value for various values of SNR, a Monte Carlo method is used in which a large random sample of input data is generated [1,2].
This paper considers two simulations. The first baseband binary simulation will be carried out by creating a MATLAB [3] program to produce BER data. The second simulation will be carried out using SIMULINK to produce BER data.
Both experimental simulations show good agreement with each other and the theoretical prediction. The theoretical prediction is discussed in the following section.
2. Theoretical Prediction of BER
The simulation of matched filtering for baseband binary transmission initially involves the conversion of unipolar binary data into bipolar data [4]. A sequence of unipolar data b is converted into a polar data sequence A by the formula:
where i is the element of the sequence and is the length of the sequence.
For example the sequence is converted to the sequence . The data is then passed through a transmission raised cosine filter, which is used to pulse shape the signal and minimize InterSymbol Interference (ISI) [5]. The theory involved in this type of filter is described in the following section.
2.1. Raised Cosine Filter Theory
A raised cosine filter has a frequency spectrum given by the formula [6]:
where is a roll-off factor in the range , and T is the reciprocal of the symbol rate.
The impulse response of the raised cosine function for values of and is shown in Figure 2 (as produced on a Maple package).
It can be seen in Figure 2, has zero values at the normalized sampling times , which leads to zero ISI values being zero at all sampling points provided delay is taken into account [7,8].
A raised cosine filter is commonly used at both ends of a transmission line. In practice a matched filter system is used at both ends in order to maximize signal-to-noise ratios and hence minimize the bit error rate (BER) [9]. In this paper a pair of square-root raised cosine filters is chosen at both ends, which is equivalent to the signal being subjected to a single raised cosine filter [1].
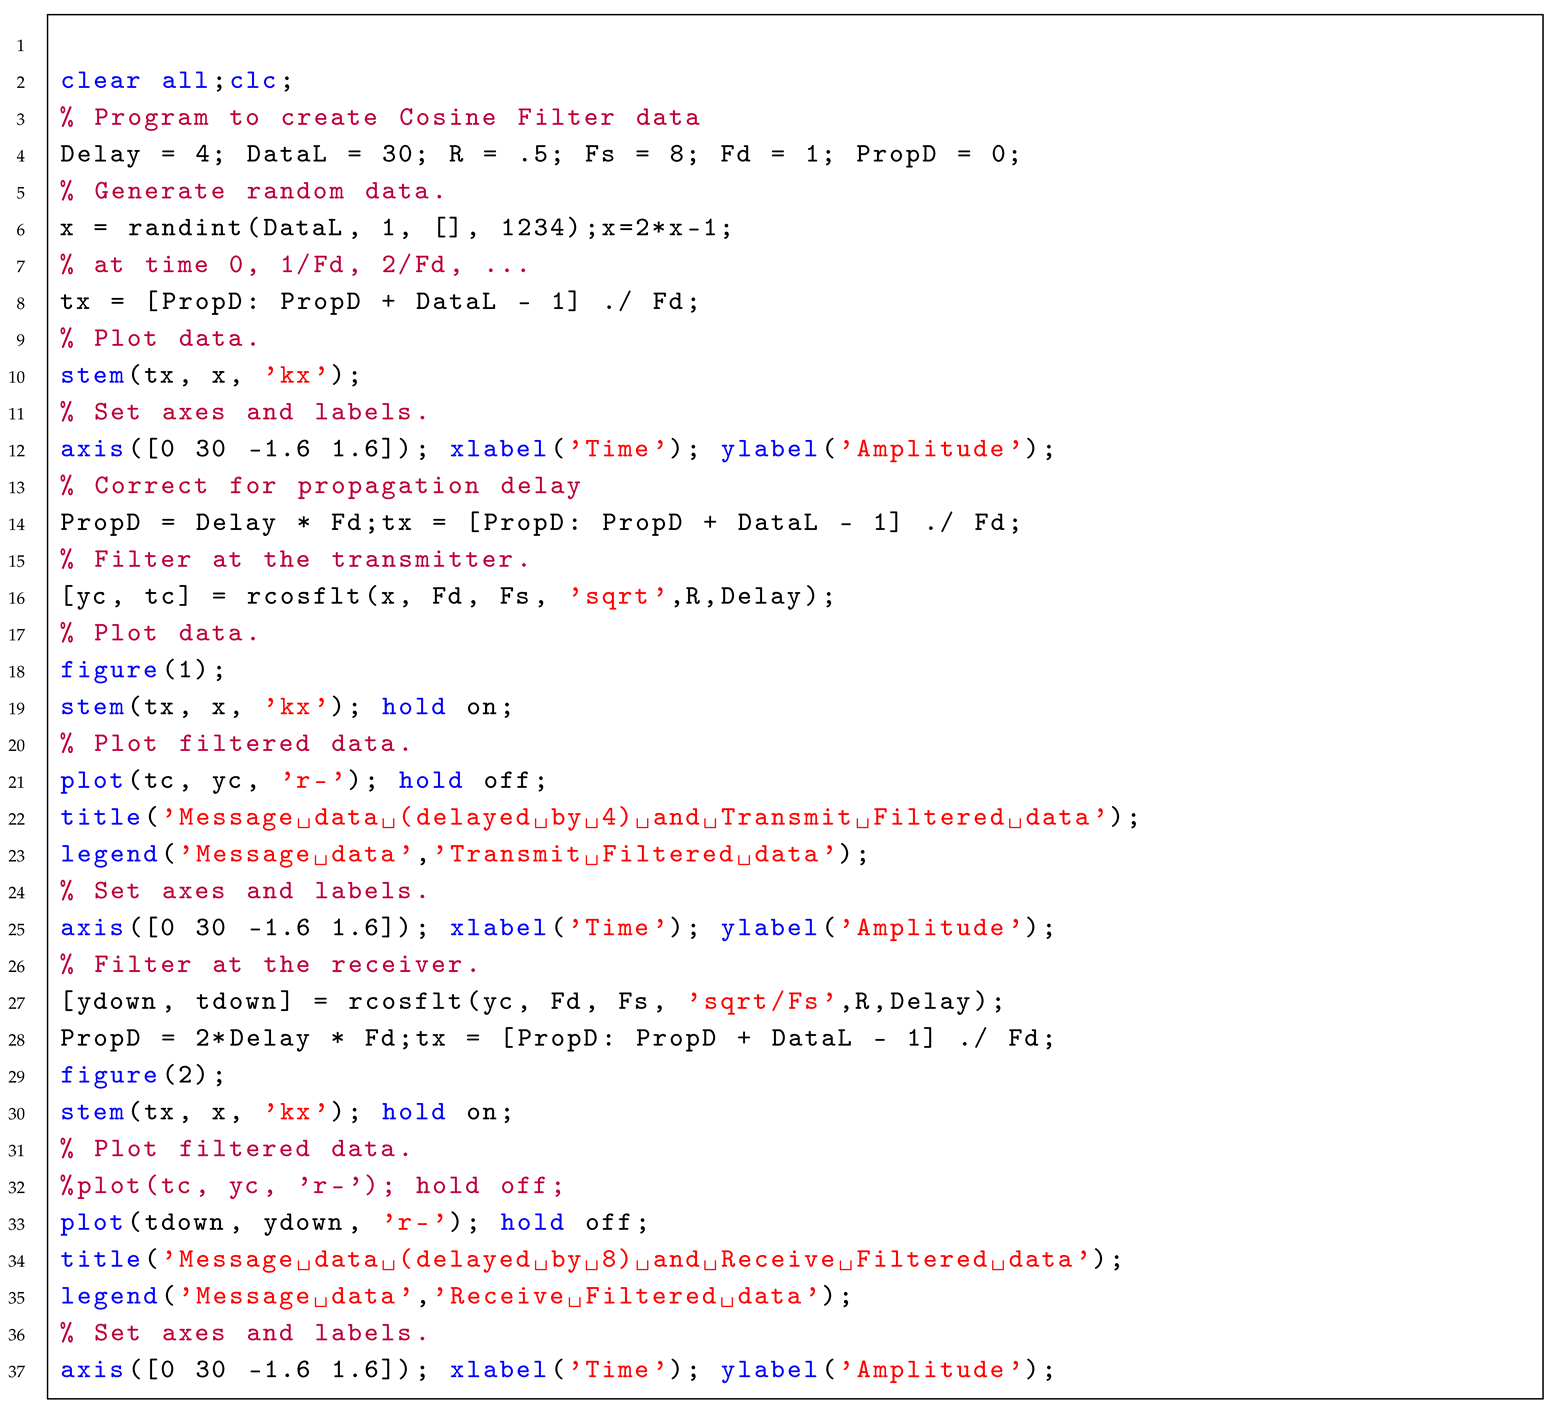
To demonstrate the effect of an SQRT filter on input polar data, a 30 symbol random sample is selected, as shown as message data in Figure 3. The filtered output of an SQRT filter is also presented in Figure 2 which has been upsampled by a factor of 16 and is compared with the message data, which have been shifted by a delay factor of 4 [10]. The output data from the transmit SQRT filter (without further upsampling) are passed through the receive SQRT filter, which has an output shown in Figure 4. It can be seen that zero ISI values occur when the input message is delayed by 8 [11].
The MATLAB program presented in Appendix 1 was used to generate the data presented in Figure 3 and Figure 4 respectively [12].
2.2. Gaussian Noise
When noise is introduced in the transmission line, the ISI will no longer be zero at the sample points, and depending on the magnitude of the signal-to-noise ratio can lead to bit errors at the receiving end [13]. The theory for predicting BER rates as a function of SNR is as follows.
Consider an input signal to a matched filter system over an AWGN channel with an output signal , where is the noise function as shown in Figure 5 [1,14].
To simulate noise, a Gaussian distribution is used to model the noise level in the transmission line, which is assumed to have a zero mean. A Gaussian function with a mean of volts and a Gaussian function of mean volts are shown in Figure 6 [15,16].
As shown in Figure 6, the probability that code 1 is mistaken as code corresponds to the area of the green section and the probability that code is mistaken as code 1 corresponds to the area of the blue section [13,17].
The probability of a bit error occurring in a transmission line subjected to Gaussian noise is given by:
Since (Probability of bit = (Probability of bit then probability of a bit error is:
Using symmetry:
On making the substitution: , then
i.e., where
For a polar signal of volts, the mean signal power .
For a Gaussian distribution, normalized Gaussian noise, for a zero mean, is equal to the expected value:
Hence on substituting and into Equation 8 give the probability of a bit error as [17]:
For a polar signal,
where is the ratio of signal to noise.
3. Simulation Model Using MATLAB Programming
A random number generator is used to generate a source of binary data for transmission through a filtering system. Before filtering, the binary data are first converted to Non-Return to Zero (NRZ) bipolar data using a BPSK decoder [1,14]. A raised cosine-matched SQRC filter is used at the transmission end and at the receiver end in the simulation model. This type of matched filter has the advantage that the shape of the waveform does not cause Inter-Symbol Interference (ISI) of the signal between the transmitter and receiver [7,8,13].
3.1. Simulation Using Programming
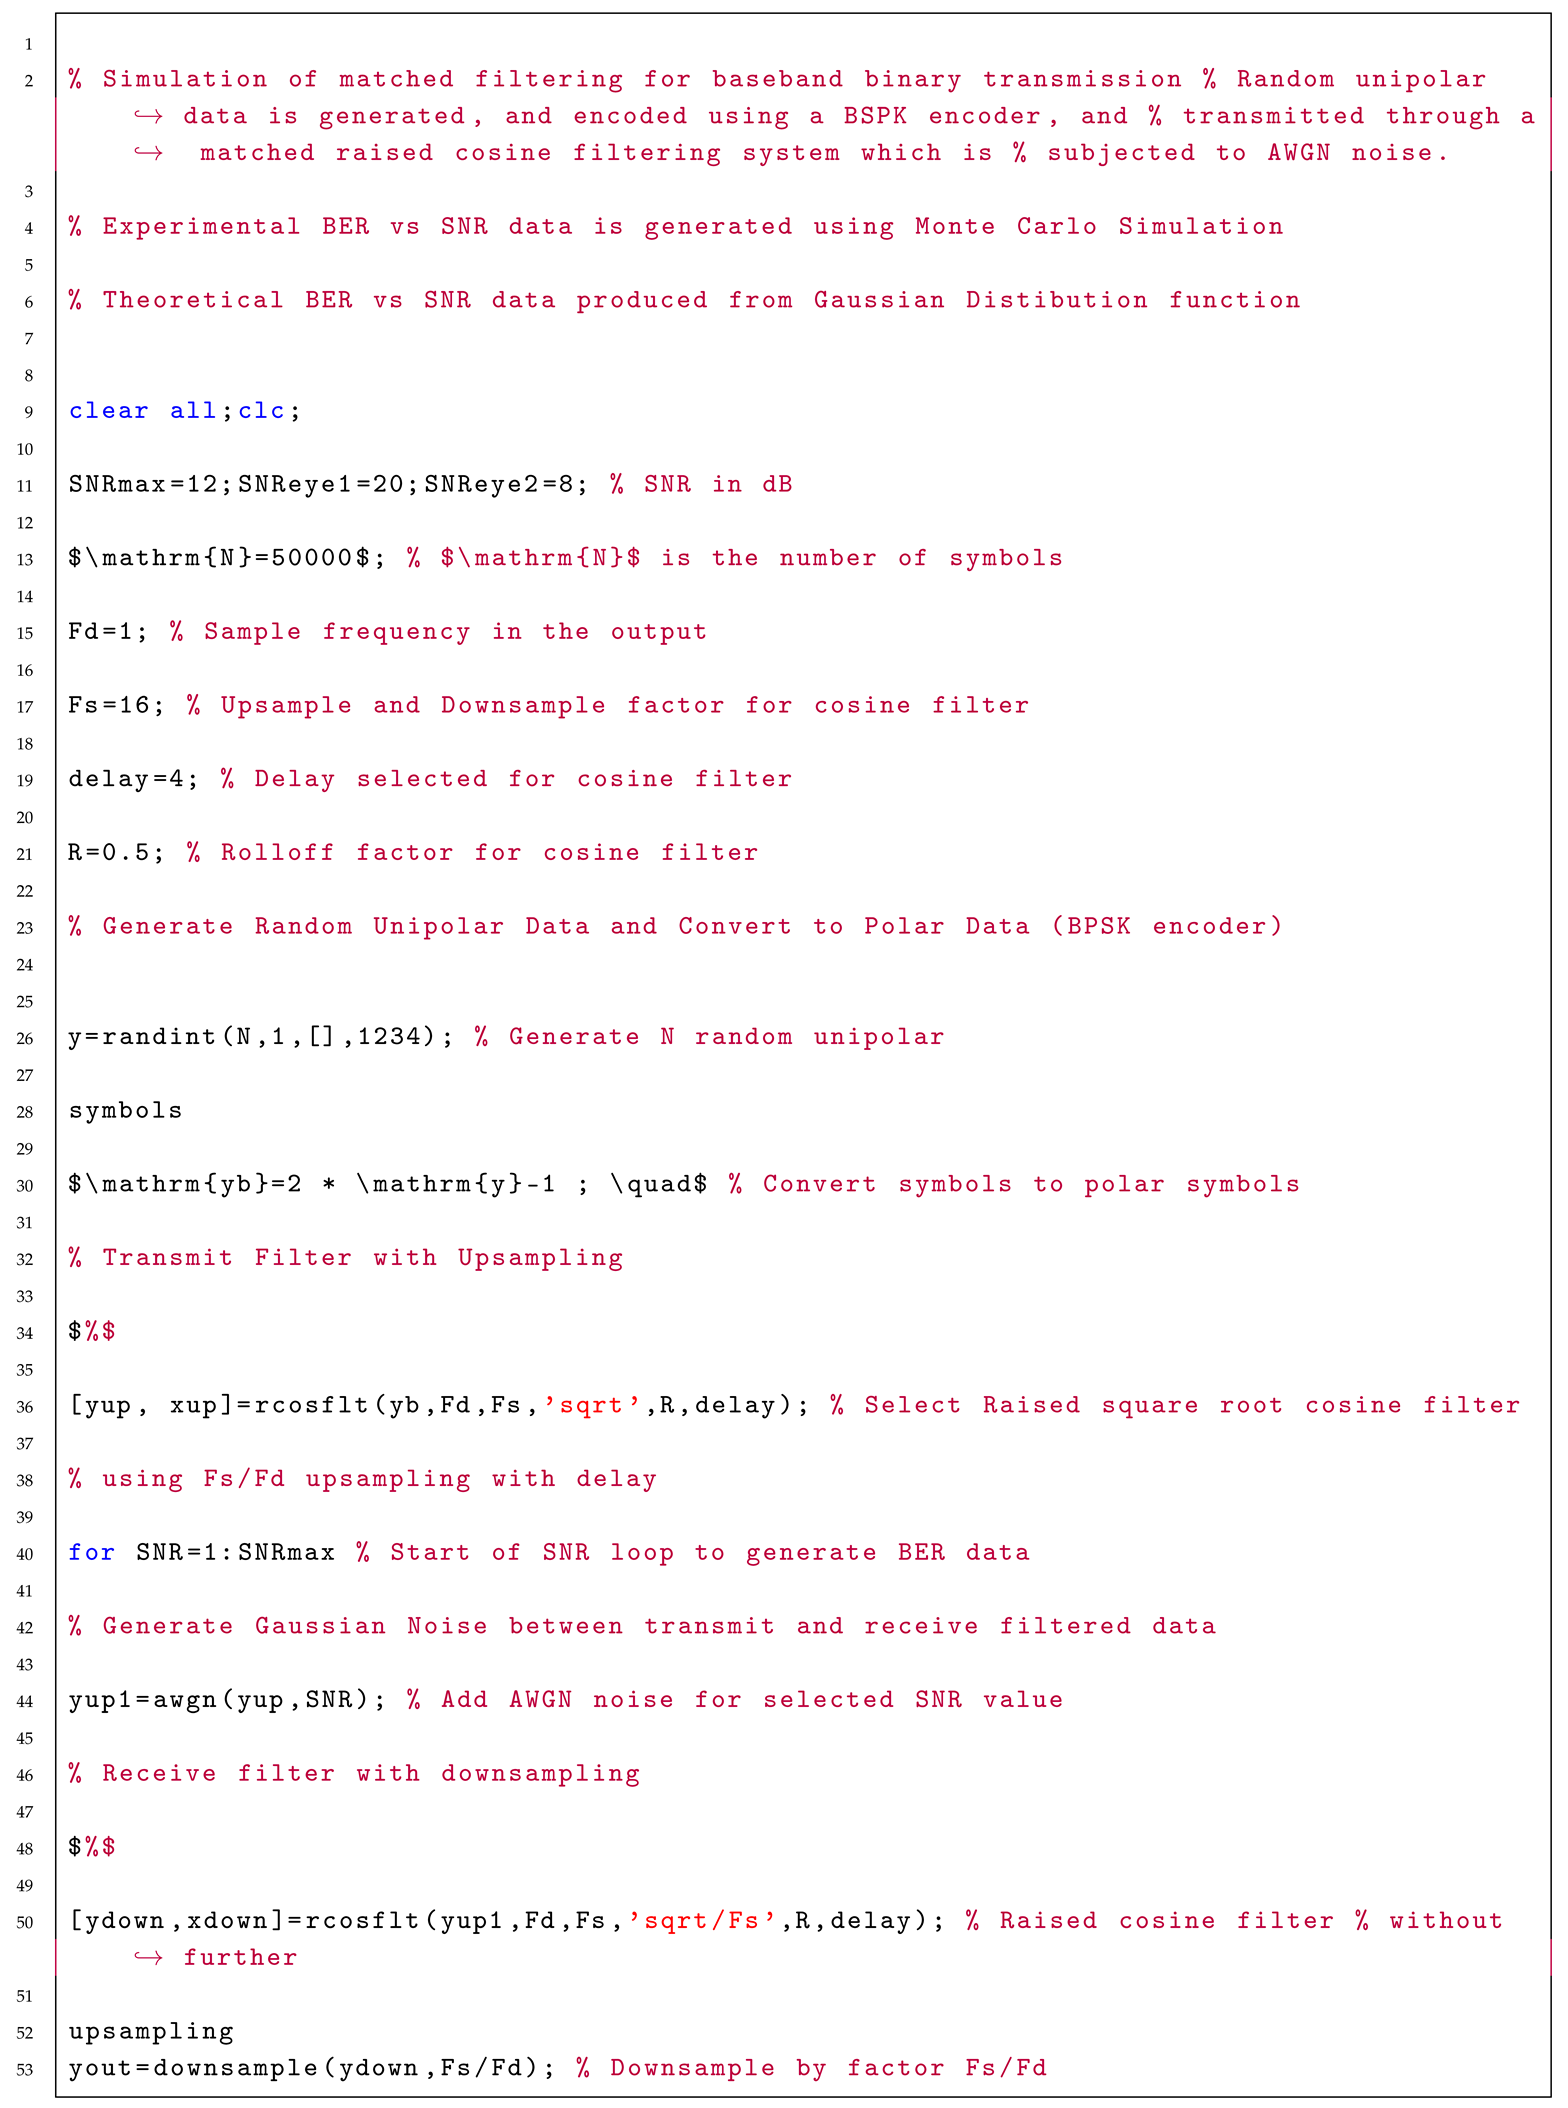
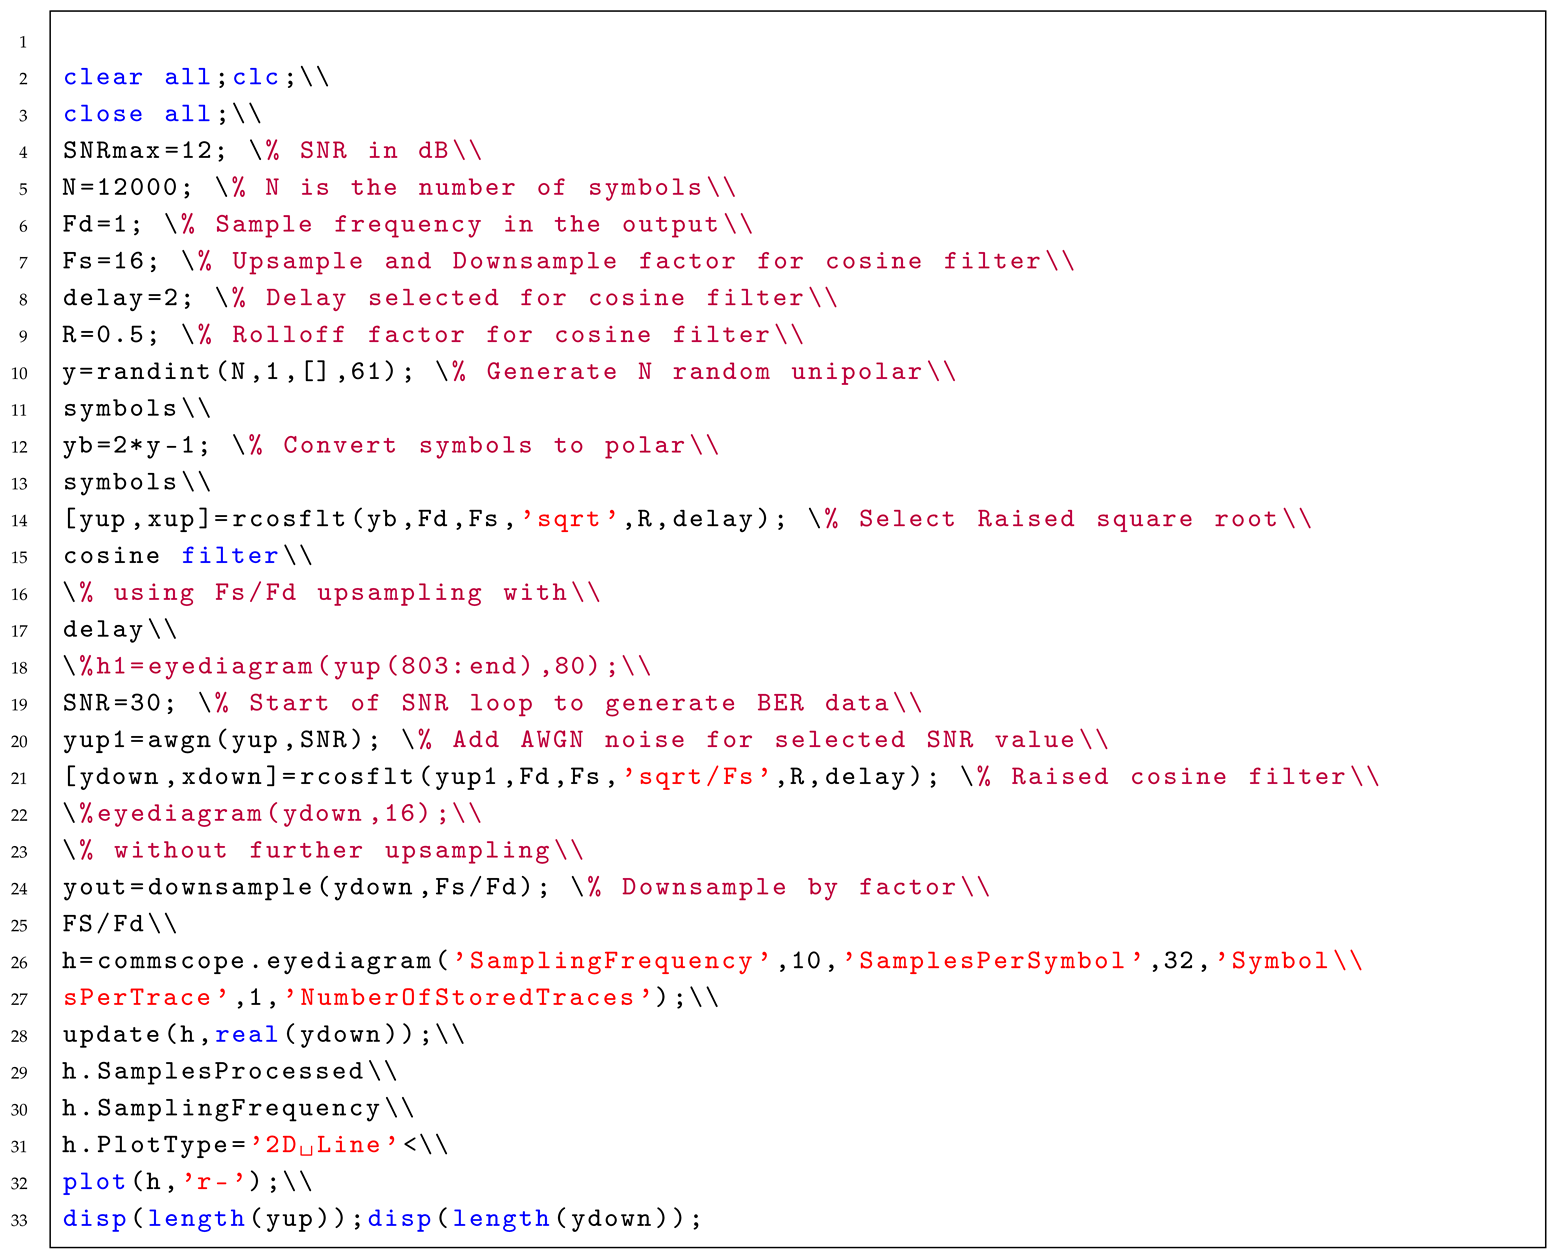
A MATLAB program was written to generate BER vs. SNR data for a matched filtering of baseband binary transmission using the Monte Carlo method as shown in Appendix 2 [1,11,18].
A sequence of unipolar data points, denoted by b, was created using a random number generator. The data is then converted to polar data, denoted by , using the formula , where and are the elements of the sequences b and A respectively [2,4].
The MATLAB command RCOSFLT was used to generate transmission output data from a square root raised output filter using an upsampling value of 16, a delay of 4 and a roll-off factor of . The MATLAB RCOSINE command was not used in this program, since this function is incorporated into the MATLAB RCOSFLT function [1,8]. To generate Gaussian noise data from the transmission output, the command AWGN was used, which was set to SNR values ranging from 1 to 12 [1,2].
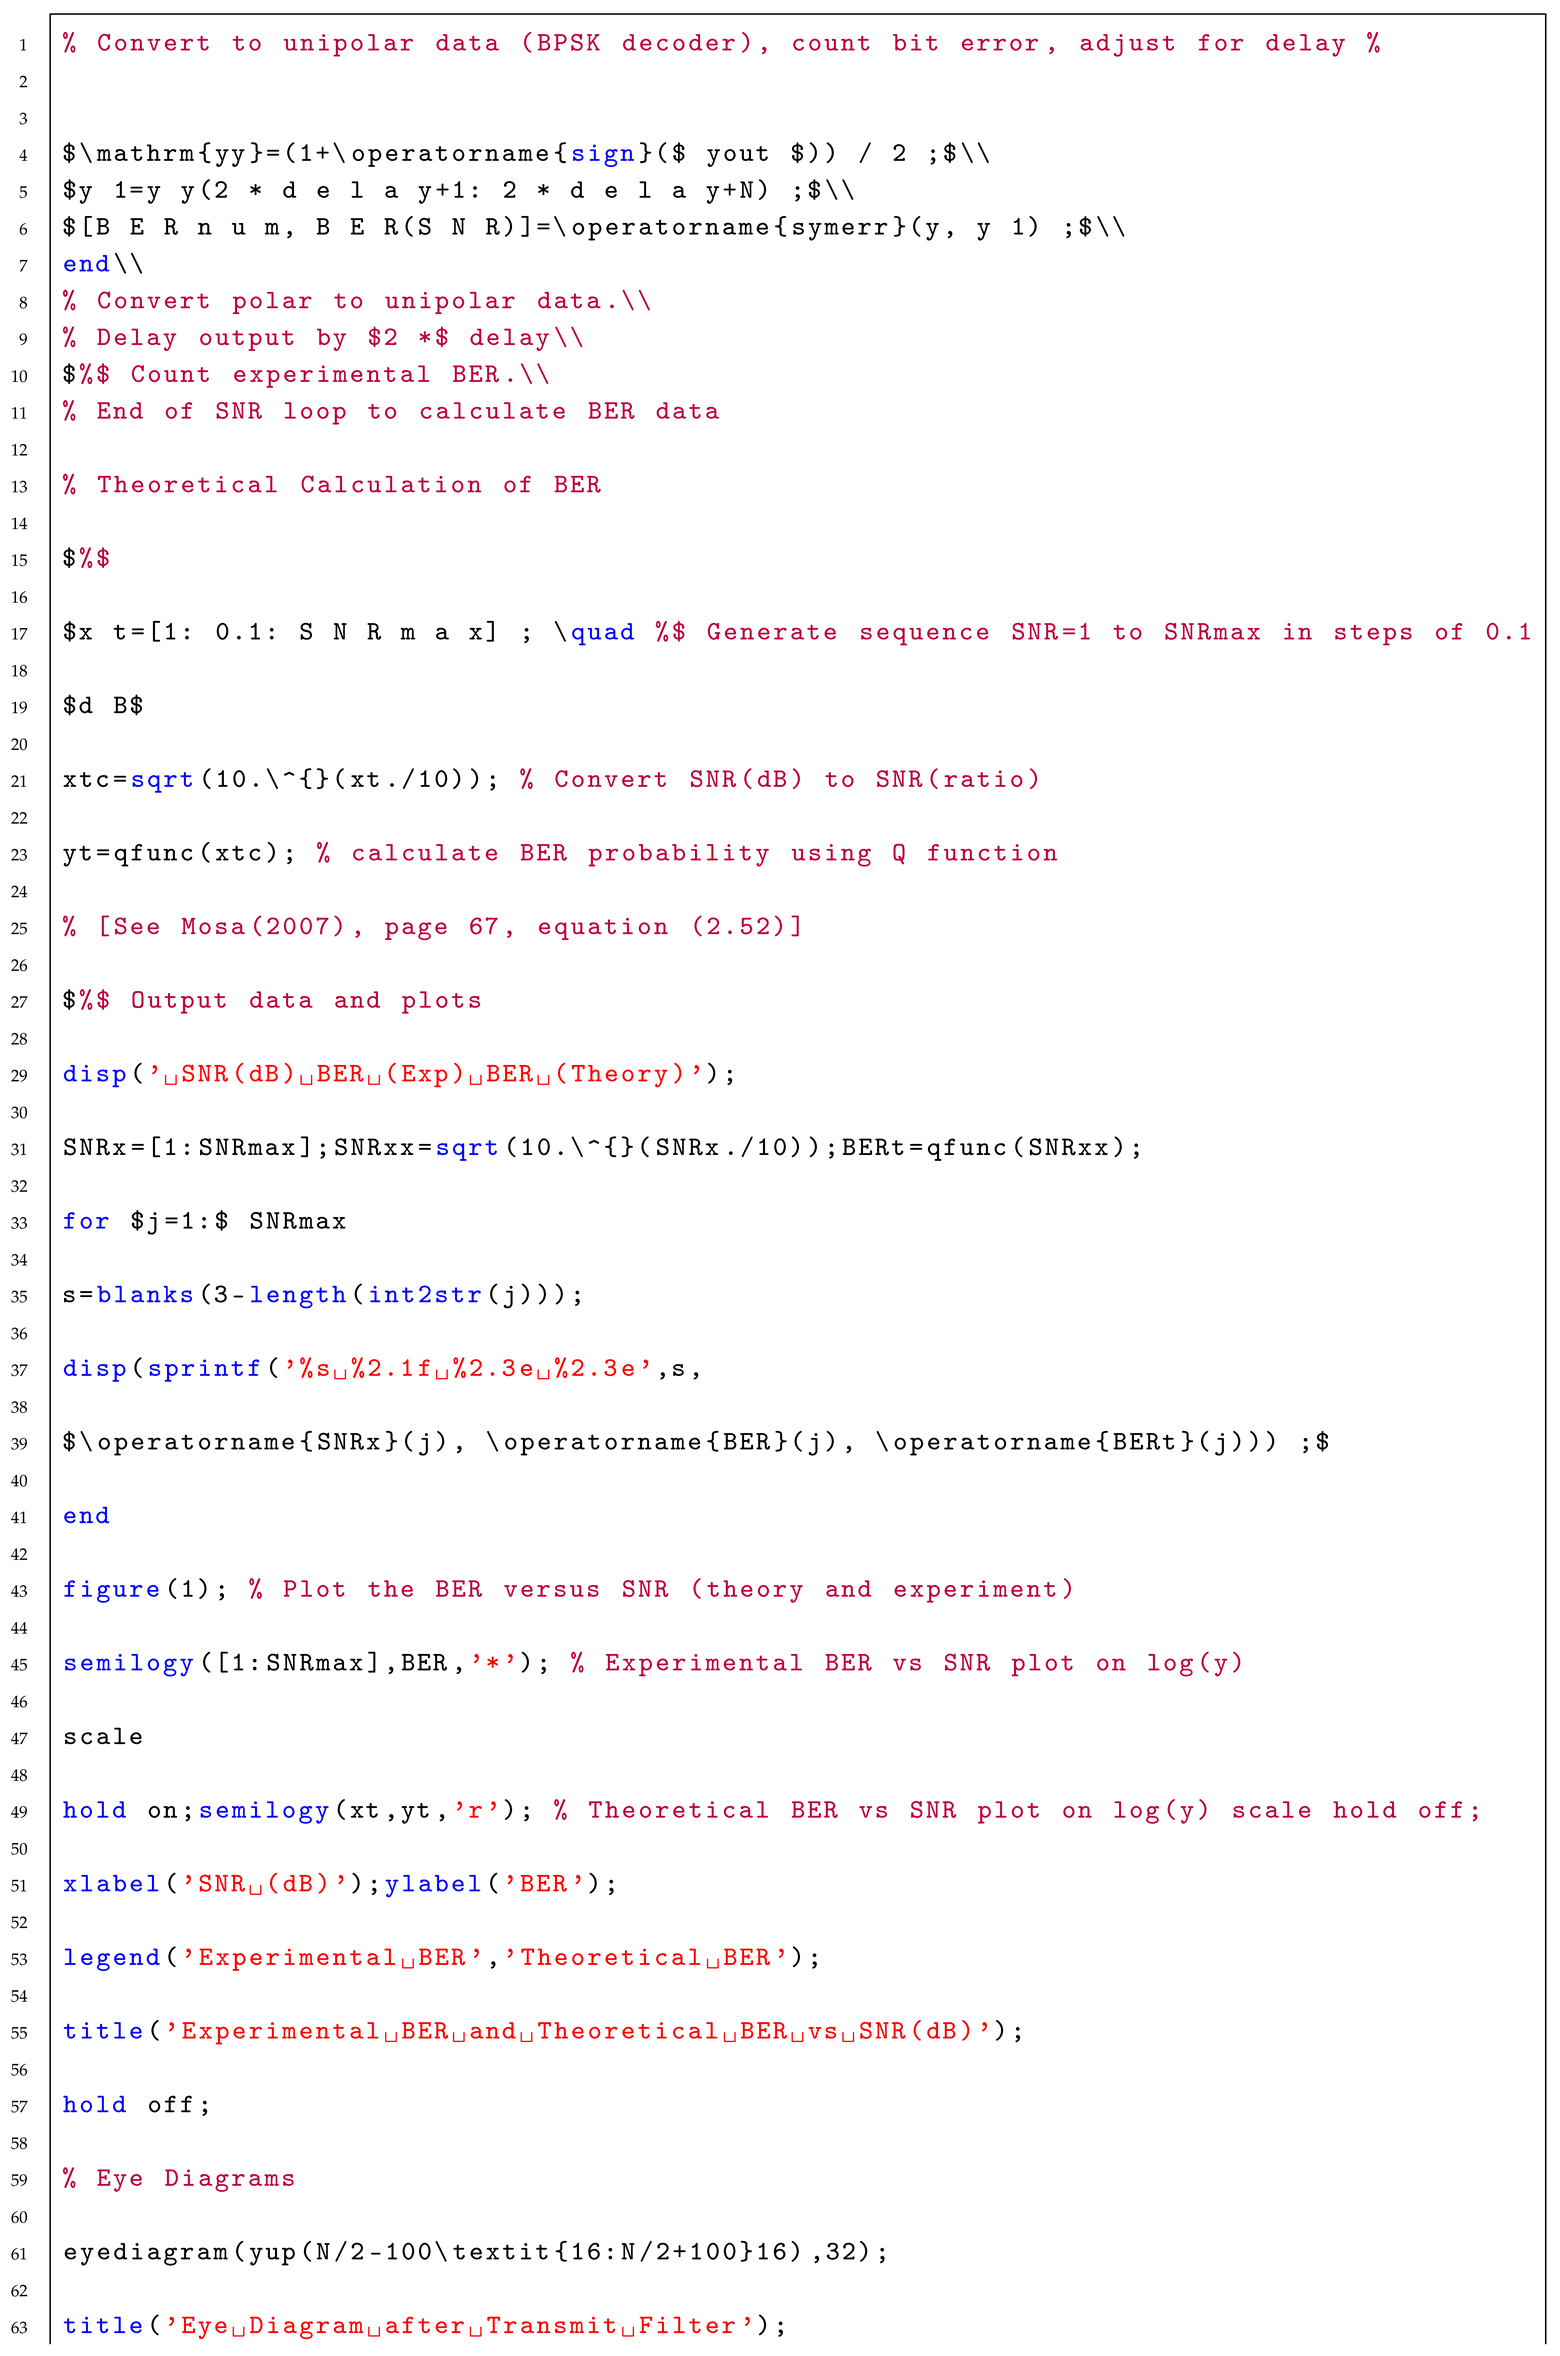
The received square-root raised cosine filter used in the program was also generated from the MATLAB RCOSFLT function, which was set without further upsampling [6,11]. The received filtered data was converted to unipolar data by using the Maximum Likelihood rule:
In order to computerize the BER values, the first 8 symbols of the output sequence were removed from the output data to compensate for the delay of 4 in each of the two raised cosine filters [18].
The BER value was obtained by comparing the truncated output sequence with the input sequence using the MATLAB sumerr function which counts the number of non-matching bits occurring between the input and output sequence [4,5,6].
To ensure an accurate estimation of the bit error, a random sample of symbols was generated for the input sequence. A loop was used to generate BER data for SNR values ranging from 1 to 12 [9,10].
Theoretical BER values were also computed in the MATLAB program for comparison purposes. The results of this program are discussed in the results and discussion in Section 4.
3.2. Simulation Using SIMULINK
A SIMULINK program [3,18] was developed to simulate the BER vs SNR values for matched filtered baseband transmission as shown in Figure 7.
In the SIMULINK block diagram, the Bernoulli binary block was used to generate binary data using random seed of 61. To generate polar data from the binary data, a BPSK modulator block was used in which the phase offset was set to pi [6,8]. This ensured that the binary code 1 was encoded as 1 and the binary code 0 was encoded as . The upsampling of the data was incorporated into the SQRT transmit filter using an upsampling ratio of . The roll-off factor was set to with a chosen delay of 4 [5,6].
It should be noted that the output from the BPSK encoder and the SQRT filter is represented as a complex number in which the imaginary part is zero [2,18]. In order to avoid the AWGN channel creating noise on the real part and the imaginary part of the complex number output, a real part converter was placed before the AWGN block channel as shown in Figure 7. A real number conversion to a complex number block was required after the AWGN channel for consistent matching of the data in the matched receive filter [5,8].
The receive cosine filter was set to 16 input symbols per second with group delay of 4 and roll-off factor of .
The BPSK demodulator was set with phase offset of pi to decode the polar bit as 0 and to decode the polar bit 1 as 1.
The Error rate calculation block, was set with a received delay of 8 (since each of the two matched filters were each set with a delay of 4). The computation delay was set to 0. The target number of errors and the maximum number of symbols in the Error rate calculation block was set to infinity [7,8].
4. Discussion and Results
A MATLAB program was written to generate BER data vs SNR values ranging from 1 to 12 as shown in Appendix 2. A sequence of random data bits was generated to ensure sufficient accuracy with the theoretical data, which is also produced in the same program [1]. The graphical output and tabulated output generated by the computer program are shown in Figure 8 and Figure 9, respectively.
Figure 8 shows good agreement between the theoretical and experimental data. Some discrepancy in the experimental data occurs at high values of SNR which is to be expected since the BER values are in the region of . To improve accuracy for higher values of SNR, a simulation run of at least should be used in the program.
A MATLAB SIMULINK program was also run with a symbol size of random binary data. As seen in Figure 7, a bit error rate of was obtained when . This value is very close to the tabulated theoretical value of shown in Figure 9, which confirms the accuracy of the SIMULINK program [17,19].
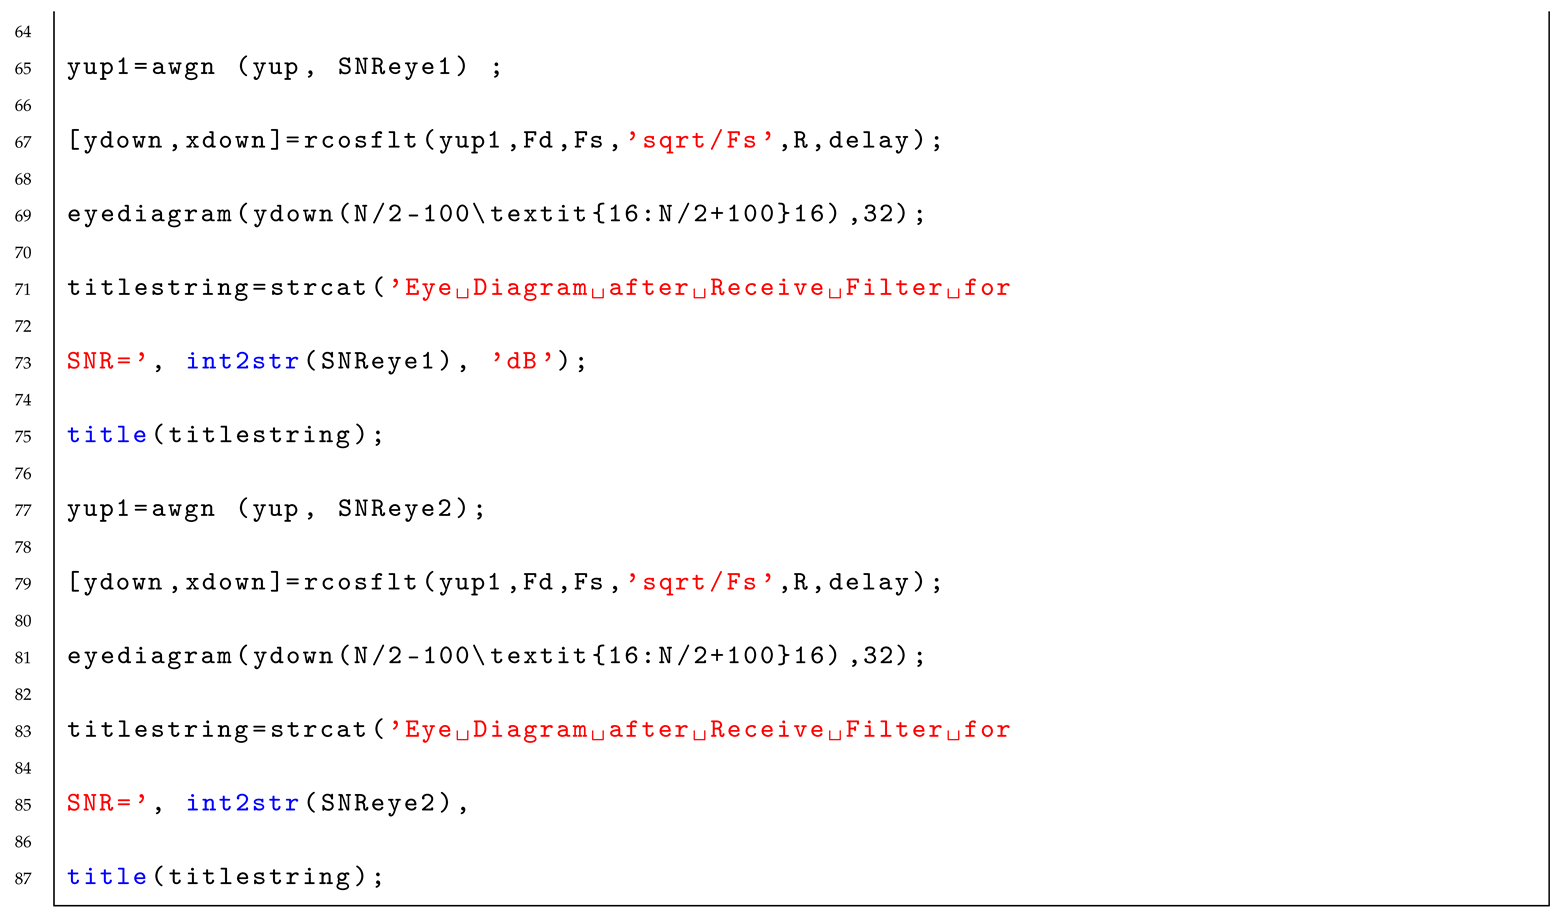
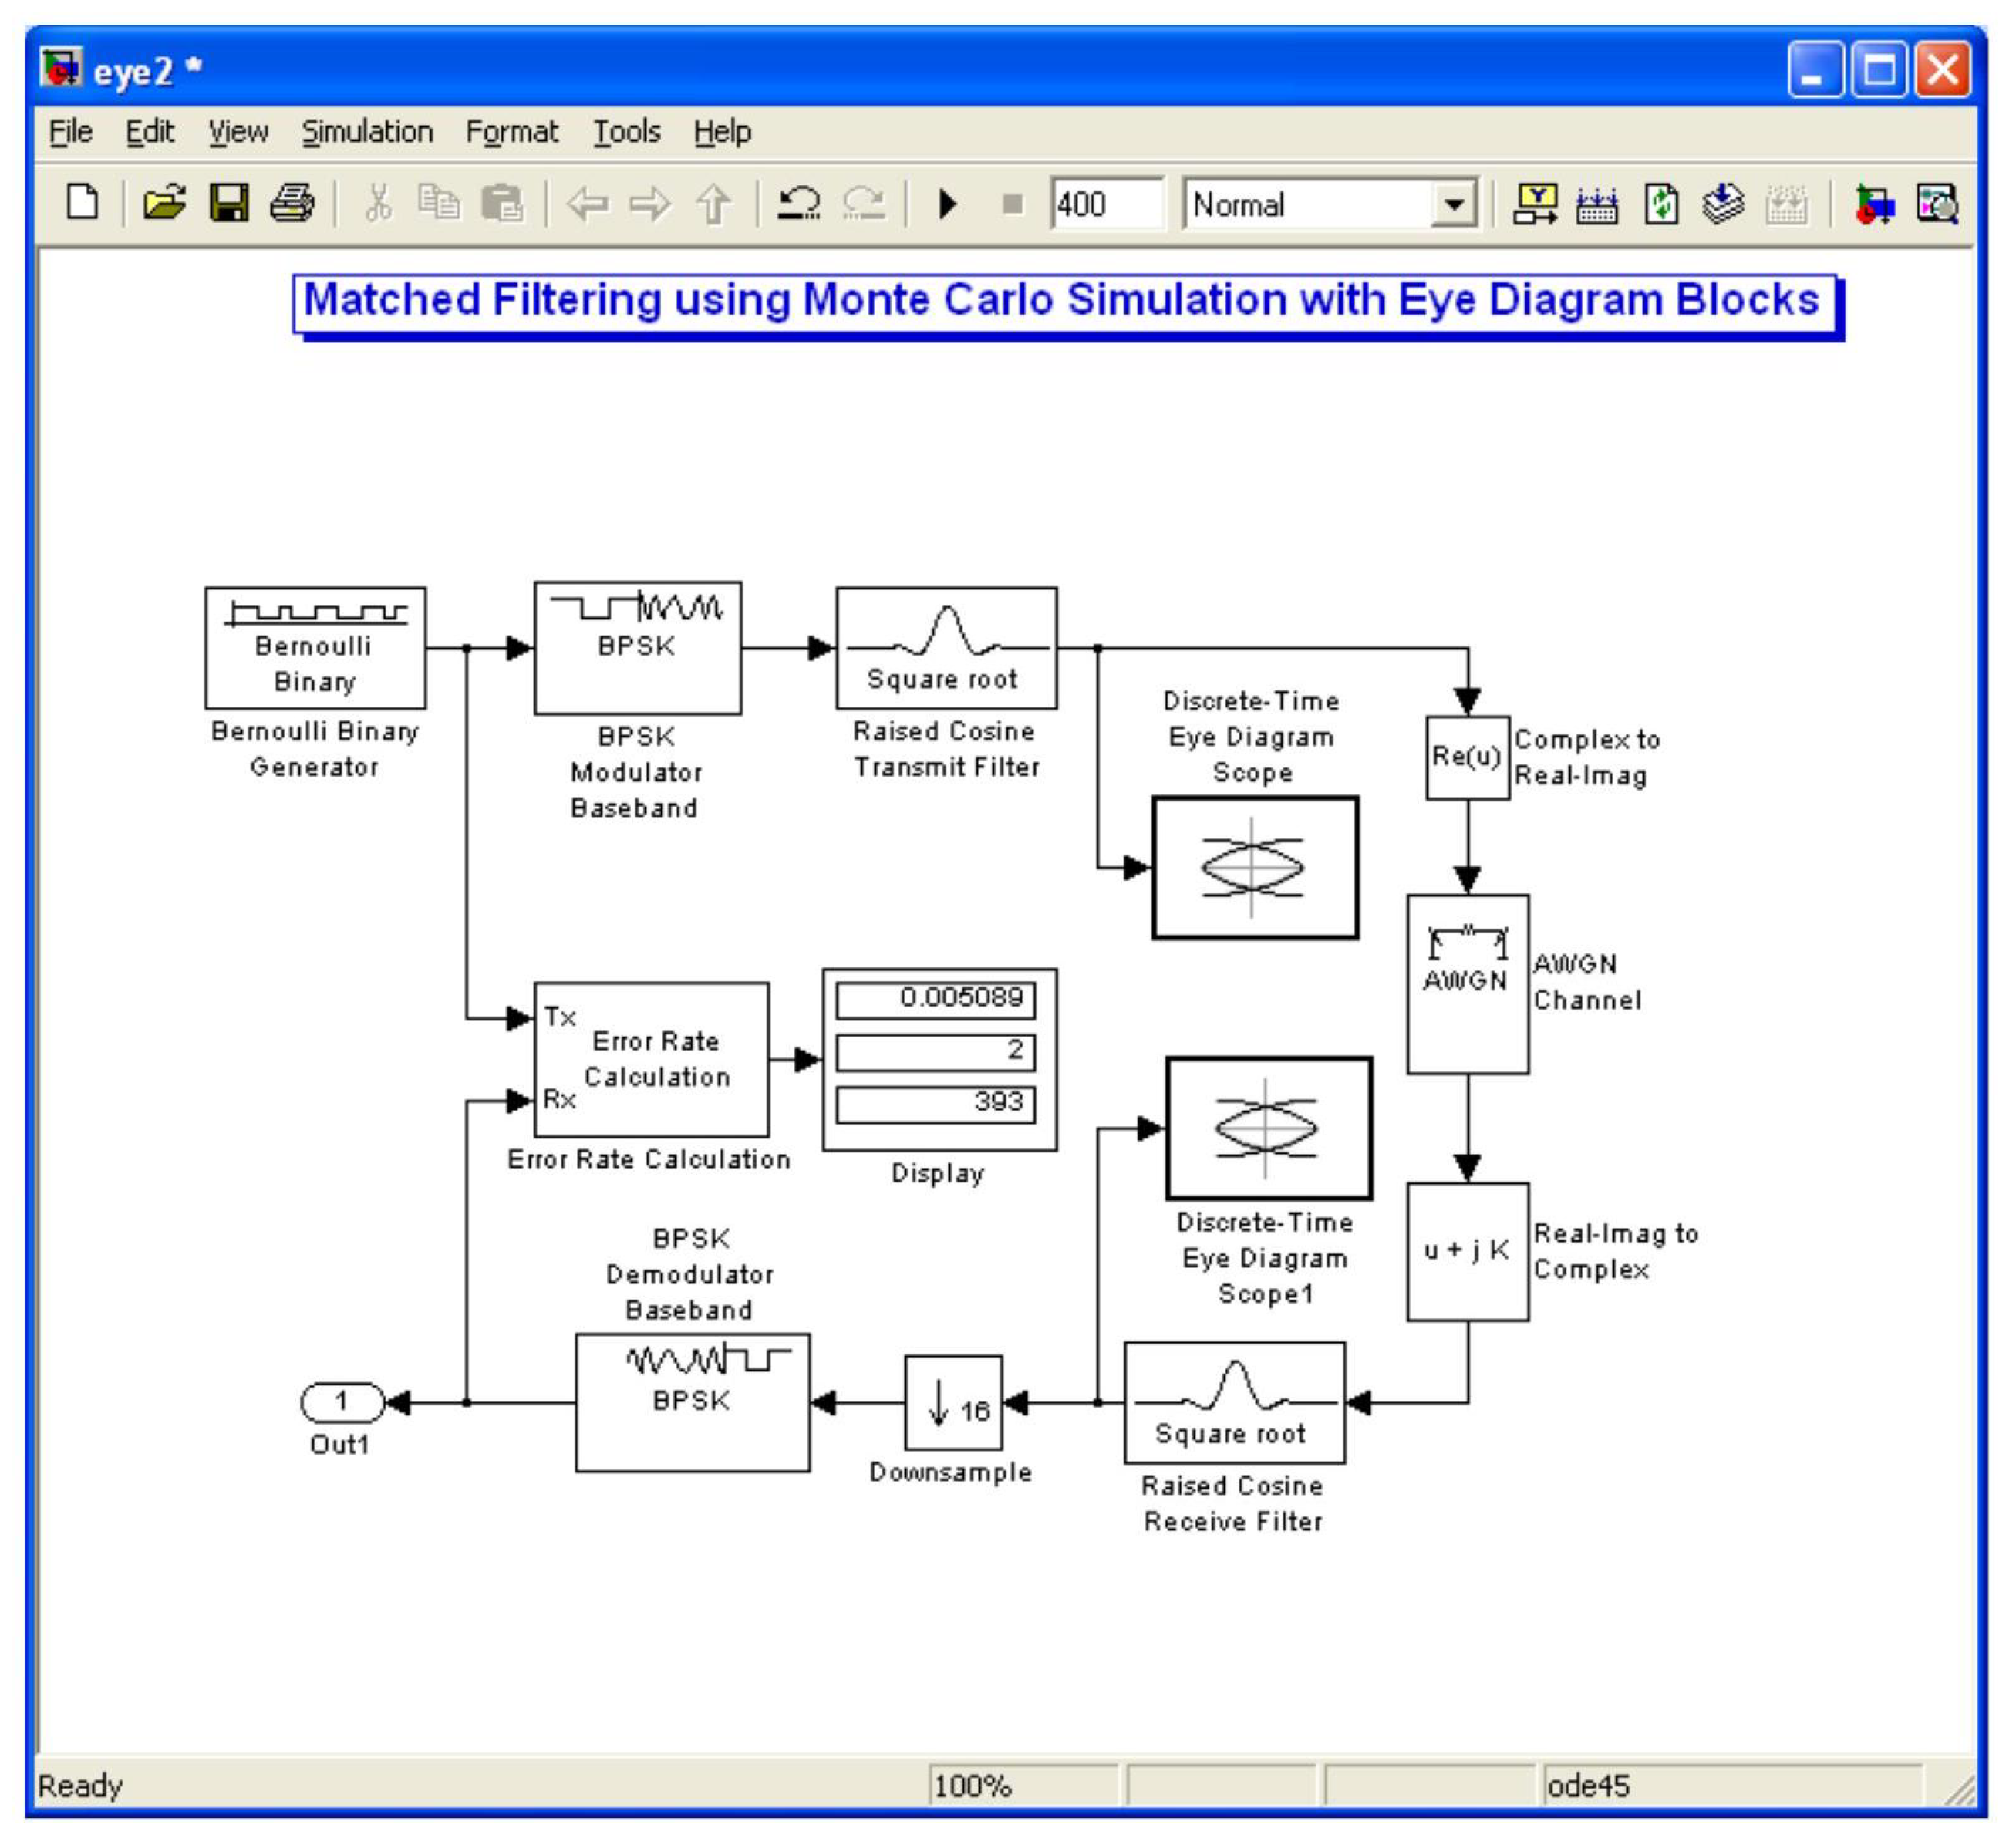
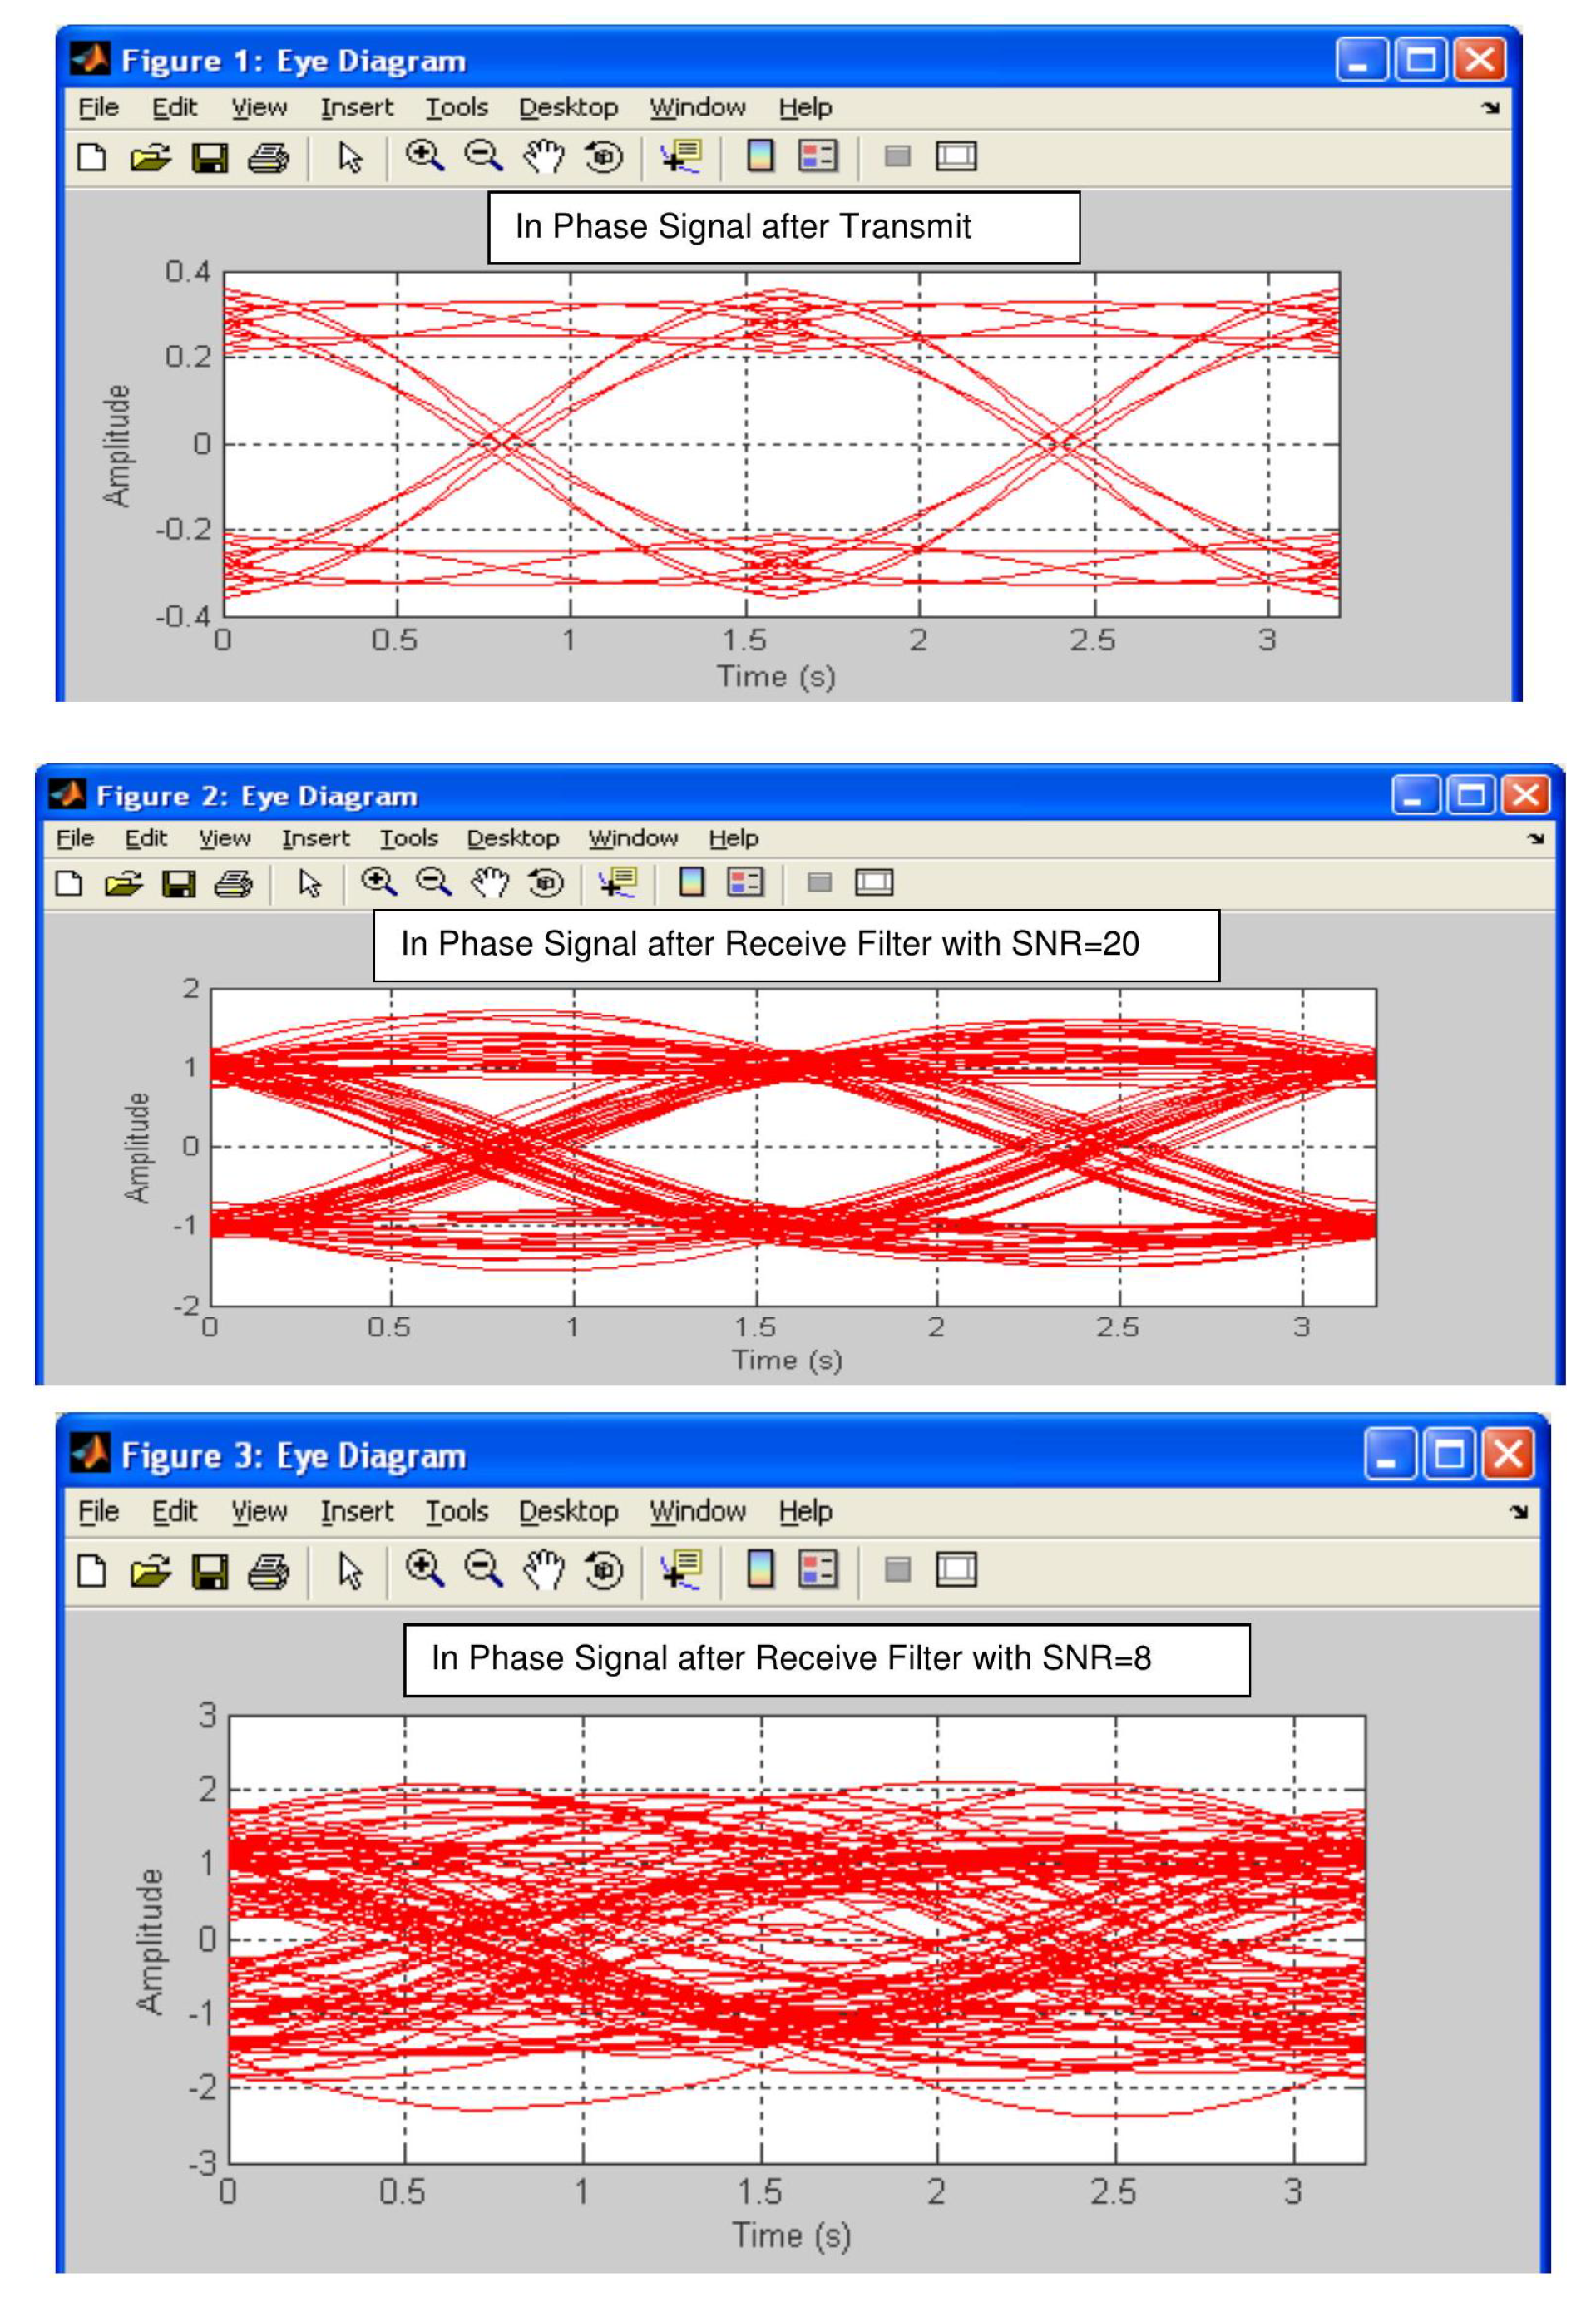
In order to visualize the bit error dependence of the matched filter baseband transmission on SNR values, eye diagrams were constructed using a computer-generated program (see Appendix 2). A SIMULINK program was also used to generate an eye diagram by including a Discrete-Time Eye Diagram Scope block in the program (see Appendix 5) [18].
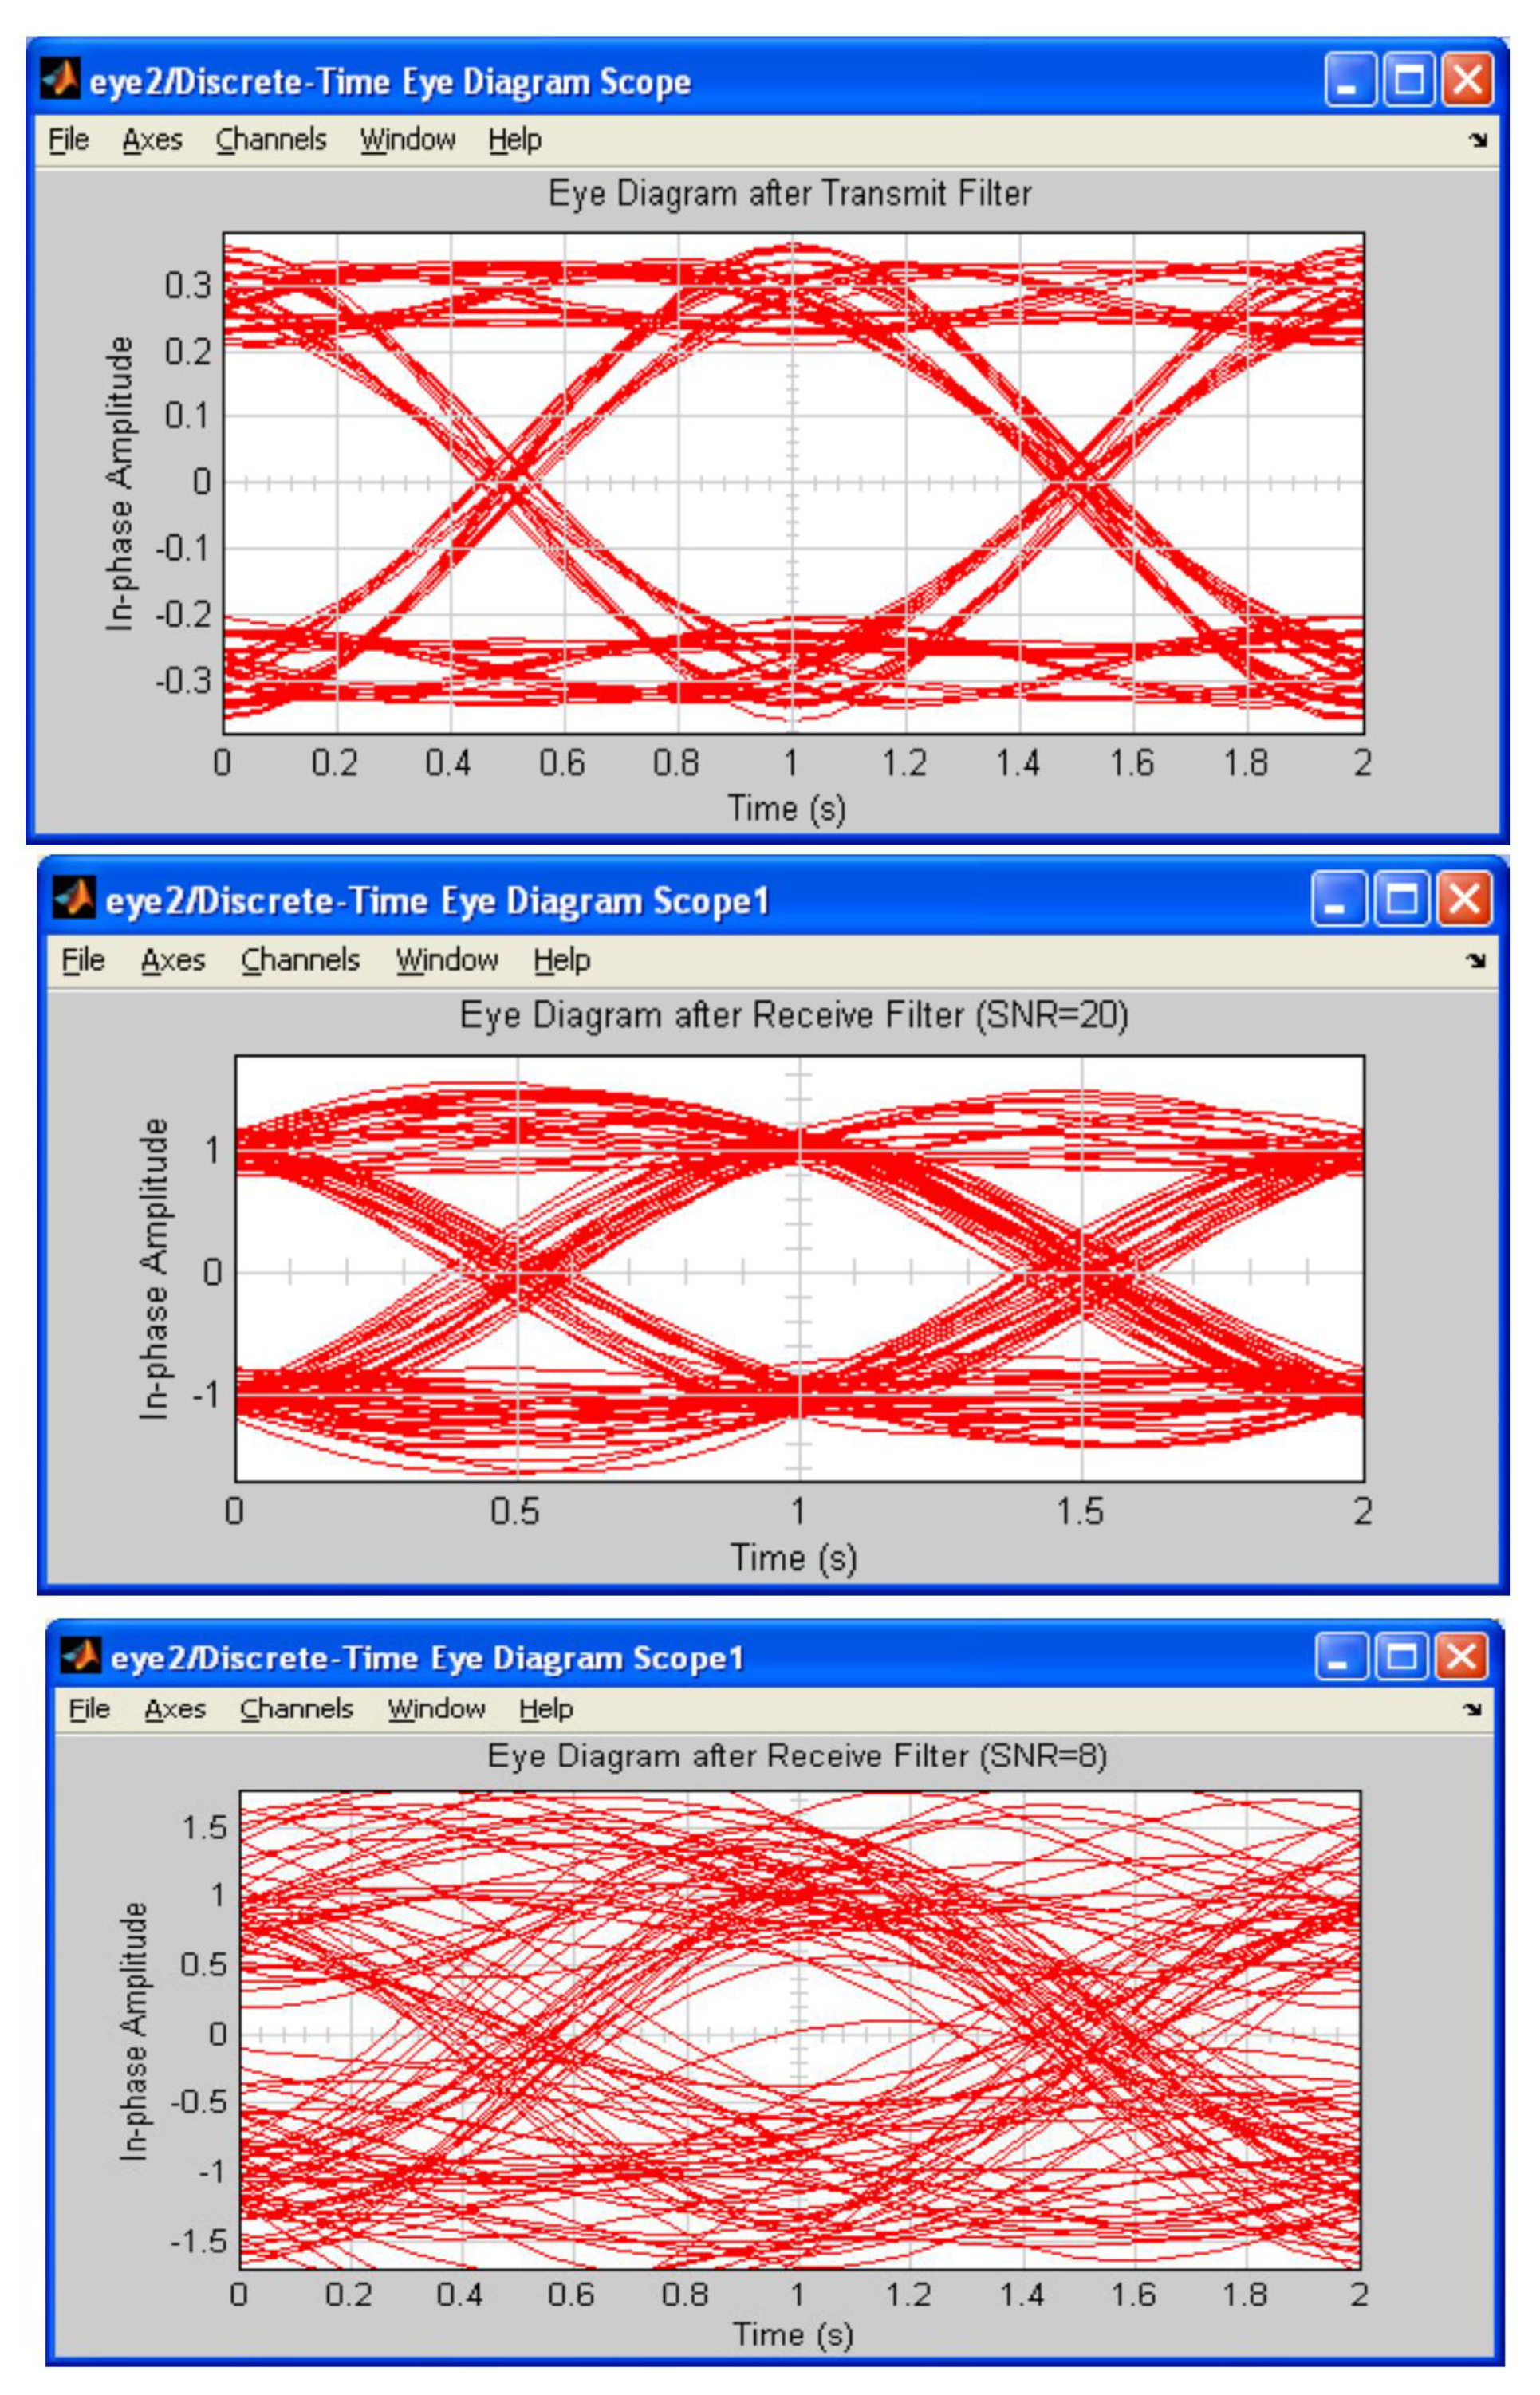
Figure 10 shows the eye diagram of the signal after the transmit filter and also the eye diagrams of the signal after the receive filter when subjected to values of and [20]. The eye diagrams for after the transmit filter and receive filter show minimal time variation and low signal distortion when the signal to noise ratio is large. Time variation and noise levels after the receive filter are larger than those of the receive filter (with ) since the signal is passed through an extra filter. No bit errors occurred in the SIMULINK program when [21,22]. This can be confirmed by inspecting the eye diagram, as the eye has a wide opening at the sampling points of seconds when .
In the case when , a bit error rate of was recorded in the SIMULINK program. This result is consistent with the eye diagram representation shown in Figure 10 when . A bit error rate of corresponds to one trace error in 200 traces occurring at a sampling point. The eye diagram clearly shows one or two traces closing the eye near a sampling point.
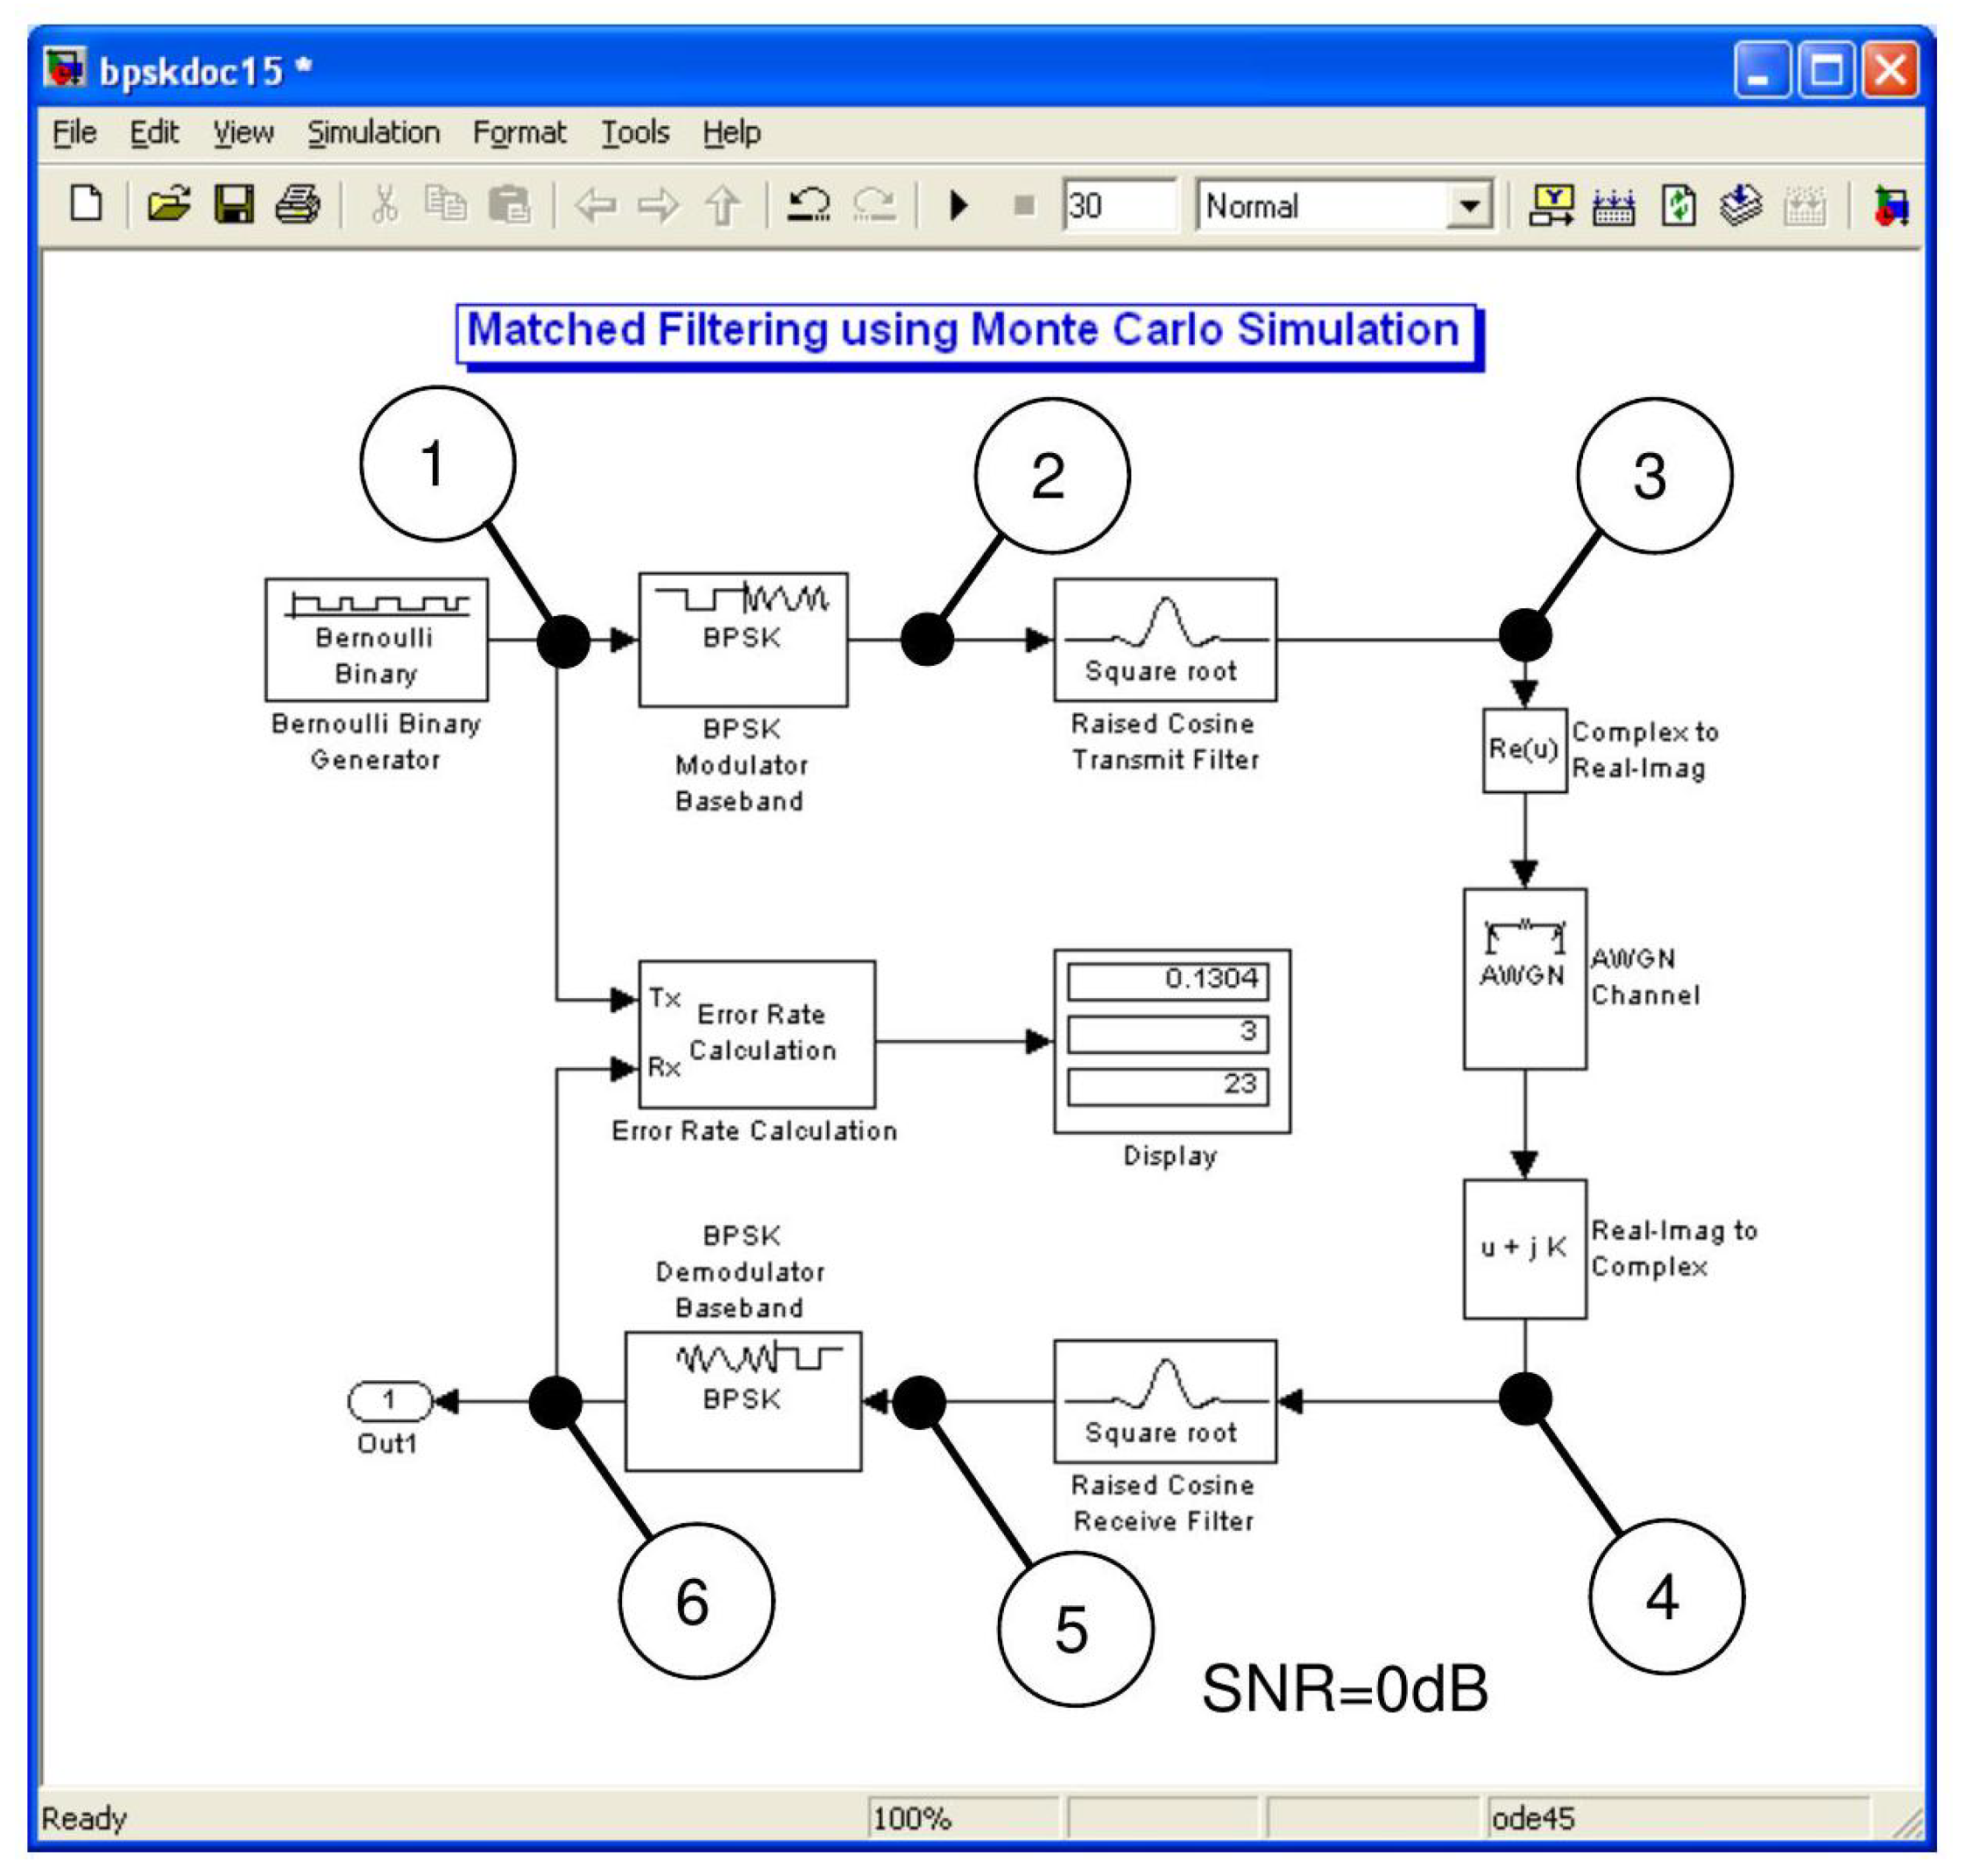
For completeness and understanding of the simulation process, a SIMULINK program was generated with time scopes positioned at 6 points of the simulation loop as shown in Appendix 3. A random 30 symbol sequence was generated and the time scope displays at each of the 6 positions is shown in Appendix 4 using a SNR value of zero. Appendix 6 also shows eye diagram outputs generated by the MATLAB program presented in Appendix 2.
In conclusion of the paper, the performance of Matched filtering baseband binary transmission using a Monte Carlo simulation accurately predicts the theoretical values of BER over the range of SNR from to .
Conflicts of Interest
The authors declare no conflict of interest.
Appendix 1
Appendix 2
Appendix 3
Figure A1.
Matched Filtering using Monte Carlo Simulation Demonstration for a 30 random bit sequence, with set to . Labels 1-6 show position of times scopes.
Figure A1.
Matched Filtering using Monte Carlo Simulation Demonstration for a 30 random bit sequence, with set to . Labels 1-6 show position of times scopes.
Appendix 4
Figure A2.
Simulation Demonstration of a 30 symbol input sequence with .
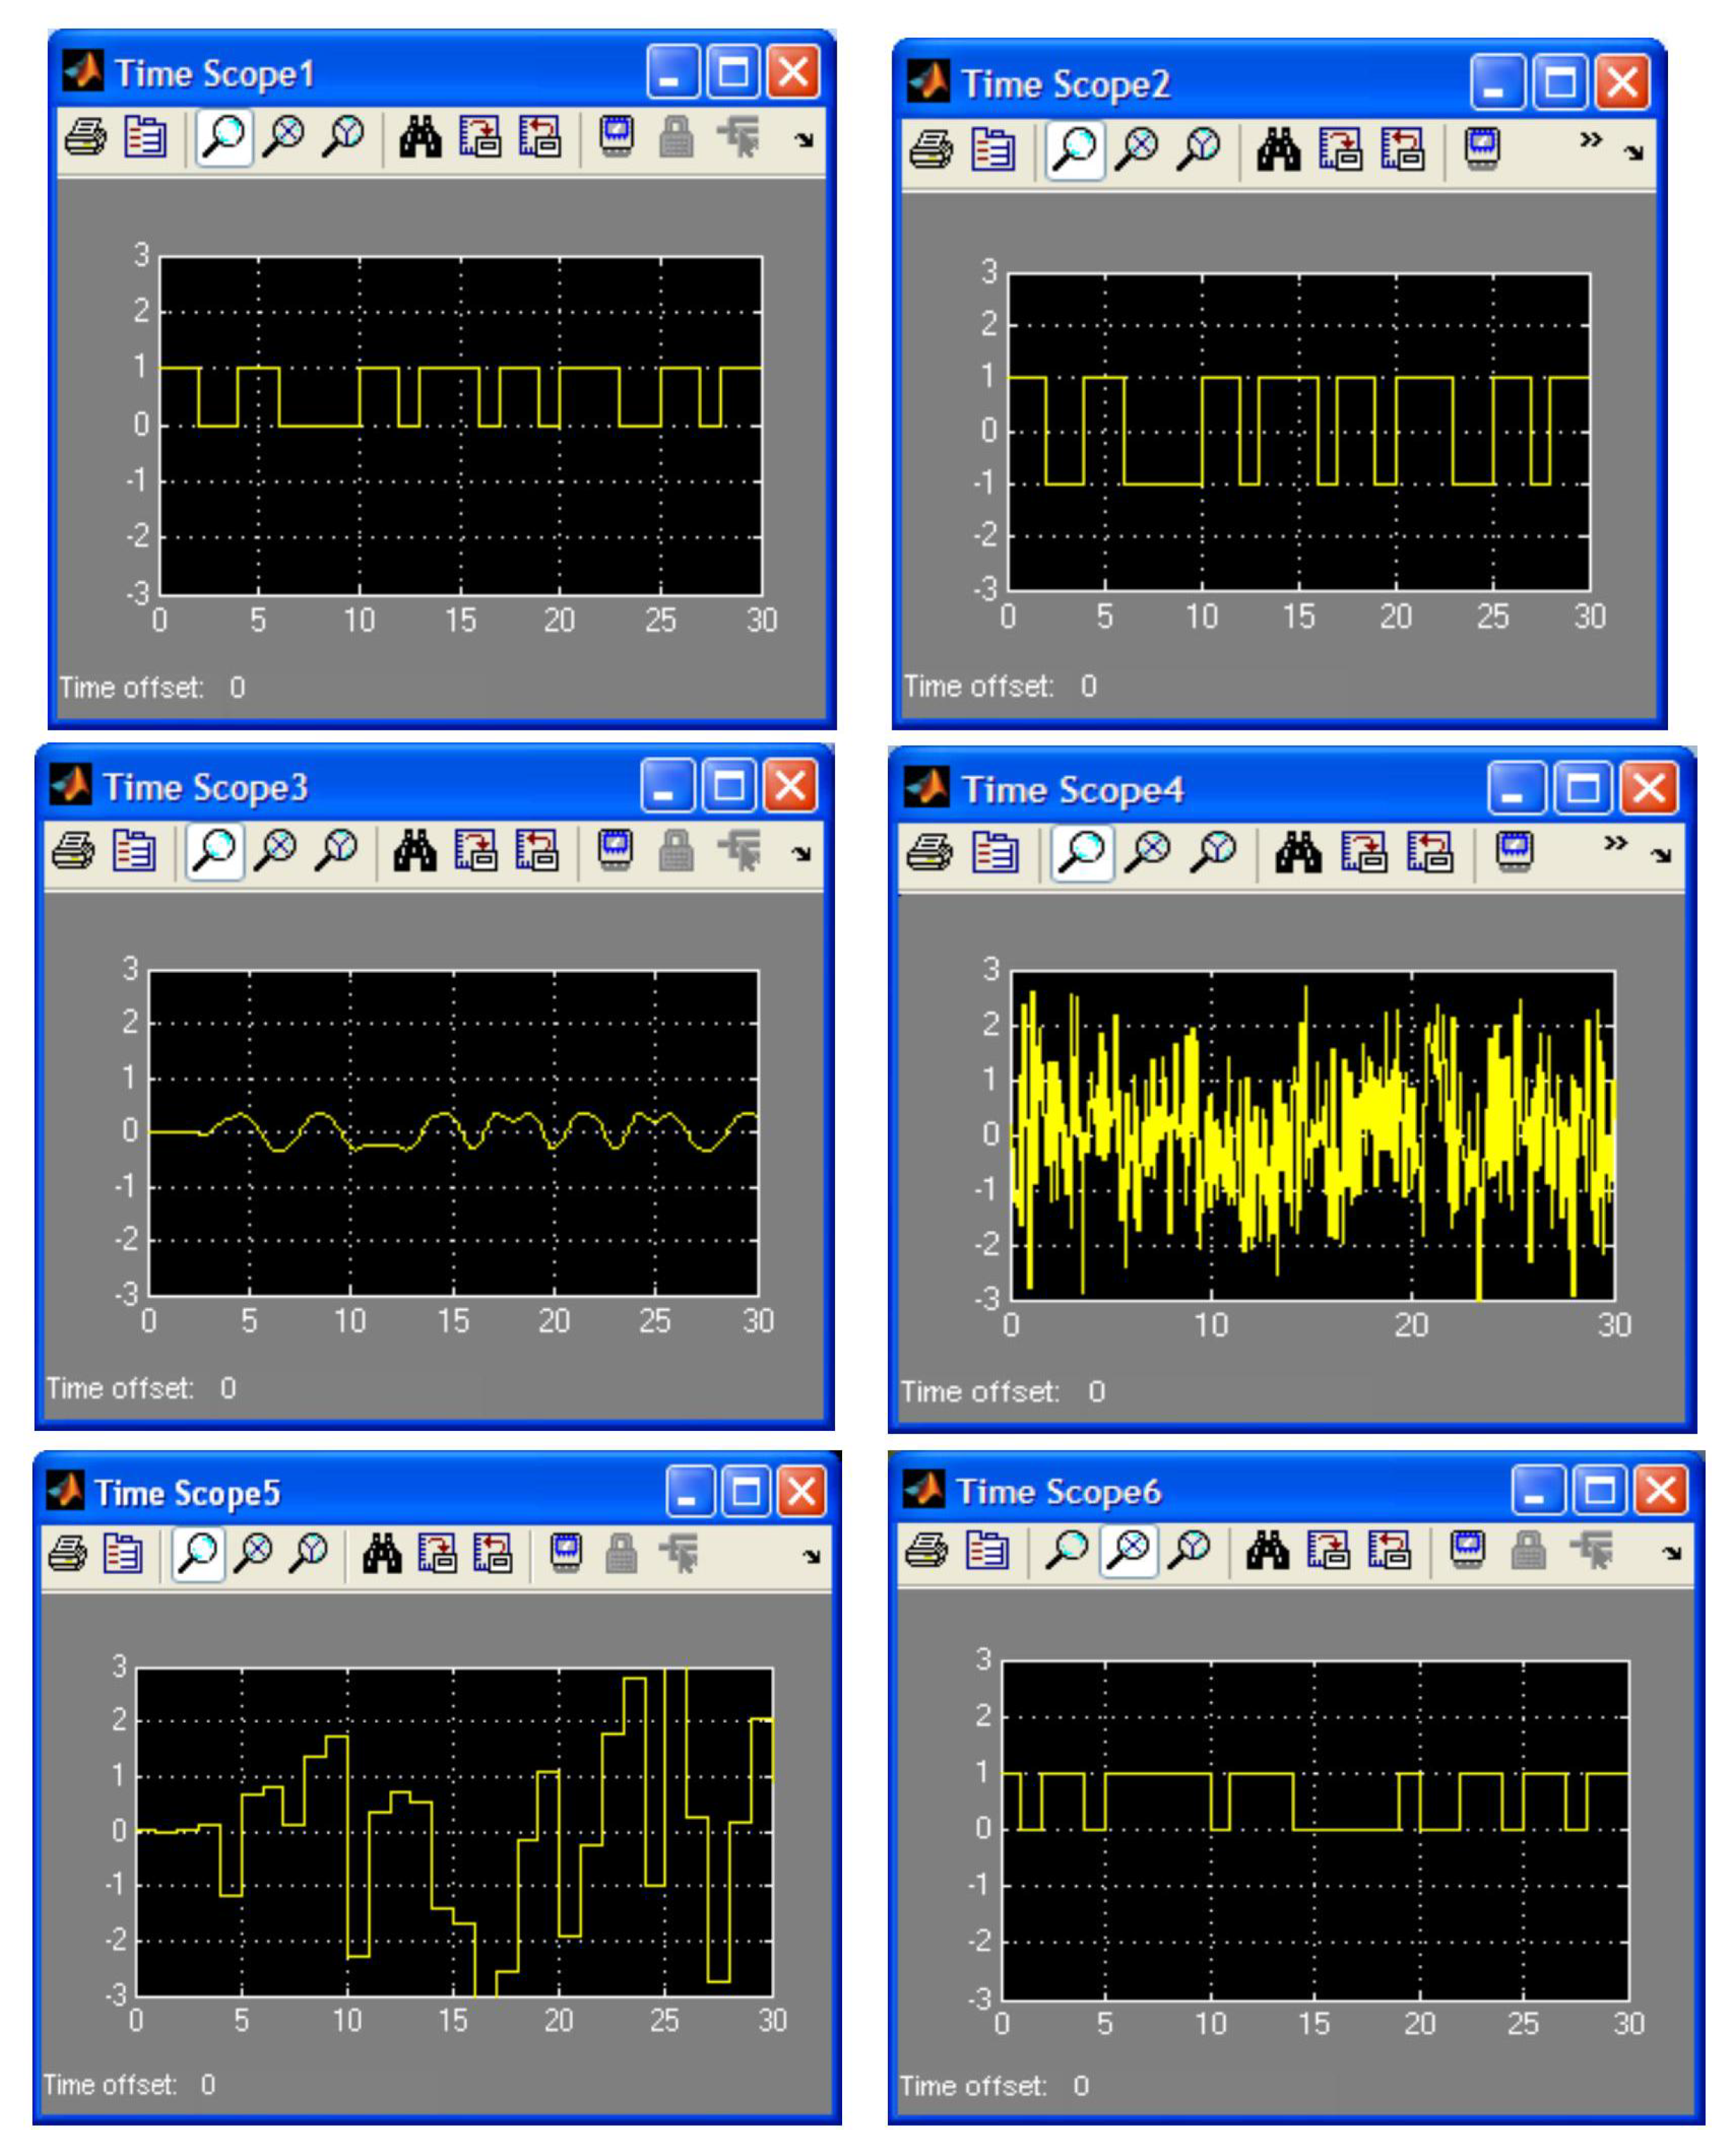
Time scope displays are taken at scope points as shown in Figure 8 respectively Input sequence Output sequence (after delay of 8 bits) Difference in input and output sequence shows 3 error bits in 23 bits giving
Appendix 5
Appendix 6
Figure A3.
SIMULINK eye diagram generator for Matched Filtering of Baseband Transmission.
Appendix 7
Figure A4.
MATLAB program generated eye diagrams after transmit filter and after receive filter with and .
Figure A4.
MATLAB program generated eye diagrams after transmit filter and after receive filter with and .
References
- Abu-Rgheff, M. A. Introduction to CDMA Wireless Communications (Academic Press, 2007).
- Sklar, B. Digital Communications: Fundamentals and Applications (Prentice Hall, 2001), 2nd edn.
- The MathWorks. Matlab documentation. http://www.mathworks.com/access/helpdesk/help/techdoc/matlab.shtml. Accessed: 2008-02-14.
- Cevrero, A. et al. Fast and accurate ber estimation methodology for i/o links based on extreme value theory. Proceedings -Design, Automation and Test in Europe, DATE 7, (2013). [CrossRef]
- Huo, Y. et al. Technology trends for massive mimo towards 6g. Sensors 23, 7, (2023). [CrossRef]
- Wang, Z. et al. A tutorial on extremely large-scale mimo for 6g: Fundamentals, signal processing, and applications. arXiv preprint arXiv:2307.07340, 39, (2023). [CrossRef]
- Lei, H. et al. Near-field user localization and channel estimation for xl-mimo systems: Fundamentals, recent advances, and outlooks. arXiv preprint arXiv:2407.10147, 9, (2024). [CrossRef]
- Dong, J. Estimation of Bit Error Rate of any digital Communication System. Theses, Télécom Bretagne, Université de Bretagne Occidentale (2013).
- Molisch, A. F. Wireless Communications (Wiley-IEEE Press, 2011), 2nd edn.
- Saadat, A., Salman, M. & Saadat, H. Matched filter based timing synchronization for orthogonal frequency division multiplexing systems. In Proceedings of the 2013 IEEE 8th Conference on Industrial Electronics and Applications (ICIEA), 1157–1161, (IEEE, 2013). [CrossRef]
- Shahi, S. N. Analysis and Mitigation of the Nonlinear Impairments in Fiber-Optic Communication Systems. Ph.d. thesis, McMaster University, Hamilton, Ontario, Canada (2013). Supervisor: Dr. Shiva Kumar.
- Mestoui, J., Ghzaoui, M. E., Elaage, S., Hmamou, A. & Foshi, J. Ce-ofdm-cdma phase modulation for 5g system. International Journal of Mathematical, Engineering and Management Sciences 6, 1100–1114, (2021). [CrossRef]
- Proakis, J. & Salehi, M. Digital Communications (McGraw-Hill Education, 2007), 5th edn.
- Liberti, J. C. & Rappaport, T. S. Smart Antennas for Wireless Communications: IS-95 and Third Generation CDMA Applications (Prentice Hall PTR, 1999), 1st edn.
- Aadithya, K., Ray, S. & Roychowdhury, J. Bee: Predicting realistic worst case and stochastic eye diagrams by accounting for correlated bitstreams and coding strategies. In Proceedings of the Asia and South Pacific Design Automation Conference (ASPDAC), 366–371, (2015). [CrossRef]
- Hall, T., Delport, J. & Fourie, C. Determination of the bit error rate due to thermal noise using josim superconducting circuit simulator and the monte carlo method. IEEE Transactions on Applied Superconductivity PP, 1–5, (2023). [CrossRef]
- Rindhe, B., Digge, J. & Narayankhedkar, S. Modeling of ofdm based system with optical components for bw reconfiguration. International Journal of Computer Applications 14–20 (2014).
- Giannakopoulos, G. Low Power Modem Design: A guidance to use novel algorithms (QPSK) and digital filters (FIR, IIR) with MATLAB, SIMULINK with VHDL and Xilinx FPGA (LAP LAMBERT Academic Publishing, 2015), 1st edn.
- Güvenkaya, E. & Arslan, H. Frequency domain eye diagram for ofdm. In Conference Paper, (2013). [CrossRef]
- Yadav, S., Kumar, P., Singh, R., Raj, V. & Pradhan, D. Comparative analysis of ber and papr for ofdm, ofdm-cdma, ofdm-mc-cdma & ofdm-idma systems. International Journal of Electronics and Communication Engineering 10, 456–462 (2021).
- Saadat, A., Salman, M., Ajaz, M. & Islam, M. U. Matched filter based timing and frequency synchronization for multiple input multiple output orthogonal frequency division multiplexing systems. Wireless Personal Communications 82, (2015). [CrossRef]
- Rindhe, B., Digge, J. & Narayankhedkar, S. Implementation of optical ofdm based system for optical networks. International Journal of Electrical and Computer Engineering (IJECE) vol. 4, page 767–781 (2014).
Figure 1.
Baseband binary simulation.
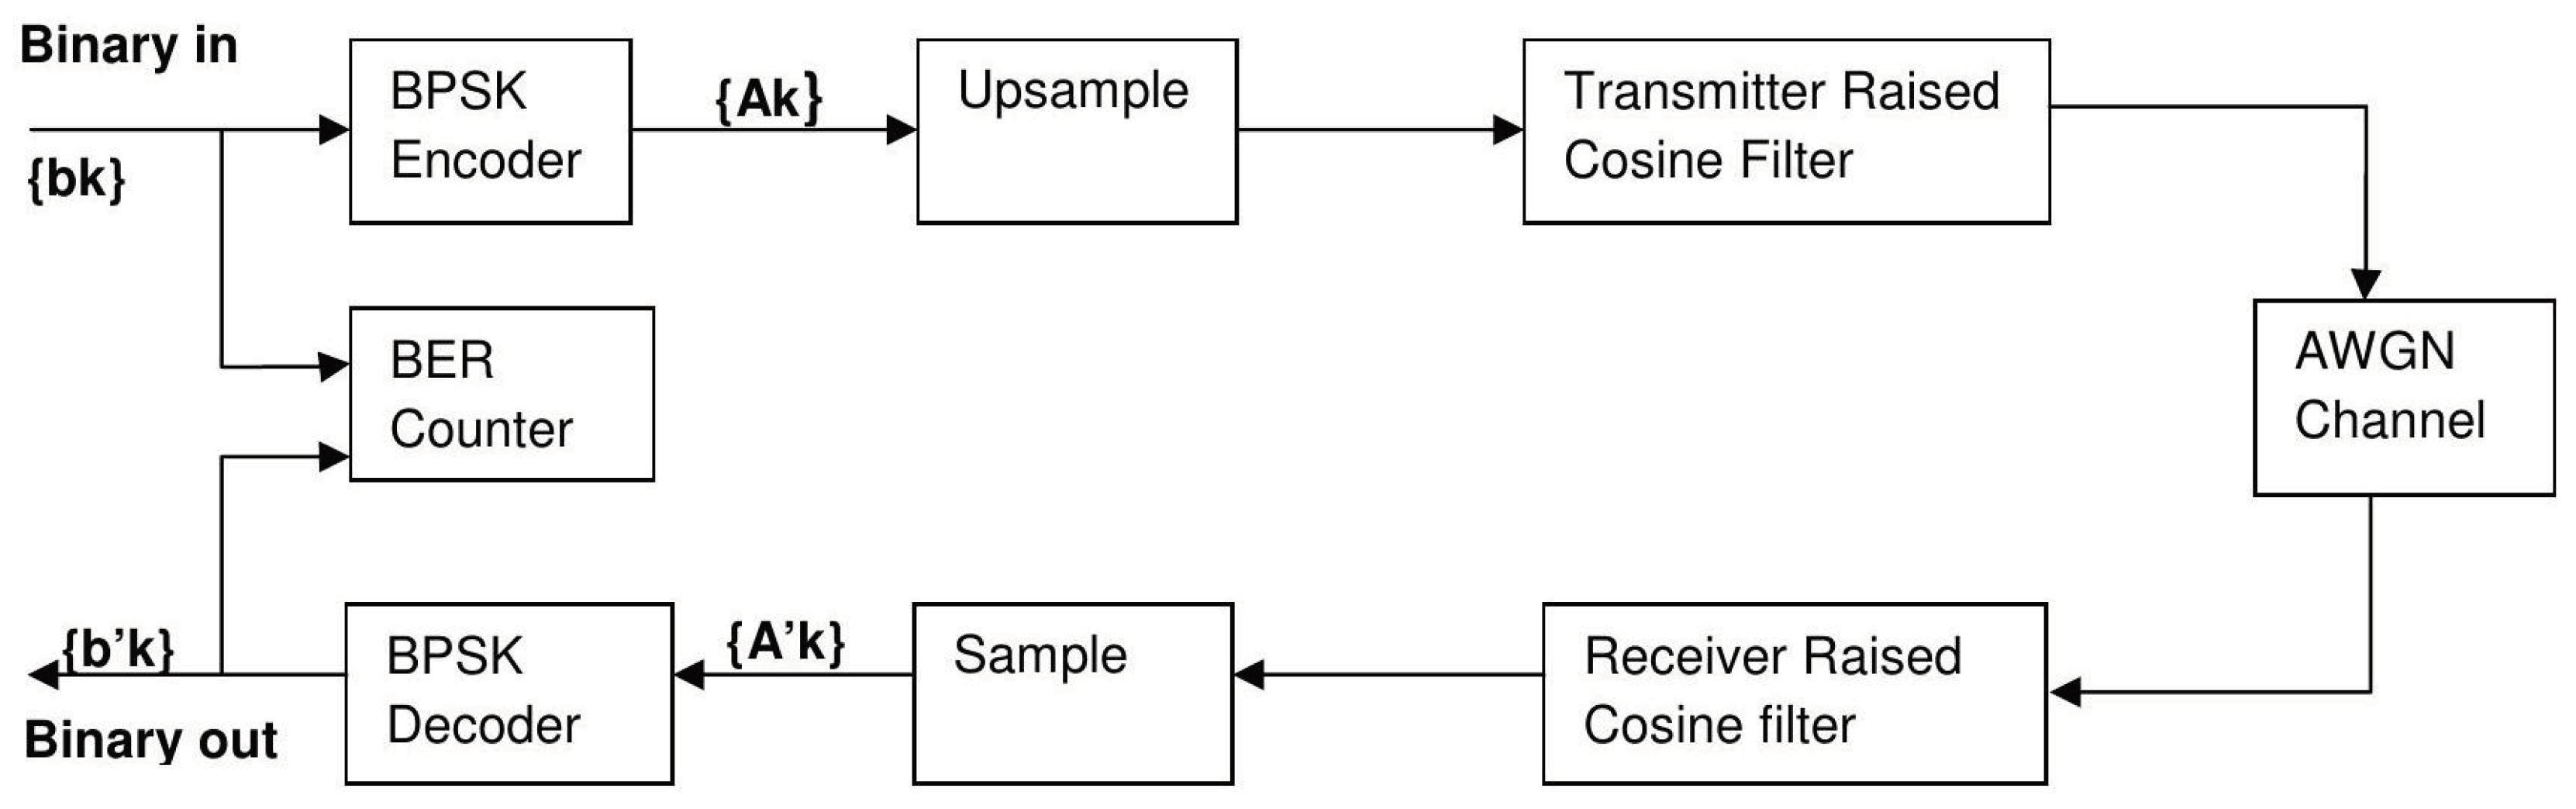
Figure 2.
Impulse response of a raised cosine filter.
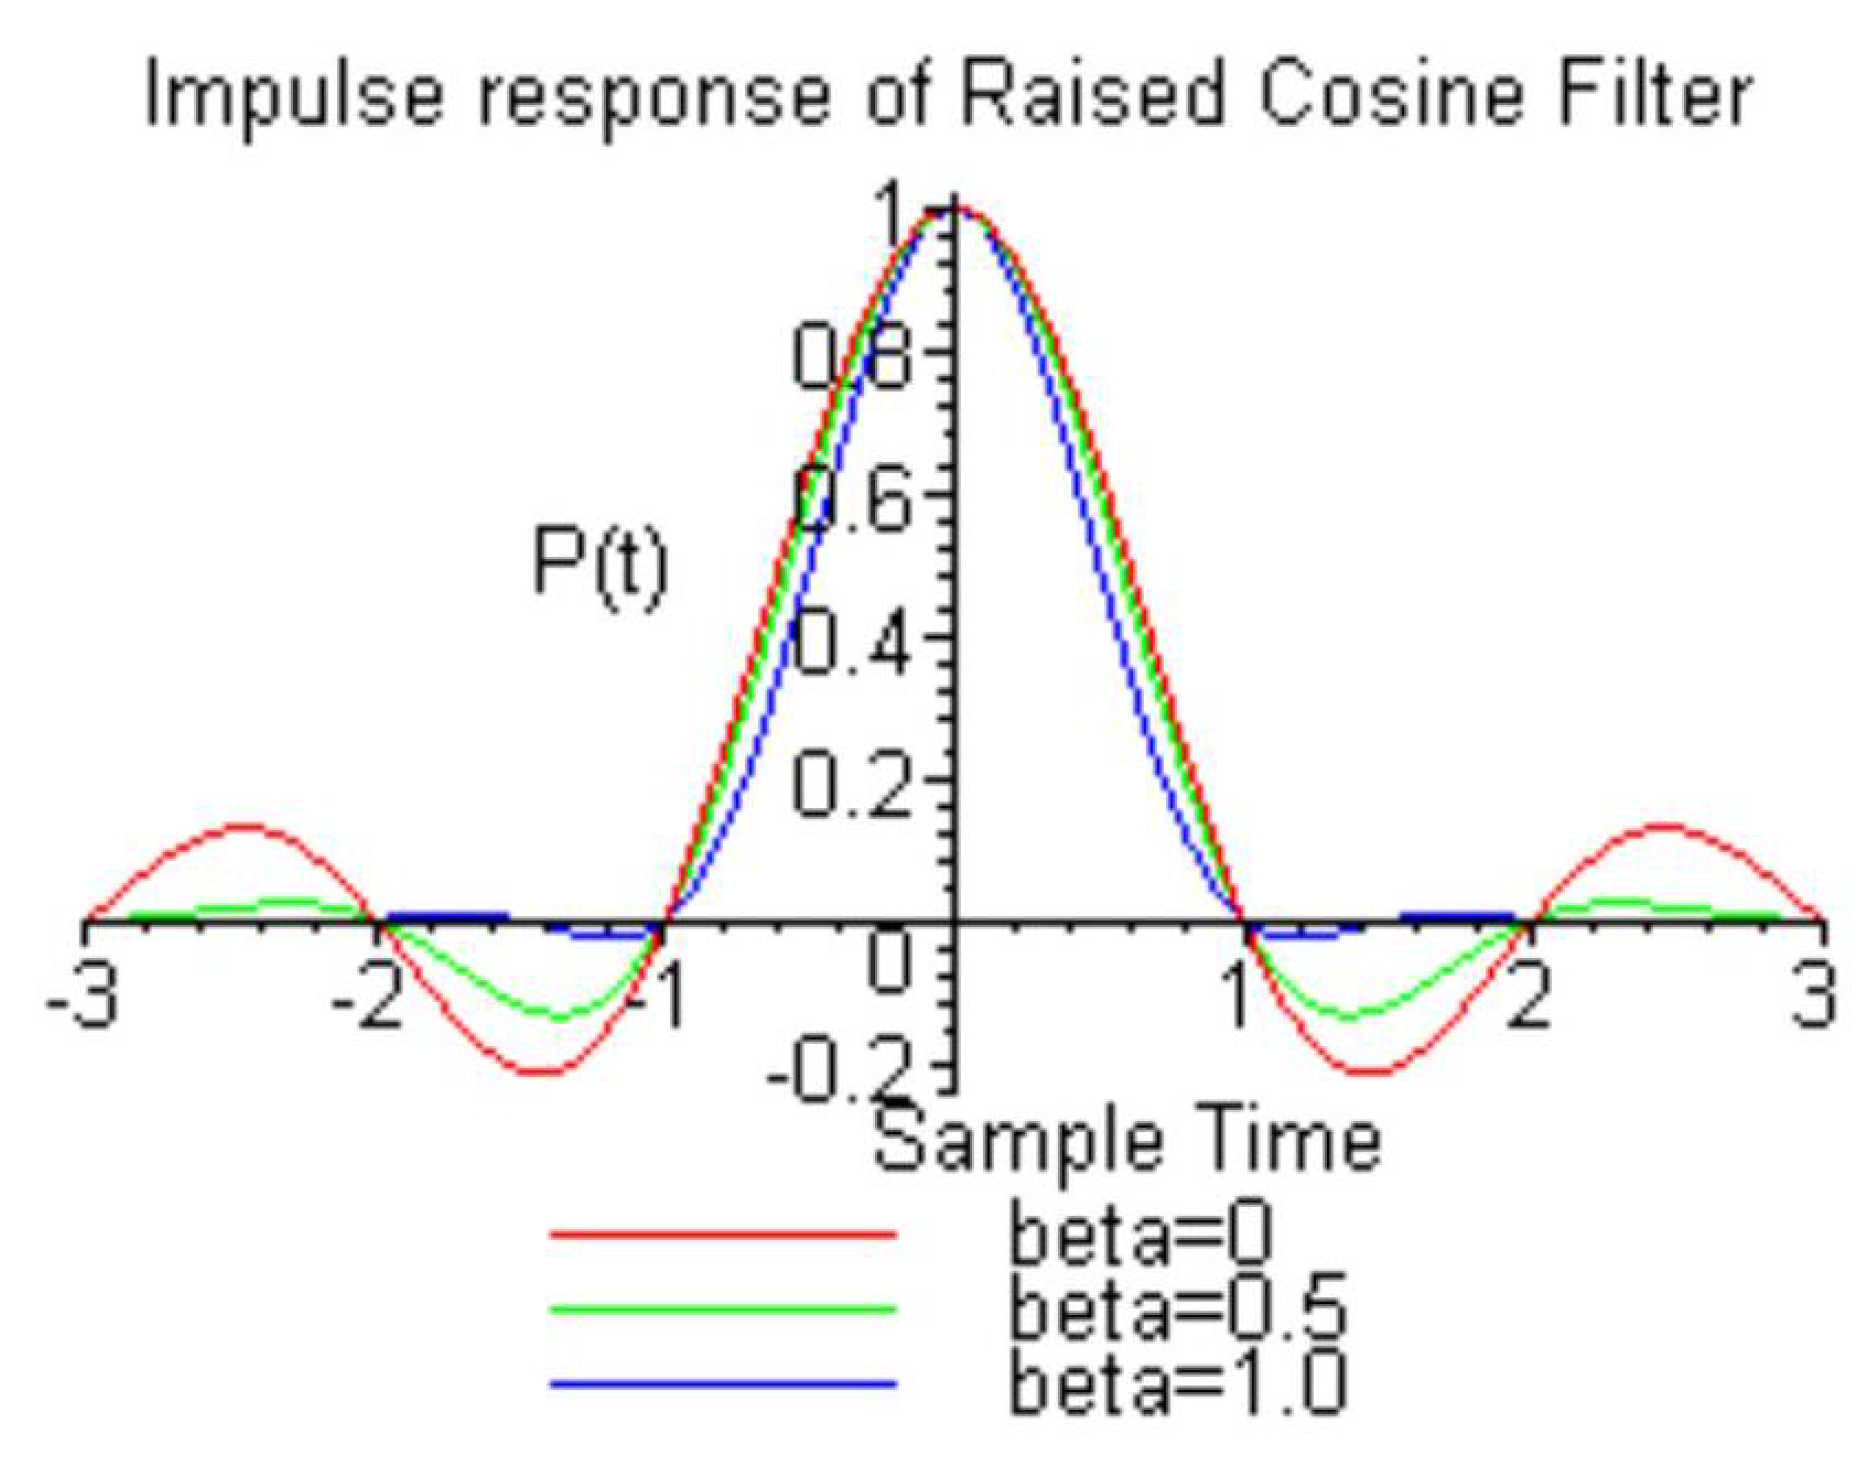
Figure 3.
Square root raised cosine transmitted data (roll off factor ) compared with message data (shifted by a delay factor 4 symbols).
Figure 3.
Square root raised cosine transmitted data (roll off factor ) compared with message data (shifted by a delay factor 4 symbols).
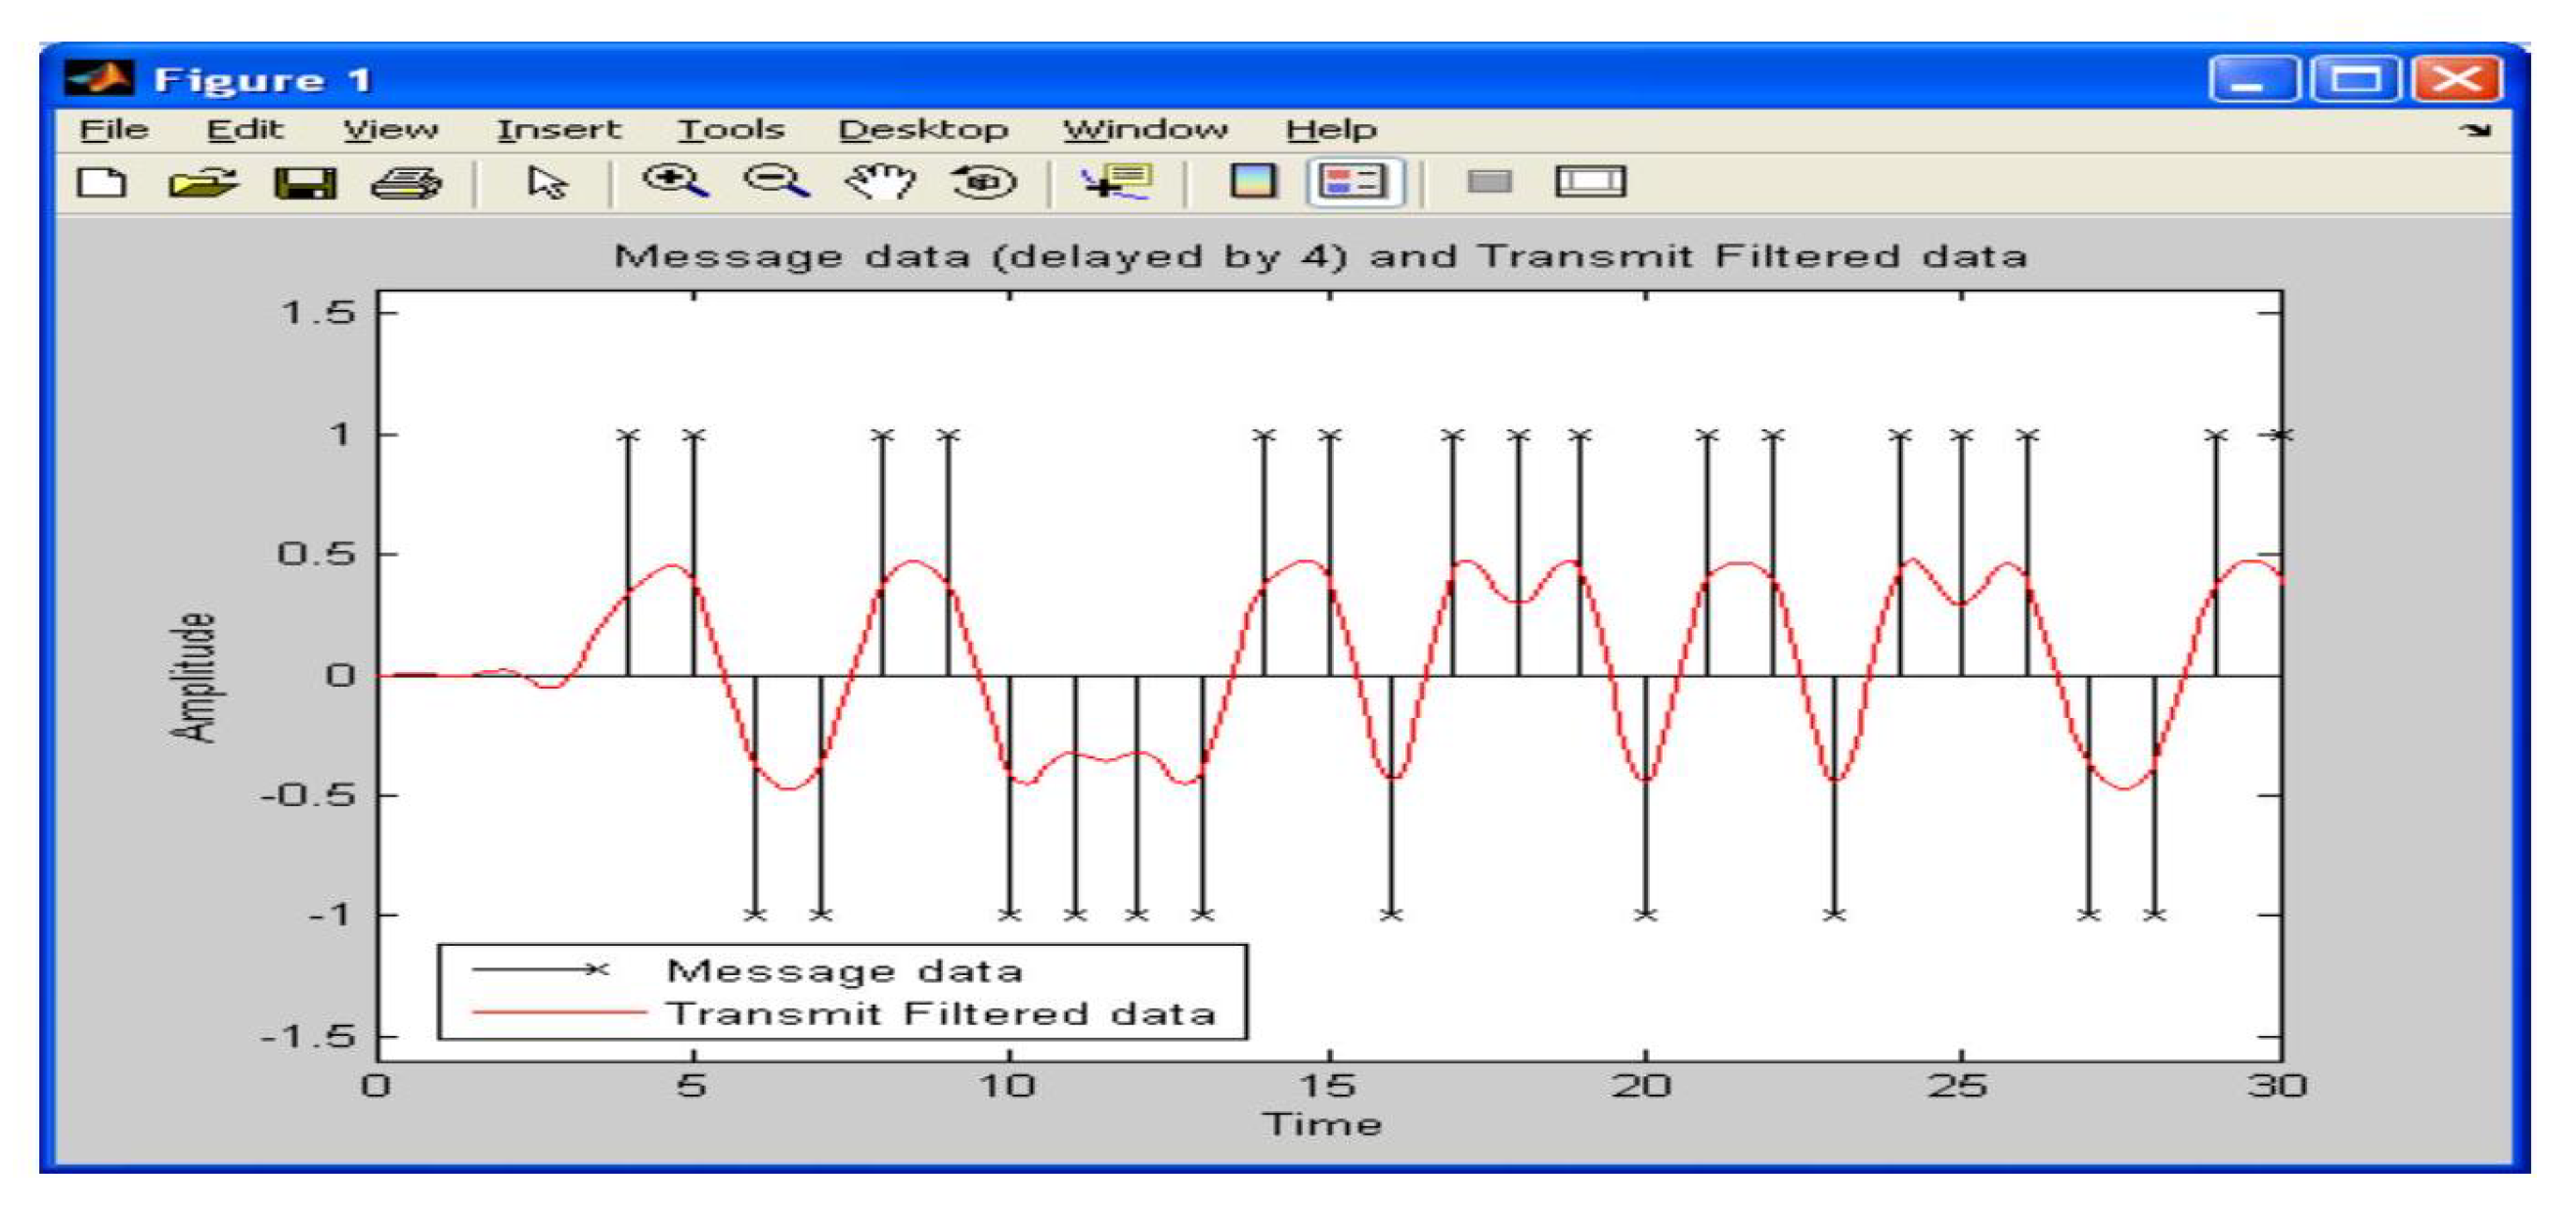
Figure 4.
Square root raised cosine received data (roll off factor ) compared with message data (shifted by a delay factor of 8 symbols).
Figure 4.
Square root raised cosine received data (roll off factor ) compared with message data (shifted by a delay factor of 8 symbols).
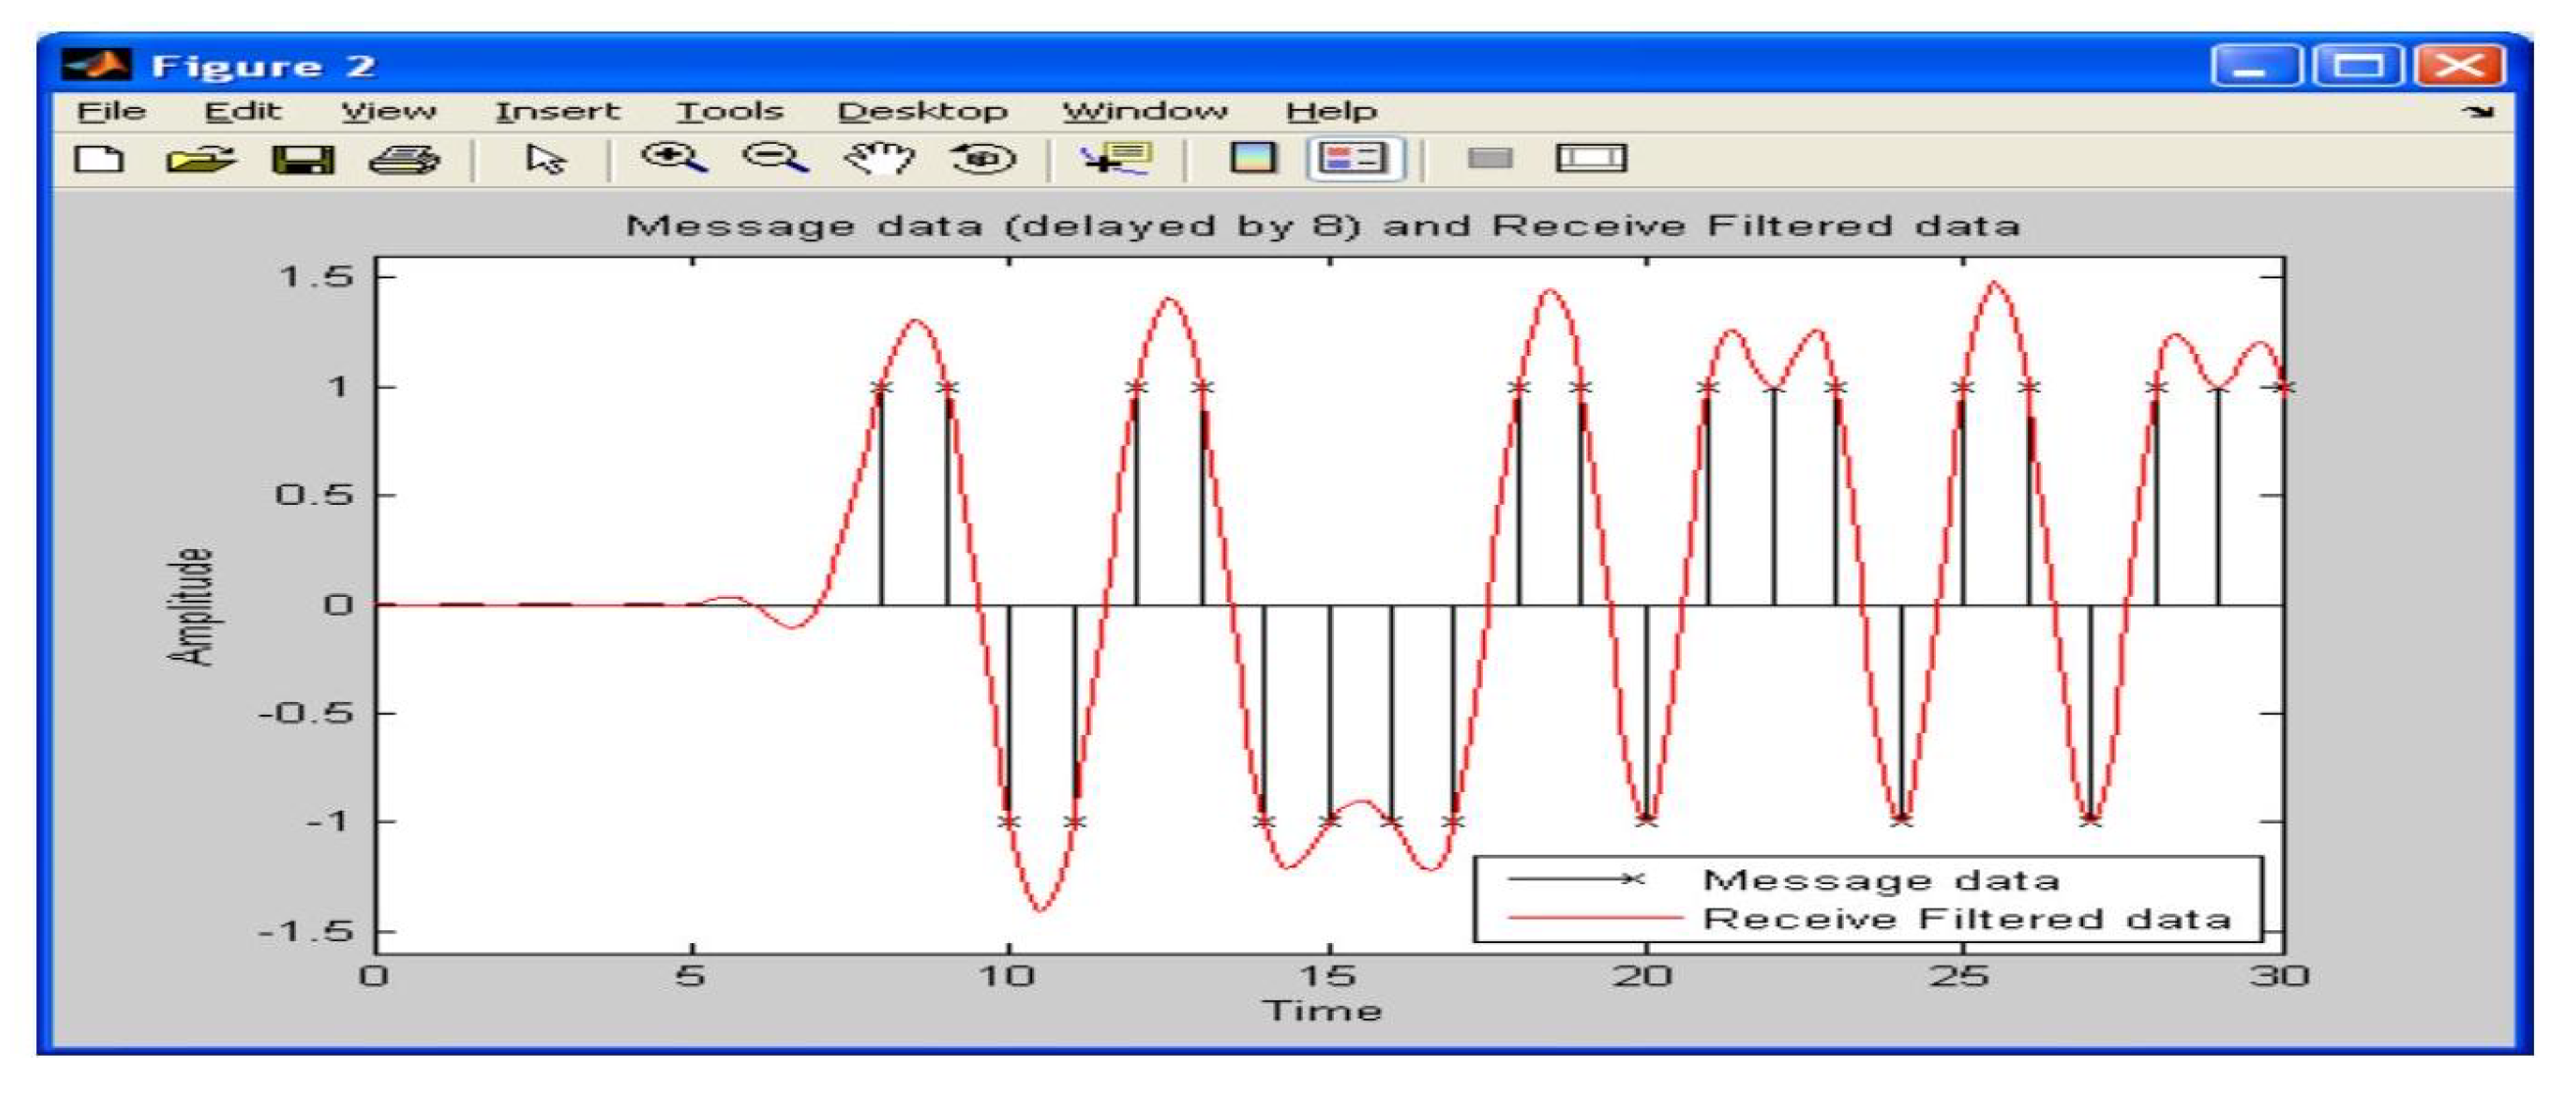
Figure 5.
Diagram of a Matched filter.
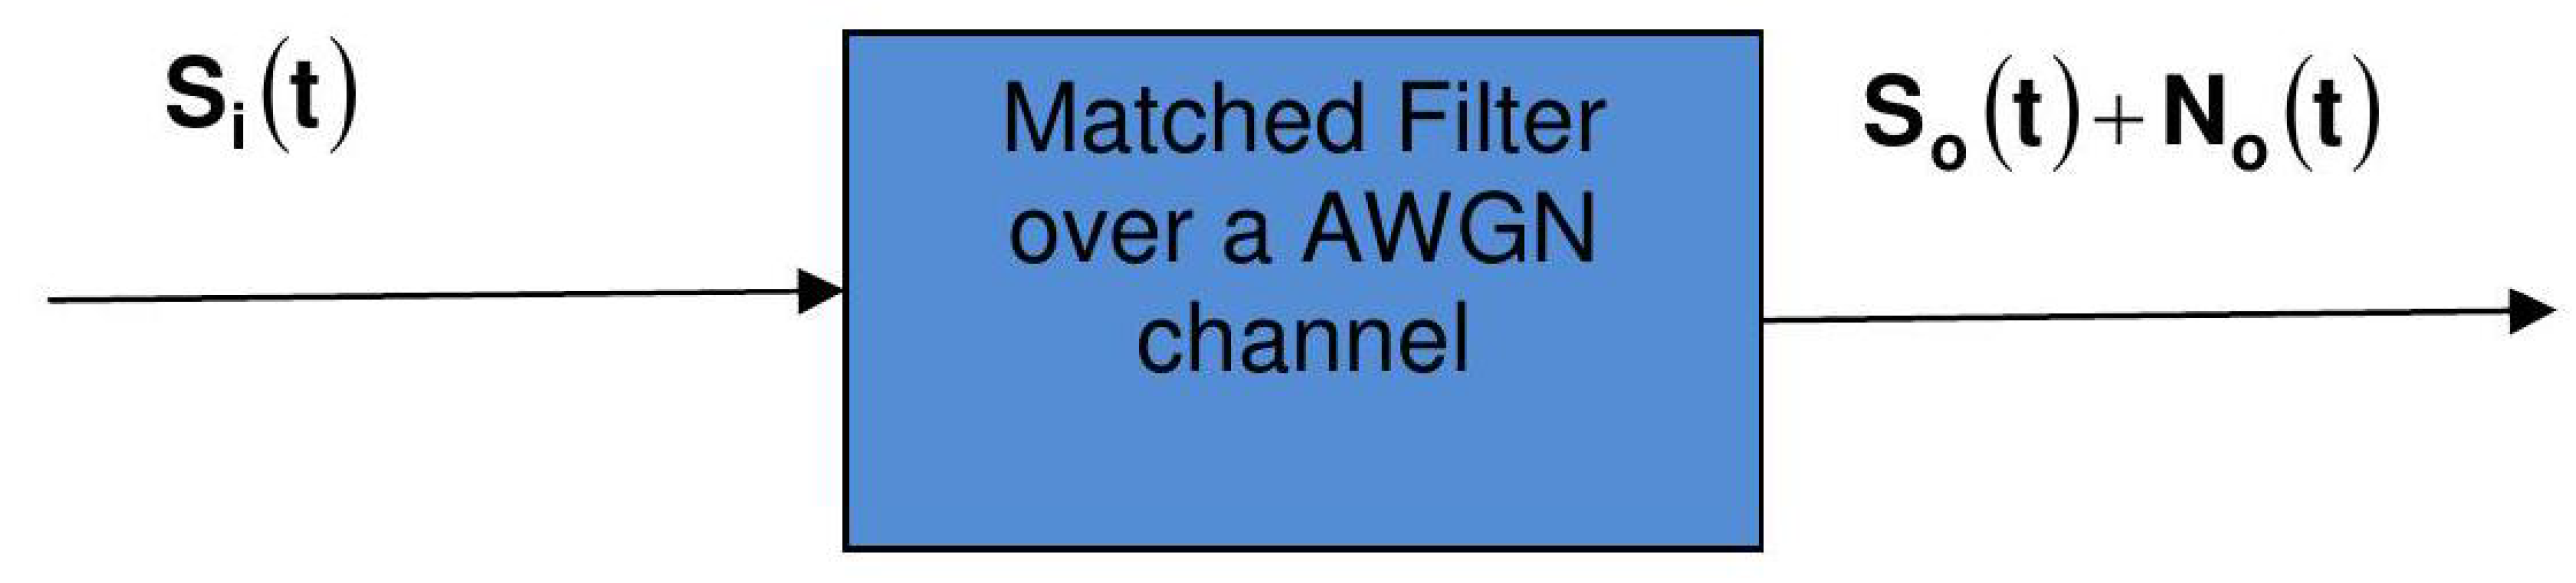
Figure 6.
Gaussian distribution.
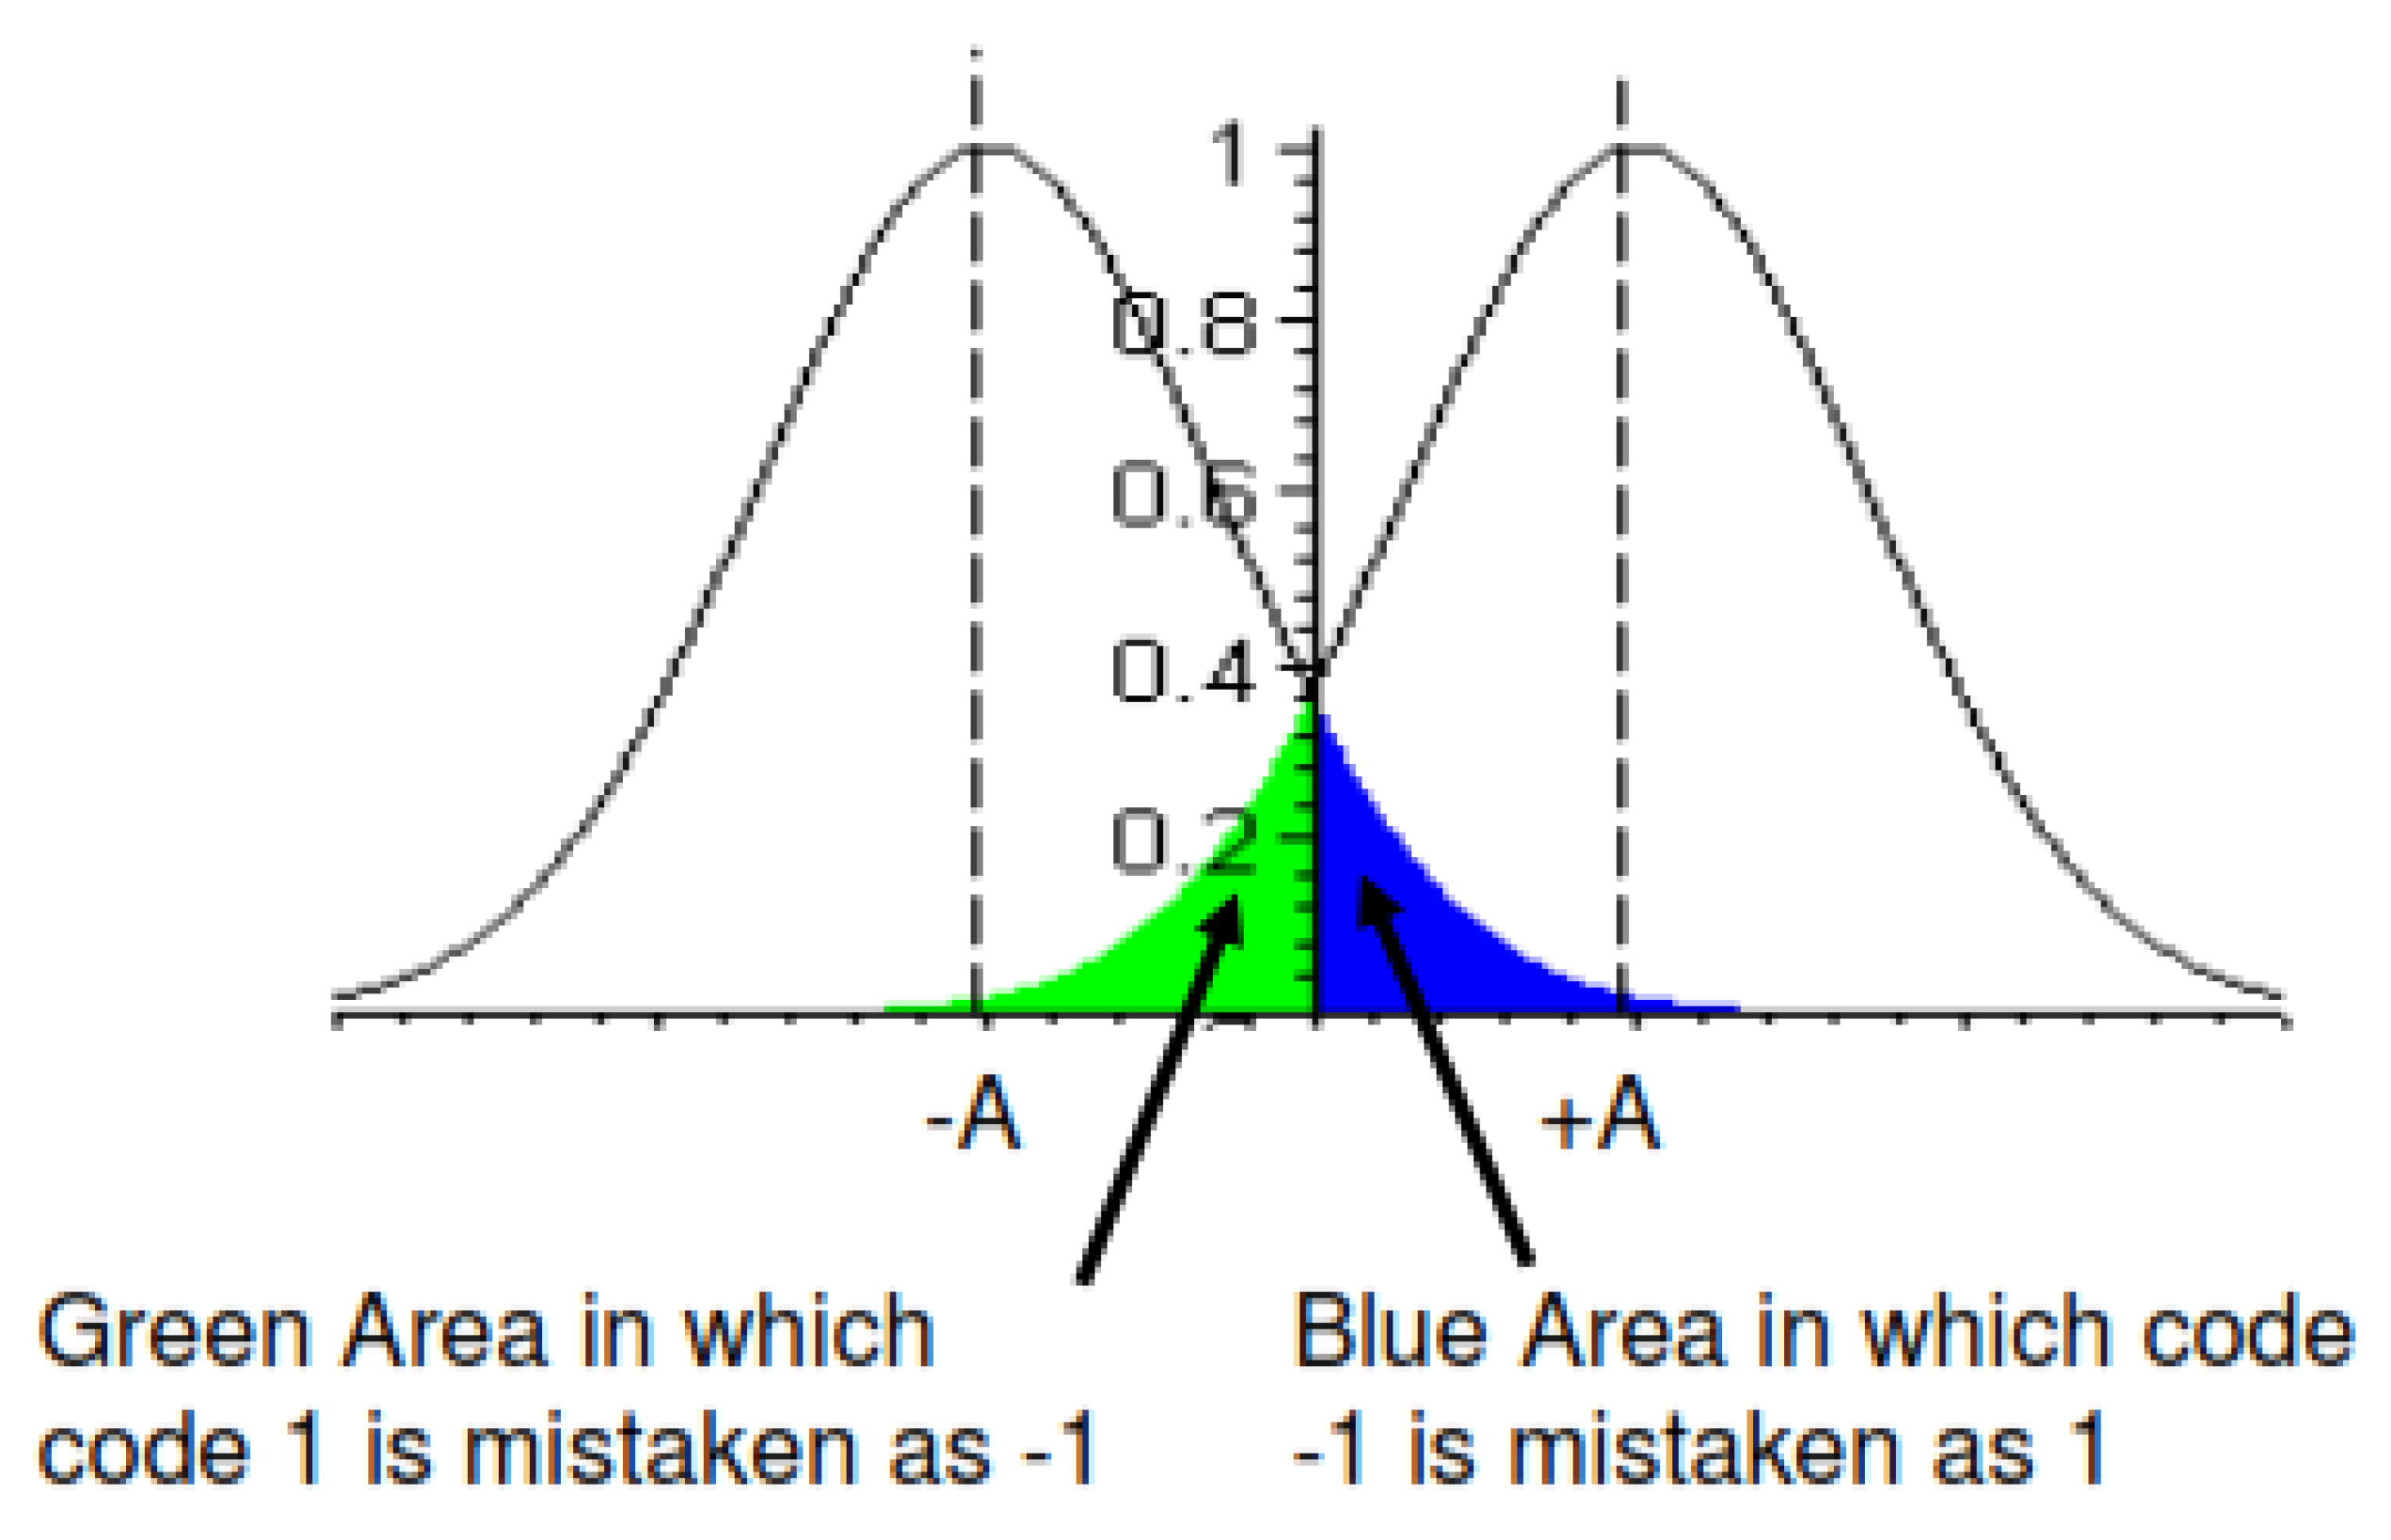
Figure 7.
Matched Filtering using Monte Carlo Simulation Demonstration for a 50000 random bit sequence, with set to .
Figure 7.
Matched Filtering using Monte Carlo Simulation Demonstration for a 50000 random bit sequence, with set to .
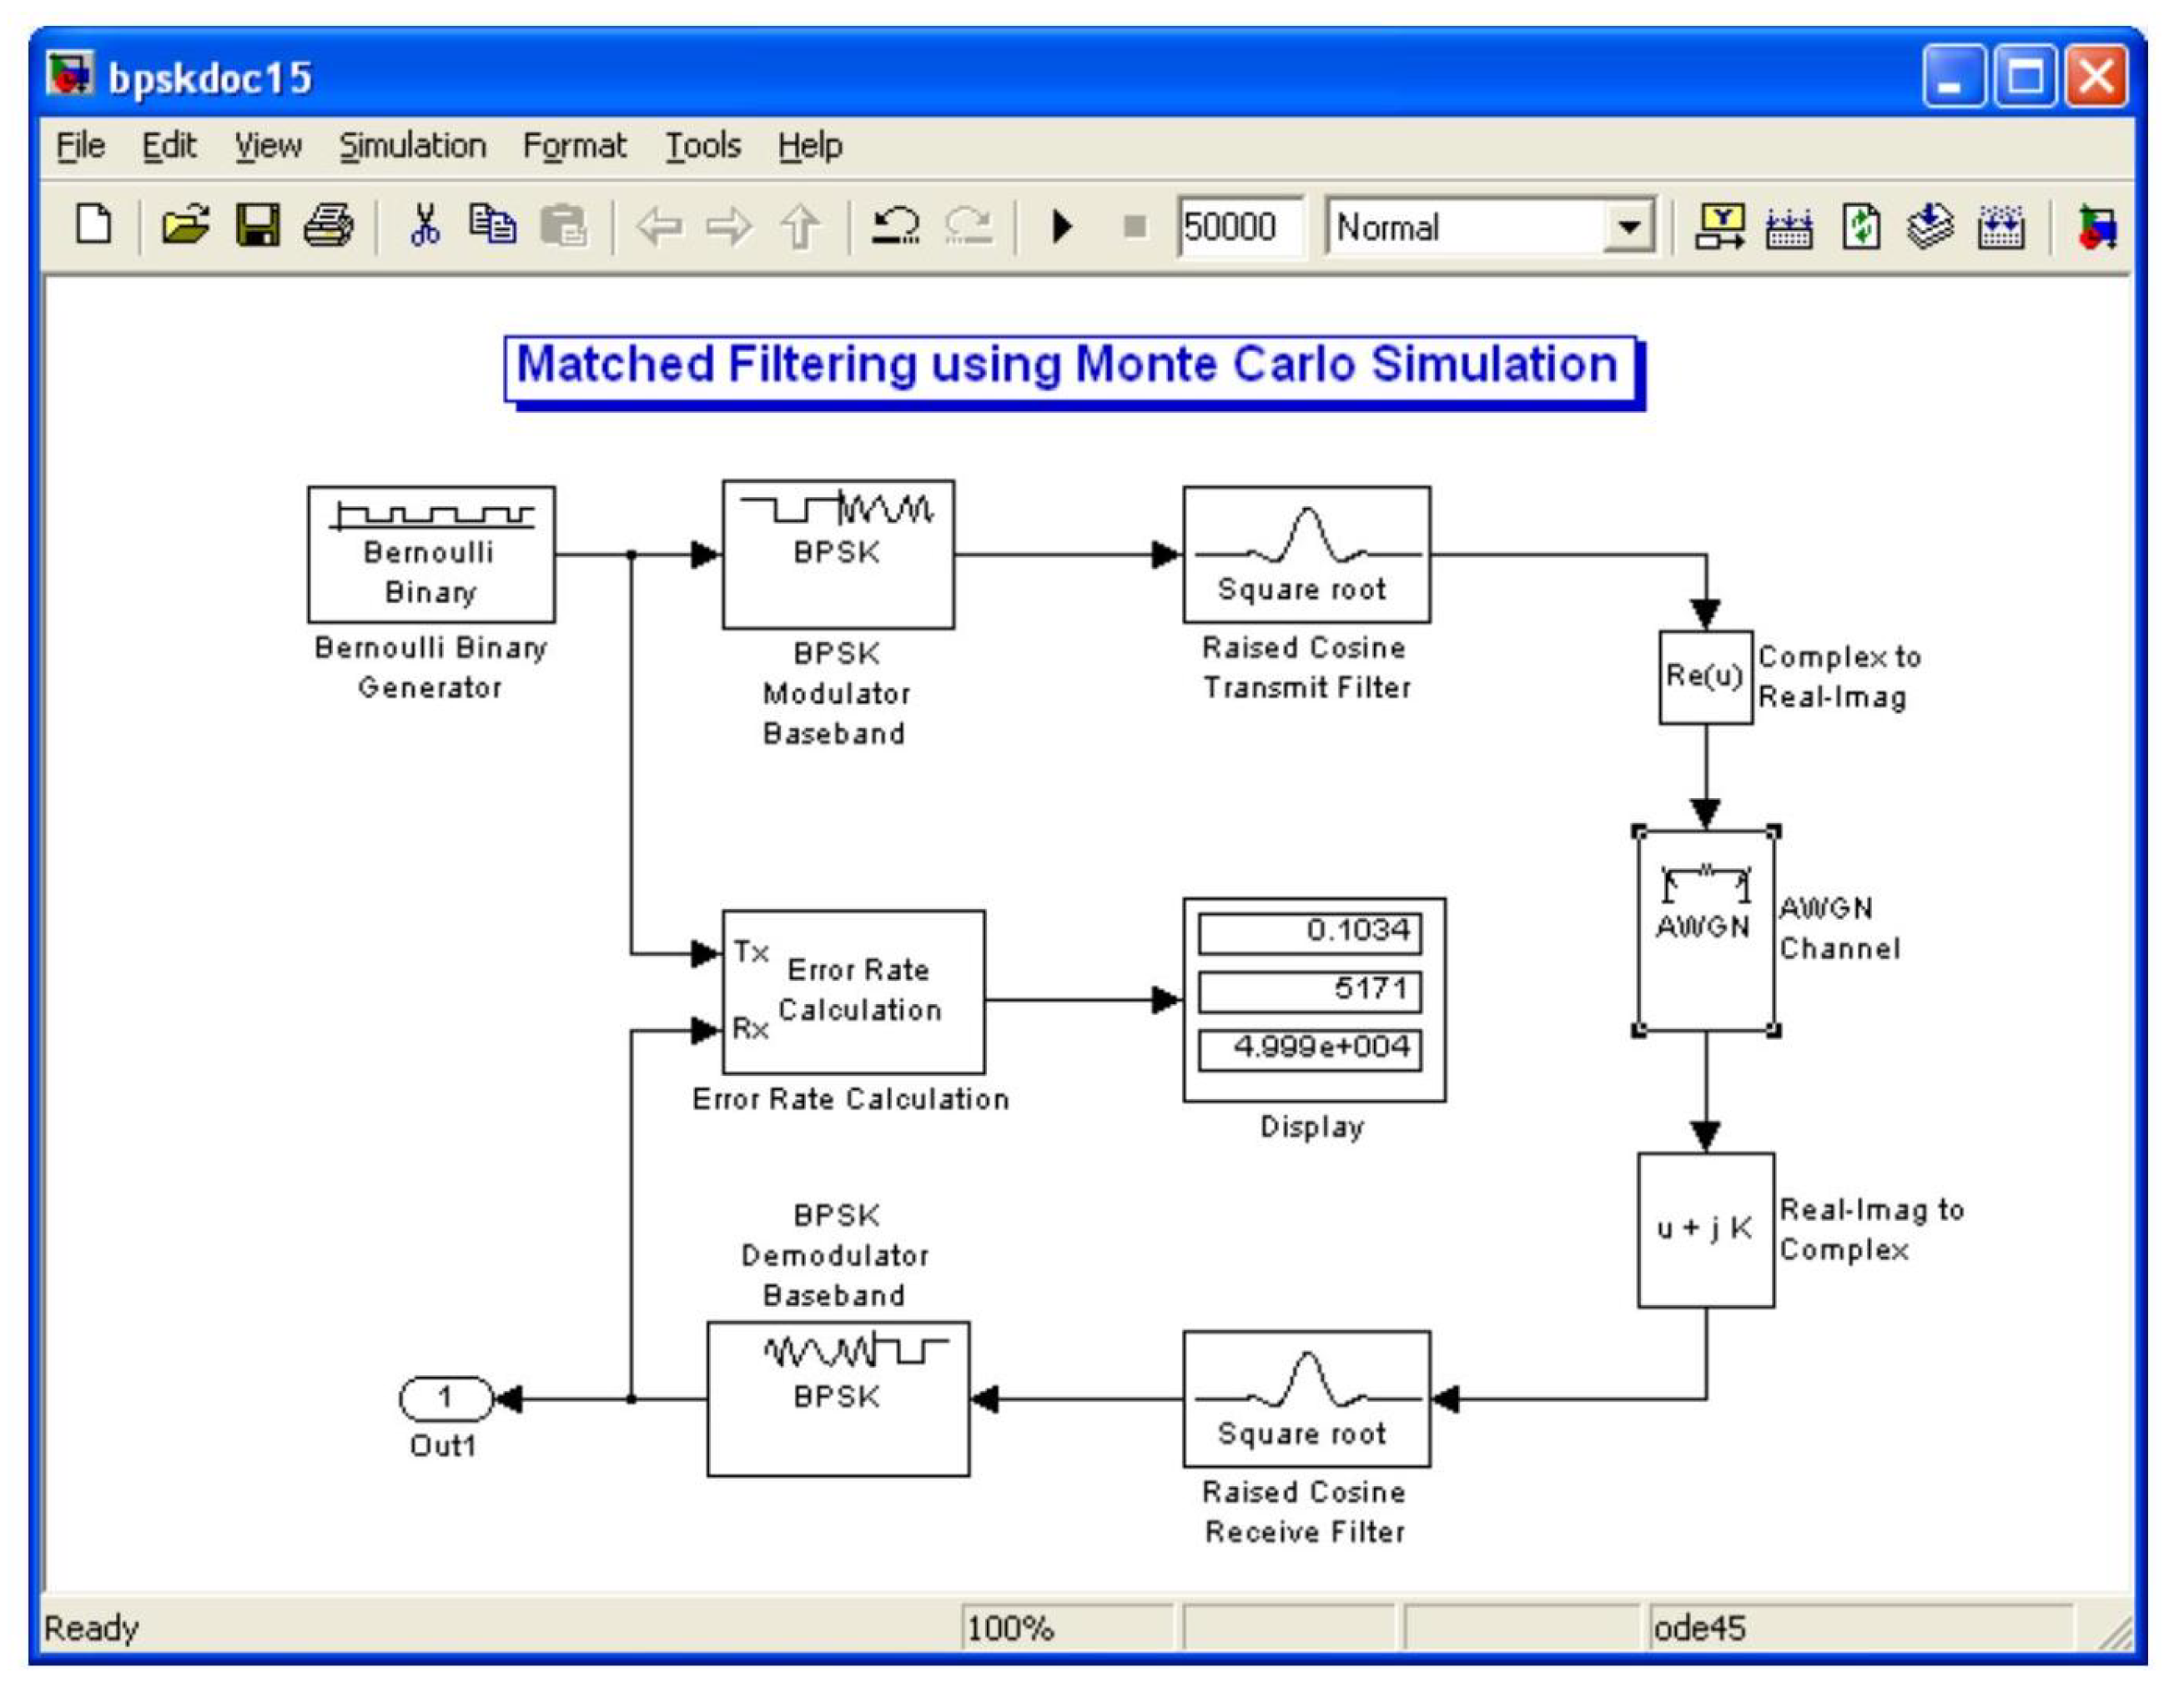
Figure 8.
Experimental and Theoretical BER versus SNR (dB).
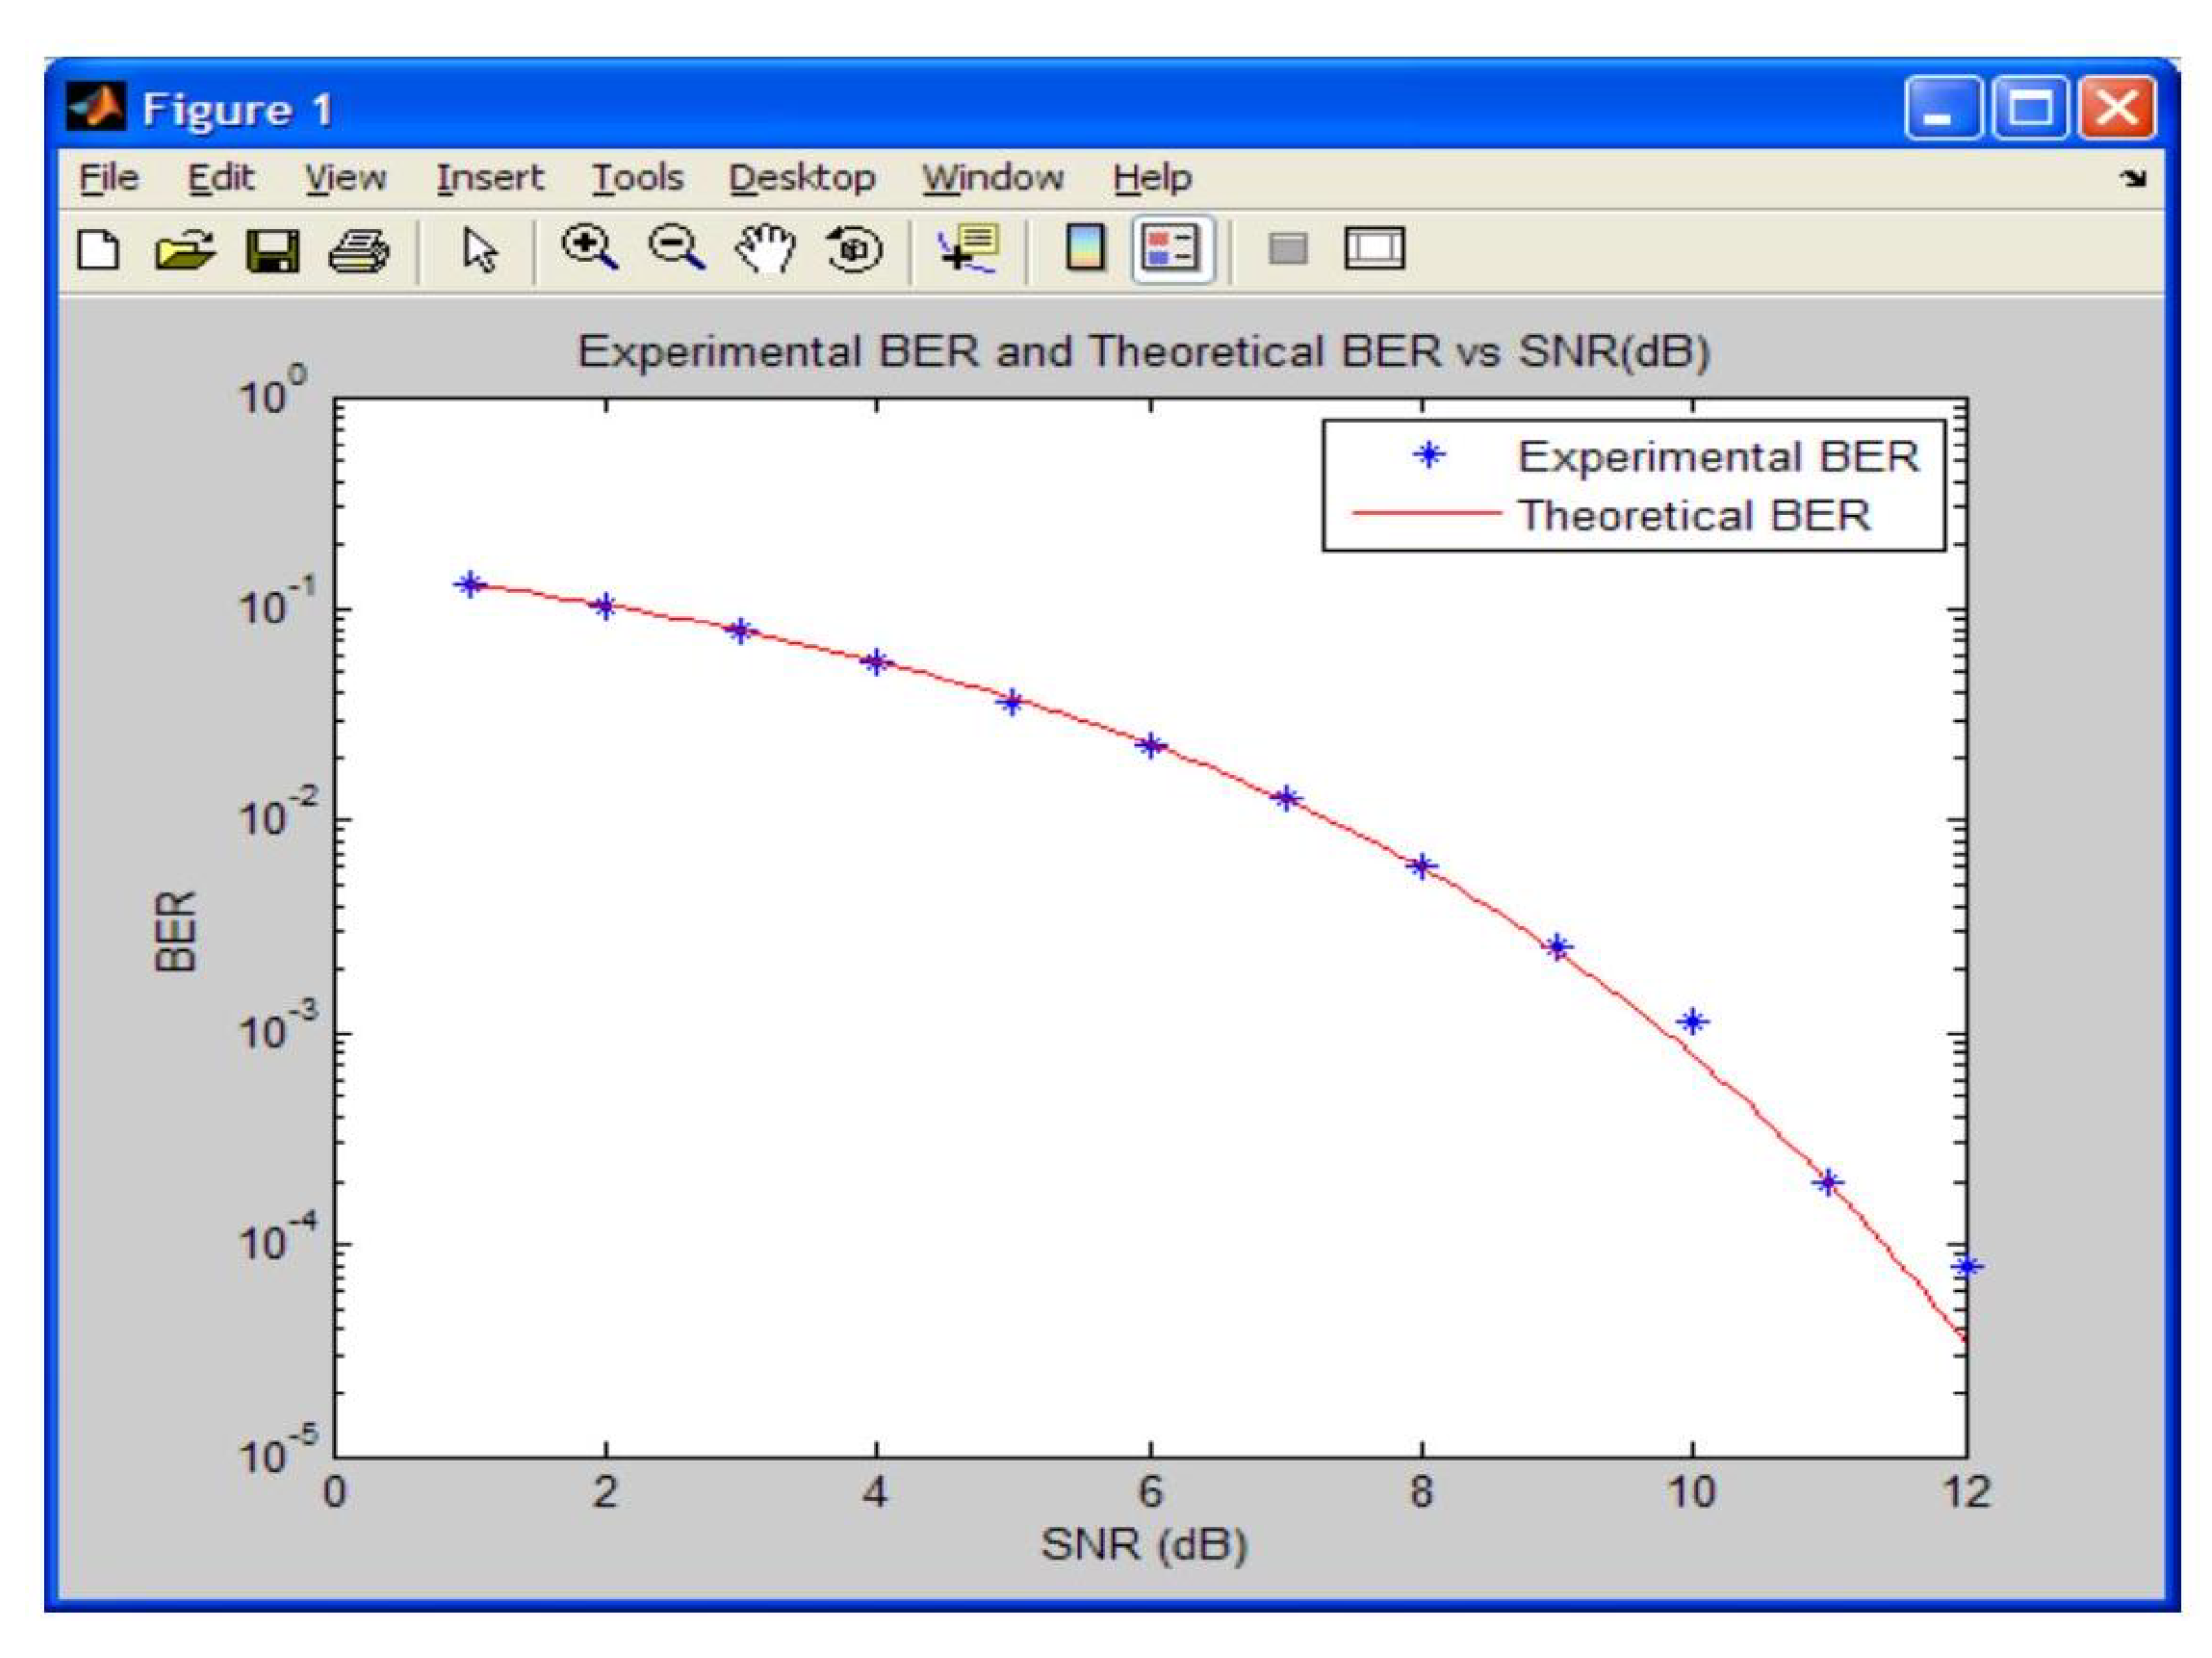
Figure 9.
Tabulated Experimental and Theoretical BER versus SNR (dB).
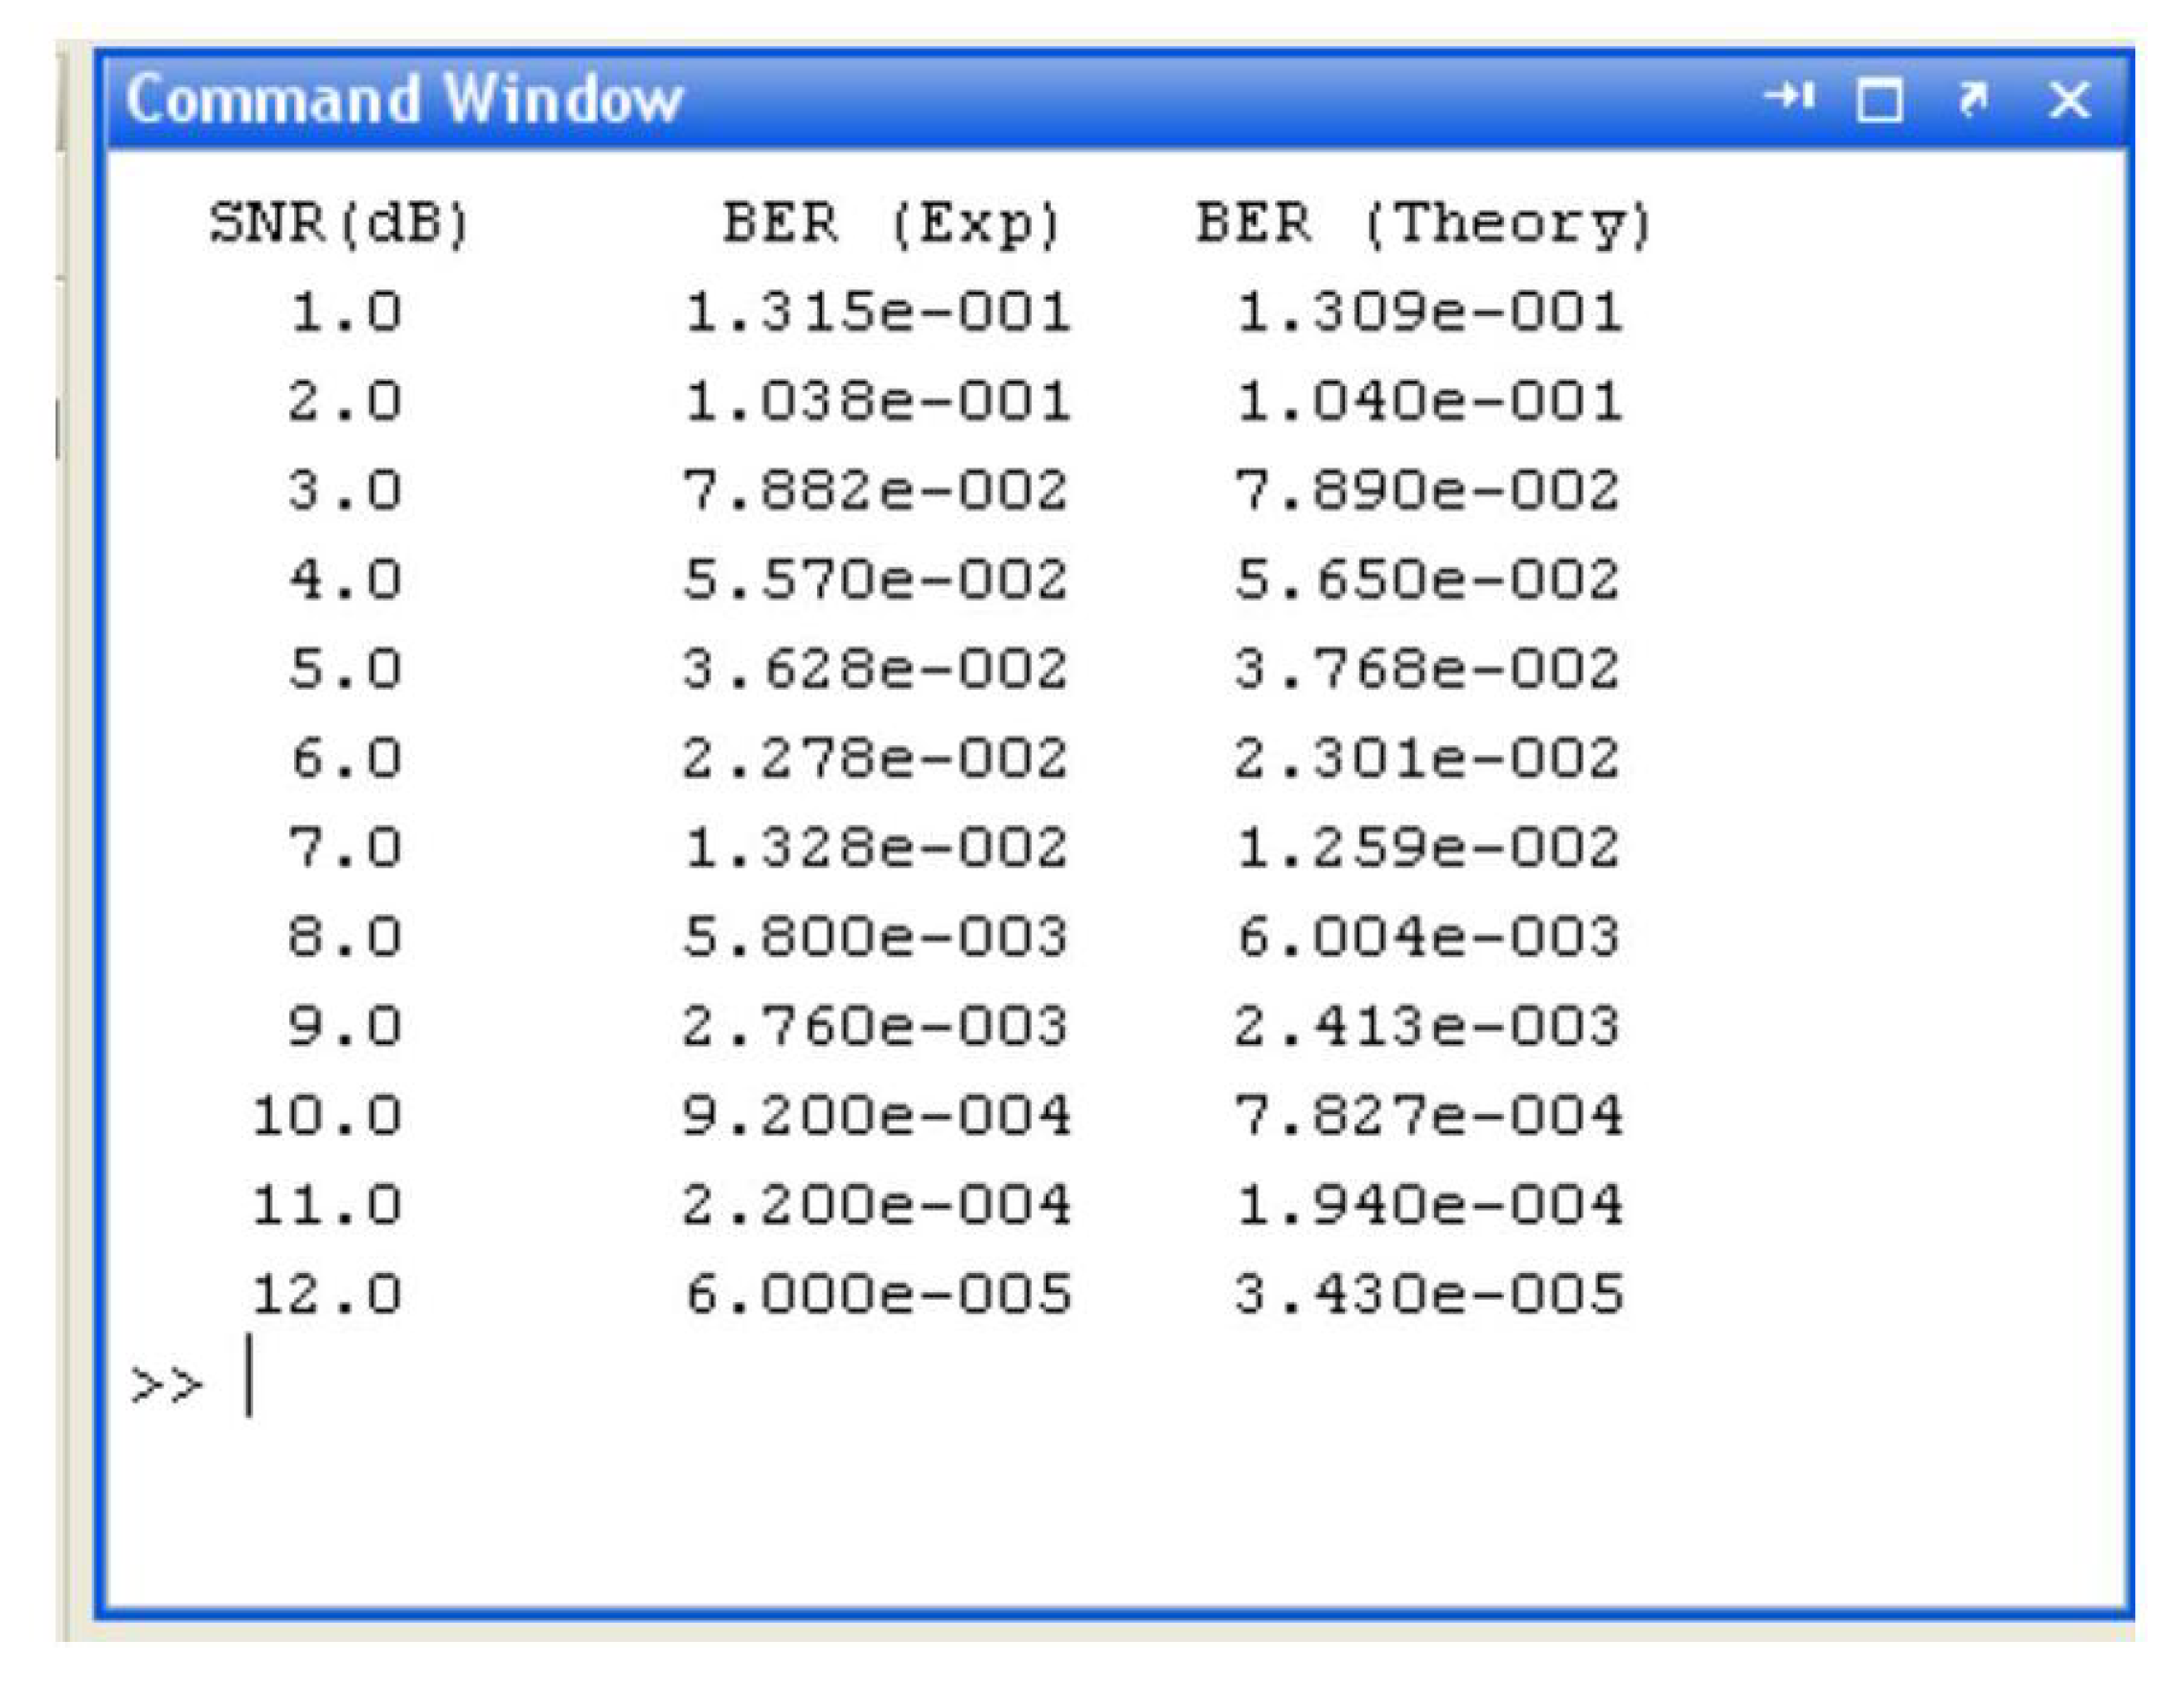
Figure 10.
Transmit Filter and Receive Filter Eye Diagrams ().
Disclaimer/Publisher’s Note: The statements, opinions and data contained in all publications are solely those of the individual author(s) and contributor(s) and not of MDPI and/or the editor(s). MDPI and/or the editor(s) disclaim responsibility for any injury to people or property resulting from any ideas, methods, instructions or products referred to in the content. |
© 2025 by the authors. Licensee MDPI, Basel, Switzerland. This article is an open access article distributed under the terms and conditions of the Creative Commons Attribution (CC BY) license (http://creativecommons.org/licenses/by/4.0/).
Copyright: This open access article is published under a Creative Commons CC BY 4.0 license, which permit the free download, distribution, and reuse, provided that the author and preprint are cited in any reuse.


