Preprint
Article

This version is not peer-reviewed.

Integrating P2M-CC for Sustainable Decarbonization in Cement Manufacturing

A peer-reviewed article of this preprint also exists.

Submitted:

14 January 2025

Posted:

15 January 2025

You are already at the latest version

Abstract

The cement industry is recognized as an energy-intensive industry, and as a consequence of this, it is one of the industries that generate large amounts of CO2 into the environment. The global fight against climate change requires rethinking processes in such industries. The use of fossil fuels as a primary energy source and the cement production process make it one of the industries with the largest CO2 footprint. In this case, a sustainable solution, at least in the medium term, is to integrate the P2M-CC (Power - to - methane with carbon capture) concept, which involves replacing natural gas with synthetic methane obtained by methanization of green hydrogen and carbon dioxide captured from the industrial process. The paper analyzed three modernization scenarios of a cement plant with an annual production of 1,200,000 tons defined on the basis of techno-economic assumptions. It was observed that by integrating the P2M-CC concept in the initial process, the CO2 emission factor decreased from 789 (baseline scenario) to about 85 kg/ton of cement (proposed scenarios). From an economic point of view, the initial investment costs were significantly higher in the proposed scenarios than in the reference case due to the expansion of the plant by including electrolysis, methane, CO2 capture, and wind farm energy production. The costs were thus 5 to 13 times (€ 2.9 billion) higher than in the baseline scenario according to the assumptions underlying each scenario. In terms of operation and maintenance costs, the variation was totally different depending on the scenario analyzed, ranging from less than half of the costs of the baseline scenario to 2.4 times (€ 2.8 billion) higher. This variation depended to a large extent on the CO2 tax and the excess electricity used in the clinker process. The discounted cost per tonne of cement, LCOC, varied significantly for the 3 proposed scenarios, with the minimum value (about 58% lower than in the reference case) being obtained for the ideal scenario where the excess electricity covers the entire electricity needs of the cement plant processes. Despite the much higher initial investment and operating costs, the payback period was slightly longer than in the baseline case (5 vs. 3 years) due to the significantly higher net fees paid in the baseline scenario. In conclusion, the technical and economic improvement of the performance of the cement industry is dependent on the EU-wide regulation of CO2 taxes but also on the careful management of electricity generated by renewable energy sources.

Keywords: 
;  ;  ;  ;  

1. Introduction

The worldwide evolution of cement production/consumption emphasizes the role that the cement industry plays in increasing greenhouse gas emissions, in particular CO2, and thus on global change. The growth in global cement production has been significant over the last 25 years, from about 1.6 billion tons in 2000 to 2.55 billion tons in 2006 and about 4.5 billion tons in 2024 [1-4]. Moreover, production is expected to continue to increase by up to 23% by 2050 [5]. On the other hand, the large carbon footprint of the cement production process makes the cement industry a 7% contributor to the total CO2 emissions generated worldwide [6]. Considering that the cement industry generates about 2.1 billion tons of CO2 annually, it is important to know the contribution of the various processes in the industry to the production of this pollutant. Therefore, half of the CO2 emissions are generated in the calcination process [7], 40% of the emissions are generated in the fossil fuel combustion process (mostly natural gas) [8], and the remaining 10% are generated in the transportation and electricity generation process consumed in the industrial process.
Considering all these aspects, it can be stated that the cement industry contributes significantly to the generation of CO2 emissions, reflecting the energy-intensive nature of the entire cement production process. In order to highlight the role of the cement industry in the generation of CO2 emissions, Figure 1 shows a comparison of the CO2 emissions generated by different industrial sectors, excluding the energy sector, in 2022 (total CO2 emissions of 11 billion tons).
The above graph shows that the cement industry, together with the steel industry, is one of the largest CO2 generators globally. The other sectors shown in the graph (e.g., the pulp and paper industry), although playing a smaller role, are important contributors to these emissions. Other sectors include the glass industry, the aluminum industry, the textile industry, etc.
Carbon capture, transport and storage (CCS) technologies represent one of the most effective solutions to achieve decarbonization targets in the cement industry [9-10]. Essentially, these technologies capture carbon dioxide from the industrial environment and store it underground with the potential to reduce emissions by about 90%. In contrast to its high potential, CCS technologies present high technical and economic challenges (e.g. high investment costs, high energy consumption, etc.) which make their large-scale deployment difficult. However, their feasibility is already proven in pilot projects developed in Europe or North America [11].
The use in the cement industry of alternative fuels from biomass or organic waste as well as the use of hydrogen instead of fossil fuels can lead to significant reductions in CO2 emissions [12]. Although the use of biomass can reduce emissions by up to 30%, the sustainability and availability of these resources are the main concerns of researchers [13]. On the other hand, the energy efficiency of cement industry technologies has increased significantly, reaching today values of about 90% for the efficiency of industrial kilns, and reducing specific energy consumption by about 30% by implementing waste heat recovery systems [14]. In terms of the actual cement production process, new technologies such as precalcining have been developed, which has led to increased process efficiency. In addition, the reduction of the clinker/cement ratio due to the use of secondary materials (e.g. fly ash from coal-fired power plants) has reduced CO2 emissions by about 30% [15]. However, the limited amount of substitutes makes these proposed solutions not sustainable.
Consequently, the solution on the integration of emerging P2G (Power-to-Gas) technologies, and in particular P2M-CC technology within the cement industry represents an innovative solution by utilizing surplus renewable energy to produce synthetic methane obtained as a result of the reaction between CO2 captured from the industrial process and hydrogen obtained by water electrolysis [16-17]. Being a closed-loop process, the integration of the P2M-CC concept in cement plants leads to a drastic reduction of CO2 emissions, with only a small fraction (10-12% of the initial CO2 emissions) being generated in the environment. Although the concept has been technically proven, the integration of this concept and large-scale implementation is challenging due to high investment costs and local infrastructure development requirements.
Regardless of the solution, efforts to decarbonize the cement industry require significant costs. The integration of CO2 capture technologies alone increases cement production costs by 50-100% depending on the technology chosen. In addition, following the integration of CO2 capture technologies, the specific energy consumption of the process increases up to values of 3,400 MJ/ton of clinker [18].
Summarizing the information presented, it can be said that decarbonization of the cement industry faces major challenges due to the energy intensive nature of the process and the inherent CO2 emissions generated by the calcination process. The simultaneous application of several measures, such as the integration of CCS technologies, the use of alternative fuels, increased energy efficiency, and the use of innovative technologies such as P2G, can lead to a significant reduction in the carbon footprint of the cement industry. The development and integration of these technologies in the cement industry require overcoming several barriers, such as economic, technical, or legislative.
The main objective of this article is the technical analysis of the P2M-CC technology in order to assess its integration in the cement industry economically. The following technical issues deserve to be addressed to achieve the main objective:
-
Assessment of the current CO2 emissions by identifying the main generating sources;
-
Investigation of the benefits of integrating P2M-CC technologies into the cement manufacturing process. This will examine how the CO2 emissions will be captured and subsequently utilized in the methanation reactor together with hydrogen to produce synthetic methane. The electricity requirement generated from harnessing wind energy to produce green hydrogen in the electrolyzer;
-
Techno-economic assessment of the integration of P2M-CC technologies in the cement plant. This will assess the investment costs, operation and maintenance costs and energy flows for each P2M-CC technology;
-
Evaluation of the carbon footprint of the cement plant modernized by the implementation of P2M-CC technologies as well as the associated decarbonization costs;
By addressing these issues, we aim to contribute by proposing solutions to the current efforts to reduce CO2 emissions in the cement industry, and by promoting innovative technologies based on the use of renewable energy sources. The P2M-CC concept presented in the paper utilizes the carbon dioxide captured in the synthetic methane production process, eliminating both the need for storage and the use of fossil fuels, and contributing to the circular carbon economy.
The integration of CO2 capture technology into cement production technology is particularly attractive as it aims to create a primary energy production system to replace the natural gas used. Synthetic methane is a known fuel that is compatible with the existing infrastructure in the cement industry and does not require additional investment for its use.

2. Integration of Renewable Energy and Carbon Capture Technologies in Cement Industry Decarbonization

The cement manufacturing process includes several stages including the stage of extraction and processing of raw materials (limestone, clay), which generate indirect CO2 emissions due to the use of various specific equipment, and the stage of grinding these materials to obtain a powder known as coarse meal using electricity from the national energy system, the amount of CO2 being dependent on the energy mix of the primary resources used to produce the electricity consumed.
However, the main step in the cement production process is the thermal decomposition of limestone at 1450 C in the industrial kiln. Natural gas is used to produce heat at this thermal level, which, in the process of combustion generates additional CO2 emissions in addition to the CO2 emissions resulting from the thermal decomposition of limestone. Also, the grinding of the clinker and subsequent mixing with gypsum requires a cosnum of electricity, which adds CO2 emissions.
As can be seen a large amount of CO2 is generated in the cement manufacturing process. However, in this paper only directly generated emissions are discussed, which account for about 65% of the total emissions generated in the cement production process [7]. Thus, the aim is to capture the carbon dioxide resulting from the combustion of fossil fuel respectively from the thermal decomposition of limestone in order to reduce the environmental impact but also to feed the CO2 to the CO2 methanation reactor.

2.1. Electricity Generation in Wind Power Plant

Wind turbines convert wind energy into electricity, which is essential for powering the electrolyzer, the methanation reactor, and all electrical equipment in the cement plant.
Establishing a location defined by sufficient wind potential is essential in order to supply the electricity needs of the cement plant. The wind speed is an important parameter in the choice of the location as it has to be within certain limits depending on the wind turbine used, usually between 3-4 m/s, the lower limit, and 25 m/s, the upper limit. It is important to know the wind potential of the chosen area throughout the year in order to be able to cover the load curve of the cement plant. Meeting this requirement will lead to increased reliability and sustainability of the whole system.
The main consumers of electricity in the modernized cement plant are the electrolysis process (60-70%) and the CO2 capture process (15-20%). Taking into account the electrolyser efficiency of about 70%, the specific energy consumption required for hydrogen production is about 50 kWh/kg H2 [19]. The electricity required in the CO2 capture process to compress CO2 to the pressure required by the methanation reactor is 0.5 MWh/ton CO2.
Sizing the wind power plant for efficient conversion of wind energy into electricity involves the use of fundamental equations describing the relationship between wind parameters and turbine characteristics [20]. The energy harnessed by the wind turbine is initially determined by the available wind power, which depends on the wind speed, air density and turbine rotor disk area. Thus, the equation can be written as:
P w i n d = 1 0 3 2 ρ A v 3
where:
P w i n d – wind power, in kW; ρ – air density, in kg/m3; A – is the area of the rotor disk, in m2; and v – is the wind speed, in m/s.
The power coefficient, C p is a measure of how efficiently the wind turbine converts wind energy into mechanical energy. Equation 2 shows the relationship for determining the electrical power generated by the turbine.
P t u r b = 1 0 3 2 ρ A v 3 C p λ , β
where: C p λ ,   β - is the power coefficient, which depends on the specific rotor speed, λ (the ratio of the blade tip linear velocity to the wind speed), and the blade pitch angle, β .
Betz's law limits the maximum theoretical efficiency of a wind turbine to 60%, also known as the „Betz limit”, [10]. The law describes the maximum efficiency with which wind energy can be converted into mechanical energy (Equation 3).
P m a x = 0.6 1 0 3 2 ρ A v 3

2.2. Process Description of the Alkaline Electrolyzer

The electrolysis of water in an alkaline electrolyzer is a process by which water (H2O) is broken down into oxygen (O2) and hydrogen (H2) using electrical energy. The process is carried out in an alkaline environment in the presence of either potassium hydroxide (KOH) or sodium hydroxide (NaOH) solution as the electrolyte.
An alkaline electrolyzer uses a solution of potassium hydroxide (KOH) or sodium hydroxide (NaOH) as an electrolyte to increase water's electrical conductivity. It comprises two electrodes, an anode, and a cathode, separated by a membrane that allows ions to pass through but prevents the gases produced from mixing. The chemical equations underlying the oxidation and reduction processes are described below using equations 4-5 [21].
Anode reaction (oxidation):
2 H 2 O l O 2 g + 4 H + a q + 4 e
Cathode reaction (reduction):
4 H + a q + 4 e 2 H 2 g
The overall process reaction (equation 6) illustrates the electrolysis process's production of hydrogen and oxygen from water.
2 H 2 O l 2 H 2 g + O 2 g
The energy consumption required by the alkaline electrolysis process depends on its energy efficiency and the applied voltage. The applied voltage per cell required to initiate electrolysis varies between 1.8 and 2.6 V. The equation below (7) can be used to determine energy consumption.
E = n F V
where: n is the number of moles of electrons transferred; F is Faraday's constant (96,485 C/mol); V is the applied voltage per cell.

2.3. Process Description of the Methanation Reactor

The production of synthetic methane is based on the chemical reaction of CO2 with H2 in the methanation reactor, thus valorizing CO2 captured from the industrial process. Technologies to store energy in H2 or synthetic methane are essential in the energy transition to clean energy sources. The choice of the catalyst in the methanation reactor depends on its operating parameters. Thus, nickel (Ni)-based catalysts are among the most widely used due to their low cost and high conversion efficiency [22]. On the other hand, Ni-based catalysts degrade due to carbon deposition affecting their long-term stability and efficiency. There is also the possibility of improving the performance and stability of Ni-based catalysts by combining them with different promoters (e.g. alkaline earth metals, noble metals or phosphorus that improve thermal stability or catalytic activity by reducing carbon deposition and reducing side reactions that may occur during the process) [23]. The use of transition metals (e.g. CeO2) improve catalyst activity and stability, facilitating Ni dispersion and favoring the formation of active sites for the methanation reaction [24-25].
Catalysts based on noble metals, such as ruthenium (Ru) and rhodium (Rh), exhibit higher catalytic activity and stability than Ni-based catalysts. The disadvantage of these catalysts is the high acquisition cost, which limits their applicability on an industrial scale [23].
Currently, MOF-derived catalysts are being studied due to the advantage of improving the dispersion of Ni particles and favoring the formation of active zones for the interaction between CO2 and H2 [25]. High specific surface area support materials (e.g. CeO2, ZrO2) can contribute to the catalyst stability and performance by facilitating CO2 reduction (activates CO2 molecules making them more reactive) and H2 dissociation.
The methanation process parameters (operating pressures up to 80 bar and operating temperature of 450 oC) influence the methane selectivity and CO2 conversion rate, which reach values of 100% and 85%, respectively.
For the reactor design, the amount of catalyst used should be taken into account to ensure complete conversion of reactants as well as the volume of the catalyst bed to avoid incomplete reactions or, on the contrary, the occurrence of increased investment costs [26].
The realization of mass and energy balances allows to determine the energy consumption for the amount of methane required by the cement plant. In order to supply the required amount of methane, the optimization of the methanation reactor involves the adjustment of pressure and temperature parameters, the choice of the appropriate catalyst as well as the adjustment of the molar ratio of the reactants.
Below are the main chemical reactions (CO2 hydrogenation, reverse gas-water gas reaction - RWGSR, and carbon monoxide hydrogenation), and the heat generated/absorbed by each reaction. Equation 8 is the sum of reactions 9 and 10.
C O 2 + 4 H 2 C H 4 + 2 H 2 O , H = 164 k J / m o l
C O 2 + H 2 C O + H 2 O , H = + 41 k J / m o l
C O + 3 H 2 C H 4 + H 2 O , H = 206 k J / m o l
Temperature and pressure have a significant influence on the equilibrium constant K and hence on the degree of conversion of reactants to products. Nickel, used as a catalyst, helps to lower the activation energy, allowing the reaction to take place efficiently at low temperatures. Thus, for an optimal temperature value, the catalyst activates H2 and CO2 molecules, facilitating the formation of CH4 and H2O with high efficiency. The reaction rate expressions and reaction constants are described below using Equations 11-14 [27-28].
r = k p H 2 0,5 p C O 2 0,5 1 p C H 4 p H 2 O 2 p C O 2 p H 2 4 K e q 1 + K O H p H 2 O p H 2 0,5 + K H 2 p H 2 0,5 + K m i x p C O 2 0,5 2
k = k 0 , r e f e x p E A R 1 T r e f 1 T
K i = A x , r e f e x p H x R 1 T r e f 1 T
K e q = 137 10 10 T 3.998 e x p 1587 R T
Table 1 shows the values of the main parameters used in the present study necessary for the reactor sizing. Thus, details of the catalyst used, reactant fluxes (amount of CO2 and H2), and methanation process parameters (pressure, temperature, molar ratio) are presented. The methanation reactor was modeled using CHEMCAD 8 - chemical process simulation software. The type of reactor used was PFR (Plug flow reactor), in which the composition and temperature vary along the reactor length. The equilibrium constants were calculated using Van't Hoff relations. The thermodynamic model used to describe the behavior of the substances is based on Peng Robinson's equation of state thus determining the molar volume, vaporization pressures, and liquid and vapor phase compositions [29-30].

2.4. CO2 Capture by Chemical Absorption Technology

The process of capturing carbon dioxide (CO2) by chemical absorption from the flue gas of a cement factory is an effective and widespread method of reducing greenhouse gas emissions. The process of chemical absorption involves the transfer of a soluble gas, in this case CO2, from the gaseous phase into a liquid solution, where it chemically reacts with a soluble absorbent (MEA, DEA or MDEA). The typical process of capturing CO2 from flue gas by chemical absorption includes the following steps (see Figure 2):
-
The flue gas is first cooled and filtered to remove particulates and impurities, such as sulfur and nitrogen oxides, which can interfere with the absorption process, resulting in a reduction in the absorption capacity of the solvent;
-
The pre-treated flue gas is then introduced into the absorption column at the bottom, where it is brought into contact with an absorbing solvent, usually an amine solution, such as monoethanolamine (MEA), diethanolamine (DEA) or methyl diethanolamine (MDEA), introduced at the top of the absorption column. The active zone of the absorption column may consist of a filler, through which the flue gas flows in countercurrent with the solvent, thus maximizing the contact area between the two phases;
-
The rich loading solvent is pumped into the regeneration column after preheating in the heat exchanger to reduce the steam input required for regeneration;
-
d) the lean loading solvent is recirculated to the bottom of the regeneration column to recover as much CO2 as possible. Solvent regeneration is achieved by using the steam produced from the flue gas heat recovery from the industrial process. Given the required parameters, additional heat is produced using synthetic methane to ensure a minimum pressure of 5 bar and a temperature of approximately 125 oC necessary for solvent regeneration in the regeneration column;
-
Cooling of the lean loading solvent shall be carried out in two stages to ensure the appropriate temperature in the absorption column of approximately 45 oC ;
-
f) The separated CO2 in the regeneration column is purified and compressed for transportation and storage; the compression being carried out at 70 bar.
Two different types of amines, monoethanolamine (MEA) and diethanolamine (DEA), have been used in the CO2 capture process to react with CO2 to form soluble carbamates or bicarbonates. Each amine has its specific chemical characteristics and reactions.

2.4.1. Monoethanolamine Solvent

MEA is a commonly used primary amine for CO2 capture due to its high reactivity and regeneration capacity. In this process, CO2 reacts with MEA to form MEA-carbamate and water. During regeneration, the MEA-carbamate is broken down into CO2 and MEA, allowing the MEA to recirculate. The chemical reactions underlying carbamate formation are [31-32]:
C O 2 + R N H 2 R N H 2 + C O O
R N H 2 + C O O + R N H 2 R N H C O O + R N H 3 +
C O 2 + R N H 2 B R N H C O O B H +
C O 2 + R N H 2 R N H C O O H
R N H C O O H + R N H 2 R N H C O O + R N H 3 +

2.4.2. Diethanolamine Solvent

DEA is a secondary amine that, similar to MEA, reacts with CO2 to form a stable compound (DEA-carbamate) and water [33]. DEA offers a similar capture efficiency to MEA, but with thermal stability and foam formation advantages. The following chemical reactions describe the absorption process of CO2 with DEA.
C O 2 + R 2 N H R 2 N H 2 + C O O
R 2 N H 2 + C O O + R 2 N H R 2 N C O O + R 2 N H 2 +
C O 2 + R 2 N H B R 2 N C O O B H +
C O 2 + R 2 N H R 2 N C O O H
R 2 N C O O H + R 2 N H R 2 N C O O + R 2 N H 2 +

2.4.3. Technical Consequences of Solvent Regeneration

Solvent regeneration is mandatory to maintain the required efficiency of the CO2 capture system but also to prolong the lifetime of the solvent by avoiding premature solvent degradation and the need for frequent replacement with fresh solvent. The correct functioning of the regeneration process minimizes both the operational costs (solvent purchase) and the energy used (synthetic methane consumption).
The solvent regeneration process is energy intensive because it requires a significant amount of heat at a thermal level of about 125 oC (valid for primary amines - MEA) to break the chemical bonds between CO2 and the solvent. The heat required comes either from the steam produced using the waste heat recovered from the flue gas or directly by using synthetic methane. Therefore, it is important to know the amount of heat needed for the solvent regeneration process to determine the amount of synthetic methane needed in addition to the amount of methane needed by the cement factory furnace.
Energy balance on cement plant processes is essential to reduce the consumption of synthetic methane and consequently to reduce the investment costs in the electrolyzer, methanation reactor or wind farm. Increasing the flue gas heat recovery factor leads to a reduction in the amount of synthetic methane used and thus increases the feasibility of the whole process. Keeping the process temperature at about 125 oC is important in order not to degrade the chemical solvent and thus not to increase the operational costs. Therefore, pre-treating the flue gas and maintaining a constant temperature in the regeneration process as well as the use of additives such as piperazine will allow to prolong the lifetime of the chemical solvent and thus reduce the related operational costs. Table 2 shows the different degradation mechanisms of chemical solvents as well as the amounts of solvent lost in the process.
Table 2 also highlights the effectiveness of different methods in reducing chemical solvent degradation (MEA) by adding additives, controlling the temperature of the regeneration process, removing heavy metals from the solvent or pretreating the flue gas. Each method has advantages and disadvantages but the application of one or the other depends on the degradation mechanism predominant in the process.
Although each method has the potential to reduce solvent losses, the maximum efficiency can be achieved by a strategic combination of several methods tailored to the specifics of each installation. The higher initial investment to implement the methods can be offset by the long-term savings and improved performance of the CO2 capture process.
The energy required for regenerating the solvent is determined from the energy balance on the regeneration column, considering the energy introduced as steam, the heat of regeneration, and the heat required to desorb CO2 from the solvent. The relationship can express the energy balance for the stripping column.
Q r e g = m ˙ s o l v C p , s o l v T + m ˙ C O 2 λ C O 2
where: Q r e g is the total heat required for regeneration (kJ/s or kW); m ˙ s o l v is the solvent mass flow rate (kg/s); C p , s o l v is the specific heat capacity of the solvent (kJ/kg C); T is the temperature difference between CO2-lean and CO2-rich solvent temperature (K); m ˙ C O 2 is the mass flow rate of CO2 released from the solvent in the gas phase (kg/s); λ C O 2 is the latent heat of desorption of CO2 or the energy required to break the chemical bonds between CO2 and solvent (kJ/kg).
The energy required for solvent regeneration is determined using the energy balance equation, considering the heat of regeneration, steam input, and latent heat of desorption. For instance, depending on process parameters, a cement plant capturing one ton of CO2 requires approximately 2,773 GJ of heat for solvent regeneration [37]. By improving solvent regeneration efficiency and stability, cement plants can significantly lower the levelized cost of cement, making the integration of P2M-CC technology more viable.

2.5. Economic Implications of P2M-CC Technology

Equation 26, based on the scaling method using the specific baseline cost C b s of a reference capacity Q r , as well as the exponent (e), was used to calculate the investments required to implement the P2M-CC sub-systems, including the wind power plant, the electrolyzer, the methanation reactor, and the CO2 capture technology [38].
C e q u i p m e n t = C b s Q Q r e
where: C e q u i p m e n t – represents the updated cost of the equipment; Q – the current capacity of the equipment.
Table 3 details the investment costs for the main equipment used in the cement plant modernized with the P2M-CC concept, also presenting the scaling parameters taken into account, the base costs, the base capacities, and the scaling exponents needed to determine the costs of each equipment using Equation 26.
The operation and maintenance costs for the cement plant modernized with the P2M-CC concept include the expenses necessary to operate each subsystem (wind farm, electrolyzer, methanation reactor, clinker kiln, and CO2 capture technology). Expenses include the purchase of solvents, fuels, additives, alkaline solutions, catalysts but also equipment maintenance, staff salaries, etc.). All OPEX expenses are shown in Table 4.
The levelised cost of cement (LCOC) produced in the modernized cement plant (with P2M-CC technology) and in the reference cement plant (without P2M-CC technology) is the ratio of the total discounted expenditure (CTA) to the annual quantity of cement produced (TQC) (equation 27).
L C O C t o n c e m e n t = C T A T Q C
The total discounted expenditure (CTA) is determined as the sum of the total capital expenditure (CAPEX) divided by the equipment's annual lifespan and the total operation and maintenance expenditure (OPEX), presented in equation 28.
C T A = C A P E X l i f e s p a n + O P E X
Equations 29 and 30 determine the total capital O&M expenditure for each piece of equipment i (see Table 10 and Table 11), where m is the number of technologies used in the P2M-CC technology.
C A P E X = i = 1 m C e q u i p m e n t i
O P E X = i = 1 m O P E X i
Net Present Value (NPV) is an economic metric to evaluate an investment's profitability (equation 31). It is calculated by summing the present values of incoming and outgoing cash flows over a specific period (the lifespan is 25 years). The cash flows are discounted using a particular rate, often the cost of capital or a required rate of return.
N P V = t = 0 n C t 1 + r t
where: C t – represents cash flow at the time, t; r – is the discount rate; t – is the period and n – is the lifespan.
A positive NPV indicates that the projected earnings (discounted back to the present value) exceed the anticipated costs, making the investment potentially profitable. Conversely, a negative NPV suggests that the costs outweigh the benefits, indicating a less favorable investment.
The payback period (PP) is an economic term that refers to the time required for an investment to recover its initial cost from the net cash inflows it generates. It is a straightforward measure of investment risk. The shorter the payback period, the less time the investment is at risk. The payback period is calculated by summing the cash inflows until they equal the initial investment (equation 32).
P P = I n i t i a l i n v e s t m e n t A n n u a l c a s h i n f l o w
The initial investment represents the total amount needed to cover all expenses including the purchase of equipment, land, buildings and other expenses necessary to launch the project. Payback period indicates in how many years the initial investment can be amortized considering the cash flows generated annually by the project. Although it does not take into account the depreciation of the money supply or the income subsequently generated by the project, the payback period is a useful indicator for a quick assessment of the payback period and the risk associated with the investment. Net present value income, NPV, is useful in determining the profitability of an investment taking into account the devaluation of the cash flow.
The EPI indicator, defined in Equation 33, is a useful tool to simultaneously account for the influences of the three indicators NPV, LCOC and PP. The EPI is useful because it allows a unitary assessment of the economic performance of a project by simplifying the comparative analysis.
E P I = N P V L C O C P P t o n e c e m e n t y e a r
The usefulness of this indicator lies in the ease of comparing several scenarios when changing a given parameter, in this case the CO2 emission rate. A high value of the EPI indicator suggests the maximization of cement production under economically profitable conditions. The main advantage of this indicator is that it concentrates in a single indicator the influences on the analyzed scenario of the three different indicators. Thus, it avoids analyzing each parameter individually, simplifying the decision-making process.
However, the PI indicator also has some disadvantages such as its sensitivity to extreme values (e.g. a value close to zero of the payback period). In these situations the values of the indicator may be distorted due to unjustified amplification. Another drawback is that treating the three indicators as equally important (equal weights) leads to masking some real economic priorities of investors (e.g. payback period more important than investment costs). The EPI indicator can be used in financial projects to assess the extent to which an investment is likely to yield high returns.
Although the literature does not identify such an indicator in the form as defined above, the concept of combining several economic parameters is often found in multi-criteria analysis used in decision-making processes.
Another indicator is the CO2 emission factor ( F C O 2 ) determined as the ratio between the total annual amount of CO2 generated into the atmosphere by the whole system and the yearly amount of cement produced ( Q c e m e n t ), according to equation 34.
F C O 2 = C O 2 Q c e m e n t
Only the costs associated with CO2 capture (CO2 removal and CO2 avoided) were considered in determining the costs associated with CO2 capture technology. Thus, for all scenarios considered with the modernization of the cement plant, the values of the two indicators are the same. The calculation of these indicators considers the actualized cost per ton of cement for the initial and modernized cement plant, the CO2 flux generated by the modernized cement plant, and the emission factor in both scenarios (equations 35 and 36).
C O 2 r e m o v a l = L C O C c a p t u r e L C O C r e f e r e n c e C O 2 r e m o v e d
C O 2 a v o i d e d = L C O C c a p t u r e L C O C r e f e r e n c e F C O 2 r e f e r e n c e F C O 2 c a p t u r e

3. Cases Studied for the Cement Manufacturing Process Improvement Towards Decarbonization

3.1. Current Status of the Cement Plant - Reference Scenario

Table 5 centralizes the main data and information for the processes that define the current state of the cement plant representing the reference scenario. From the mass and energy balances carried out, the main flows were determined, i.e. the consumption of energy and raw materials necessary for the cement manufacturing process and the emissions generated in the environment.
For the case study, the Fieni cement plant in Romania (Figure 3) was chosen, which produces 1,200,000 tons of cement annually using 960,000 tons of clinker and 240,000 tons of clay. The cement plant has an annual running time of 75%, representing 6,570 hours of operation, the remaining time the cement plant is under maintenance. Being an energy intensive industry, the specific electricity consumption considered in the energy balances was 120 kWh/ton of cement produced [51-52]. In order to produce the planned amount of cement, the cement plant consumes 144,000 MWh of electricity per year, which is supplied by the national energy system. In terms of specific heat consumption, the cement plant consumes 920 kWh/ton of cement, the annual requirement being 1,104,000 MWh [51]. 77,850 tons of methane are consumed annually to generate heat energy, considering the conversion efficiency of methane to heat energy of 92%.
As a result of the use of methane gas as well as the cement production process, the cement plant generates significant CO2 emissions. The determination of the annual CO2 emissions took into account the amount of methane used and the amount of clinker produced, knowing the emission factor of 0.85 ton CO2/ton of clincher [52]. Equation 37 shows the chemical reaction of stoichiometric methane combustion.
C H 4 + 2 O 2 C O 2 + 2 H 2 O , H = 165 k J m o l
It can be seen that one mole of CO2 is generated for each mole of methane. Given the molar masses of the reaction products, the annual amount of CO2 resulting from methane combustion is about 214,050 tons. Equation 38 is used to determine the CO2 emissions from the clinker manufacturing process.
C a C O 3 C a O + C O 2
Knowing that approximately 1.5 tons of calcium carbonate are used to produce one ton of clinker, the annual emissions of CO2 resulting strictly from cement production are 732,600 tons. Thus, the annual emission of CO2 resulting from the entire process is the sum of the CO2 emissions from the methane combustion process and the clinker production process, Equation 39.
C O 2 = C O 2 C H 4 + C O 2 c e m e n t
On the basis of the resulting calculations, an emission factor of 789 kgCO2/ton of cement was obtained. Taking into account the energy intensive nature of the process, measures are needed to reduce CO2 emissions either by replacing fossil fuel or by adding CO2 capture technologies.
Emissions of CO2 from the direct use of electricity in the process have been neglected due to their relatively small contribution compared to the total emissions from the cement manufacturing process or from methane combustion. Emissions associated with electricity consumption amount to approximately 40,752 tons of CO2/year, corresponding to a specific emission factor of 34 kg CO2/ton of cement. The amount of CO2 thus obtained represents only 4.3% of the total emissions of CO2/ton of cement (789 kg CO2/ton of cement for the whole reference scenario). Consequently, the CO2 contribution from power generation is minimal compared to the direct emissions from clinker production and methane combustion.
Consequently, the impact associated with the cement plant can be reduced by integrating the P2M-CC concept. Thus, the natural gas used will be completely replaced by synthetic methane and the electricity needed for the whole process is produced by the wind power plant that capitalizes on the wind potential of the area [53].

3.2. Scenarios Description for Upgrading Cement Plant with P2M-CC Integration

Taking into account the increasingly stringent environmental conditions imposed on the energy-intensive industry (in this case the cement industry), three solutions for the modernization of a cement plant based on the use of renewable energy sources and modern technologies such as CO2 capture by chemical absorption using amines, hydrogen production by electrolysis or synthetic methane production in the methanation reactor have been proposed in this article. Therefore, the baseline scenario is compared with the modernized one (the three proposed solutions).
For all the alternatives proposed in the modernized scenario, the wind farm provides all the electricity to cover the needs of the cement plant (including the new equipment: electrolyser, methanation reactor, hydrogen compression, and CO2 capture). By integrating this equipment, the aim is to reduce dependence on natural gas and reduce CO2 emissions, thus creating a closed carbon cycle in which carbon dioxide becomes a primary resource used in the methanation process (Figure 4).
The modernization of the cement plant involves the complete replacement of natural gas with synthetic methane and a 90% reduction in CO2 emissions, with the CO2 thus captured being used entirely in the methanation reactor. Thus, three distinct scenarios have been proposed with the objective of producing the same annual amount of cement: the full scenario (S2.1), the ideal scenario (S2.2) and the realistic scenario (S2.3). Each scenario represents a possible situation under real operating conditions.

3.2.1. Complete Scenario (S2.1)

In this scenario, the initial costs and the operation and maintenance costs of the wind farm are included in the economic analysis, with the wind farm supplying the entire amount of electricity required by the cement plant. The definition of this scenario is motivated by the need to analyze the economic impact of including all the equipment that defines the modernized solution. This scenario reflects a realistic and comprehensive approach, assessing the long-term economic sustainability of the modernized cement plant.

3.2.2. Ideal Scenario (S2.2)

In this scenario, the wind farm is located close to the cement plant but is not owned by the plant owner. It is assumed that the excess electricity produced (e.g. at night, when the energy price is negative or zero) by the wind farm fully covers the cement plant's needs. Consequently, the costs associated with the purchase of electricity are assumed to be zero. The definition of this scenario is motivated by the desire to assess the maximum possible benefits of modernizing the cement plant when electricity costs are minimal (even zero). The scenario provides insight into the ideal economic potential, highlighting the maximum benefits of modernizing the cement plant under favorable market conditions.

3.2.3. Realistic Scenario (S2.3)

As in the previous case, the wind farm is located close to the cement plant and is not owned by the plant owner. However, in this case, the excess electricity is only one third of the cement plant's needs (8h out of 24 h - energy produced at night), the rest of the electricity needed by the cement plant is purchased at market price. The choice of this scenario is motivated by the need to assess the economic risks and constraints in the context of real conditions, providing a clear perspective on the feasibility of the proposed project.
In all three proposed scenarios for the modernization of the cement plant (S2.1-3), the electrolysis process generates oxygen with a purity of more than 99 %. Oxygen is a co-product of the cement plant that can be valorized by selling it to various beneficiaries such as specialized companies (e.g. Linde). The economic analysis also included the revenues from the sale of this product in order to maximize the economic benefits obtained by the cement plant.
The analysis of these three alternatives provides a holistic understanding of the economic and operational impact of modernizing a cement plant. Each scenario highlights distinct benefit and cost issues, allowing a detailed assessment of the feasibility of the proposed modernization project.

4. Results and Discussion

The proposed scenarios will be analyzed from a technical, economic, and environmental impact point of view to capture the extent to which the proposed modernizations of the cement plant benefit the cement industry. Each modernized scenario is characterized by benefits (CO2 capture, oxygen generation) and challenges (e.g. increased initial investment and increased operating and maintenance costs). Benefits and challenges will be the criteria used to determine each scenario's sustainability and economic viability. The detailed analysis will help to understand the potential for transforming the cement plant into a more efficient and environmentally friendly system.
Table 6 shows the primary data for each piece of equipment in the cement plant modernized by introducing the P2M-CC system.
The cement plant operates 6 570 hours per year, while the wind turbines operate 8 000 hours yearly. This means that, for 1 430 hours, the wind turbines continue to produce electricity, but the cement plant is under maintenance and cannot directly use the available energy. It is, therefore, necessary to develop a hydrogen production and storage system to efficiently harness the renewable energy produced by the wind turbines during this period. The hydrogen produced during maintenance is stored in specialized tanks at a pressure of 350 bar, and the wind farm will ensure the electricity required. These tanks are designed to provide safe hydrogen storage and prevent losses. The storage capacity is calculated to cover the amount of hydrogen used in the methanation reactor to produce the synthetic methane needed by the cement plant during the periods when it is in operation, so that the cement plant can supply the entire annual cement supply. Implementing a hydrogen production and storage system during the maintenance period of the cement plant allows the full utilization of renewable energy produced by wind turbines.
In previous studies, the post-combustion CO2 capture process using the chemical absorption based process using amines [55, 57-59] is presented in detail. These studies involved rigorous experimental tests to ensure the accuracy and relevance of the data collected on the specific thermal energy consumption required for chemical solvent regeneration and the electricity consumption of the capture plant. The results obtained from the pilot plant studies were compared with results from other literature studies to validate the accuracy and reliability of the data [56, 60]. Thus, the data used in the current study are robust being validated by various specialized technical reports.

4.1. Integration of the P2M-CC in the Cement Plant

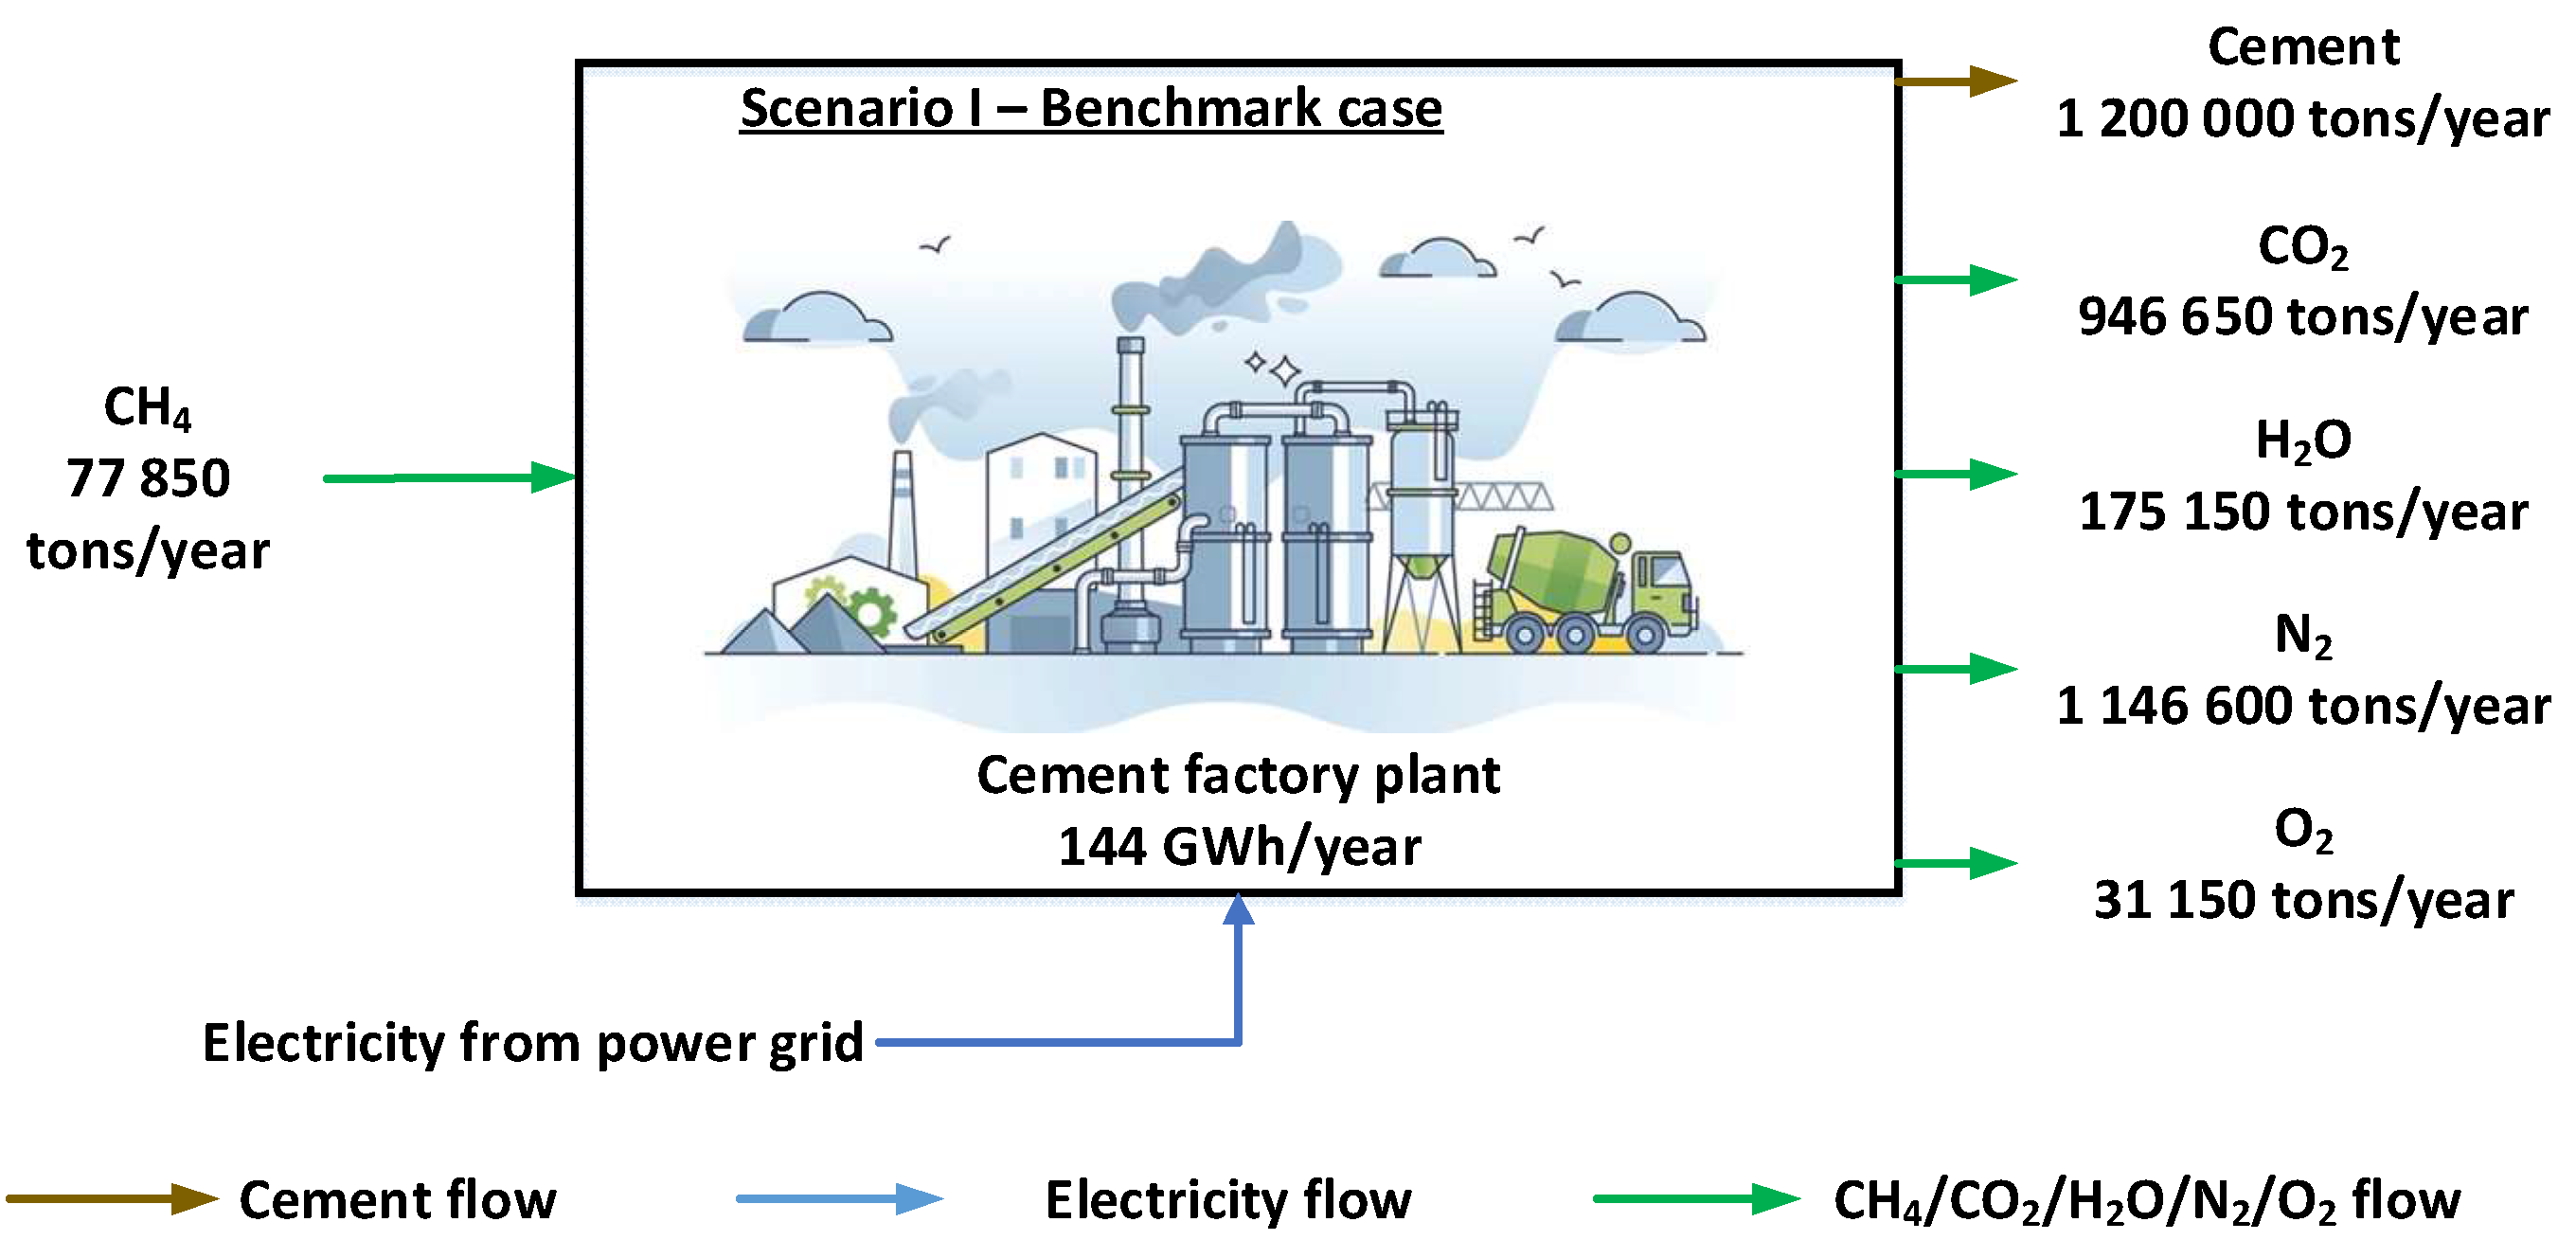
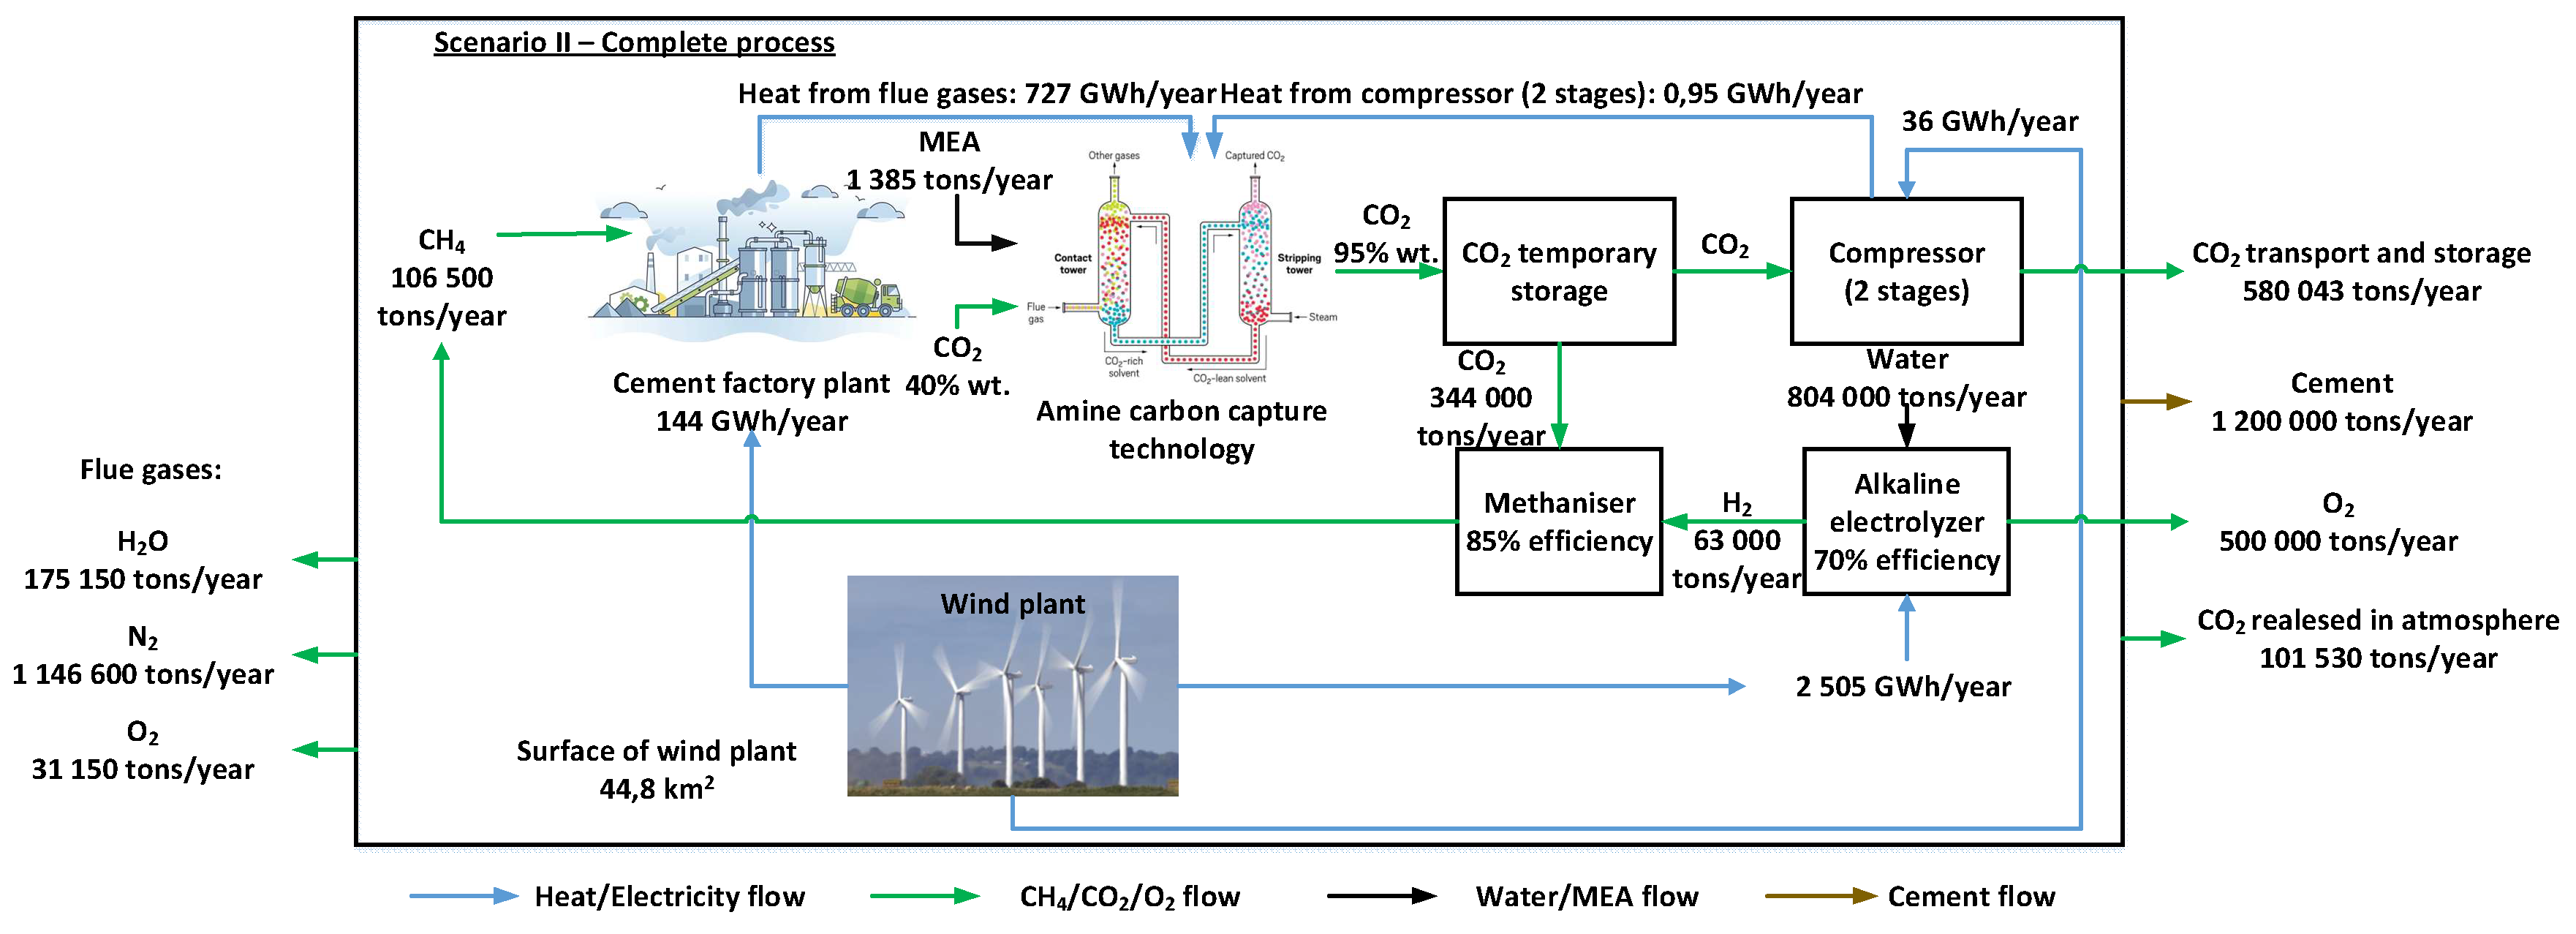
To modernize the cement plant to integrate the P2M-CC concept, it is necessary to assess the sustainability of generating the synthetic methane requirements using the carbon dioxide captured by the post-combustion integrated chemical absorption technology in the cement manufacturing process. Thus, in Table 7, the characteristic data of the modernized cement plant are presented concerning the electricity and heat requirements as well as the CO2 flux resulting from various processes.
According to 
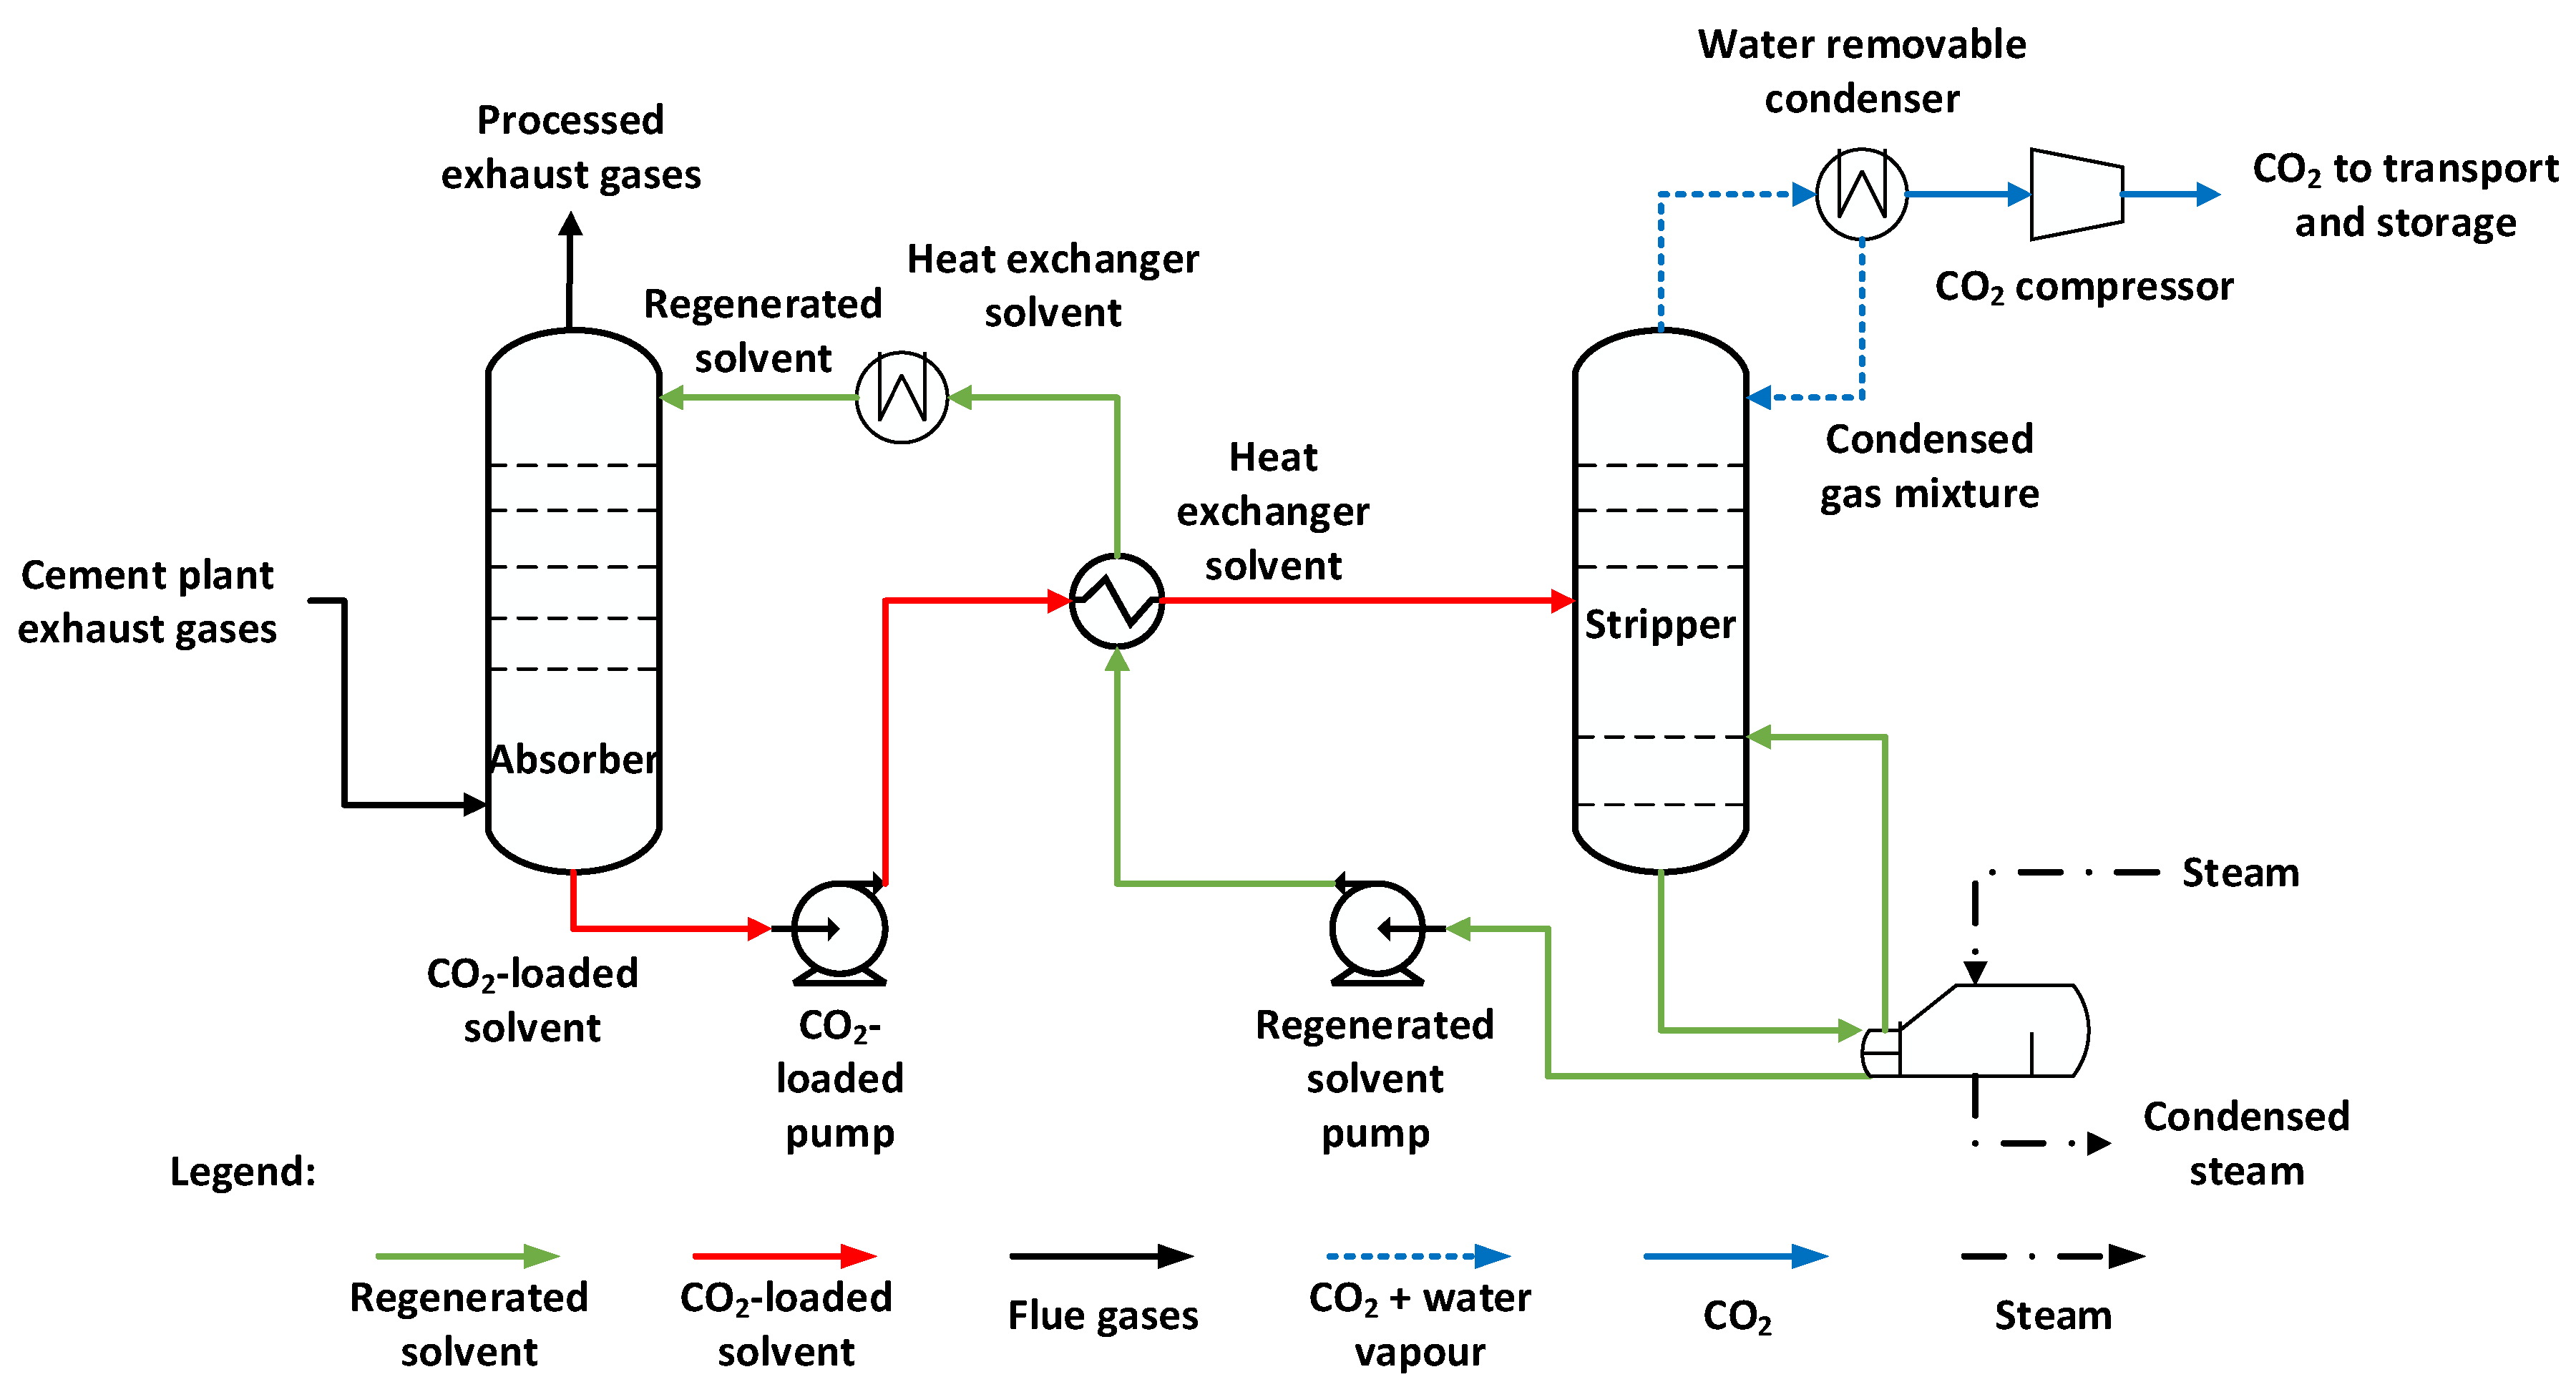
Figure 2, the integration of chemical absorption technology requires an additional heat source to ensure solvent regeneration. The heat required for solvent regeneration comes, on the one hand, from flue gas heat recovery and, on the other hand, from the additional methane combustion in a thermal power plant.
Determining the heat required to regenerate the solvent depends on the type of solvent used and its mass concentration to ensure 90% carbon capture efficiency. The total carbon dioxide generated is 732,600 tons/year, mainly from clinker manufacture. In comparison, 214,054 tons/year come from the combustion of methane to generate the heat required for the cement plant, and 78,919 tons/year come from the combustion of methane to produce the heat required to cover the entire heat input for the chemical regeneration of solvents.

4.1.1. Parameterization of the Chemical Absorption Process

Determining the optimal parameters of the chemical adsorption process is essential to minimize solvent consumption and reduce the heat consumption required for solvent regeneration. Thus, two chemical solvents (MEA and DEA) were analyzed, each in three mass concentration variants: 10, 20 and 30 % (Figure 5 and Figure 6). Simulations of the chemical absorption process were performed with the CHEMCAD version 8.0 program using the thermodynamic package specific to amines starting from the composition of the flue gas resulting from the cement plant. Table 8 shows the flue gas mass composition considering the flue gas stream resulting from the cement manufacturing process and that resulting from the methane gas combustion.
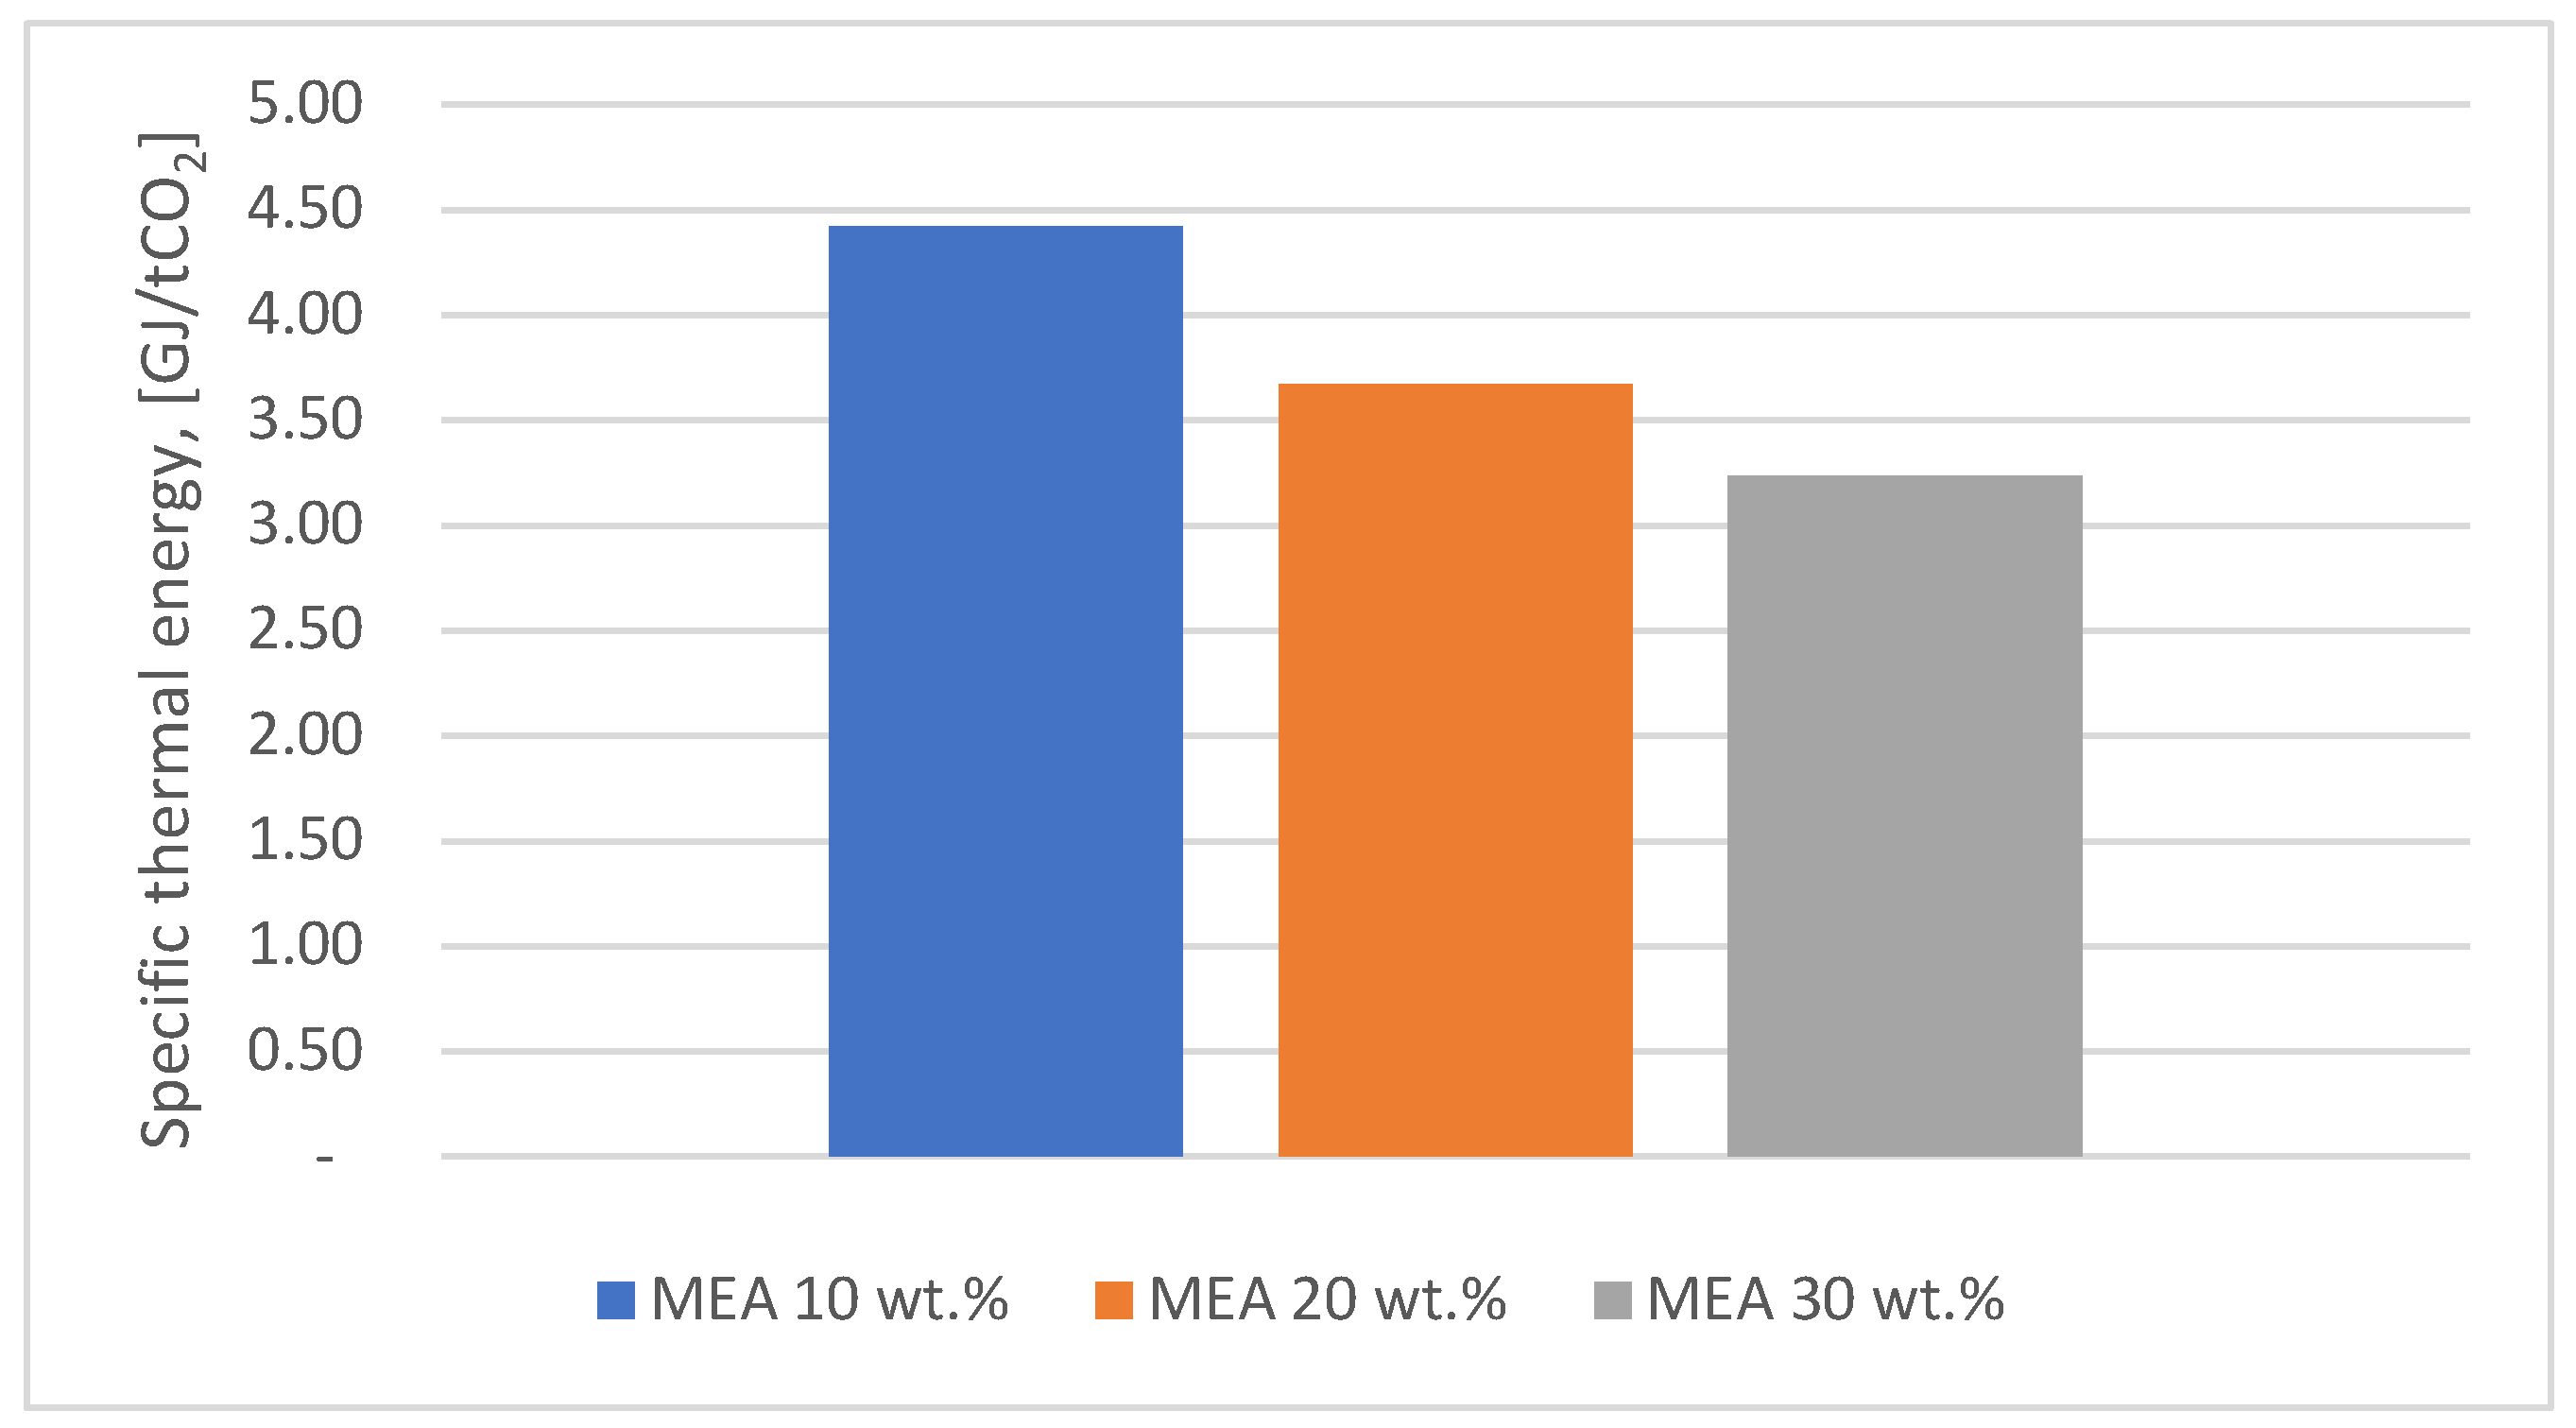
The choice of the chemical solvent was based on a comparison of the values of the thermal energy consumption required to regenerate the solvent (GJ/ton CO2) for the two solvents.
Figure 5 shows the comparison of the values obtained for the thermal energy consumption corresponding to the MEA solvent with different mass concentrations (10, 20, 30 wt.%) while 
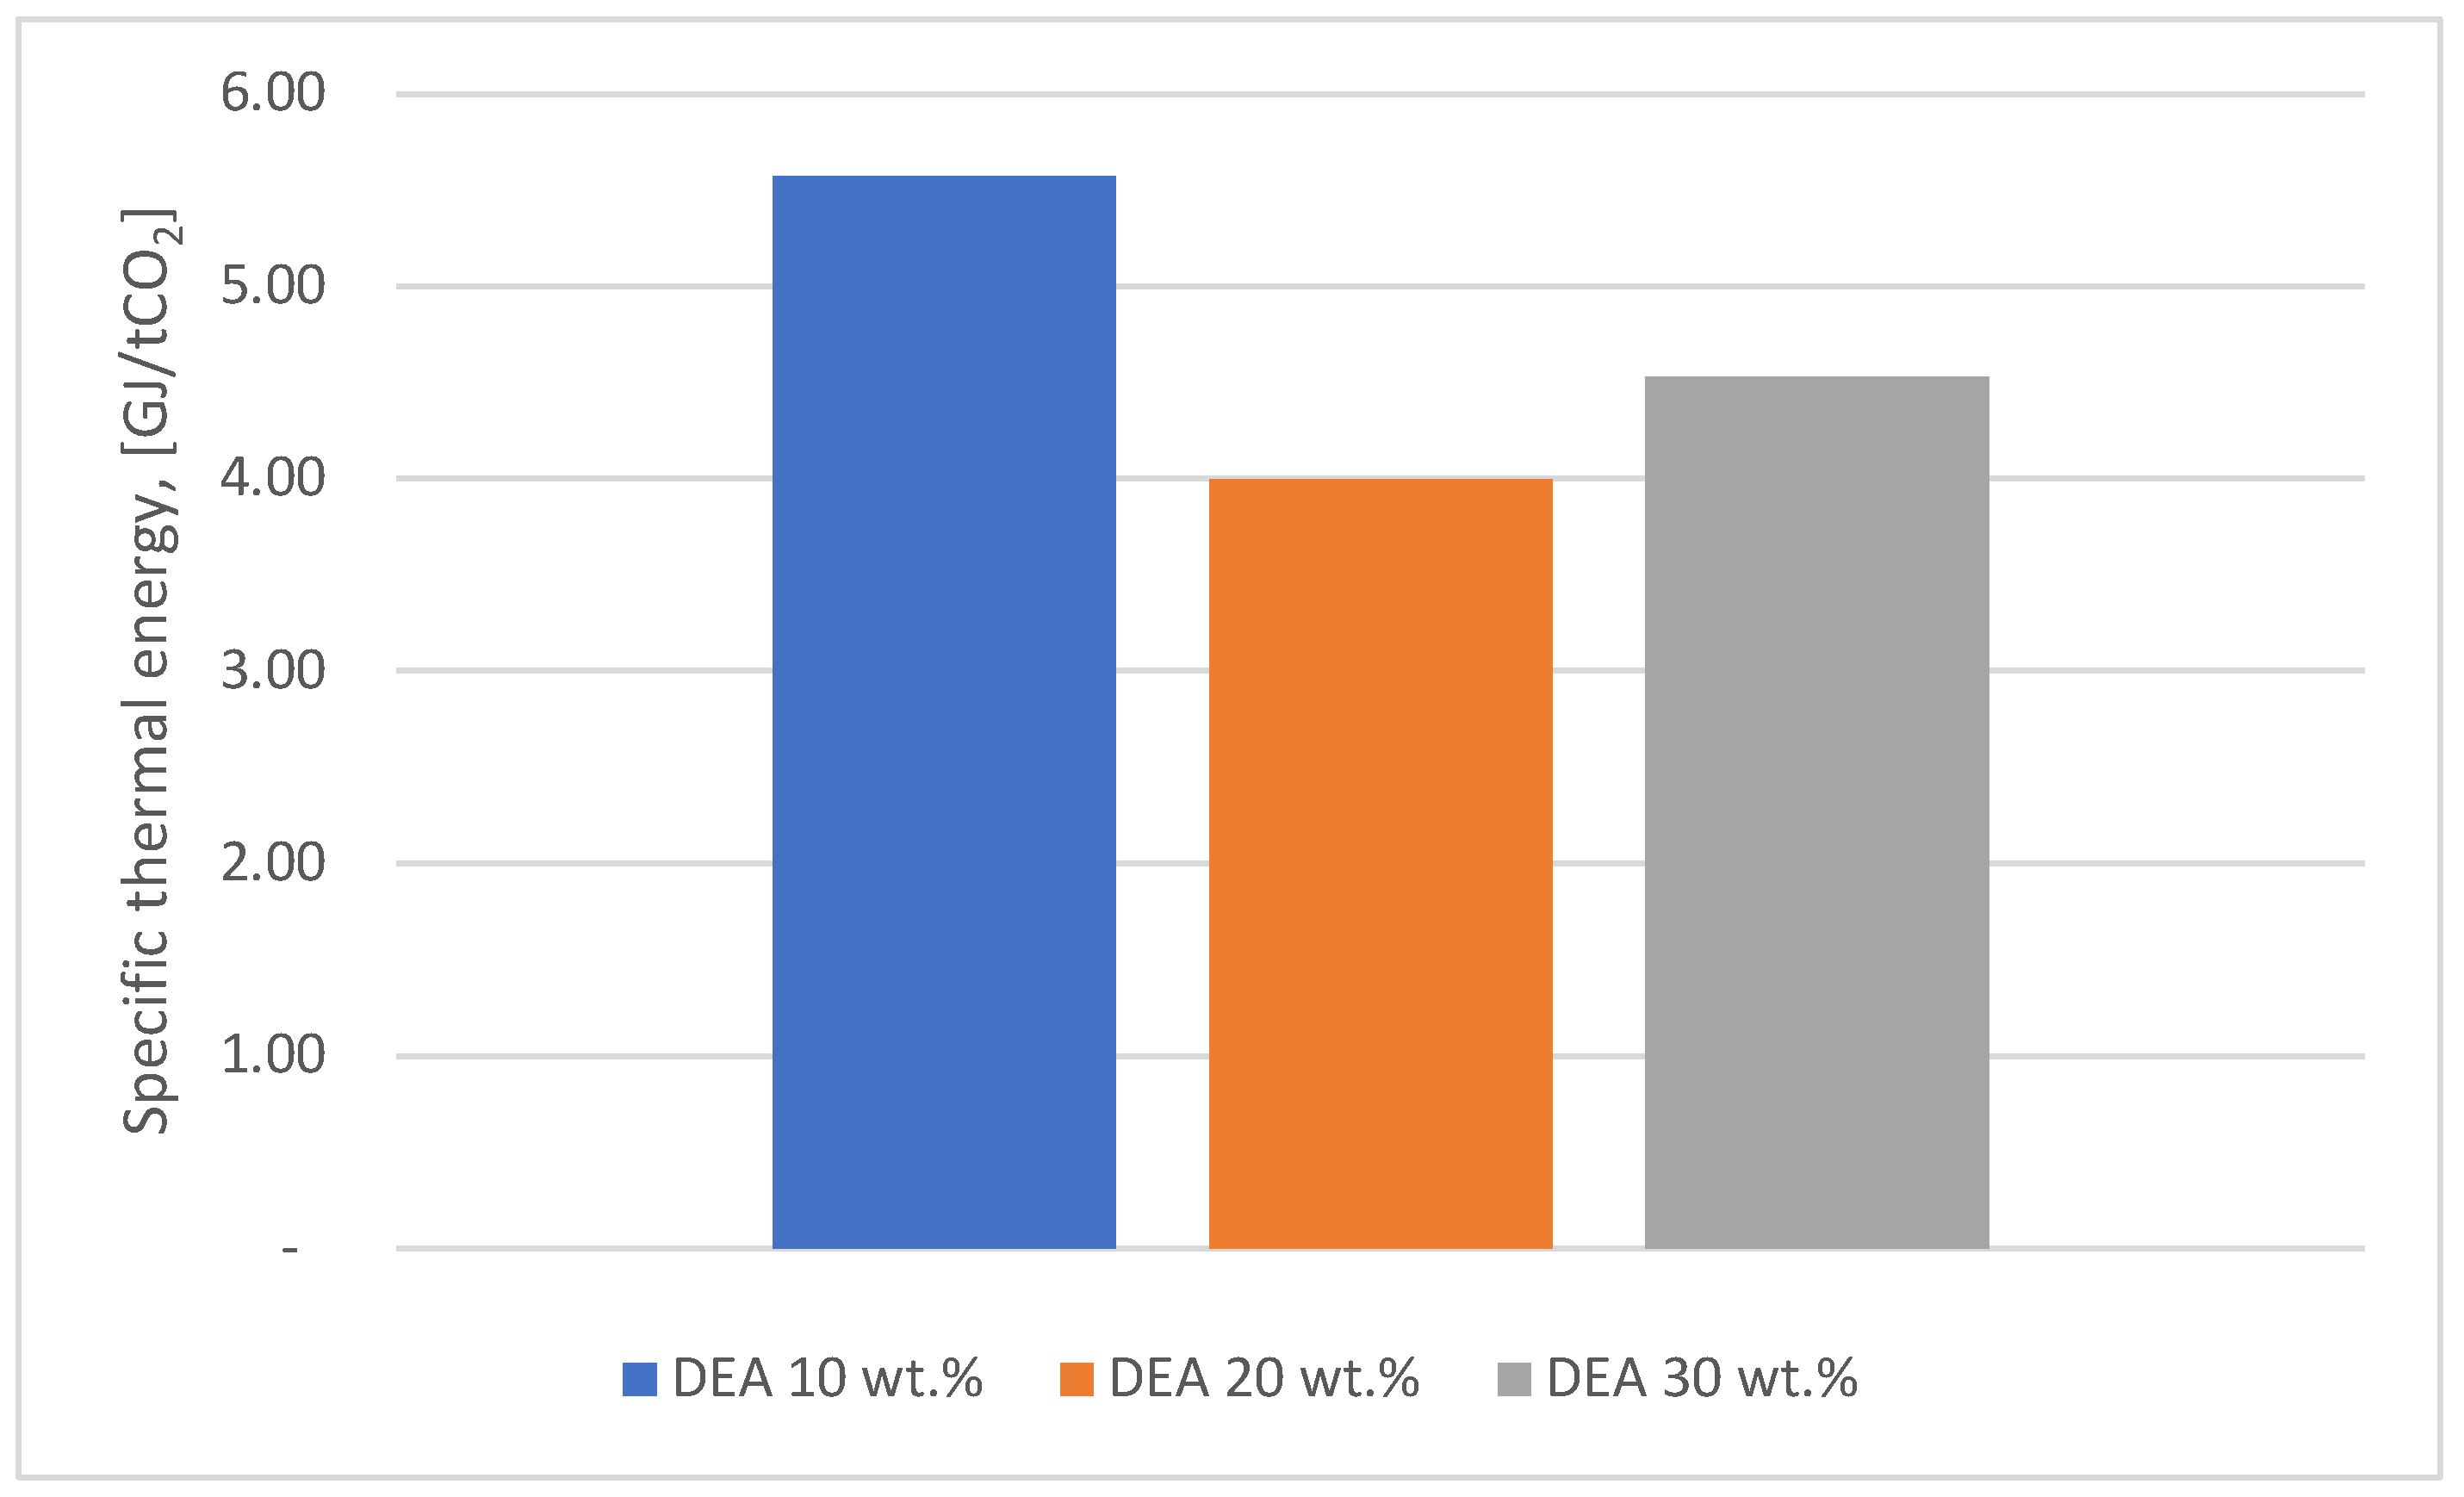
Figure 6 shows the comparison of the results obtained for the thermal energy consumption corresponding to the DEA solvent with the same mass concentrations as for MEA.
It can be seen that the lowest value of thermal energy consumption (3.07 GJ/ton CO2) was obtained for a MEA mass concentration of 30 %. In the case of DEA, the optimum value of thermal energy consumption was obtained for a mass concentration of 20 %, being 4 compared to 3.24 GJ/ton CO2 for MEA. The differences in specific heat energy consumption between MEA at 30 wt.% and DEA at 20 wt.% are due to the physico-chemical properties of MEA, which allow more efficient carbon dioxide capture and regeneration.
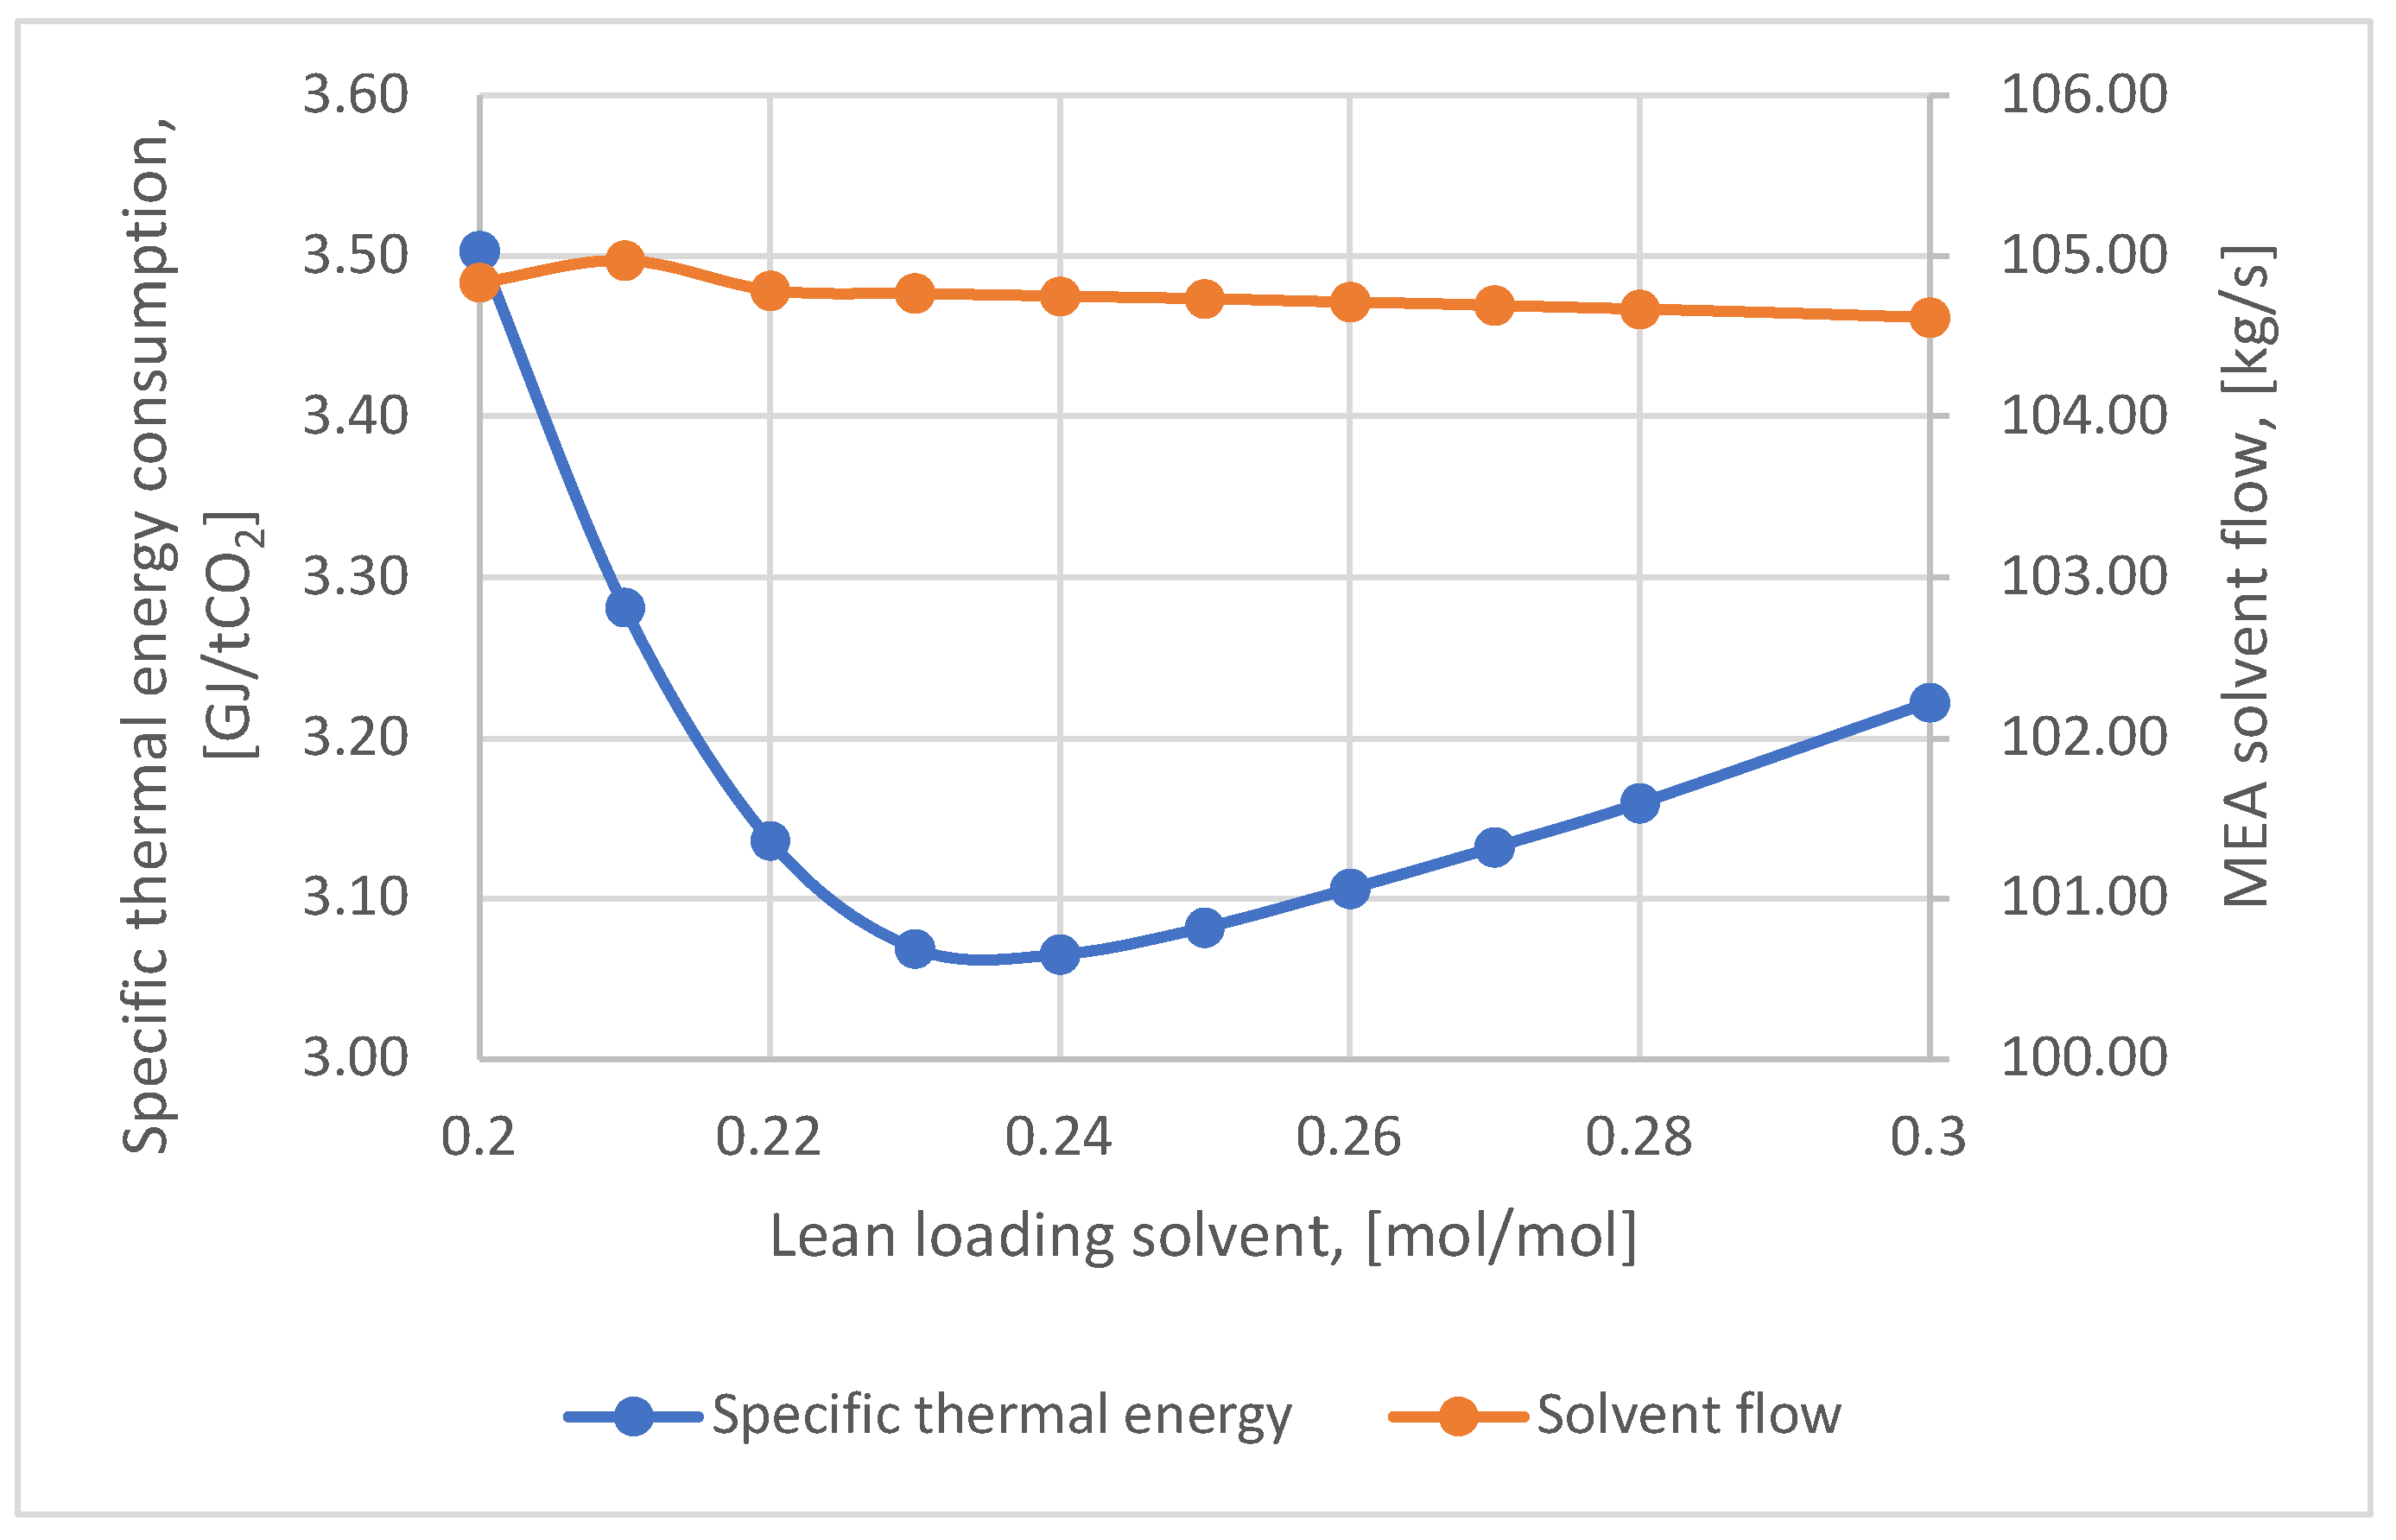
The lean loading solvent was optimized to reduce the heat consumption necessary for the regeneration process. The literature shows that lowering CO2 content in the lean loading solvent requires a higher heat consumption in the reboiler but increases the solvent's absorption capacity, reducing operating costs [63]. Figure 7 shows the variation of the specific heat consumption and solvent flow rate (MEA 30 wt.%) with the lean loading solvent. Thus, it was observed that the lowest value of the specific heat consumption (3.07 GJ/ton CO2) was obtained for a lean loading solvent of 0.23 mol CO2/mol MEA.
The solvent flow rate obtained under these conditions was approximately 105 kg/s. When using the DEA-based solvent at a mass concentration of 20 %, the optimum value for lean loading solvent was 0.2 mol CO2/mol DEA. In this case, the thermal energy consumption was 5.4 GJ/ton CO2, and the solvent flow rate was about 219 kg/s. Therefore, using the MEA-based solvent at a mass concentration of 30% resulted in lower values for both energy consumption and solvent flow rate.
The parameters presented in Table 9 for each of the two solvents analyzed were considered for the choice of the optimal chemical solvent. In addition to the results obtained in this study, various literature references were studied in order to determine the degradation rate of the two solvents [60-61].

4.1.2. Parametrization of the P2M-CC Process

  • Wind turbine plant
The conversion of wind energy to synthetic methane required detailed knowledge of the operation of equipment such as wind turbine, electrolyzer, and methanation reactor and their interaction. Based on the data collected from the website https://www.meteoromania.ro/, a database for the year 2023 corresponding to the Fieni area (Argeș county, Romania) was built including information related to the average wind speed, wind frequency, and wind speed distribution. The collected data helped to determine the location with the most advantageous wind potential in relation to the type of wind turbine chosen [
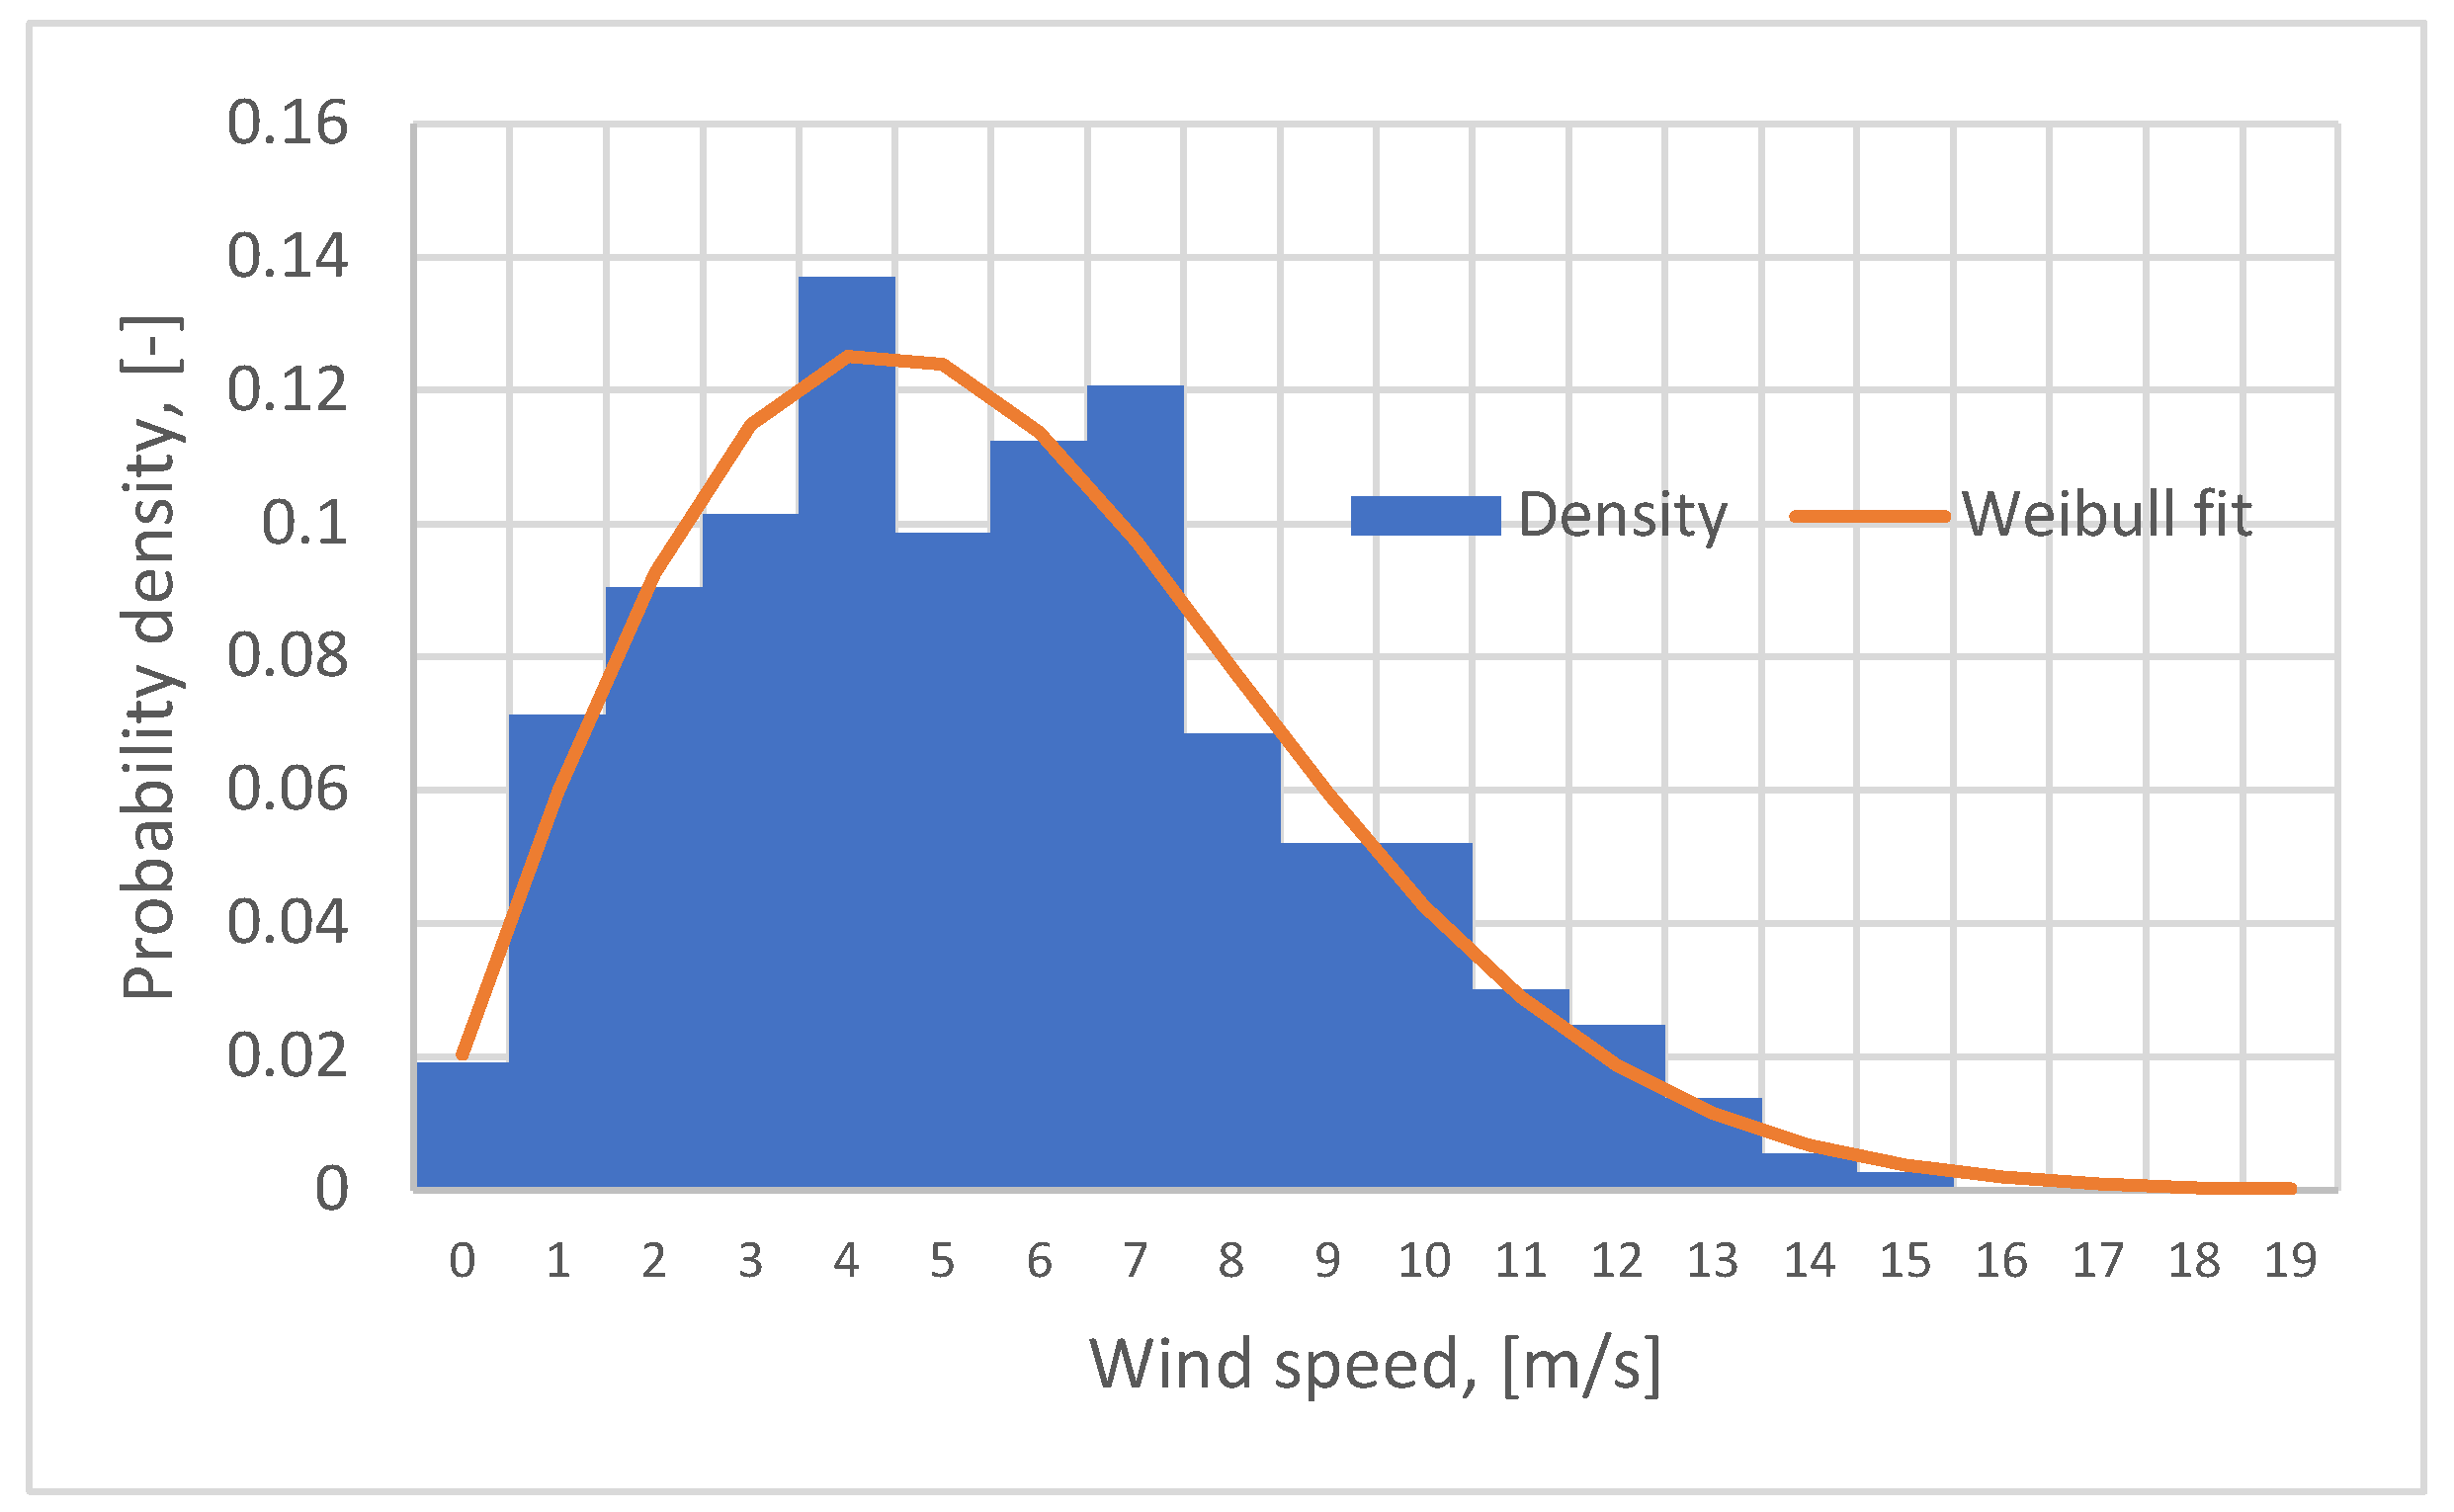
66]. The Fieni region is known for its existing wind potential allowing the development of energy projects based on the use of wind energy. Based on this information, the wind power plant was sized to ensure the electricity production capacity required by the whole system (electrolyzer, cement factory, etc.). Thus, the wind potential during 2023 was evaluated using Weibull distribution to model the wind speed distribution (Figure 8). Analyzing Figure 8, it can be observed that in about 14% of the cases, the wind speed ranged between 4-5 m/s, and in 12%, it ranged between 7-8 m/s. In order to determine the location for wind turbine siting, it is necessary to identify areas characterized by wind speed greater than 5 m/s.
Table 9 shows the characteristics of different types of wind turbines, including rotor diameter, power rating, tower height, minimum wind speed, and nominal wind speed. It identifies several types of turbines: Vestas, Siemens, or Enercon [67 - 69]. The choice of the type of wind turbine takes into account the meteorological characteristics of the area.
Taking into account the technical characteristics of wind turbines, in this study it was considered that the Vestas V150 wind turbine best suits the specific meteorological conditions of the Fieni area. In addition, Vestas V150 wind turbines are characterized by high reliability for different wind speed values which make them suitable for energy projects based on wind energy exploitation.
The capacity coefficient of a wind turbine, expressed as a percentage, is the ratio between the electrical energy actually produced by the wind turbine and the maximum energy it could have produced if it had been continuously operated at rated capacity. Taking into account the V150 wind turbine's power curve over the year (equation 2), the capacity coefficient is estimated to be about 24,7 %. In other words, 24,7 % of the period of one year the turbine operates at rated capacity. For simplicity, in modeling the operation of the wind power plant, the capacity factor was considered as 25%.
  • b. Alkaline electrolyzer
The specific characteristics of the different types of electrolyzers are summarized in Table 10. Among the types of electrolyzers presented, alkaline electrolyzers (AEC) are considered mature with multiple industrial applications. Aqueous alkaline solutions are used in such equipment and potassium hydroxide (KOH) based solution is preferred due to high electrical conductivity but also due to low electrode corrosion. Metal alloys such as Ni-Mo, Ni-Cr-Fe and low alloyed steels are the materials used for electrode materials. Taking into account the operating parameters (pressure, temperature, non-corrosive character of the electrolyte), the alkaline electrolyzer is an optimal choice for the P2M concept.
  • c. Methanation reactor
The hydrogen obtained in the electrolysis process and the carbon dioxide captured in the chemical absorption process react in the methanation reactor to produce synthetic methane. The methanation technology is appropriately sized to supply the full amount of synthetic methane required by the cement plant. Synthetic methane thus fully replaces fossil natural gas. Therefore, the methanation reactor is not only a solution for storing renewable energy in synthetic methane but also for reducing CO2 emissions by providing a sustainable solution for the production of alternative fuels.
Knowing the characteristics of the methanization reactor, presented in Table 1, as well as the amount of CO2 available after the chemical absorption process, the amount of hydrogen needed to obtain the synthetic methane requirement corresponding to the Sabatier reaction is determined (Equation 37).
Taking into account the information specific to each equipment used in the concept (P2M-CC), the main operational flows presented in Table 11 were determined. The determination of these flows is essential for the appropriate sizing of each equipment used (electrolyzer, methanation reactor, CO2 capture process, wind power plant). This information is useful in technico-economic calculations (CAPEX and OPEX costs) and financial assessments.

4.2. Economic and Technical Evaluation of Integrating P2M-CC in a Cement Factory

This section aimed to determine the economic and technical impact of involving the P2M-CC concept in the cement plant. The techno-economic analysis consisted in determining the capital (CAPEX) and operation and maintenance (OPEX) costs for the four scenarios defined above.
The main parameters considered in the techno-economic analysis and their range of variation are presented in Table 11.
The results obtained and presented in Table 12 are based on the initial values of the parameters presented in Table 11, which were used in the techno-economic assessment of each scenario analyzed.
Table 12 centralizes the techno-economic results for the four scenarios analyzed in this study. The baseline scenario is characterized by the highest environmental impacts due to using natural gas and the lack of investment in advanced energy generation and decarbonization based technologies. In the absence of a policy on decarbonizing the energy-intensive industry, the baseline scenario presents the most competitive discounted cost per ton of cement of about 103 €/ton. The application of a CO2 emission tax of 80 €/ton increases the LCOC indicator to 169 €/ton of cement for the reference scenario, which is surpassed by the ideal scenario S2.1 whose LCOC value is 71 €/ton of cement. Although all the upgraded scenarios (S2. 1-3) show high environmental performance by integrating CO2 capture technology, the economic performance is totally different due to the technical assumptions underlying their construction. The high investment costs in the full scenario S2.1 lead to a high cost for the LCOC indicator (297 €/ton of cement) while in the realistic scenario S2.3 the LCOC indicator value is the highest among the cases studied (333 €/ton of cement) due to very high operating costs (the electricity procurement process being the basis for these high costs).
Taking all these aspects into account, the integration of the P2M-CC concept in a cement plant leads to a drastic reduction of CO2 emissions achieving an almost complete decarbonization. However, the implementation of this solution in cement plants requires the optimization of all process parameters (wind power plant, electrolyser, methanation reactor, cement plant, CO2 capture technology) and the implementation of environmental regulations (CO2 tax) in order to obtain the ideal technological conditions to achieve the above mentioned economic performances.
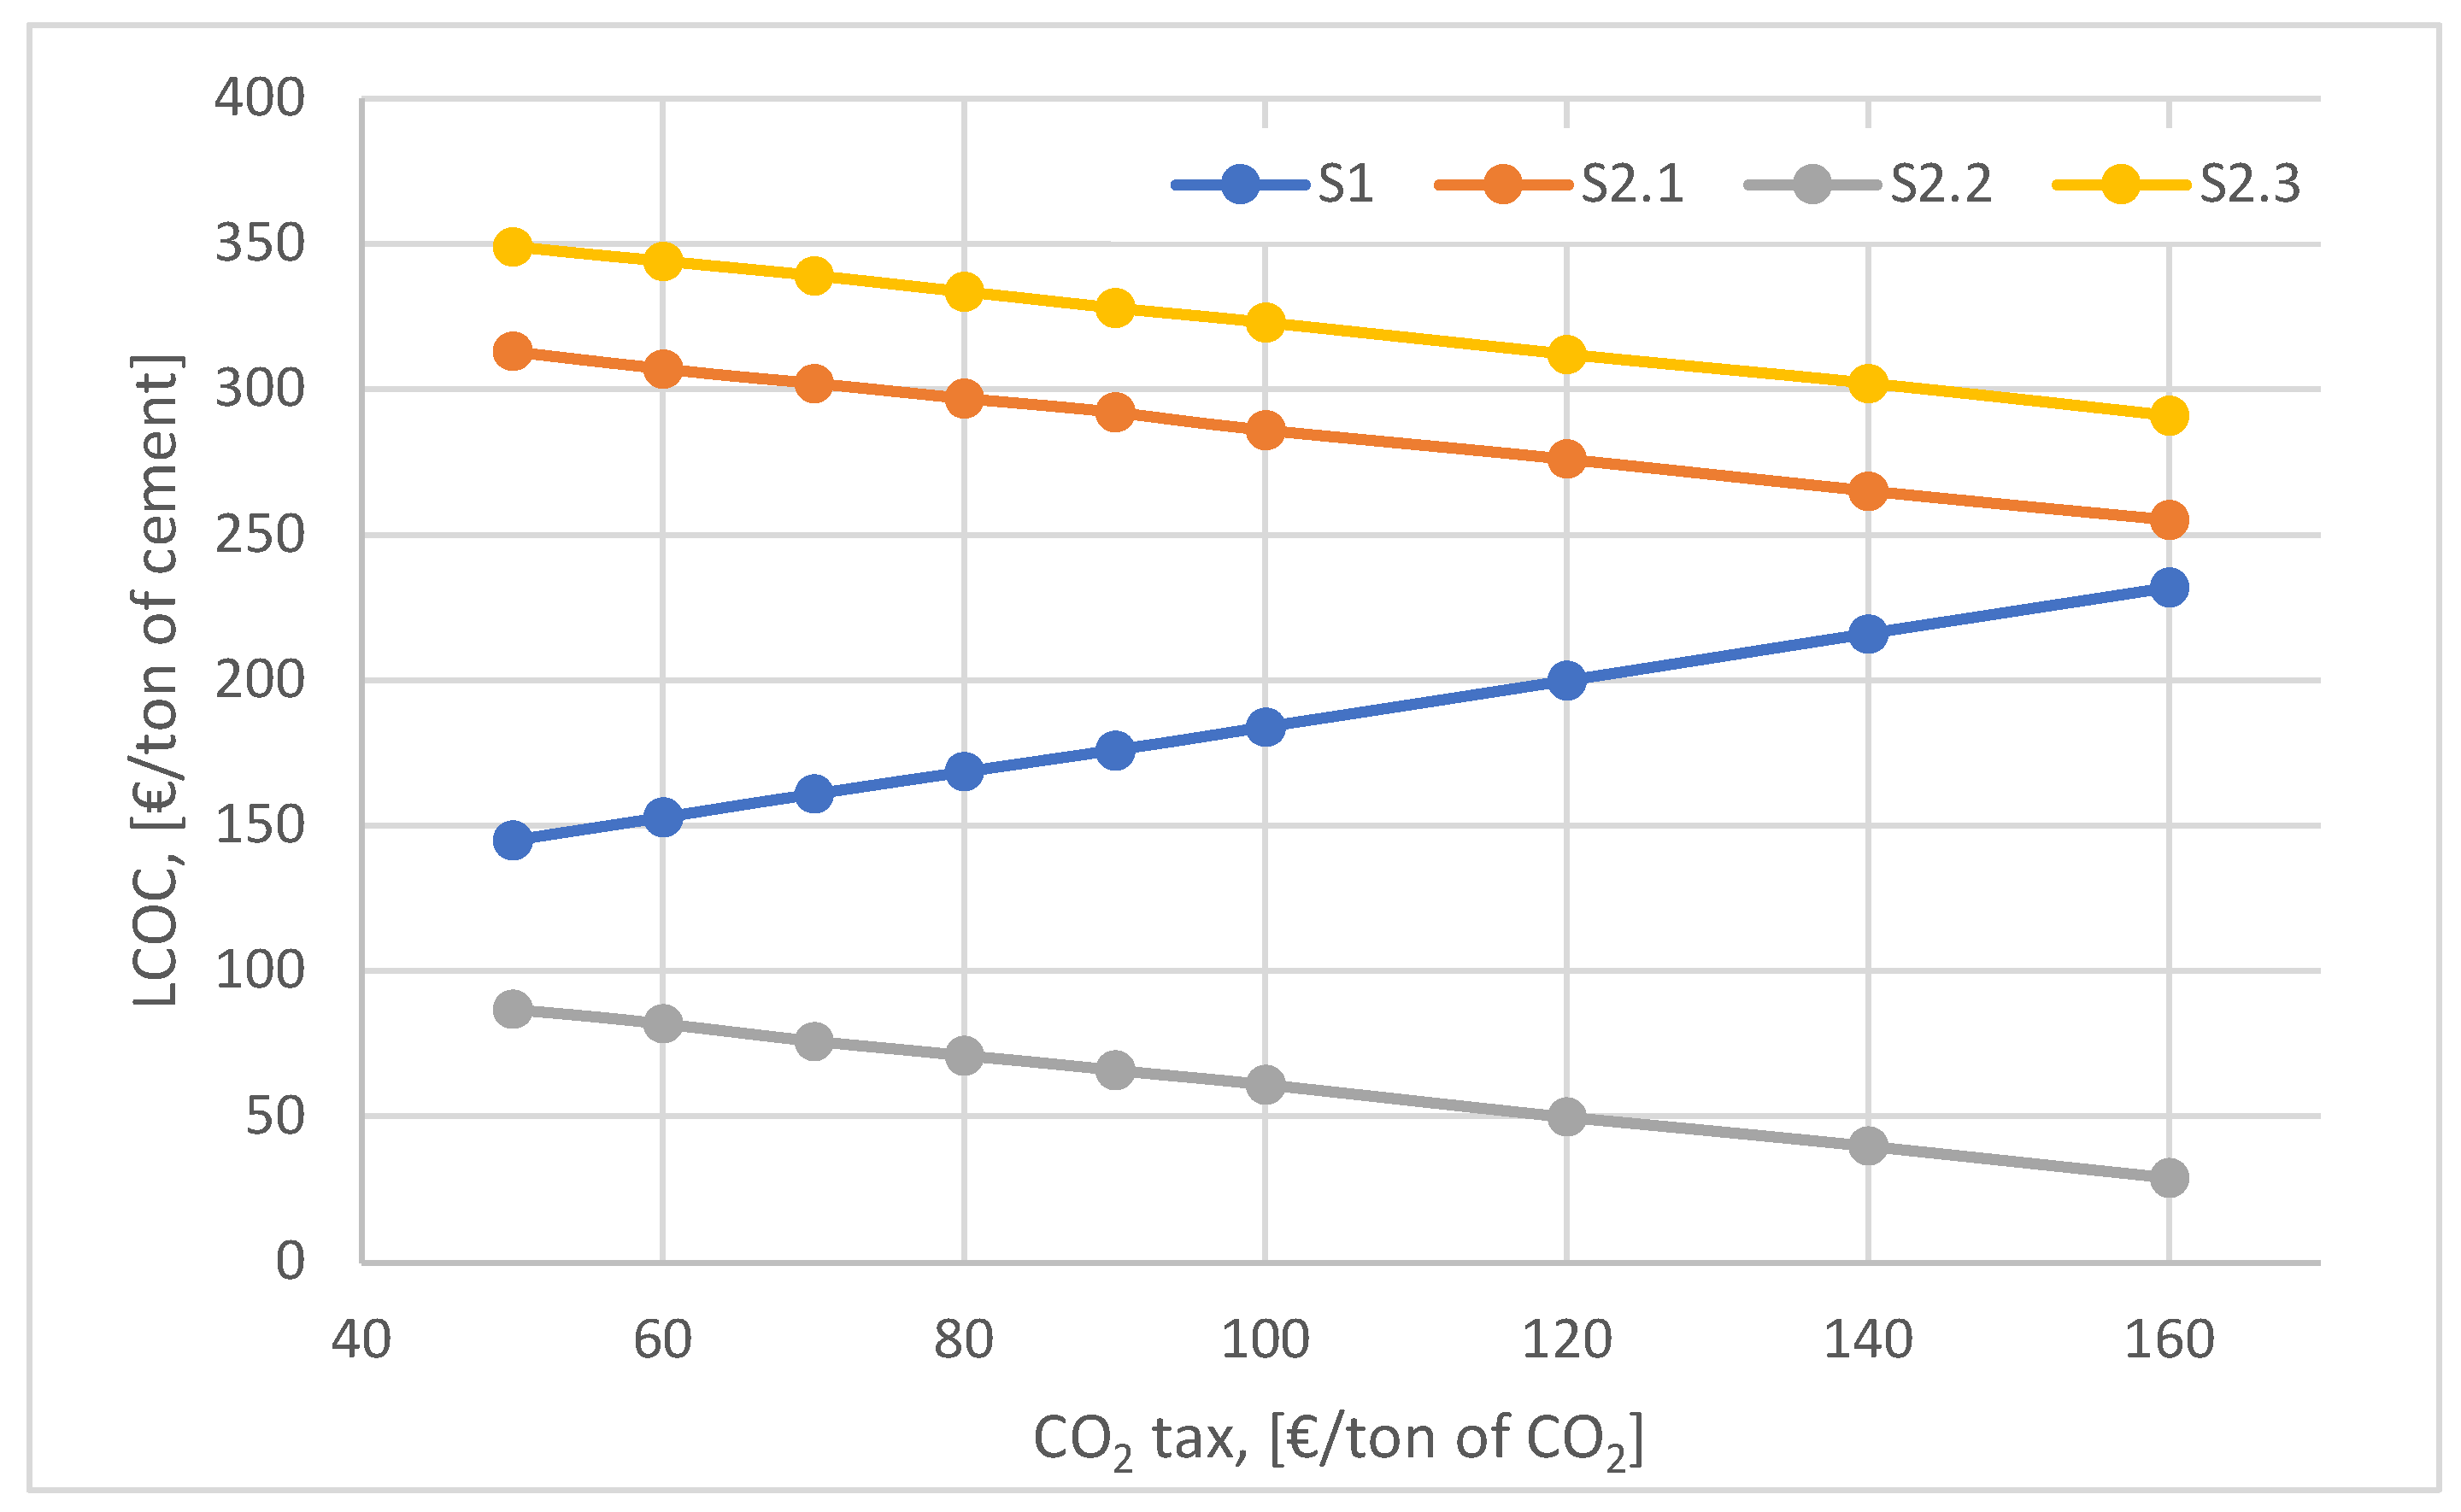
The influence of the CO2 emission tax increase on the discounted cost per ton of cement is shown in Figure 9. Although the ideal scenario, S2.1, is the most competitive scenario presenting the lowest LCOC indicator value (below 100 €/ton of cement) for CO2 tax values ranging between 50 - 160 €/ton of CO2, its implementation is dependent on large investments in advanced technologies (e.g. electrolyzer, methanation reactor, CO2 capture technologies). The feasibility of the full and realistic scenarios (S2.1 and S2.3) depends very much on the EU policy to accelerate the increase of the CO2 tax so as to stimulate the development of advanced technologies and consequently reduce their specific costs (wind power plants, methanation reactors, electrolysers, CO2 capture technologies).
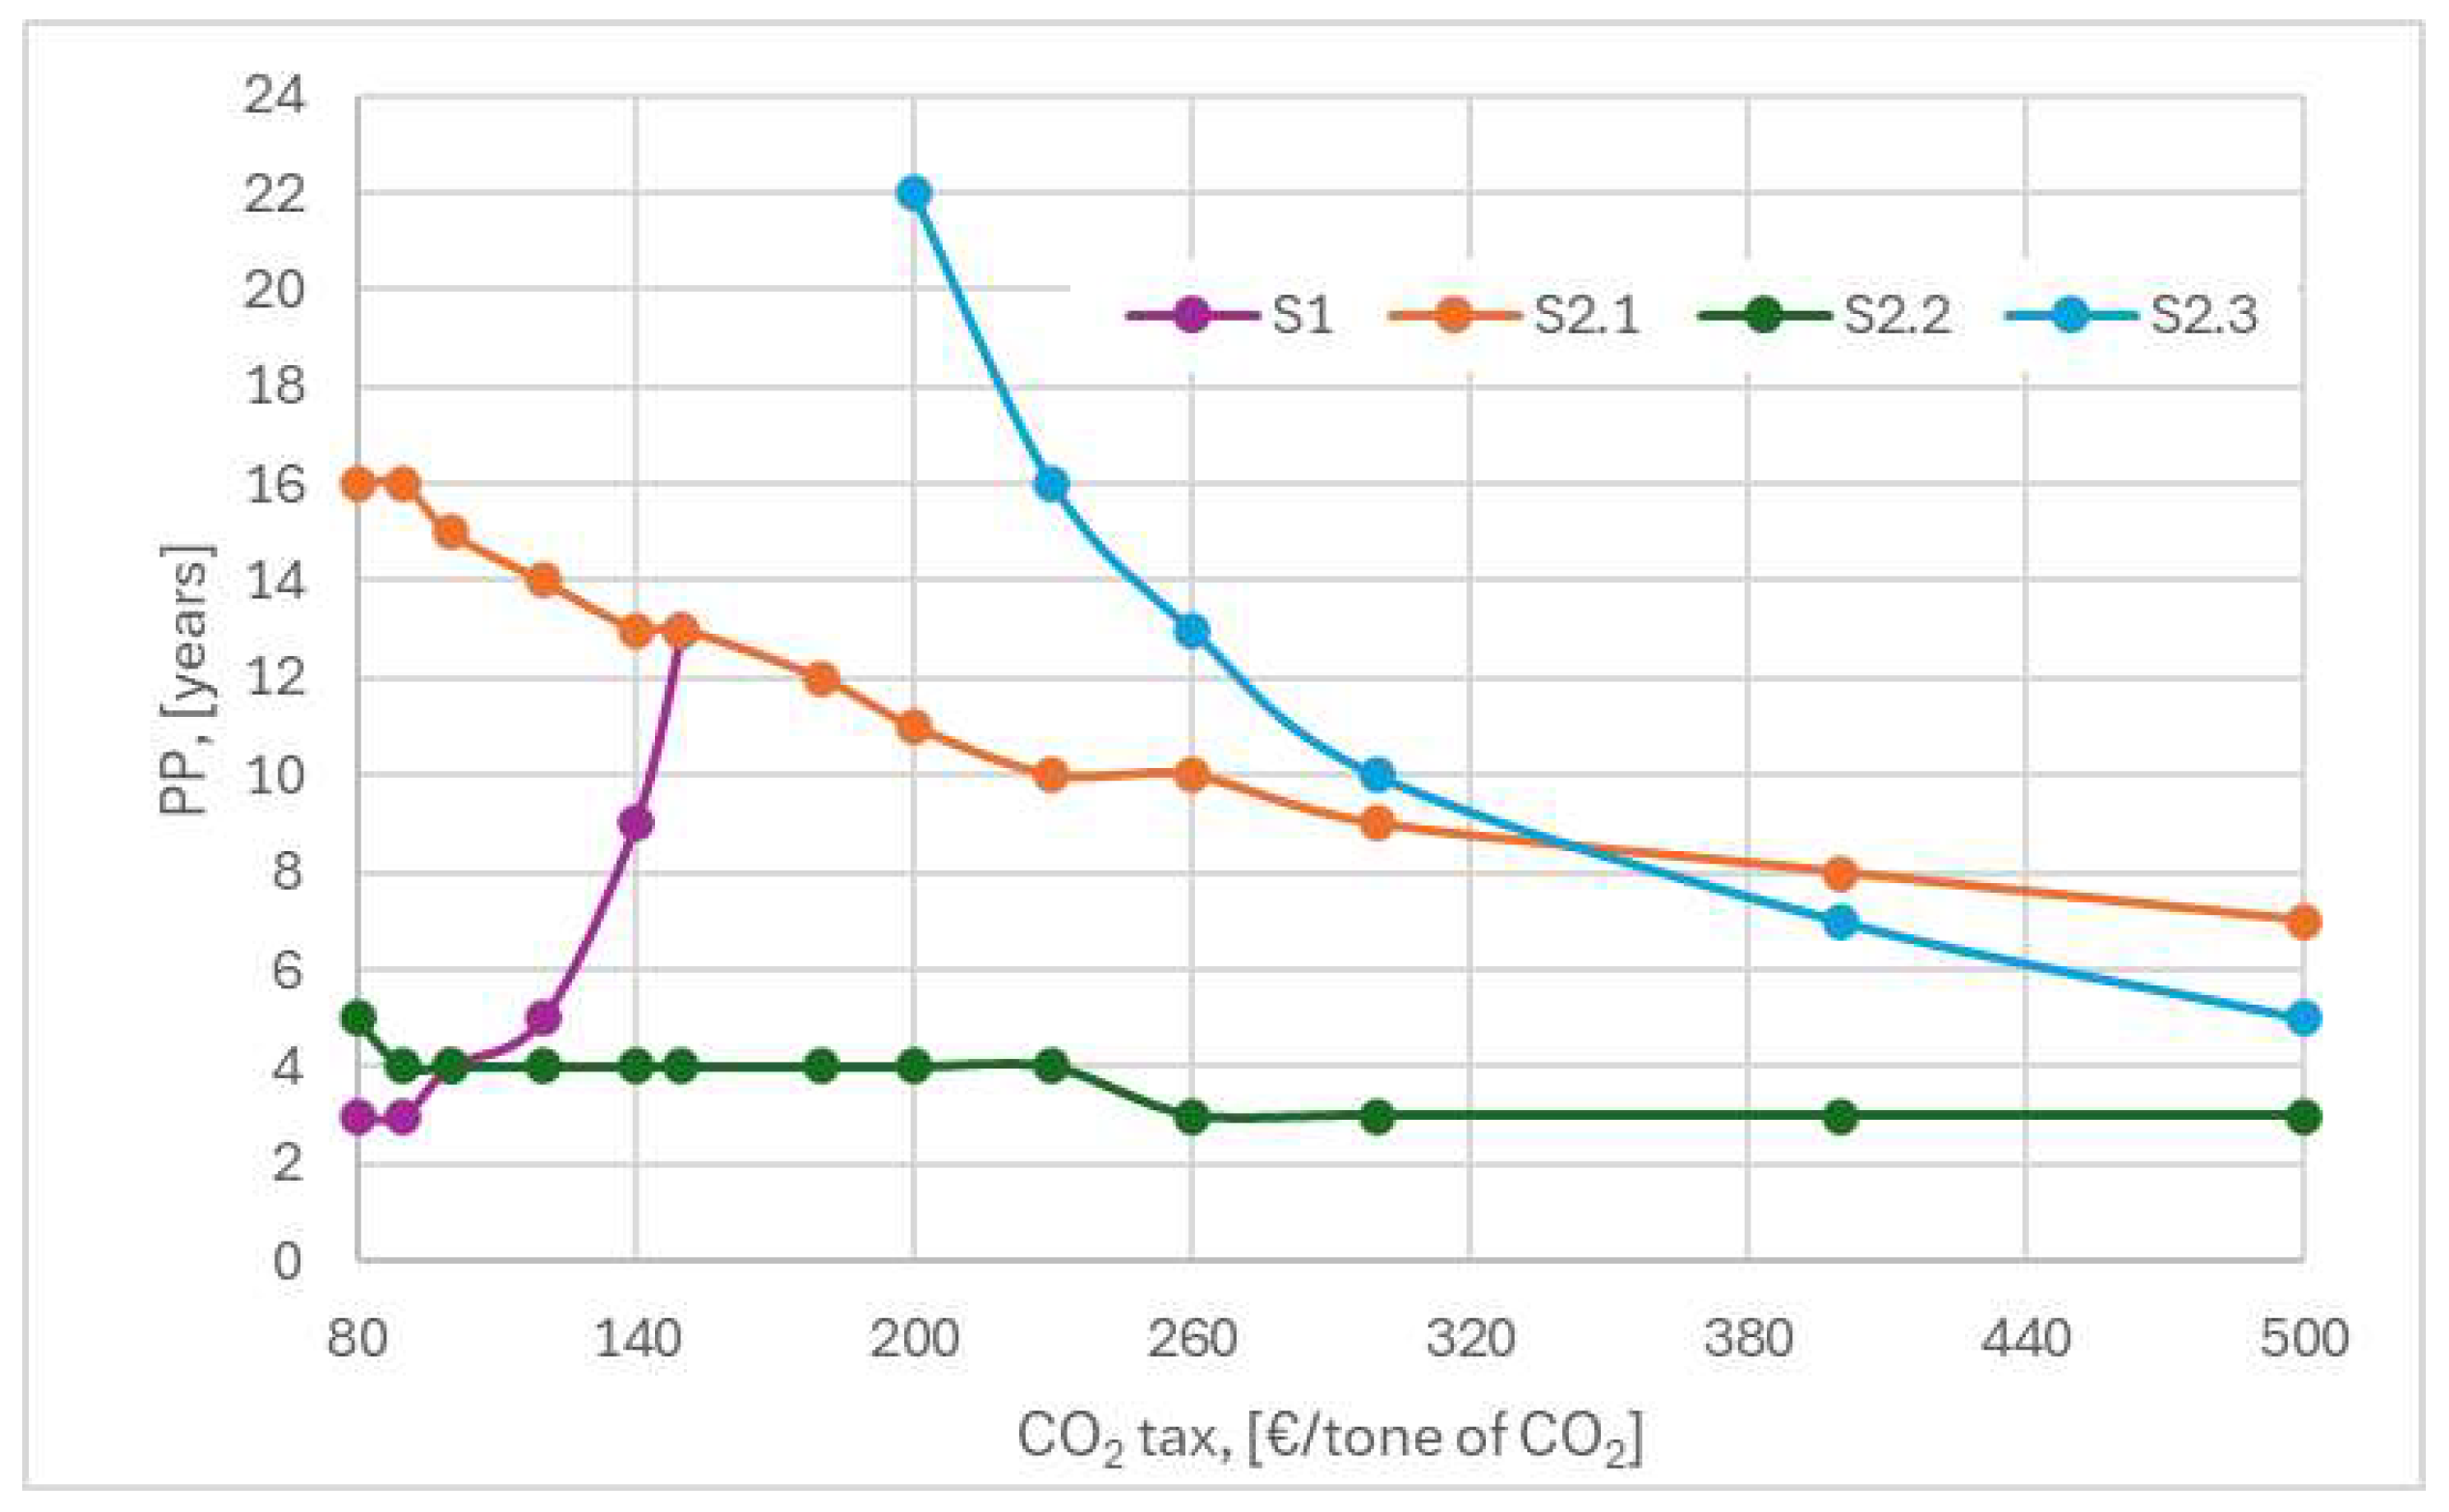
Figure 10 shows how the CO2 emission tax increase influences the payback time for each of the four scenarios analyzed by showing the differences in their economic outcomes by grouping them into two categories as not feasible or competitive. It is evident that the scenarios that were constructed considering CO2 capture technology were advantaged (lower payback times with increasing CO2 tax) but this advantage differed from scenario to scenario (S2.1-3) according to the assumptions that were the basis for their construction.
Of the three cement plant modernization scenarios (S2.1-3), the ideal scenario S2.2 is by far the most profitable due to low investment costs. However, this scenario is not very credible since the entire amount of electricity needed for the plant is available and there is no need to purchase wind power plants. The purpose of such a scenario is to utilize the wind energy produced in excess. The full scenario S2.1 considers the purchase of the wind power plant to supply the full amount of electricity but the investment and subsequent operation and maintenance costs are not quickly compensated by the increased CO2 tax and a longer payback period is needed. In contrast to the S2.2 scenario, the full scenario is advantaged by high values of the CO2 tax. In other words, the purchase of the wind farm is not a feasible option as long as the CO2 tax is reactively low, below 350 €/tonne of CO2. The realistic scenario, S2.3, is based on the fact that the wind farm exists but it only supplies one third of the electricity produced (during the night the electricity is produced in excess). Consequently, the rest of the electricity needed by the cement plant is purchased from the same supplier that manages the wind farm. Therefore, the electricity operating costs start to offset at high values of the CO2 emission tax, with the payback period becoming shorter as the CO2 tax increases. It can be observed that for values higher than 350 €/ton of CO2, the realistic scenario becomes more attractive than the full scenario (i.e. it is more attractive to purchase the electricity than to invest in the wind farm). Further analysis shows that for values above 600 €/ton of CO2 the realistic scenario becomes as attractive as the ideal scenario.
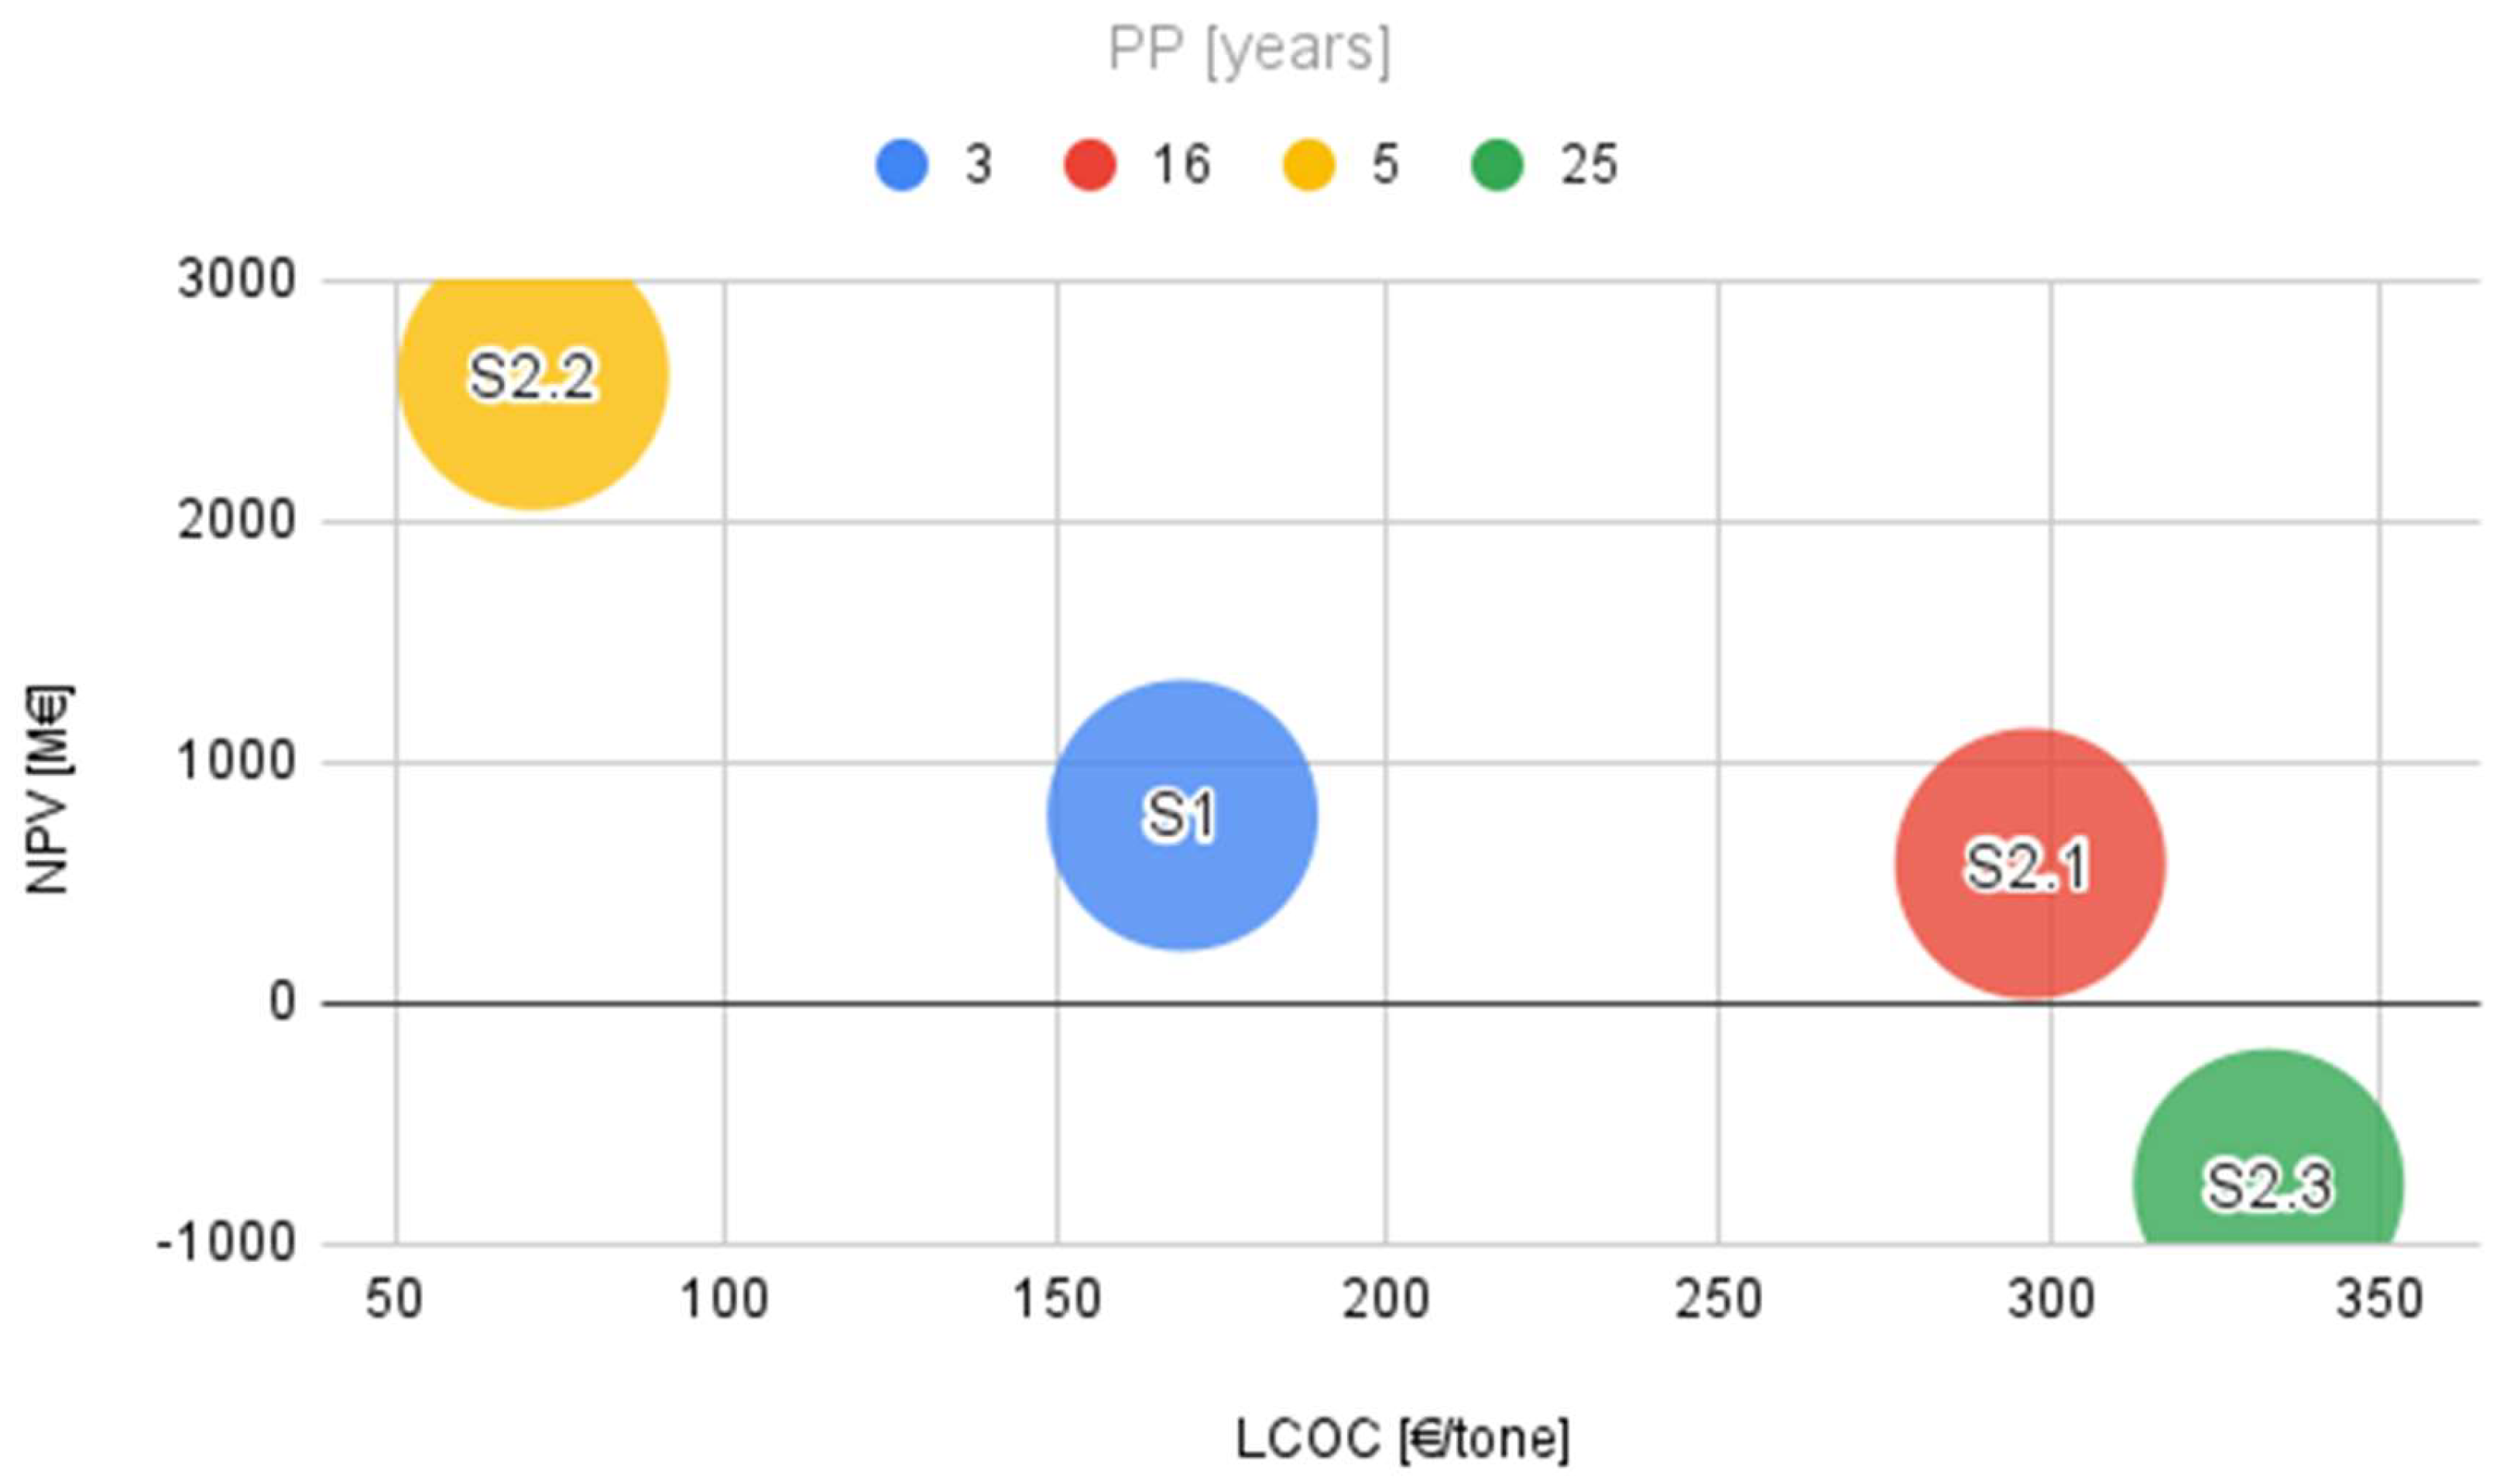
Considering a constant value of the CO2 tax, the simultaneous evaluation of the discounted cost of cement (LCOC), the discounted net present value (NPV) and the payback period (PP) allowed to distribute the analyzed scenarios on a graph (Figure 11) in order to highlight the large differences between their techno-economic results. It can thus be seen that the position of the realistic scenario S2.3 indicates an unfavorable combination for all three indicators, the scenario being completely unrealistic in the current economic context. On the other hand, the baseline scenario, S1, and the full scenario, S2.1, although they are at about the same level of the NPV indicator, have completely different results for the LCOC and PP indicators due to the large investments made in the modernized scenario (S2.1), the latter becoming economically unattractive.
However, even with a relatively low CO2 emission tax (80 €/tonne of CO2), the modernized cement plant can still perform significantly better than the reference scenario if electricity is supplied from external sources without the need for initial investments and high operating costs (S2.2).
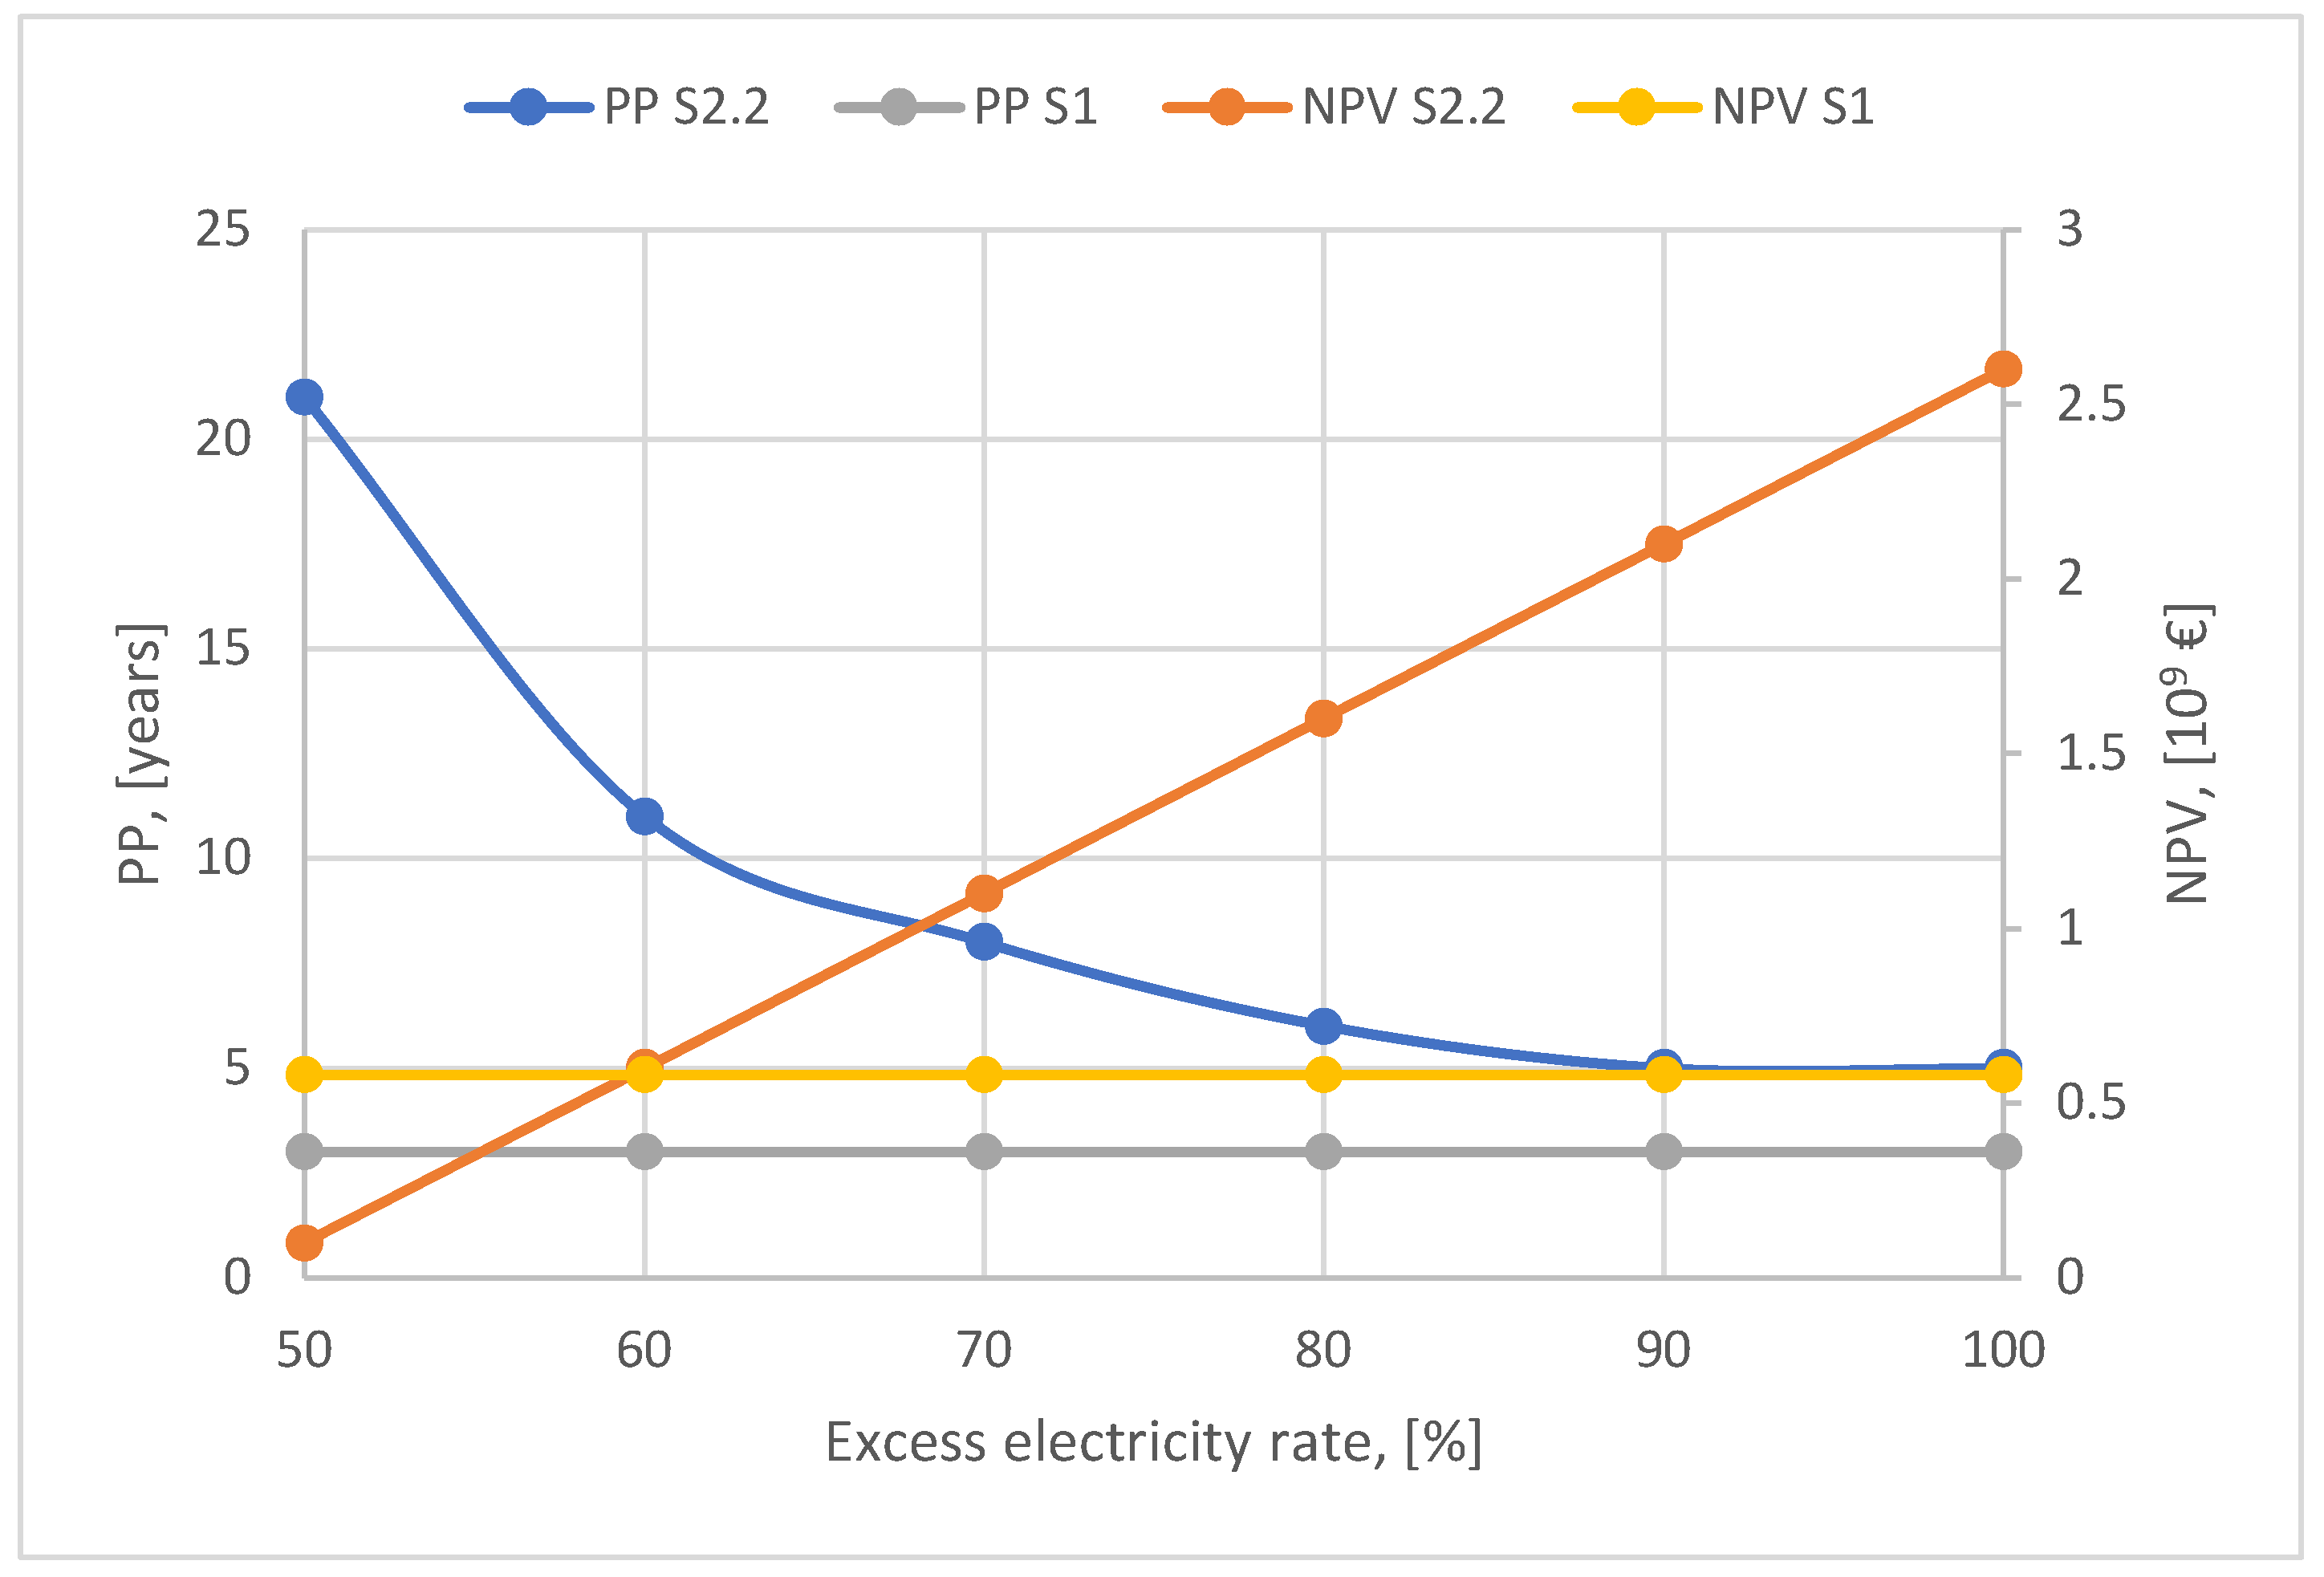
Moreover, the ideal scenario remains competitive even if the wind power plant does not fully cover the electricity needs of the cement plant but only 70-80 % as shown in Figure 12.
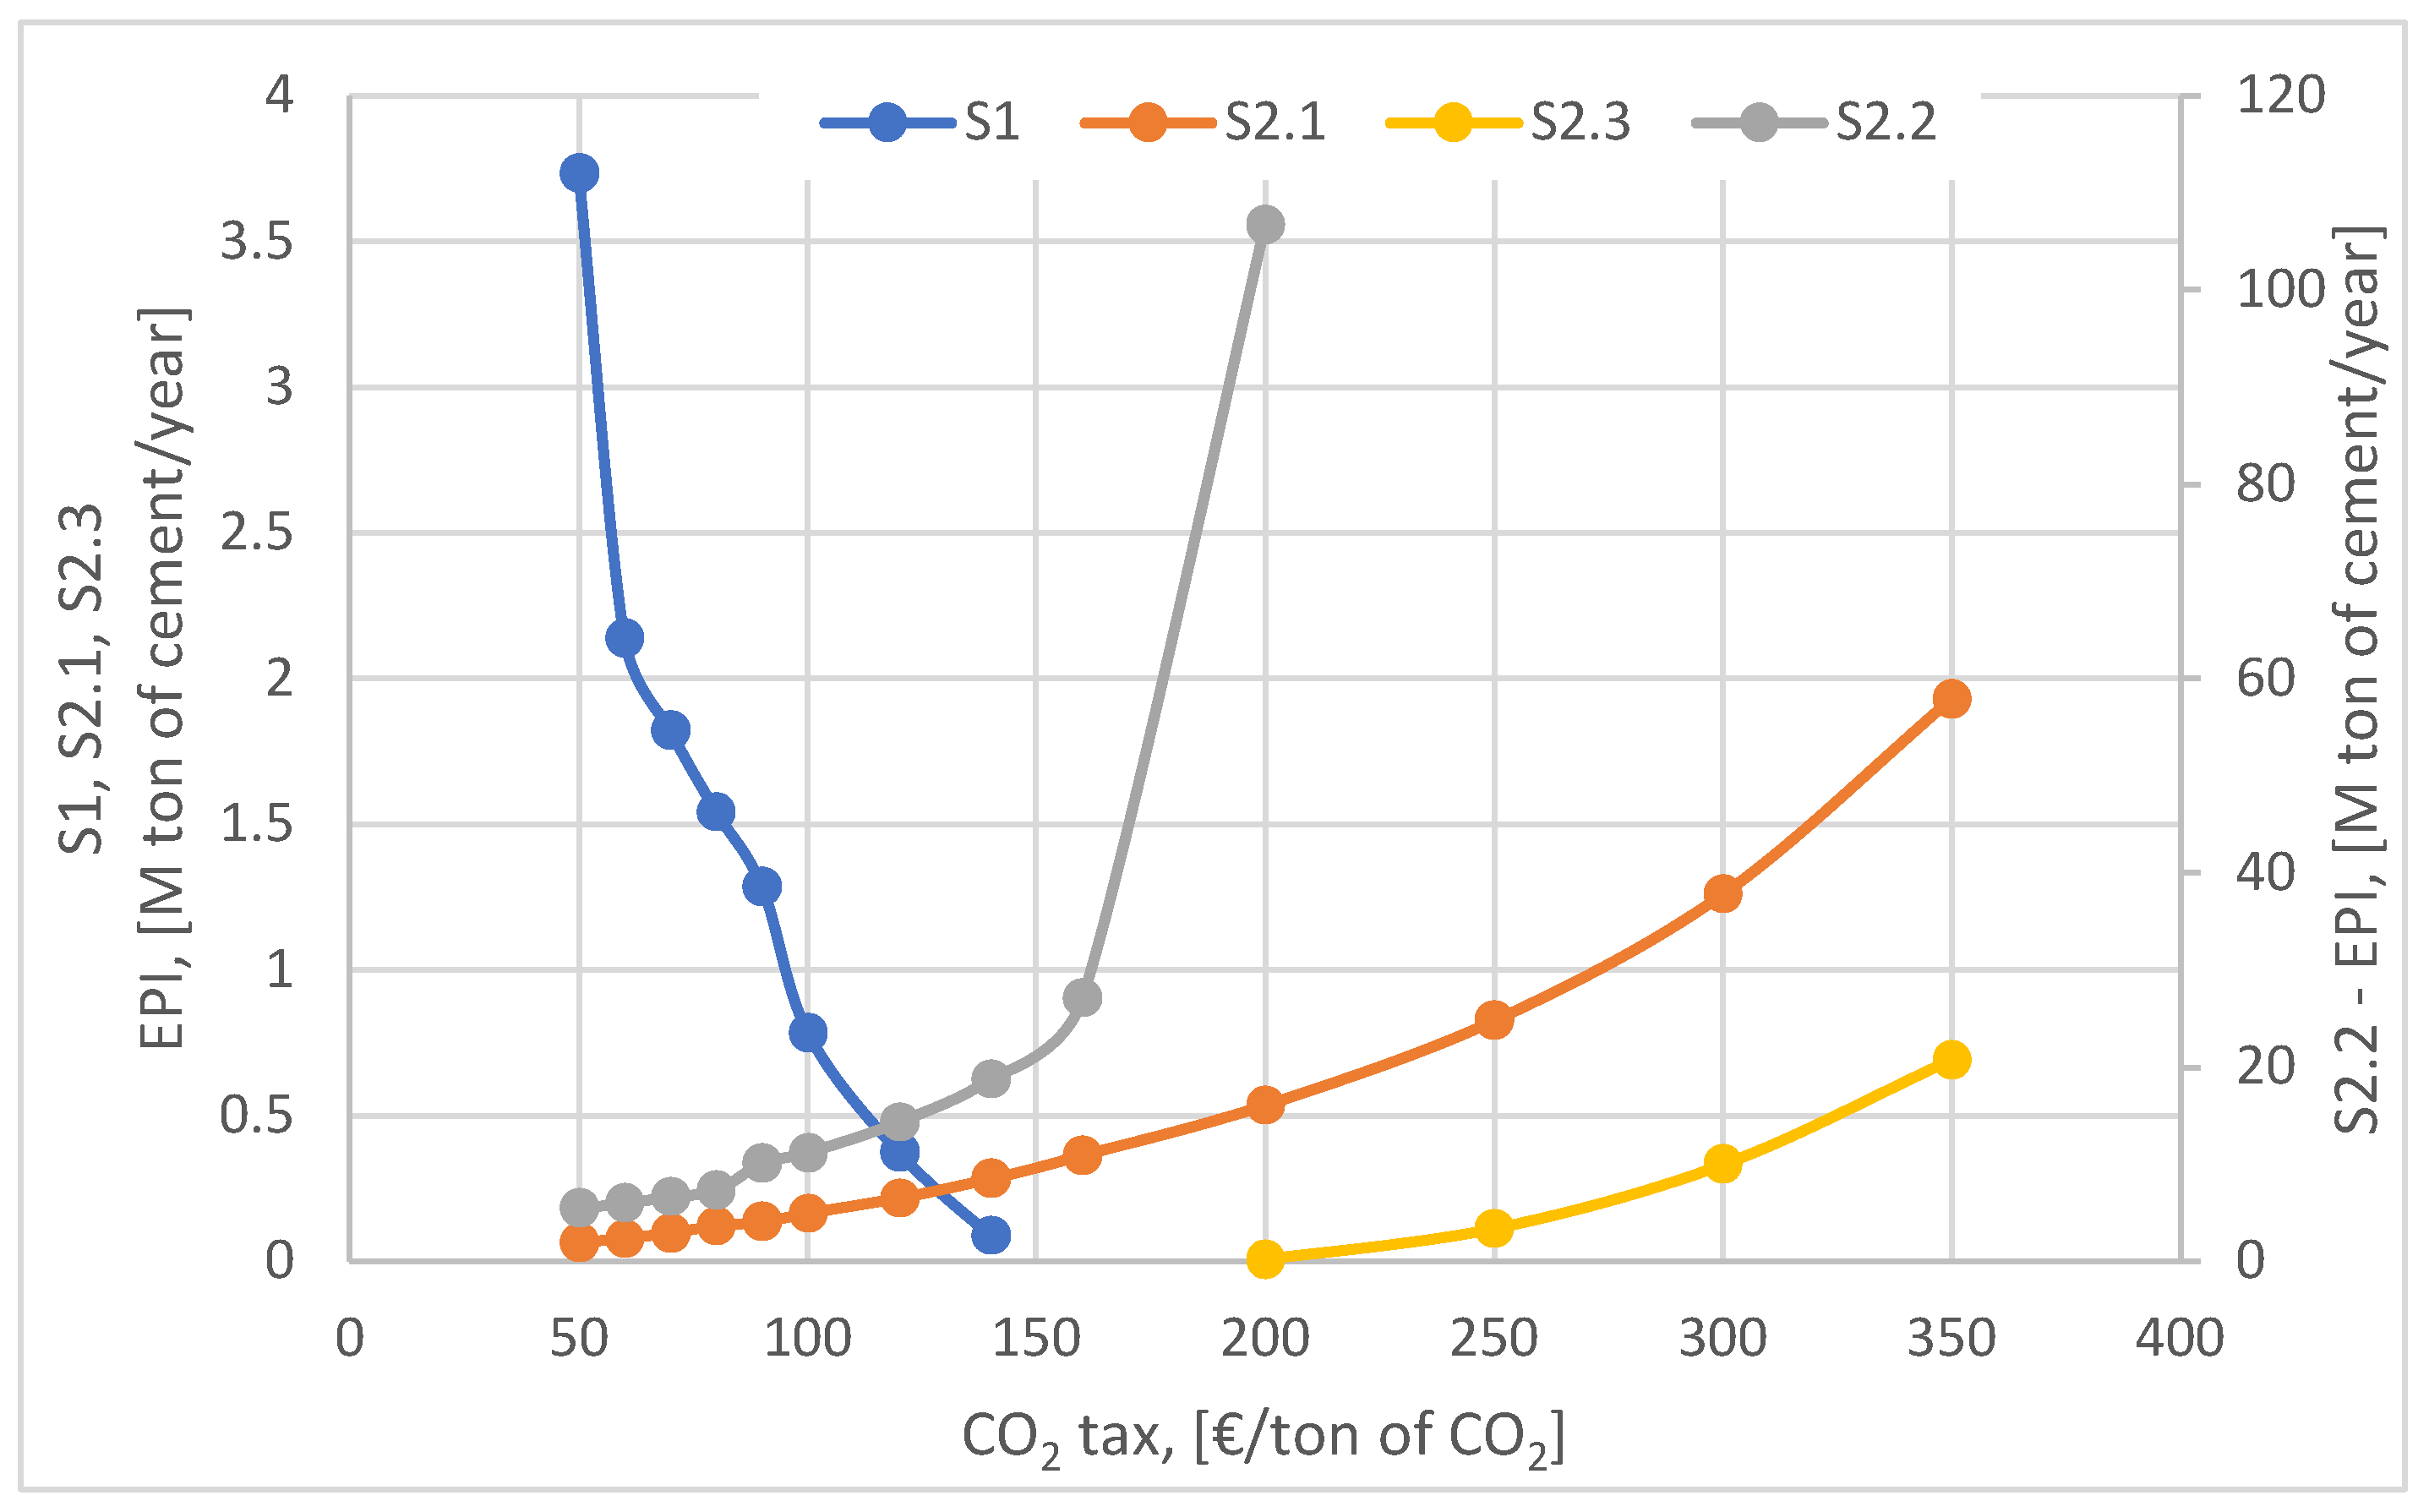
Figure 13 illustrates the evolution of the EPI indicator for the four scenarios analyzed, as a function of the variation of the CO2 tax considering the current trends of the European Union policies. Taking into account the assumptions underlying the construction of each scenario analyzed, the evolution of the EPI indicator for each of them is completely different, reflecting the ability of each scenario to offset the investment and operation - maintenance costs with those of the CO2 tax. The evolution of the EPI indicator for the S2.2 scenario is exponential as a result of the limitation of investment costs by using the existing wind farm and as a result of fully covering the electricity needs based on the wind plant output.
On the other hand, the baseline scenario is strongly affected by the increase in the CO2 emission tax as it is based on the use of fossil natural gas and the purchase of electricity from the national grid electricity. It can be seen from the graph that the EPI indicator decreases sharply and becomes unprofitable for a value higher than 150 €/ton of CO2. Among the scenarios proposed for the development of the cement plant, scenarios S2.1 and S2.3 show slightly positive evolutions being less affected by the tax increase. This is explained by the fact that high initial investments (S2.1) or high operating costs (S2.3) are relatively compensated by carbon capture technology. As for scenario S2.1, the EPI indicator increases slowly, indicating a gradual improvement in its techno-economic performance with the increase in the CO2 tax. However, compared to scenario S2. 2, the lower value of the EPI indicator is explained by the much higher investment costs (around 3 billion €), which led to a much longer payback period and a high value of the LCOC indicator. In scenario S2.3, although the EPI indicator shows a slight increase, it is not significant because the use of carbon dioxide as a resource does not compensate for the increase in operating costs generated by the purchase of electricity (about 2.8 billion € over the 25 years). Consequently, scenario S2.3 becomes uncompetitive compared to the other alternatives analyzed.
From the analysis of the four proposed alternatives, it can be concluded that using the surplus electricity generated by the existing wind power plants to produce synthetic methane is a viable strategy in the context of the CO2 tax increase, leading to the development of a high performance scenario (S2.3) but under the condition that the power plants would fully supply the electricity needs of the cement plant.
By integrating CO₂ capture technologies, in this case, the chemical absorption process based on the use of MEA in a mass concentration of 30%, the CO2 capture and CO2 avoidance costs were calculated. Thus, the avoidance cost of 51 €/ton CO2 is slightly higher than the capture cost of 47 EUR/ton CO2, as it includes additional penalties related to the efficiency of the process (more energy is needed to keep the cement production constant).
Taking into account the relatively low values of the two costs of CO2 capture and avoidance, it can be concluded that the proposed CO2 capture solution is economically attractive and has a high potential for large-scale implementation, at least in the cement industry. Furthermore, considering that a CO2 tax of 80 EUR/ton CO2 was taken into account in the analysis, we can safely state that the integration of this technology into the cement manufacturing process is a more economically efficient option than paying the CO2 tax. The technical performance of the CO2 capture process is also underlined by the decrease of the CO2 emission factor from 789 kg to 85 kg CO2/ton of cement. It is important to emphasize that maintaining high efficiency in this process is essential, as the captured CO2 emission is one of the primary resources used in the methanization process to obtain synthetic methane. Flow optimization in the cement plant is essential to ensure that all captured CO2 is used in the methanation process, so that the hybrid cement production system based on P2M-CC technology only releases to the environment the CO2 emissions that could not be captured due to the efficiency limitations of the capture process.

5. Conclusions

The article's main objective was to integrate the Power-to-Methane (P2M) concept combined with carbon capture and sequestration (P2M-CC) to reduce CO2 emissions and thus create a profitable and sustainable business model. The scenarios in the article represent technical and economic solutions for modernizing cement plants while integrating renewable energy produced by wind power plants.
From the analysis carried out, it resulted that by integrating the P2M-CC technology, it is possible to significantly reduce CO2 emissions from 789 kg CO2/ton of cement, the value obtained in the reference scenario, to about 85 kg CO2/ton of cement, the value obtained for all the modernized scenarios. From the analysis of the obtained results, it was observed that the ideal scenario (S2.2) received the best economic and environmental results mainly because no costs were charged for the electricity supply due to zero investment costs for the wind power plant. For scenario S2.2, the following values were obtained for the economic indicators: LCOC was 71 €/ton of cement, and NPV was about 2609 million €, suggesting long-term profitability.
In the context of the increasing CO2 tax, hybrid technologies incorporating CO2 capture technologies are becoming more and more economically attractive and can be found in the framework of policies to accelerate the decarbonization of the energy-intensive industry and, in particular, of cement. To increase the economic and environmental benefits of integrating P2M-CC technology into a cement plant, maximizing the flow of electricity produced by the wind power plant and the amount of carbon dioxide captured from the cement plant and used for the production of synthetic methane is necessary. For example, if the electricity produced by the wind power plant does not cover all of the cement plant's needs but only one-third (S2.3), the operating costs increase dramatically, and the scenario is not economically viable.
Storing or converting the surplus electricity produced in the wind power plants into hydrogen in the electrolysis units becomes a key element of the whole process. The methanation reactor facilitates the production of synthetic methane using the carbon dioxide captured from the cement plant. Thus, by properly managing the variability of wind energy, the stability and viability of the industrial process are ensured.
Synthetic methane in the cement plant has a double benefit: it reduces dependence on fossil fuels and drastically reduces CO2 emissions. Consequently, by integrating the P2M-CC system, the concept of a circular economy is developed. CO2 emissions from the plant processes become a primary resource in the methanation reactor, thus closing the carbon cycle.
As mentioned above, integrating the CO2 capture system by chemical absorption produces synthetic methane and reduces the cement plant's carbon footprint. From an economic point of view, this technological model contributes to long-term cost reduction by harnessing a renewable energy source and minimizing the penalties associated with CO2 emissions.
Therefore, implementing the P2M-CC concept represents a flexible solution to the current challenges in the cement industry. It combines CO2 emission reduction, harnessing wind potential, and economic efficiency. The proposed technology supports the decarbonization objectives and contributes to increasing the industrial sector's sustainability and resilience in the face of climate change and economic constraints.

Acknowledgments

This paper was supported by a project of the Collaborative Research Projects (CRPs) - Norway Grants Call 2019, project identification number: RO-NO-2019-0379.

Nomenclature

  • CAPEX - Capital expenditure
  • OPEX - Operational expenditure
  • LCOC - Levelized cost of cement
  • NPV - Net present value
  • PP - Payback period
  • P2M - Power-to-Methane
  • P2M-CC - Power-to-Methane with Carbon Capture
  • MEA, DEA, MDEA - Monoethanolamine, Diethanolamine, Methyldiethanolamine
  • CO2 Removal Cost: The cost of capturing CO2 per ton
  • CO2 Avoided Cost: The cost of avoiding CO2 emissions
  • ETS - Emissions Trading System
  • EPI - Economic Performance Indicator
  • FCO2 - CO2 Emission Factor
  • GHSV - Gas Hourly Space Velocity
  • CCS - Carbon Capture and Storage

References

  1. U.S. Geological Survey, Mineral Commodity Summaries. Reston, VA. https://doi. org/10.3133/mcs2020.
  2. IEA, 2009a. Cement Technology Roadmap 2009: Carbon Emissions Reductions up to 2050. Paris. https://iea.blob.core.windowsnet/assets/897b7ad9-200a-414b870-394dc8e6861a/CementTechnologyRoadmapCarbonEmissionsReductionsupt o2050.pdf.
  3. Rusanescu, et al., 2022. Recovery of Sewage Sludge in the Cement Industry. https://doi. org/10.3390/en15072664. Energies.
  4. Garside, M. 2022. Cement Production Worldwide from 1995 to 2021. https://www.stati sta.com/statistics/1087115/global-cement-production-volume/.
  5. IEA, 2018a. Cement Technology Roadmap Plots Path to Cutting CO2 Emissions. https:// www.iea.org/news/cement-technology-roadmap-plots-path-to-cutting-co2-emissio ns-24-by-2050.
  6. IEA, 2018b. Technology Roadmap - Low-Carbon Transition in the Cement Industry. https://www.iea.org/reports/technology-roadmap-low-carbon-transition-in-the-cement-industry.
  7. Worrell, Ernst, et al., 2001. Carbon dioxide emissions from the global cement industry. Annu. Rev. Energy Environ. 26 (1), 303–329. [CrossRef]
  8. Schneider, Martin, 2019. The cement industry on the way to a low-carbon future. Cement Concr. Res. 124, 105792. [CrossRef]
  9. Fasihi, M. Bogdanov, D., Breyer, Ch, 2017. Long-Term hydrocarbon trade options for the Maghreb region and europedrenewable energy based synthetic fuels for a net zero emissions world. Sustainability 9 (2), 306.
  10. Leeson, D. Mac Dowell, N., Shah, N., Petit, C., Fennell, P.S., 2017. A Techno-economic analysis and systematic review of carbon capture and storage (CCS) applied to the iron and steel, cement, oil refining and pulp and paper industries, as well as other high purity sources. International Journal of Greenhouse Control 61, 71-84.
  11. He, Z.X. Xu, C.C., Shen, W.X., Long, R.Y., Chen, H., 2017. Impact of urbanization on energy related CO2 emission at different development levels: regional difference in China based on panel estimation. J. Clean. Prod. 140, 1719–1730.
  12. ECA (European Cement Association), 2020c. What is Co-Processing?. ECA Available.
  13. EC (European Commission), 2020. Deep decarbonisation of industry: The cement sector. EC Available.
  14. Miro, L. McKenna, R., Jaeger, T., Cabeza, L.F., 2018. Estimating the industrial waste heat recovery potential based on CO2 emissions in the European non-metallic mineral industry. Energy Efficiency. 11, 427–443.
  15. HOLCIM, 2013. Successful Trial for New Generation Low Carbon Cement. HOLCIM Available.
  16. D.H. Konig, N. D.H. Konig, N. Baucks, R.-U. Dietrich, A. Worner, Simulation and evaluation of a process concept for the generation of synthetic fuel from CO2 and H2, Energy 91 (2015) 833–841.
  17. S. Adelung, S. Maier, R.-U. Dietrich, Impact of the reverse water-gas shift operating conditions on the Power-to-Liquid process efficiency, Sustain. Energy Technol. Assess. 43 (2021), 100897.
  18. IEA, 2021. Carbon Capture, Utilisation and Storage. https://www.iea.org/fuels-and-te chnologies/carbon-capture-utilisation-and-storage.
  19. El-Shafie, M. (2023). Hydrogen production by water electrolysis technologies: A review. Results in Engineering, 20, 1-17.
  20. Huleihil, M. & Mazor, G. (2012). Wind Turbine Power: The Betz Limit and Beyond. InTech. [CrossRef]
  21. Kumar SS, Lim H. An overview of water electrolysis technologies for green hydrogen production. Energy Rep 2022; 8:13793-813.
  22. Mikhailov, Iakov, et al. "Efficiency Study of Nickel-Containing Glass-Fiber Catalysts for CO2 Methanation." Available at SSRN 4833168.
  23. Gómez, Laura, et al. "Selection and optimisation of a zeolite/catalyst mixture for sorption-enhanced CO2 methanation (SEM) process." Journal of CO2 Utilization 77 (2023): 102611.
  24. Martínez-López, Iván, et al. "Structural design and particle size examination on NiO-CeO2 catalysts supported on 3D-printed carbon monoliths for CO2 methanation." Journal of CO2 Utilization 81 (2024): 102733.
  25. Liu, Shenghua, et al. "A research on the synthesis process of Zr-MOF derived Ni-based catalysts for CO2 methanation: The role of Ce promoter, method of Ni introduction and calcination condition." Fuel 379 (2025): 132962.
  26. Bian, Zhoufeng, et al. "A CFD study on H2-permeable membrane reactor for methane CO2 reforming: Effect of catalyst bed volume." International Journal of Hydrogen Energy 46.77 (2021): 38336-38350.
  27. F. Koschany, D. Schlereth, O. Hinrichsen, On the kinetics of the methanation of carbon dioxide on coprecipitated NiAl(O)x, Appl. Catal. B: Environ. 181 (2016) 504–516.
  28. L.M. Aparicio, Transient isotopic studies and microkinetic modeling of methane reforming over nickel catalysts, J. Catal. 165 (2) (1997) 262–274.
  29. Y.-W. Ni, J.D. Ward, Automatic design and optimization of column sequences and column stacking using a process simulation automation server, Ind. Eng. Chem. Res. 57 (21) (2018) 7188–7200.
  30. Y.-W. Ni, et al., Plantwide optimization coupled with column sequencing and stacking using a process simulator automation server, Comput. Chem. Eng. 146 (2021), 107196.
  31. Yan Wang, Lei Song, Kui Ma, Changjun Liu, Siyang Tang, Zhi Yan, Hairong Yue, Bin Liang. An Integrated Absorption–Mineralization Process for CO2 Capture and Sequestration: Reaction Mechanism, Recycling Stability, and Energy Evaluation. ACS Sustainable Chemistry & Engineering 2021, 9 (49), 16577-16587.
  32. Xiaowei Zhou, Yao Shen, Fan Liu, Jiexu Ye, Xinya Wang, Jingkai Zhao, Shihan Zhang, Lidong Wang, Sujing Li, Jianmeng Chen. A Novel Dual-Stage Phase Separation Process for CO2 Absorption into a Biphasic Solvent with Low Energy Penalty. Environmental Science & Technology 2021, 55 (22), 15313-15322.
  33. de Ávila, S. G., Logli, M. A., & Matos, J. R. (2015). Kinetic study of the thermal decomposition of monoethanolamine (MEA), diethanolamine (DEA), triethanolamine (TEA) and methyldiethanolamine (MDEA). International Journal of Greenhouse Gas Control, 42, 666-671.
  34. Clery, D. S., Mason, P. E., Barnes, D. C., Szuhánszki, J., Akram, M., Jones, J. M., ... & Rayner, C. M. (2021). The effect of biomass ashes and potassium salts on MEA degradation for BECCS. International Journal of Greenhouse Gas Control, 108, 103305.
  35. Fytianos, G., Ucar, S., Grimstvedt, A., Hyldbakk, A., Svendsen, H. F., & Knuutila, H. K. (2016). Corrosion and degradation in MEA based post-combustion CO2 capture. International Journal of Greenhouse Gas Control, 46, 48-56.
  36. François, M. H. J., Buvik, V., Vernstad, K., & Knuutila, H. K. (2024). Assessment of the volatility of amine degradation compounds in aqueous MEA and blend of 1-(2HE) PRLD and 3A1P. Carbon Capture Science & Technology, 13, 100326.
  37. Shamsi, M. Naeiji, E., Vaziri, M., Moghaddas, S., Elyasi Gomari, K., Naseri, M., & Bonyadi, M. (2023). Optimization of energy requirements and 4E analysis for an integrated post-combustion CO2 capture utilizing MEA solvent from a cement plant flue gas. Environment, Development and Sustainability, 1-27.
  38. R. Smith, Chemical process design and integration, second ed., Wiley, Hoboken, USA 2016.
  39. Boyle, G. Everett, B., Ramage, J. (2003). Energy Systems and Sustainability. Oxford University Press.
  40. Sankir, M. & Sankir, N. D. (Eds.). (2017). Hydrogen production technologies. John Wiley & Sons.
  41. Lehner, M. Tichler, R., Steinmüller, H., & Koppe, M. (2014). Power-to-gas: technology and business models (pp. 7-17). Cham: Springer International Publishing.
  42. Havercroft, I. Macrory, R., & Stewart, R. B. (2018). Carbon Capture and Storage: Emerging Legal and Regulatory Issues. Bloomsbury Publishing.
  43. Bejan, A. Tsatsaronis, G., & Moran, M. J. (1995). Thermal design and optimization. John Wiley & Sons.
  44. Burton, T. Sharpe, D., Jenkins, N., Bossanyi, E., (2011). Wind Energy Handbook. John Wiley and Sons Ltd.
  45. International Energy Agency (IEA), Energy Prices, 2023.
  46. Pichtel, J. (2005). Waste management practices: municipal, hazardous, and industrial. CRC press.
  47. European Commission, "Quarterly Report on European Gas Markets," 2023.
  48. Havercroft, I. Macrory, R., & Stewart, R. B. (2018). Carbon Capture and Storage: Emerging Legal and Regulatory Issues. Bloomsbury Publishing.
  49. European Commission, "European Labour Market and Wage Developments", 2023.
  50. Mukul, Taneja, S., Özen, E., & Bansal, N. (2024). Challenges and Opportunities for Skill Development in Developing Economies. Contemporary Challenges in Social Science Management: Skills Gaps and Shortages in the Labour Market, 1-22.
  51. N.A. Madlool, R. Saidur, N.A. Rahim, M. Kamalisarvestani, An overview of energy savings measures for cement industries, Renew. Sustain. Energy Rev. 19 (2013) 18–29.
  52. B. Afkhami, B. Akbarian, N. Beheshti, A.H. Kakaee, B. Shabani, Energy consumption assessment in a cement production plant, Sustain. Energy Technol. Assess. 10 (2015) 84–89.
  53. Ministerul Energiei, Strategia energetică a României 2018-2030, cu perspectiva anului 2050, 2017, internet file accsesed on 17 June 2024: google.com/url?sa=t&rct=j&q=&esrc=s&source=web&cd=&ved=2ahUKEwjw-6iHneKGAxW5BNsEHatDChIQFnoECCcQAQ&url=https%3A%2F%2Fenergie.gov.ro%2Fwp-content%2Fuploads%2F2018%2F09%2FStrategia_Energetica_2018-1.docx&usg=AOvVaw2V5sI8wquprrxNkVUOkBVa&opi=89978449.
  54. CEMBUREAU - the European Cement Association, Best Available Techniques, The European Cement Association, 1999 for the Cement Industry, No. December.
  55. Cormos, C. C. Petrescu, L., Cormos, A. M., Dinca, C., Assessment of Hybrid Solvent—Membrane Configurations for Post-Combustion CO2 Capture for Super-Critical Power Plants. Energies, 2021, 14(16), 5017.
  56. D. Ipsakis, G. Varvoutis, A. Lampropoulos, S. Papaefthimiou, G.E. Marnellos, M. Konsolakis, Τechno-economic assessment of industrially-captured CO2 upgrade to synthetic natural gas by means of renewable hydrogen, Renew. Energy 179 (2021) 1884–1896. [CrossRef]
  57. Dinca, C. & Badea, A. (2013). The parameters optimization for a CFBC pilot plant experimental study of post-combustion CO2 capture by reactive absorption with MEA. International Journal of Greenhouse Gas Control, 12, 269-279.
  58. Bozonc, A. C. Cormos, A. M., Dragan, S., Dinca, C., & Cormos, C. C. (2022). Dynamic modeling of CO2 absorption process using hollow-fiber membrane contactor in MEA solution. Energies, 15(19), 7241.
  59. Dinca, C. (2016). Critical parametric study of circulating fluidized bed combustion with CO2 chemical absorption process using different aqueous alkanolamines. Journal of Cleaner Production, 112, 1136-1149.
  60. Padurean, A. Cormos, C. C., Cormos, A. M., & Agachi, P. S. (2011). Multicriterial analysis of post-combustion carbon dioxide capture using alkanolamines. International Journal of Greenhouse Gas Control, 5(4), 676-685.
  61. R. Chauvy, D. Verdonck, L. Dubois, D. Thomas, G. De Weireld, Techno-economic feasibility and sustainability of an integrated carbon capture and conversion process to synthetic natural gas, J. CO2 Util. 47 (2021) 101488. [CrossRef]
  62. Ecoinvent, Ecoinvent Database v3.9.1, (2023). https://doi.org/https://ecoinvent. org/.
  63. Sima, S. Racoviţă, R. C., Dincă, C., Feroiu, V., & Secuianu, C. (2017). Phase equilibria calculations for carbon dioxide+ 2-propanol system. Univ. Politeh. Bucharest Sci. Bull. Ser. B, 79, 11-24.
  64. A.K. Morken, S. Pedersen, E.R. Kleppe, A. Wisthaler, K. Vernstad, Ø. Ullestad, N. E. Flø, L. Faramarzi, E.S. Hamborg, (2017). Degradation and emission results of amine plant operations from MEA Testing at the CO2 technology centre mongstad, Energy Procedia 114, 1245–1262.
  65. Xue, B. Yu, Y., Chen, J. et al. (2017). A comparative study of MEA and DEA for post-combustion CO2 capture with different process configurations. Int J Coal Sci Technol 4, 15–24.
  66. https://www.meteoromania.ro/, internet file accessed during the year 2023.
  67. Garret, P., Ronde, K. (2013). Life cycle assessment of electricity production from an onshore V90 – 3 MW wind plant. Denmark, internet site: LCA_V903MW_version_1_1.pdf.coredownload.inline.pdf (vestas.com) accessed on 9 July 2024.
  68. Siemens Gamesa Onshore Wind Turbine SG 2.6-114 internet file accesed on 9 July 2024.
  69. Enercon.pdf (wind-watch.org) internet file accessed on 9 July 2024.
  70. Hidalgo, D. Martín-Marroquín, J.M., 2020. Power-to-methane, coupling CO2 capture with fuel production: an overview. Renew. Sust. Energy Rev. 132.
  71. Faheem, H.H. Tanveer, H.U., Abbas, S.Z., Maqbool, F., 2021. Comparative study of conventional steam-methane-reforming (SMR) and auto-thermal-reforming (ATR) with their hybrid sorption enhanced (SE-SMR & SE-ATR) and environmentally benign process models for the hydrogen production. Fuel, 297.
  72. Gilliam, R.J. Graydon, J.W., Kirk, D.W., Thorpe, S.J., 2007. A review of specific conductivities of potassium hydroxide solutions for various concentrations and temperatures. Int. J. Hydrogen Energy 32, 359–364.
  73. Schmidt, O. Gambhir, A., Staffell, I., Hawkes, A., Nelson, J., Few, S., 2017. Future cost and performance of water electrolysis: an expert elicitation study. Int. J. Hydrogen Energy 42, 30470–30492.
  74. dos Santos, K.G. Eckert, C.T., De Rossi, E., Bariccatti, R.A., Frigo, E.P., Lindino, C.A., et al., 2017. Hydrogen production in the electrolysis of water in Brazil, a review. Renew. Sust. Energy Rev. 68, 563–571.
Figure 1. CO2 emissions by different industrial sources in 2022.
Preprints 146183 g001
Figure 2. Flow diagram of the CO2 chemical absorption process.
Preprints 146183 g002
Figure 3. The cement factory (reference scenario) evaluation.
Preprints 146183 g003
Figure 4. The cement factory upgraded with P2M – CC concept (scenario II).
Preprints 146183 g004
Figure 5. Specific heat energy utilization for different concentrations of MEA solvent.
Preprints 146183 g005
Figure 6. Specific heat energy utilization for different concentrations of DEA solvent.
Preprints 146183 g006
Figure 7. Specific thermal energy consumption and MEA solvent flow variation with lean loading solvent.
Preprints 146183 g007
Figure 8. Wind speed distribution and Weibull fit for Fieni in the year 2023.
Preprints 146183 g008
Figure 9. LCOC variation as a function of the CO2 tax for cement scenarios.
Preprints 146183 g009
Figure 10. Payback period (PP) as a function of CO2 tax.
Preprints 146183 g010
Figure 11. Scenarios comparison according to different economic criteria.
Preprints 146183 g011
Figure 12. Comparative assessment between S1 and S2.2 according to different excess electricity rate.
Preprints 146183 g012
Figure 13. Evolution of economic performance (EPI) according to CO2 tax for each scenario.
Preprints 146183 g013
Table 1. Primary data for methanation reactor.
Category Parameter Description Example/Values
Catalyst Catalyst type Catalyst type used for chemical reaction Ni/Al2O3
Catalyst amount Amount of catalyst used in the reactor 4 650 kg
Time residence Residence time of reactants in contact with the catalyst 0,5-2 seconds/0,72 seconds
Catalyst regeneration Method and frequency of catalyst regeneration Oxidation, H2 reduction, at 100-300 hours
Gas flow CO2 flow rate Amount of CO2 passing through the reactor ~ 445 000 L/min
H2 flow rate Amount of H2 passing through the reactor ~ 1 780 000 L/ min
Molar ratio of H2/CO2 Ratio between the amount of H2 and CO2 in the inlet gas 3:1 – 4:1 / (4:1)
Inert gases Amount of inert gases (N2, Ar) in the gas stream It is not considered in this study
Reaction conditions Reaction temperature Temperature at which the methanation reaction takes place 250 – 450 oC
Reaction pressure Pressure under which the reaction takes place 1 – 10 bar
GHSV (Gas hourly space velocity) Ratio of gas volume to catalyst volume 4 000 – 10 000 hr-1 / 5 000 hr-1
Table 2. Impact of degradation mitigation methods on chemical solvent use [34 – 36].
Mechanism of degradation Main products Improvement method Solvent loss (kg MEA/ton CO2 captured)1 Solvent loss (kg MEA/ton CO2 captured)2
Oxidative degradation Volatile amines, HEF, HEI, HEPO Addition of piperazine to solvent mixture 0,6 0,3 – 0,5 [34]
Thermal degradation HEEDA, oxazolidinones (OZD) Temperature control in reboiler 0,7 0,4 – 0,6 [35]
Catalytic degradation HEI, HEINO Removal of metal ions (Fe, Cu) from solvent 0,4 0,2 – 0,3 [34]
Degradation caused by impurities Stable compounds, thermal salts Flue gas pre-treatment for removal of SOx, NOx 0,9 0,5 – 0,7 [36]
1 before applying the improvement method; 2 after applying the improvement method.
Table 3. Capital cost for P2M-CC technology.
Equipment Scaling parameter Base cost (M€) Base capacity Scaling exponent (e) References
Wind turbine Power (MW) 1.5 3 MW 0.7 [39]
Electrolyzer Power (MW) 0.8 5 MW 0.6 [40]
Methanation reactor Power (MW) 1.2 5 MW 0.7 [41]
Absorption column Solvent flow rate (m3/h) 0.015 1,000 (m3/h) 0.7 [42]
Desorption column Solvent flow rate (m3/h) 0.02 1,000 (m3/h) 0.7 [42]
Heat exchanger Heat exchange area (m2) 0.01 1,000 (m2) 0.8 [43]
Pump Power (kW) 0.005 100 kW 0.6 [43]
Compressor Power (kW) 0.01 200 kW 0.75 [43]
Table 4. Operation and maintenance cost for P2M-CC technology.
Equipment OPEX Specific cost Details References
Wind turbine Turbine maintenance costs 0.01 €/kWh Inspection, lubrication, maintenance [44]
Purchase of electricity 0.1 €/kWh Operation of auxiliary equipment [45]
Infrastructure maintenance costs 4 €/kW Maintenance of electricity networks [39]
Electrolyzer Cost of alkaline solution (e.g. KOH) 1.5 €/kg Purchase and replenishment of alkaline solution [40]
Alkaline waste treatment costs 0.5 €/kg Disposal and treatment of waste solutions [46]
Maintenance of electrolysis cells 11 €/kW Replacement of worn components, inspections and repairs [40]
Methanation reactor Maintenance costs 34.5 €/kW Inspection and repair [41]
Purchase of methane gas 0.3 €/m3 Fueling the reactor and cement plant and providing the necessary heat [47]
CO2 chemical absorption Cost of chemical solvents 2.5 €/kg Purchase and replenishment of MEA solvent [48]
Chemical waste disposal costs 0.8 €/kg Disposal of used solvents and waste treatment [46]
Maintenance costs of capture equipment 6.6 €/ton CO2 Inspection, repair, and general maintenance [48]
General costs Operating staff salaries 50 k€/year/employer Salaries for employees operating and supervising sub-systems [49]
Maintenance staff salaries 45 k€/year/employer Salaries for maintenance teams [50]
Training costs 1,000 €/year/employer Ongoing staff training and development programs [50]
Table 5. Primary data of the cement factory.
Category Unit Values
Raw materials and fuels
Methane (CH4) tons/year 77,850
Limestone tons/year 960,000
Clay tons/year 240,000
Energy
Electricity GWh/year 144
Products
Cement tons/year 1,200,000
CO2 tons/year 946,650
Emissions
Water tons/year 175,150
Nitrogen - N2 tons/year 1,146,600
Oxygen – O2 tons/year 31,150
NOx mg/Nm3 500
Table 6. Central assumption and data calculated for cement factory upgraded with P2M - CC .
System Assumption Values Reference
General Operational lifetime, [years] 25 [51-52]
Cement production Operating hours, [hours/year] 6,570 [52]
Average annual clinker production capacity, [tons/year] 1,200,000
Clinker/cement ratio, [ton clinker/ton cement] 0.925 [54]
Direct CO2 emissions, [tons CO2/tons cement] 0.789
Amine CO2 capture CO2 capture ratio 0.9 [55-60]
Electrical required for CO2 capture – MEA 30% wt., [kWh/ton CO2] 100 [58]
Electrical required for CO2 capture – DEA 25% wt., [kWh/ton CO2] 90 [58]
Electrolysis Type of electrolyzer – alkaline AEL
Water to H2 ratio 4.5
H2 amount generation, [tons/year] 53,268
O2 amount generation, [tons/year] 426,142
Electricity for AEL, [kWh/ton CO2] 47,023
Energy efficiency 0.7
Methanation Reactor efficiency 0.85 [56]
Electricity for methanation, [kWh/GJ methane] 1.95 [61]
CO2 emissions, [tons/GJ methane] 0.0589 [62]
Wind plant Capacity factor 0.25 [53]
Operating hours, [hours/year] 8,000
Installed power in wind turbine, [MW] 3
Number of wind turbines, [-] 545
The total area of the wind plant farm, [km2] 54.5
The total electricity requested, [GWh/year] 2,685
Table 7. Primary data of the cement factory .
Nr.crt. Parameter UM Values
1 Annual amount of cement produced tons/year 1,200,000
2 Specific electrical energy consumption kWh/ton cement 120
3 Electricity for the cement factory MWh/year 144,000
4 Specific thermal energy consumption kWh/ton cement 920
5 Heat for the cement factory MWh/year 1,104,000
6 Methane for cement factory tons/year 106,536
7 CO2 from clinker production tons/year 732,600
8 CO2 from methane combustion tons/year 292,973
9 Total CO2 from cement factory tons/year 1,025,573
10 CO2 emissions captured tons/year 924,043
11 CO2 emission factor kg/ton cement ~85
Table 8. Flue gas constituents from cement plant operation.
Nr.crt. Component UM Values
1 Flue gas flow kg/s 121.65
2 CO2 % wt. 35.64
3 H2O % wt. 8.33
4 N2 % wt. 54.54
5 O2 % wt. 1.48
Table 9. Parameter optimization in CO2 capture processes.
Nr.crt. Component MEA DEA
1 Solvent mass proportion, wt. % 30 20
2 CO2 capture rate, % 90.3 90.9
3 Gas absorption unit, trays 16 18
4 Gas desorption unit, trays 14 16
5 Liquid-to-gas flow rate ratio, kg/kg 2.97 8.56
6 CO2 capture absorption capacity, mol/mol 0.29 0.24
7 Specific thermal energy, GJ/tCO2 3.07 5.36
8 Solvent degradation rate, kg amine/tCO2 1.5 [60] 0.5 [61]
Table 9. Attributes of wind turbines.
Attribute Vestas V150 Siemens Gamesa SG 2.6 - 114 Enercon E - 126
Type Horizontal axis Horizontal axis Horizontal axis
Rotor diameter, m 150 114 127
Rated power, MW 3 2.6 7.58
Tower height, m 105-166 92.5; 107.5; 127.5 135; 138; 145
Start wind speed, m/s 3 3 2.5
Nominal wind speed, m/s 5-7 12 12
Cut-out wind speed, m/s 22.5 25 28-34
Table 10. Attributes of different electrolyzer technologies.
Attributes AEC PEMEC SOEC Sources
Maturity Established Commercialized Developing [70]
Electrolyte KOH Polymer membrane YSZ [71]
Electrode materials Metal alloys Precious metals Ni/LSMO [72]
Operating temperature, oC 40-90 20-100 600-1,000 [73]
Operating pressure, bar 1-30 <100 <25 [73]
Efficiency, % <80 <85 <90 [74]
Table 11. Primary data of each technology of P2M process.
Technology Parameter UM Values
Methanation reactor Methanation capacity m3/h 24,715.7
Conversion efficiency % 85
Operating temperature oC 300
Operating pressure bar 10
Electrolyzer Type – Alkaline - -
Hydrogen production capacity m3/h 90,206.12
Water requirement kg/h 72,970
Oxygen generation kg/h 64,862
Electrical efficiency % 70
Nominal power MW 312
Wind turbine Nominal capacity MW 3
Rotor diameter m 120
Tower height m 100
Wind speed for nominal capacity m/s 12
Capacity factor % 25
Number of wind plants - 545
Total power installed MW 1,635
Total area km2 54.5
Table 11. Assumptions for key sensitivity parameters in economic and operational analysis.
Parameter Unit Initial value Range of variation Range of values
CO2 tax €/ton 80 +/- 30% 56 ... 104
O2 price €/kg 0.33 +/- 50% 0.17 ... 0.5
Electricity price €/MWh 175 +/- 30% 122.5 ... 227.5
Methane cost €/m3 0.091 +/- 5% 0.09 ... 0.1
MEA solvent cost €/kg 1.5 +/- 20% 1.2 ... 1.8
Cement price €/ton 220 +/- 5% 209 ... 231
Wind capacity factor % 25 +/- 20% 20 ...30
Cement plant capacity % 1,200,000 +/- 30 % 840,000 ... 1,560,000
CO2 capture efficiency % 90 +/- 10% 81 ... 99
Excess electricity rate % 33 +/- 10% 29.7 ... 36.3
Electrolyzer efficiency % 70 +/- 30% 49 ... 91
Methane to heat conversion efficiency % 92 n.a. n.a.
Discount rate % 8 n.a. n.a.
Table 12. Benchmarking the economic and environmental performance for the integration of the P2M concept in cement plants.
Scenarios Unit Cement plant – reference case Cement plant – P2M integrated
S 1. S 2.1. S 2.2. S 2.3.
CAPEX M€ 230 2,968 1,333 1,189
OPEX25 years M€ 1,152 1,026 666 2,778
LCOC25 years €/ton of cement 169 297 71 333
NPV25 years M€ 780 579 2,609 - 751
PP years 3 16 5 n.a.
FCO2 kg CO2/ton of cement 789 85
CO2 removal €/tonCO2 n.a. 47
CO2 avoided €/tonCO2 n.a. 51
Disclaimer/Publisher’s Note: The statements, opinions and data contained in all publications are solely those of the individual author(s) and contributor(s) and not of MDPI and/or the editor(s). MDPI and/or the editor(s) disclaim responsibility for any injury to people or property resulting from any ideas, methods, instructions or products referred to in the content.
Copyright: This open access article is published under a Creative Commons CC BY 4.0 license, which permit the free download, distribution, and reuse, provided that the author and preprint are cited in any reuse.
Prerpints.org logo

Preprints.org is a free preprint server supported by MDPI in Basel, Switzerland.

Subscribe

Disclaimer

Terms of Use

Privacy Policy

Privacy Settings

© 2025 MDPI (Basel, Switzerland) unless otherwise stated